Submitted:
08 December 2024
Posted:
09 December 2024
Read the latest preprint version here
Preprints on COVID-19 and SARS-CoV-2
Abstract
The SARS-CoV-2 virus, responsible for the COVID-19 pandemic, has impacted the health of millions globally, with many individuals experiencing persistent symptoms even after testing negative, a condition known as Post-acute Sequelae of SARS-CoV-2 infection (PASC), or “Long COVID”. This study analyzes demographic influences on the severity and timeline of PASC symptoms, with emphasis on physiological and cognitive effects. Using a self-reporting survey method, data was collected from a sample of 110 participants and analyzed using statistical methods such as Exploratory Factor Analysis (EFA), Pearson Correlation, and Two-Factor ANOVA Test. The participants were primarily based within California, and a majority of them were ethnically Asian. Based on the study, females generally reported higher severity for cognitive and physiological symptoms compared to males, and symptom severity was generally lower among vaccinated individuals. Correlation analysis revealed a significant relationship between depression and cognitive impairments, underscoring the psychological impact of PASC. This study emphasizes the complexity of PASC, demonstrating how demographic characteristics such as age, sex, and vaccination status influence the severity and duration of symptoms, contributing to the growing understanding of PASC. Further research should consider SARS-CoV-2 variant-specific impacts and broader population samples.
Keywords:
COVID-19
; Long COVID
; PASC
; Brain Fog
; symptoms
; COVID severity
; COVID timeline
; vaccination
Introduction
The COVID-19 pandemic, caused by the SARS-CoV-2 virus, has led to a global health crisis, affecting millions of individuals worldwide. As of today, over 776 million cases and 7 million deaths have been reported globally, as regularly updated by the World Health Organization (WHO) [1]. While the majority of individuals recover from COVID-19 without long-term complications, an increasing number continue to experience persistent symptoms, a condition known as Long COVID or Post-Acute Sequelae of SARS-CoV-2 infection (PASC). Long COVID represents a diverse set of symptoms, including cognitive dysfunction (e.g., brain fog), fatigue, respiratory distress, joint pain, and other neurological symptoms, which can significantly impact an individual’s quality of life.
The Emergence of Long Covid:
Long COVID has emerged as a significant public health concern, affecting individuals across different demographic groups, including those who had mild or asymptomatic COVID-19 infections. According to data from the Centers for Disease Control and Prevention (CDC) [2], up to 25.6% of adults who have had COVID-19 report persistent symptoms, which can last for months or even longer. These lingering effects not only burden healthcare systems but also affect economic productivity, as individuals struggle to return to work or engage in daily activities. The mechanisms behind Long COVID are not fully understood, but it is believed to involve a combination of factors such as viral persistence, immune system dysregulation, and prolonged inflammation [3].
Demographic Factors and Risks:
Several demographic factors play a crucial role in determining the likelihood of developing Long COVID. Age is a significant factor, with older adults (especially those over 65 years) being more susceptible to severe acute outcomes from COVID-19 due to age-related declines in immune function and the presence of comorbidities such as diabetes and cardiovascular diseases [4]. However, studies indicate that middle-aged adults (35-49 years) are at a heightened risk for Long COVID, showing higher prevalence rates of symptoms compared to both younger and older age groups [5].
Aim of the Study
This study aims to analyze the demographic influences on the severity and duration (timeline) of SARS-CoV-2 infection. The symptom categories were centered primarily on physiological and cognitive effects. The study seeks to examine how demographic factors, including sex, age, vaccination status, and ethnicity, affect the development of Long COVID in individuals. In addition, this study analyzes the connections between symptoms through Exploratory Factor Analysis (EFA), Pearson Correlation, and other forms of statistical analysis to understand how specific symptoms are correlated.
Ultimately, this study aims to contribute to a greater understanding of Long COVID. It also provides insights into the prevalence of PASC that can shape global public health efforts to address and, eventually, treat PASC.
Methodology
This study employed a descriptive research design using a survey strategy to gather data on the physiological and cognitive effects of PASC [38,39]. This method was chosen because it allows for a comprehensive analysis using a larger sample size. Participants were recruited through posted flyers, word of mouth, and online platforms targeting individuals who fit the eligibility criteria. The eligibility criteria required every participant to not have any pre-existing health conditions, were from the ages 18 - 55, and tested positive for Covid-19. The effects of pre-existing health conditions could cause a lot of variability to our results, so to decrease the confounding variables we ensured that every participant didn’t have any preexisting health conditions such as chronic pain, or autoimmune diseases and weren’t pregnant as that also can cause symptoms intervening with Long Covid. For example, when answering questions in our questionnaire about symptom severity, if those with preexisting health conditions participated, we wouldn’t know if their responses were because of COVID-19 or those health conditions. We had to limit the ages of participants to 55 due to natural health decline from old age. If we had many senior citizen responses being compared to younger participants, we can’t determine if the results are simply because of age or because of health decline of those who are older then 55. The online self-reporting survey consisted of 64 questions and was built on the HIPAA-compliant platform, JotForm.
All participants consented before the study and were informed about the aim and purpose of it. An internal Institutional Review Board has reviewed and approved the research proposal and the data privacy.
With ethical guidelines, trigger warnings were implemented before the survey sections containing potentially distressing content.
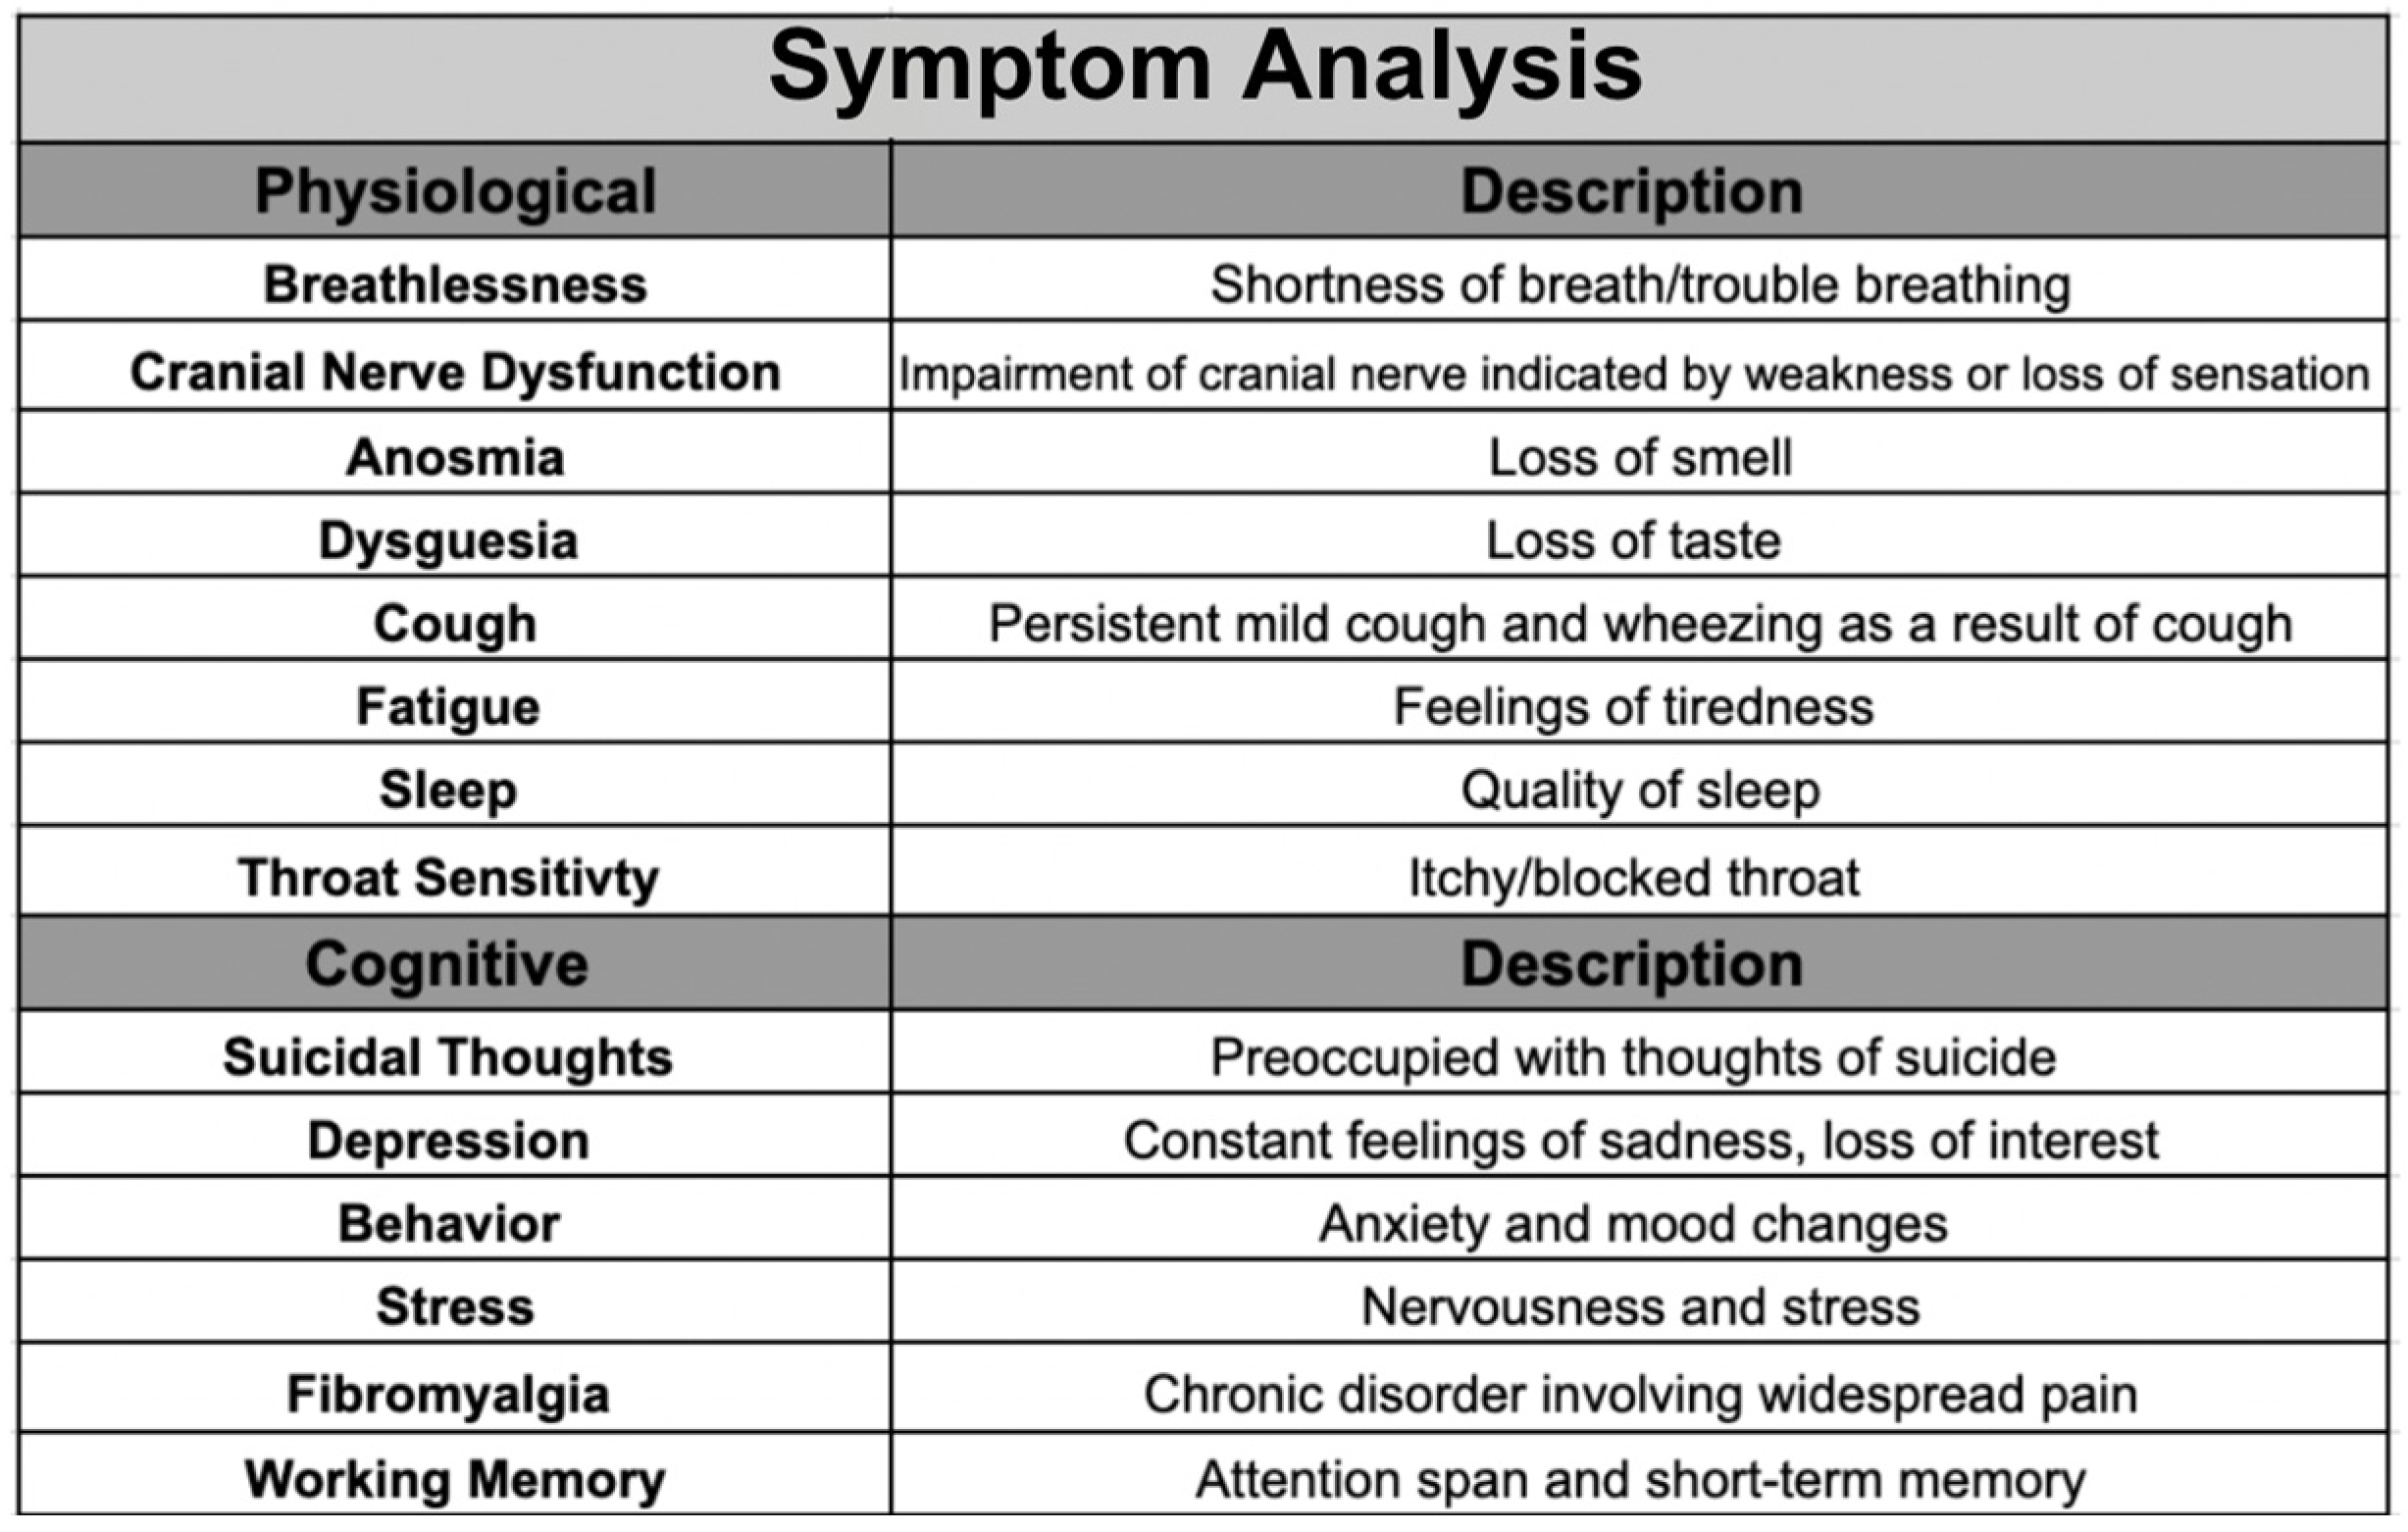
The 64 questions evaluated 14 symptoms and were categorized into physiological, cognitive, and working memory. The physiological [38] category encompassed breathlessness, cranial nerve dysfunction, cough, anosmia, dysgeusia, fatigue, sleep, and throat sensitivity. The cognitive category contained suicidal thoughts, depression, behavior, stress, working memory, and fibromyalgia. These specific symptoms were included to get a comprehensive view of each category and to investigate symptoms associated with PASC in previous studies [39] to confirm these findings.
The primary focus of this study is to gain a more in-depth understanding of brain fog [38]. Our study explored the impact of Long-COVID on working memory, in addition to the psychological impact.
Figure 1.
Outlines the sequential steps of our research process, including data collection and analysis.
Figure 1.
Outlines the sequential steps of our research process, including data collection and analysis.
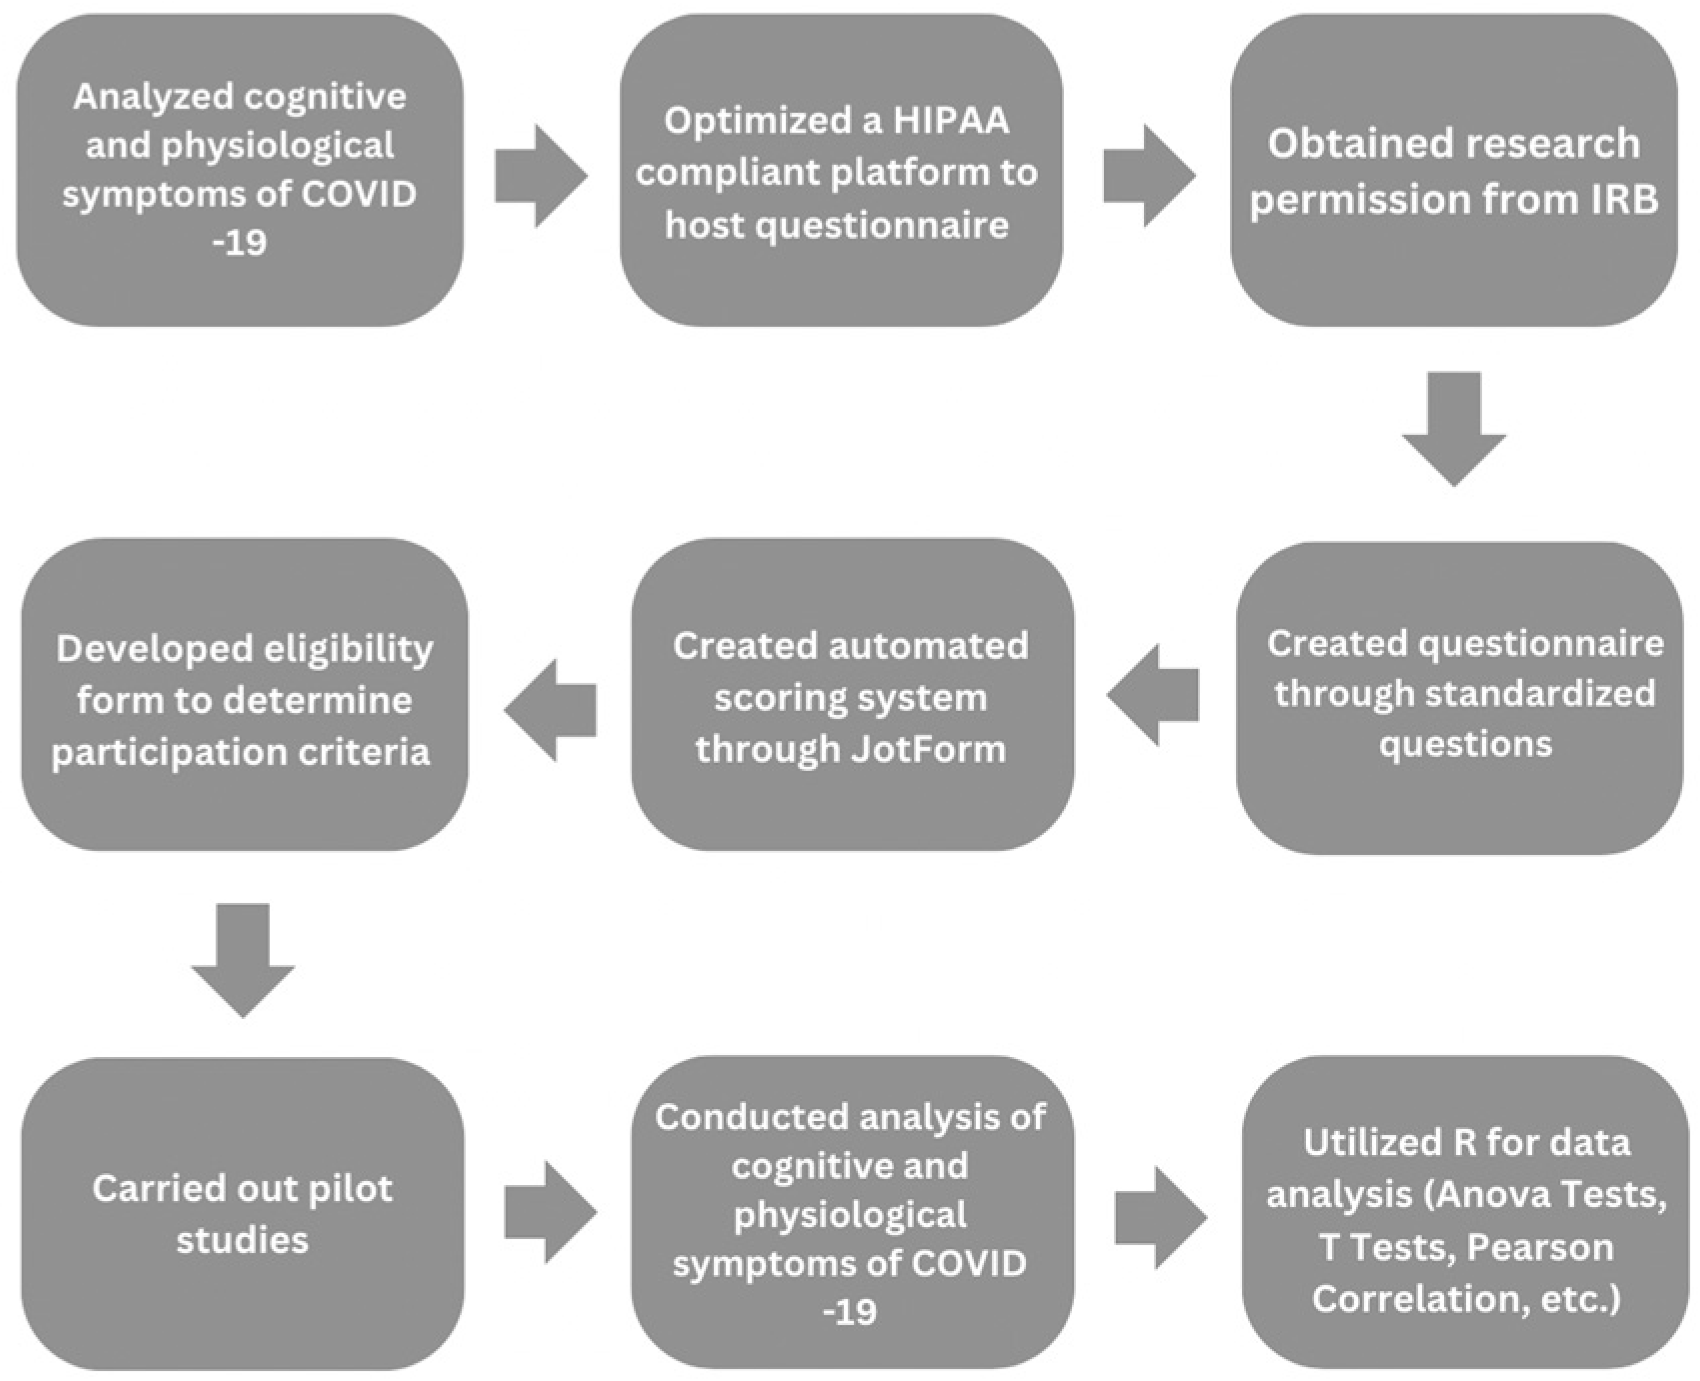
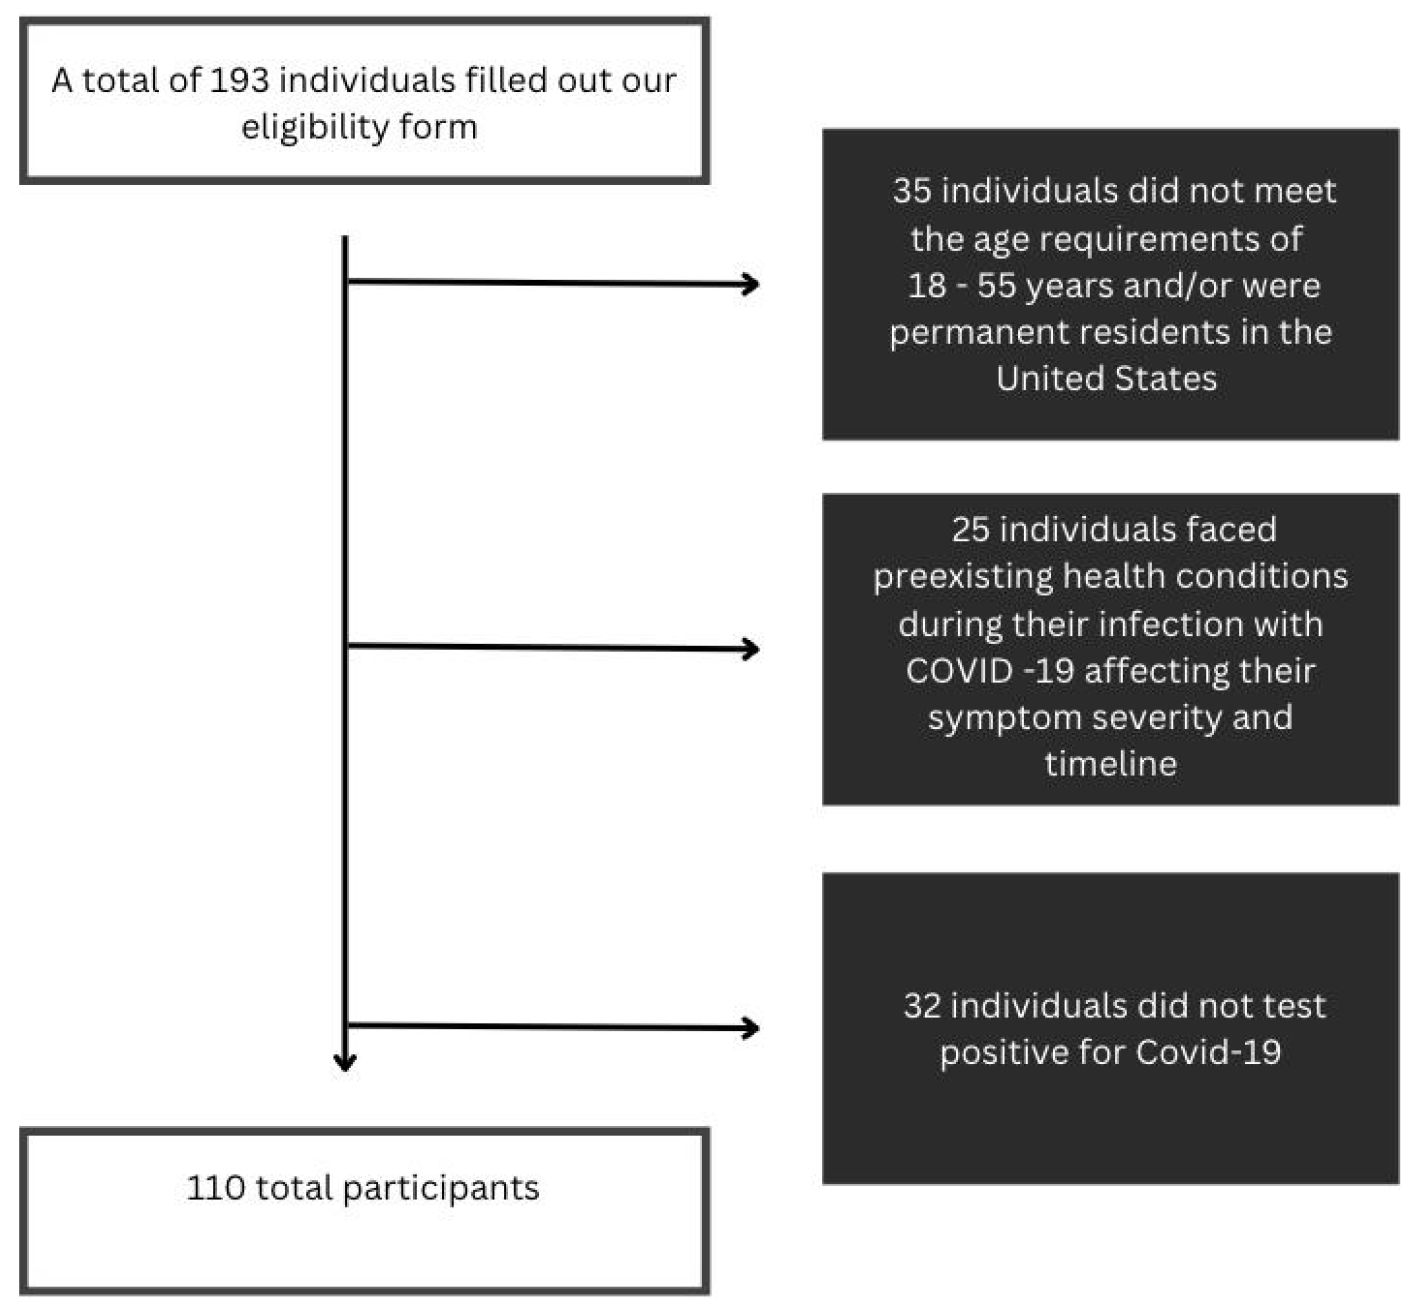
Figure 2.
Participants eligibility pipeline. From the flow chart displayed, the eligibility to eliminate the biases associated with pre-existing health conditions.
Figure 2.
Participants eligibility pipeline. From the flow chart displayed, the eligibility to eliminate the biases associated with pre-existing health conditions.
Demographics, including location, age, ethnicity, and vaccination status, were collected through a self-reporting survey to observe patterns between symptoms experienced and an individual’s demographic information. Specific eligibility requirements include all of the participants residing in various states across the United States, between the ages of 18 and 55 years old, infected and diagnosed with COVID-19 in the US, have not been pregnant while exposed to COVID-19, and no underlying critical health conditions like cancer or autoimmune diseases.

Table 1.
Symptom analysis on 14 symptoms assessed with descriptions providing insights into their relevance to Post‐Acute Sequelae of SARS‐CoV‐2 (PASC). Categorizes symptoms into three domains: physiological, cognitive, and working memory.
Table 1.
Symptom analysis on 14 symptoms assessed with descriptions providing insights into their relevance to Post‐Acute Sequelae of SARS‐CoV‐2 (PASC). Categorizes symptoms into three domains: physiological, cognitive, and working memory.
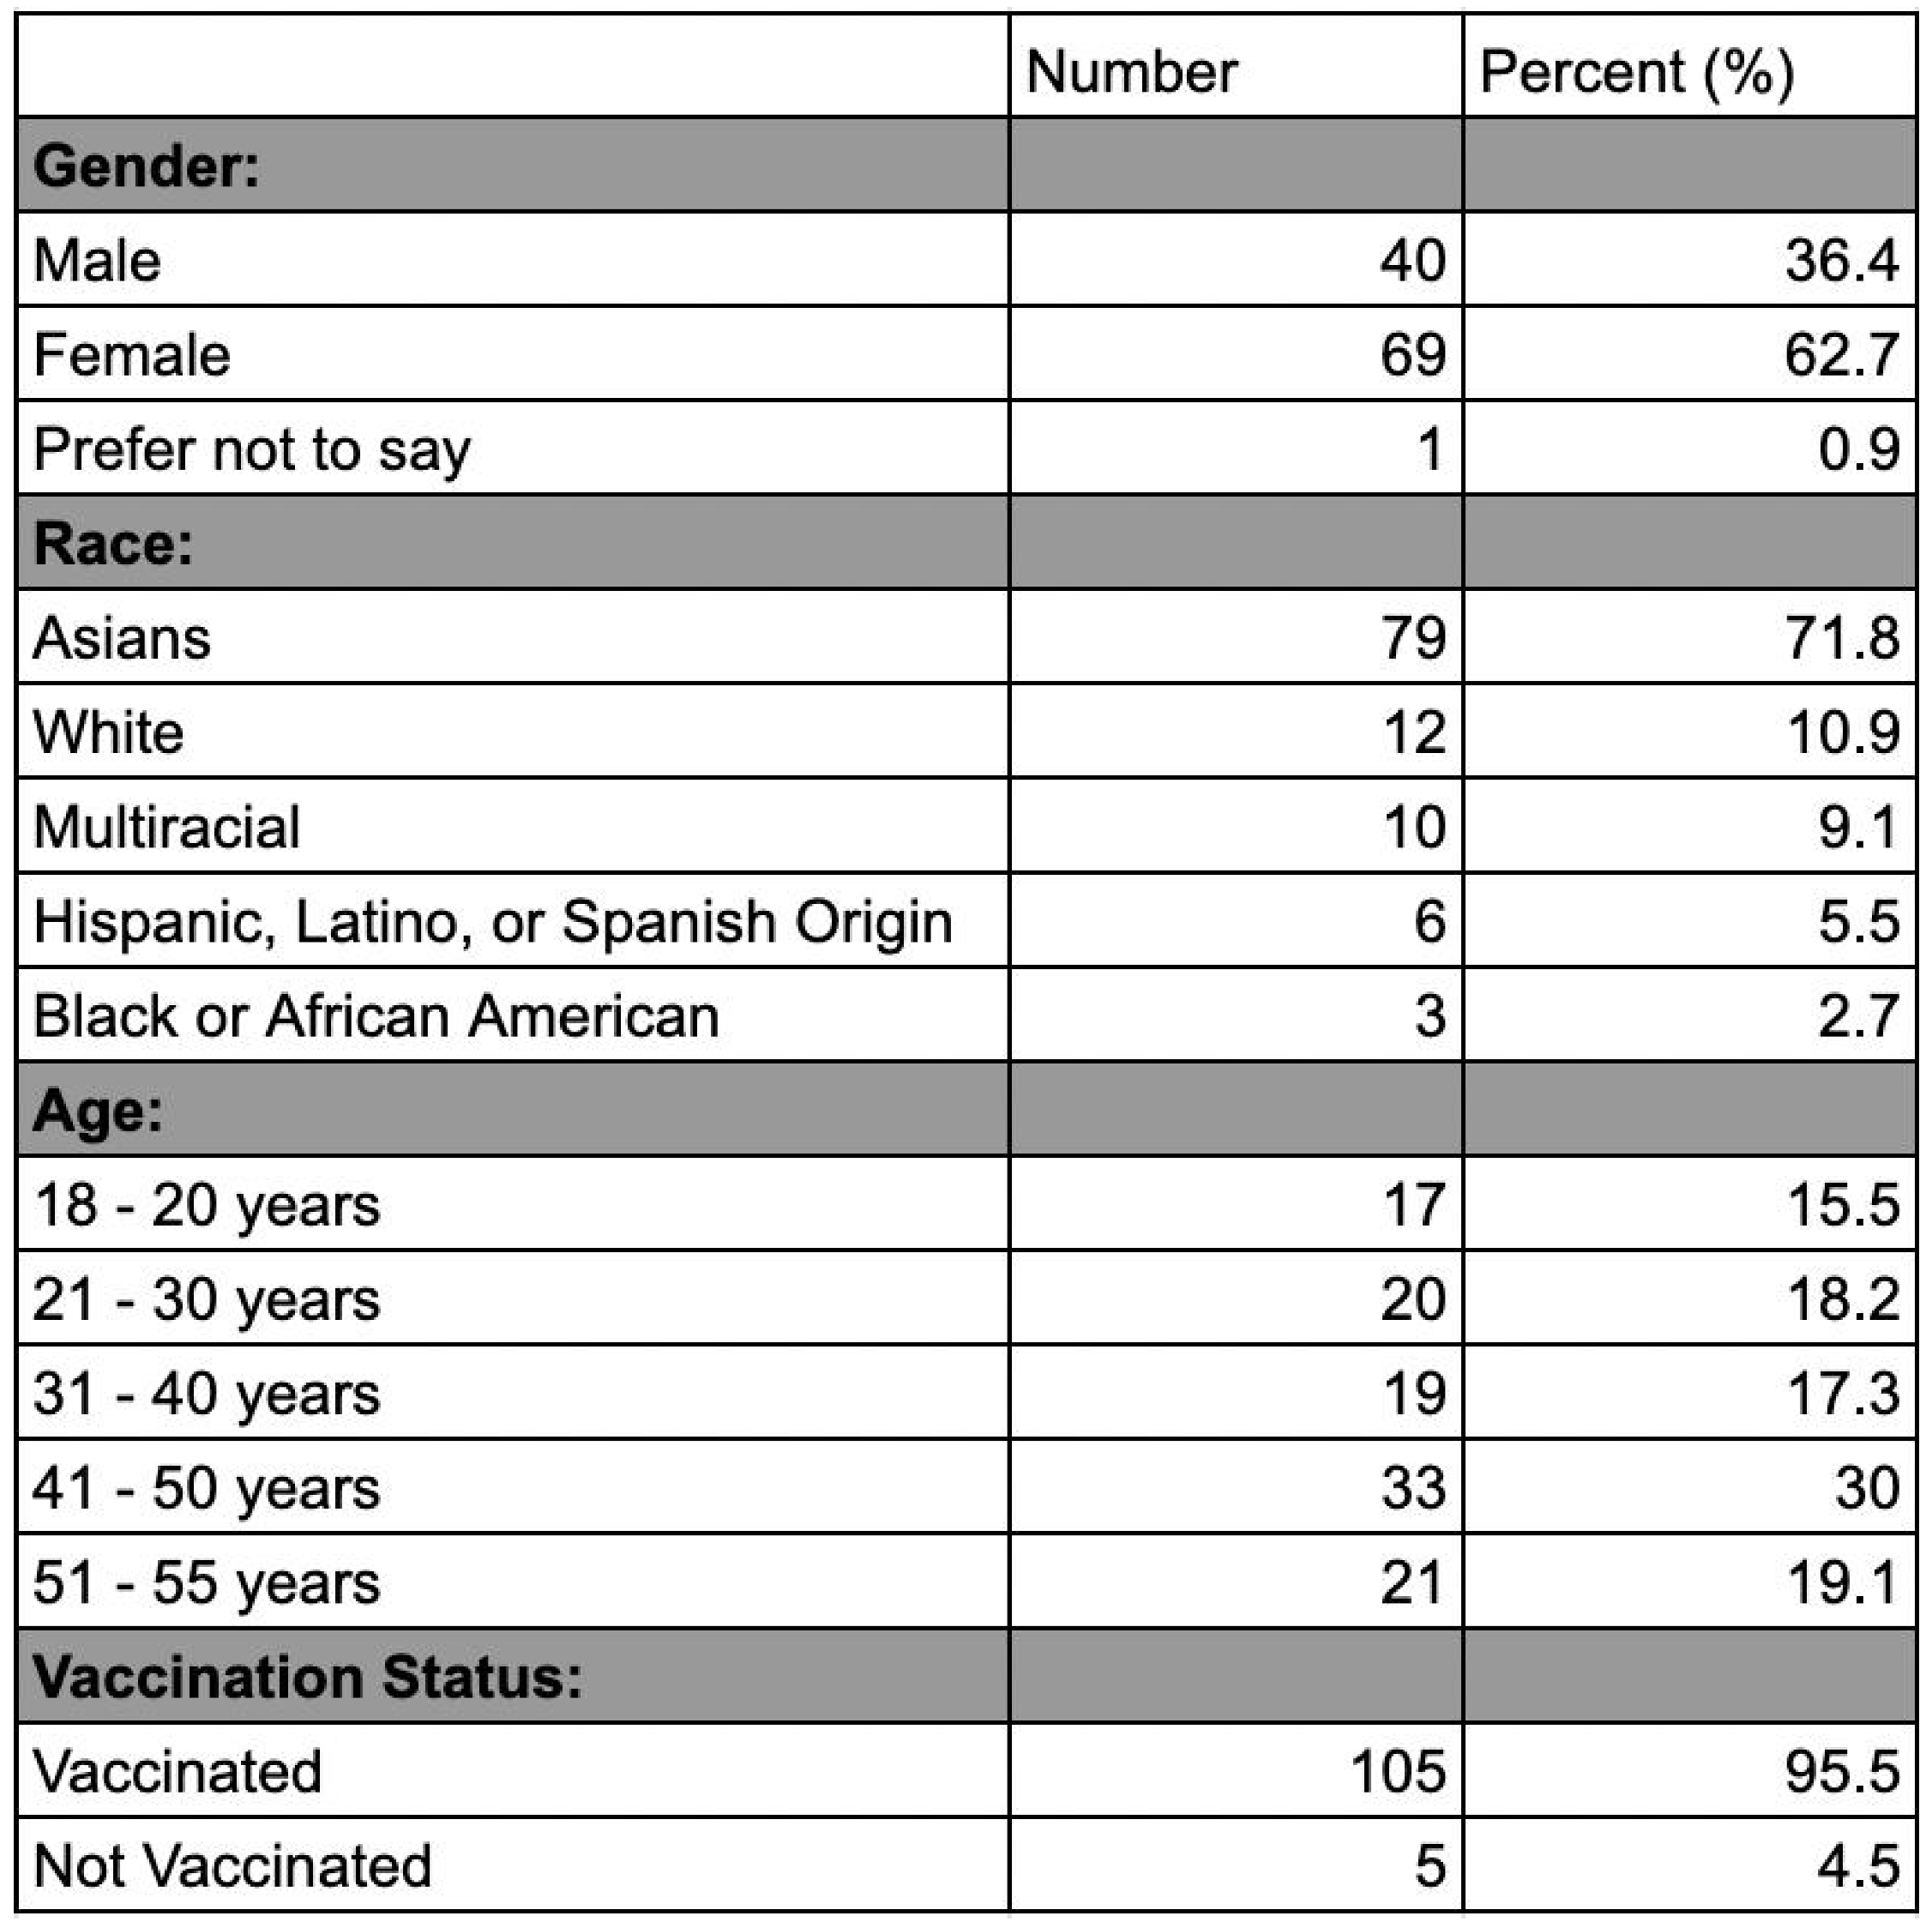
Regarding gender, 68% of the participants were females, 31% were males, and 1% preferred not to disclose. Overall, our most common age group was people between 41-50 years old at 30%, with those between 51-55 at (19.1%). Specifically for males, the most common age group was people from 51-55 years at 32.5%, while the least common age group was those from 18-20 years at 10.8%. For females, the most common age group was people from 41-50 years at 33.8%, while the least common age group was those from 51-55 years at 13.2%. Regarding ethnicity, the most prevalent group in our sample was Asians at 71.8%, followed by those who are White at 10.9%. When asked about their vaccination status, 105 participants were vaccinated (95.4%), while 5 participants were not (4.6%).
Table 2.
Demographic characteristics of participants. Data including gender, race, age, and
vaccination status were collected for all participants.
Table 2.
Demographic characteristics of participants. Data including gender, race, age, and
vaccination status were collected for all participants.
The sampling method used was a mix of random and convenience sampling. Participants’ data was de-identified before participating in the self-reporting survey to protect participant confidentiality.
Preliminary data analysis was initiated upon completion of the pilot study. The pilot study data helped establish the scoring process for the severity and timeline of each symptom experienced by participants. This study compiled many different types of questions including a selection of statements, each describing a different intensity level of the specified symptom. In addition, a scale from one to ten was used to determine the severity of each symptom experienced. Participants were asked to describe their symptoms from feeling it once in a while to feeling it regularly. Selection statements, specifying how many days of the week a participant felt the symptom, were used to determine the timeline value. The severity scale was from 0, never experiencing the symptom, to 3, experiencing intensely. The timeline scale was from 0 (never experiencing the symptom) to 4 (enduring for a prolonged time). If a participant indicated that they never experienced the symptom, a 0 on the severity scale, then the timeline value would automatically be 0 as well. In addition to the scoring scale, averages were calculated for both physiological symptom severity/timeline and cognitive severity/timeline by grouping sub-symptoms and taking the mean. Pearson correlation, a statistical measure used to assess the strength and direction of the linear relationship between two variables, was employed to evaluate the connections among all the symptoms.
Categories containing more than one question, had the scores averaged to calculate the overall severity. For example, the severity of working memory had scores added up from the 3 questions, then divided by three to obtain the average of the values noted. The pilot study of data analysis led to the usage of automatic scoring in JotForm, eliminating human error in calculations.
Before completing the self-reporting survey, participants filled out a form, determining their eligibility to participate in the study. If one met the criteria for eligibility, one completed the final survey; if not, they were removed from the system. Using this method eliminated the need to delete ineligible participants, removing the possibility of human error. Data scrubbing was conducted to eliminate redundant data, if a participant mistakenly turned in the form twice. Sometimes participants did not answer every question, causing incorrect averages for the severity of each symptom experienced; all their data throughout the self-reporting survey would then have to be scrubbed. This was done to ensure all of the data collected was not through accidental or randomly clicking, and the survey was carefully filtered.
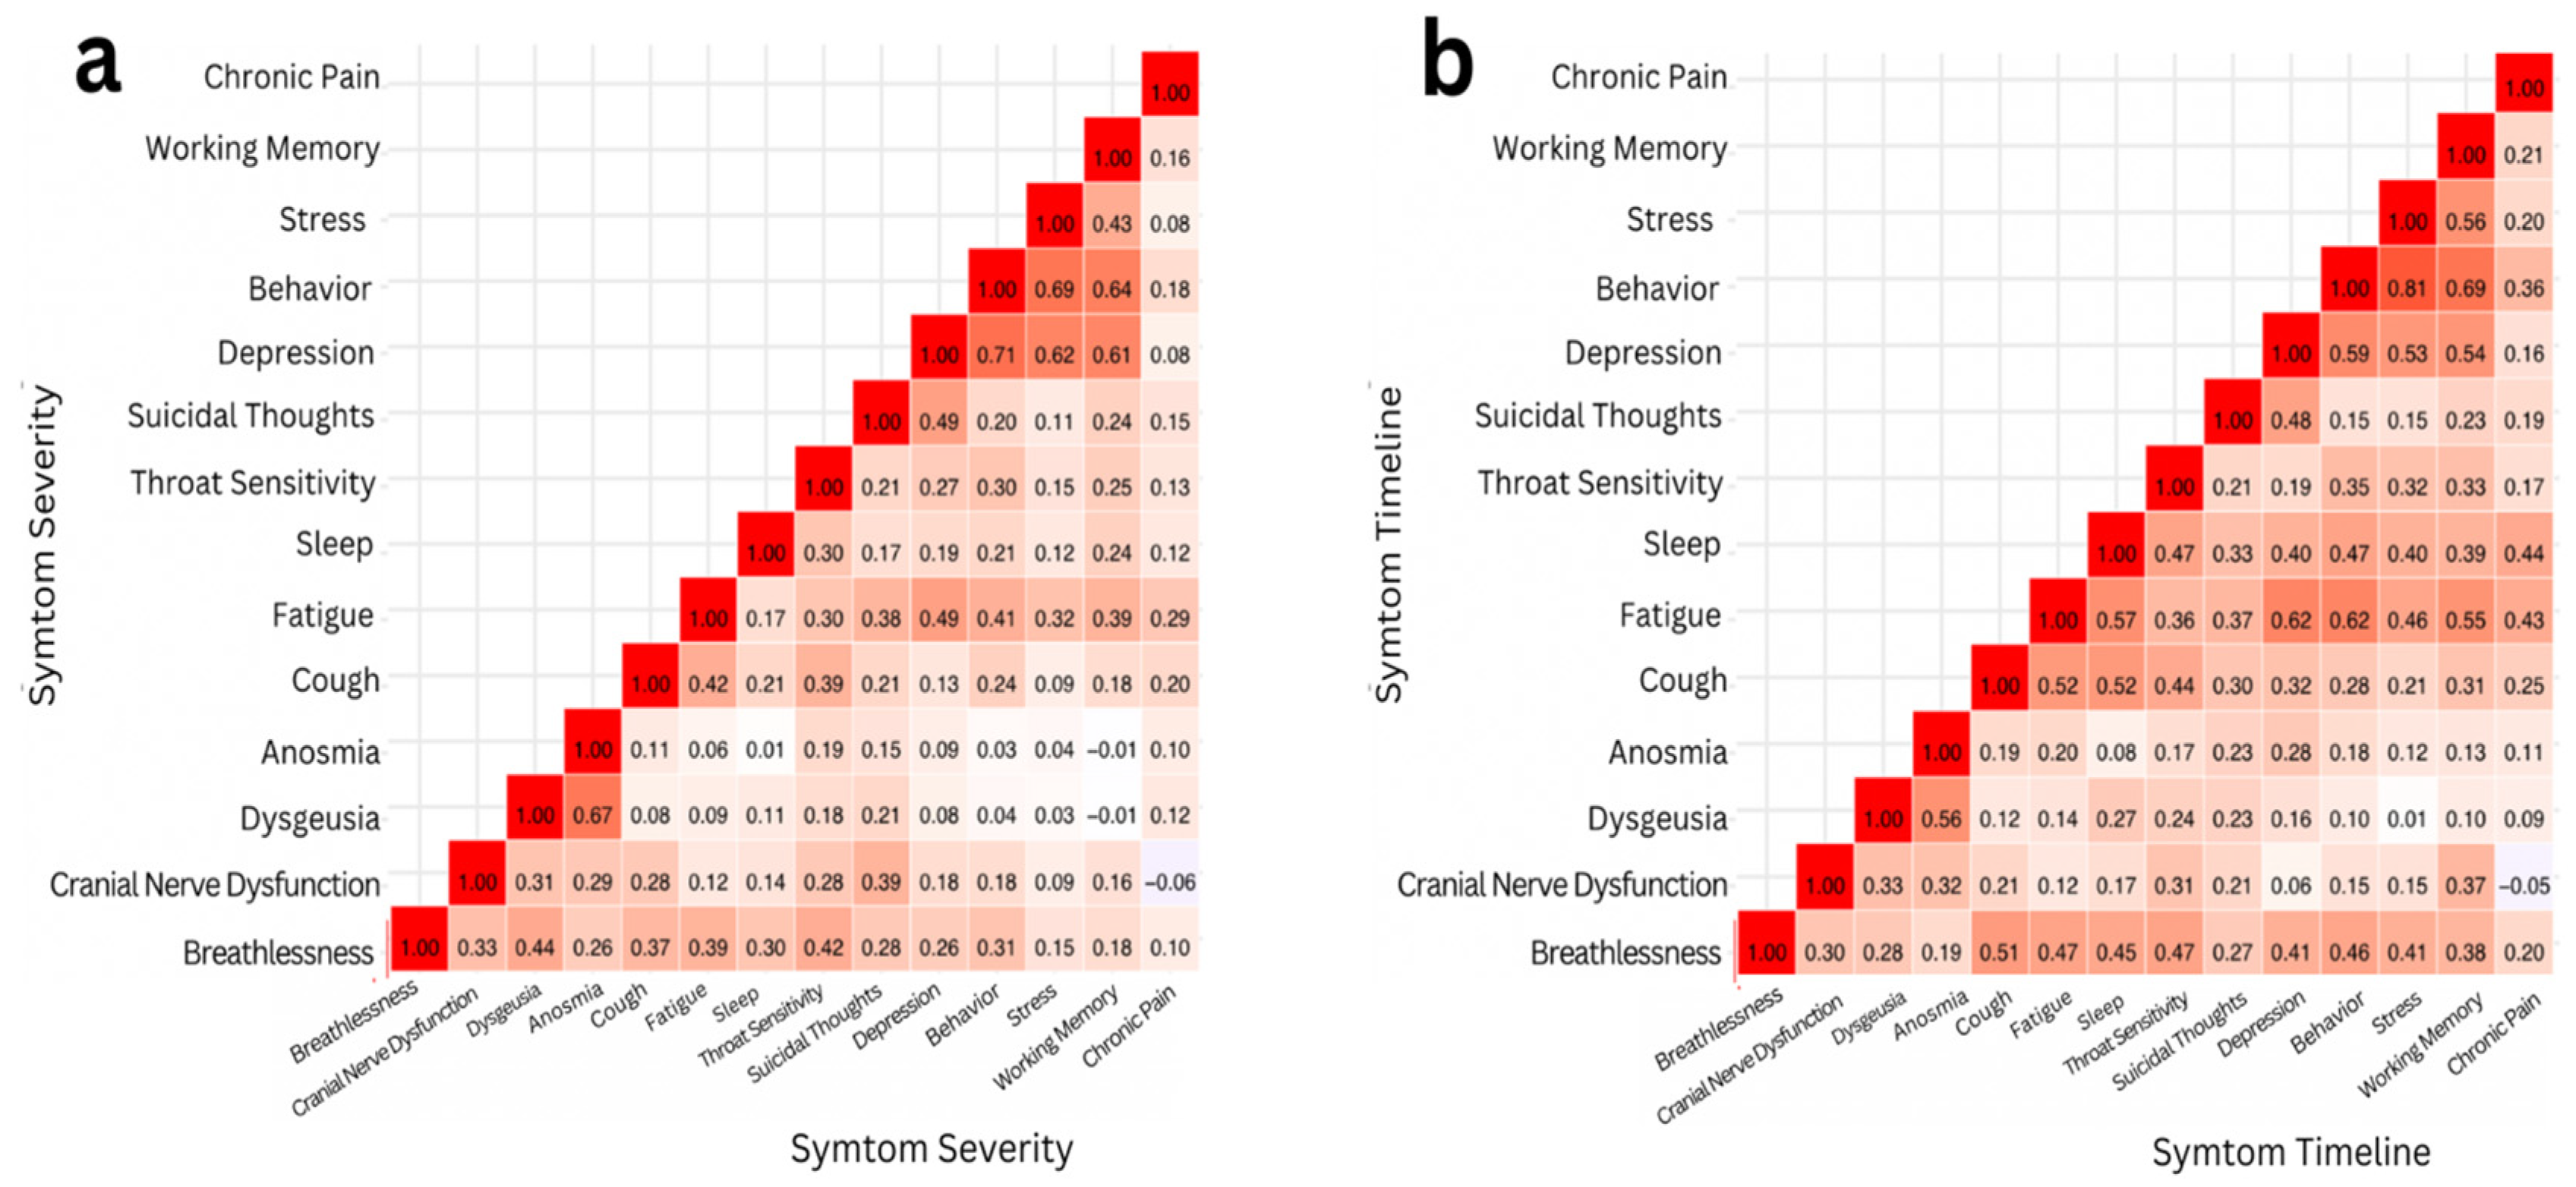
Figure 3.
Two Pearson Correlation heat maps representing the strength of correlations between a) severity of symptoms and b) timeline of symptoms. The color of a square signifies the extent to which two symptoms are correlated: dark red signifies a strong positive correlation (r > 0.5), light red signifies a weak correlation (r ≤ 0.5), and white signifies no correlation (r ≈ 0).
Results
In this study, the results were analyzed through two correlations: the severity of symptoms and the timeline of symptoms. Pearson correlation and correlation matrix heatmaps were performed to analyze and visualize the results. Upon assessing symptom severity, it was determined that the Pearson correlation coefficient (r) between the severity of depression and working memory was 0.73, indicating a strong positive correlation.
A statistical data analysis was performed using t-test: Paired Two Sample for Means [46] and ANOVA: Two Factor Without Replication Tests [47]. Pearson correlations were calculated between each symptom’s severity and timeline and different symptoms. R, a statistical analysis platform, was used to process and analyze the data for a more thorough analysis.
A paired t-test was conducted to examine the relationship between the severity of depression and working memory. The two-tailed p-value obtained was approximately 0.024*. Given that this p-value is less than the alpha level of 0.05, we reject the null hypothesis. This result provides statistically significant evidence of a correlation between depression severity and working memory performance. The correlation between the timeline of stress and behavior was also assessed. The Pearson coefficient correlation was found to be r = 0.81*, indicating a strong positive correlation. After running a paired t-test, a two-tailed p-value of around 0.205 was derived. Since the p-value was greater than the alpha level, we failed to reject the null hypothesis. Despite the strong positive correlation between stress and behavior timelines, the paired t-test did not reveal a statistically significant difference between the two. Therefore, the sample did not provide sufficient evidence to conclude that the timeline of stress significantly affects the timeline of behavior.
Table 3.
Severity and Timeline mean and standard deviation for each symptom.
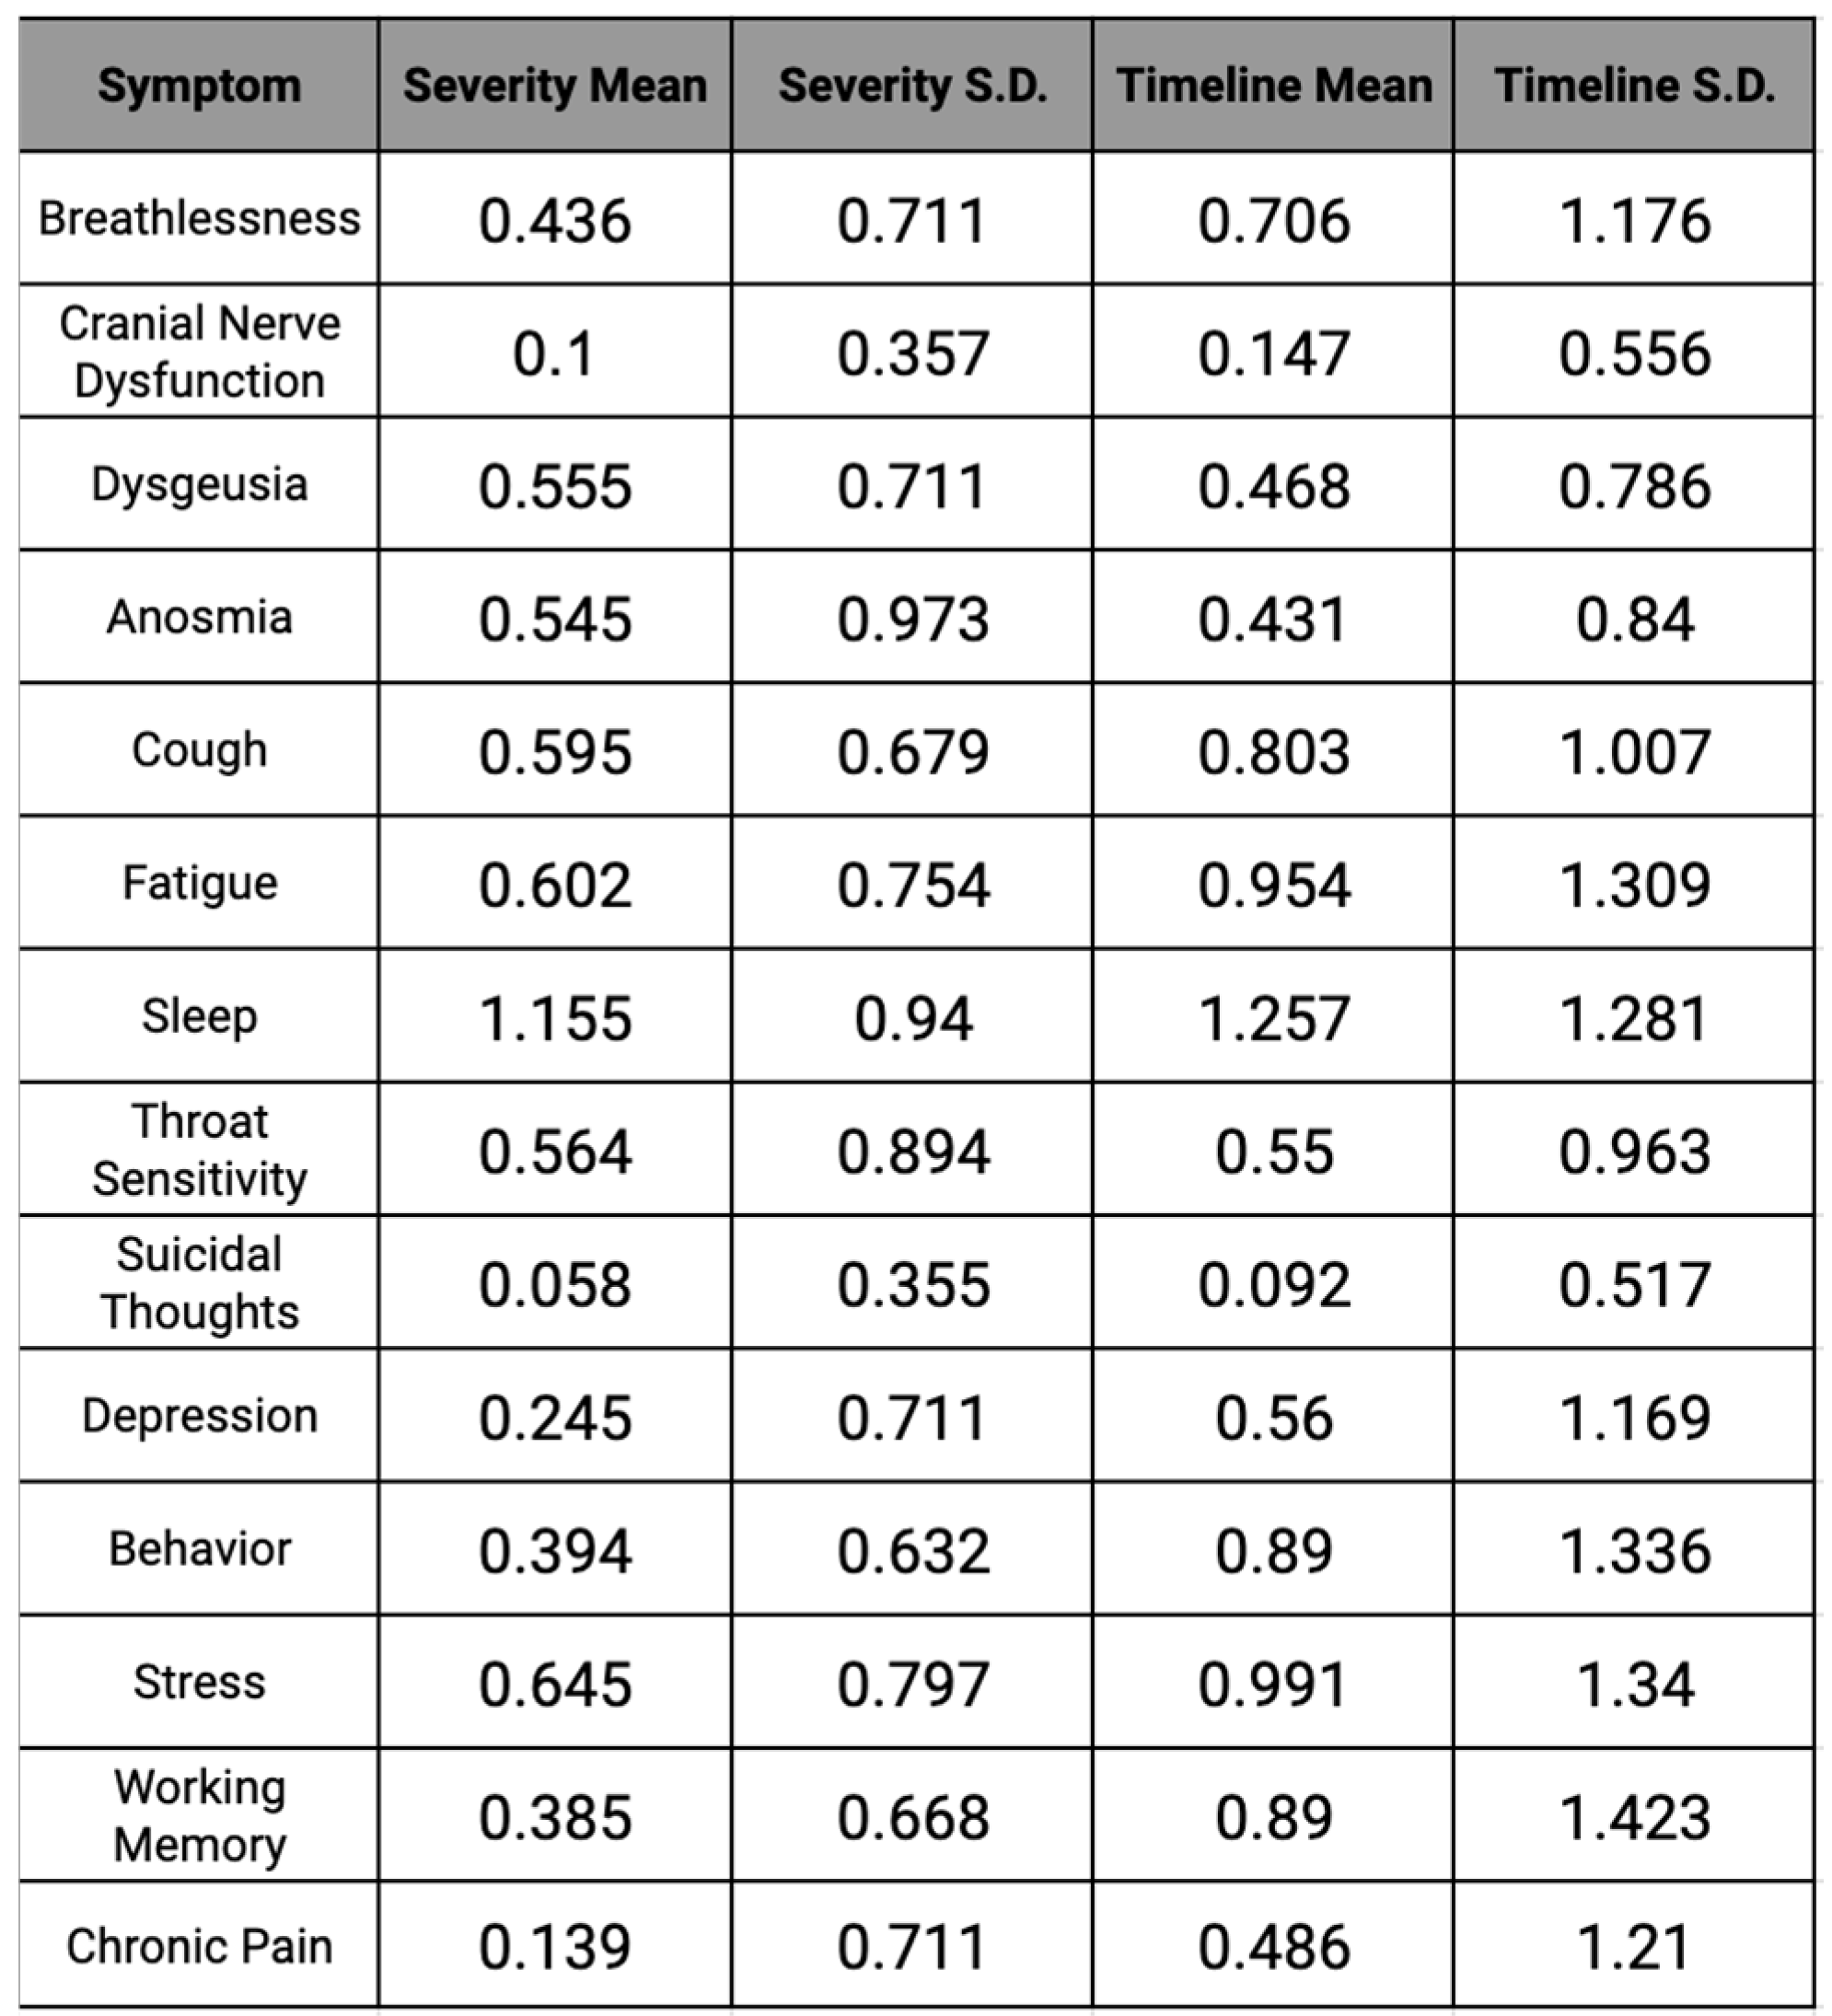
Sleep was the most affected symptom of COVID-19 in the study, with the average severity being 1.155 on a scale of 0-3. In correspondence with the highest severity–sleep—the highest timeline was also sleep, with an average of 2-4 weeks. Throughout the data, sleep had the highest severity and timeline, with 68% of participants dealing with sleep changes, demonstrating that most individuals affected by COVID-19 faced disturbances or changes in their sleep patterns.
Unlike sleep, the factor, of suicidal thoughts, had the lowest severity found in this study, with an average of 0.06 on the same scale of 0-3. Similar to the lowest severity for suicidal thoughts, the lowest timeline of the study was also represented by this factor with the average being 0-1 weeks. Approximately 0.04% of participants in our study dealt with suicidal thoughts during their time affected by COVID-19, revealing that it was one of the least common symptoms of the virus.
The physiological severity for both males and females encompasses eight symptom categories. Upon examination, the median and distribution were not statistically different. The median value for physiological severity of both males and females was 0.47. However, for the physiological timeline, biological females exhibited a much greater standard deviation (0.72) than males (0.52), despite a similar median value. The median value for physiological severity in males and females was 0.5.
Females had a median score of 0.267 for mental severity, compared to 0.033 for males [Refer to Supplemental Figure 18]. The standard deviation for females was also greater (0.41 vs. 0.28 for males). Regarding the mental timeline, the difference was even more pronounced. The median score for females was 0.4 and 0.1 for males [Refer to Supplemental Figure 18]. Similarly, the standard deviation for the mental timeline score for females was 0.91 as opposed to 0.47 for males.
For stress severity (Figure 4a), vaccinated individuals showed a considerably lower distribution of severity scores, with a median score significantly lower than that of unvaccinated individuals. The unvaccinated group had a wider distribution as well, indicating greater variability and high central tendency, suggesting that unvaccinated individuals were more likely to experience higher stress levels post-COVID-19 infection. The violin plot for sleep severity [Figure 4b] reveals a broader range of scores and a higher median for unvaccinated individuals, while the vaccinated sample has a more condensed distribution.
In Behavior Severity [Figure 4c], the vaccinated group exhibited lower severity and less variability than the unvaccinated group, implying lower behavioral disturbances due to vaccination. This same trend is mirrored for Throat Sensitivity Severity [Figure 4e], but not for Breathlessness [Figure 4d], where the median and distribution are much more similar, with the vaccinated group having a larger range.
Lastly, depression severity [Figure 4f] was significantly lower among the vaccinated group, with a narrower distribution of scores centered on a lower median severity score. Unvaccinated individuals exhibited a wider and more variable distribution, showing a higher tendency towards more severe depressive symptoms post-COVID-19 infection.
Analysis of the data presented in Figure 4 indicates that vaccinated individuals generally report lower severity scores with more consistent distributions compared to unvaccinated individuals. This trend is seen for both physical symptoms, such as sleep and throat sensitivity, and cognitive symptoms, such as stress and depression.
Table 4.
Shows the distribution of when participants were infected relative to vaccination status.
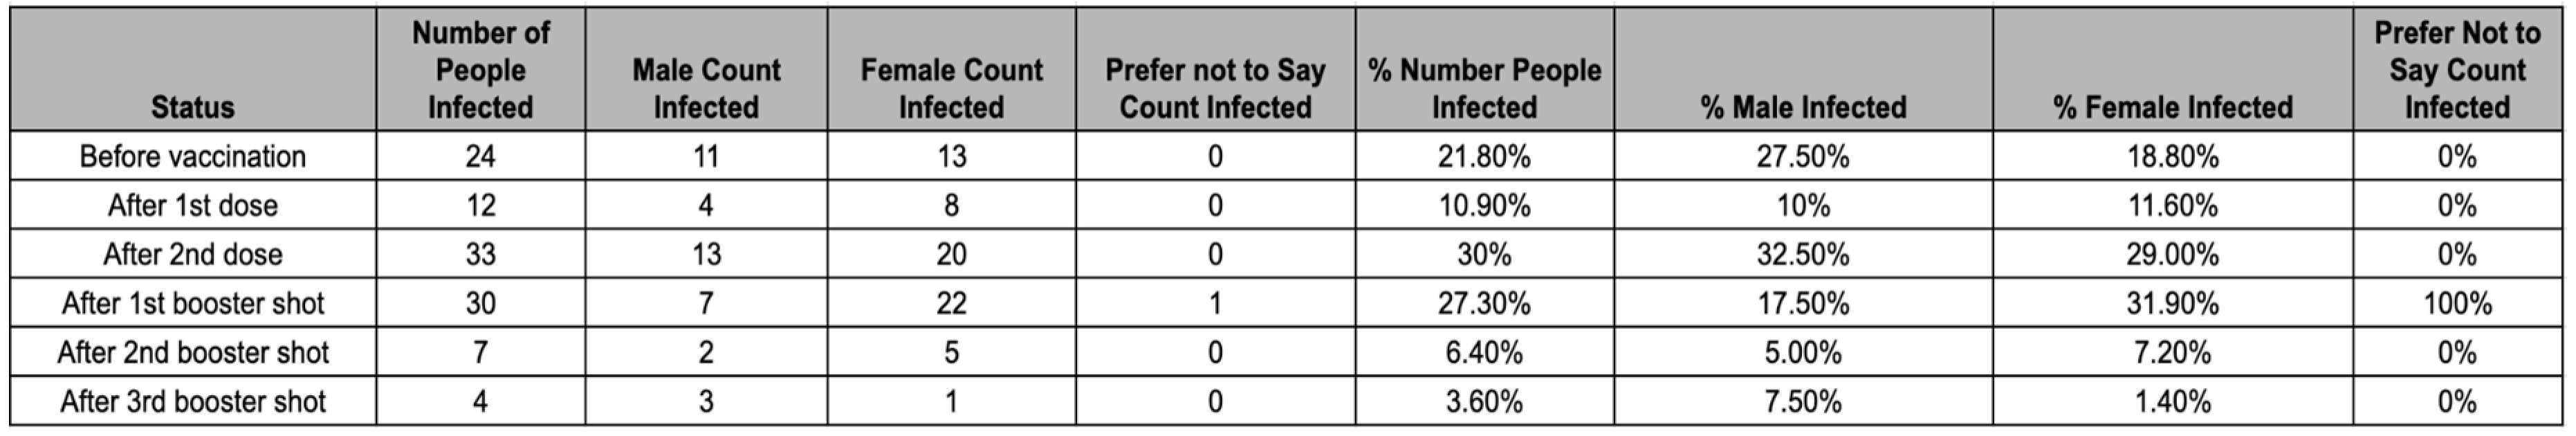
The majority of participants (67.3%) were infected with COVID-19 after they received at least their 2nd dose of the vaccine. Of the remaining 32.7% who were infected prior to their second dose, 1.8% were infected after their first dose of a single-dose vaccine. Male participants had a higher likelihood of being infected prior to completing their first complete course of vaccination (2 doses for double-dose vaccine, 1 dose for single-dose vaccine), with 35% of males being infected before a complete course compared to 29% of females being infected before a complete course of vaccination. However, the variability in vaccination efficacy between sexes may be a result of the sample. The likelihood of participants getting infected after the 2nd booster shot was significantly lower than in the other categories, likely because of a lower rate of vaccination for the second booster (45.5%) and the timing of the second booster release.
Figure 4.
Violin Plots the distributions of individual symptom severities for Stress, Sleep, Behavior, Breathlessness, Throat Sensitivity, and Depression for vaccinated and unvaccinated individuals.
Figure 4.
Violin Plots the distributions of individual symptom severities for Stress, Sleep, Behavior, Breathlessness, Throat Sensitivity, and Depression for vaccinated and unvaccinated individuals.
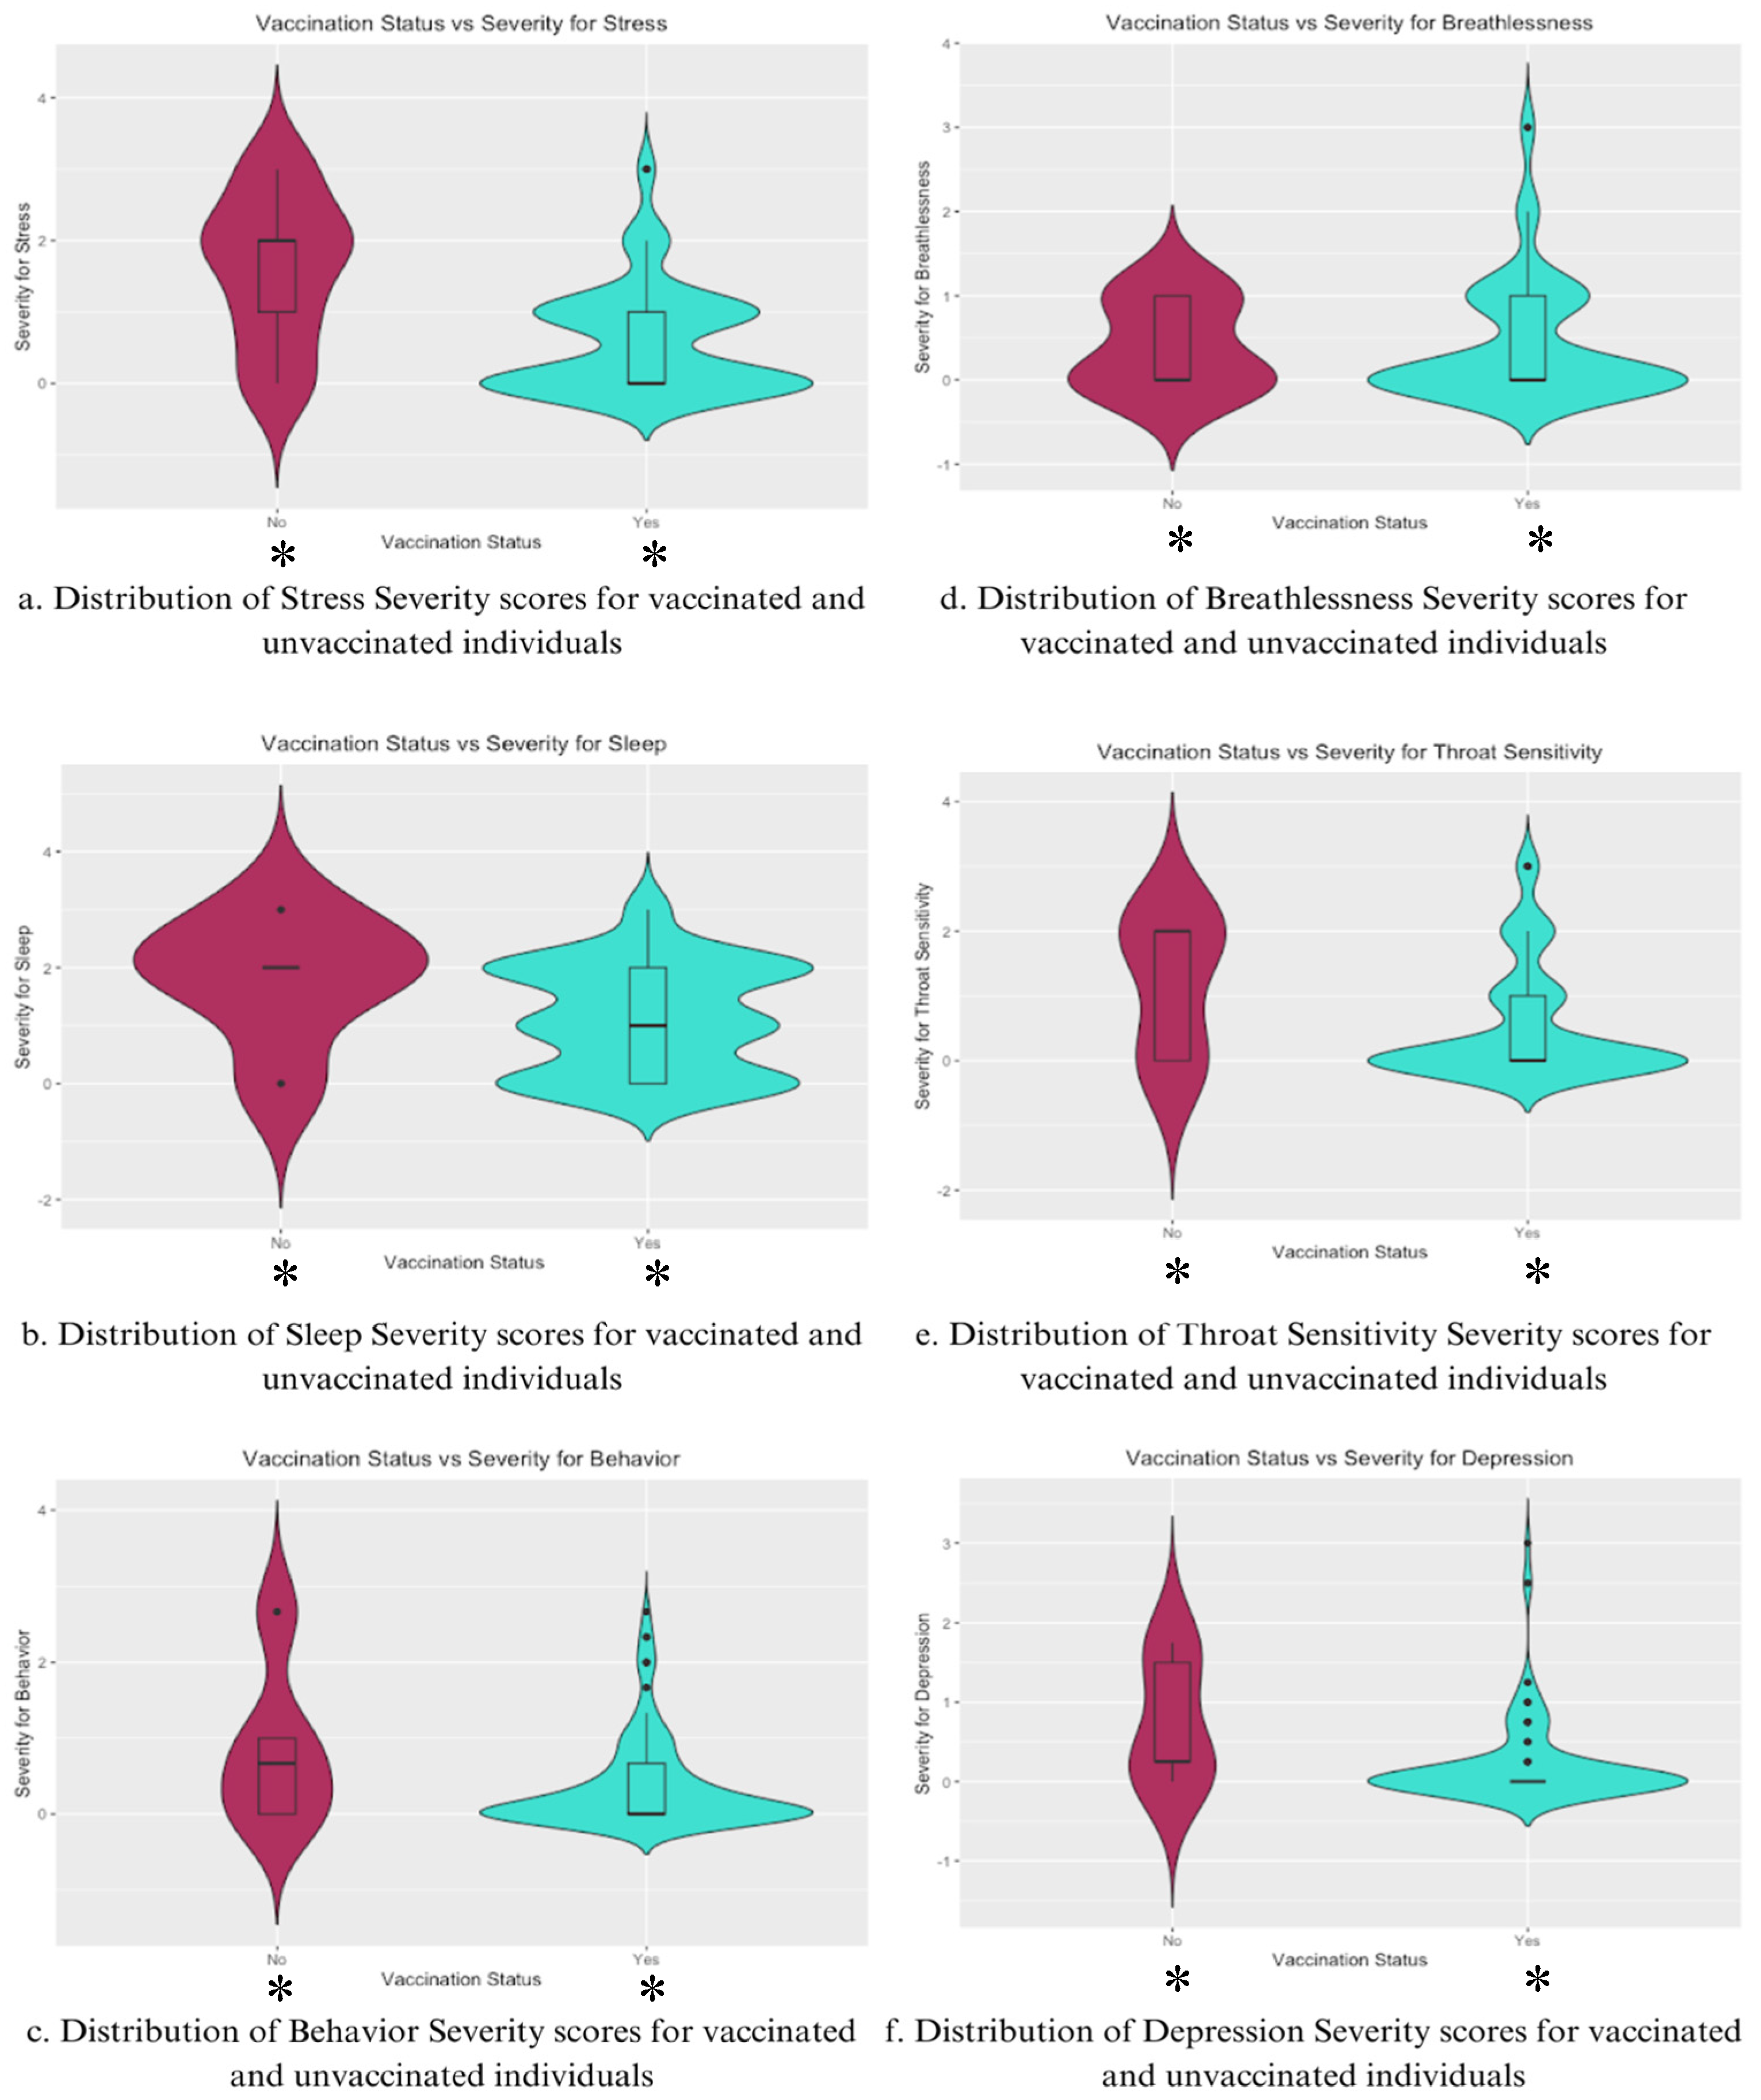
Table 5.
Comparative table showing the distribution of days it took to test negative for COVID‐19 among female and male participants.
Table 5.
Comparative table showing the distribution of days it took to test negative for COVID‐19 among female and male participants.
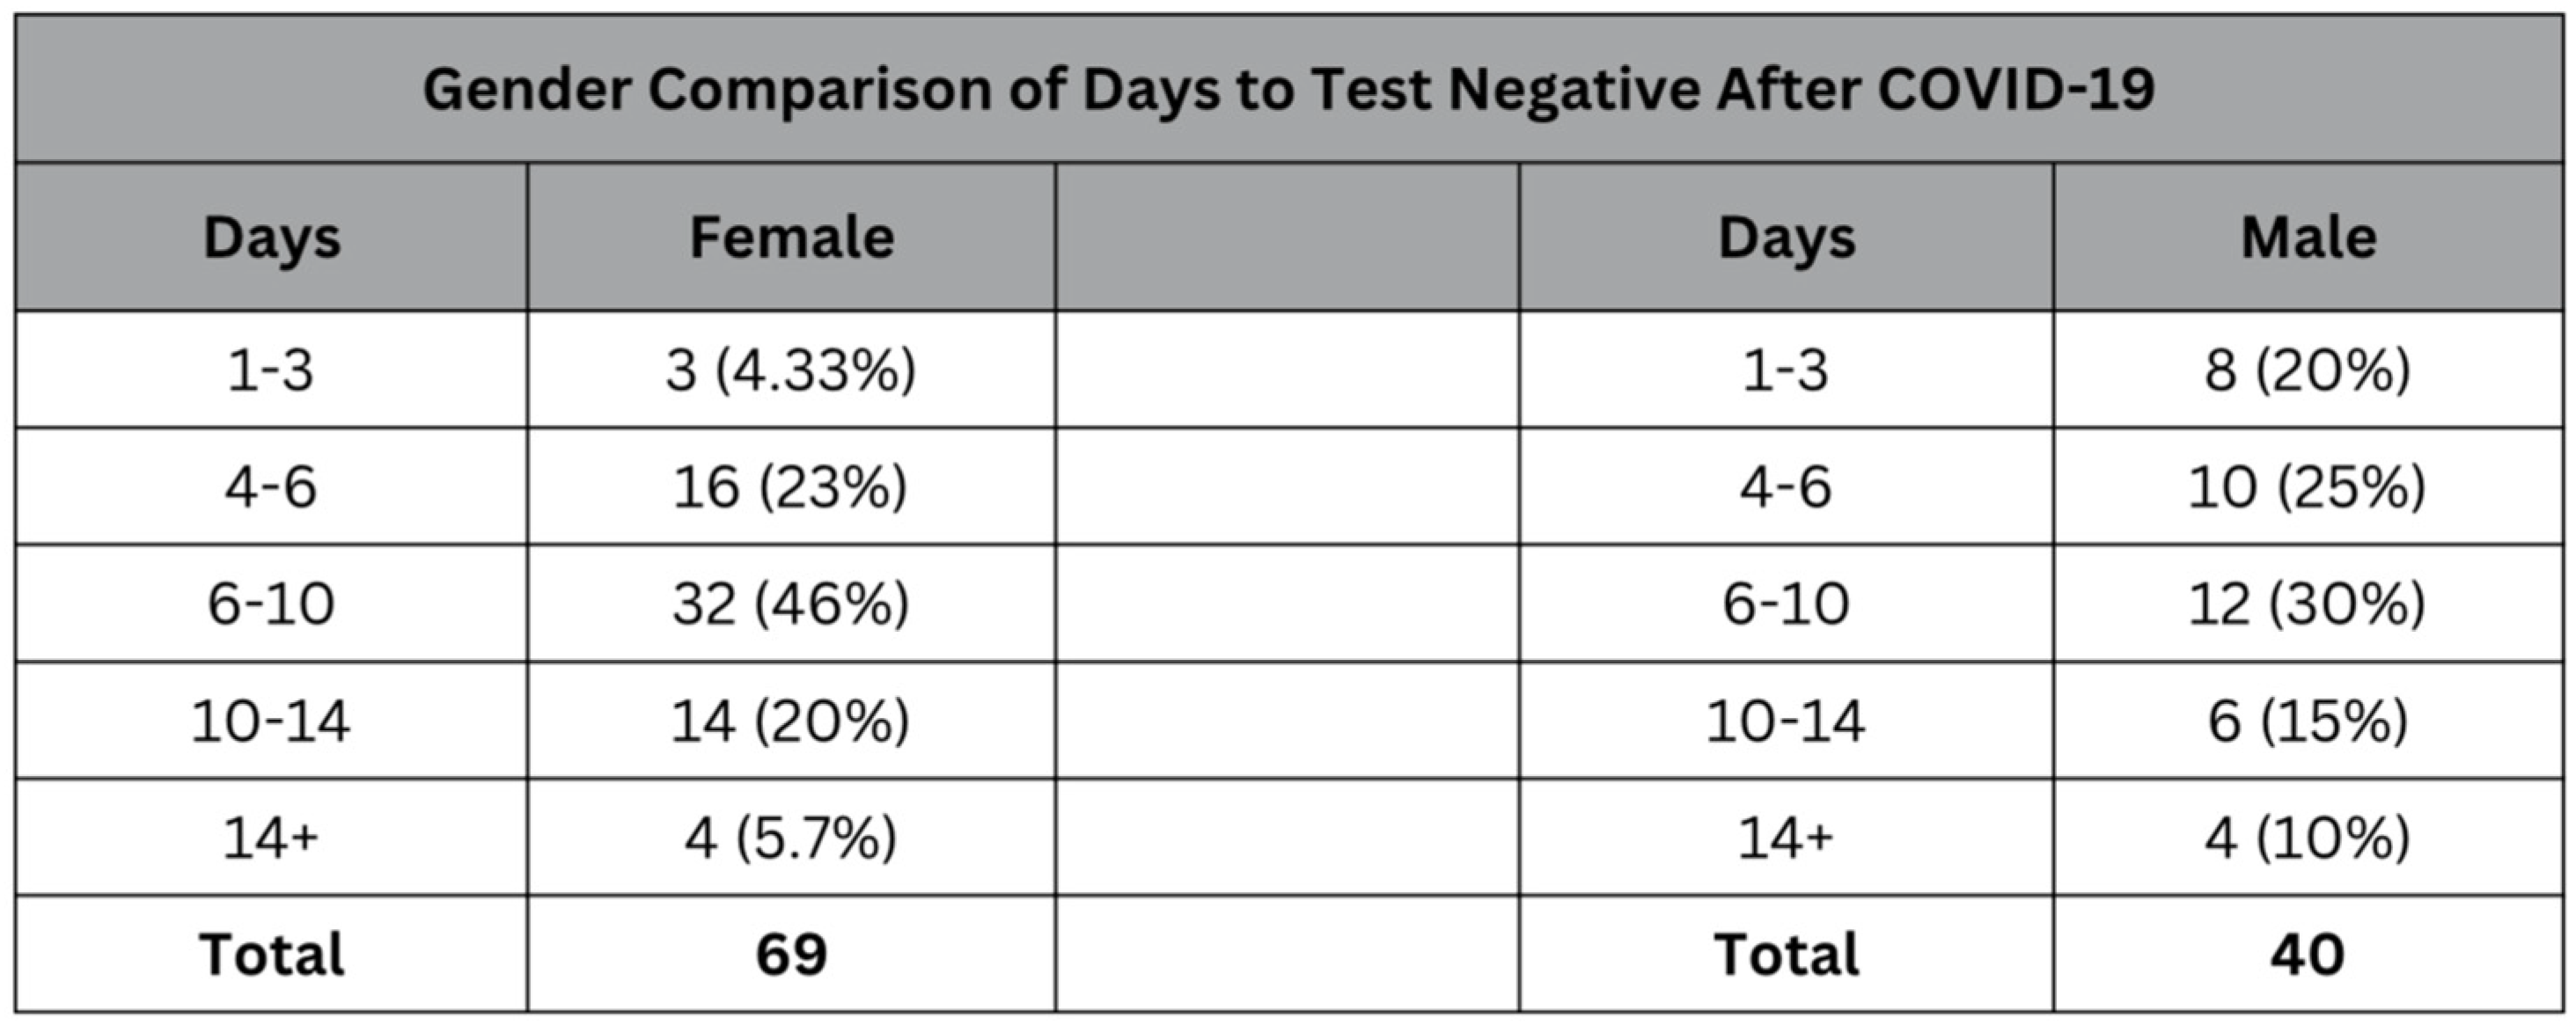
While the median for the number of days it took to test negative for both the male and female subsets of the sample was 6-10 days. However, the male subset of the sample had more variance and a wider distribution compared to the female subset, which had a strong central tendency toward the 6 to 10-day median. The lower rate (4.33%) of women who tested negative after only 1-3 days compared to 20% of males who tested negative within the same window shows that generally, women had to wait longer to be able to return to the workplace and resume normal activities.
Figure 5.
Exploratory Factor Analysis for Timeline of Symptoms.
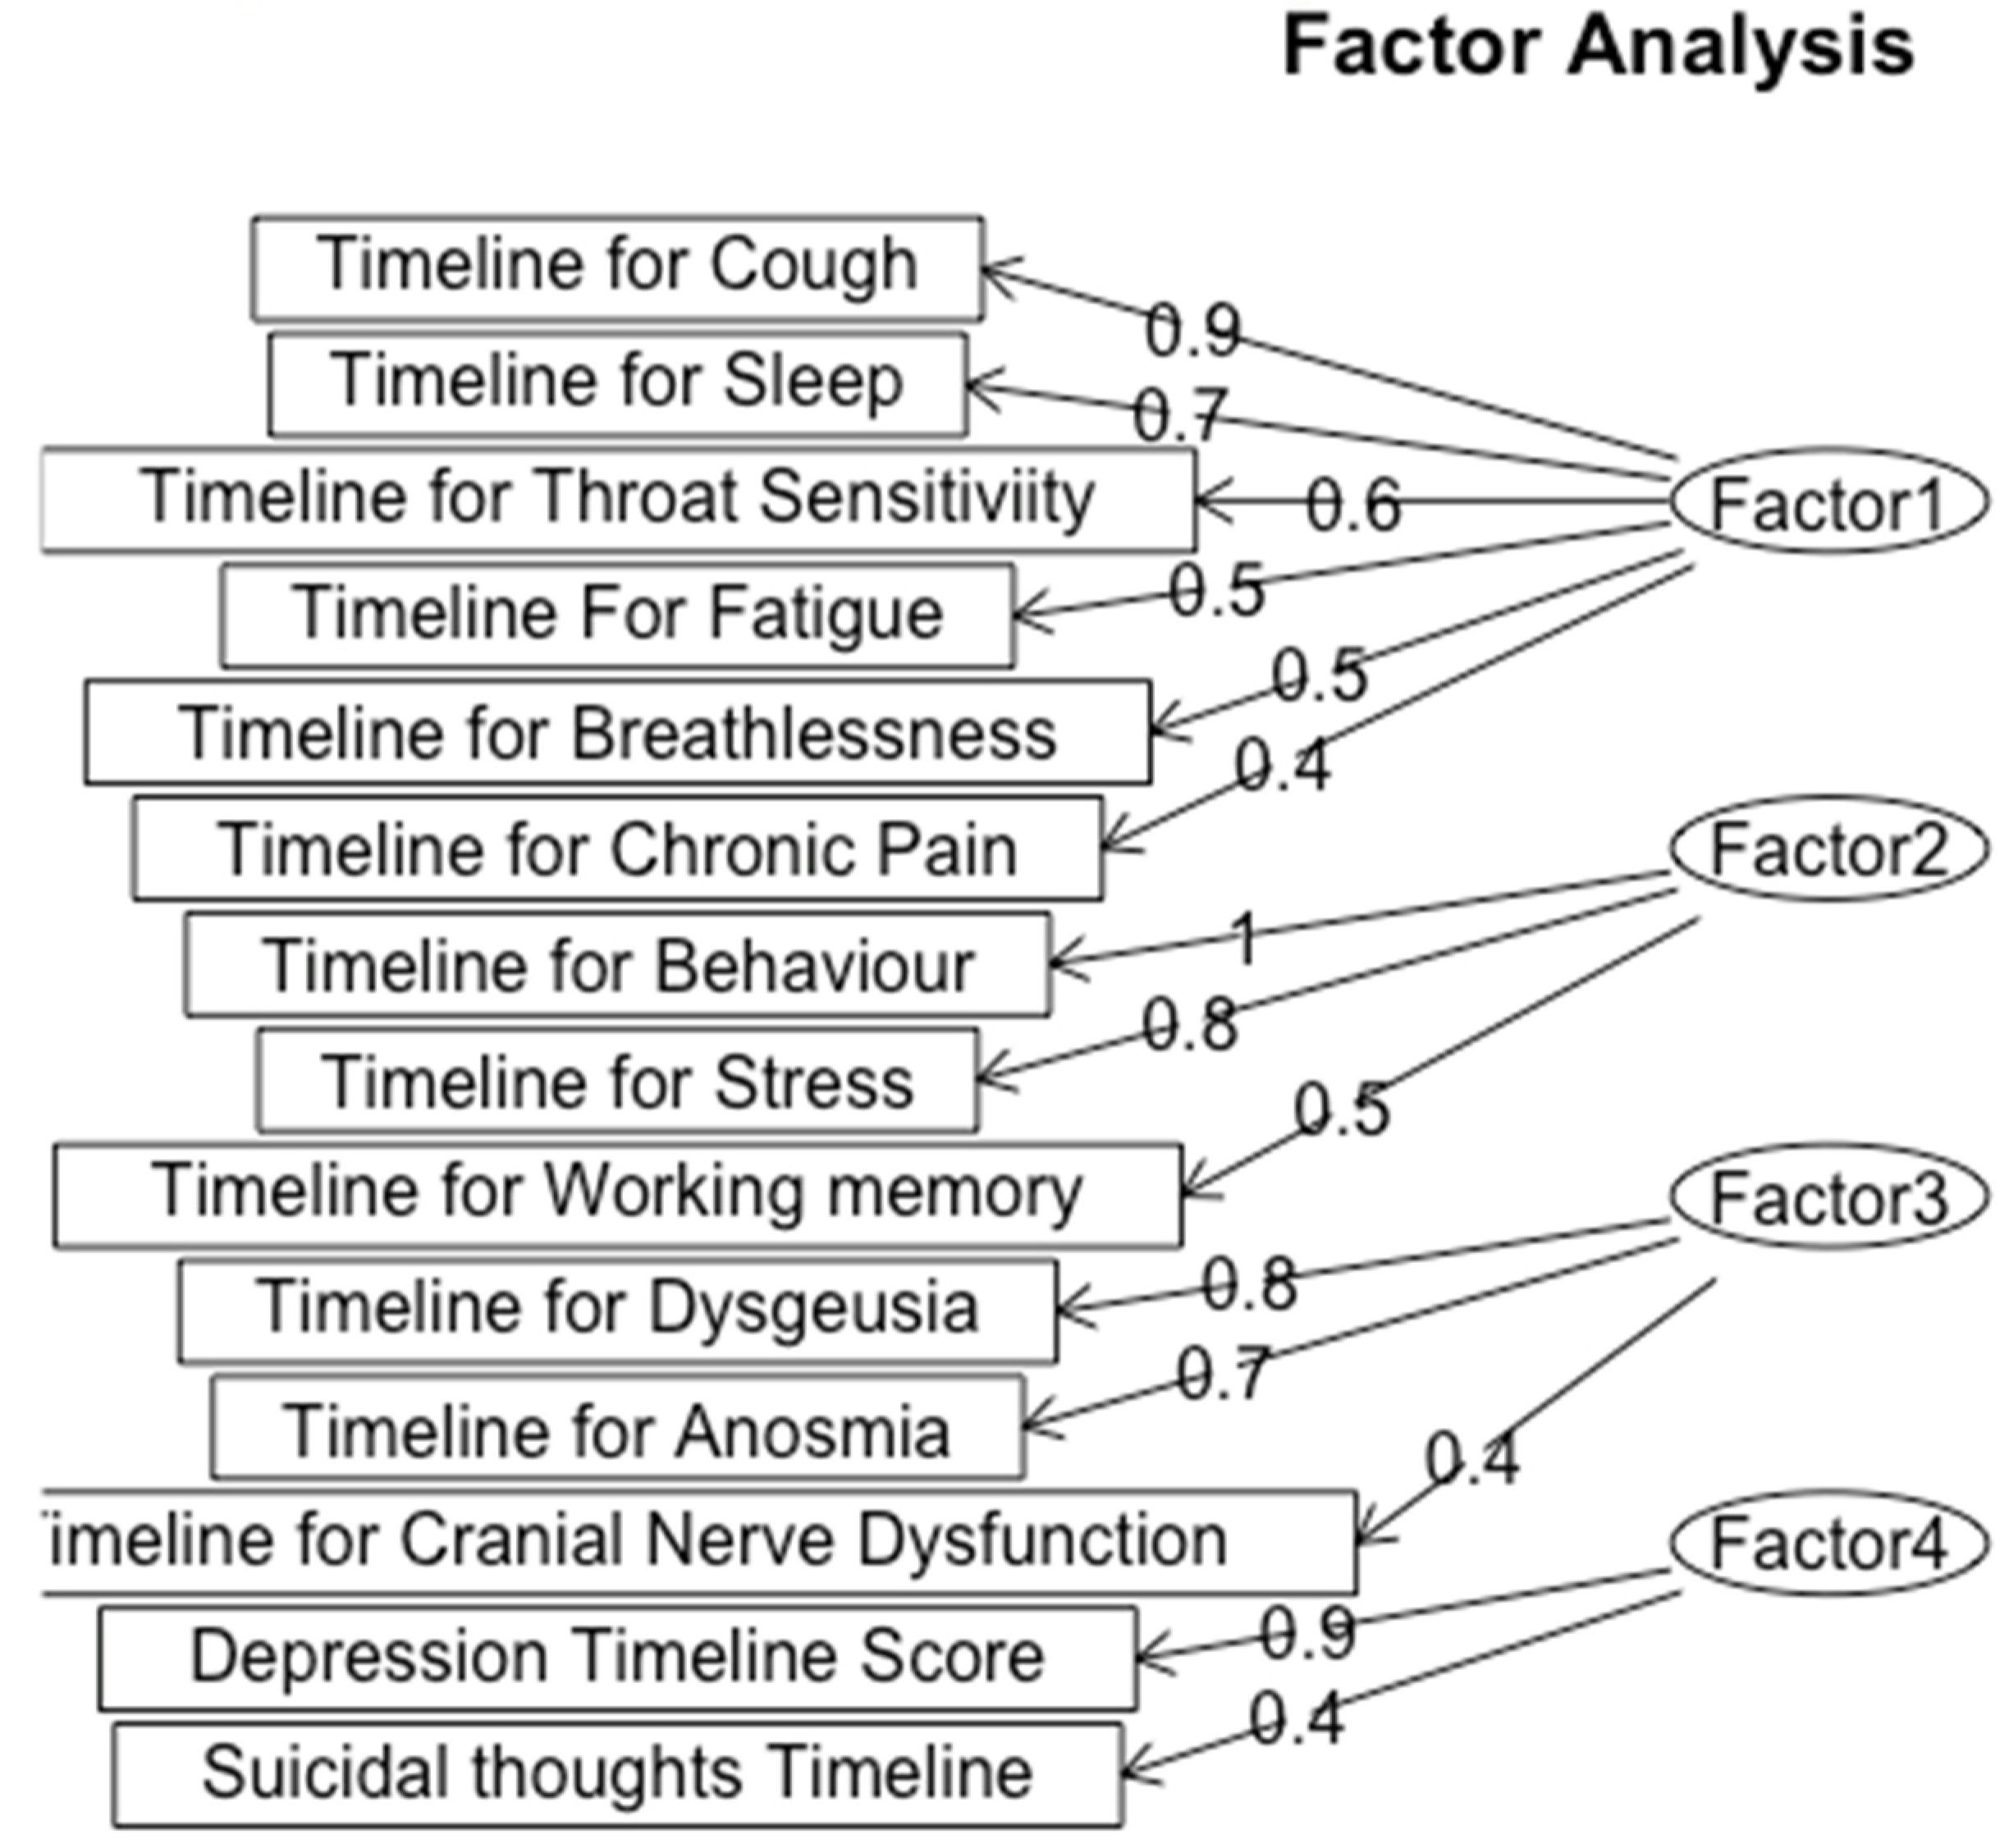
We classified Factor 1 as Respiratory and Fatigue Symptoms, which include symptoms such as cough (loading = 0.9), sleep disturbances (loading = 0.7), throat sensitivity (loading = 0.6), fatigue (loading = 0.5), and breathlessness (loading = 0.4), reflects a group of symptoms associated with both respiratory and fatigue-related problems. The high loading value of cough indicates that it is a key symptom within this factor, which aligns with the known respiratory effects of Long-COVID. This reveals that patients in this cluster disproportionately suffer from impacts on breathing and energy levels.
The psychological impact of Long COVID is highlighted through the second factor, Psychological and Behavioral Disturbance, characterized by behavior (loading = 1.0) and stress (loading = 0.8). This factor shows the significant mental strain, impacting patients’ behavior and mental health. The loading of 1.0 for behavior shows a strong correlation with the overall factor, suggesting that Long-COVID patients have profound behavior disruptions.
Factor 3, Sensory Dysfunction, included the timeline for the three symptoms of Dysgeusia (loading = 0.8), Anosmia (loading = 0.7), and Cranial Nerve Dysfunction (loading = 0.4). All of these symptoms are sensory nerve-related conditions, and the high loading values for Dysgeusia and Anosmia and their high correlation value indicate these symptoms are closely tied together.
The fourth factor that we categorized the symptoms into was Depression which encompasses depression (loading = 0.9) and suicidal thoughts (loading = 0.4), which also exhibited a high correlation in early analysis. The significant loading for depression emphasizes the serious mental implications of Long-COVID, suggesting these patients may benefit from comprehensive neuropsychiatric evaluation and support.
Figure 6.
Exploratory Factor Analysis for Severity of Symptoms.
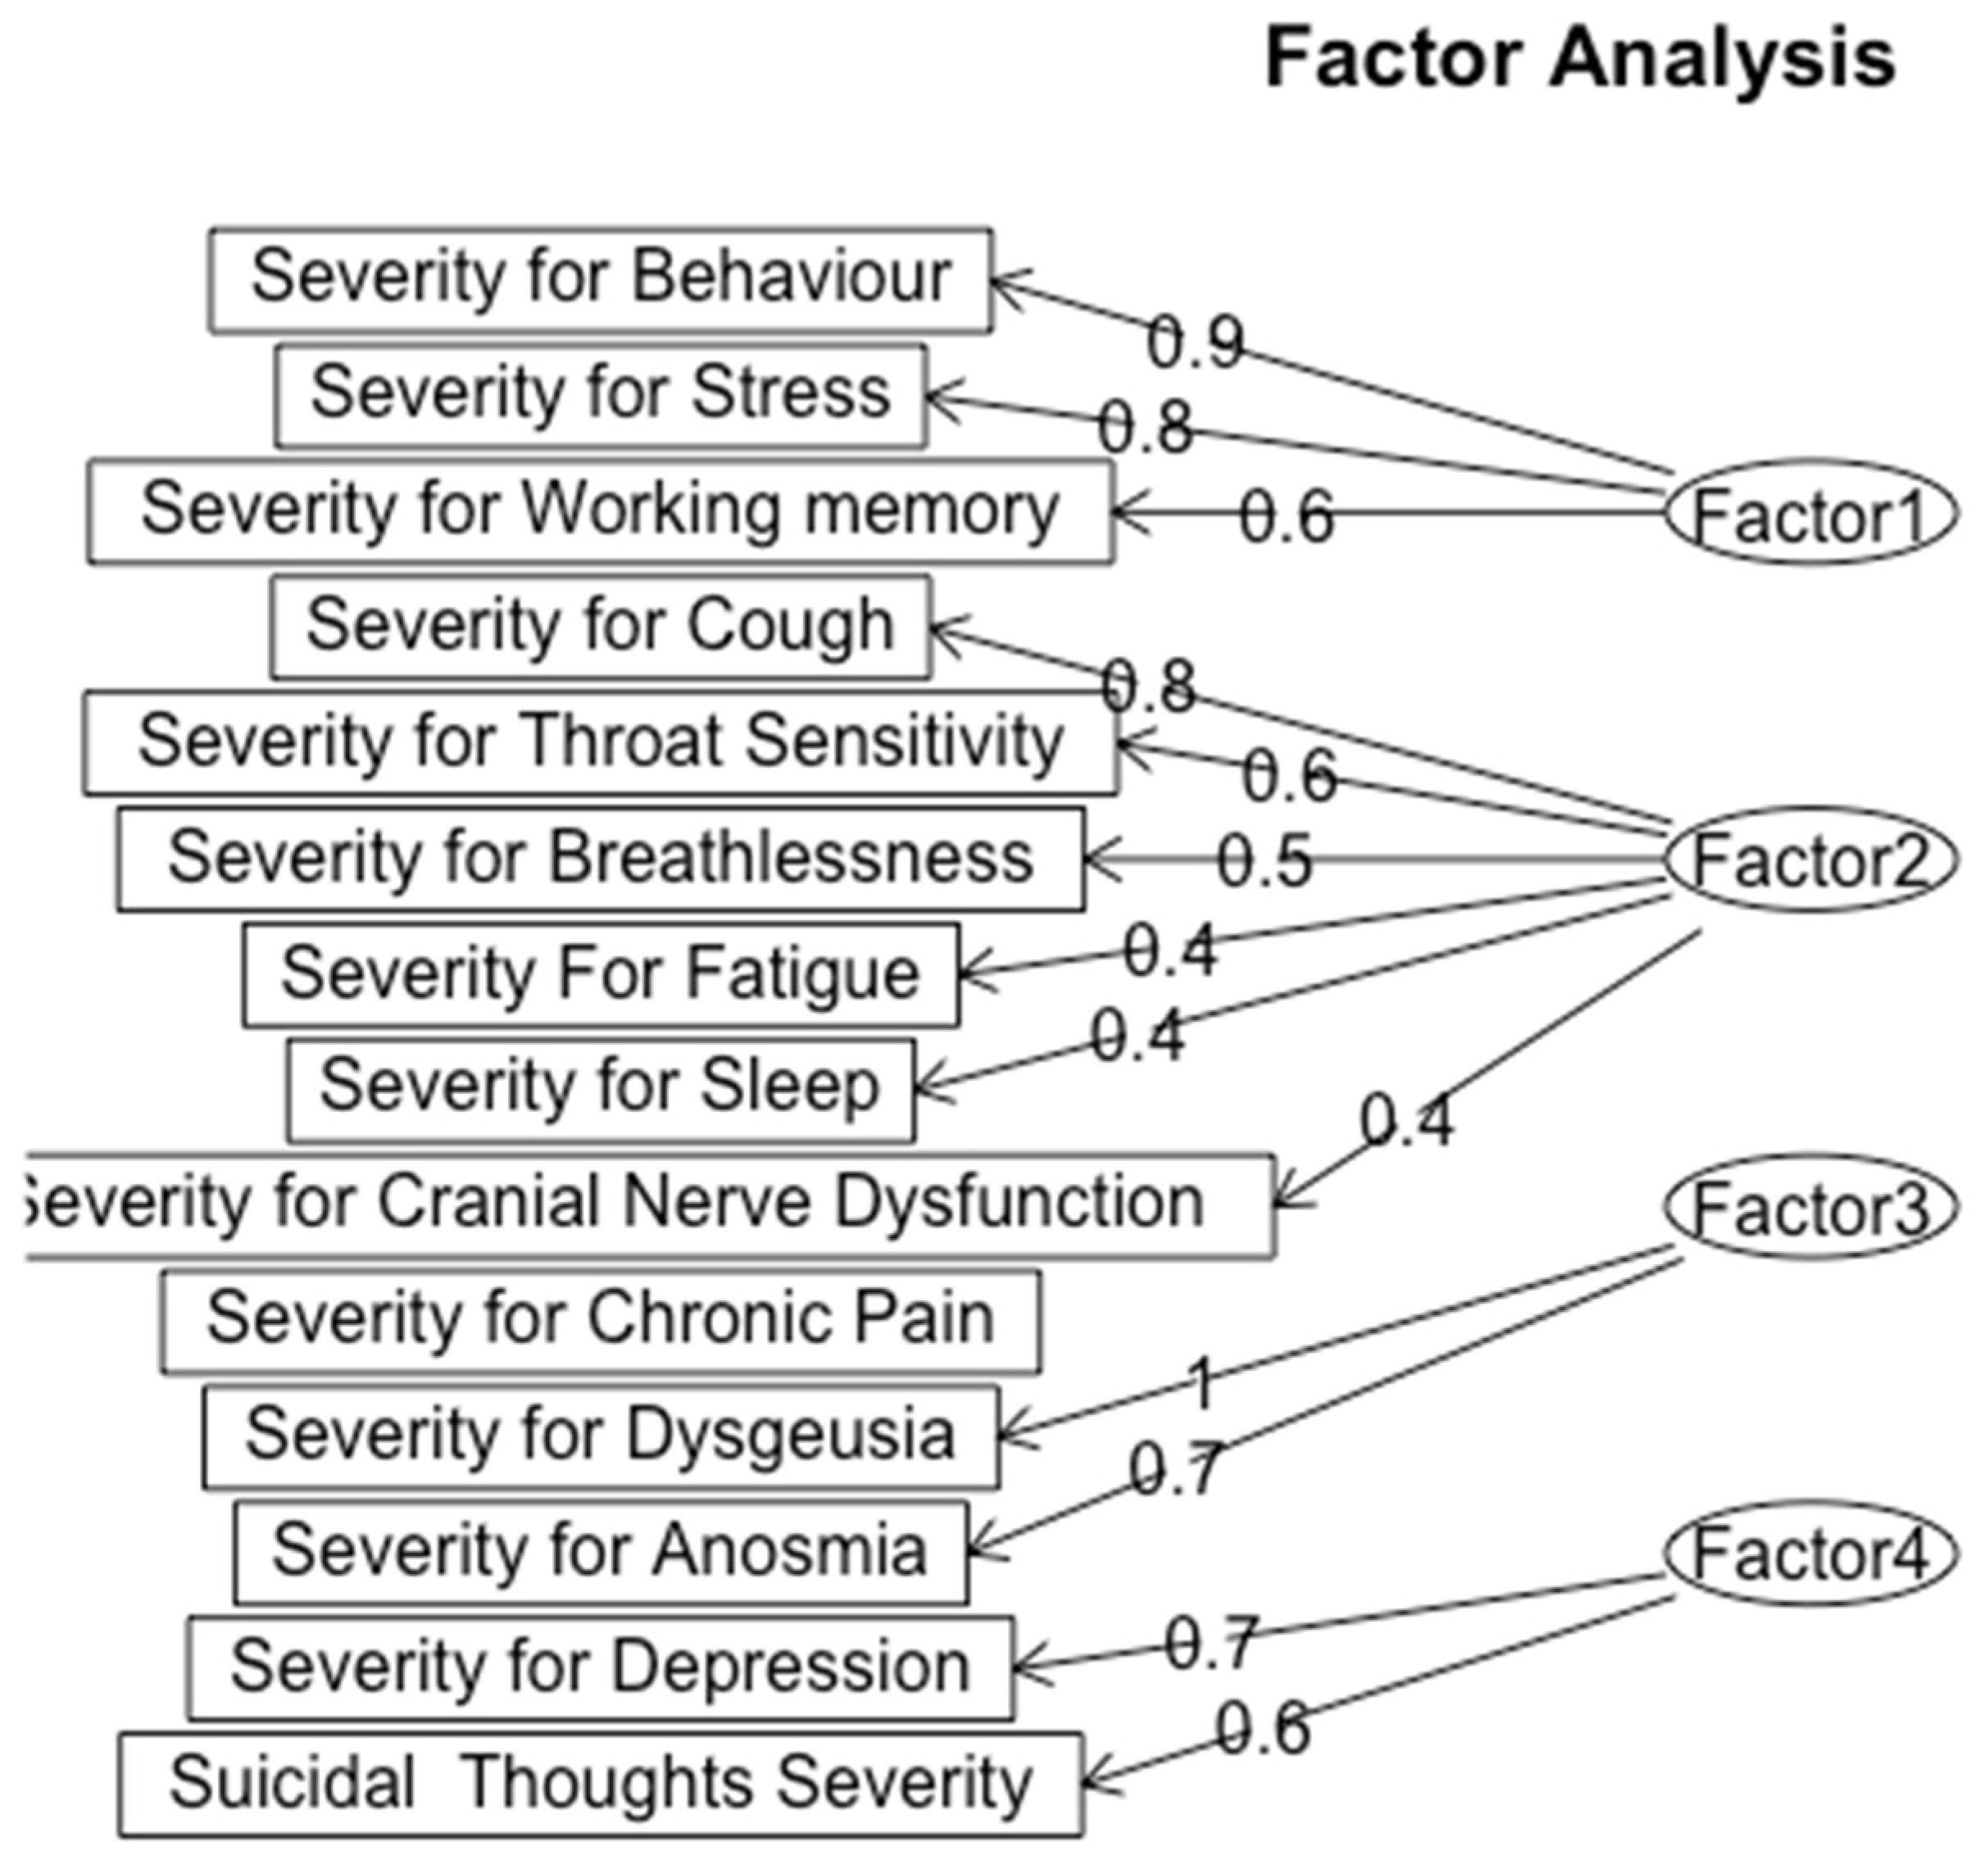
We classified factor 1 as Psychological and Cognitive Strain, which is characterized by symptoms of behavioral severity (loading = 0.9), stress (loading = 0.8), and working memory (loading = 0.6). This grouping contrasts with the timeline analysis, which categorized behavioral and psychological symptoms separately from cognitive impairments. The severity analysis indicates that elevated stress and behavioral disruptions are closely linked to cognitive strain, suggesting that mental health challenges may worsen cognitive symptoms in patients with Long-COVID.
Factor 2, Respiratory and Fatigue Severity, includes cough (loading = 0.8), throat sensitivity (loading = 0.6), breathlessness (loading = 0.5), fatigue (loading = 0.4), sleep issues (loading = 0.4), and cranial nerve dysfunction (loading = 0.4). This factor is aligned with the respiratory cluster found in the timeline analysis; however, when taking severity into account, cough stands out as a particularly significant symptom due to its high loading. The lengthy duration of respiratory symptoms highlights the substantial physical burden these symptoms place on patients.
Factor 3, labeled as Sensory Dysfunction, includes Dysgeusia (loading = 1) and Anosmia (loading = 0.7), indicating alterations in taste and smell perception in Long-COVID patients. These sensory impairments can impact patients’ quality of life, potentially worsening psychological distress and complicating recovery efforts.
Finally, Factor 4, labeled as Depression, consists of depression (loading = 0.7), and suicidal thoughts (loading = 0.6). Although suicidal thoughts indicate a major area of worry, their slightly lower loading indicates that depression is a core component of this factor. This connection calls for a more thorough investigation of the ways in which clinical populations may experience depression, especially in light of other illnesses.
Using our demographic information collected, we split up severity and timeline scores for each cognitive symptom by those who took one booster, two boosters, three boosters, and no booster. We found the average severity (on a scale of 0-3) and timeline score (on a scale of 0-4) from their respective scores and found a significant difference from the score results, especially for Depression, Behavio,r and Stress. For Depression Severity, no booster averaged a score of 0.357, Depression Timelines no booster averaged 0.574, while those with three boosters averaged a score of 0 for both severity and timeline. Average Behavior Severity for No booster scores 0.571, while three boosters scored 0.111. Average Timeline Behavior scored 1.286 for no booster, while three boosters scored 0.667. Average Timeline Stress scored 1.143 for No Booster, but 0.667 for the average of those who received Three Boosters. For Average Depression Timeline, Average Behavior Severity and Timeline, Average Severity Stress, and Average Chronic Pain Severity, the score of Two Boosters was higher than the score of One Booster indicating worsened symptoms from the Third Booster. This increase in scores can be due to only 8% of participants receiving three boosters, and 3 total participants getting Covid-19 after three booster shots. These results show the impact of the COVID-19 booster shots from various companies. Overall, there is a downward trend of scores as we can see from the total averaged out Cognitive timeline and Cognitive Severity Score. For Severity, the No Boosters had a score of 0.319 and decreased to 0.1629 for Three Boosters and Timeline had a score of 0.714 and decreased to 0.444.
Limitations
The results of this study are largely concentrated in the Western United States, this limits their generalizability to other regions or populations. The geographic focus of this study needs to be expanded to an international scale to be relevant to the general population. The data therefore is catered toward the demographic of the Western United States. While the study attempted to capture the San Francisco Bay Area’s demographic breakdown, some groups are better represented in the data, especially the Asian-American population. The results are more pertinent to the Asian-American population because of this. Finally, gender is also a limitation of this study. Because the female percentage of the study is 68 percent as compared to a 38 percent composition of males, the data and implications are relevant to both groups but can have higher accuracy in predicting and analyzing the symptoms of females.
Discussion
The purpose of this study was found through an extensive literature search showing specific COVID-19 aftereffects and their symptoms [7,8,9,10,11,12,13,14,15,16,17,18,19,20,21,22,23,24,25,26,27,28,29,30,31,32,33,34,35]. Recent data from the 2022 National Health Interview evaluate the ongoing symptoms of post-COVID-19 in the United States, which show that long-term symptoms are influenced by different demographics [8]. When it comes to age, this self-reporting survey concludes that adults, between ages 35-49, were more likely to have Long COVID than adults, between ages 18-34, 50-64, and 65 or older [8]. For gender, Long COVID symptoms differ by sex. Women, by 3.3%, were more likely to experience Long COVID symptoms following exposure than men [8]. Furthermore, the interview shows that the percentage of adults who had Long COVID varied by race. Asian adults were least likely to have Long COVID compared to Black, White, and Hispanic groups. Hispanic adults were the most likely to obtain post symptoms (8.3%) followed by White and then Black adults [8]. Finally, the percentage of adults who had long-term symptoms differed by the urbanization level as long-COVID was less prevalent in adults living in large central metropolitan areas compared to medium to small metropolitan areas [8].
Due to COVID-19’s worldwide prevalence, this study can be utilized to educate others on the risks associated with COVID-19. More specifically, Long COVID, where patients continue to face physiological and neurological effects with unknown timeframes, has affected millions of people across the United States of America. By surveying those who tested positive for COVID-19, connections can be made between demographic factors and symptoms to discover the longevity of COVID-19 effects. This study can be used to aid clinics, research projects, and public health experts in understanding and improving the prevention and treatment of Long-COVID. In addition, the findings can raise awareness about Long-COVID among healthcare providers and the general public to understand potential symptoms and support affected individuals. This study can incentivize the establishment of community support groups for those dealing with the long-term impacts of COVID-19.
However, it is hard to draw connections between specific variants of SARS-CoV-2 severity and the timeline of symptoms experienced. 58 of the 110 participants (~53%) responded “I don’t know” when asked what variant of COVID they were infected with. Of the 58 participants who responded that they knew what variant of SARS-CoV-2 they were infected with, 4 (~8%) specified it was Delta, 22 (~42%) specified it was Omicron, 4 (~8%) specified it was a sub-variant of Omicron, and 22 (~42%) specified it was the original strain of the virus. This variation in the proportion of participants affected could be a result of variation in the degree of contagiousness or the time period in which these strains of the virus were most prevalent. The initial strain of SARS-CoV-2 was the primary strain from January 2020 to June 2021, which may explain the 42% of participants who knew which strain they had been infected with. On the other hand, the Delta variant was most prevalent from June to mid-December 2021 [42]. The Omicron strain of the SARS-CoV-2 virus replaced the Delta variant in mid-December 2021. It was most prevalent until mid-2022 when it mutated into several sub-variants, such as EG.5 (“Eris”) and BA.2.86 (“Pirola”), which are still prevalent to this day. Yale Medicine also noted that Omicron and its sub-variants were the most contagious strains of the SARS-CoV-2 virus, which could contribute to the large portion of participants infected with this strain. Among those who knew their variant, there was significant variation in the strain they were infected with and the time period of each variant’s prevalence. Therefore, no clear conclusions can be drawn about the effects of a specific variant.
Conclusion
This study aimed to investigate the prevalence, severity, and demographic influences on symptoms associated with Long COVID-19 (PASC). The findings indicate that sleep disturbances were the most prevalent symptom, with an average severity score of 1.15 and a duration of 2–4 weeks. These conclusions align with previous studies (e.g., Ayigebusi et al., 2021), which highlight sleep disruptions as a common long-term consequence of COVID-19. On the other hand, suicidal thoughts were the least reported symptom, with an average severity of 0.06, suggesting it is less commonly associated with Long COVID in the studied population.
Demographic factors played a significant role in the severity of the symptoms experienced. Female participants consistently reported higher severity scores for both physiological and cognitive symptoms compared to males, corroborating findings by Bai et al. (2021) that women tend to experience more severe post-infection symptoms. Age also influenced symptom reporting, with adults aged 35–49 demonstrating a higher likelihood of experiencing Long COVID, which may reflect age-related immune responses or occupational exposure risks.
As hypothesized, vaccination was a critical variable, with vaccinated participants reporting lower severity scores across symptoms such as stress, sleep disturbances, and depressive symptoms. This finding highlights the importance of vaccination in mitigating the long-term effects of COVID-19, although the presence of breakthrough infections highlights the need for continued surveillance and tailored interventions.
Overall, this study contributes to the growing literature on COVID-19, identifying demographic disparities and emphasizing Long COVID’s complex, multifactorial nature. However, limitations, such as the overrepresentation of female and Asian-American participants and reliance on self-reported data, suggest caution in generalizing the findings to the broader population. Future research should utilize a larger, more diverse sample and explore the influence of SARS-CoV-2 variants and socioeconomic factors on symptom severity and duration. The findings of this study could inform public health strategies and clinical interventions to address the enduring impacts of COVID-19.
Author Contributions
Rohan Melwani: Methodology, Data Curation, Formal Analysis, Investigation, Writing—Original Draft, Writing—Review & Editing, and Visualization. Keerthana Noru: Methodology, Data Curation, Formal Analysis, Investigation, Writing—Original Draft, Writing—Review & Editing, and Visualization. Sanya Kondapalli: Methodology, Data Curation, Formal Analysis, Investigation, Writing—Original Draft, and Writing—Review & Editing. Ameya Ravi: Data Curation, Formal Analysis, Investigation, Writing—Original Draft, Writing—Review & Editing, and Visualization. Saanvi Shah: Formal Analysis, Investigation, Writing—Original Draft, Writing—Review & Editing, and Visualization. Shashank Sashtry: Methodology and Data Curation. Shreeya Setty: Investigation. Sahar Jahanikia: Conceptualization, Methodology, Data Curation, Formal Analysis, Investigation, Writing—Review & Editing, Funding Acquisition, Project Administration, Supervision
Funding
This research received no funding.
Acknowledgments
The authors would like to express their gratitude to the Aspiring Scholars Directed Research Program for providing the support that made this study possible. We also thank Sahar Jahanikia, our Principal Investigator, who provided guidance and technical assistance, as well as the Aspiring Scholars Directed Research Program and the Olive Children Foundation for financial support. Additionally, we are grateful to the participants who participated in this study and made this research possible.
Conflicts of Interest
The authors have no conflicts of interest to disclose.
References
- WHO COVID-19 dashboard. Available online: https://data.who.int/dashboards/covid19/cases?n=c (accessed on 16 June 2024).
- Clinical Overview of Long COVID. Available online: https://www.cdc.gov/covid/hcp/clinical-overview/index.html (accessed on 16 June 2024).
- Wang, L.; Berger, A.N.; Kaelber, C.D.; Davis, B.P.; Volkow, D.N.; Xu, R. ; COVID infection rates, clinical outcomes, and racial/ethnic and gender disparities before and after Omicron emerged in the US, medRxiv 2022, 6. [CrossRef]
- People with Certain Medical Conditions and COVID-19 Risk Factors. Available online: https://www.cdc.gov/covid/risk-factors/?CDC_AAref_Val=https://www.cdc.gov/coronavirus/2019-ncov/need-extra-precautions/people-with-medical-conditions.html (accessed on 16 June 2024).
- Dutta, S.S. Why Can Women Fight COVID-19 Better Than Men? Available online: https://www.news-medical.net/health/Why-Can-Women-Fight-COVID-19-Better-Than-Men.aspx#:~:text=A%20growing%20pool%20of%20evidence,higher%20in%20men%20than%20women (accessed on 16 June 2024).
- Estrada, L.V.; Levasseur, J.L.; Maxim, A.; Benavidez, G.A.; Pollack Porter, K.M. Structural Racism, Place, and COVID-19: A Narrative Review Describing How We Prepare for an Endemic COVID-19 Future. Health Equity 2022, 6, 356–366. [Google Scholar] [CrossRef] [PubMed]
- How many people have long COVID? Available online: https://usafacts.org/articles/how-many-people-have-long-covid/ (accessed on 16 June 2024).
- Adjaye-Gbewonyo, D.; Vahratian, A.; Perrine, CG.; Bertolli, J. Long COVID in adults: United States, 2022. CDC 2023, ID# 13 2417, 2. [Google Scholar] [CrossRef]
- Stroop Test. Available online: https://josieking.org/patientsafety/module_e/stroop_test.html (accessed on 16 June 2024).
- Coy, K.; Hoffman, N. Big Data Analytics under HIPAA. Available online: https://www.agg.com/news-insights/publications/big-data-analytics-under-hipaa-03-17-2016/ (accessed on 22 June 2024).
- Brief Suicide Safety Assesment. Available online: https://www.nimh.nih.gov/sites/default/files/documents/research/research-conducted-at-nimh/asq-toolkit-materials/adult-outpatient/bssa_outpatient_adult_asq_nimh_toolkit.pdf (accessed on 14 August 2022).
- Ergin, G.; Yildirim, Y. A validity and reliability study of the Turkish Checklist Individual Strength (CIS) questionnaire in musculoskeletal physical therapy patients. Physiotherapy Theory and Practice 2012, 28, 624–632. [Google Scholar] [CrossRef] [PubMed]
- Bennett, R.M. , Friend, R., Jones, K.D.; Ward, R.; Han, B.K., Ross, R.L.; et al. The Revised Fibromyalgia Impact Questionnaire (FIQR): validation and psychometric properties. Arthritis Res Ther 2009, 11. [CrossRef]
- Besnier, F.; Bérubé, B.; Malo, J.; Gagnon, C.; Grégoire, C.-A.; Juneau, M.; Simard, F.; L’Allier, P.; Nigam, A.; Iglésies-Grau, J.; et al. Cardiopulmonary Rehabilitation in Long-COVID-19 Patients with Persistent Breathlessness and Fatigue: The COVID-Rehab Study. Int. J. Environ. Res. Public Health 2022, 19. [Google Scholar] [CrossRef] [PubMed]
- Health Insurance Portability and Accountability Act of 1996 (HIPAA). Available online: https://www.cdc.gov/phlp/php/resources/health-insurance-portability-and-accountability-act-of-1996-hipaa.html?CDC_AAref_Val=https://www.cdc.gov/phlp/publications/topic/hipaa.html (accessed on 24 August 2022).
- Individuals’ Right under HIPAA to Access their Health Information 45 CFR § 164.524. Available online: https://www.hhs.gov/hipaa/for-professionals/privacy/guidance/access/index.html (accessed on 24 August 2022).
- El Sayed, S.; Shokry, D.; Gomaa, S.M. Post-COVID-19 fatigue and anhedonia: A cross-sectional study and their correlation to post-recovery period. Neuropsychopharmacol Rep 202, 41, 50-55. [CrossRef]
- Graham, E.L.; Clark, J.R.; Orban, Z.S.; Lim, P.H.; Szymanski, A.L.; Taylor, C.; DiBiase, R.M.; Jia, D.T.; Balabanov, R.; Ho, S.U.; et al. Persistent neurologic symptoms and cognitive dysfunction in non-hospitalized Covid-19 “long haulers”. Ann Clin Transl Neurol 2021, 8, 1073–1085. [Google Scholar] [CrossRef] [PubMed]
- COLLECTION, USE, AND DISCLOSURE LIMITATION. Available online: https://www.hhs.gov/sites/default/files/ocr/privacy/hipaa/understanding/special/healthit/collectionusedisclosure.pdf (accessed on 24 August 2022).
- Adler, S. HIPAA Data Security Requirements. Available online: https://www.hipaajournal.com/hipaa-data-security-requirements/ (accessed on August 24, 2022).
- Kuut, T.A.; Müller, F.; Aldenkamp, A.; Assmann-Schuilwerve, E.; Braamse, A.; Geerlings, S.E.; Gibney, K.B.; Kanaan, R.A.A.; Nieuwkerk, P.; Olde Hartman, T.C.; et al. A randomised controlled trial testing the efficacy of Fit after COVID, a cognitive behavioural therapy targeting severe post-infectious fatigue following COVID-19 (ReCOVer): study protocol. Trials 2021, 22. [Google Scholar] [CrossRef] [PubMed]
- Mackay, A. A Paradigm for Post-Covid-19 Fatigue Syndrome Analogous to ME/CFS. Front Neurol 2021, 12. [Google Scholar] [CrossRef] [PubMed]
- Hafiz, R. , Gandhi, T. K., Mishra, S., Prasad, A., Mahajan, V., Di, X.,... & Biswal, B. B. Higher Limbic and Basal Ganglia volumes in surviving COVID-negative patients and the relations to fatigue. medRxiv [Preprint]. 2022 Mar 1:2021.11.23.21266761. Originally published 2021 Nov 24. [Version 2]. [CrossRef]
- Mayo Clinic Staff. Fibromyalgia. Available online: https://www.mayoclinic.org/diseases-conditions/fibromyalgia/diagnosis-treatment/drc-20354785 (accessed on 24 August 2022).
- Nass, S. J.; Levit, L. A., & Gostin, L. O. (2009). Beyond the HIPAA privacy rule - NCBI bookshelf. Available online: https://www.ncbi.nlm.nih.gov/books/NBK9578/ (accessed on 27 August 2022).
- Guidance Regarding Methods for De-identification of Protected Health Information in Accordance with the Health Insurance Portability and Accountability Act (HIPAA) Privacy Rule. Available online: https://www.hhs.gov/hipaa/for-professionals/privacy/special-topics/de-identification/index.html#rationale (accessed on August 27, 2022).
- Research. Available online: https://www.hhs.gov/hipaa/for-professionals/special-topics/research/index.html (accessed on 29 August 2022).
- Summary of the HIPAA security rule. Available online: https://www.hhs.gov/hipaa/for-professionals/security/laws-regulations/index.html (accessed on 30 August 2022).
- Ortelli, P. , Ferrazzoli, D., Sebastianelli, L., Engl, M., Romanello, R., Nardone, R.,... & Versace, V. Neuropsychological and neurophysiological correlates of fatigue in post-acute patients with neurological manifestations of COVID-19: Insights into a challenging symptom. J Neurol Sci. 2021 Jan 15:420:117271. [CrossRef]
- SCL1201 - section 3: Suicide assessment: Questions to include. Available online: https://www.yourceus.com/pages/scl1201-section-three-suicide-assessment-questions-to-include (accessed on 30 August 2022).
- Sfera, A. , Osorio, C., Zapata Martin del Campo, C. M., Pereida, S., Maurer, S., Maldonado, J. C., & Kozlakidis, Z. Endothelial senescence and chronic fatigue syndrome, a COVID-19 based hypothesis. Front Cell Neurosci. 2021 Jun 25:15:673217. [CrossRef]
- Square program (suicide, questions, answers and resources). Available online: https://www.square.org.au/wp-content/uploads/sites/10/2013/05/Questions-to-Assess-Suicide-Risk_May2013_Handout1.pdf (accessed on 30 August 2022).
- Summary of the HIPAA privacy rule. Available online: https://www.hhs.gov/hipaa/for-professionals/privacy/laws-regulations/index.html (accessed on 30 August 2022).
- Vallat-azouvi, C.; Azouvi, P. The Working Memory Questionnaire: A scale to assess everyday life problems related to deficits of working memory in brain injured patients. Available online: https://www.academia.edu/17625012/The_Working_Memory_Questionnaire_A_scale_to_assess_everyday_life_problems_related_to_deficits_of_working_memory_in_brain_injured_patients (accessed on 30 August 2022).
- Robert, L.S.; Williams, B.W.J.; Kroenke, K. Patient Health Questionnaire-9 (PHQ-9). Available online: https://www.phqscreeners.com/images/sites/g/files/g10060481/f/201412/PHQ-9_English.pdf (accessed on 1 September 2022).
- Brain Fog: Solutions to Help You Improve Concentration. Available online: https://www.bangkokhospital.com/en/content/brain-fog-syndrome (accessed on 1 September 2022).
- Long Covid or Post-Covid Conditions. Available online: www.cdc.gov/coronavirus/2019-ncov/long-term-effects/index.html#:~:text=People%20with%20post%2DCOVID%20conditions%20(or%20long%20COVID)%20may,away%20or%20come%20back%20again (accessed on day month year).
- Aiyegbusi, O.L.; Hughes, S.E.; Turner, G.; Rivera, S.C.; McMullan, C.; Chandan, J.S.; Haroon, S.; Price, G.; Davies, E.H.; Nirantharakumar, K.; et al. ; Symptoms, complications and management of long COVID: a review. J R Soc Med. 2021, 14, 428–442. [Google Scholar] [CrossRef] [PubMed]
- Takao, M.; Ohira, M. ; Neurological post-acute sequelae of SARS-CoV-2 infection. Psychiatry Clin Neurosci. 2023, 77, 72–83. [Google Scholar] [CrossRef] [PubMed]
- Shining a Light on Long COVID Brain Fog. Available online: https://covid19.nih.gov/news-and-stories/shining-light-long-covid-brain-fog#:~:text=%E2%80%9CBrain%20fog%E2%80%9D%20is%20a%20 range,also%20known%20as%20Long%20COVID. (accessed on 27 August 2024).
- H. Wickham; ggplot2: Elegant Graphics for Data Analysis; Springer-Verlag New York, 2016.
- Katella, K. Omicron, Delta, Alpha, and More: What To Know About the Coronavirus Variants, Available online:. Available online: https://www.yalemedicine.org/news/covid-19-variants-of-concern-omicron#:~:text=Omicron%20was%20first%20identified%20in,skyrocket%20to%20over%20a%20million. (accessed on 13 September 2024).
- Bai, F.; Tomasoni, D.; Falcinella, C.; Barbanotti, D.; Castoldi, R.; Mulè, G.; Augello, M.; Mondatore, D.; Allegrini, M.; Cona, A.; et al. ; Female gender is associated with long COVID syndrome: a prospective cohort study. Clin Microbiol Infect. 2022; 28, 611. [CrossRef]
- Aiyegbusi, O.L.; Hughes, S.E.; Turner, G.; Rivera, S.C.; McMullan, C.; Chandan, J.S.; Haroon, S.; Price, G.; Davies, E.H.; Nirantharakumar, K.; et al. ; J R Soc Med. Symptoms, complications and management of long COVID: a review. 2021, 114, 428–442. [Google Scholar] [CrossRef]
- Jensen, A. , Stromme, M., Moyassari, S., Chadha, A. S., Tartaglia, M. C., Szoeke, C., & Ferretti, M. T. (2022). COVID-19 vaccines: Considering sex differences in efficacy and safety. Contemporary Clinical Trials, 115. [CrossRef]
- Skaik, Y. The bread and butter of statistical analysis “t-test”: Uses and misuses. Pak J Med Sci. 2015 Nov-Dec;31,1558–1559. [CrossRef]
- Tae Kyun Kim, K.T. Understanding one-way ANOVA using conceptual figures. JKorean J Anesthesiol. 2017 Jan 26;70,22–26. [CrossRef]
Disclaimer/Publisher’s Note: The statements, opinions and data contained in all publications are solely those of the individual author(s) and contributor(s) and not of MDPI and/or the editor(s). MDPI and/or the editor(s) disclaim responsibility for any injury to people or property resulting from any ideas, methods, instructions or products referred to in the content. |
© 2024 by the authors. Licensee MDPI, Basel, Switzerland. This article is an open access article distributed under the terms and conditions of the Creative Commons Attribution (CC BY) license (http://creativecommons.org/licenses/by/4.0/).
Copyright: This open access article is published under a Creative Commons CC BY 4.0 license, which permit the free download, distribution, and reuse, provided that the author and preprint are cited in any reuse.


