
Submitted:
24 October 2024
Posted:
24 October 2024
You are already at the latest version
Abstract
Background: Chronic low-grade inflammation in obesity is linked to white adipose tissue (WAT) dysfunction. Plasma lipopolysaccharide (LPS) activates Toll-like receptor 4 (TLR4), triggering NF-κB and worsening these disturbances. Previously, we showed that H3K27 epigenetic modifications affect WAT gene expression in high-fat diet mice, identifying key pathways in adipose-derived stem cells (ASCs). This study explores whether NF-κB influences H3K27 modifiers in human ASCs and evaluates fish oil (FO) as a modulator. Methods: Human visceral WAT ASCs were stimulated with LPS and treated with FO enriched with eicosapentaenoic acid (EPA). Flow cytometry, PCR array, RT-PCR, and Western blot assays were used. Results: LPS increased NF-κB activity, elevating KDM6B demethylase levels and H3K27 acetylation. These epigenetic modifications in LPS-stimulated ASCs were associated with persistent changes in the expression of genes involved in adipogenesis, metabolic regulation, and inflammation, even after LPS removal and cell differentiation. FO mitigated these effects, reducing H3K27 acetylation and promoting methylation. Conclusions: FO demonstrates potential in modulating inflammation-induced epigenetic changes and preserving adipocyte function.
Keywords:
adipose tissue
; mesenchymal stem/stromal cells
; lipopolysaccharide
; inflammation
; H3K27ac
; H3K27me3
; KDM6B
; n-3 PUFA
1. Introduction
White adipose tissue (WAT) displays high plasticity in response to the individual's diverse metabolic demands. While mature adipocytes primarily drive this plasticity, adipose-derived mesenchymal stem cells (ASCs), found within the vascular stromal fraction of WAT, facilitate WAT expansion by differentiating into new adipocytes. This process is fundamental to allow healthy adjustment of lipid reserves, thereby minimizing any disruptions to WAT homeostasis [1,2].
During adipogenesis, epigenetic alterations involving histone 3 lysine 27 (H3K27) are critical for silencing genes responsible for the commitment of ASCs to other cellular fates, such as chondrogenesis and osteogenesis, as well as for the activation of transcription factors critical for adipogenesis [3,4,5]. Enhancer of Zeste Homolog 2 (Ezh2) is responsible for trimethylation of H3K27 (H3K27me3), resulting in gene silencing, though its effects on gene expression can vary depending on the context [4,6,7]. These effects can be reversed by a couple of histone lysine demethylases, KDM6A/UTX and KDM6B/JMJD3, which were found to inhibit adipogenesis and promote osteogenic differentiation of human mesenchymal stem cells (hMSCs) [8,9]. On the other hand, histone acetylation, such as H3K27ac, leads to transcriptional activation and is promoted by acetyltransferases CREBBP and EP300 (CBP/p300). CBP/p300 in the PPARγ complex is the main enzyme that activates gene transcription. It can also increase the expression of CEBPα and PPARγ to promote adipogenesis, as recently reviewed [10].
ChIP-seq assays have shown that the entire NF-kB transcription factor family binds to the EZH2 promoter in human lymphoblastoid cell lines and in cancer [11,12,13,14]. Encyclopedia of DNA Elements (ENCODE) project revealed multiple NF-kB (RelA) binding sites not only in the EZH2 promoter region, but also in the promoters of other H3K27 modifiers like Crebbp, Ep300, Kdm6a, and Kdm6b. In ASCs, the transcriptional regulation of histone H3 modifiers by NF-κB is still largely unknown. In obese individuals, elevated levels of circulating lipopolysaccharide (LPS) significantly activate NF-κB in WAT [15,16]. We hypothesize that in a low-grade inflammatory environment, typical of obesity, NF-κB modulates the expression of histone modifiers in these progenitor cells.
Consistent with this hypothesis, we recently demonstrated a strong correlation between H3K27 epigenetic modifications and high-fat diet (HFD)-induced obesity in both ASCs [17] and WAT [18] from mice. However, in the context of chronic inflammatory conditions associated with obesity, the specific impact of H3K27 marks on WAT, particularly on ASCs, as well as the role of NF-κB in this process in humans, remains poorly understood.
Extensive research has underscored the remarkable benefits of long-chain polyunsaturated fatty acids n-3 (n-3 PUFA), notably eicosapentaenoic acid (EPA) and docosahexaenoic acid (DHA), abundant in fish oil (FO), in mitigating obesity-related chronic inflammatory conditions [19,20,21,22,23]. Building upon our prior investigations, which illuminated the efficacy of EPA-rich FO supplementation at a 5:1 EPA:DHA ratio, we demonstrated in HFD-induced obesity mice administered with this formulation, marked reductions in body weight and adipose mass, alongside improved adipocyte function and marked improvements in obesity-related metabolic and endocrine dysfunctions [24,25,26,27]. Furthermore, our recent study showed that FO significantly attenuated the HFD-induced alterations in the WAT gene expression profile and exhibited potential in mitigating the epigenetic changes triggered by inflammation associated with obesity in mice [18].
In this study, we used an in vitro approach and visceral human WAT samples to investigate how activation of the NF-κB pathway influences the deposition of epigenetic marks on H3K27 in ASCs, and whether this process is modulated by FO.
2. Materials and Methods
2.1. Human subjects
The entire protocol and use of samples were approved by the Research Ethics Committee of Unifesp (CEP/UNIFESP Project No.: 0268/2022). Visceral WAT (abdominal region) were collected from patients undergoing gastric surgery at the Municipal Hospital of Paulínia-SP, after having signed the Informed Consent Form (ICF). Male patients were between 30 and 50 years old and overweight (BMI >25<30).
The visceral WAT samples were processed in the Adipose Tissue Physiology and Epigenetics Laboratory of UNIFESP, following the protocol described [28]. After dissection and fragmentation of the WAT, the samples were placed in digestion buffer (Dulbecco’s modified Eagle’s medium – D’MEM/HEPES 20 mM/BSA 4%, collagenase II [Sigma Chemical, St. Louis, MO, United States] - 1.0mg/ml, pH 7.40), for tissue digestion by collagenase and cell isolation [29], whose incubation took place for approximately 45 - 60 minutes at 37oC in a water bath with orbital shaking (130 rpm). The samples were then filtered through a fine-mesh plastic sieve (which retains tissue debris and undigested vessels) and the volume was completed to 25 ml of EHB buffer (EARLE/HEPES salts 25 mM, BSA 1%, sodium pyruvate 1 mM, without glucose, pH 7.45, 37ºC) in a 50 mL Falcon. The filtrate was centrifuged (400G, 1 min) and then divided into two fractions: 1. the upper layer or supernatant, which contains the isolated mature adipocytes; 2. the stromal cell fraction (SVF) or remnant of the filtrate, which was subjected to a new centrifugation (1500G for 10 min). This fraction contained in the pellet (lower layer) after centrifugation. The material is then resuspended and washed twice with 25 ml of EHB buffer, following the same centrifugation steps for adipocytes and SVF (which contains ASCs), respectively.
2.2. Isolation and Cell Culture
We followed the previously described protocol with adaptations [30]. The cell pellet (SVF) obtained after digestion of the visceral WAT sample was resuspended in the culture medium [D'MEM Han's F-12, supplemented with 10% fetal bovine serum (FBS) and 10ml/l penicillin/streptomycin (Gibco BRL, NY, USA)] and seeded in culture plates, which were kept in a 5% CO2 incubator at 37 ºC (culture medium was renewed every two days) until reaching 70-80% confluence. After this period, the medium was removed and the plate washed with PBS. The final step for the isolation of ASCs is the selection of the adherent SVF population. The cells were trypsinized for the first time (passage 1 - P1), resuspended in the same culture medium, redistributed into larger culture plates for cell expansion, and maintained until they reached 70-80% confluence again. The cell concentration was estimated in a Neubauer chamber and the cells were replated (P2), always maintaining the limit of 80% confluence for passages. Between P2 and P5, they will be plated for the experiments (1x10⁵ cells/well in 6-well plates (35mm).
When they reached 85-90% confluence (during proliferation) or after differentiation as indicated in the text, the cells were treated (or not) with LPS and/or FO and/or JSH, for 72h.
2.3. Cell treatments
The FO used in this study is rich in EPA (EPA/DHA ratio 540/100 mg/g, or 5:1, HiOmega-3, Naturalis, São Paulo, Brazil). FO was added to the cultures for 72 hours, as indicated in the text, at a concentration of 50 μM, dissolved in ethanol (vehicle) not exceeding 0.05% in the controls. The cells were stimulated with 1µg/ml of LPS (E. coli 05:88; Sigma) diluted in culture medium. NF-κB inhibitor JSH-23 [4-Methyl-N1-(3-phenylpropyl) benzene-1,2-diamine, SigmaAldrich, St Louis, MO, USA], a cell-permeable diamine compound that selectively blocks the nuclear translocation of the p65/p50 NF-κB dimer and its transcriptional activity, without affecting the degradation of IκB-α was added to the cultures. The dose used was based on previous studies [31].
2.4. Adipogenic differentiation
For differentiation, cells were cultured until reaching 100% confluence. At 100% confluence (day D0), cells were stimulated to differentiate by treatment with an adipogenic cocktail composed of: D'MEM/Han's F12 plus 0.5mM IBMX (3-isobutyl-1-methylxanthine), 0.1μM dexamethasone, 0.5μM human insulin, 2nM T3, 30μM indomethacin, 17μM pantothenate, 33μM biotin, 1μM Rosiglitazone, 1mg/ml Apo-transferrin, 2% FBS and antibiotics 1% penicillin-streptomycin for 4 days (D4) in the absence of FO or LPS or JSH23. The cells were subjected to extraction of total RNA and proteins for analysis of the expression of markers of histone modifying enzymes and the NF-κB pathway.
2.5. Immunophenotyping
Human ASC markers have been well characterized. We used the following markers: positive staining for CD73 and CD90 and negative staining for CD45 and CD31 [28]. We used BD Bioscience antibodies already labeled with fluorophore. For characterization by immunophenotyping of ASCs, we incubated a concentration of 1x10⁶ cells resuspended in 100μl, with the respective antibodies for 30 minutes protected from light. The cells were fixed and resuspended in 500ul of PBS with 3% BSA. The cells were evaluated in FACS Canto II equipment with acquisition of at least 1x10⁴ events.
2.6. RNA Extraction and Real Time PCR
Total RNA was extracted was with Trizol reagent (TRIzol, Invitrogen), according to the instructions by the provider. The quantity and quality of the RNAs produced were verified by spectrophotometry (260 nm) in a nanodrop (Thermo Scientific). cDNA was synthesized from the treated RNA.
Gene expression was evaluated by Real Time PCR and the analysis of the results obtained was carried out using the 2^(-∆∆Ct) method [32]. Data are expressed as the ratio between the expression of the target gene and housekeeping gene (GAPDH). Primers used: CREBBP (CBP) (5’- 3’sense: GAAACCAACAAACCATCCTGG; 5’-3’antisense: CATTGGATTATTTCCCAGGG); EP300 (5’-3’sense: TGCAGGCATGGTTCCAGTTT; 5’3’antisense: AGGTAGAGGGCCATTAGA AGTCA); EZH2 (5’- 3’sense: GCTGGAATCAAAGGA TACAGACA; 5’-3’antisense: GACACCGAGAATTTGCTTCAG); GAPDH (5’-3’sense: GTCTCCTCTGACTTCAACAGCG; 5’-3’antisense: ACCACCCTGTTGCTGTAGCCAA); KDM6A (5’- 3’sense: GAGGGAAGCTCTCATTGCTG; 5’-3’antisense: AGATGAGGCGGATGGTAATG); KDM6B (5’-3’sense: CTCAACTTGGGCCTCTTCTC; 5’-3’antisense: GCCTGTCAGATCCCAGTTCT).
2.7. PCR Array Gene Expression Analysis
For PCR Array Gene Expression Analysis, RNA was isolated using an RNA extraction kit following the manufacturer’s instructions, and the assay was conducted as previously described [18]. Briefly, cDNA and RT2 SYBR® Green qPCR Mastermix (Cat. No. 330529) were utilized on a Custom HUMAN RT2Profiler PCR Array-CLAH47257; Qiagen, Hilden, Germany) consisting of 90 genes. This array allowed us to assess the expression pattern of genes encoding pro/anti-adipogenic, pro/anti-lipogenic and lipolytic, pro/anti-browning, adipokines, receptors, and components of adipocyte transduction pathways (see Table 1). CT values were exported and uploaded to the manufacturer's data analysis web portal a http://www.qiagen.com/geneglobe. Samples were categorized into control and test groups, and CT values were normalized based on a manual selection of reference genes. Fold Change was calculated using the 2^(-∆∆Ct) method via the data analysis web portal (and exported at GeneGlobe®, Qiagen).
2.8. Western Blot
Proteins were extracted according to a previously described protocol [33]. Briefly, a volume corresponding to 20-30ug of the protein extract in question was applied for Western Blot and quantified by the Bradford method. The samples were heated (100°C for 5min) separately, applied to 10% and 12% polyacrylamide gels and transferred to nitrocellulose membranes. The transfer efficiency was determined using Ponceau solution. The membranes were then blocked with TBS-T and 5% BSA for 1h and then incubated with the respective primary antibodies (anti-H3K27ac #ab4729, H3K27me3 #sab5700166, anti-ACL #ab40793, anti-KDM6B #ab169197, anti- p-Nfkb p105/50 #ab28849, Abcam, Waltham, MA, USA) diluted in TBS-T and 2.5% BSA overnight at 4°C. The membrane was washed with TBS-T and the respective secondary antibody was added at a concentration of 1:5000 (Millipore) for 1h in TBS-T + 2.5% BSA. The membrane was washed with TBS-T and the developing solution was added, with immediate exposure to the imaging system to capture the images. The ImageJ software was used to quantify the bands.
2.9. Statistical analysis
The data were analyzed using one-way Analysis of Variance (ANOVA), followed by Tukey's post-test for comparisons between-groups or Student's t-test. The results are expressed as mean ± standard error of the mean (SEM). Differences were considered significant for p<0.05. Statistical analysis was performed using GraphPad Prism software version 9.1.2 (GraphPad Software Inc., San Diego, CA, USA).
3. Results
3.1. Immunophenotyping of ASCs by Flow Cytometry
We performed immunophenotyping of ASCs using flow cytometry, following culture in plates that isolate mesenchymal cells from the visceral WAT stromal fraction. This procedure was crucial to confirm the selection of mesenchymal cells used in the present study. We utilized a panel of specific markers including CD73-FITC, CD90-APC, CD45-PERCP/CY5, and CD31-PE. CD45 was used to identify hematopoietic lineage, while CD31 identified endothelial cells. The CD90+CD73+ phenotype was used to identify the mesenchymal cell population. It is important to note that phenotypic markers may vary during cell culture, due to preferential growth of subpopulations or external factors such as the culture medium used, which can induce changes in marker expression [34,35,36]. Therefore, we performed immunophenotyping between passages P2 and P4, which were the passages used in our studies. The analysis showed satisfactory homogeneity in mesenchymal markers (positivity for CD90 and CD73, and negativity for CD31 and CD45), even after four passages of cell culture (see Table 2).
The cells were studied between passages P2-P4. The data represent the mean ± SEM of 3 independent experiments
3.2. Expression of NF-kB by ASCs exposed to LPS and/or FO for 72 hours
We first validated the effect of LPS in activating the NF-kB pathway in human ASCs, as has been well described in both macrophages and adipocytes [37,38]. 90% confluence ASCs were treated with LPS, with or without FO, for 72 hours. After this period, the secretion medium was collected and proteins were extracted for Western blot analysis.
As a result, we observed an increase in the phosphorylation of NF-kBp50, as well as elevated levels of total NF-kBp105 and NF-kBp50 upon LPS stimulation. Interestingly, these effects were prevented by the presence of FO (Figure 1).
3.3. Expression of histone modifiers by ASCs exposed to LPS and/or FO for 72 hours
We next evaluated the expression of histone modifiers as potential targets responding to the activation or attenuation of NF-kB pathway.
The gene expression of genes encoding the acetylases CREBBP and EP300 and the methylase EZH2 did not exhibited statistical difference between the groups (Figures 2A, B and D, respectively). The mRNA content for demethylase KDM6B was significantly increased in ASCs treated with LPS and completed inhibited by FO (Figure 2C).
We then investigated the expression of the ATP citrate lyase (ACL) enzyme in ASCs exposed to LPS and/or FO for 72 hours. There was a significant and pronounced increase in ACL expression (50%) in response to LPS stimulation, an effect completely prevented in the presence of FO (Figure 2E). ACL, which catalyzes the conversion of citrate and coenzyme A (CoA) into oxaloacetate and acetyl-CoA, is present in both the cytoplasm and nucleus of various mammalian cells, and it is the primary enzyme responsible for producing acetyl-CoA. It serves not only as a substrate for de novo lipogenesis but also for histone H3 acetylation (via acetylases) in the nucleus of mammalian cells. In the absence of ACL, a significant reduction in histone acetylation occurs, along with impaired differentiation of cells into adipocytes, reduced expression of Glut4, and lower levels of other glycolytic enzymes. This suggests a correlation between the cell's energy metabolism and the dynamic regulation of histone acetylation, dependent on the nuclear concentration of acetyl-CoA produced by ACL.
3.4. Expression of genes encoding histone modifiers by ASCs exposed to LPS and/or NF-κB inhibitor JSH-23
To confirm that the NF-κB transcription factor alters the expression of H3K27 modifiers and, consequently, the deposition of epigenetic marks on this histone, we conducted experiments in the presence of the NF-κB inhibitor JSH-23, a cell-permeable diamine compound that selectively blocks the nuclear translocation of the p65/p50 NF-κB dimer to the nucleus and its transcriptional activity without affecting IκB-α degradation. The dosage was based on previous studies [31].
As shown in Figure 2, LPS exposure led to an increase in H3K27 acetyl marks, which was associated with altered expression of H3K27 modifiers. However, the expression of these H3K27 modifiers was significantly modulated in ASCs treated with LPS + JSH-23 compared to cells treated with LPS alone (Figure 3). JSH-23 significantly reduced LPS-induced KDM6B mRNA levels (Figure 3C) by inhibiting NF-κB transcriptional activity. Curiously, NF-κB inhibition resulted in increased expression of EZH2 on LPS-treated cells (Figure 3D).
3.5. Gene expression by PCR array
Our next question was whether the effects of the pro-inflammatory agent LPS could be propagated through epigenetic changes in the deposition of the H3K27 mark in ASCs (adipose-derived stem cells) leading to differentiated adipocytes. To investigate this, ASCs were pre-exposed to LPS for 72 hours, then differentiated and analyzed on day 4 post-differentiation. During this period, from day 0 (induction of differentiation) to day 4, the cells were cultured in the absence of LPS.
We examined the gene expression profile in these adipocytes. A custom panel containing of 90 genes of interest for human adipocytes was designed on a PCR array plate. The differentially expressed genes (both positively and negatively regulated) in response to LPS stimulation are shown in Table 3.
According to the table, the majority of genes were affected (59 genes), exhibiting a fold change greater than 2, although the p-value exceeded 0.5 due to a low number of biological replicates. Nonetheless, all these genes whose expression was influenced by prior exposure to LPS play a significant role in the metabolism and secretory function of developing adipocytes. While validation of the expression of specific genes is crucial following this screening, our results indicate that pre-exposing ASCs to LPS was sufficient to induce increased expression of genes encoding pro/anti-adipogenic factors, cytokines, receptors, and components of pro-inflammatory pathways in the newly differentiated adipocytes.
Furthermore, there was a reduction in the expression of LEP and FABP4, key adipocyte markers after differentiation induction, suggesting a delay in the process compared to the control group. There was also a decrease in the expression of pro-browning genes (SIRT3, SRC, TBX1, TFAM) and of PPARGC1B, which encodes PGC-1β, a protein that plays a crucial role in metabolic regulation and mitochondrial biogenesis. Additionally, we observed a decline in the expression of components of the insulin signaling pathway (IRS1, IRS2, AKT2).
These results suggest that chronic exposure of ASCs to LPS prior to differentiation induction may result in an epigenetic memory in these cells, leading to significant changes in the transcription of genes that will only be expressed in adipocytes.
3.6. Expression of histone modifiers by adipocytes differentiated from LPS-pre-exposed ASCs (in the presence or absence of FO) prior to differentiation
To further investigate whether the alterations in the expression of several key adipocyte genes is associated with persistent changes in epigenetic marks on H3K27, we examined the expression of the histone modifiers and the acetylation and methylation marks in newly differentiated ASCs.
Our results demonstrated that the effects of LPS on the expression of genes encoding H3K27 modifiers also persisted after the differentiation, including both the demethylases KDM6A and KDM6B, as well as the acetylase CREBBP (Figure 4A-C). In agreement with this scenario (increased acetylase and decreased demethylases), we detected an increased deposition of acetylation marks in the newly differentiated ASCs, as evidenced by an upregulation of ACL and H3K27ac (Figures 4D-E, respectively).
Finaly, we explored whether FO could attenuate the changes induced by pre-exposing ASCs to LPS prior to differentiation. FO was combined with LPS during the pre-stimulation of ASCs, following the same experimental protocol. Specifically, ASCs were pre-exposed to LPS in the presence or absence of FO for 72 hours, followed by differentiation. Cells were analyzed on day 4 post-differentiation, at which point the treatments were no longer present in the culture. At this stage, we assessed only the lasting effects, focusing on the deposition of epigenetic marks on H3K27. We observed that in the presence of FO, the effects of LPS were attenuated not only in the expression of both ACL and H3K27ac (Figure 4D-E, respectively), but also in demethylase enzyme expression KDM6B (Figure 4F). Thus, FO reduced the LPS-induced acetylation, even after its removal, promoting an increase in H3K27 methylation, that is, increased H3K27me3 (Figure 4G), likely by attenuating the action of the KDM6B demethylase. Therefore, we found that FO's protective capacity against the effects of LPS persisted under these conditions, protecting adipocyte progenitor cells from the adverse impacts of this pro-inflammatory agent, commonly linked to obesity-related complications.
4. Discussion
The main objective of this study was to investigate whether NF-κB transcription factors alter the deposition of methylation and acetylation marks on histone H3K27 in human ASCs and whether FO mitigates these effects. Our results showed that LPS-induced activation of the NF-κB pathway leads to significant changes in epigenetic marks, including increased H3K27 acetylation, which were effectively attenuated by FO. These findings support the hypothesis that EPA-rich FO acts as an anti-inflammatory agent capable of modulating epigenetic mechanisms involved in inflammation-related dysfunction in WAT.
Several aspects of our findings are consistent with previous studies that have established the role of chronic low-grade inflammation in driving WAT dysfunction, particularly in the context of obesity. Increased plasma LPS, a component of the bacterial cell wall, has been shown to mediate obesity-induced metabolic dysregulation by binding to the Toll-like receptor 4 (TLR4). This triggers a cascade of inflammatory responses that significantly affect WAT, promoting insulin resistance, lipid dysregulation, and adipocyte dysfunction. Our study extends these findings by showing that these inflammatory processes also affect the epigenetic of ASCs, specifically through changes in H3K27 acetylation and methylation.
We have also hypothesized that ASCs challenged with LPS would differentiate into adipocytes with a different transcriptome than the adipocytes derived from unchallenged ASCs. Therefore, we have pre-exposed ASCs to LPS, followed by induction of differentiation into adipocytes, and analyzed the expression of several key adipocyte genes. We also examined the expression of H3K27 histone modifiers and the acetylation and methylation marks in newly differentiated ASCs. Our results showed that the effects of LPS on the expression of genes encoding H3K27 modifiers also persisted after adipogenesis, including the increased expression of KDM6B and H3K27ac.
Therefore, LPS would establish an epigenetic memory in ASCs during the inflammatory process. This memory is evidenced by altered expression of key adipogenic and metabolic genes, including reductions in LEP and FABP4—markers of mature adipocytes—and PPARGC1B, a regulator of mitochondrial biogenesis and metabolic homeostasis. These changes suggest that chronic inflammation in ASCs affects not only their immediate response to inflammatory stimuli but also affects their long-term differentiation capacity and functionality.
In addition, the upregulation of histone modifiers such as KDM6B, CREBBP, and EZH2 in response to LPS exposure highlights the complex interplay between inflammation and epigenetic regulation. These enzymes are critical in the dynamic addition and removal of epigenetic marks that control gene expression. In the absence of FO, LPS treatment increased H3K27 acetylation (H3K27ac) and consequently decreased H3K27me3 (triggered by the increased activity of the demethylase KDM6B), which is associated with the transcriptional activation and repression, respectively, of key genes involved in adipocyte metabolism and differentiation [3,34,35].
In this context, changes of histone modification marks mediated by H3K27 modifiers [39] plays a critical role at key stages during differentiation. These modifications are essential for establishment of the adipocyte-selective gene program driven by PPARγ and C/EBPs [40].
The protective effect of FO on LPS-induced epigenetic changes in ASCs highlights its potential role in combating obesity-associated inflammation. This anti-inflammatory property of FO has been demonstrated in various tissues, and our study adds valuable insights into its mechanism of action at the epigenetic level. In particular, the ability of FO to both reduce H3K27ac and restore H3K27me3 in pre-differentiated ASCs suggests that it can reestablish epigenetic balance, which may have far-reaching consequences for adipocyte metabolic health and overall tissue function.
Taken together, our results suggest that these epigenetic modifications in LPS-stimulated ASCs are associated with persistent changes in the expression of genes involved in adipogenesis, metabolic regulation, and inflammation, even after differentiation. Remarkably, FO treatment effectively counteracted these LPS-induced changes. These findings highlight the therapeutic potential of FO in reducing inflammation-related epigenetic changes in ASCs and supporting proper adipocyte function.
An important avenue for future research is to explore whether other dietary or pharmacological interventions can similarly modulate the epigenetic profile of ASCs. This may provide new therapeutic strategies to prevent or reverse WAT dysfunction in obesity, metabolic syndrome, and type 2 diabetes. In addition, the exact molecular mechanisms by which FO exerts its protective effects remain to be fully elucidated.
Furthermore, our findings regarding the epigenetic memory established in ASCs following LPS exposure raise critical questions about the long-term effects of inflammation on adipose progenitor cells. Future research should investigate whether this memory can be completely reversed or whether it leads to permanent dysfunction in adipocytes, which may contribute to the chronic nature of obesity-related metabolic diseases. Understanding the reversibility of these epigenetic marks will be critical for developing targeted interventions to restore healthy adipocyte function.
Our study provides compelling evidence that LPS-induced activation of the NF-κB pathway alters the epigenetic landscape of human ASCs, specifically by modifying the H3K27 acetylation mark. This alteration led to permanent changes in the expression of pivotal genes for TAB function, even after differentiation. FO effectively mitigates these changes, highlighting its potential as a therapeutic agent in the context of obesity-related inflammation. By modulating epigenetic regulators, FO may provide a novel approach to improving adipose tissue function and preventing metabolic dysfunction in individuals with chronic inflammation. These findings contribute to future investigations into the role of epigenetic modifications in WAT biology and the development of novel therapeutic strategies for obesity and related disorders.
5. Conclusions
This study provides a significant contribution to understanding the effects of inflammation and FO on the expression of histone modifiers and the epigenetic signatures of transcription factors in human ASCs. These findings offer valuable insights for future research, which may further explore the mechanisms involved and have relevant implications for the development of new therapeutic approaches.
Author Contributions
Conceptualization, methodology, formal analysis and investigation, JJS, AFSB, VTGP, JFB, RJS, ABMA, JCCA, AVS and MICAV; writing—original draft preparation, JJS and AFSB; writing—review and editing, LMAC and MICAV.; visualization, JJS, AFSB, VTGP and MICAV; supervision, MICAV; project administration, JJS, AFSB and MICAV; funding acquisition, LMAC and MICAV. All authors have read and agreed to the published version of the manuscript”.
Funding
This work was financed by São Paulo Research Foundation (Fundação de Amparo a Pesquisa do Estado de São Paulo – FAPESP) Grant #2019/13618-9 and fellowships #2019/26240-4, #2022/15127-5, #2023/12708-0 and #r2023/12836-8, and also by the Coordenação de Aperfeiçoamento de Pessoal de Nível Superior – Brasil (CAPES) – Finance Code 001.
Institutional Review Board Statement
Not applicable.
Informed Consent Statement
Informed consent was obtained from all subjects involved in the study.
Data Availability Statement
Data are available from the corresponding author upon specific request.
Conflicts of Interest
The authors declare no conflicts of interest.
References
- Iacobini C, Vitale M, Haxhi J, Menini S, Pugliese G. Impaired Remodeling of White Adipose Tissue in Obesity and Aging: From Defective Adipogenesis to Adipose Organ Dysfunction. Cells. 2024 Apr 30;13(9):763. [CrossRef]
- Johnston EK, Abbott RD. Adipose Tissue Development Relies on Coordinated Extracellular Matrix Remodeling, Angiogenesis, and Adipogenesis. Biomedicines. 2022 Sep 8;10(9):2227. [CrossRef]
- Mikkelsen TS, Xu Z, Zhang X, Wang L, Gimble JM, Lander ES, Rosen ED. Comparative epigenomic analysis of murine and human adipogenesis. Cell. 2010 Oct 1;143(1):156-69. [CrossRef] [PubMed] [PubMed Central]
- Zhao Y, Skovgaard Z, Wang Q. Regulation of adipogenesis by histone methyltransferases. Differentiation. 2024 Mar-Apr;136:100746. [CrossRef]
- Jang S, Hwang J, Jeong HS. The Role of Histone Acetylation in Mesenchymal Stem Cell Differentiation. Chonnam Med J. 2022 Jan;58(1):6-12. Epub 2022 Jan 25. [CrossRef]
- Voigt P, Tee WW, Reinberg D. A double take on bivalent promoters. Genes Dev. 2013 Jun 15;27(12):1318-38. [CrossRef]
- Margueron R, Reinberg D. The Polycomb complex PRC2 and its mark in life. Nature. 2011 Jan 20;469(7330):343-9. [CrossRef]
- Hemming S, Cakouros D, Isenmann S, Cooper L, Menicanin D, Zannettino A, Gronthos S. EZH2 and KDM6A act as an epigenetic switch to regulate mesenchymal stem cell lineage specification. Stem Cells. 2014 Mar;32(3):802-15. [CrossRef]
- Wei Y, Chen YH, Li LY, Lang J, Yeh SP, Shi B, Yang CC, Yang JY, Lin CY, Lai CC, Hung MC. CDK1-dependent phosphorylation of EZH2 suppresses methylation of H3K27 and promotes osteogenic differentiation of human mesenchymal stem cells. Nat Cell Biol. 2011 Jan;13(1):87-94. Epub 2010 Dec 5. [CrossRef]
- Zhong Q, Xiao X, Qiu Y, Xu Z, Chen C, Chong B, Zhao X, Hai S, Li S, An Z, Dai L. Protein posttranslational modifications in health and diseases: Functions, regulatory mechanisms, and therapeutic implications. MedComm (2020). 2023 May 2;4(3):e261. [CrossRef]
- De Donatis GM, Le Pape E, Pierron A, Cheli Y, Hofman V, Hofman P, Allegra M, Zahaf K, Bahadoran P, Rocchi S, Bertolotto C, Ballotti R, Passeron T. NF-kB2 induces senescence bypass in melanoma via a direct transcriptional activation of EZH2. Oncogene. 2016 May;35(21):2735-45. Epub 2015 Sep 14. Erratum in: Oncogene. 2016 May;35(21):2813. [CrossRef]
- Masudo K, Suganuma N, Nakayama H, Oshima T, Rino Y, Iwasaki H, Matsuzu K, Sugino K, Ito K, Kondo T, Nakamura Y, Yoshihara M, Masuda M, Miyagi Y. EZH2 Overexpression as a Useful Prognostic Marker for Aggressive Behaviour in Thyroid Cancer. In Vivo. 2018 Jan-Feb;32(1):25-31. [CrossRef]
- Lee ST, Li Z, Wu Z, Aau M, Guan P, Karuturi RK, Liou YC, Yu Q. Context-specific regulation of NF-κB target gene expression by EZH2 in breast cancers. Mol Cell. 2011 Sep 2;43(5):798-810. [CrossRef]
- Iannetti A, Ledoux AC, Tudhope SJ, Sellier H, Zhao B, Mowla S, Moore A, Hummerich H, Gewurz BE, Cockell SJ, Jat PS, Willmore E, Perkins ND. Regulation of p53 and Rb links the alternative NF-κB pathway to EZH2 expression and cell senescence. PLoS Genet. 2014 Sep 25;10(9):e1004642. [CrossRef]
- Creely SJ, McTernan PG, Kusminski CM, Fisher fM, Da Silva NF, Khanolkar M, Evans M, Harte AL, Kumar S. Lipopolysaccharide activates an innate immune system response in human adipose tissue in obesity and type 2 diabetes. Am J Physiol Endocrinol Metab. 2007 Mar;292(3):E740-7. Epub 2006 Nov 7. [CrossRef]
- Yu SY, Kim MB, Park YK, Bae M, Kang H, Hu S, Pham TX, Carpenter R, Lee J, Lee OH, Lee JY, Kim YC. Anthocyanin-Rich Aronia Berry Extract Mitigates High-Fat and High-Sucrose Diet-Induced Adipose Tissue Inflammation by Inhibiting Nuclear Factor-κB Activation. J Med Food. 2021 Jun;24(6):586-594. Epub 2021 Mar 22. [CrossRef]
- da Silva VS, Simão JJ, Plata V, de Sousa AF, da Cunha de Sá RDC, Machado CF, Stumpp T, Alonso-Vale MIC, Armelin-Correa L. High-fat diet decreases H3K27ac in mice adipose-derived stromal cells. Obesity (Silver Spring). 2022 Oct;30(10):1995-2004. Epub 2022 Sep 5. [CrossRef]
- de Jesus Simão J, de Sousa Bispo AF, Plata VTG, Armelin-Correa LM, Alonso-Vale MIC. Fish Oil Supplementation Mitigates High-Fat Diet-Induced Obesity: Exploring Epigenetic Modulation and Genes Associated with Adipose Tissue Dysfunction in Mice. Pharmaceuticals (Basel). 2024 Jul 1;17(7):861. [CrossRef]
- Takić M, Ranković S, Girek Z, Pavlović S, Jovanović P, Jovanović V, Šarac I. Current Insights into the Effects of Dietary α-Linolenic Acid Focusing on Alterations of Polyunsaturated Fatty Acid Profiles in Metabolic Syndrome. Int J Mol Sci. 2024 Apr 30;25(9):4909. [CrossRef]
- Su Y, Choi HS, Choi JH, Kim HS, Lee GY, Cho HW, Choi H, Jang YS, Seo JW. Effects of Fish Oil, Lipid Mediators, Derived from Docosahexaenoic Acid, and Their Co-Treatment against Lipid Metabolism Dysfunction and Inflammation in HFD Mice and HepG2 Cells. Nutrients. 2023 Jan 13;15(2):427. [CrossRef]
- Kapoor B, Kapoor D, Gautam S, Singh R, Bhardwaj S. Dietary Polyunsaturated Fatty Acids (PUFAs): Uses and Potential Health Benefits. Curr Nutr Rep. 2021 Sep;10(3):232-242. Epub 2021 Jul 13. [CrossRef]
- Yu S, Xie Q, Tan W, Hu M, Xu G, Zhang X, Xie G, Mao L. Different ratios of DHA/EPA reverses insulin resistance by improving adipocyte dysfunction and lipid disorders in HFD-induced IR mice. Food Funct. 2023 Jan 23;14(2):1179-1197. [CrossRef]
- Shahidi F, Ambigaipalan P. Omega-3 Polyunsaturated Fatty Acids and Their Health Benefits. Annu Rev Food Sci Technol. 2018 Mar 25;9:345-381. [CrossRef]
- de Sá RD, Crisma AR, Cruz MM, Martins AR, Masi LN, do Amaral CL, Curi R, Alonso-Vale MI. Fish oil prevents changes induced by a high-fat diet on metabolism and adipokine secretion in mice subcutaneous and visceral adipocytes. J Physiol. 2016 Nov 1;594(21):6301-6317. Epub 2016 Aug 25. [CrossRef]
- da Cunha de Sá RDC, Cruz MM, de Farias TM, da Silva VS, de Jesus Simão J, Telles MM, Alonso-Vale MIC. Fish oil reverses metabolic syndrome, adipocyte dysfunction, and altered adipokines secretion triggered by high-fat diet-induced obesity. Physiol Rep. 2020 Feb;8(4):e14380. [CrossRef]
- Antraco VJ, Hirata BKS, de Jesus Simão J, Cruz MM, da Silva VS, da Cunha de Sá RDC, Abdala FM, Armelin-Correa L, Alonso-Vale MIC. Omega-3 Polyunsaturated Fatty Acids Prevent Nonalcoholic Steatohepatitis (NASH) and Stimulate Adipogenesis. Nutrients. 2021 Feb 15;13(2):622. [CrossRef]
- da Cunha de Sá RDC, Simão JJ, Silva VSD, Farias TM, Cruz MM, Antraco VJ, Armelin-Correa L, Alonso-Vale MI. Fish Oil Enriched in EPA, but Not in DHA, Reverses the Metabolic Syndrome and Adipocyte Dysfunction Induced by a High-Fat Diet. Nutrients. 2021 Feb 26;13(3):754. [CrossRef]
- Bellei B, Migliano E, Tedesco M, Caputo S, Picardo M. Maximizing non-enzymatic methods for harvesting adipose-derived stem from lipoaspirate: technical considerations and clinical implications for regenerative surgery. Sci Rep. 2017 Aug 30;7(1):10015. [CrossRef]
- RODBELL M. METABOLISM OF ISOLATED FAT CELLS. I. EFFECTS OF HORMONES ON GLUCOSE METABOLISM AND LIPOLYSIS. J Biol Chem. 1964 Feb;239:375-80.
- Planat-Benard V, Silvestre JS, Cousin B, André M, Nibbelink M, Tamarat R, Clergue M, Manneville C, Saillan-Barreau C, Duriez M, Tedgui A, Levy B, Pénicaud L, Casteilla L. Plasticity of human adipose lineage cells toward endothelial cells: physiological and therapeutic perspectives. Circulation. 2004 Feb 10;109(5):656-63. Epub 2004 Jan 20. [CrossRef]
- Kumar A, Negi G, Sharma SS. JSH-23 targets nuclear factor-kappa B and reverses various deficits in experimental diabetic neuropathy: effect on neuroinflammation and antioxidant defence. Diabetes Obes Metab. 2011 Aug;13(8):750-8. [CrossRef]
- Livak KJ, Schmittgen TD. Analysis of relative gene expression data using real-time quantitative PCR and the 2(-Delta Delta C(T)) Method. Methods. 2001 Dec;25(4):402-8. [CrossRef] [PubMed]
- Moldes M, Zuo Y, Morrison RF, Silva D, Park BH, Liu J, Farmer SR. Peroxisome-proliferator-activated receptor gamma suppresses Wnt/beta-catenin signalling during adipogenesis. Biochem J. 2003 Dec 15;376(Pt 3):607-13. [CrossRef]
- Murray IR, West CC, Hardy WR, James AW, Park TS, Nguyen A, Tawonsawatruk T, Lazzari L, Soo C, Péault B. Natural history of mesenchymal stem cells, from vessel walls to culture vessels. Cell Mol Life Sci. 2014 Apr;71(8):1353-74. Epub 2013 Oct 25. [CrossRef]
- Lv J , Chang H , Wang Y , Wang M , Xiao J , Zhang Q , Cheng Y . Fluorination on polyethylenimine allows efficient 2D and 3D cell culture gene delivery. J Mater Chem B. 2015 Jan 28;3(4):642-650. Epub 2014 Nov 28. [CrossRef]
- Hagmann S, Moradi B, Frank S, Dreher T, Kämmerer PW, Richter W, Gotterbarm T. Different culture media affect growth characteristics, surface marker distribution and chondrogenic differentiation of human bone marrow-derived mesenchymal stromal cells. BMC Musculoskelet Disord. 2013 Jul 30;14:223. [CrossRef]
- Sharif O, Bolshakov VN, Raines S, Newham P, Perkins ND. Transcriptional profiling of the LPS induced NF-kappaB response in macrophages. BMC Immunol. 2007 Jan 12;8:1. [CrossRef]
- Creely SJ, McTernan PG, Kusminski CM, Fisher fM, Da Silva NF, Khanolkar M, Evans M, Harte AL, Kumar S. Lipopolysaccharide activates an innate immune system response in human adipose tissue in obesity and type 2 diabetes. Am J Physiol Endocrinol Metab. 2007 Mar;292(3):E740-7. Epub 2006 Nov 7. [CrossRef]
- Zhao Y, Skovgaard Z, Wang Q. Regulation of adipogenesis by histone methyltransferases. Differentiation. 2024 Mar-Apr;136:100746. Epub 2024 Jan 14. [CrossRef]
- Inagaki T, Sakai J, Kajimura S. Transcriptional and epigenetic control of brown and beige adipose cell fate and function. Nat Rev Mol Cell Biol. 2016 Aug;17(8):480-95. Epub 2016 Jun 2. Erratum in: Nat Rev Mol Cell Biol. 2017 Aug;18(8):527. [CrossRef]
Figure 1.
Graphical representation of phosphorylated NF-kBp50 protein content (A) and total NF-kBp105 and NF-kBp50 (B) in ASCs extracted from human visceral WAT cultured until reaching 90-100% confluence and exposed for 72 hours to lipopolysaccharide (LPS, 1μg/mL), in the presence (or absence) of fish oil (FO, 50μM). Values are expressed as mean ± SEM relative to control and normalized by total protein by Ponceau staining. Above each graph, a representative autoradiogram of experiments (n= 3) quantified by ImageJ is shown. * P<0.05, ** P<0.001.

Figure 2.
Expression of genes encoding H3K27 modifiers associated with acetylation, CREBBP (A) and EP300 (B), demethylation, KDM6B (C), and methylation, EZH2 (D), respectively. Graphical representation of the protein content of ACL (E), H3K27ac (F), and KDM6B (G). ASCs were extracted from human visceral WAT, cultured until reaching 90-100% confluence and exposed for 72 hours to LPS (1μg/mL), in the presence (or absence) of FO (50μM). Values are expressed as mean ± SEM relative to control and normalized by the expression of constitutive GAPDH (A-D) or total protein by Ponceau staining (E-H). Next to each graph, a representative autoradiogram of experiments (n= 3) quantified by ImageJ is shown. * P<0.05, ** P<0.001.
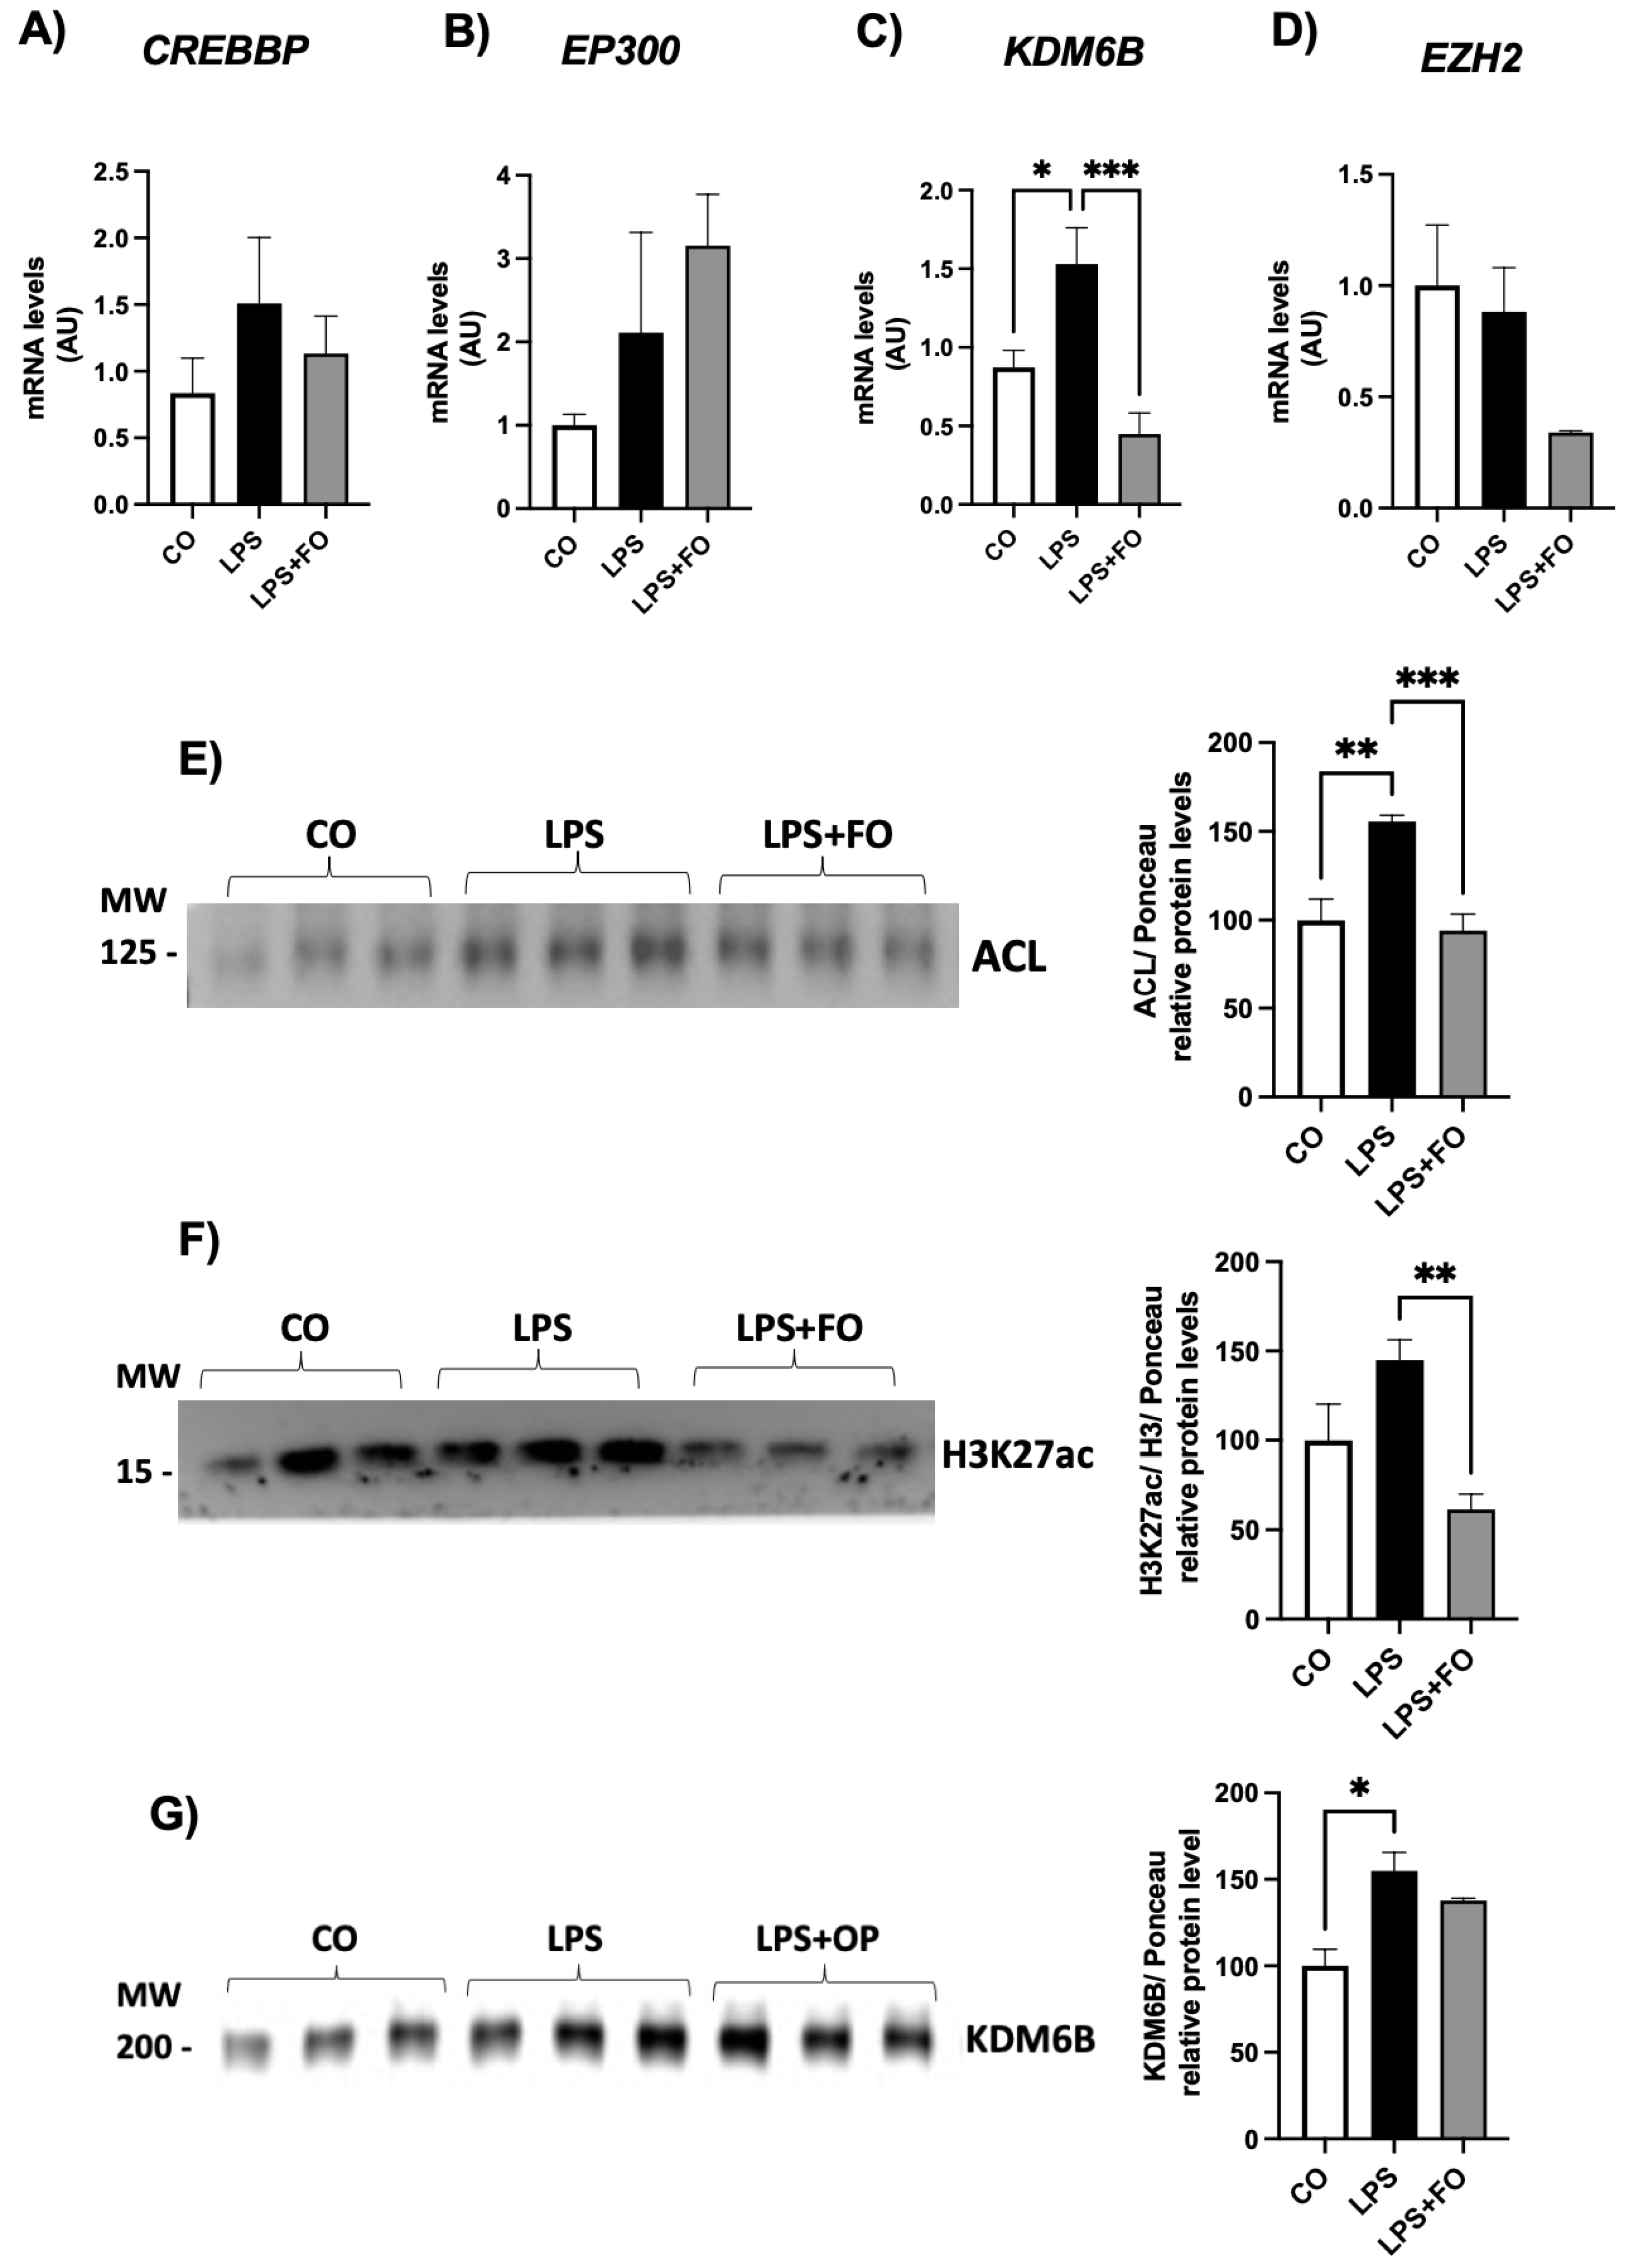
Figure 3.
Expression of genes encoding H3K27 modifiers associated with acetylation, CREBBP (A) and EP300 (B), demethylation, KDM6B (C), and methylation, EZH2 (D), respectively. ASCs were extracted from human visceral WAT, cultured until reaching 90-100% confluence and exposed for 72 hours to LPS (1μg/mL), in the presence (or absence) of JSH-23 (10μM). Values are expressed as mean ± SEM relative to control and normalized by the expression of constitutive GAPDH. ** P<0.001, **** P<0.0001.
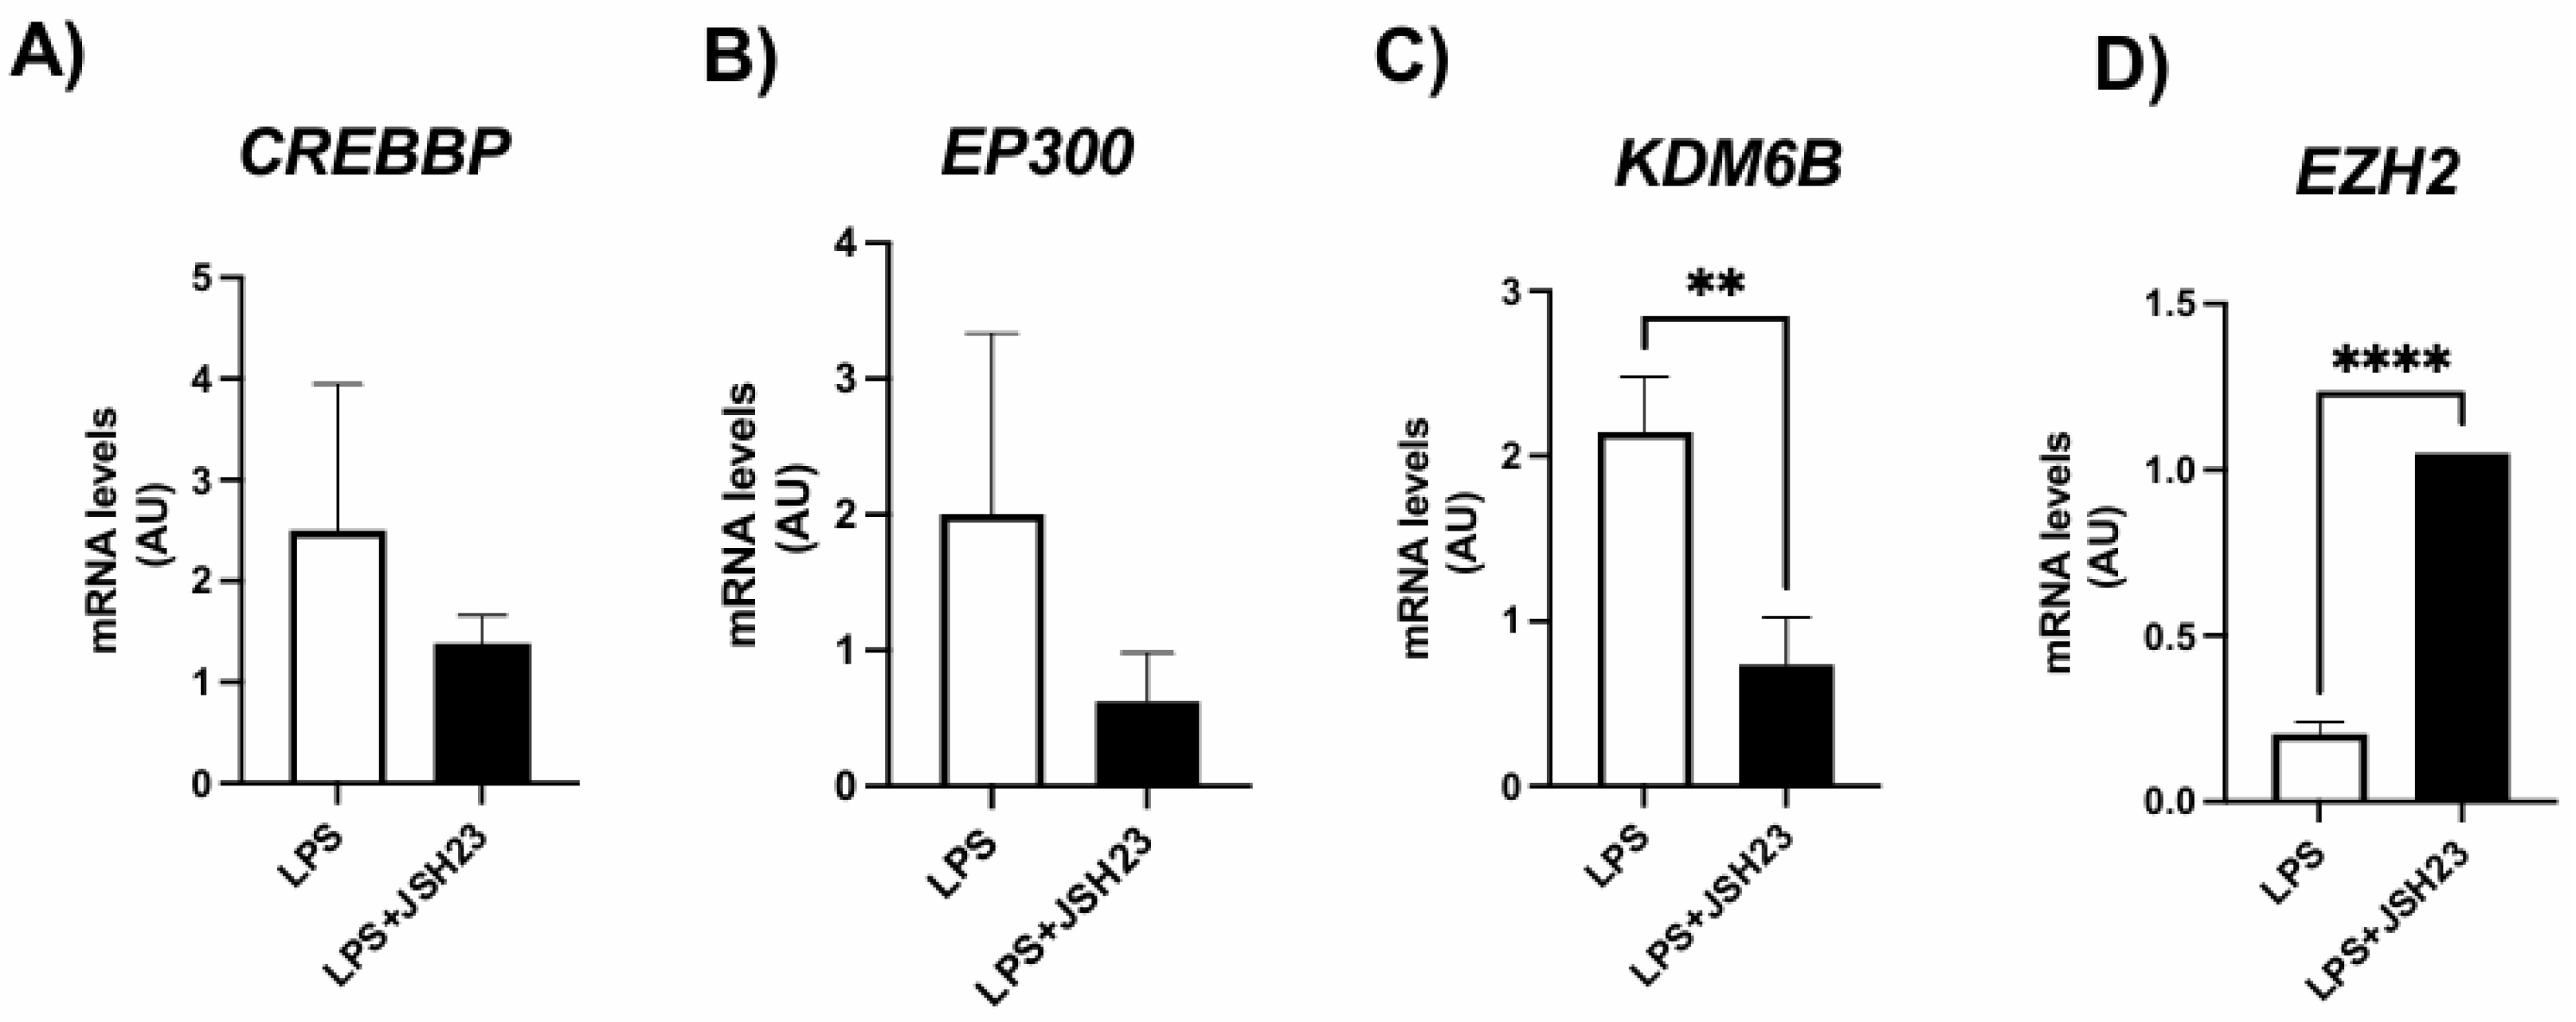
Figure 4.
Expression of genes encoding H3K27 modifiers associated with: acetylation, CREBBP (A), and demethylation, KDM6A and KDM6B (B-C), respectively, in adipocytes newly differentiated in vitro from visceral ASCs, pre-stimulated chronically with LPS. Graphical representation of the protein content of ACL (D), H3K27ac (E), KDM6B (F), and H3K27me3 (G). The cells were cultured until reaching 90-100% confluence and exposed for 72h to LPS (1μg/mL) in the presence (or absence) of FO (50μM). After 72h (day 0), the treatment was removed and the cells were washed and differentiated with an adipogenic cocktail until day 4, when total RNA and protein were extracted and subjected to RT-PCR or western blotting, respectively. Values are expressed as mean ± SEM relative to control and normalized by the expression of constitutive GAPDH (A-C) or total protein by Ponceau staining (D-G). Next to each graph, a representative autoradiogram of experiments (n= 3) quantified by ImageJ is shown. * P<0.05, ** P<0.001, ***P < 0,0001.
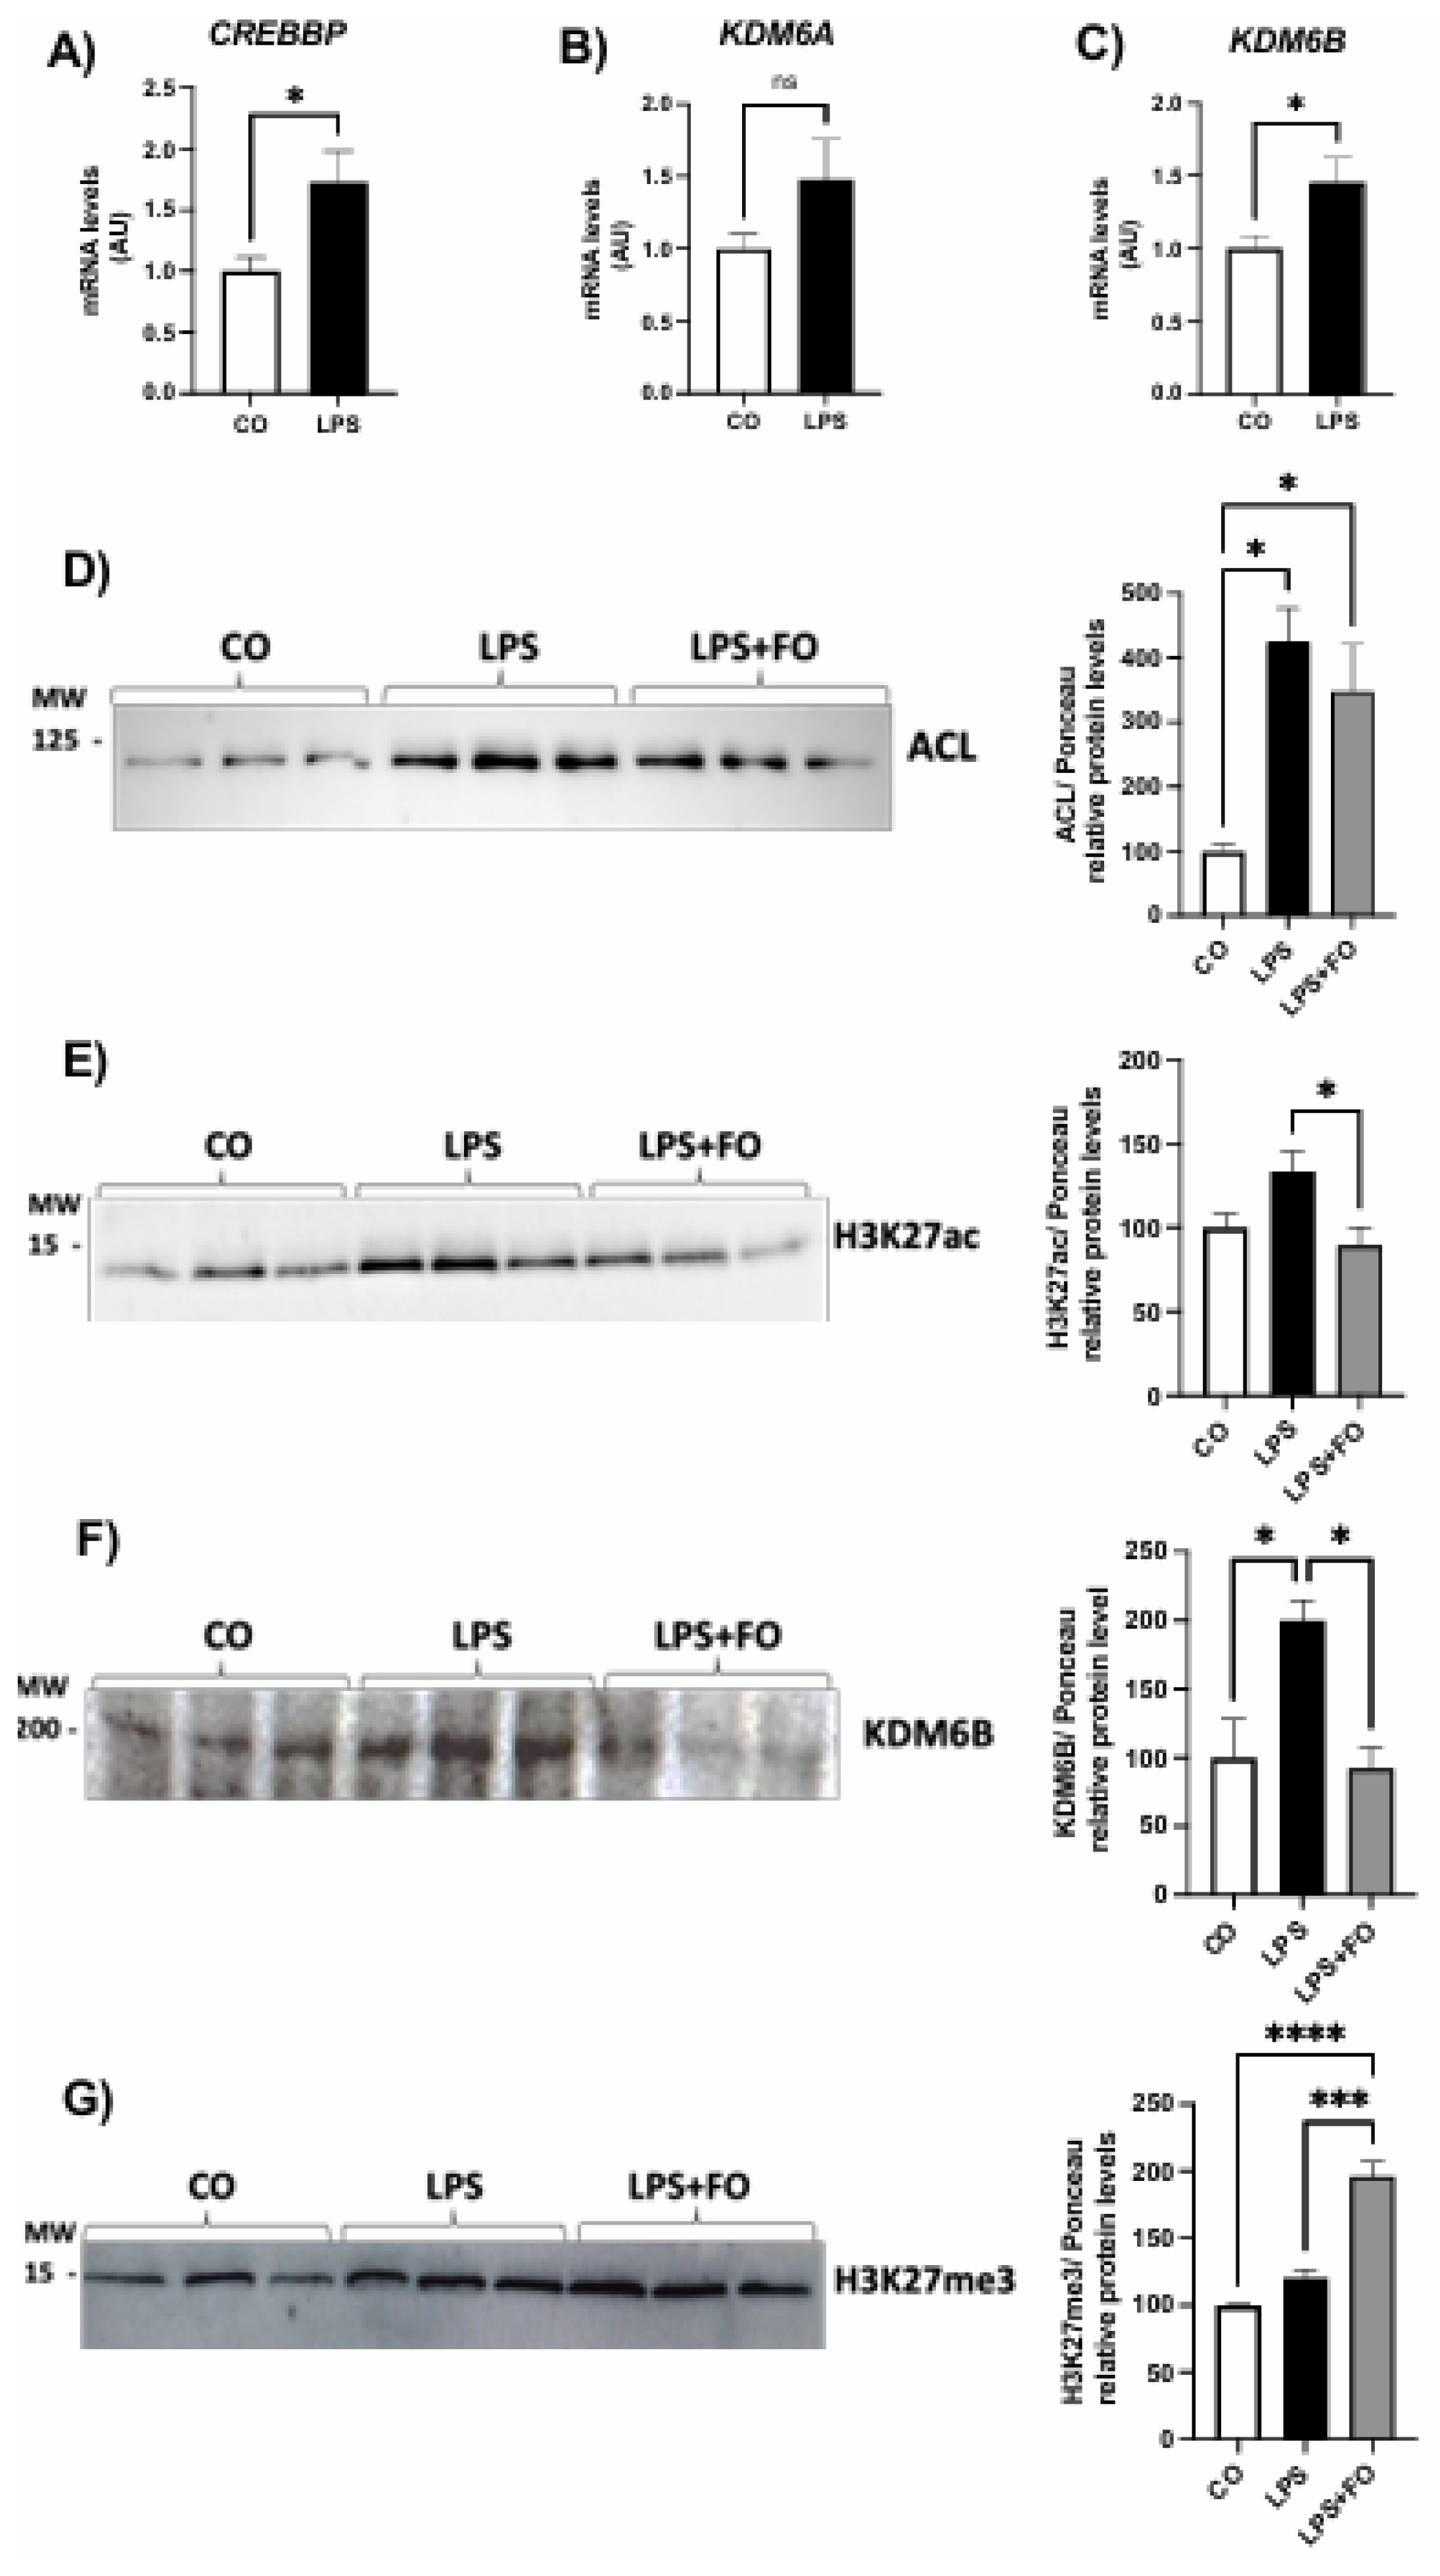

Table 1.
- List of selected genes in Custom Human RT2 Profiler PCR Array.
| Pathways | Genes |
|---|---|
| Adipokines | ADIPOQ, CFD, LEP, RETN |
| Lipases and lipogenic enzymes | ACACA, GPD1, LIPE (HSL), SCD, LPL, PNPLA2, LPIN1, PCK1, FASN |
| Pro- adipogenesis | CEBPA, CEBPB, CEBPD, PPARG, SREBF1, FABP4, PLIN1, FGF2, FGF10, JUN, LMNA, SFRP1, SLC2A4 (GLUT4), KLF15, KLF4 |
| Anti- adipogenesis | ADRB2, CDKN1A (P21CIP1, CAP20), CDKN1B (P27KIP1), DDIT3 (GADD153, CHOP), DLK1(PREF1), FOXO1, NCOR2, SHH, SIRT1, WNT1, WNT3A, GATA2, KLF2 |
| Pro-Browning, fatty acid thermogenesis and oxidation | BMP7, CIDEA, CPT1B, CREB1, DIO2, ELOVL3, FOXC2, MAPK14 (P38ALPHA), NRF1, PPARA, PPARD, PPARGC1A (PGC1ALPHA), PPARGC1B (PERC, PGC1BETA), PRDM16, SIRT3, SRC, TBX1, TFAM, UCP1, WNT5A |
| Anti-Browning | NCOA2, NR1H3, RB1, WNT10B |
| Adipokines receptors | LEPR, ADIPOR2, ADRB1 |
| Cytokines, growth factors and signal transduction | CCL2 (MCP1), CXCL10, IFNG, IL1B, IL4, IL6, IL10, IL12B, IL13, TGFB1, TNF, INSR, IRS1, IRS2, AKT2, PTPN1 (PTP1B), IKBKB (IKKbeta), MAPK8 (JNK1), NFKB1, PIK3R1 (P85ALPHA), IRF4, CD68 |
ACACA (ACC1) - Acetyl-Coenzyme A carboxylase alpha; ADIPOQ, Adiponectin; ADIPOR2 - Adiponectin receptor 2; ADRB1 - Adrenergic receptor, beta 1; ADRB2- Adrenergic receptor, beta 2; AKT2 - Thymoma viral proto-oncogene 2; BMP7 - Bone morphogenetic protein 7; CCL2 - Chemokine (C-C motif) ligand 2; CD68 - CD68 antigen; CDKN1A - Cyclin-dependent kinase inhibitor 1A (P21); CDKN1B - Cyclin-dependent kinase inhibitor 1B; CEBPA or C/EBPA - CCAAT/enhancer binding protein (C/EBP), alpha; CEBPB or C/EBPΒ - CCAAT/enhancer binding protein (C/EBP), beta; CEBPD - CCAAT/enhancer binding protein (C/EBP), delta; CFD - Complement factor D (adipsin); CIDEA - Cell death-inducing DNA fragmentation factor, alpha subunit-like effector A; CPT1B - Carnitine palmitoyltransferase 1b, muscle; CXCL10 - Chemokine (C-X-C motif) ligand 10; DDIT3 - DNA-damage inducible transcript 3; DIO2 - Deiodinase, iodothyronine, type II; DLK1 (PREF-1) - Delta-like 1 homolog (Drosophila); ELOVL3 - Elongation of very long chain fatty acids (FEN1/Elo2, SUR4/Elo3, yeast)-like 3; FABP4 (aP2) - Fatty acid binding protein 4, adipocyte; FASN - Fatty acid synthase; FGF10 - Fibroblast growth factor 10; FGF2 - Fibroblast growth factor 2; FOXC2 - Forkhead box C2; FOXO1 - Forkhead box O1; GATA2 - GATA binding protein 2; GPD1 - Glycerol-3-phosphate dehydrogenase 1 (soluble); IFNG - Interferon gamma; IKBKB(IKKBETA) - Inhibitor of kappaB kinase beta; IL10 - Interleukin 10; IL12B - Interleukin 12b; IL13 - Interleukin 13; IL1B - Interleukin 1 beta; IL4 - Interleukin 4; IL6 - Interleukin 6; INSR - Insulin receptor; IRF4 - Interferon regulatory factor 4; IRS1 - Insulin receptor substrate 1; IRS2 - Insulin receptor substrate 2; JUN - Jun oncogene; KLF15 - Kruppel-like factor 15; KLF2 - Kruppel-like factor 2 (lung); KLF4 - Kruppel-like factor 4 (gut); LEP – Leptin; LEPR - Leptin receptor; LIPE (HSL) - Lipase, hormone sensitive; LMNA - Lamin A; LPIN1 - Lipin 1; LPL - Lipoprotein lipase; MAPK14 - Mitogen-activated protein kinase 14; MAPK8(JNK1) - Mitogen-activated protein kinase 8; NCOA2 - Nuclear receptor coactivator 2; NCOR2 - Nuclear receptor co-repressor 2; NFKB1 - Nuclear factor of kappa light polypeptide gene enhancer in B-cells 1, p105; NR1H3 - Nuclear receptor subfamily 1, group H, member 3; NRF1 - Nuclear respiratory factor 1; PCK1 -Phosphoenolpyruvate carboxykinase 1, cytosolic; PIK3R1 - Phosphatidylinositol 3-kinase, regulatory subunit, polypeptide 1 (p85 alpha); PLIN1 - Perilipin 1; PNPLA2- patatin like phospholipase domain containing 2; PPARA - Peroxisome proliferator activated receptor alpha; PPARD - Peroxisome proliferator activator receptor delta; PPARG or PPARΓ - Peroxisome proliferator activated receptor gamma; PPARGC1A - Peroxisome proliferative activated receptor, gamma, coactivator 1 alpha; PPARGC1B - Peroxisome proliferative activated receptor, gamma, coactivator 1 beta; PRDM16 - PR domain containing 16; PTPN1 - Protein tyrosine phosphatase, non-receptor type 1; RB1 - Retinoblastoma 1; RETN – Resistin; SCD - Stearoyl-Coenzyme A desaturase 1; SCR - Rous sarcoma oncogene; SFRP1 - Secreted frizzled-related protein 1; SHH - Sonic hedgehog; SIRT1 - Sirtuin 1 (silent mating type information regulation 2, homolog) 1 (S. cerevisiae); SIRT3 - Sirtuin 3 (silent mating type information regulation 2, homolog) 3 (S. cerevisiae); SLC2A4 (GLUT4) - Solute carrier family 2 (facilitated glucose transporter), member 4; SREBF1 - Sterol regulatory element binding transcription factor 1; TBX1 - T-box 1; TFAM - Transcription factor A, mitochondrial; TGFB1 - Transforming growth factor, beta 1; TNF - Tumor necrosis factor; UCP1 - Uncoupling protein 1 (mitochondrial, proton carrier); WNT1 - Wingless-related MMTV integration site 1; WNT10B - Wingless related MMTV integration site 10b; WNT3A - Wingless-related MMTV integration site 3A; WNT5A - Wingless-related MMTV integration site 5A.
Table 2.
- Immunophenotyping of ASCs from human visceral WAT between passages P2-P4.
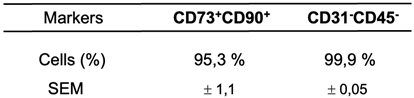
Table 2.
- List of genes that were up-regulated and down-regulated in the LPS-stimulated group compared to the control (non-stimulated).
Table 2.
- List of genes that were up-regulated and down-regulated in the LPS-stimulated group compared to the control (non-stimulated).
| Gene | Ref Seq Number |
Fold Regulation |
p-Value | Pathway Related |
|---|---|---|---|---|
| Up-regulated | ||||
| GPD1 | NM_005276 | 3.83 | 0.372275 | Lipases and lipogenic enzymes |
| LIPE | NM_005357 | 657.62 | 0.053407 | Lipases and lipogenic enzymes |
| LPL | NM_000237 | 5.08 | 0.357196 | Lipases and lipogenic enzymes |
| LPIN1 | NM_145693 | 2.24 | 0.035099 | Lipases and lipogenic enzymes |
| FASN | NM_004104 | 2.05 | 0.198777 | Lipases and lipogenic enzymes |
| ADRB2 | NM_000024 | 26.25 | 0.153417 | Anti- adipogenesis |
| CDKN1B | NM_004064 | 257.98 | 0.326792 | Anti- adipogenesis |
| DLK1 | NM_003836 | 24.27 | 0.367295 | Anti- adipogenesis |
| FOXO1 | NM_002015 | 7.55 | 0.344553 | Anti- adipogenesis |
| SIRT1 | NM_012238 | 6.62 | 0.283462 | Anti- adipogenesis |
| WNT3A | NM_033131 | 454.39 | 0.126152 | Anti- adipogenesis |
| GATA2 | NM_032638 | 255172.11 | 0.135933 | Anti- adipogenesis |
| CPT1B | NM_004377 | 6.17 | 0.375312 | Pro-Browning, fatty acid thermogenesis and oxidation |
| DIO2 | NM_000793 | 639.64 | 0.136301 | Pro-Browning, fatty acid thermogenesis and oxidation |
| PRDM16 | NM_199454 | 5.25 | 0.074225 | Pro-Browning, fatty acid thermogenesis and oxidation |
| UCP1 | NM_021833 | 33.73 | 0.018196 | Pro-Browning, fatty acid thermogenesis and oxidation |
| WNT5A | NM_003392 | 2.29 | 0.376944 | Pro-Browning, fatty acid thermogenesis and oxidation |
| NCOR2 | NM_006312 | 2.32 | 0.033524 | Anti-Browning |
| NCOA2 | NM_006540 | 11.89 | 0.225568 | Anti-Browning |
| NR1H3 | NM_005693 | 4.93 | 0.360812 | Anti-Browning |
| RB1 | NM_000321 | 3.52 | 0.045966 | Anti-Browning |
| ADIPOR2 | NM_024551 | 75.38 | 0.141593 | Adipokines receptors |
| ADRB1 | NM_000684 | 66502.05 | 0.135936 | Adipokines receptors |
| CXCL10 | NM_001565 | 7.37 | 0.174107 | Cytokines, growth factors and signal transduction |
| IFNG | NM_000619 | 6.59 | 0.179346 | Cytokines, growth factors and signal transduction |
| IL4 | NM_000589 | 326.54 | 0.361392 | Cytokines, growth factors and signal transduction |
| IL6 | NM_000600 | 830.95 | 0.011242 | Cytokines, growth factors and signal transduction |
| IL10 | NM_000572 | 25.07 | 0.361432 | Cytokines, growth factors and signal transduction |
| IL12B | NM_002187 | 985920.03 | 0.135932 | Cytokines, growth factors and signal transduction |
| IL13 | NM_002188 | 37086.62 | 0.103510 | Cytokines, growth factors and signal transduction |
| TGFB1 | NM_000660 | 323.16 | 0.372799 | Cytokines, growth factors and signal transduction |
| TNF | NM_000594 | 11.09 | 0.050047 | Cytokines, growth factors and signal transduction |
| INSR | NM_000208 | 2.45 | 0.206700 | Cytokines, growth factors and signal transduction |
| PTPN1 | NM_002827 | 2.97 | 0.262779 | Cytokines, growth factors and signal transduction |
| IKBKB | NM_001556 | 6064.24 | 0.373517 | Cytokines, growth factors and signal transduction |
| MAPK8 | NM_002750 | 4994.45 | 0.373575 | Cytokines, growth factors and signal transduction |
| NFKB1 | NM_003998 | 1356174.24 | 0.035932 | Cytokines, growth factors and signal transduction |
| ACLY | NM_001096 | 2.96 | 0.281940 | Cytokines, growth factors and signal transduction |
| CD68 | NM_001251 | 9.49 | 0.368878 | Cytokines, growth factors and signal transduction |
| Down-regulated | ||||
| LEP | NM_000230 | -2.18 | 0.0858765 | Adipokines |
| FABP4 | NM_001442 | -3.72 | 0.0652578 | Pro- adipogenesis |
| KLF4 | NM_004235 | -2.55 | 0.239165 | Pro- adipogenesis |
| WNT1 | NM_005430 | -10.84 | 0.460085 | Anti- adipogenesis |
| KLF2 | NM_016270 | -19.14 | 0.241078 | Anti- adipogenesis |
| NRF1 | NM_005011 | -3.33 | 0.295323 | Pro-Browning, fatty acid thermogenesis and oxidation |
| PPARGC1B | NM_133263 | -7.18 | 0.012021 | Pro-Browning, fatty acid thermogenesis and oxidation |
| SIRT3 | NM_012239 | -4.66 | 0.361493 | Pro-Browning, fatty acid thermogenesis and oxidation |
| SRC | NM_005417 | -102.81 | 0.372853 | Pro-Browning, fatty acid thermogenesis and oxidation |
| TBX1 | NM_005992 | -7.42 | 0.323127 | Pro-Browning, fatty acid thermogenesis and oxidation |
| TFAM | NM_003201 | -2.56 | 0.658977 | Pro-Browning, fatty acid thermogenesis and oxidation |
| IRS1 | NM_005544 | -2.43 | 0.549537 | Cytokines, growth factors and signal transduction |
| IRS2 | NM_003749 | -63.29 | 0.000514 | Cytokines, growth factors and signal transduction |
| AKT2 | NM_001626 | -8.47 | 0.38668 | Cytokines, growth factors and signal transduction |
Gene expression profile in adipocytes newly differentiated in vitro from human visceral ASCs, pre-stimulated chronically with LPS. The cells were cultured until reaching 90-100% confluence and exposed for 72h to LPS (1μg/mL). After 72h (day 0), the treatment was removed and the cells were washed and differentiated with an adipogenic cocktail until day 4, when RNA was extracted and subjected to RT2 Profiler PCR Array.
Disclaimer/Publisher’s Note: The statements, opinions and data contained in all publications are solely those of the individual author(s) and contributor(s) and not of MDPI and/or the editor(s). MDPI and/or the editor(s) disclaim responsibility for any injury to people or property resulting from any ideas, methods, instructions or products referred to in the content. |
© 2024 by the authors. Licensee MDPI, Basel, Switzerland. This article is an open access article distributed under the terms and conditions of the Creative Commons Attribution (CC BY) license (http://creativecommons.org/licenses/by/4.0/).
Copyright: This open access article is published under a Creative Commons CC BY 4.0 license, which permit the free download, distribution, and reuse, provided that the author and preprint are cited in any reuse.


