
Submitted:
22 October 2024
Posted:
23 October 2024
You are already at the latest version
Abstract
Custom copper smelters, dependent on purchased concentrates, face increasing economic pressures amid falling treatment and refining fees. With declining availability of high-grade, low-impurity concentrates, copper demand is expected to surge to support the transition to renewable energy. This study, based on recent observations of Chinese custom smelters, examines their strategies to address the challenge of purchasing concentrates at record-low treatment and refining charges. By investing in slag flotation technology, smelters can enhance copper, gold and silver recoveries. Through blending of high-grade and low-grade concentrates they can capitalize on the gap between the recoverable and payable metals, which is often referred to as “free metals”, while also benefiting from by-products, mainly sulfuric acid. While this approach offers economic opportunities, it introduces operational complexities. To mitigate these, laboratory testing combined with advanced digital predictive tools based on thermodynamics is crucial. This study demonstrates the use of thermodynamic models supported by experimental work for analyzing furnace operations. FactSage® software and a custom database are employed to define the operating window of two common flowsheets: 1) Flash Smelting + Flash Converting and 2) Bottom-Blown Smelting + Bottom Blowing Converting.
Keywords:
Custom copper smelter
; Blending of concentrate
; Thermodynamic modelling
; FactSage
1. Introduction
Custom smelters purchase concentrates from miners, paying for contained copper, gold, and silver while charging penalties for impurities (As, F, Bi, Pb, Zn, Hg, Ni, Co, Cd). Additionally, smelters impose treatment charges and refining charges (TC/RC) on miners. The sale and purchase of the copper concentrates in international market is driven by benchmark TC/RC which is annually negotiated between the major miner and smelter. Historically, the benchmark was set by Escondida or Freeport Indonesia with the Japanese smelters. During last 20 years, as the dynamic of the market has shifted towards China, the benchmark has been dominated by Freeport and Antofagasta Minerals with the major Chinese smelters. Due to the tight supply of copper concentrates, the spot TC/RCs have been declining, as illustrated in Figure 1, reaching zero values. A meaningful increase in future TC/RC is unlikely due to a shortage of new mining projects to match recent smelter expansions in China [1]. Furthermore, countries producing concentrates may also restrict their export to secure access to copper as a critical metal for energy transition. China operates over 44 custom copper smelters, primarily processing concentrates from Chile, Peru, Kazakhstan, Mongolia, Mexico, and Panama. According to the World Integrated Trade Solution (WITS) website, China imported over 27 million tonnes of copper ores and concentrates in 2023, accounting for a substantial 69% share among countries importing these materials. As ore grades of deposits across the world have been decreasing, the resulting concentrates have also become of lower grades with higher impurity levels (As, Bi, Sb, Pb, Zn, etc.). China has access to significant quantities of low-grade concentrates, but their processing is economically challenging without blending with a higher-grade material.
Thus, a trend has emerged where Chinese custom smelters purchase concentrates from 10-20 different sources to create an optimal feed blend for processing. Recent observations of Chinese smelters indicate that those operating Flash furnaces target a feed blend close to 25 wt.% Cu [2], while those working with bath-type furnaces (Bottom-Blown, Side-Blown, or TSL) tend to target lower grades, around 21 wt.% Cu. For Flash smelting, the stability and temperature of the flame largely depends on the concentrate grade [3]. This study provides the economic justification for custom smelters to incorporate more low-grade materials into their flowsheets, along with a technical analysis of process conditions
In future, more smelters are expected to adopt a market driven value-added blending strategy to produce metals at maximum revenue. The operating strategies must be supported by feed-forward control and adjustable process conditions. In such a dynamic environment, advanced computational tools supported by experiments are essential for operational stability. We demonstrate calculations using FactSage® software [4] and a thermodynamic database developed through an integrated experimental and modelling program in collaboration between the Pyrometallurgy Innovation Laboratory and a consortium of copper producers, including Rio Tinto. Two typical smelter types, Bottom-Blown and Flash, are analyzed, considering their kinetic differences. Thermodynamic predictions are validated through a multicomponent chemical system experimental study, mainly focusing on solubility of copper in slag, Fe/SiO2 ratio for sub-liquidus slags, distribution coefficient of gold and silver.
2. Materials and Methods
2.1. Concentrate Evaluation
For custom smelters, the price of concentrate is the sum of the values of the payable metals (Cu, Au and Ag) minus the sum of the deductions such as, TC/RC and penalties. Custom smelters have four major revenue streams: TC/RC, premium for metals, “free metals”, and sulfuric acid. Treatment charges are calculated per tonne of dry concentrate, while refining charges are calculated based on payable amount of copper. “Free metal” revenue stream originates from the difference between recovered metal and paid metal:
Figure 2 shows a typical payable curve (in %) as a function of concentrate grade (in wt. %) [5]. The curve is non-linear: from the maximum of 96.75 % payable it decreases only slightly to 96.65% at 30 wt.% Cu, below that the drop rate increases. The mineralogical composition of lower-grade concentrates is dominated by Chalcopyrite (CuFeS2) and Pyrite (FeS2), while the higher-grade concentrates contain Bornite (Cu5FeS4), Chalcocite (Cu2S), Covellite (CuS). As a result, higher-grade concentrates often have a higher ratio of Cu/S compared to lower-grade concentrates. There are exceptions, when low-grade concentrates contain more gangue materials, i.e. SiO2, Al2O3 CaO and MgO, but have high Cu/S ratio. Most economic value is in the treatment of difficult low-grade concentrates with high level of impurities containing higher values of precious metals, such as Ag, Au, Pt and Pd.
To demonstrate the economic value of treating lower grade concentrates, the following two process flowsheets of copper making were considered:
Case 1: Flash Smelting + Flash Converting (double flash)
Case 2: Bottom Blowing Smelting + Bottom Blowing Converting.
Flash Smelting furnaces are most valued for their high throughput, but they are more sensitive to the quality of concentrate, such as moisture, sulfur content, particle size distribution, etc. We will consider a smelter with a capacity for 230 t/h of dry concentrate and up to 290 t/h of combined solid feed. Case 2 is the process consisting of Bottom Blown Smelter and Bottom Blown Converter, representing bath-type smelter operations. These furnaces do not reach such high throughputs, but are tolerant to the moisture and deviations in composition. Smelter from Case 2 has design capacity of 150 t/h of dry concentrate and up to 190 t/h of combined solid feed. To simplify the analysis, let’s assume that no investment has been allocated to the dust leaching for the removal of harmful elements, such As, Bi and Sb from the flue dust. All the generated dust is recycled back to the furnace, and the dust collection is 100% efficient. At the same time, both invested in the facility of slow slag cooling, crushing and flotation, which significantly increases the recovery of Cu, Au and Ag. Slag concentrate containing recovered Cu, Ag and Au is sent back to the smelting, while the rest is discarded. These facilities are assumed to operate with the same efficiency in both cases. Thus, in both cases there are only three outputs: off-gas free from flue dust, discard slag and anode copper. Valuable and harmful metals partition amount the latter two streams.
To further simplify the analysis, let’s assume that four concentrates are available on the market. Their compositions are shown in Table 1. Concentrate 1 represents average quality concentrate. Concentrate 2 has a very high content of gold in ppm, but low content of copper. It approximately represents the concentrates available in Western Australia. Concentrate 3 has a high content of silver, but also high concentrations of impurities, Pb, Zn, As, Sb and Bi. These types are available in Peru. The last Concentrate 4 is neither rich in copper, nor in gold and silver, but it is very clean from the very same impurities and based on some compositions reported in Pakistan.
The procurement team is given the task to maximize the profit, which can be generated per year from processing these concentrates. First, it is necessary to estimate the price of concentrates. Copper, gold and silver contribute positively to the price. For instance, copper from Concentrate 1 contributes 1 tonne × 25 wt. % × 9800 US$/tonne × 96 %Payable = 2352 US$/tonne. A very important parameter is %Payable, which is established through negotiations on the market. Examples of payable functions for copper and gold are shown in Figure 2 [5,6]. For silver, the common practice is to use only 90 %Payable on concentrations over 30 ppm [5,6]. Many other metals have negative contributions to the price of the concentrate, in recognition to the fact that resources are necessary for their safe utilization. These often kick off starting from the certain concentration and then increase for every 0.1 wt. % in the concentrate, as shown in the last two rows of Table 1 [7]. For instance, the contribution of As to the price of Concentrate 3 is 1 tonne × 2.4/0.1 wt. %/wt. % × (-5) US$/tonne = -120 US$/tonne. Prices calculated using this procedure are given in the last column of Table 1.
2.2. Thermodynamic Calculations
Equilibrium calculations are performed using FactSage® software [4], complemented by non-thermodynamic factors, that represent main potential deviations of furnaces from the equilibrium conditions. The thermodynamic database developed by the authors is used [8]. It combines experimental phase equilibria studies, calorimetric measurements, activity data and distribution among phases for all elements in Table 1, except Cd, F, Hg and Se. Predictions of copper solubility in slag was modelled earlier by the authors [9,10]. The models for the distribution of gold and silver among slag and matte were developed as well [11]. The database is gradually improved by the iterative process of targeted experiments and reassessments of model parameters.
The approach to model process units deviating from equilibrium condition has been described and tested in recent publications [12,13]. Process units are divided into equilibrium zones connected with streams of materials. Each stream contains information about the mass flow of elements and the enthalpy value. Enthalpy values are calculated by FactSage® for all streams including concentrates, fluxes and other materials whose mineral (phase) composition is predicted based on elemental composition. The energy balance in each zone is calculated simply as a difference between the output and input streams. User interface and operations with streams: dividing, combining and transferring from one unit to another, are done in Excel. Macro language built-in Excel initiates FactSage® calculations though the Application Programming Interface of EquiSage.exe (Figure 3).
Non-thermodynamic factors are necessary to account for the fact that a portion of a stream may bypass the equilibrium zone without reacting. Unreactive portions are assumed to participate in energy balance, but not in equilibrium.
Process parameters used in the present study are collected in Table 2.
2.3. Experimental Study
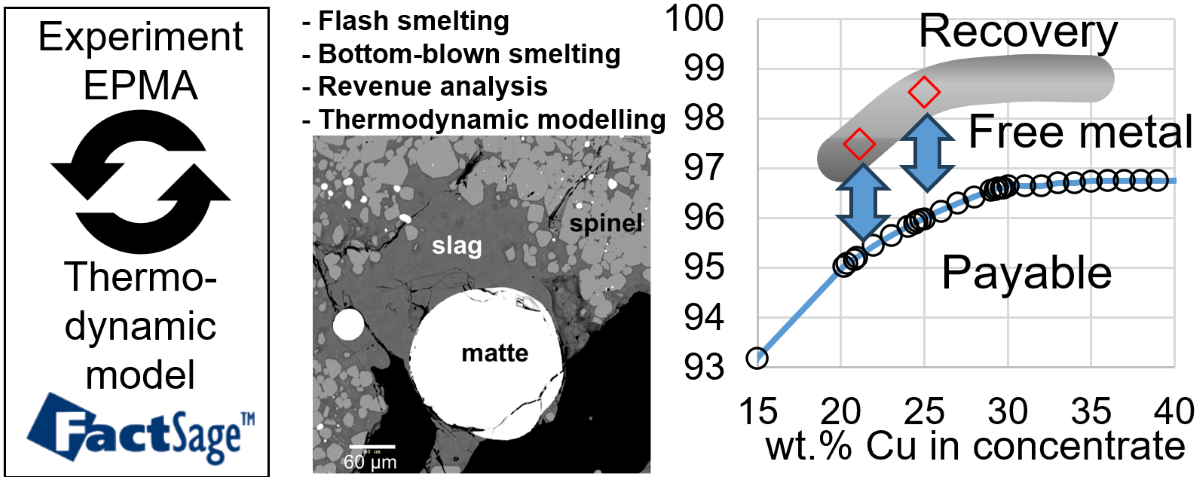
The purpose of experimental study is to verify the predictive power of thermodynamic models for chemical solubility of Cu, Ag and Au in slag, as well as recommend Fe/SiO2 ratio for the smelting step. The latter is an important factor influencing the amount of slag though flux addition, as well as energy balance due to the need of heating flux materials. Experimental methodology involves high-temperature equilibration, quenching and direct measurement of compositions of phases using Electron Probe X-ray Microanalysis (EPMA) or Laser ablation ICP-MS. This technique was described in many articles by the authors [25], but in this study it was pushed to the limit by studying many more components than previously.
Conditions for equilibration experiments were selected close to the corresponding smelting conditions. The targeted equilibrium was among gas, slag, matte and spinel (Fe3O4). Powdered mixtures in proportions estimated by FactSage® were made from analytical grade reagents (e.g. SiO2, Fe2O3, Fe, Cu, CaCO3, Al2O3, MgO, Ni, Co, As, Sb, Bi, PbO, ZnO, Ag, Au), and pre-melted master slags (e.g. PbO-SiO2, CaO-SiO2, CaO-Fe2O3). Master slags improve the kinetics during equilibration and mitigate the initial evaporation of volatile elements. Pelletized samples were placed onto the substrate of spinel (Fe3O4). It was made in a shape of open basket obtained from oxidation of Fe foil in controlled CO/CO2 atmosphere. For experiments with high concentrations of MgO in slag, magnesia crucibles were used. The furnace setup and sample location are shown in Figure 4. The experimental samples were suspended in a 30mm ID recrystallized alumina reaction tube and positioned in the calibrated, uniform hot zone of a vertical, electrically heated furnace. Alumina-shielded Pt-Rh 6%/Pt-Rh 30% B type thermocouple placed immediately next to the sample controlled its temperature within ±5 K. P(SO2) and P(O2) during the equilibration were fixed by a 500 ml/min gas flow of Ar, SO2, CO and CO2 in pre-calculated proportions. Gases were supplied by Coregas (NSW, Australia). Flow rates were controlled using U-tube pressure differential type gas flowmeters. The accuracy of the targeted oxygen partial pressure was verified using a DS-type oxygen probe made from Y2O3-stabilized ZrO2 solid electrolyte cell, supplied by Australian Oxycontrol systems (Victoria, Australia).
After equilibration, samples quickly dropped into CaCl2 or MgCl2 brine solution at -20°C, ensuring quenching from > 1250 °C to 500 °C within 2-3 seconds. After cooling to room temperature, phases present during the equilibration retained their compositions. Samples were dried, placed in epoxy resin, polished and coated with thin layer of carbon to improve the current discharge during EPMA. Typical microstructures are shown in Figure 5.
Elements in high concentrations were measured using a JEOL JXA 8200L (trademark of Japan Electron Optics Ltd., Tokyo) electron probe X-ray microanalyzer (EPMA) equipped with five Wavelength Dispersive Detectors (WDD). An acceleration voltage of 15 kV and a probe current of 20 nA were used. The Duncumb-Philibert ZAF correction procedure supplied with the probe was applied. The following standards were used for EPMA: wollastonite CaSiO3 for Si and Ca, corundum Al2O3 for Al, periclase MgO for Mg, hematite Fe2O3 for Fe, InAs for As, CuFeS2 for S, ZnO for Zn, PbSiO3 glass for Pb, pure metal standards (Cu, Au, Ag) for Cu and minor elements. All standards were supplied by Charles M. Taylor Co., Stanford, CA, USA; PbO-SiO2 K456 glass from NIST for Pb. For slag and matte phases, probe diameters of 20-50 micron were used to decrease the scatter of EPMA results due to dendrite formation during quenching and to limit the loss of volatile species under the electron beam. Laser Ablation Inductively Coupled Plasma Mass Spectrometry (LA-ICPMS) has been used to measure the concentrations of minor elements (Ag, Au) in the slag phase that were below the detection limit of EPMA. The LA-ICPMS is comprised of NWR193 Laser Ablation System (Electro Scientific Industries Inc, Portland, USA) and an Agilent 8800 ICP-MS (Agilent Technologies, Santa Clara, USA). Two certified synthetic glass reference materials NIST610 and NIST612 were used as standards. If required for increased accuracy, additional samples with high (>1%) concentration of certain elements in slag, measured with EPMA, were used as references for other samples where these elements could only be detected by LA-ICPMS.
3. Results
3.1. Revenue Calculations
To calculate revenue for Cases 1 and 2, the same prices listed in Table 1 were used for Cu, Ag, and Au. Price premiums were assumed to be zero. Recoveries for modern smelters exceed payables. Recoveries for copper and gold vary based on factors like chemistry, physics, and management. When optimized, these recoveries primarily depend on slag generation per unit copper. More slag means higher losses, even with slag cleaning equipment. Lower copper concentrate grades increase slag-forming impurities (Fe, SiO2, Al2O3), leading to the downward trend as shown in Figure 2. Gold and silver recoveries also inversely correlate with slag amount, and hence, with copper concentrate grade in the feed, but are largely independent of their own concentrations (Figure 2). The difference between payable and recovery referred to as "free metal” in this study becomes one of the main revenue source under conditions of low TC/RC and premiums.
For Case 1, using a Flash Furnace, the procurement team selected Concentrate 1 due to its 25% Cu content, a typical target for Flash Smelters. With recoveries of 98.5% for Cu, 98.9% for Ag, and 99.2 % for Au, 'free metal' value is (2743.6 – 2650.0) = 93.7 US$/tonne. By-product revenue from sulfuric acid, assuming 95% recovery and a $70/tonne price, is $69.2/tonne of dry concentrate. Operating at 230 t/h for 24/7, this yields $328 million in annual revenue under unfavorable conditions of zero TC/RC and premium.
For Case 2, using Bottom Blown smelting, the team optimized for maximum “free metal” by blending concentrates. While targeting 21% Cu, they imposed impurity limits of <0.25% As, <0.1% Sb, <0.035% Bi, <0.03% Cd, F, Se, and <0.0005% Hg. This blending approach, similar to Wang et al. [27], uses industry standards to set limits (the Nonferrous Metals Industry Standard YS/T 318-200X). The resulting blend (Table 1) is 43% Concentrate 1, 30% Concentrate 2, 3% Concentrate 3, and 24% Concentrate 4. With recoveries of 97.5% for Cu, 97.8% for Ag, and 98.2 % for Au, 'free metal' value is $108.6/tonne, higher than Case 1. H2SO4 revenue is $64.9/tonne. At 150 t/h, annual revenue is $228 million under unfavorable conditions of zero TC/RC and premium. Although higher “free metal” values are possible, throughput, linked to furnace capacity, remains a dominant economic factor. Bottom Blown Furnace capacities have steadily increased since 2000, but remained lower compared to largest Flash Smelters [17].
While this study does not delve into capital costs (higher for Case 1), oxygen enrichment and concentrate drying costs (higher for Case 1 [28]), campaign life, refractory replacement, or furnace availability, these factors will significantly impact annual revenue. A common criticism of bath type of smelters is higher operating costs due to tuyeres blockage, but this may be solved in future using jetting regime of injection [29].
For a custom smelter, the strategy of concentrate purchase requires key engineering parameters: recovery functions for Cu, Au, and Ag, and maximum acceptable impurity concentrations in the blended concentrate. The next section will outline a potential procedure for obtaining these values.
3.2. Results of Thermodynamic Calculations
Mass and energy balances estimated for concentrate blends from Table 1 and process conditions in Table 2 are presented in Figure 6 (Case 1) and Figure 7 (Case 2).
A flowsheet's recirculation ratio for an element is defined as the mass flow in all recycling streams at steady-state conditions (i.e., smelter dust, converter slag, converted dust, slag concentrate, anode slag, and anode furnace dust) divided by the total input of that element. Recirculation generally reduces throughput and can lead to element accumulation in the process.
Case 2's lower recoveries are attributed to the use of a concentrate blend with lower copper content, resulting in higher slag production per unit of copper. This does not indicate technological inefficiency; as demonstrated in Section 3.1, the gap between recovery and payables allows for extracting more value from "free metal." Recoveries for Ag and Au into anode copper are higher, compared to Cu. This analysis does not include losses copper electrorefining and anode slime treatment, but the additional at those stages are typically considered small [30]. The same 70% recovery efficiency was assumed for Cu, Au, and Ag in the slag-cooling, crushing, and flotation process for both Case 1 and Case 2. This value for copper was achieved using xanthates [31], but reliable information for Au and Ag was not found. More environmentally friendly frothers are currently being developed [32] but they did not yet reach the recovery of 70% for copper. Higher concentrations of these metals in discard slag are due to initially higher entrainment of matte droplets in slags with suspended solids, as observed in Case 2. This is evident in micrographs of quenched Flash furnace and Bottom-blown furnace slags [24,33]. In practice, the efficiency of slag-cooling, crushing, and flotation may vary between Case 1 and Case 2, but comprehensive literature on this topic is lacking. Alternative methods of slag cleaning are proposed as well, for instance using aluminothermic reactions from recycled LIBs [34], or sulfidation treatment [35], so the recoveries may further increase in near future.

Table 3.
Calculated compositions of imporant streams in copper smelting flowsheets: Case 1 (Figure 6) and Case 2 (Figure 7). Flows of Cd, F, Hg, Se were not modelled.
| Compositions | Cu, wt% |
Ag ppm |
Au ppm |
Fe, wt% |
O, wt% |
S, wt% |
SiO2, wt% |
Al2O3, wt% |
CaO, wt% |
MgO, wt% |
| Discard slag Case 1 | 0.6 | 0.7 | 0.1 | 43.9 | 14.4 | 0.4 | 31.2 | 4.1 | 2.5 | 1.6 |
| Discard slag Case 2 | 0.8 | 4.7 | 0.7 |
45.0 | 15.5 | 0.4 | 29.0 | 4.0 | 1.8 | 1.7 |
| Anode copper Case 1 | 99.5 | 161.0 | 15.8 | <0.001 | 1490 ppm | 20 ppm | <0.001 | <0.001 | <0.001 | <0.001 |
| Anode copper Case 2 | 99.0 | 679.3 | 124.4 | <0.001 | 1460 ppm | 8 ppm | <0.001 | <0.001 | <0.001 | <0.001 |
| Smelter dust Case 1 | 11.2 | 19 | 2 | 12.8 | 40.0 | 17.5 | 3.9 | 1.2 | 0.3 | 0.5 |
| Smelter dust Case 2 | 8.2 | 68 | 10 | 11.6 | 37.8 | 15.4 | 4.3 | 1.1 | 0.4 | 0.4 |
| Flowsheet re-circulation Case 1, % | 20 | 15 | 15 | 20 | 16 | 10 | 10 | 13 | 65 | 10 |
| Flowsheet re-circulation Case 2, % | 14 | 10 | 7 | 11 | 6 | 4 | 12 | 7 | 9 | 7 |
| Compositions (continued) | Pb, wt% |
Zn, wt% |
Ni, wt% |
As, wt% |
Sb, wt% |
Bi, wt% |
Mol As/(Bi +Sb | Cu recov., % | Ag recov., % | Au recov., % |
| Discard slag Case 1 | 0.1 | 0.8 | <0.01 | 0.4 | 0.03 | 0.01 | ||||
| Discard slag Case 2 | 0.5 | 1.0 | 0.05 | 0.2 | 0.07 | 0.01 | ||||
| Anode copper Case 1 | 830 ppm | 9 ppm | 410 ppm | 930 ppm | 140 ppm | 840 ppm | 2 | 98.5 | 98.9 | 99.2 |
| Anode copper Case 2 | 480 ppm | 9 ppm | 2170 ppm | 2780 ppm | 705 ppm | 1010 ppm | 3 | 97.5 | 97.8 | 98.2 |
| Tolerable levels, ppm [36,37] | 4000 | 100 | 3000 | 500-1500 | 350 | 300 | >2 | |||
| Smelter dust Case 1 | 0.3 | 0.4 | <0.001 | 9.6 | 0.02 | 2.2 | ||||
| Smelter dust Case 2 | 2.1 | 0.7 | 0.03 | 12.6 | 0.06 | 5.2 | ||||
| Flowsheet re-circulation Case 1, % | 290 | 40 | 80 | 570 | 30 | 1100 | ||||
| Flowsheet re-circulation Case 2, % | 200 | 25 | 50 | 400 | 15 | 1030 |
3.3. Analysis of Accuracy of Thermodynamic Predictions
The estimation of entrainment coefficients for matte in slag is often based on the difference between measured and calculated Cu concentrations. Optimal Fe/SiO2 ratio in slag depends on the matte grade, P(SO2) in the system, and the concentrations of Al2O3, CaO and MgO. The losses of Au and Ag are commonly attributed to matte entrainment, a claim that needs testing. Overall, 25 multicomponent (17 elements) gas-slag-matte-spinel experiments have been performed in the range of temperature 1250-1300 °C and matte grades from 50 to 75 wt.% Cu. All results are provided in Supplementary data.
Due to the large number of elements and phases present in the experiments, it is impractical to compare model predictions with experimental data using binary or ternary phase diagrams. A methodology for comparison has been developed and discussed in a recent publication [26]. The composition of each phase can be considered as coordinates in multicomponent space. As an example, experimentally measured compositions for experiment #23 are provided in Table 4. For each experiment, a FactSage® calculation was performed at the bulk composition within the shape formed by the phases in equilibrium. This is marked as the "FactSage Input" row in Table 4. In the case of a three-phase equilibrium, the shape is a triangle in multicomponent space. The composition within the triangle is selected by assigning proportions to the experimentally observed phases, as shown in the last column of Table 4. These proportions may be close to those in the experiment but do not have to be exact values. Since the procedure respects the Gibbs phase rule, the calculated compositions of the phases do not change with varying proportions. However, temperature, total pressure, and P(SO2) must be fixed to match the experimental conditions. The latter was adjusted by adding an excess SO2/N2 mixture to the FactSage® input table, forming a gas phase with the target P(SO2). The amount of oxygen was not measured by EPMA, so it was also adjusted to represent the target oxidation/reduction conditions in the system. In this work, the selected target was the matte grade, meaning the wt.% Cu in the matte. A summary of the conditions is provided in Figure 8. After the calculation, the accuracy of the predictions was compared by examining the difference in composition between the phases measured in the experiment and those predicted by FactSage®. The results for the Fe/SiO2 ratio, wt.% Cu, and ppms of Au and Ag in the slag are provided in Figure 9.
The predicted chemical solubility of Cu in the slag is within 0.2 wt. % of the experimental uncertainty (Figure 10). These values correlate with the wt.% S in the slag. However, a small but systematic deviation has been observed for the predicted Fe/SiO2 ratio (Figure 10). This indicates that when planning operations using FactSage®, corrections should be made. For slags with > 5 wt% Al2O3, the predicted Fe/SiO2 in equilibrium with spinel must be corrected by +0.15. For a given Fe/SiO2, the current model overestimates the proportion of spinel, as illustrated in Table 4, last row, last column. For slags with > 2 wt.% MgO, the predicted Fe/SiO2 in equilibrium with spinel must be corrected by -0.10. For Ag and Au, the predictions were confirmed to be accurate within the uncertainty of the experimental tests. A detailed analysis of the distribution of other elements is beyond the scope of this study, but the results are reasonable and provided in Supplementary data.
These results will be used to inform further fundamental experimental and modeling activities within the consortium program to improve predictions.
4. Discussion
Let's analyze the thermodynamic calculations presented in Table 3. According to predictions for concentrate blends selected in Section 2.1, higher recirculation rates are observed in Case 1 compared to Case 2 for all elements. This is primarily due to two factors: higher mechanical dust carryover from the Flash Smelting Furnace in Case 1 and a lower matte grade selected for smelting in Case 1 (70 vs 74 wt.% Cu). The impact of the second factor is that lower matte grades result in the transfer of more iron to the converting stage, where it is turned into slag and must be recycled back to the smelter. Historically, high matte grades were avoided due to difficulties in maintaining a fully liquid slag under more oxidizing conditions and to prevent copper losses through chemical solubility and the entrainment of matte droplets. However, advancements in bath smelting technologies, such as the tolerance to solid spinel and the implementation of slag crushing and flotation, have allowed for higher matte grades, reducing the load on the converting stage. The higher recirculation rate in Case 1 may contribute to the selection of higher-grade concentrate blends for treatment in Flash Furnaces. Dust and high-copper converter slag do not add calorific value to the process, making it challenging to maintain the energy balance.
Regarding energy balance, the value of -15 MW obtained for Case 2 smelting is slightly less exothermic than expected based on a simple scaling of Case 1's value using throughput data: -30 MW / (230 t/h) × (150 + 13 t/h) = -21 MW. This is reasonable since Bottom-Blown smelter operates at lower temperature, reducing radiation heat loss. Flash Smelter shafts also have active water-cooling systems, which bath smelters usually don’t use. There are several factors that should make Case 2 smelting process relatively more exothermic: higher operating matte grade, lower amounts of recirculated dust and converter slag, as well as higher Fe/SiO2 ratio requiring less silica flux to melt. Factors that contribute to Case 2 being less exothermic are high moisture content and lower oxygen enrichment. To achieve the -15 MW value in Case 2, it was necessary to introduce a lower oxygen efficiency of 90% compared to 99% in Case 1. This may not be the final conclusion, and other factors, such as the addition of cool revert or recycle materials, could be influencing the energy balance.
Importantly, the copper recovery values for Cu, Ag and Au obtained in Table 3 align well with those used for revenue calculations and shown in Figure 2.
For the selected concentrate blend in Case 2, the resulting concentrations of As, Sb, and Bi in the anode copper exceed tolerable levels (Table 3). Bi is also too high in Case 1. This indicates that the generated dust needs to be periodically leached [38]. Utilizing calcium ferrite slags at the converting stage can revert more As and Sb back to the smelting process, reducing their concentration in anode copper. However, this also means that arsenic will accumulate in discard slag tailings. Arsenic in vitreous slag matrices can be quite stable under environmental conditions but using it as a destination for arsenic is a complex issue with ongoing discussions among researchers, policymakers, and businesses. Recent research has demonstrated the application of calcium ferrite in the ISACONVERT® process for bath smelting [39,40]. However, there is limited literature available on the use of this slag chemistry in bottom-blown converters.
5. Conclusions
This study presented the operating dynamics of a custom copper smelters. As the number of quality deposits of copper are decreasing, the custom smelters are adopting an advanced level of operational excellence to improve the economy of copper production. At the core of a successful custom smelter lies a sophisticated value-added blending model for an optimum performance of copper making. The model maximizes the revenue streams while maintaining the operating limits of the plant. By leveraging an understanding of recovery curves and maximum tolerable levels of impurity elements, authors have demonstrated the potential for increasing “free metal” value. Specifically, our findings highlight the benefits of blending low-grade copper concentrates (< 20 wt% Cu) with higher-grade concentrates (25 wt% Cu) to maximize overall efficiency.
To further enhance the process, future research should focus on advanced modeling techniques. Refining computational tools based on advanced thermodynamics should rely both on laboratory-controlled experiments and calibration of kinetic factors using real-time process data. Maximum tolerable impurity levels of As, Sb can be increased either by investments in dust leaching equipment, or by exploring calcium-ferrite slag chemistries at the converting stage.
Supplementary Materials
The following supporting information can be downloaded at the website of this paper posted on Preprints.org, Tables S1-S5: Experiments #1-25; Figures S1-S5: FactSage® predictions for experiments, Figures S6-S10: Case 1-Case2, Smelter, Converter, Anode refining.
Author Contributions
For research articles with several authors, a short paragraph specifying their individual contributions must be provided. The following statements should be used “Conceptualization, N.T; methodology, E.J. and D.S.; model development, D.S.; experimental study, S.S.; formal analysis, D.S.; investigation of market conditions, N.T.; writing—original draft preparation, D.S.; writing—review and editing, E.J.; visualization, D.S. and S.S.; project administration, E.J.; funding acquisition, N.T. All authors have read and agreed to the published version of the manuscript.
Funding
This research was funded by Rio Tinto.
Data Availability Statement
The original contributions presented in the study are included in the article/supplementary material, further inquiries can be directed to the corresponding author.
Acknowledgments
In this section, you can acknowledge any support given which is not covered by the author contribution or funding sections. This may include administrative and technical support, or donations in kind (e.g., materials used for experiments).
Conflicts of Interest
Authors have an academic interest in studying the impact of high grade concentrates on the performance of custom smelters.
References
- Pickens, N.; Griffin, R.G.; Joannides, E.; Liu, Z. Securing copper supply: no China, no energy transition. Horizons Wood Mackenzie 2024, 1–11. [Google Scholar]
- Zhou, H.; Liu, G.; Zhang, L.; Zhou, C.; Mian, M.M.; Cheema, A.I. Strategies for arsenic pollution control from copper pyrometallurgy based on the study of arsenic sources, emission pathways and speciation characterization in copper flash smelting systems. Environmental Pollution (Oxford, United Kingdom) 2021, 270, 116203. [Google Scholar] [CrossRef] [PubMed]
- Arias, L.; Balladares, E.; Parra, R.; Sbarbaro, D.; Torres, S. Sensors and Process Control in Copper Smelters: A Review of Current Systems and Some Opportunities. Minerals 2021, 11, 1. [Google Scholar] [CrossRef]
- Bale, C.W.; Belisle, E.; Chartrand, P.; Decterov, S.A.; Eriksson, G.; Gheribi, A.E.; Hack, K.; Jung, I.H.; Kang, Y.B.; Melancon, J.; et al. FactSage thermochemical software and databases, 2010-2016. CALPHAD 2016, 54, 35–53. [Google Scholar] [CrossRef]
- Söderström, U. Copper smelter revenue stream. In Proceedings of the Boliden Capital Markets Day; 2008; pp. 1–25. [Google Scholar]
- Payable metal and revenue issues in relation to royalty applying to prescribed and particular minerals. 2010.
- Salomon-de-Friedberg, H.; Robinson, T. Tackling impurities in copper concentrates. In Proceedings of the Teck Resources Limited; 2015. [Google Scholar]
- Jak, E.; Shevchenko, M.; Shishin, D.; Nekhoroshev, E.; Chen, J.; Hayes, P. University Research on molten slags, matte, speiss and metal systems for high temperature processing. In Proceedings of the Molten 2024, Brisbane, 2024. [Google Scholar]
- Shishin, D.; Decterov, S.A.; Jak, E. Thermodynamic assessment of slag-matte-metal equilibria in the Cu–Fe–O–S–Si system. J. Phase Equilib. Diff. 2018, 39, 456–475. [Google Scholar] [CrossRef]
- Shishin, D.; Hidayat, T.; Fallah Mehrjardi, A.; Hayes, P.C.; Decterov, S.A.; Jak, E. Integrated experimental and thermodynamic modelling study of the effects of Al2O3, CaO and MgO on slag–matte equilibria in the Cu–Fe–O–S–Si–(Al, Ca, Mg) system. J. Phase Equilib. Diff. 2018, 40, 445–461. [Google Scholar] [CrossRef]
- Shishin, D.; Hidayat, T.; Chen, J.; Hayes, P.C.; Jak, E. Experimental Investigation and Thermodynamic Modelling of the Distributions of Ag and Au between Slag, Matte and Metal in the Cu-Fe-O-S-Si System. Journal of Sustainable Metallurgy 2018, 5, 240–249. [Google Scholar] [CrossRef]
- Shishin, D.; Tripathi, N.; Babaian, I.; Jak, E. The Link Between Slag Chemistry and Arsenic Flows in Primary Copper Smeltin. In Proceedings of the COM2 4381.
- Shishin, D.; Prostakova, V.; Jak, E. Review and thermodynamic analysis of As (arsenic) in copper smelting liquid mattes, metals, slags, speiss and solid phases. In Proceedings of the COPPER 2022, Santiago, Chile, 2022.
- Alvear Flores, G.R.F.; Löbbus, M.; Springub, B.; Fallah-Mehrjardi, A.; Tappe, A. Sulfide Smelting: Thirty-Five Years of Continuous Efforts to Find New Value Adding Solutions. In Proceedings of the Extraction 2018, Cham, 2018//, 2018; pp. 39-56.
- Alexander, C.; Johto, H.; Lindgren, M.; Pesonen, L.; Roine, A. Comparison of environmental performance of modern copper smelting technologies. Cleaner Environmental Systems 2021, 3, 100052. [Google Scholar] [CrossRef]
- Zhao, B.; Liao, J. Development of Bottom-Blowing Copper Smelting Technology: A Review. Metals (Basel, Switzerland) 2022, 12, 190. [Google Scholar] [CrossRef]
- Liu, Z.; Xia, L. The practice of copper matte converting in China. Miner. Process. Extr. Metall. 2019, 128, 117–124. [Google Scholar] [CrossRef]
- Swinbourne, D.R.; Kho, T.S. Computational Thermodynamics Modeling of Minor Element Distributions During Copper Flash Converting. Metall. Mater. Trans. B 2012, 43, 823–829. [Google Scholar] [CrossRef]
- Kaur, R.; Nexhip, C.; Krippner, D.; George-Kennedy, D.; Routledge, M. Kennecott-Outotec ‘double flash’ technology after 16 years. In Proceedings of the 13th International Flash Smelting Congress, Zambia, Oct 2011, 2011.
- Jak, E.; Nexhip, C.; George-Kennedy, D.P. Calcium ferrite slag phase chemistry control used in continuous flash converting. In Proceedings of the Nickolas themelis symposium on pyrometallurgy and process engineering, Santiago Chile; 2013; pp. 503–522. [Google Scholar]
- Wang, Q.; Guo, X. Investigation of the Oxygen Bottom Blown Copper Smelting Process. In Proceedings of the Extraction 2018, Cham, 2018//, 2018; pp. 445-461.
- Wang, S.; Guo, X. Thermodynamic Modeling of Oxygen Bottom-Blowing Continuous Converting Process. 2018; pp. 573-583.
- Kaur, R.; Nexhip, C.; Wilson, M.; George-Kennedy, D. Minor element deportment at the Kennecott Utah Copper Smelter. In Proceedings of the Copper 2010, Hamburg, Germany; 2010; pp. 2415–2432. [Google Scholar]
- Xie, S.; Yuan, X.; Liu, F.; Zhao, B. Control of Copper Content in Flash Smelting Slag and the Recovery of Valuable Metals from Slag-A Thermodynamic Consideration. Metals (Basel, Switzerland) 2023, 13, 153. [Google Scholar] [CrossRef]
- Sineva, S.; Shishin, D.; Starykh, R.; Hayes, P.C.; Jak, E. Equilibrium Distributions of Pb, Bi, and Ag between Fayalite Slag and Copper-Rich Metal, Calcium Ferrite Slag and Copper-Rich Metal. Thermodynamic Assessment and Experimental Study at 1250 °C. Journal of Sustainable Metallurgy 2021, 7, 569–582. [Google Scholar] [CrossRef]
- Khartcyzov, G.; Kleeberg, C.; Shevchenko, M.; Shishin, D.; Jak, E. Analysis of slag chemistry in WEEE smelting using experimental and modelling study of the “CuO0.5”-ZnO-FeO-FeO1.5-CaO-SiO2-AlO1.5 system in equilibrium with Cu metal. Ceramics International 2024. [CrossRef]
- Wang, G.; Zhou, S.; Li, B.; Wei, Y. Copper Concentrate Blending and Melting Prediction Based on Particle Swarm Optimization Algorithm. Jom 2023, 75, 4350–4360. [Google Scholar] [CrossRef]
- Hannu, J.; Ali, B.; Lauri, P. Detailed OPEX Comparison of Modern Copper Smelting Technologies Using HSC-SIM Modelling. 2019.
- Parra, R.; Kapusta, J.P. Early Concept and Development of an “Intelligent Tuyere” for Copper Bath Smelting and Converting. Cham, 2023; pp. 789-799.
- Moosavi-Khoonsari, E.; Tripathi, N. Gold Recovery from Smelting Copper Sulfide Concentrate. Preprints 2024, 2024091473. [Google Scholar] [CrossRef]
- Pavez, O.; Herrera, P.; González, M.T.; Rivera, O. Copper Recovery Through Smelter Slag Flotation in Atacama, Chile: An Industrial Case Study. Ingeniería e Investigación 2021. [CrossRef]
- Nuorivaara, T.; Klemettinen, A.; Serna-Guerrero, R. Improving the flotation recovery of Cu from flash smelting slags by utilizing cellulose-based frother formulationss. Minerals Engineering 2022, 181, 107522. [Google Scholar] [CrossRef]
- Zhao, B.; Liao, J. Development of Bottom-Blowing Copper Smelting Technology: A Review. Metals 2022, 12, 190. [Google Scholar] [CrossRef]
- Rinne, T.; Klemettinen, A.; Klemettinen, L.; Ruismäki, R.; O’Brien, H.; Jokilaakso, A.; Serna-Guerrero, R. Recovering Value from End-of-Life Batteries by Integrating Froth Flotation and Pyrometallurgical Copper-Slag Cleaning. Metals 2022, 12, 15. [Google Scholar] [CrossRef]
- Cao, S.; Liu, Z.; Lu, X.; Zhang, L.; Li, Q.; Xia, L. The Phase Transition and Element Distribution of Copper Smelting Slag in the Cooling—Sulfidation Process. Metallurgical and Materials Transactions B 2023, 54, 969–979. [Google Scholar] [CrossRef]
- Moats, M.S.; Aslin, N.; Pranowo, A.; Alvear Flores, G.R.F. Arsenic's behaviour and benefits in copper electrorefining. In Proceedings of the COM 2014, 53rd Annual Conference of Metallurgists, Vancouver, 2014.
- Larouche, P. Minor elements in copper smelting and electrorefining. Ph.D. thesis, McGill University, Montreal, 2001.
- Tan, P.; Woodall, P.; Telford, P. ESP Dust Recovery Process Test Works, Plant Trial, Commissioning, Operations and Metallurgical Performance. 2012, 891-899. [CrossRef]
- Joubert, H.; Mc Dougall, I.; Villiers, G.; Nikolic, S.; Dyussekenov, N.; Eggert, M. Design, Construction and Performance of the Copper Cooling System Installed in the First ISACONVERT™ Copper Converting Furnace. In Proceedings of the Copper 2022, Santiago, Chile; 2023; pp. 182–199. [Google Scholar]
- Mwanza, T.; Eggert, M.; Chirwa, W.; Prince, M.; Dyussekenov, N.; Marschall, D. Kansanshi Copper Smelter ISACONVERT™ Furnace Tapping System Design, Operation, and Improvements. In Furnace Tapping; 2022; pp. 233-244.
Figure 1.
World’s treatment charges and refining charges for custom smelters based on 25% Cu in concentrate. Compiled using data source from FastMarkets and Wood Mackenzie [1]. Metric tonnes are used in this study, i.e. 1 tonne = 1000 kg = 2204.6 lbs.
Figure 1.
World’s treatment charges and refining charges for custom smelters based on 25% Cu in concentrate. Compiled using data source from FastMarkets and Wood Mackenzie [1]. Metric tonnes are used in this study, i.e. 1 tonne = 1000 kg = 2204.6 lbs.
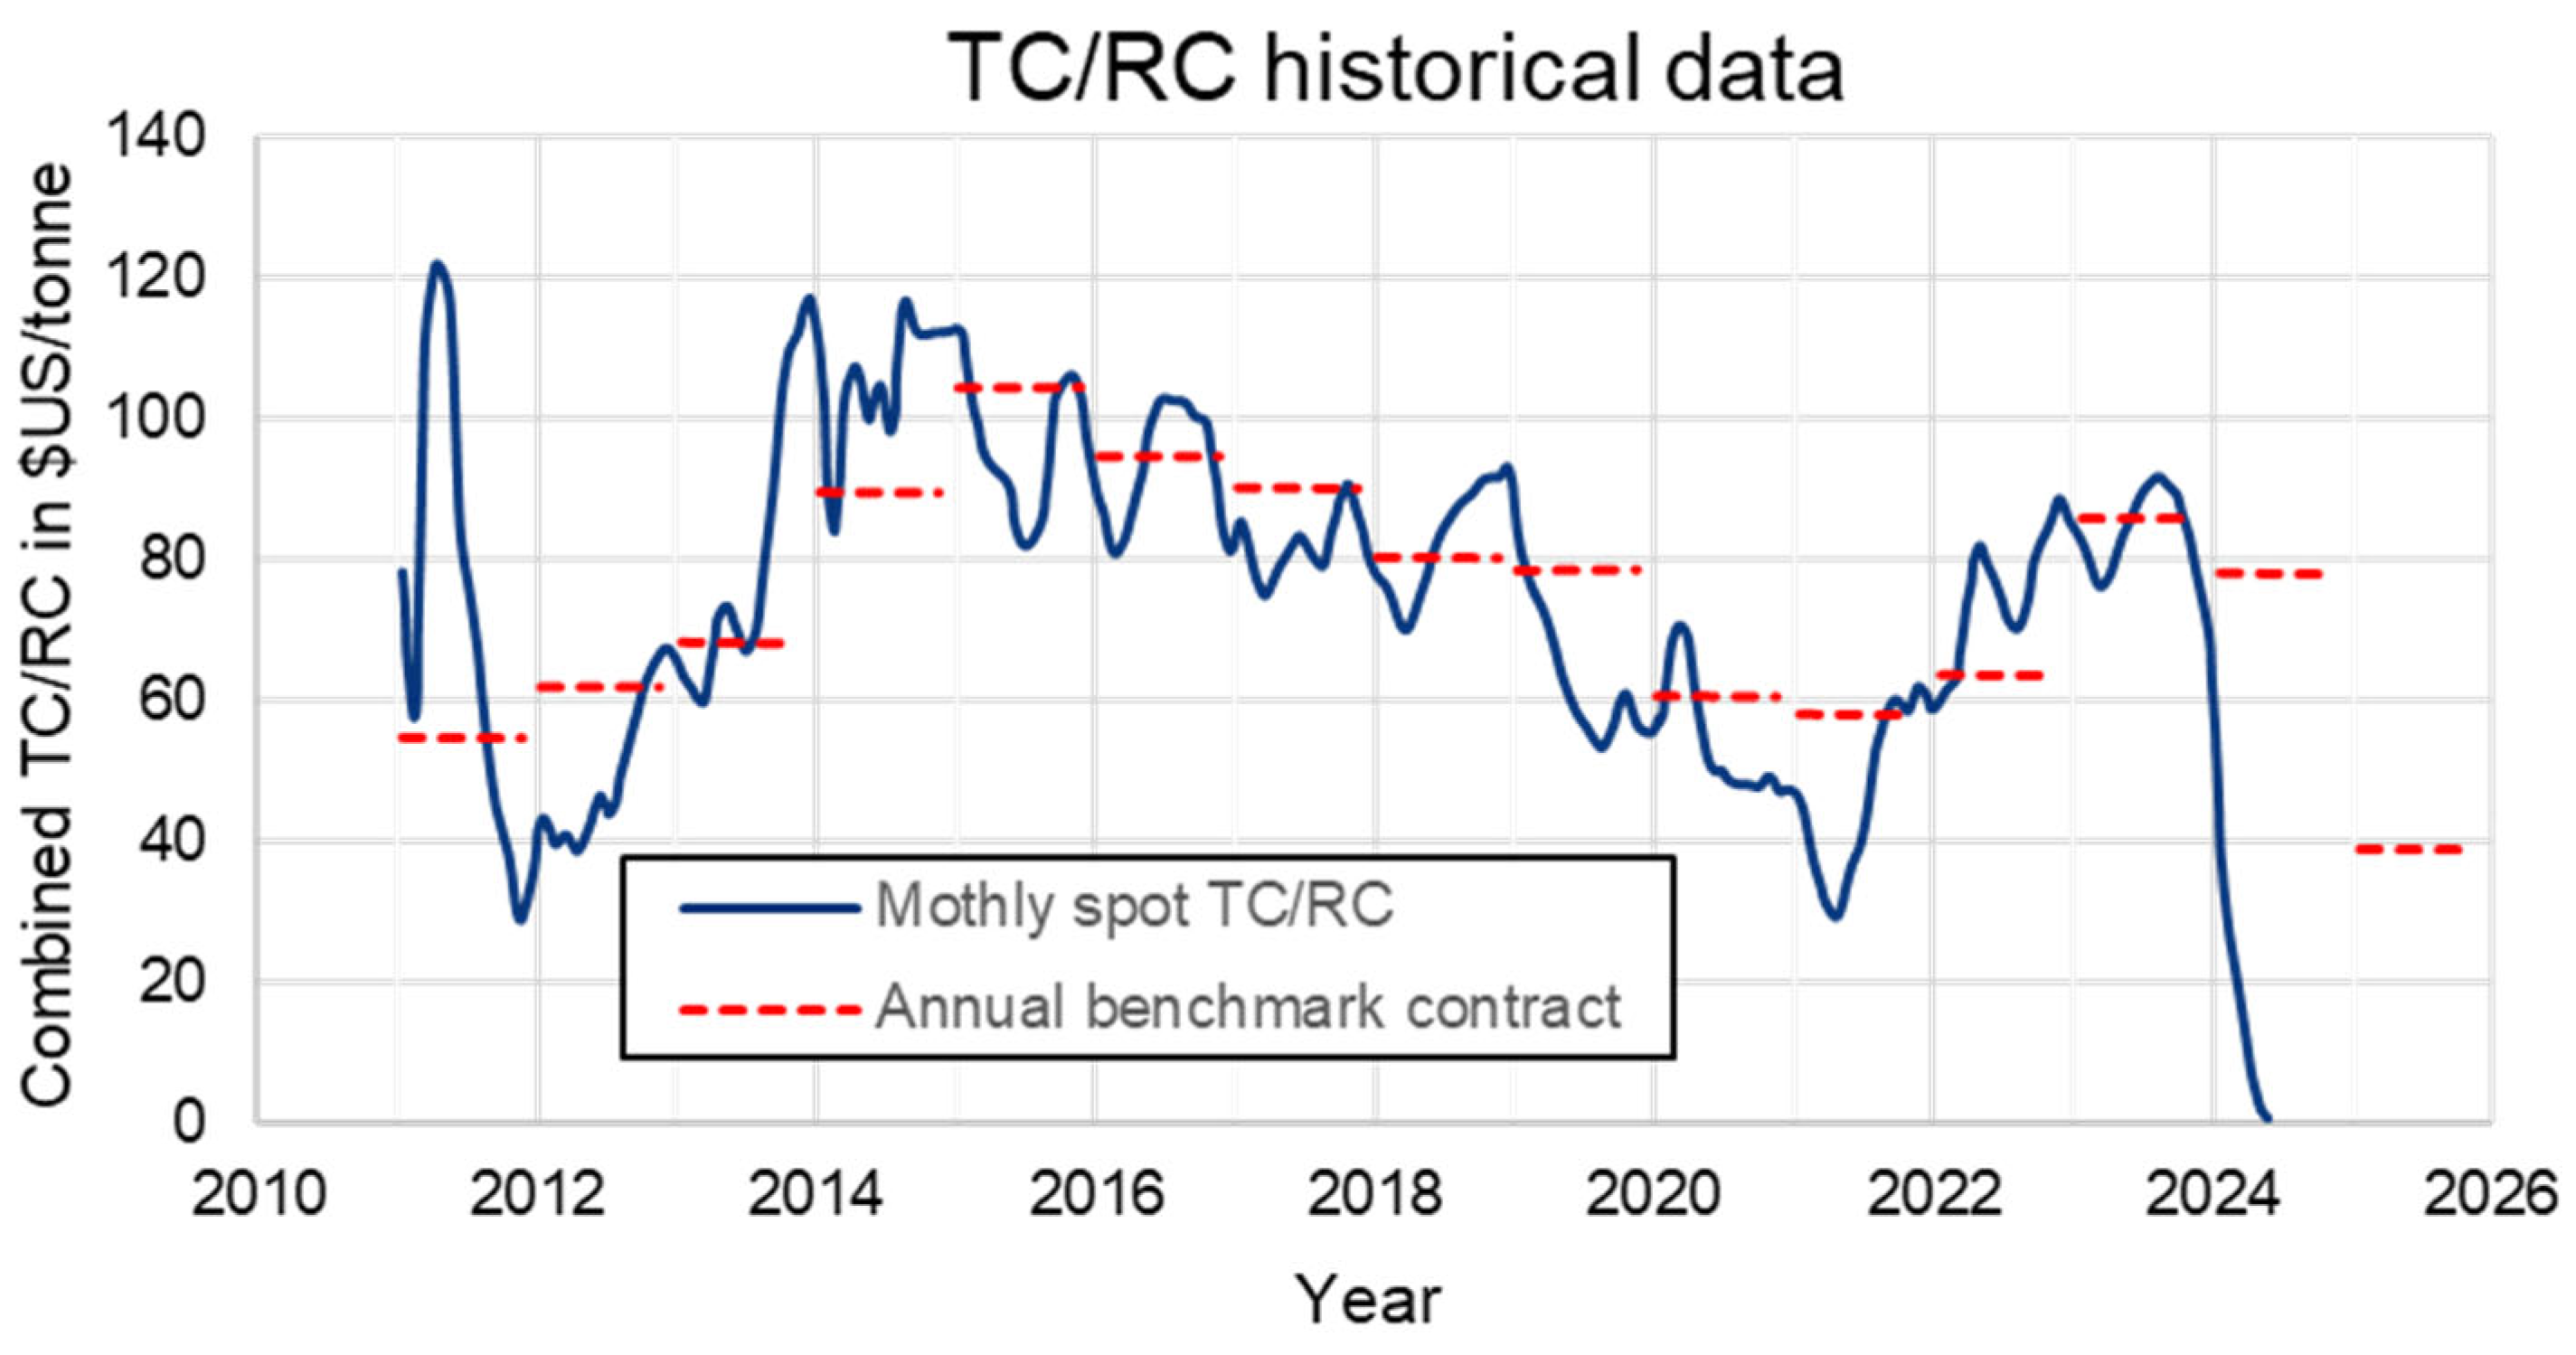
Figure 2.
Examples of payables and recovery functions for copper and gold used analysis of metal. Circles are typical values for copper industry, wide lines show recovery functions based on discussions during smelter surveys, diamond symbols are calculated using thermodynamic model of this study (see Section 3.2 below).
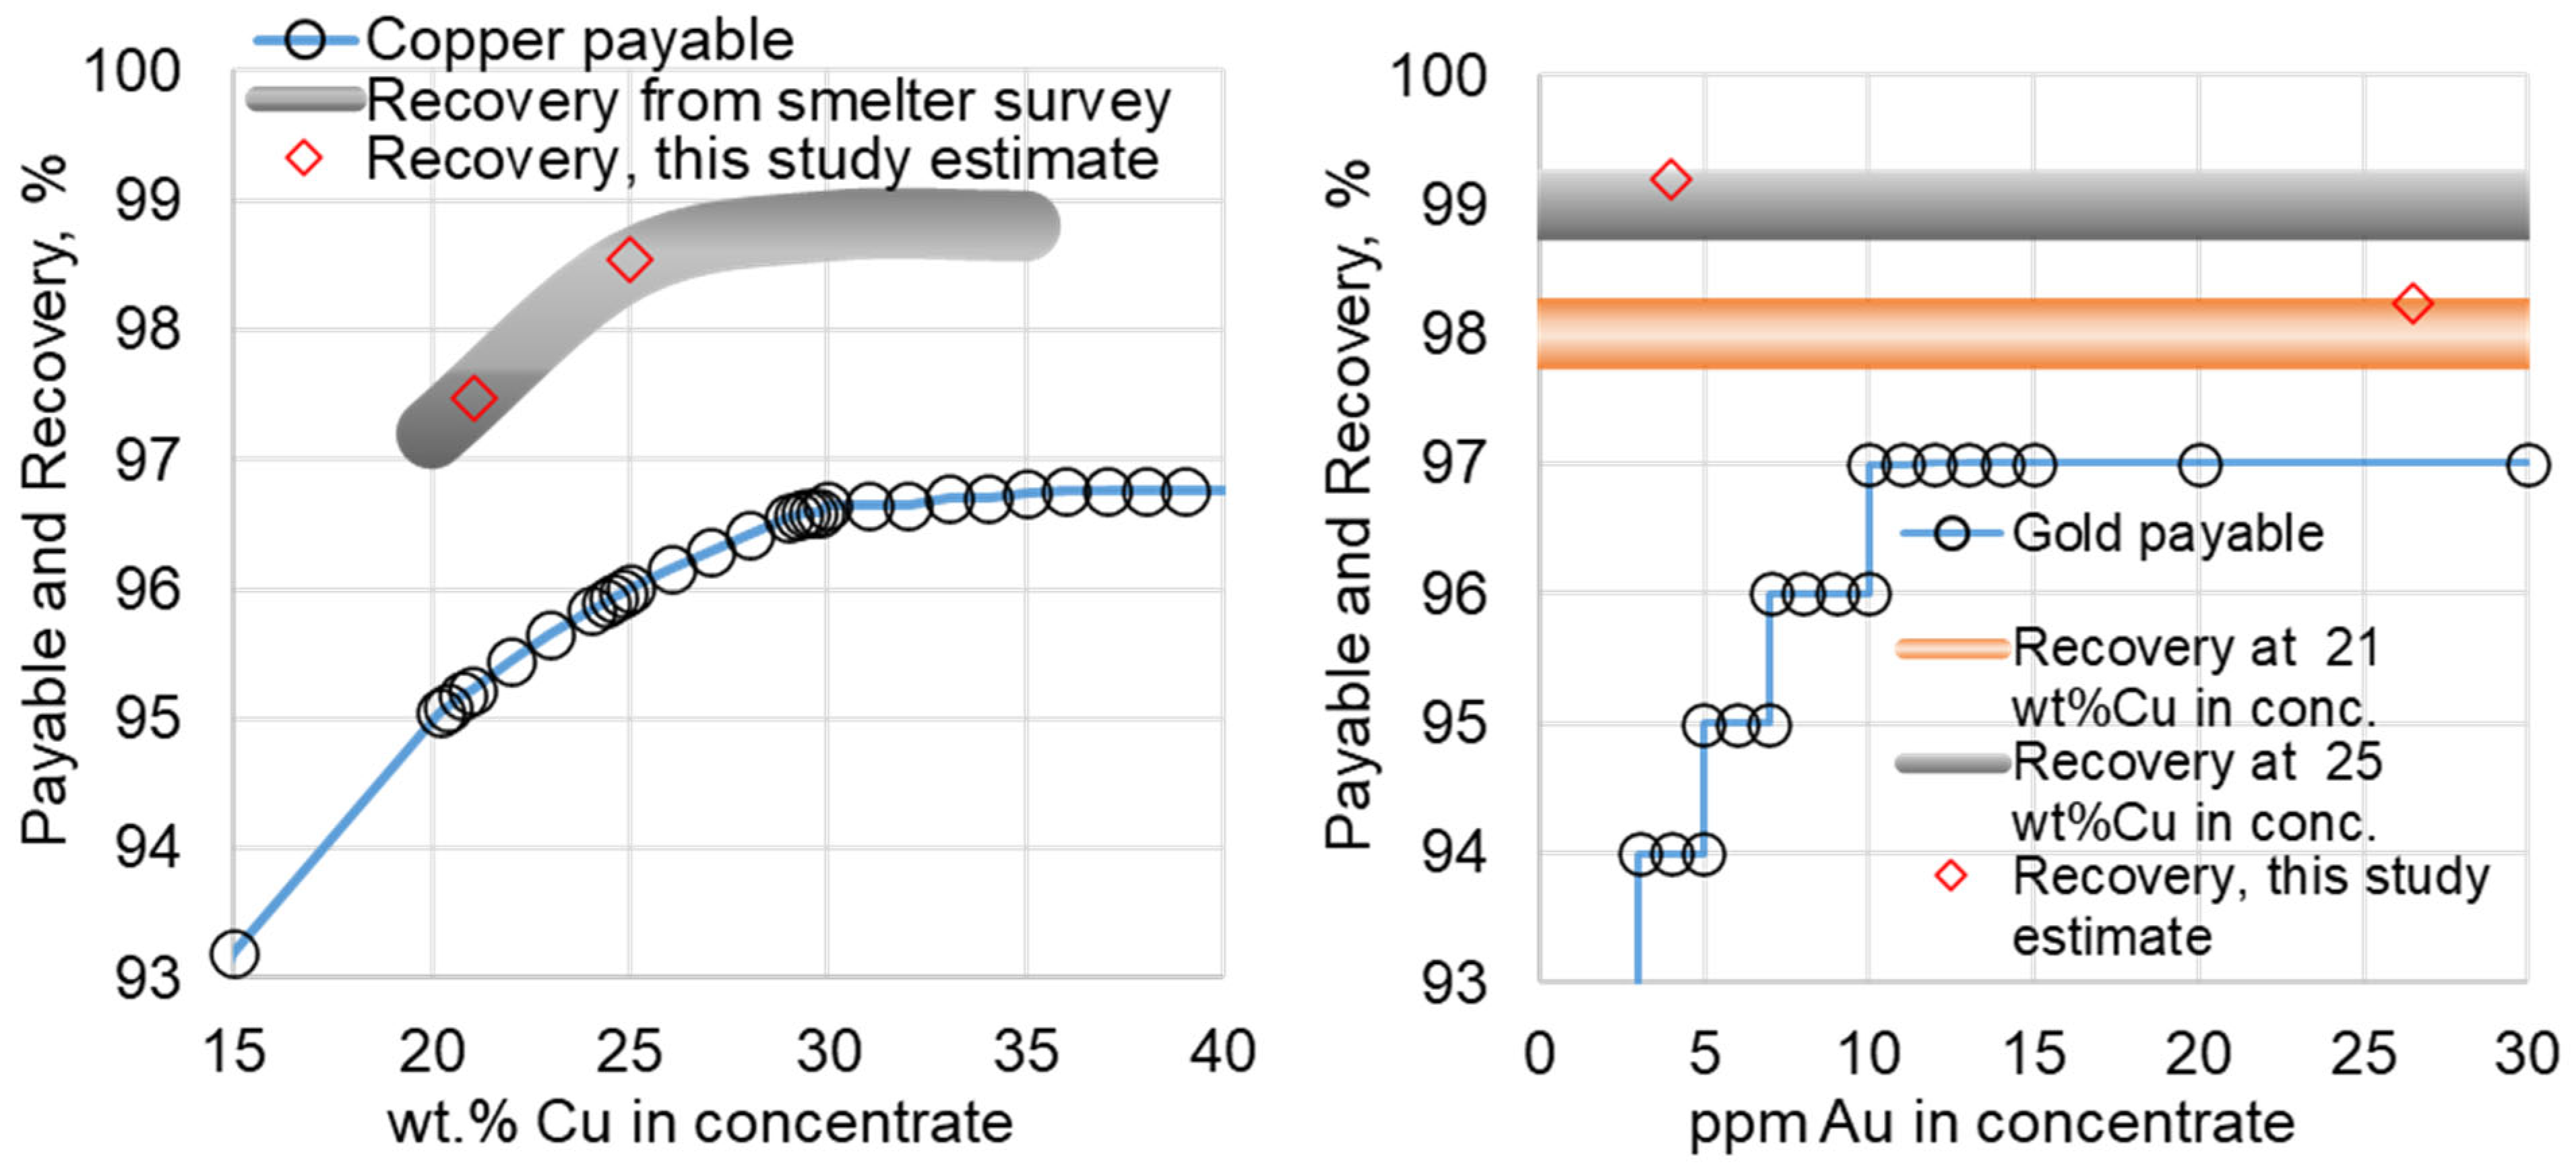
Figure 3.
A portion of Excel Macro code initiating the calculation by FactSage®.
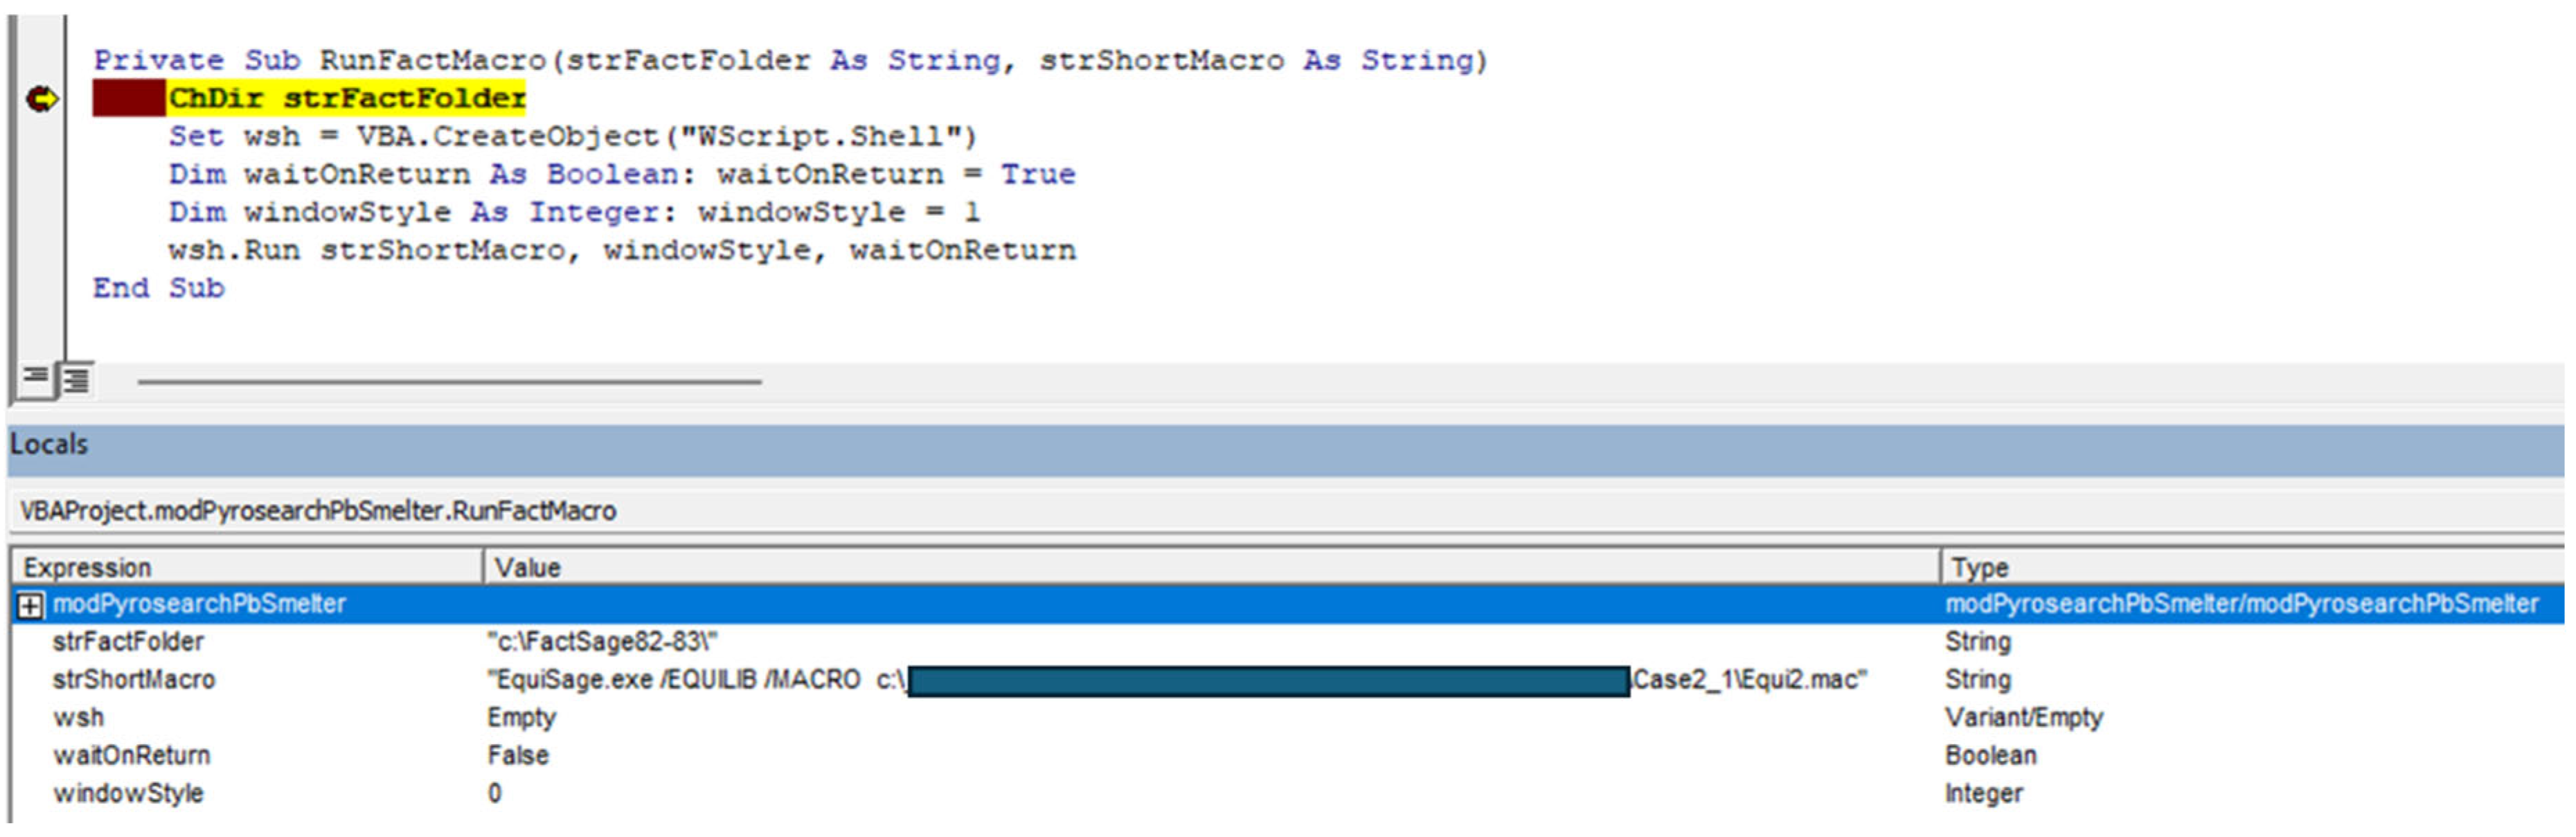
Figure 4.
Furnace setup used for equilibration [26] and sample location for open system equilibration.
Figure 4.
Furnace setup used for equilibration [26] and sample location for open system equilibration.
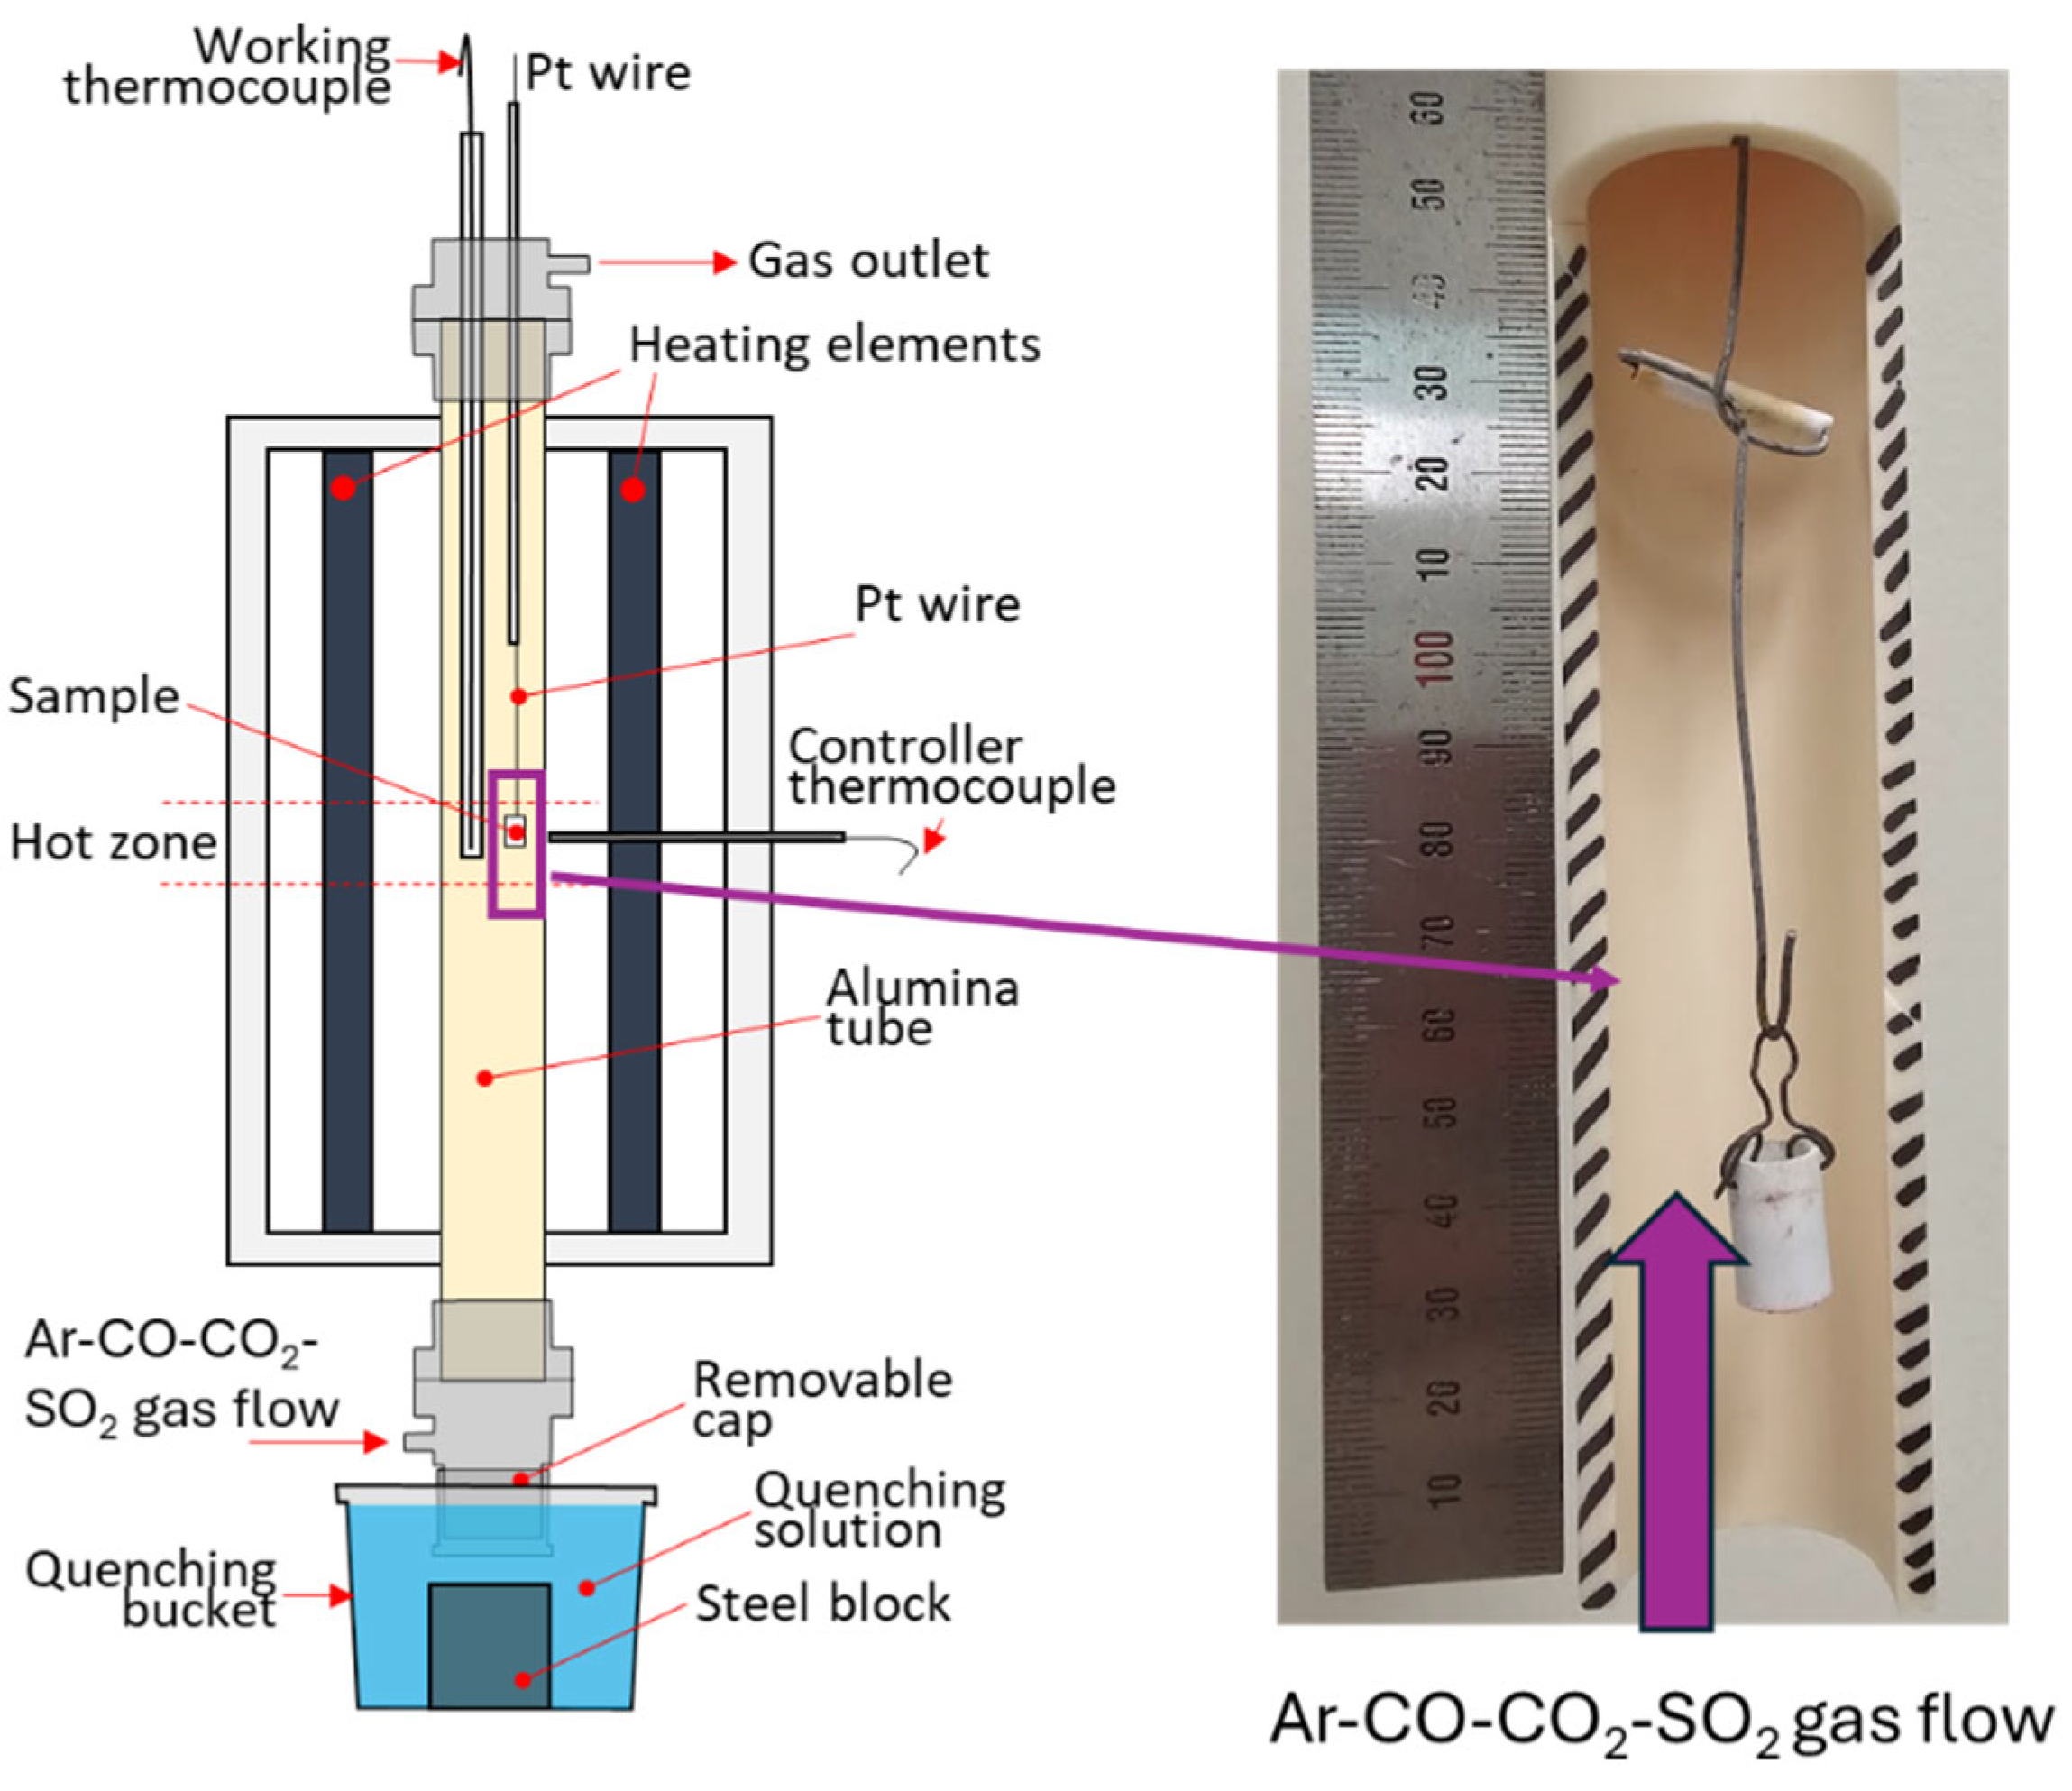
Figure 5.
Typical microstructures of samples targeting conditions in copper smelting furnace.
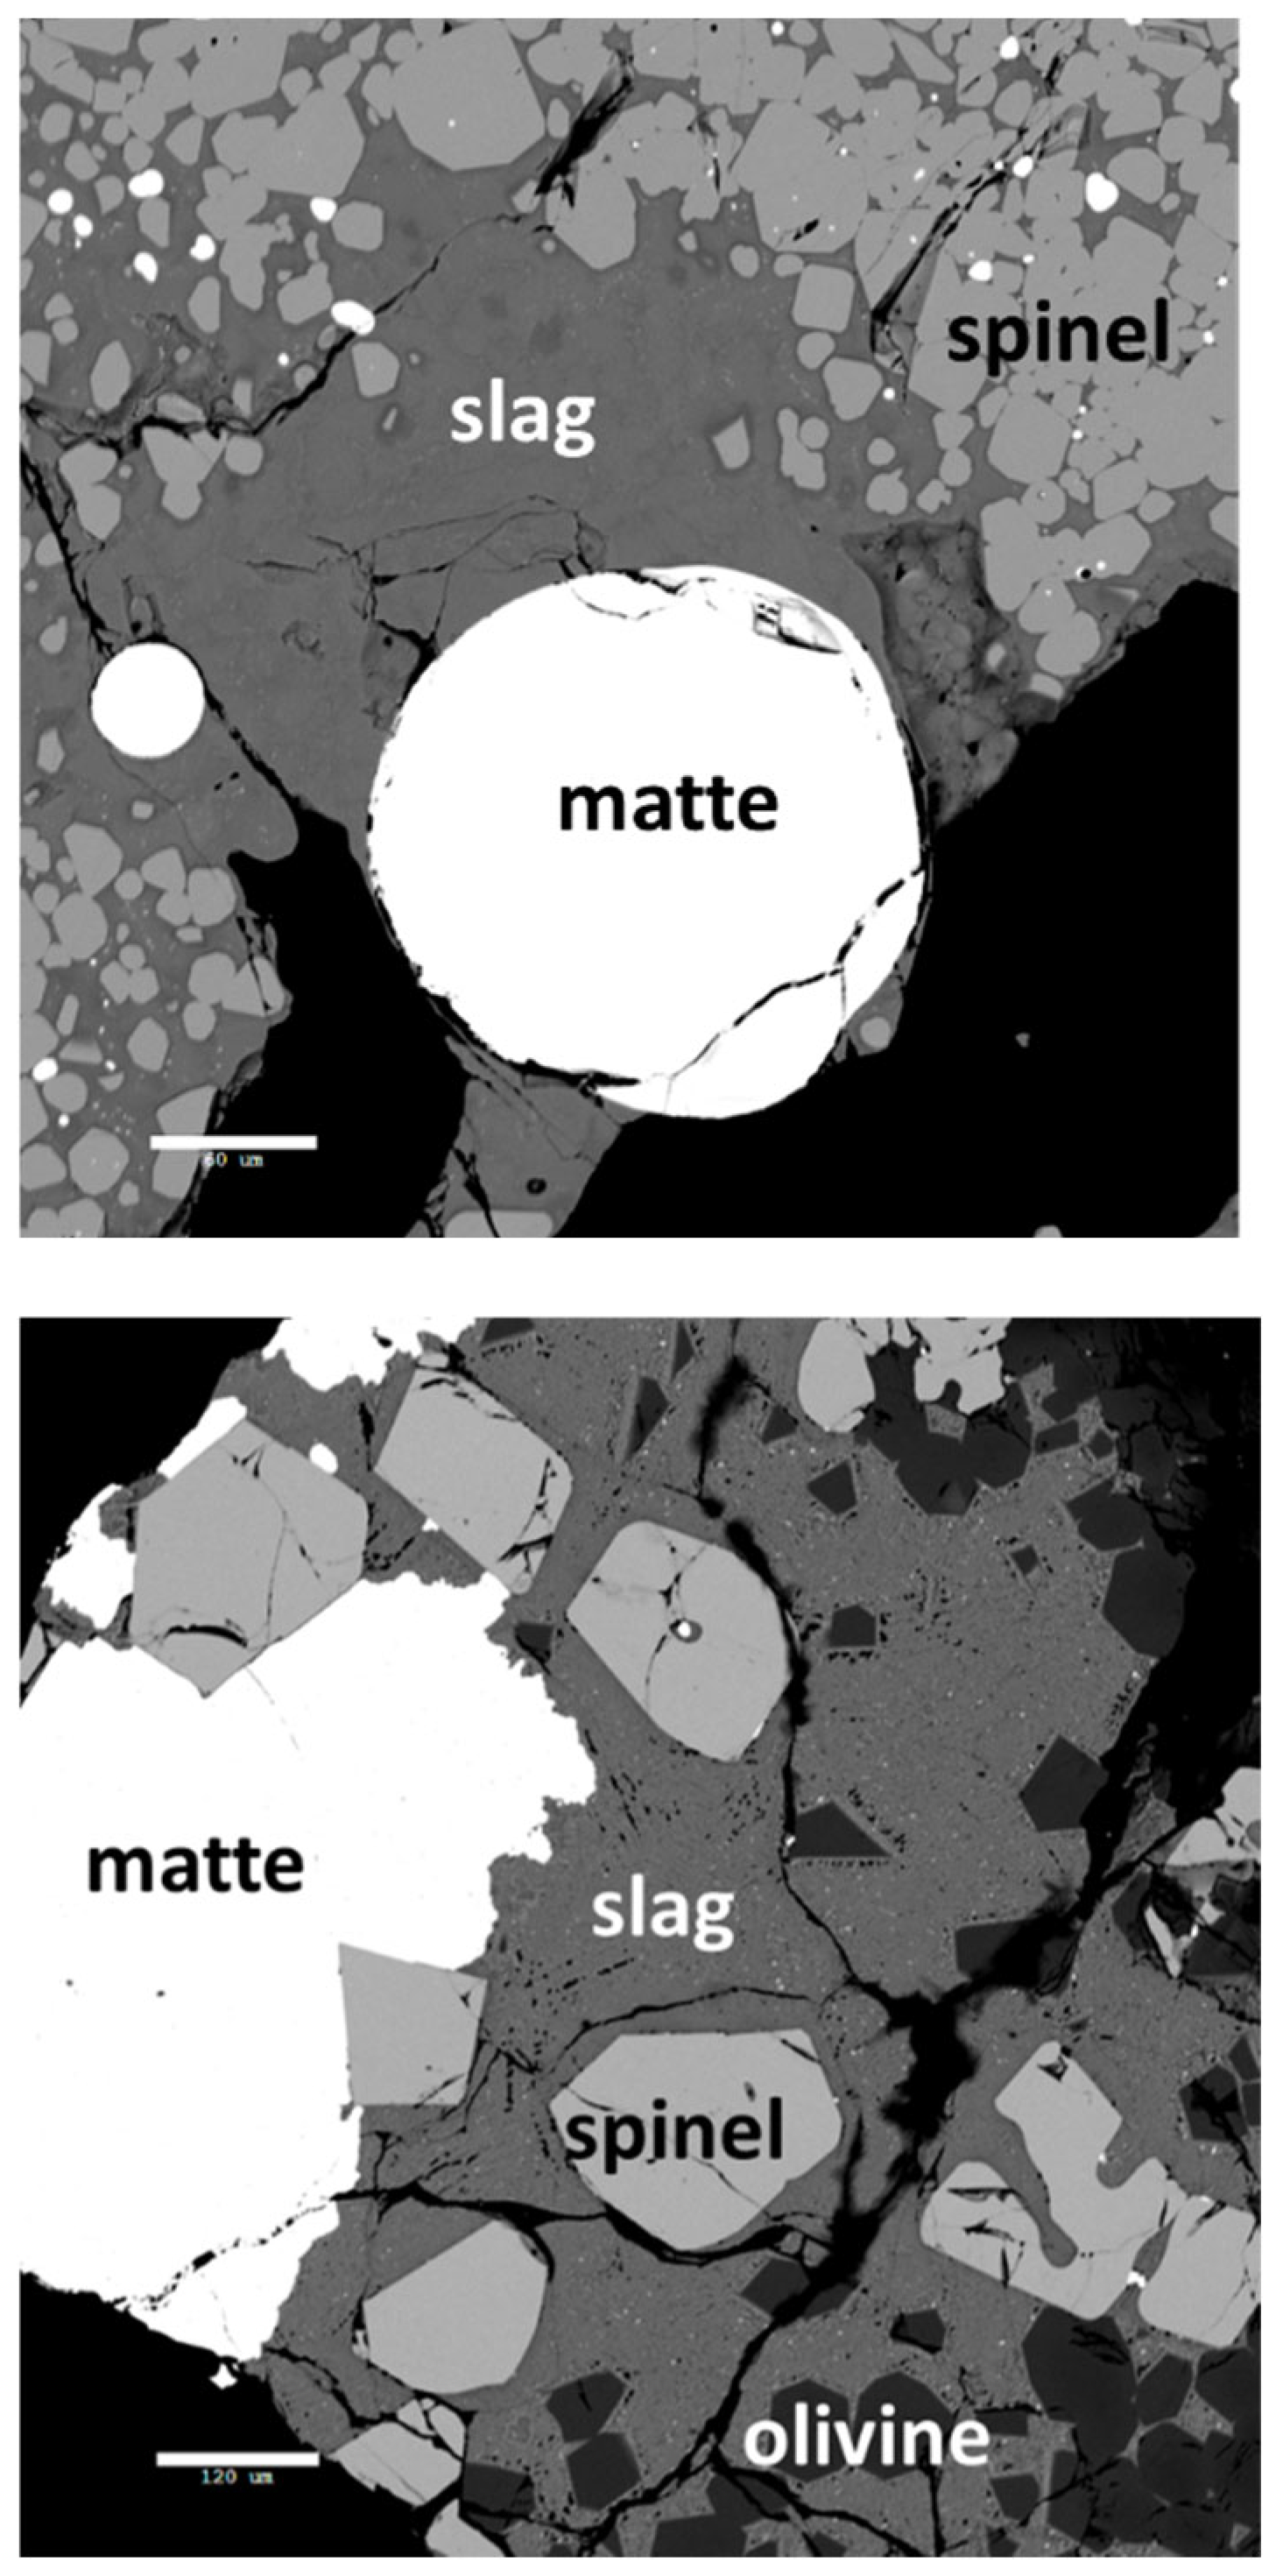
Figure 6.
Figure 6. Thermodynamic calculations of mass and energy balance for Case 1.
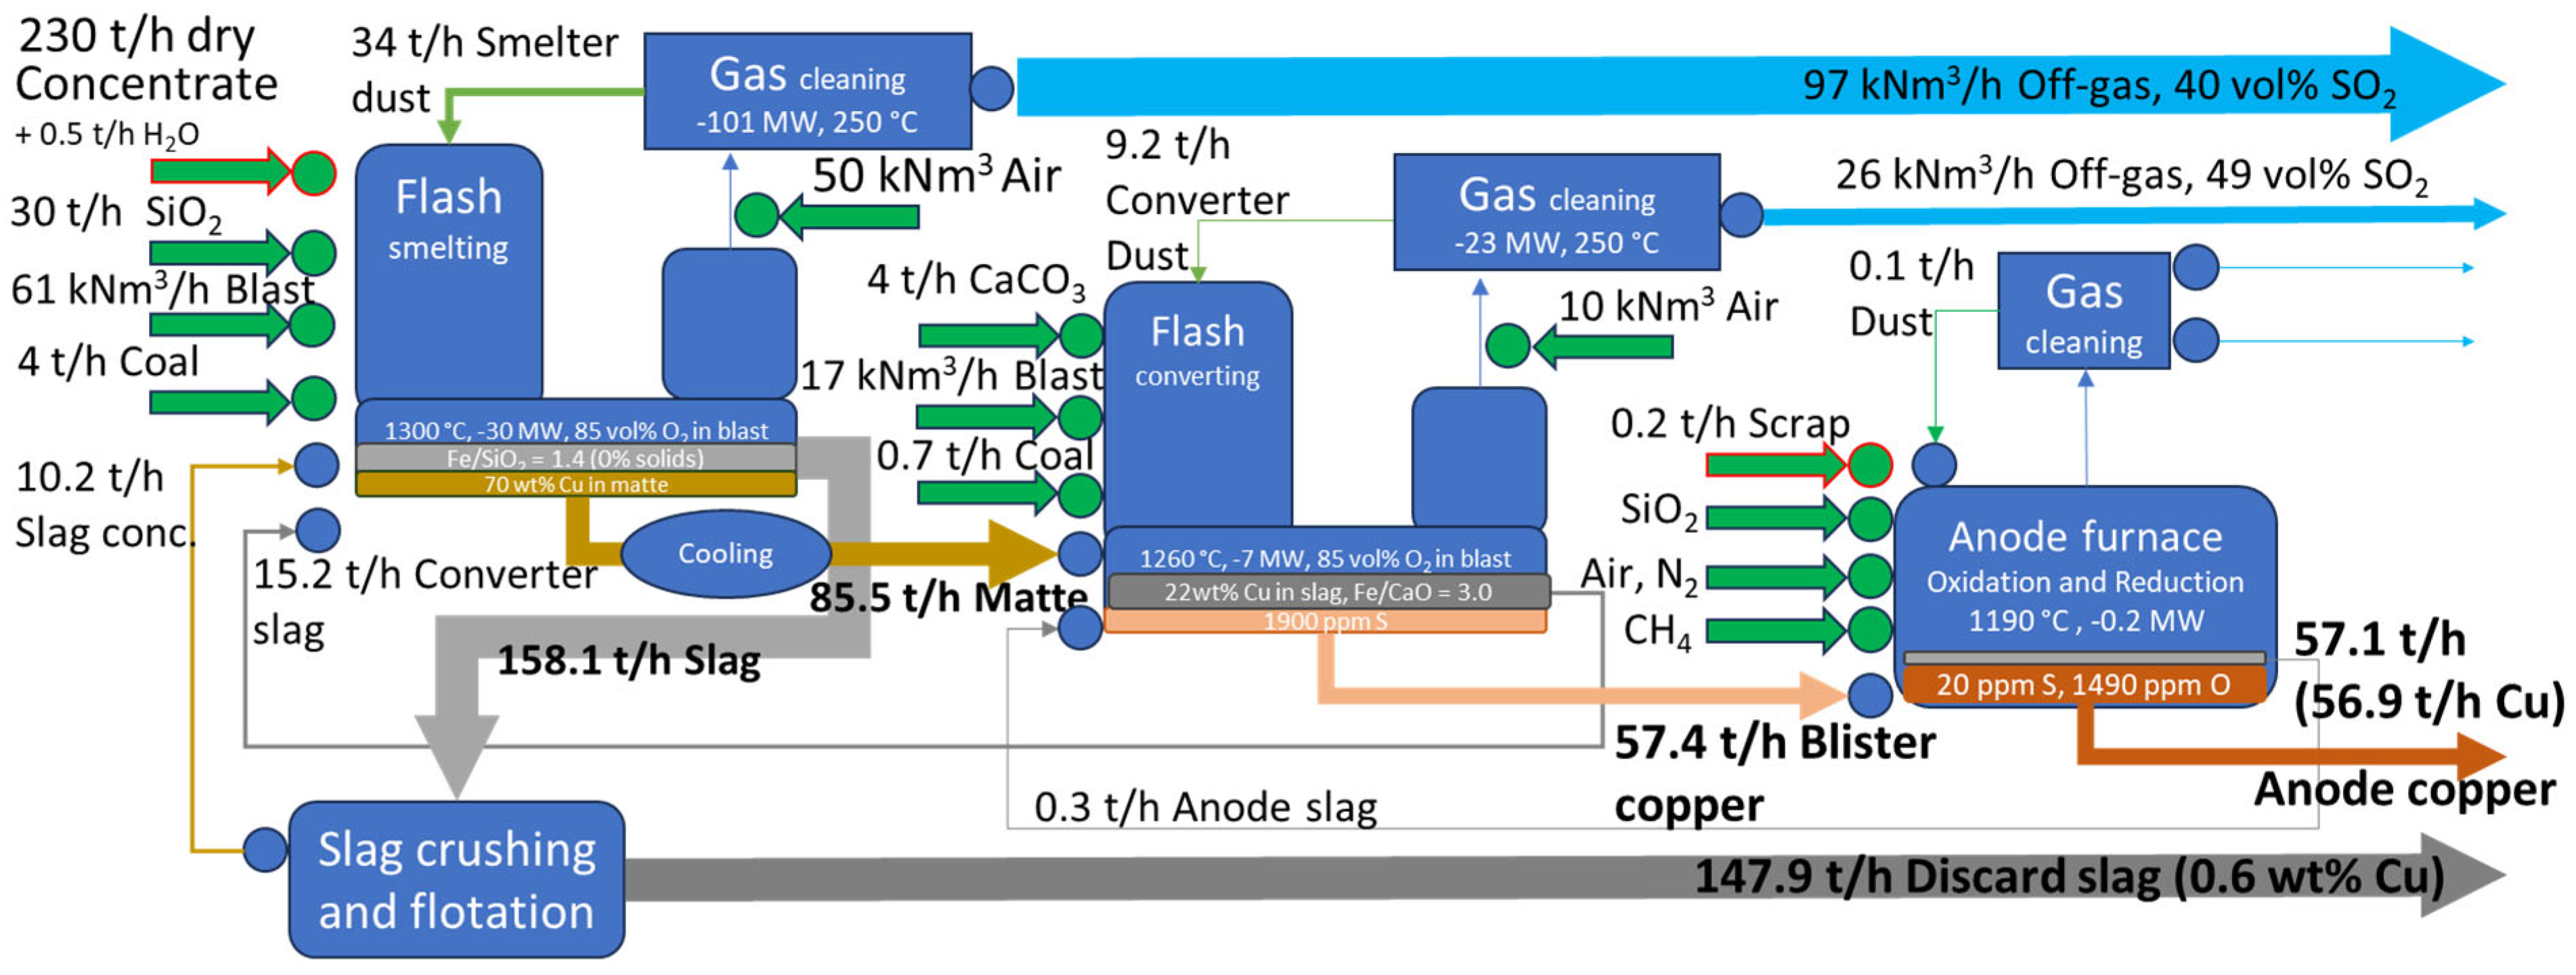
Figure 7.
Thermodynamic calculations of mass and energy balance for Case 2.
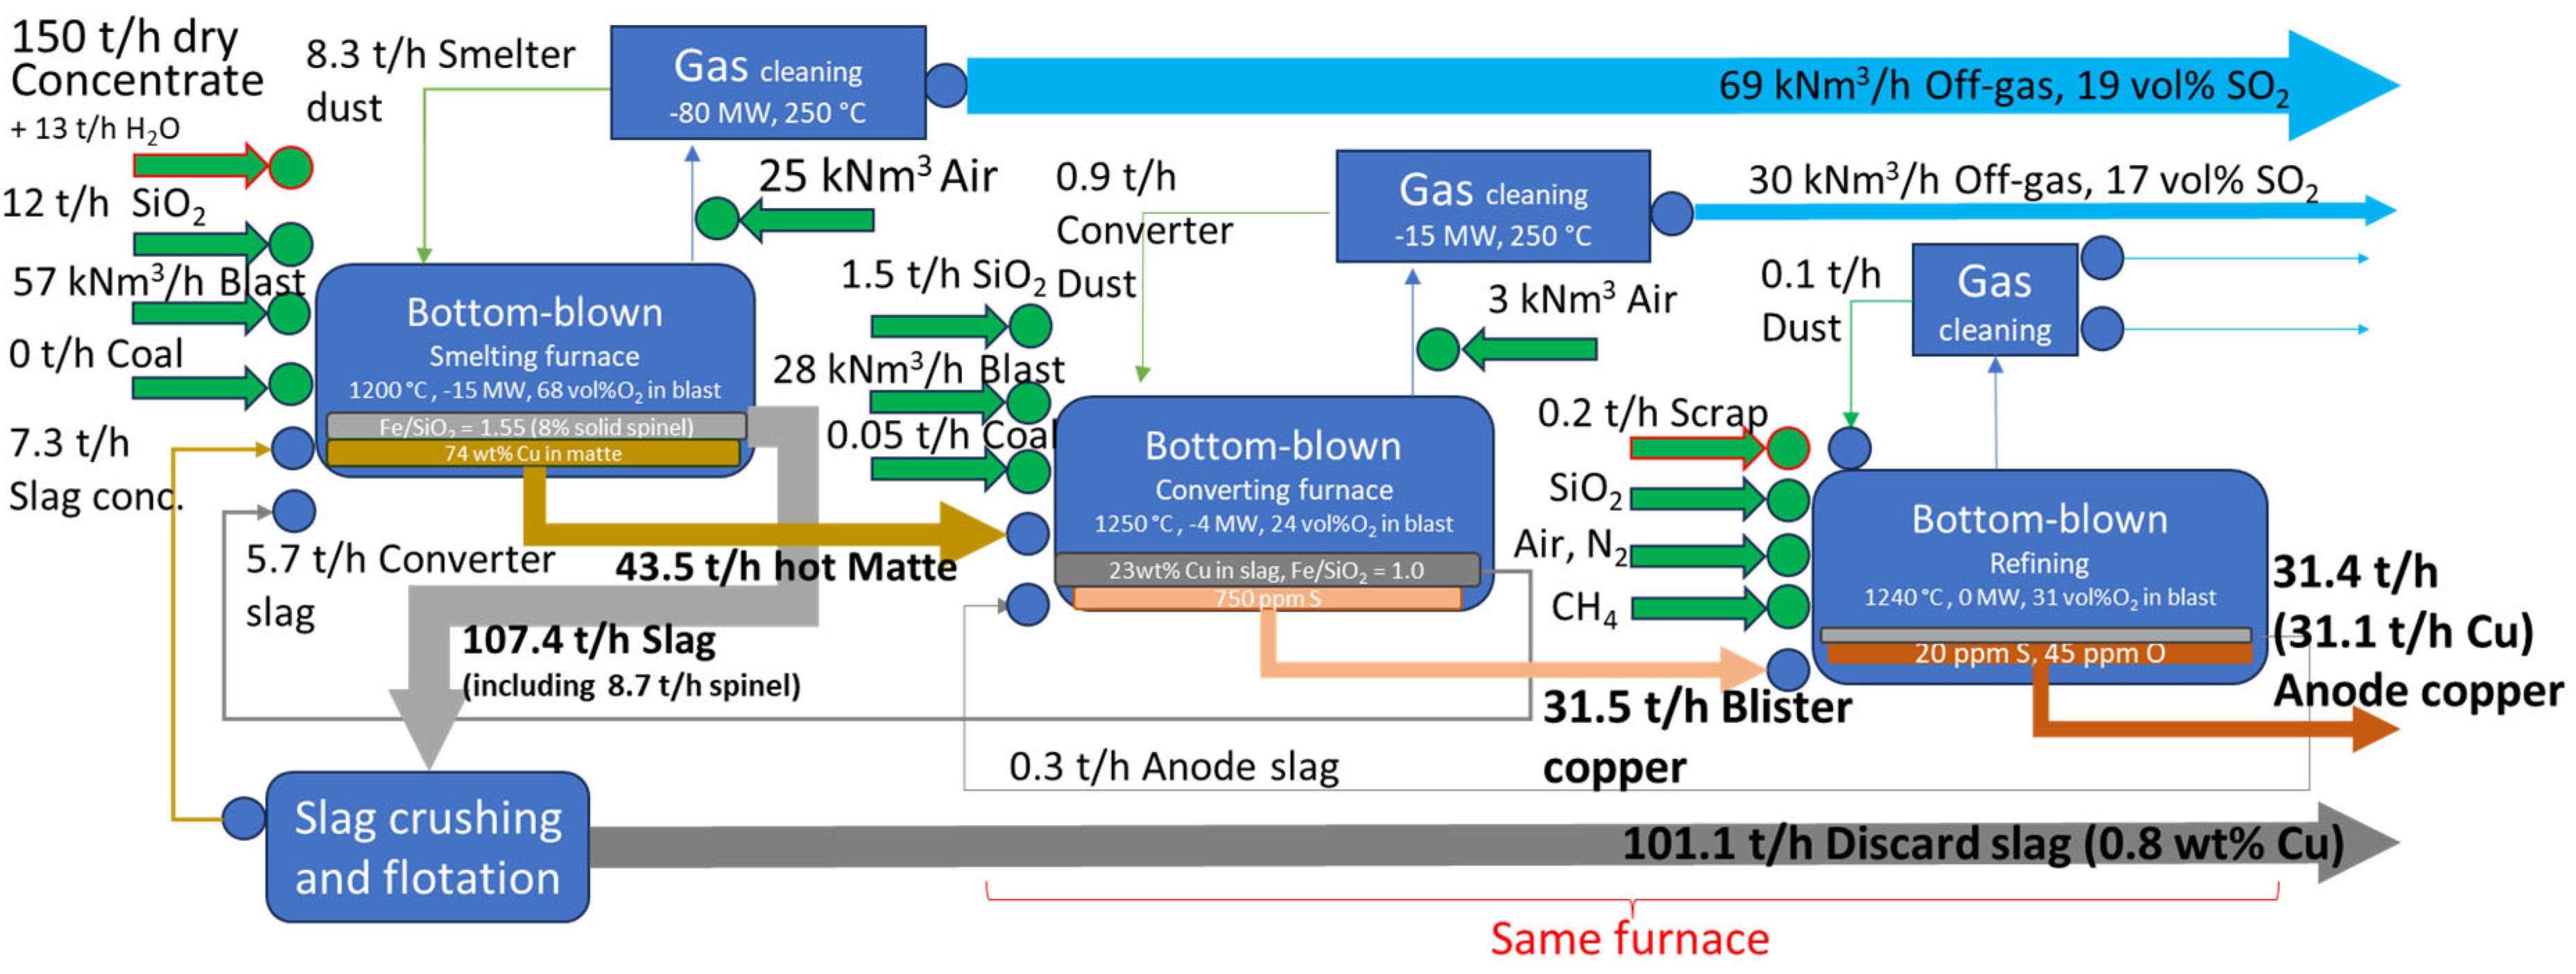
Figure 8.
Summary of conditions of a series of 25 equilibrium experiments.
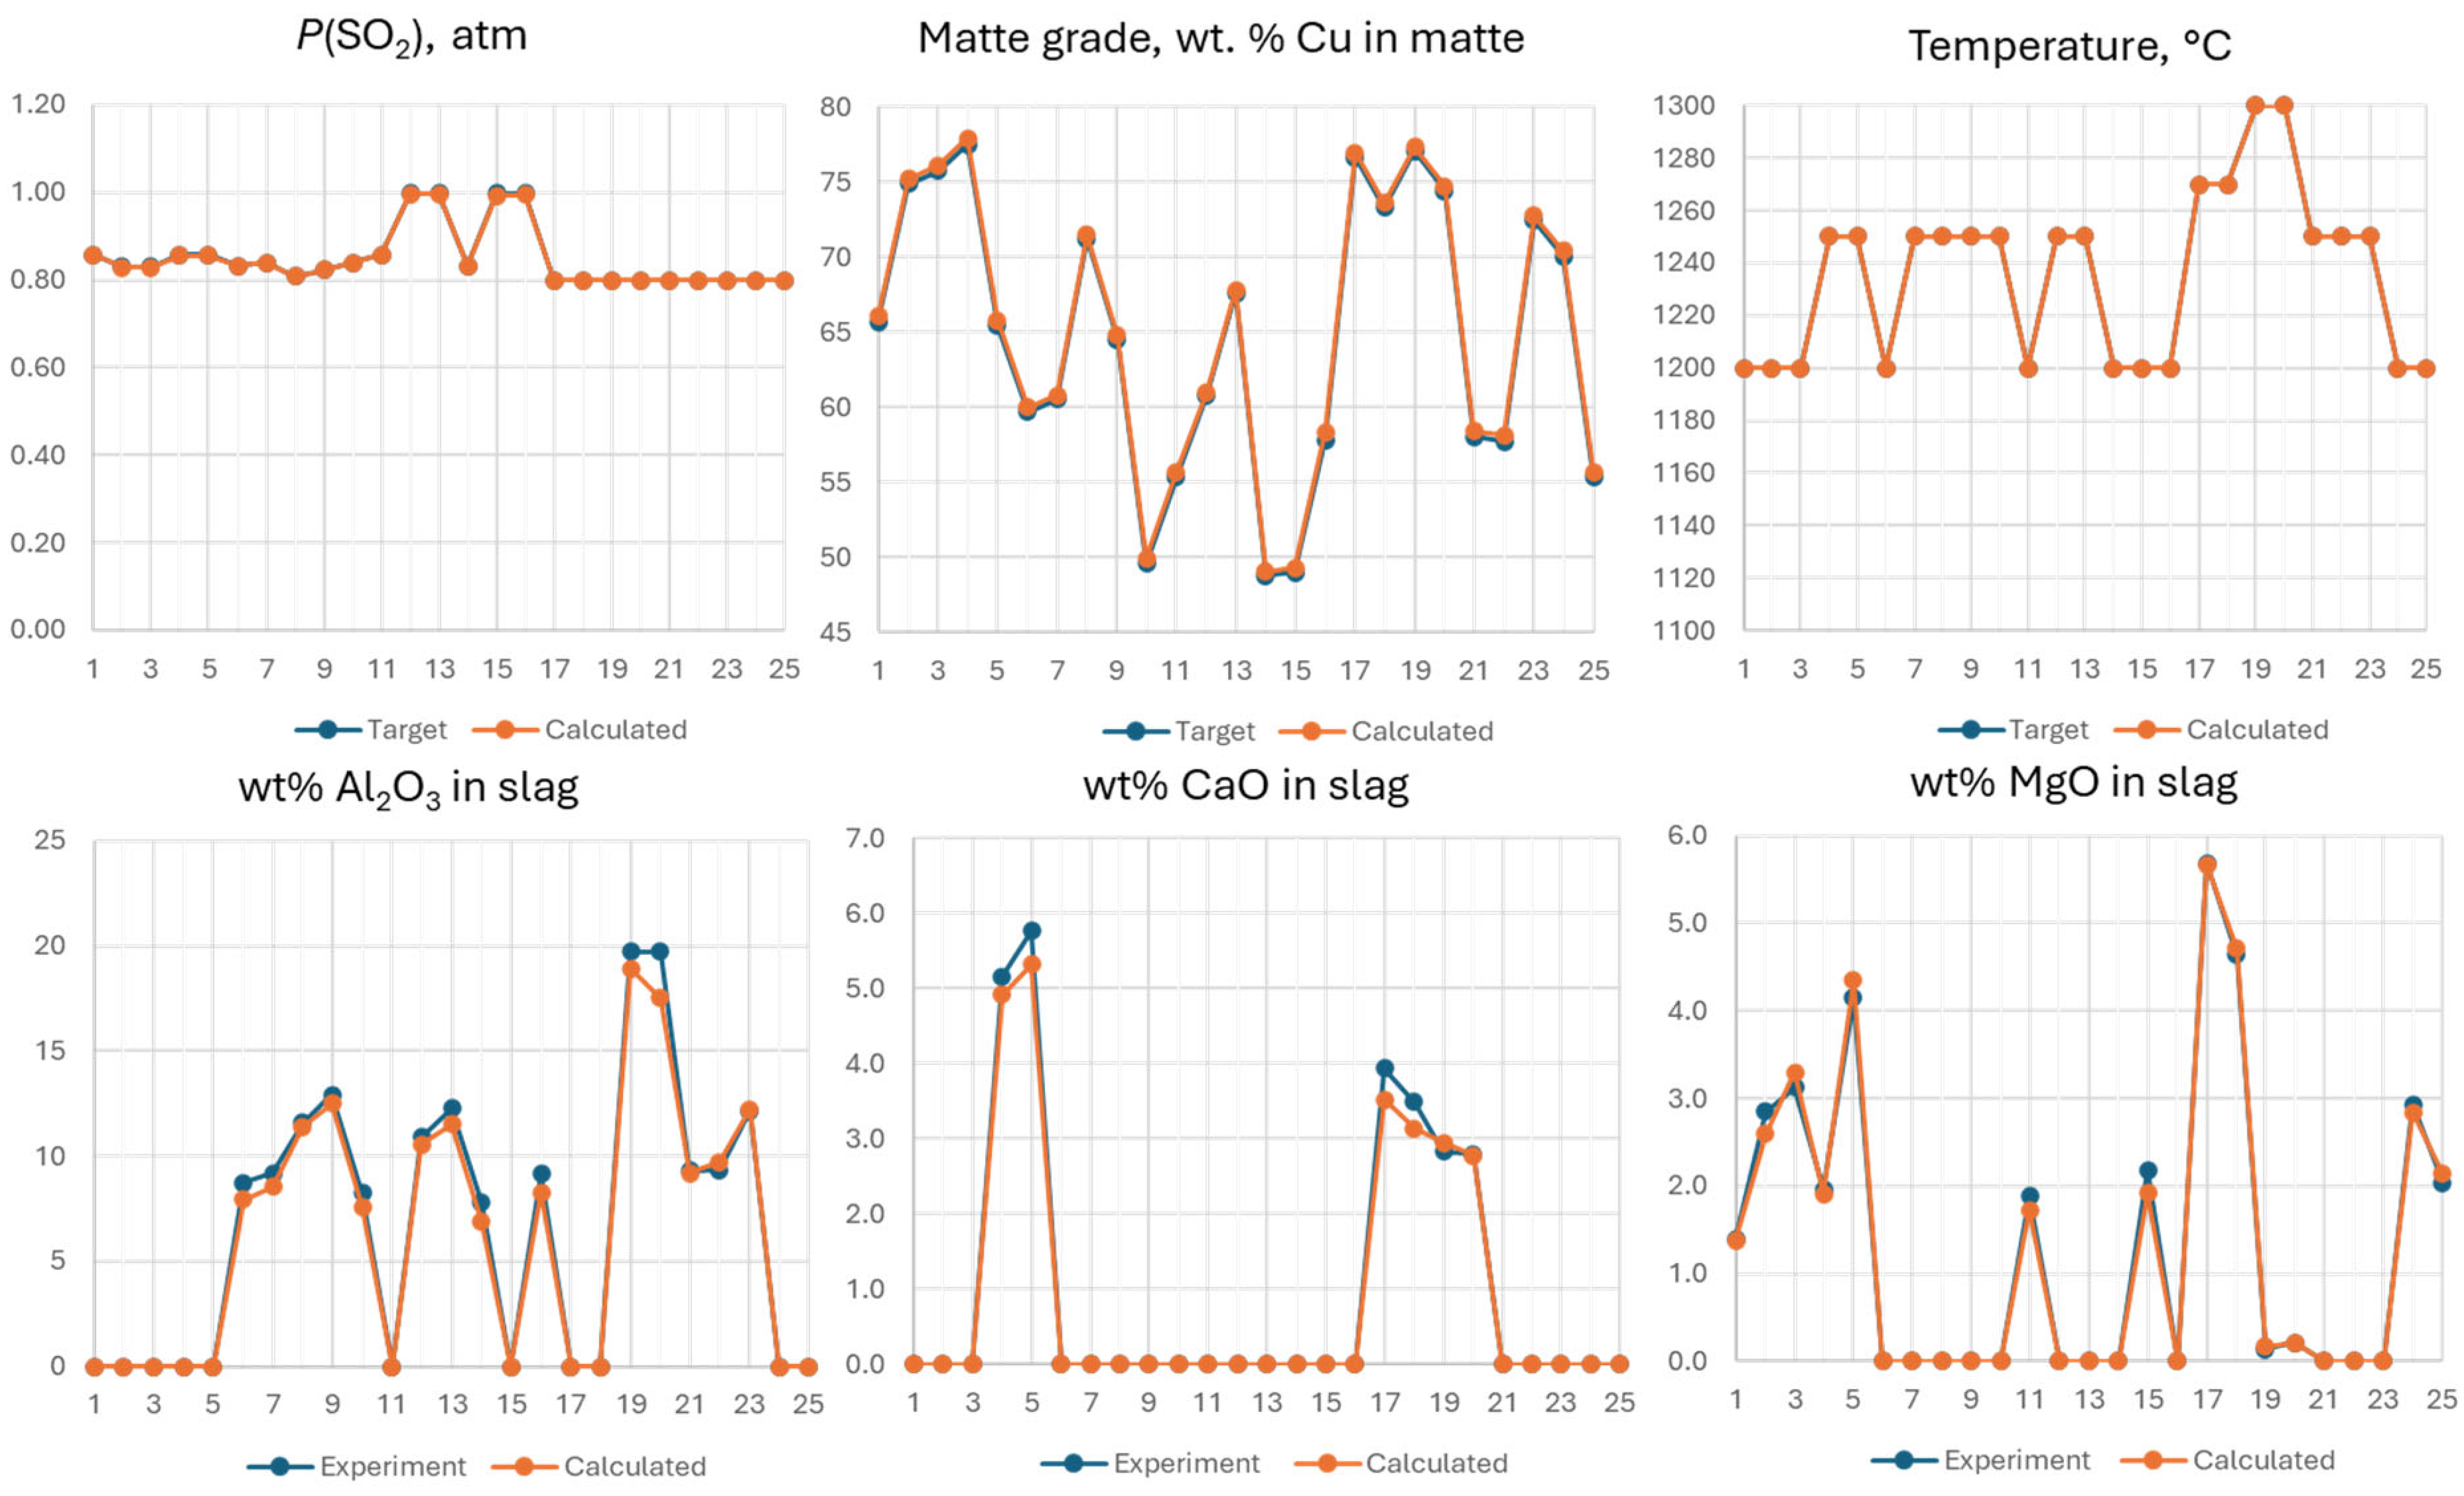
Figure 9.
Compartion of observed and predicted values: Fe/SiO2 in slag, wt.% Cu and ppm of Au and Ag in slag.
Figure 9.
Compartion of observed and predicted values: Fe/SiO2 in slag, wt.% Cu and ppm of Au and Ag in slag.
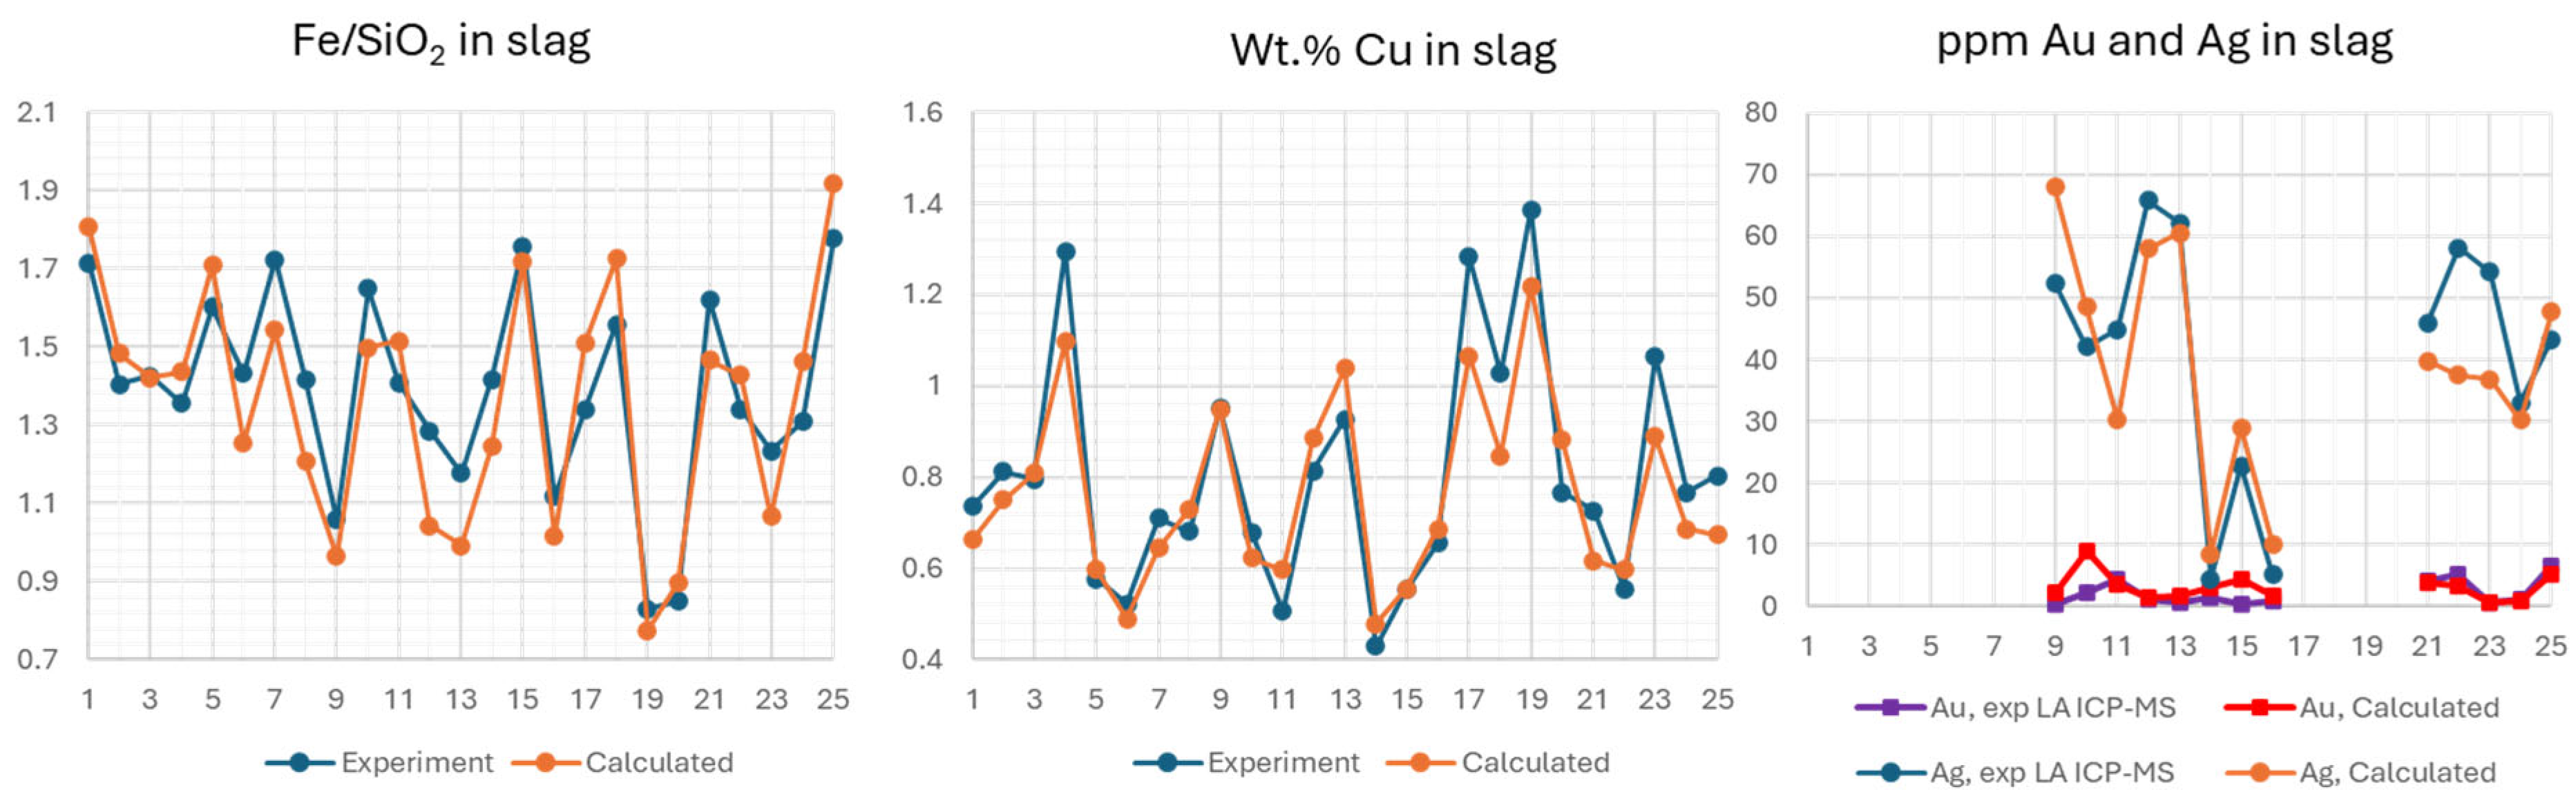
Figure 10.
Figure 10. Analysis of accuracy of predicted values: Fe/SiO2 in slag, wt.% Cu in slag
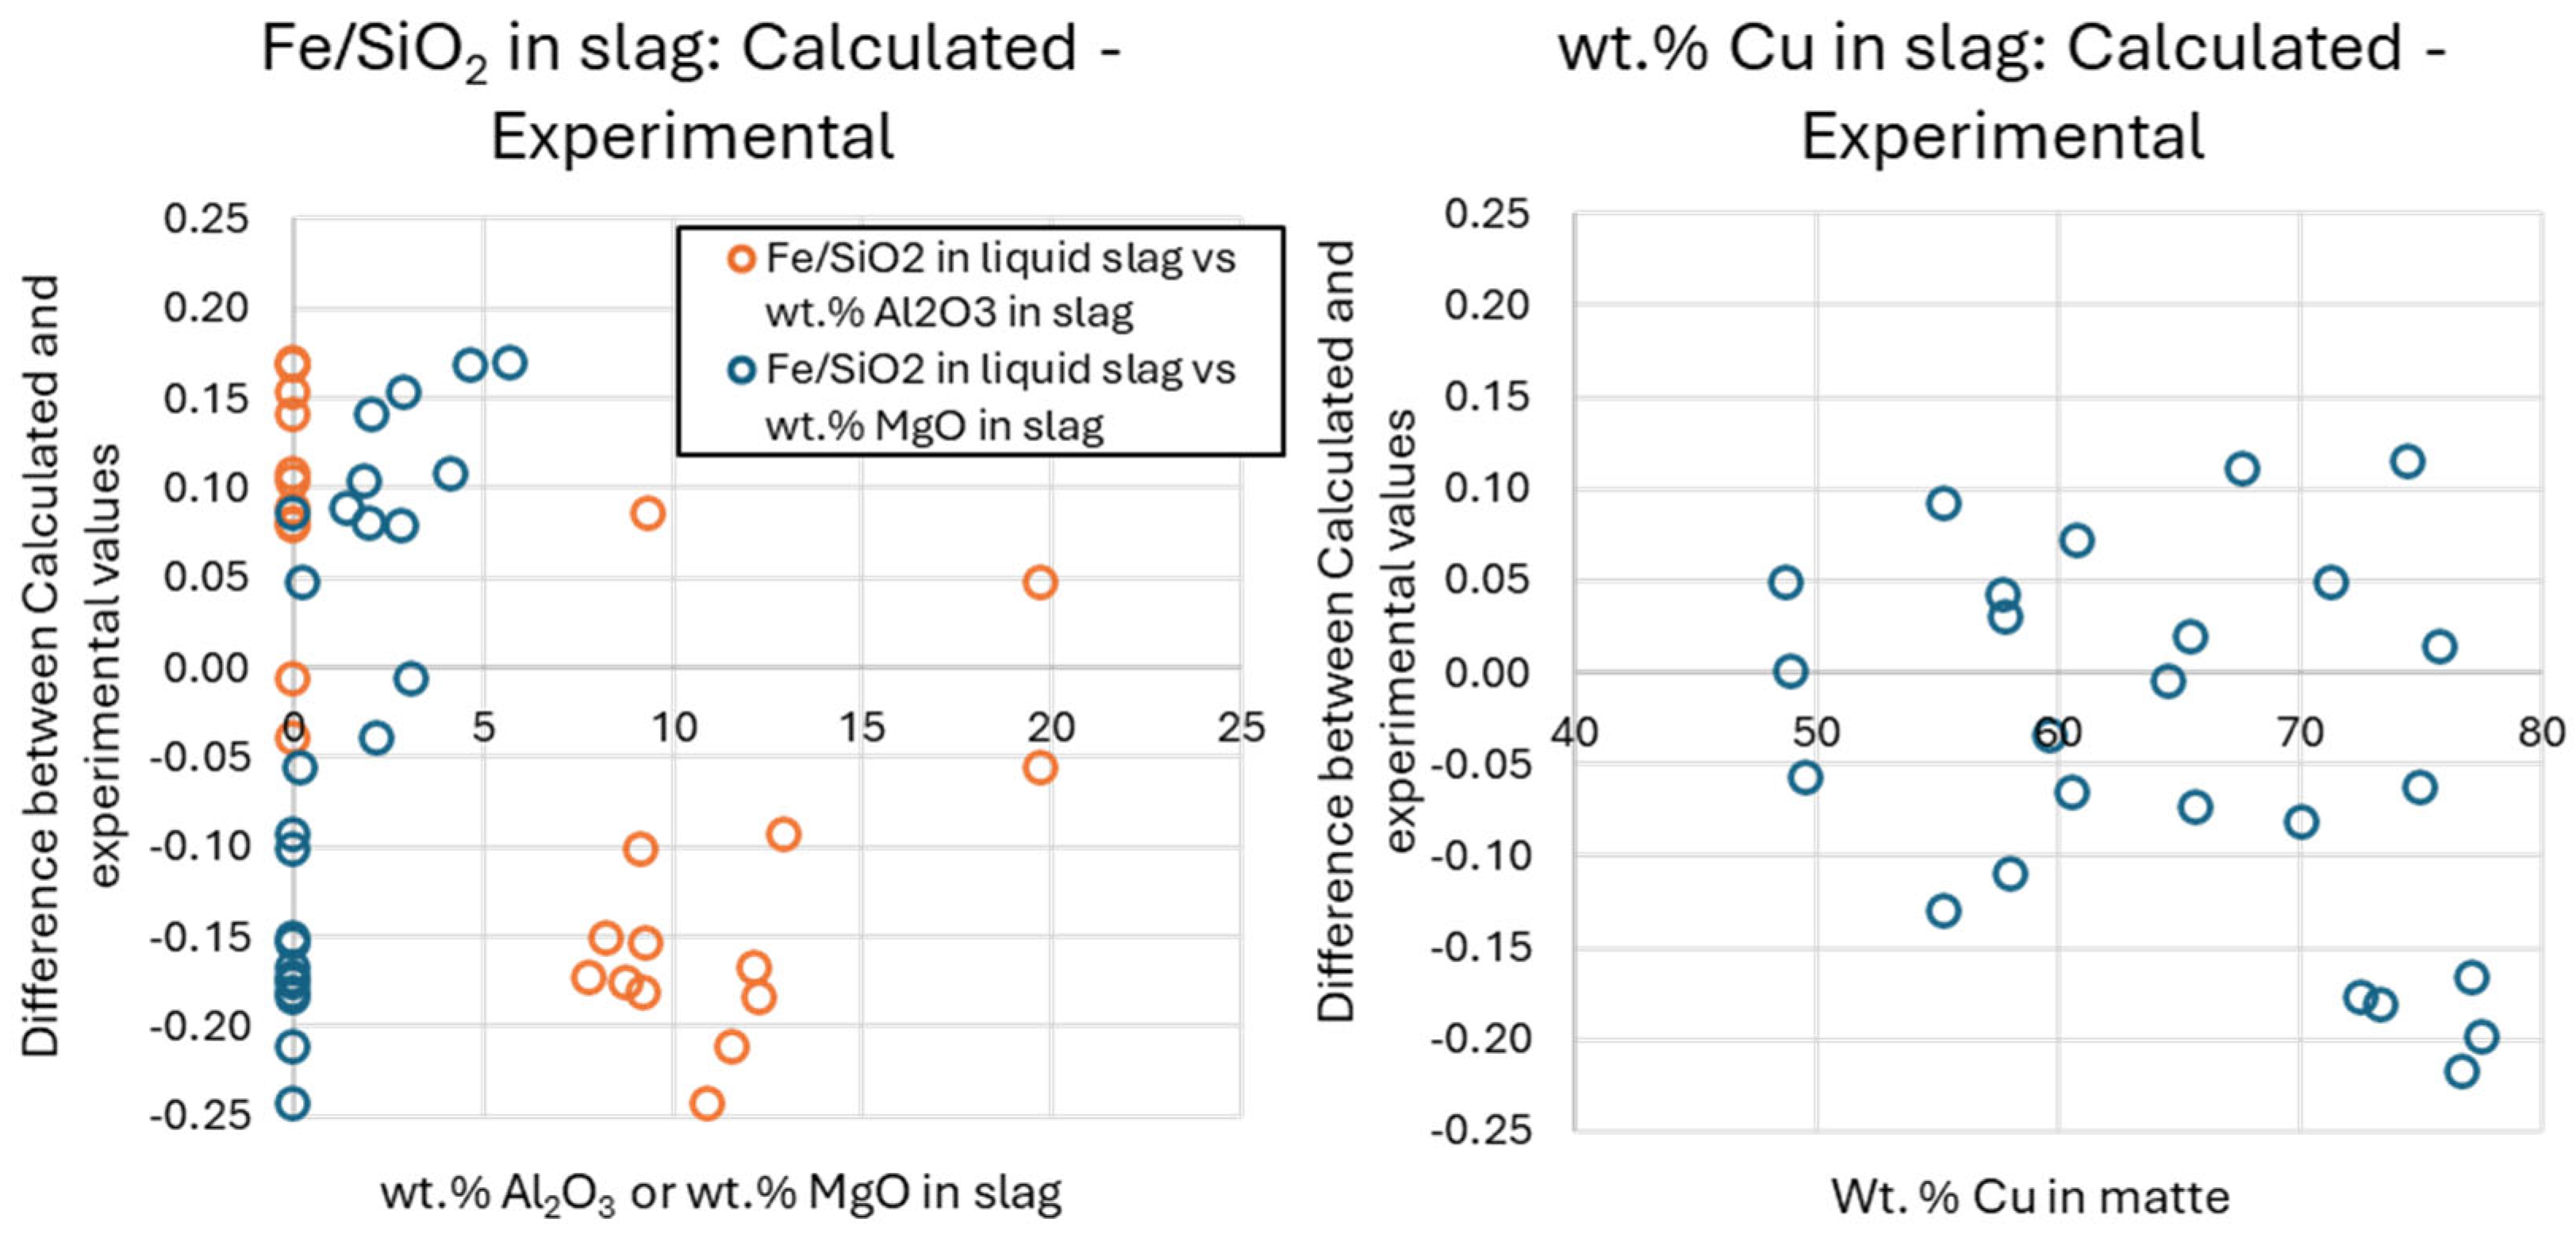
Table 1.
Compositions of concentrates used in the present study and parameters to estimate their market price.
Table 1.
Compositions of concentrates used in the present study and parameters to estimate their market price.
| Dry Composition | Cu, wt% |
Ag ppm |
Au ppm |
Fe, wt% |
O, wt% |
S, wt% |
SiO2, wt% |
Al2O3, wt% |
CaO, wt% |
MgO, wt% |
+H2O, wt% |
| Concentrate 1 (blend for Case 1) |
25 | 40 | 4 | 28.0 | 0.1 | 34 | 8 | 2.5 | 0.5 | 1.0 | 8.0 |
| Concentrate 2 | 18 | 70 | 80 | 30.0 | 0.3 | 24 | 18 | 4.5 | 2.0 | 2.0 | 8.0 |
| Concentrate 3 | 20 | 3300 | 3 | 20.0 | 0.1 | 31 | 7 | 0.5 | 1.0 | 0.5 | 8.0 |
| Concentrate 4 | 18 | 30 | 3 | 34.5 | 0.1 | 38 | 7 | 1.5 | 0.5 | 0.3 | 8.0 |
| Blend for Case 2 | 21 | 144 | 26.5 | 29.9 | 0.2 | 32 | 10.7 | 2.8 | 1.0 | 1.1 | 8.0 |
| US$/t | US$/g | US$/g | |||||||||
| Price | +9800 | +0.8 | +75 | ||||||||
| Dry Composition (continued) | Pb, wt% |
Zn, wt% |
Ni, wt% |
As, wt% |
Sb, wt% |
Bi, wt% |
Cd, wt% | F, wt% | Hg, wt% | Se, wt% | Price US$/t |
| Concentrate 1 (blend for Case 1) |
0.08 | 0.5 | 0.01 | 0.30 | 0.02 | 0.03 | 0.001 | 0.01 | 0.0003 | 0.005 | 2650 |
| Concentrate 2 | 0.30 | 0.5 | 0.2 | 0.05 | 0.02 | 0.02 | 0.003 | 0.05 | 0.0003 | 0.008 | 7551 |
| Concentrate 3 | 6.50 | 8.5 | 0.01 | 2.40 | 1.50 | 0.30 | 0.003 | 0.01 | 0.0024 | 0.008 | 3940 |
| Concentrate 4 | 0.01 | 0.1 | 0.03 | 0.02 | 0.00 | 0.01 | 0.001 | 0.01 | 0.0004 | 0.017 | 1873 |
| Blend for Case 2 | 0.32 | 0.6 | 0.07 | 0.22 | 0.06 | 0.03 | 0.002 | 0.02 | 0.0004 | 0.009 | 3972 |
| Penalty, US$/0.1 wt. % | -0.3 | -0.3 | -1.0 | -2/-5 | -15 | -25 | -30 | -15 | -3000 | -15 | |
| Penalty limit, wt. % | 1 | 3 | 0.5 | 0.2/1.0 | 0.05 | 0.05 | 0.03 | 0.03 | 0.0005 | 0.03 |
Table 2.
Summary of process parameters, targets and non-thermodynamic factors used for flowsheet modeling in this study.
Table 2.
Summary of process parameters, targets and non-thermodynamic factors used for flowsheet modeling in this study.
| Process parameters | Case 1 Smelting | Case 1 Converting | Case 2 Smelting | Case 2 Converting |
| Furnace type | Flash | Flash | Bottom-Blown | Bottom-blown |
| Slag type | Fayalite | Cu2O-Calcium ferrite | Fayalite | Cu2O-Fayalite-based |
| Dry concentrate rate, t/h | 230 [2] | 130 [14] | ||
| Moisture in feed, t/h (%) | 0.5 (0.2 %) [15] | 0.0 | 13 (8 %) [16] | 0.0 |
| Feed temperature, °C | 150 | 25 | 25 | 1200 [17] |
| Temperature in Reactor zone, °C | 1300 [17] | 1260 [17,18] | 1250 | 1250 [17] |
| Temperature in Settler zone, °C | 1250 [17] | 1250 [17,18] | 1200 [16] | 1250 [17] |
| Oxygen enrichment in the blast, vol. % | 85 [2] | 85 [17] | 68 [16] | 25 [17] |
| Phase equilibria target | Fe/SiO2 in slag = 1.4 (~50 °C above liquidus) [19] | Fe/CaO in slag = 3.0 (~10 °C above liquidus) [19] |
Fe/SiO2 in slag+solids = 1.55 (8% solids in slag) [16] | Fe/ SiO2 in slag = 1.0 (10 °C above liquidus) [17] |
| Chemical target | 70 wt% Cu in matte [17] | 22 wt% Cu in slag [20] | 74 wt% Cu in matte [21] | 23 wt% Cu in slag [22] |
| Energy balance (-1 × Heat loss), MW | -30 | -7 | -15 | -4 |
| Non-thermodynamic factors | ||||
| Oxygen efficiency, % | 99 | 99 | 90 | 99 |
| Volatile coal, % | 10 | 10 | 10 | 10 |
| Mechanical dust carry-over, % | 6 [13] | 5 [17] | 2 [14] | 1 |
| Non-equilibrium As evaporation, % | 60 [13] | 1 [23] | 60 | 1 |
| Entrainment, grams in 100 of slag+solids (estimated from industrial samples) |
1.5 [24] | 0.5 | 2.5 [21] | 0.5 |
Table 4.
Example of experimetnal results and thermodynamic calculation for Sample #23 equilibrated at 1250 °C at P(SO2) = 0.8 atm on Al2O3 substrate. Compositions are in wt. %, last column is an approximate proportion of phases used to calculate bulk compostion for FactSage® input.
Table 4.
Example of experimetnal results and thermodynamic calculation for Sample #23 equilibrated at 1250 °C at P(SO2) = 0.8 atm on Al2O3 substrate. Compositions are in wt. %, last column is an approximate proportion of phases used to calculate bulk compostion for FactSage® input.
| Wt% | Cu | Fe | S | [O] | Al2O3 | SiO2 | Ni | Co | As | Bi | Pb | Zn | Au | Ag | Sb | Mass |
| Slag (exp) | 1.1 | 39.6 | 0.2 | 11.3 | 12.2 | 32.1 | 0.10 | 0.25 | 0.036 | 4.1E-06 | 0.170 | 0.476 | 5.4E-05 | 0.005 | 0.55 | 0.90 |
| Matte (exp) | 72.4 | 2.7 | 20.4 | 0.6 | 0.0 | 0.0 | 0.84 | 0.06 | 0.004 | 3.3E-05 | 0.100 | 0.090 | 0.3920 | 0.478 | 0.11 | 1.00 |
| Spinel (exp) | 0.0 | 48.9 | 0.0 | 14.0 | 31.7 | 0.3 | 0.37 | 0.46 | 0.011 | <1E-06 | 0.017 | 1.440 | <1E-06 | 0.000 | 0.01 | 0.10 |
| FactSage Input | 73.4 | 43.3 | 20.5 | 11.9 | 14.1 | 28.9 | 0.96 | 0.33 | 0.038 | 3.7E-05 | 0.254 | 0.662 | 0.3921 | 0.483 | 0.61 | |
| Slag (calc) | 0.9 | 37.7 | 0.2 | 11.9 | 12.2 | 35.4 | 0.06 | 0.24 | 0.040 | 1.1E-05 | 0.143 | 0.594 | 6.4E-05 | 0.004 | 0.63 | 0.82 |
| Matte (calc) | 72.8 | 3.8 | 21.2 | 0.2 | 0.0 | 0.0 | 0.84 | 0.08 | 0.005 | 2.8E-05 | 0.137 | 0.078 | 0.3924 | 0.480 | 0.09 | 1.00 |
| Spinel (calc) | 0.0 | 53.5 | 0.0 | 19.6 | 25.4 | 0.0 | 0.46 | 0.33 | 0.000 | <1E-06 | 0.000 | 0.606 | 0.0000 | 0.000 | 0.00 | 0.16 |
Disclaimer/Publisher’s Note: The statements, opinions and data contained in all publications are solely those of the individual author(s) and contributor(s) and not of MDPI and/or the editor(s). MDPI and/or the editor(s) disclaim responsibility for any injury to people or property resulting from any ideas, methods, instructions or products referred to in the content. |
© 2024 by the authors. Licensee MDPI, Basel, Switzerland. This article is an open access article distributed under the terms and conditions of the Creative Commons Attribution (CC BY) license (http://creativecommons.org/licenses/by/4.0/).
Copyright: This open access article is published under a Creative Commons CC BY 4.0 license, which permit the free download, distribution, and reuse, provided that the author and preprint are cited in any reuse.


