Submitted:
23 October 2024
Posted:
24 October 2024
You are already at the latest version
Abstract
The slope protection structure of the prefabricated lattice beam is one of the most widely used and studied systems in slope structure, the core part of which is the connection between the lattice beam joint and the longitudinal and transverse beams. Because the prefabricated structure is weak in its structural integrity, it is necessary to study the influence of prefabricated lattice beam joints and the longitudinal and transverse beams on the overall mechanical properties of the structure. In this paper, one ordinary cast-in-place concrete beam and six prefabricated beams with different joint connection modes are designed, and the influence of different connection modes on the bending capacity of the beams is accordingly explored. Moreover, the flexural capacity, bending stiffness change, ductility and energy absorption capacity of the beams are analyzed through three-point bending test. The test results show that the connection mode at the joints could significantly affect the overall mechanical properties of the structure. By embedding holes in steel sleeves, filling cement mortar in the middle, and using steel plates with a thickness of 16mm for anchoring treatment joints of end plates, the specimen beams are thus obtained with the same flexural capacity, ductility and energy absorption capacity as ordinary cast-in-place concrete beams, which could be used for specimen engineering applications.
Keywords:
prefabricated
; lattice beam
; three‐point bending test
; beam joint
; ductility
0. Introduction
Prefabricated concrete structures are widely used in building structures. Compared with traditional cast-in-place structures, prefabricated concrete structures have many advantages, such as short construction period, high production efficiency, low material consumption, high quality of finished products, low carbon and environmental protection [1,2]. Therefore, prefabricated structures are one of the important ways for building technology upgrading. However, currently, the structural integrity of the prefabricated structure is relatively weak [3,4]. This is because the on-site installation and construction quality of prefabricated component connection joints is not easy to guarantee. Moreover, the narrow on-site installation and construction environment of prefabricated components, and their excessive weight has high requirements for construction equipment since in this condition, it is difficult to align the joints with poor installation accuracy, which are the key influencing factors affecting the connection quality of joints [5]. The mechanical properties of component joints have always been the key to affecting the overall performance of the structure. Therefore, the mechanical properties of joints have always been a research hotspot [6].
In the process of slope engineering, disasters such as landslides are extremely susceptible to weather conditions, such as rainfall. In consequence, supporting while excavating is a core construction concept to avoid engineering accidents during the construction process. Thus, prefabricated structures are widely used in slope support due to the advantages such as short construction period and high production efficiency [7]. The connection of prefabricated component beams in slope engineering is a key focus in the construction of prefabricated slope structures. Zheng Jing et al. [8] once proposed a prefabricated structure of a two-way variable cross-section beam to facilitate on-site assembly, and determined the maximum tensile force that the structure can withstand through on-site tension loading tests. The test results demonstrate that there are pores in the components during the actual assembly process, and will lead to stress concentration if these pores are not filled. Therefore, it is necessary to further study the influence of the connection method between slope joints and components on the overall performance of the structure.
However, there are rare studies on the influence of the connection method between slope joints and components on the overall mechanical properties of the structure. Under this circumstance, based on the design principle of "strong joints and weak components", it is a key point to find a suitable connection method for prefabricated lattice beam joints and the longitudinal and transverse beams to promote the application of prefabricated structures in slope engineering. In the past few decades, scholars from various countries have researched a lot on the performance of beam-column joints, such as the SCOPE [9]. Furthermore, Parastesh et al. [10] proposed ductile flexural joints that can be used in high-intensity areas. These connection methods have greatly promoted the development of prefabricated structures in buildings. In China, the application of prefabricated production concepts to the protection engineering of expressway slopes in mountainous areas started relatively late. Therefore, this paper conducts research on the connection method between prefabricated slope joints and the longitudinal and transverse beams, proposes several connection methods for joints and beams, and explores the influence of different connection methods on the flexural capacity of beams. The test studies and analyzes the flexural capacity, bending stiffness change, ductility ratio and energy absorption capacity of beams.
1. Experimental Condition
1.1. Specimen Design and Preparation
This paper tries to explore the influence of the connection method of lattice beam joints on the mechanical properties of beams. In this context, a total of seven specimens are designed for this test, with the size of 2000mm × 300mm × 300mm. Moreover, Specimen YZ1 is an ordinary cast-in-place concrete beam. The rest of the specimens are composed of two small beams, one simulating the on-site construction joint end, and the other simulating the longitudinal (transverse) beam end of the slope. The size, section reinforcement and materials used of the two small beams are exactly the same. The connection methods of the test design specimens are shown in Table 1. The main materials used for making the specimens are all C25 concrete and HRB400 grade steel bars and the steel plate is made of Q235 steel. The reinforcement of the beam and the specific connection are shown in Figure 1 and Figure 2 respectively. Among them, the thickness of the steel plate used in Specimen YZ5 is 14mm, and the thickness of the steel plate used in specimen YZ6 is 16mm.
1.2. Loading Scheme
In the test, the 12 prefabricated specimens are loaded in a single-point mid-span loading mode with the 3000KN electronic servo long-column pressure testing machine in the Structural Laboratory of South China University of Technology. The size of the specimens and the layout of measuring points are shown in Figure 3.
In order to test the reliability and safety of the entire test device, the loading process is divided into preloading and formal loading. The preloading adopts hierarchical loading, with the maximum load up to 100kN, and each level is loaded at 20kN. After each stage, the load is held for 5 minutes to check any potential problems in the entire test system. Moreover, when completing the preloading, the hierarchical unloading is accordingly performed.
The test carries out the official loading after completing the preloading. This official loading is still controlled by load and carried out in the step length of 20kN. After each level, the load is held for 5 minutes, and then the corresponding data of each measuring point under the test load of this level is recorded. After loading to 100kN, the loading step size is changed to 10kN to better control the sudden occurrence of brittle failure, and at the same time, it is also conducive to carefully observing the development process of component failure.
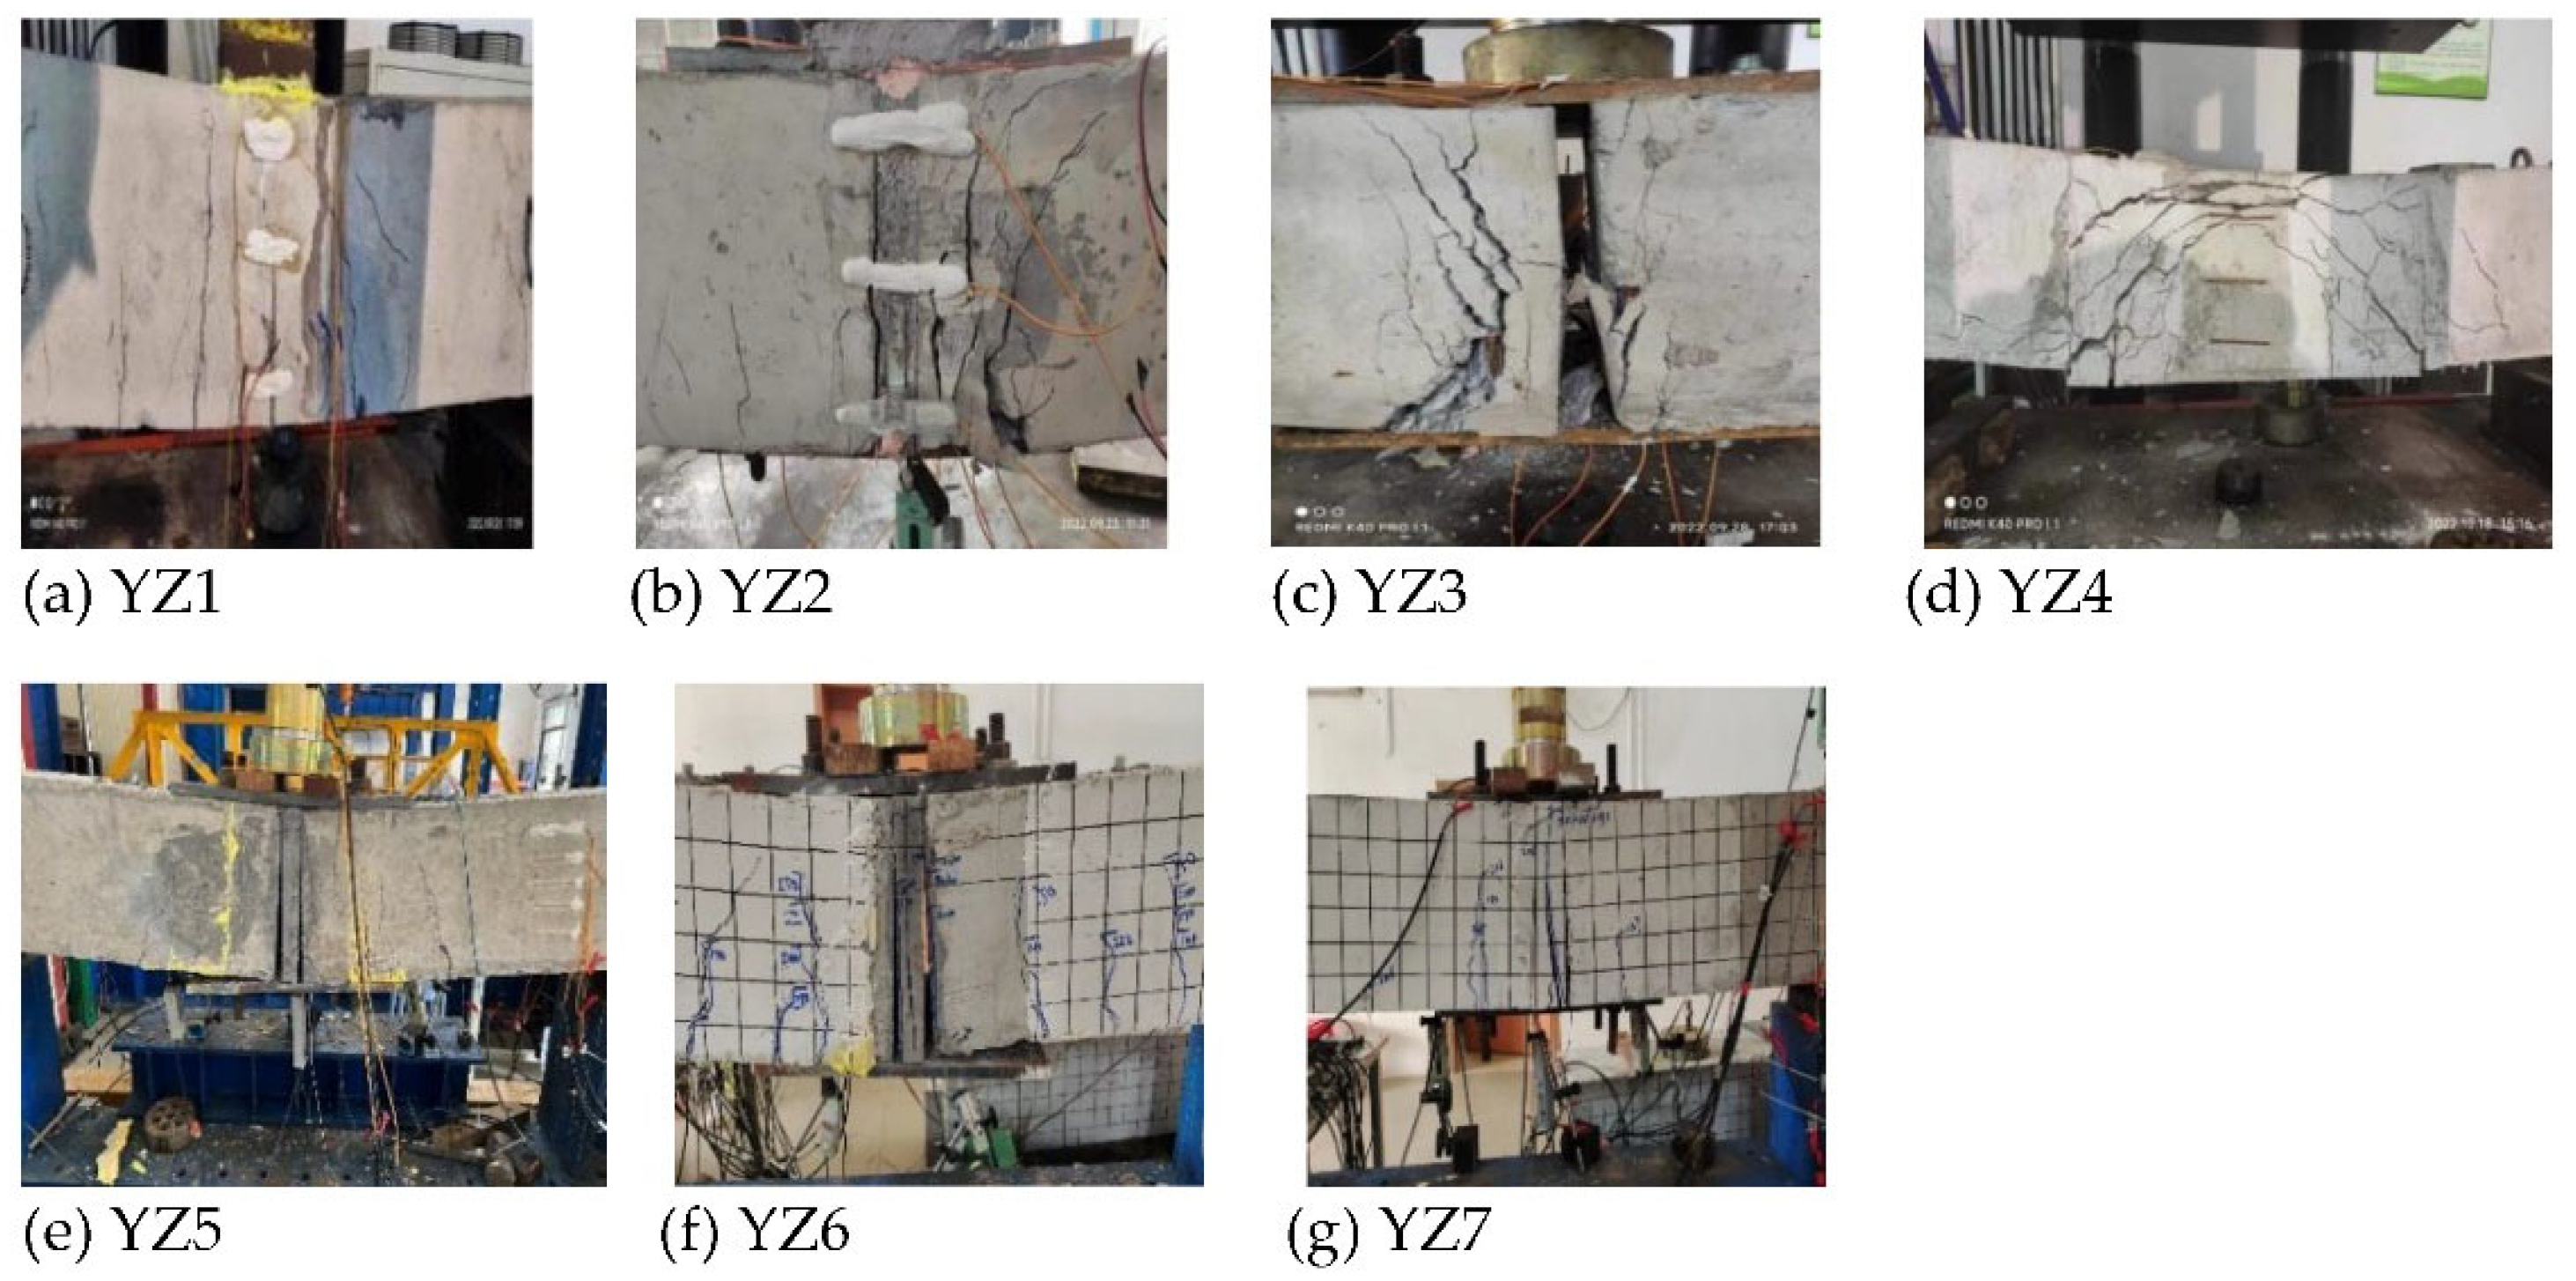
2. Experimental Phenomenon
During the entire loading process, the crack development and final failure mode of the beam are observed. When the load reaches about 160kN, Specimen YZ1 first has 1-3 vertical cracks in the lower concrete in the area near the loading point. As the load increases, the vertical cracks continue to increase and extend along the height direction. As the loading continues, individual inclined cracks begin to appear at both ends of the beam, and the deflection of the beam increases significantly. Later, when the loading continues, the number of cracks at both ends of the beam increases and the crack width becomes larger. Finally, the beam is damaged. The final failure modes of all specimens are shown in Figure 3 below. Compared with the ordinary concrete beam Specimen YZ1, Specimen YZ2 has cracks appear earlier. When the load reaches 70kN, Specimen YZ1 has cracks near the loading point, and when it is finally damaged, several large cracks are densely connected nearby. In the whole process, the deflection rate of Specimen YZ3 with load increase is obviously greater than that of ordinary slow concrete beam Specimen YZ1, and its ultimate load is also much lower than that of Specimen YZ1.
When Specimen YZ4 is subjected to load, the lower concrete at a certain distance from the loading point first appears vertical cracks. Then, inclined cracks extending in the direction of the loading point appear on the two small beams of Specimen YZ4. Finally, these inclined cracks intersect in the upper concrete near the loading point, and the specimen reaches the ultimate bearing state and is damaged. During loading, two obvious vertical cracks extending upward are generated at the interface between the two small beams and cement mortar of Specimen YZ5. When specimens YZ6 and YZ7 are subjected to load, obvious vertical cracks are generated at the interface between the small beam and cement mortar, and at the same time, several inclined cracks extending in the direction of the loading point appear nearby.
Figure 3.
Failure pattern of the specimen.
3. Experimental Results and Analysis
3.1. Analysis of Load-Deflection Curve
The load-deflection curve results of each specimen are shown in Figure 4. The load-deflection curves of all beam specimens can be regarded as linear curves at the beginning. However, when the load increases, the concrete has the first crack, and the load-deflection curve begins to become nonlinear. Finally, as the load increases, the specimen is damaged and the curve no longer rises.
The ultimate loads of each specimen and their corresponding mid-span deflections are shown in Table 2. It can be seen that different connection methods have great differences in the ultimate load of beams, which indicates that the connection method at the joint has an impact on the overall mechanical properties of the structure. The ultimate load of Specimen YZ4 based on the lap connection method of steel bars is equivalent to that of ordinary concrete beam YZ1, but its deflection is much lower than that of ordinary concrete beam YZ1, demonstrating that Specimen YZ4 has low ductility, which will be discussed in detail later in this paper. Comparing the results of the ultimate bearing capacity of specimens YZ3 and YZ3, it can be found that whether the joint pores are filled or not has a great influence on the ultimate load. The ultimate load without filling is reduced by 23.5% compared to that with filling, from 153kN to 117kN. In addition, it can be seen that the ultimate loads of specimens YZ5-YZ7 are slightly higher than the ultimate load of ordinary concrete beam YZ1, showing that the connection method of embedding holes in steel sleeves which is filled with cement mortar in the middle and anchoring end plates (U-shaped steel bars) has a better connection effect for joints and beams.
3.2. Average Bending Stiffness
In order to analyze the change of the flexural stiffness of the beam during loading, the average section stiffness BS is calculated by the following equation for analysis:
where F is the load, L is the beam length and is the deflection.
As shown in Table 3, the flexural stiffness of the specimen beams obtained through different connection methods varies greatly. When the specimen beams YZ2-YZ9 in this paper are damaged, its flexural stiffness is less than the initial flexural stiffness, which is consistent with that of the conventional concrete beam Specimen YZ1. Compared with other specimens, the initial stiffness of Specimen YZ2 and Specimen YZ3 is quite small, which conforms to the observation in the experiment that the displacement increases with the load at a speed greater than that of the ordinary concrete beam Specimen YZ1. In addition, when Specimen YZ2 and Specimen YZ3 are damaged, the bending stiffness does not change much compared with the initial flexural stiffness. This indicates that the failure of Specimen YZ2 and YZ3 at a lower load is likely due to brittle failure at the weak part of the connection, and the concrete has not reached its ultimate state. The initial flexural stiffness of Specimen YZ4 is greater than the flexural stiffness of ordinary concrete beams, and it still has a considerable flexural stiffness when it is damaged.
Furthermore, it can be observed from the table that the initial flexural stiffness of Specimen YZ8 is the largest, and the initial flexural stiffness of Specimen YZ7 is also higher than that of most specimens. This displays that the initial flexural stiffness of the joint can be significantly improved through embedding holes in steel sleeves, filling with cement mortar in the middle and anchoring the connection with end plates. What’s more, the initial bending stiffness of Specimen YZ8 anchored with a 16mm-thick steel plate is significantly higher than that of Specimen YZ7 anchored with a 14mm-thick steel plate. This demonstrates that the stiffness of the steel plate used for end plate anchoring has a great influence on the flexural stiffness of the joint section. For Specimen YZ6 treated by embedding holes in steel sleeves, filling with cement mortar in the middle and anchoring with end plates from loading to failure, its flexural stiffness and that of ordinary concrete beam Specimen YZ1 both have large change rate in this process, reaching more than 80%, showing that Specimen YZ6 also has obvious deflection deformation before failure.
3.3. Displacement Ductility and Energy Absorption
Ductility is generally used to express a structure's ability to resist inelastic behavior. The displacement ductility ratio is typically defined to characterize the ductility of structural elements. Based on previous literature, there are various models for calculating the displacement ductility ratio. Usually, the Park model [11] is adopted to calculate the displacement ductility ratio. According to the model, the ductility ratio of displacement is expressed as the ratio of the displacement corresponding to the ultimate load (Δu) and the displacement corresponding to the equivalent elastic-plastic yield point (Δy) (as shown in Equation (1)). Here, the equivalent elastic-plastic yield point (Δy) corresponds to the displacement at the intersection of the tangent at the initial point of the load-displacement curve and the maximum point.
The displacement ductility ratio of each specimen is shown in Table 4. From the table, it can be seen that the ordinary concrete beam Specimen YZ1 has the highest ductility, while Specimen YZ6 has ductility comparable to that of the ordinary concrete beam. The ductility of the other specimens is significantly lower than that of these two. This indicates that in actual engineering, if the connections at the joints of prefabricated structures are not properly treated, the entire structure's ability to resist non-elastic behavior at the joints will be significantly reduced, much lower than that of cast-in-place concrete beams. For example, the displacement ductility ratios of specimens YZ2 and YZ3 are much lower than that of Specimen YZ1. In existing literature[12], the minimum ductility ratio for ductile structural design is 3, while specimens YZ2, YZ4, and YZ7 do not meet this standard. However, using steel sleeves with embedded holes, filling them with cement mortar, and anchoring end plates at the joints can ensure the ductility of the prefabricated concrete beams. For instance, the displacement ductility ratio of Specimen YZ6 is comparable to that of Specimen YZ1. The thickness of the steel plates used for anchoring the end plates affects the bending stiffness at the joints, which in turn influences the ductility of the entire structure. For example, specimens YZ6 and YZ5 used different steel plate thicknesses and had different initial bending stiffnesses (as shown in Table 3), resulting in a twofold difference in their displacement ductility ratios (as shown in Table 4).
The energy absorption capacity of a beam can also be used to reflect its ability to resist inelastic deformation. The energy absorption capacity of the beam can be obtained by calculating the area under the force-displacement curve, which is the sum of the areas between two consecutive points (as shown in Equation 12).
The energy absorption ratio is defined as the ratio of the energy absorbed by the specimen beam to the energy absorbed by the ordinary concrete beam Specimen YZ1, allowing for a comparison of the energy absorption capabilities of other specimen beams and ordinary cast-in-place concrete beams. The energy absorption capacities of each specimen are shown in Table 4, and it can be observed that the results are consistent with the previous analysis. Specimen YZ6 demonstrates an ability to resist inelastic behavior comparable to that of the ordinary concrete beam, and thus both have similar energy absorption capacities. Specimen YZ4 has the lowest energy absorption capacity, which may be due to its high bending stiffness, resulting in little noticeable deflection deformation. When failure occurred at a load of 279kN, its mid-span deflection was only11 mm.
4. Conclusion
The paper explores the impact of different joint connection methods on the overall mechanical performance of beams. Through experiments and analysis of the beams, the following conclusions can be drawn:
- 1)
- The study investigates the mechanical properties of prefabricated beams with six different joint connection methods compared to cast-in-place ordinary concrete beams. The results indicate that the connection method significantly affects the overall mechanical performance of the beams. Specifically, the connection method influences the failure mode, ultimate load capacity, flexural stiffness, ductility, and energy absorption ratio of the beams.
- 2)
- Filling the joint pores or not has a considerable impact on the ultimate load. In the case of steel plate bolt connections, the ultimate load of the specimens with unfilled voids is 23.5% lower than that of the specimens with filled pores.
- 3)
- For specimens with joints connected by overlapping steel bars, the ultimate load capacity is comparable to that of ordinary concrete beams; however, their displacement ductility coefficient is 1.97, which is significantly lower than that of cast-in-place ordinary concrete beams, and their energy absorption capacity is only 18% of that of the cast-in-place ordinary concrete beams.
- 4)
- By using a steel sleeve with embedded holes, filling them with cement mortar, and employing 16mm-thick steel plates for anchoring treatment nodes of end plates, the specimen beams exhibit flexural capacity, ductility, and energy absorption capability comparable to that of cast-in-place ordinary concrete beams, which can be used for practical engineering applications.
References
- Shah Y I, Hu Z, Yin B S, et al. Flexural performance analysis of UHPC wet joint of prefabricated bridge deck[J]. Arabian Journal for Science and Engineering, 2021, 46, 11253–11266. [Google Scholar] [CrossRef]
- Nie Xin, Liu Tai. Experimental and Numerical Study on the Bending Behavior of Concrete-Concrete Composite Beams [J]. China Civil Engineering Journal, 2022, 055. [Google Scholar]
- Huang W, Hu G, Miao X, et al. Seismic performance analysis of a novel demountable precast concrete beam-column connection with multi-slit devices[J]. Journal of Building Engineering, 2021, 44, 102663. [Google Scholar] [CrossRef]
- Song Xiaohui, Lian Yongsheng. Research on the Connection Structure of Vertical Load-Bearing Component Joints in Prefabricated Concrete Buildings [J]. Building Structure, 2023, 53, 1206–1210. [Google Scholar]
- Xing Qiong. Mechanical Performance Study on the Joint of Concrete-Filled Steel Tube Columns and Steel-Concrete Composite Beams in Prefabricated Monolithic Underground Stations [J]. Urban Rail Transit Research, 2023, 26, 59–65+70. [Google Scholar]
- Karamloo M, Afzali-Naniz O, Doostmohamadi A. Impact of using different amounts of polyolefin macro fibers on fracture behavior, size effect, and mechanical properties of self-compacting lightweight concrete[J]. Construction and Building Materials, 2020, 250, 118856. [Google Scholar] [CrossRef]
- Guo Nan, Lu Fa, Yang Xiaohui, et al. Study on Bearing Characteristics and Calculation Method of Prefabricated Frame Prestressed Anchor Support Structure [J]. Chinese Journal of Geotechnical Engineering, 2022, 44, 254–258. [Google Scholar]
- Zheng Jing, An Mengkang, Su Junxia, et al. Field Experimental Study on Assembled Anchor (Cable) Frame [J]. Railway Construction, 2020, 60, 93–97. [Google Scholar]
- Cai Jianguo, Feng Jian, Wang Zan, et al. Research on Seismic Performance of Precast Prestressed Concrete Assembled Monolithic Frame [J]. Journal of Sun Yat-sen University (Natural Science Edition), 2009, 48, 136–140. [Google Scholar]
- Parastesh H, Hajirasouliha I, Ramezani R. A new ductile moment-resisting connection for precast concrete frames in seismic regions: An experimental investigation[J]. Engineering Structures, 2014, 70, 144–157. [Google Scholar] [CrossRef]
- Gulec A, Kose M M, Gogus M T. Experimental investigation of flexural performance of T-section prefabricated cage reinforced beams with self-compacting concrete[J]. Structures, 2021, 33, 2190–2197. [Google Scholar] [CrossRef]
- Sin L H, Huan W T, Islam M R, et al. Reinforced Lightweight Concrete Beams in Flexure[J]. ACI Structural Journal, 2011, 108. [Google Scholar]
Figure 1.
Section reinforcement of beam.
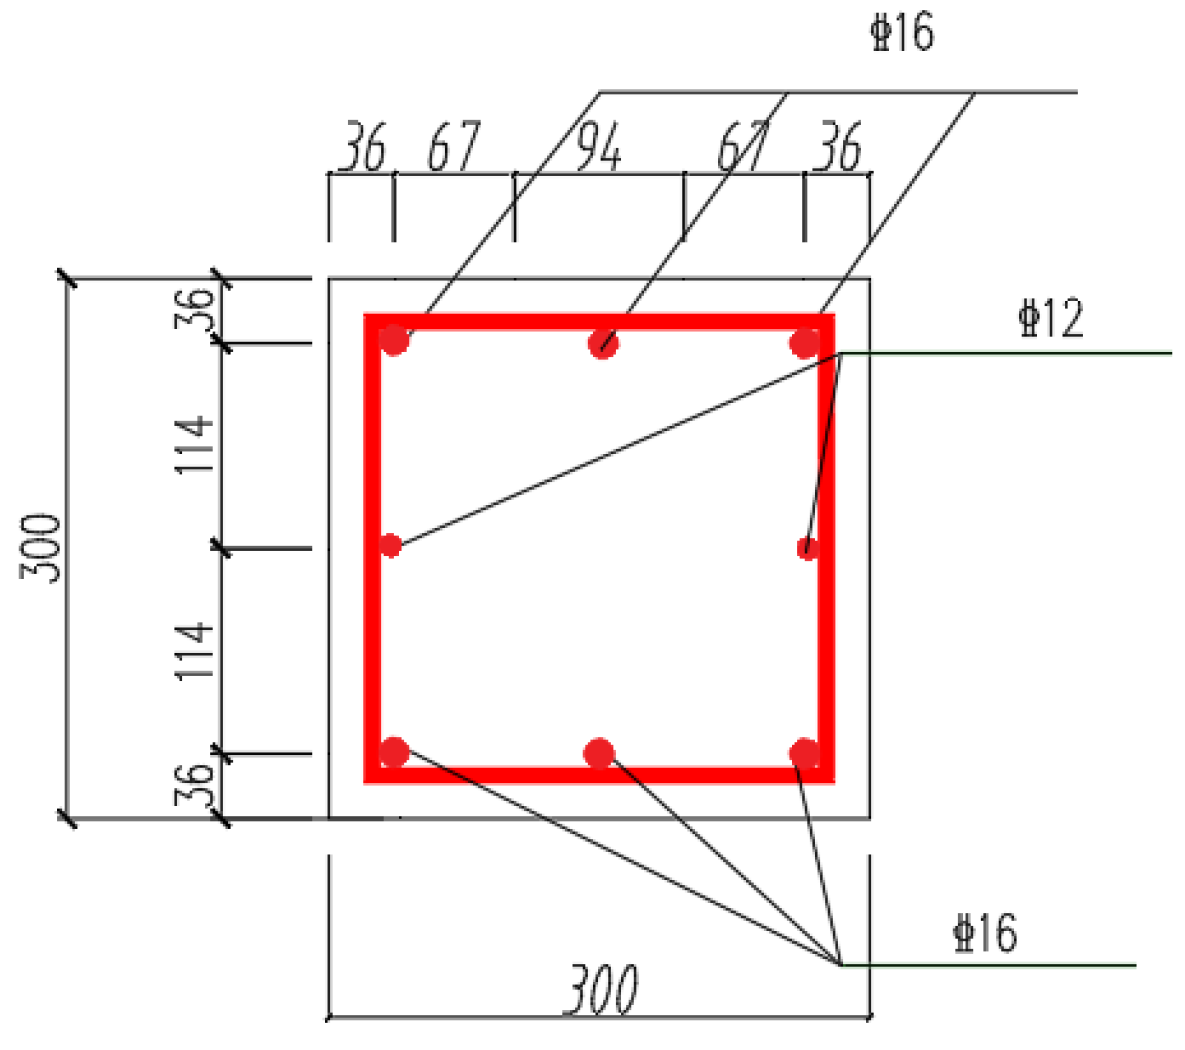
Figure 2.
Connection of specimen joints.
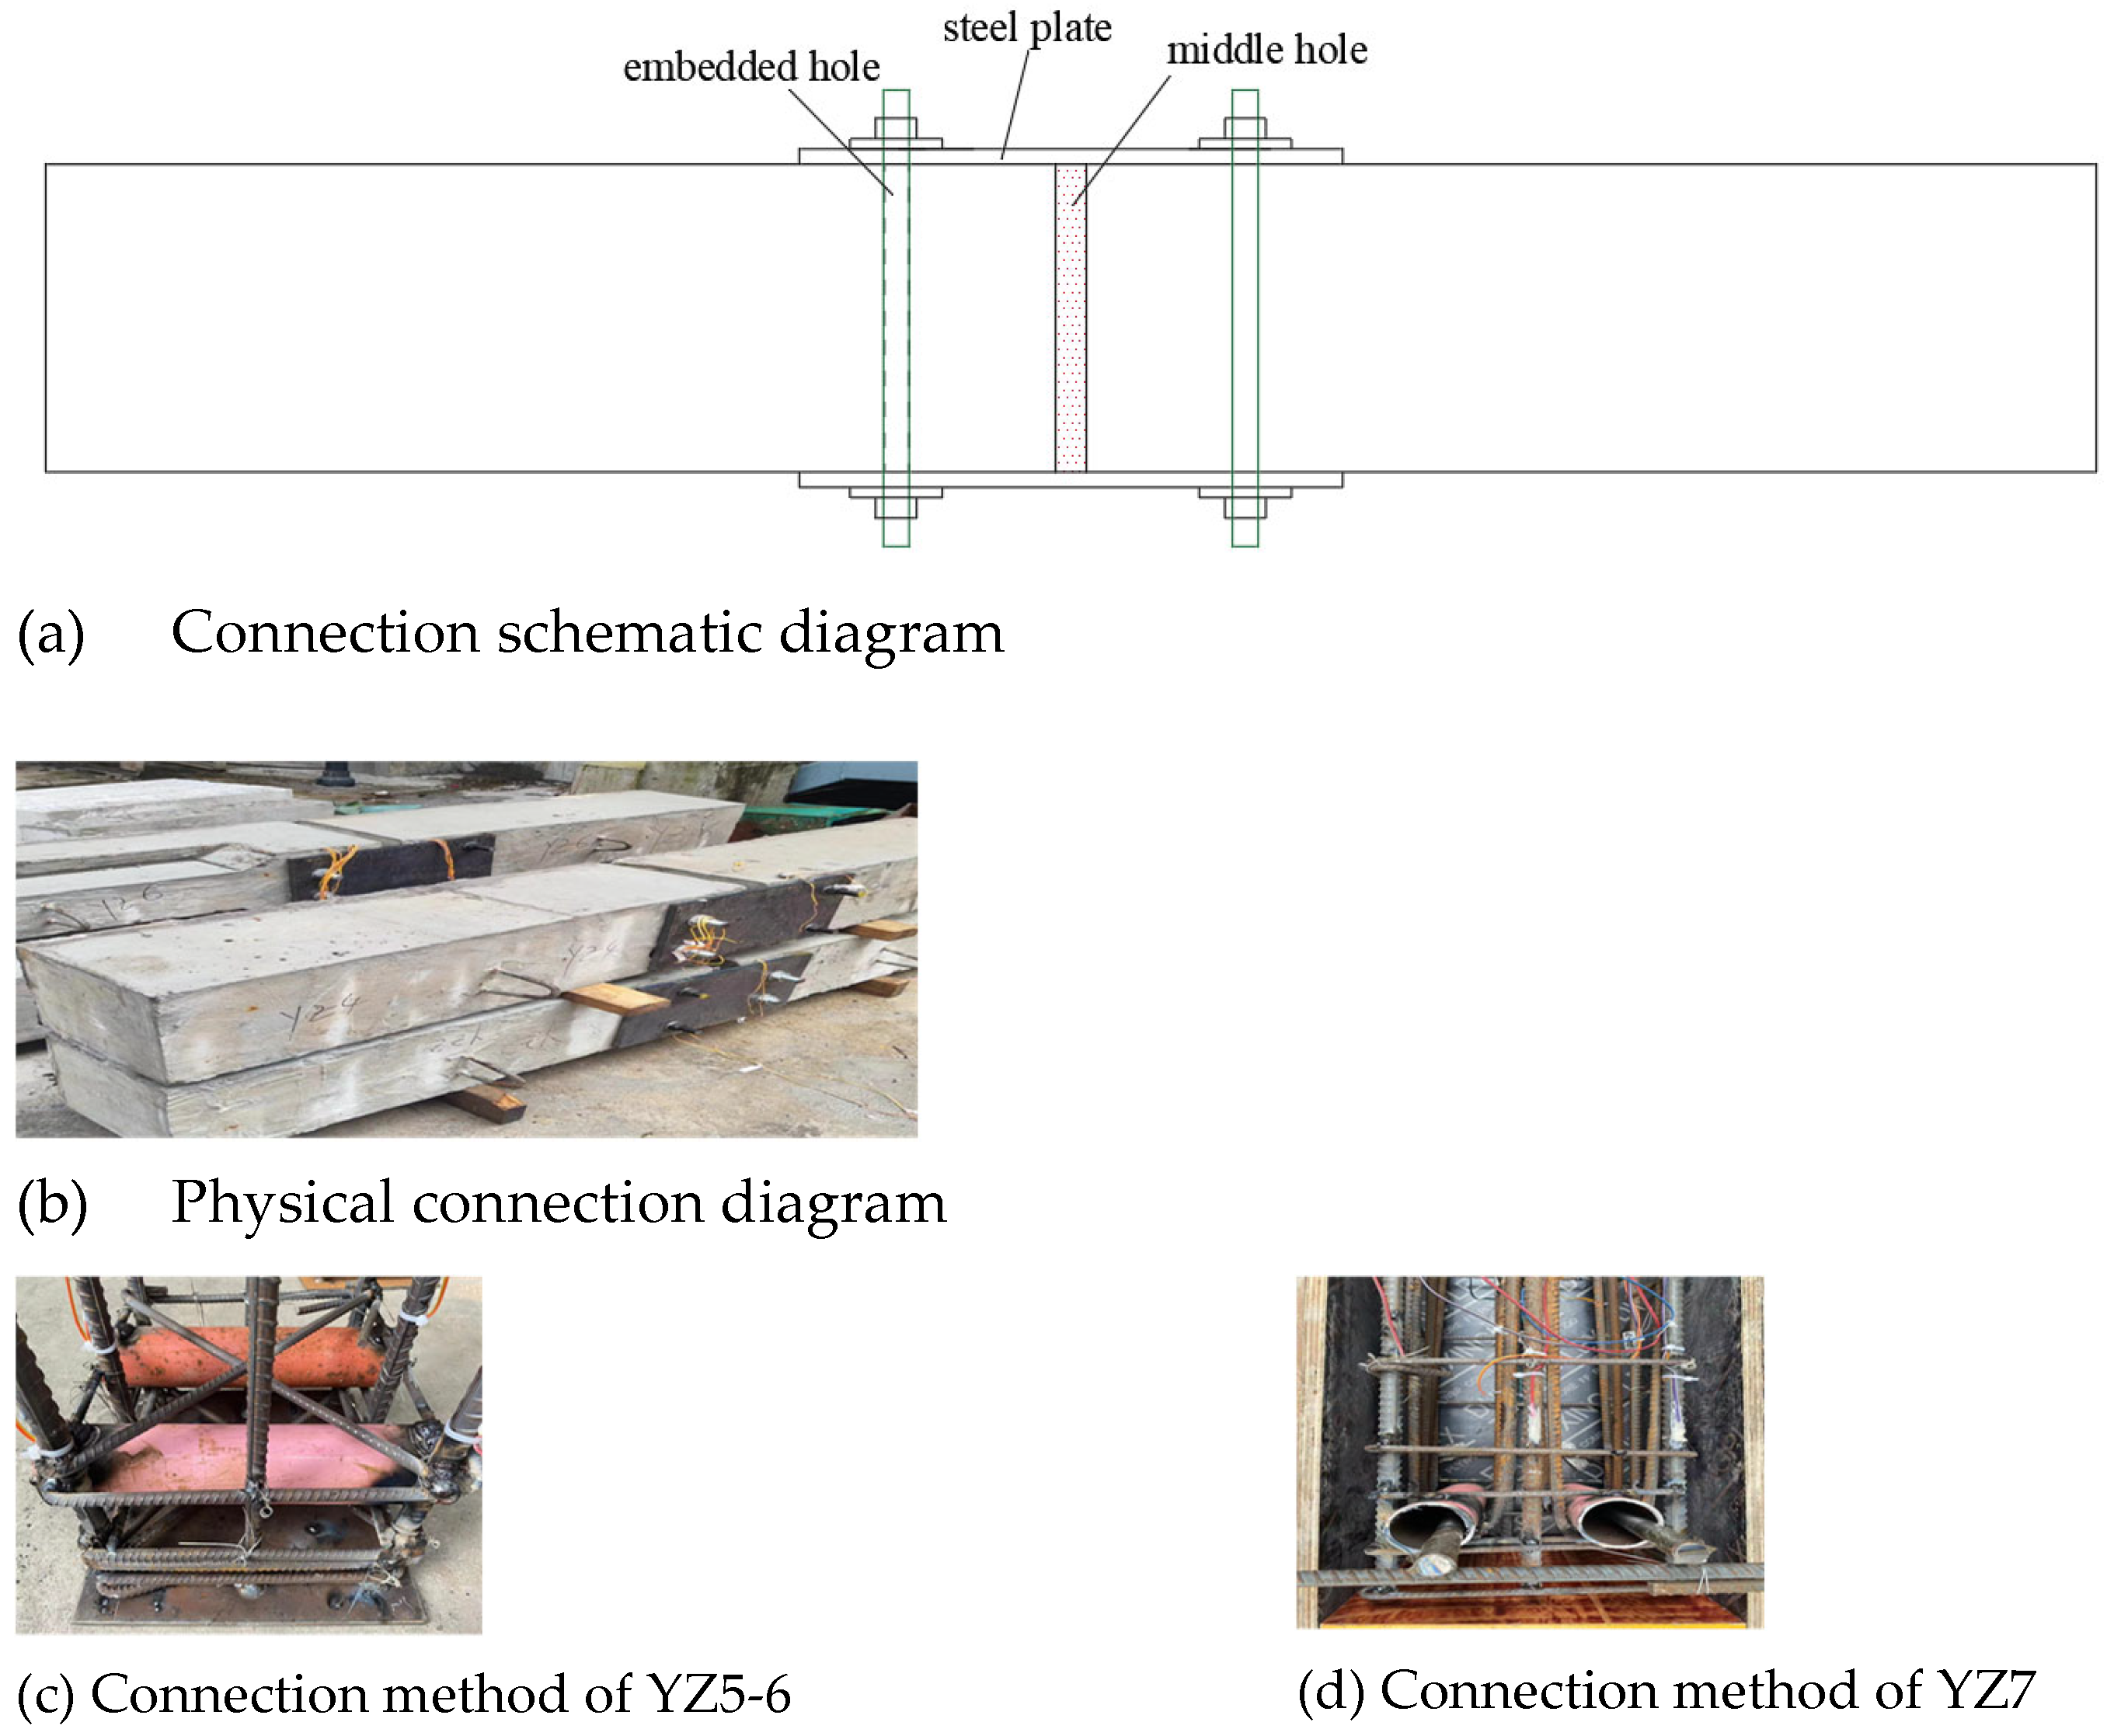
Figure 3.
Loading and measuring point arrangement.
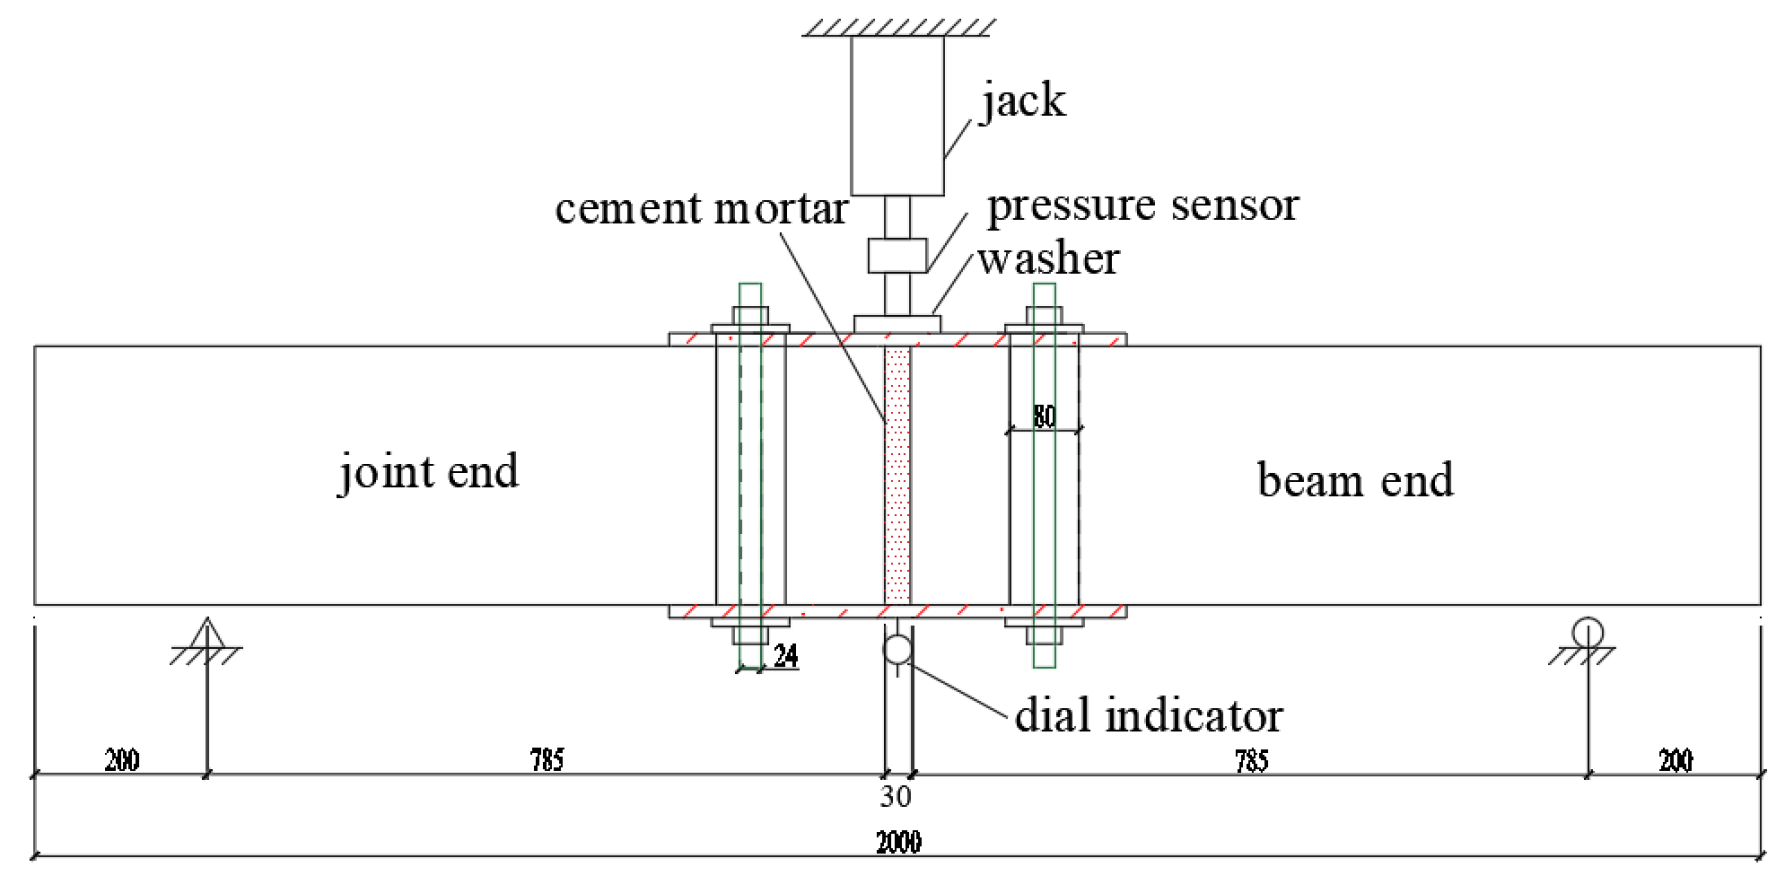
Figure 4.
Load-deflection curve.
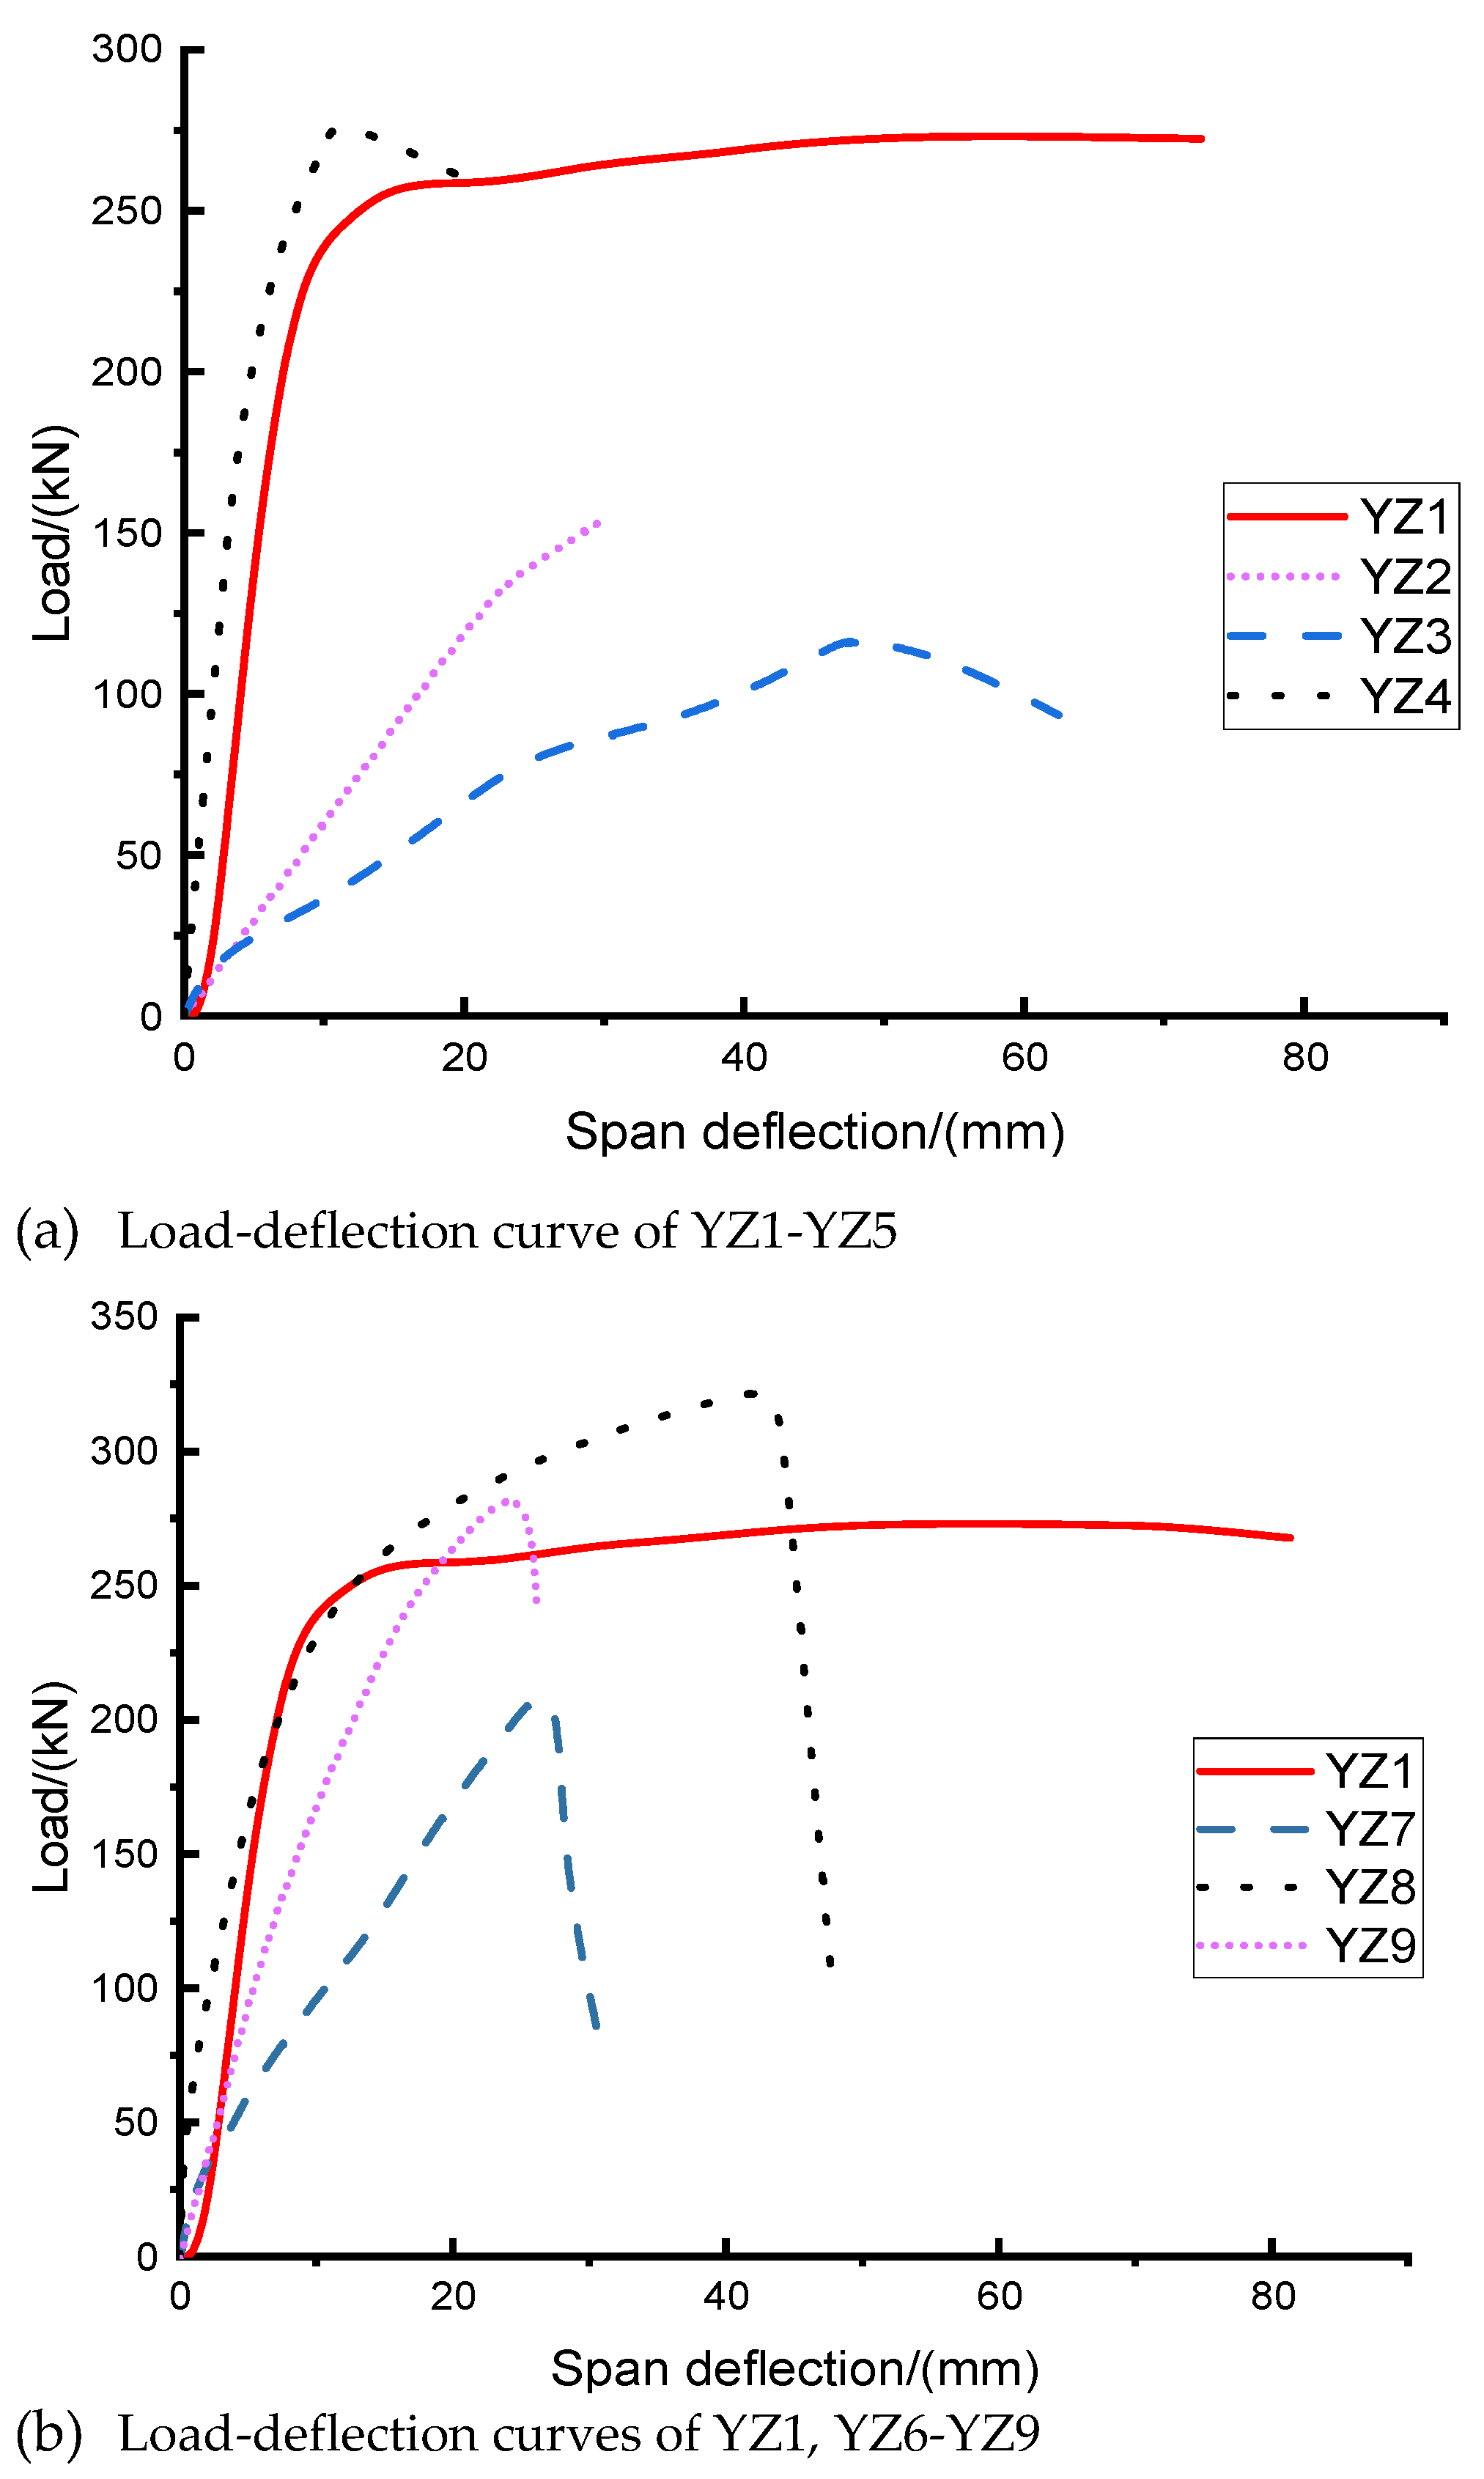

Table 1.
Experimental Design of Specimens.
| No. | Connection Method |
|---|---|
| YZ1 | Cast-in-place |
| YZ2 | Connect the steel plate by bolts, and fill the middle gap with cement mortar |
| YZ3 | Connect the steel plate by bolts, and do not fill the middle gap |
| YZ4 | Bar splicing |
| YZ5 | Embed hole for the steel sleeve, anchor the end plate and fill the embedded hole and the middle gap with cement mortar |
| YZ6 | Embed hole for the steel sleeve, anchor the end plate and fill the embedded hole and the middle gap with cement mortar |
| YZ7 | Embed hole for the steel sleeve, anchor the U bar and fill the embedded hole and the middle gap with cement mortar |
Table 2.
The ultimate load of the specimen and the corresponding mid-span deflection.
| No. | Ultimate Load /(kN) | Deflection(mm) |
|---|---|---|
| YZ1 | 273 | 72 |
| YZ2 | 151 | 28 |
| YZ3 | 118 | 48 |
| YZ4 | 279 | 11 |
| YZ5 | 219 | 27 |
| YZ6 | 325 | 42 |
| YZ7 | 291 | 25 |
Table 3.
Bending stiffness of different specimens under failure.
| No. | Initial flexural stiffness /(100kN·m2) | Flexural stiffness at failure /(100kN·m2) | Change rate |
|---|---|---|---|
| YZ1 | 24.78 | 4.81 | 80.59% |
| YZ2 | 5.12 | 4.41 | 13.87% |
| YZ3 | 3.05 | 2.11 | 30.82% |
| YZ4 | 42.64 | 21.64 | 49.25% |
| YZ5 | 22.55 | 6.74 | 70.11% |
| YZ6 | 43.72 | 6.46 | 85.22% |
| YZ7 | 15.85 | 9.77 | 38.40% |
Table 4.
The ductility and energy absorption ratio of the specimen.
| No. | Displacement ductility ratio μ | Energy absorption ratio |
|---|---|---|
| YZ1 | 7.68 | 1 |
| YZ2 | 1.11 | 0.22 |
| YZ3 | 1.45 | 0.28 |
| YZ4 | 1.97 | 0.18 |
| YZ5 | 3.25 | 0.30 |
| YZ6 | 6.62 | 0.97 |
| YZ7 | 1.59 | 0.40 |
Disclaimer/Publisher’s Note: The statements, opinions and data contained in all publications are solely those of the individual author(s) and contributor(s) and not of MDPI and/or the editor(s). MDPI and/or the editor(s) disclaim responsibility for any injury to people or property resulting from any ideas, methods, instructions or products referred to in the content. |
© 2024 by the authors. Licensee MDPI, Basel, Switzerland. This article is an open access article distributed under the terms and conditions of the Creative Commons Attribution (CC BY) license (http://creativecommons.org/licenses/by/4.0/).
Copyright: This open access article is published under a Creative Commons CC BY 4.0 license, which permit the free download, distribution, and reuse, provided that the author and preprint are cited in any reuse.


