
Submitted:
22 October 2024
Posted:
24 October 2024
You are already at the latest version
Preprints on COVID-19 and SARS-CoV-2
Abstract
Objectives: Persistent symptoms following acute COVID-19 infection, collectively termed Long COVID syndrome, have been increasingly reported. However, data on the prevalence and characteristics of Long COVID remain limited. This study aimed to evaluate the occurrence and presentation of Long COVID syndrome in individuals in-fected with COVID-19 and monitored in outpatient, ward, or intensive care settings. Methods: Patients diagnosed with COVID-19 and followed up at the Department of In-fectious Diseases and Clinical Microbiology, Çukurova University Faculty of Medicine, for a minimum of four weeks post-infection were included in this study. Demographic data, including age, gender, and comorbidities, were recorded. Patients were followed up for 12 months, with symptom assessment at baseline and 1, 3, 6, and 12 months post-infection. Functional status was evaluated using the Post-COVID-19 Functional Status (PCFS) scale, and quality of life was assessed using the SF-36 Health Survey question-naire. Results: 134 patients (71 males, 54.2%) participated in the study, with a mean age of 43.7±15.3 years (median: 45, range: 18-83). The distribution of patients across care settings was as follows: 51.1% outpatient, 35.9% ward, and 13% intensive care unit (ICU). Fatigue during exertion was the most frequently reported Long COVID symptom across all follow-up timepoints. Patients treated in the ICU experienced a higher burden of Long COVID symptoms compared to those in outpatient or ward settings. Furthermore, the PCFS scale revealed significantly poorer quality of life and functional status in patients treated in the ICU and wards than those receiving outpatient care. Conclusions: Long COVID syndrome poses a significant ongoing health concern, particularly for patients requiring intensive care during acute COVID-19 infection. Our findings underscore the importance of vigilant monitoring for long-term sequelae, particularly concerning quality of life and functional status, in all individuals recovering from SARS-CoV-2 infection.
Keywords:
Long COVID-19
; Post-COVID-19 Functional Status (PCFS) scale
; SF-36
1. Introduction
Severe acute respiratory syndrome coronavirus 2 (SARS-CoV-2), detected in China in December 2019 and rapidly spread worldwide, causing a global epidemic, has continued to spread rapidly worldwide with the emergence of new variants [1]. While many patients recover within 2-3 weeks after COVID-19, it has been reported that some people have long-lasting symptoms [2]. Information about the long-term effects of COVID-19 is becoming clearer every day. Based on the evidence obtained in the SARS epidemics in 2003 and the Middle East Respiratory Syndrome (MERS) epidemics in 2012, caused by other coronaviruses, long-term symptoms such as impaired pulmonary and physical functions, decreased quality of life, and emotional stress continued after the acute disease period in these patients. It is estimated that there may be problems [3]. The number of people affected by late sequelae after the acute phase of COVID-19 is unknown. It is reported that persistent symptoms are more common in women, and the risk of persistent symptoms is linearly related to age. These effects appear to occur regardless of the initial severity of the infection and are often linked to more than one organ system [4]. There is no standardization yet in the terminology used when naming this period after COVID-19. This period in which the clinical findings of COVID-19 do not fully improve is named in various ways, such as long COVID, post-COVID-19, and post-acute COVID-19. Although there is no generally accepted name and definition, there is a general consensus among the medical literature and healthcare organizations that symptoms appear ≥4 weeks after initial infection and that the period between 4 and 12 weeks is further classified as subacute or ongoing symptomatic infection[5]. Since the absence of a globally standardized terminology and clinical case definition poses difficulties in epidemiological reporting, research, clinical management of affected patients, and treatment development, an international panel was established under the World Health Organization’s (WHO) leadership. This panel defined post-COVID-19 condition as a condition that occurs in individuals with a history of probable or confirmed SARS-CoV-2 infection, usually occurring three months after the onset of COVID-19, with symptoms lasting at least two months and cannot be explained by an alternative diagnosis. Common symptoms include fatigue, shortness of breath, and cognitive dysfunction, often impacting daily functioning[4] .This study aimed to evaluate the prevalence and characteristics of Long COVID-19 syndrome in individuals monitored as outpatients, in the ward, or intensive care due to COVID-19. Additionally, the study sought to assess patients’ functional limitations using the Post-COVID-19 Functional Status (PCFS) scale, validated for the Turkish population, and their quality of life using the SF-36 Health Survey questionnaire.
2. Materials and Methods
2.1. Study Population
Between 2020 and 2021, 131 patients diagnosed with COVID-19 by PCR testing of nasopharyngeal swab samples and monitored at the Department of Infectious Diseases and Clinical Microbiology, Çukurova University Faculty of Medicine, were enrolled in this study. Participants were included if they expressed willingness to participate four weeks post-diagnosis. Individuals under the age of 18, individuals unable to complete the study forms due to dementia, learning disabilities, or other cognitive or communication disorders, and patients with a duration of COVID-19 illness less than four weeks were excluded from the study. Informed consent was obtained from all participants who agreed to participate in the study. This study was approved by the Ethics Committee of Çukurova University Faculty of Medicine (approval number: [insert number], date: [insert date]). A structured questionnaire was designed to collect information on patients’ current health status and persistent symptoms in the post-COVID period. All eligible patients were contacted for participation. The questionnaire collected demographic data, including age, gender, and the presence of comorbidities such as diabetes mellitus, hypertension, cardiovascular disease, chronic obstructive pulmonary disease (COPD), asthma, malignancy, chronic renal failure, obesity, and HIV infection. The presence and nature of Long COVID symptoms were also assessed. Patients were grouped and recorded according to their level of care during COVID-19: outpatient monitoring, ward monitoring, or intensive care unit (ICU) monitoring. For patients requiring ward or ICU care, the length of their hospital stay was recorded. A comprehensive assessment of COVID-19 symptoms was conducted. These included fever,weakness, fatigue during exertion, cough, shortness of breath, myalgia, arthralgia, palpitations, headache, sleep disturbance, forgetfulness, difficulty concentrating, loss of appetite, loss of smell, loss of taste, diarrhea, skin findings, and visual impairment. Patients were also asked about any other complaints they experienced. These symptoms were questioned and recorded both at the time of diagnosis and 1, 3, 6, and 12-month follow-up intervals. The "Post-COVID-19 Functional Status Scale" (PCFS) was applied at 1, 3, 6, and 12 months post-diagnosis to measure functional status. Additionally, the "SF-36 survey" was administered at the same follow-up intervals to assess quality of life. Finally, patient outcomes were documented as either recovery or death (exitus).
2.1.1. Post-COVID-19 Functional Status Scale
The Post-COVID-19 Functional Status (PCFS) scale, developed by Klok et al., is an ordinal scale designed to assess functional recovery in patients at 4 and 8 weeks post-hospital discharge and functional sequelae at 6 months. It comprises six grades, ranging from 0 (no functional limitations) to 5 (death). Grade D is assigned to patients who have died. From grade 1 onwards, increasing degrees of symptoms, pain, or anxiety are observed. The PCFS scale classifies functional status limitations as follows: Grade 0: No functional limitations, Grade 1: Negligible functional limitations, Grade 2: Mild functional limitations, Grade 3: Moderate functional limitations, Grade 4: Severe functional limitations, Grade 5: Death [6].
2.1.2 Short Form 36 (SF 36)
The Short Form 36 (SF-36) Health Survey is a generic quality-of-life instrument that provides a broad assessment of health status. It consists of 36 items and evaluates health status with eight sub-parameters. These parameters are physical function (10 items), social function (2 items), role limitations due to physical functions (4 items), role limitations due to emotional problems (3 items), mental health (5 items), energy/vitality (4 items), pain (2 items), and general perception of health (5 items). Instead of giving a single total score, the scale gives a total score for each subscale separately. Subscales evaluate health between 0 and 100, with 0 indicating poor health and 100 indicating good health [7].
2.2. Data Analysis and Statistical Methods
Statistical analysis was performed using SPSS (Statistical Package for the Social Sciences) version 25.0. Categorical variables were summarized as frequencies and percentages, as means and standard deviations (medians and minimum-maximum values when appropriate). Chi-square and Fisher’s exact tests were employed for comparisons between categorical variables. The Shapiro-Wilk test was used to assess the normality of distribution for continuous variables. For non-normally distributed data, the Kruskal-Wallis test was applied. Post hoc analysis was conducted using Tamhane’s T2 test to identify specific group differences. A significance level of 0.05 was used for all statistical tests.
3. Results
In total, 131 patients were included in the study, of whom 71 (54.2%) were male. The mean age of the patients was 43.7 years ± 15.3 years (Median: 45, Range: 18-83). Comorbidities were present in 81 (61.8%) patients. The most prevalent comorbidity was hypertension (23, 17.6%), followed by cardiovascular disease (18, 13.7%) and diabetes mellitus (15,11.5%). Most patients, 67 (51.1%), were treated on an outpatient basis. However, 47 (35.9%) were deemed appropriate for general ward admission, and 17 (13.0%) met the criteria for intensive care unit (ICU) admission. Notably, the mean age of patients treated in the ICU was significantly higher than those treated in the general ward or as outpatients (p < 0.05). Furthermore, the ICU and general ward groups had a higher proportion of male patients and a greater prevalence of comorbidities such as diabetes (p = 0.029), hypertension (p = 0.028), and cardiovascular disease (p < 0.001) compared to the outpatient group (Table 1).
Evaluation of patient symptoms revealed that 99.2% experienced at least one symptom at the time of diagnosis. This rate progressively decreased over time: 87% at 1 month, 68.7% at 3 months, 55.6% at 6 months, at 48.9% at 12 months (Figure 1).
Evaluation of patient symptoms revealed distinct temporal patterns. At diagnosis, the most prevalent symptoms included weakness and fatigue (86.3%), easy fatigue during exertion (70.2%), cough (69.5%), and myalgia (71.0%). By the first month, easy fatigue during exertion (74.8%) and weakness and fatigue (56.5%) remained the most common complaints. Notably easy fatigue during exertion persisted as the primary symptom throughout the follow-up period, affecting 50.4% of patients at 3 months, 38.2% at 6 months, and 36.6% at 12 months. A comprehensive breakdown of symptom frequencies at each time point is available in Table 2.
At diagnosis, outpatients had a significantly lower frequency of fever (p=0.021) and dyspnea (p=0.002) compared to patients treated in the ward or intensive care unit. Conversely out patients exhibited a higher frequency of loss of smell (p<0.001) and loss of taste(p=0.010). Analysis of COVID-19 symptoms at 1-, 3-, 6-, and 12-months post-diagnosis revealed that patients initially treated in intensive care units experienced significantly higher rates of persistent symptoms than those treated in general wards or as outpatients. It is shown in detail in table 3
Table 4 summarizes the distribution of patient scores on the PCFS scale at various time points: pre-COVID-19, diagnosis,and at 1, 3, 6, and 12 months post-diagnosis. While 71.8% of patients reported no or negligible functional limitation (PCFS scores 0 or 1) in the pre-COVID-19 period, this percentage dropped to 14.6% at one month post-diagnosis. Although there was improvement over time, with 44.2% reporting no or negligible limitation at six months and 50% at twelve months, a full return to pre-COVID-19 functional status was not observed in all patients.
Analysis of PCFS scale scores in outpatient patients revealed significant differences compared to those treated in wards or intensive care units (ICUs). Outpatients exhibited a higher frequency of no functional limitation (grade 0) in the pre-COVID period (p<0.001), at diagnosis (p < 0.001), and at the 12-month follow-up. Conversely, patients treated in wards or ICUs had a higher frequency of severe functional limitation (grade 4) at one- month post-diagnosis (p < 0.001) and a higher frequency of moderate to severe limitations (grades 3 and 4) at three months (p = 0.002). (Table 5).

Table 5.
Review of findings on PCFS and differences between study groups.
| Outpatient (n=67) |
General ward (n=47) |
Intensive care unit (n=17) |
pa | |
|---|---|---|---|---|
| n(%) | n(%) | n(%) | ||
| PCFS scale Pre-COVID-19 | ||||
| 0 | 59 (88,1) | 30 (63,8) | 5 (29,4) | <0,001** |
| 1 | - | - | - | |
| 2 | 8 (11,9) | 15 (31,9) | 11 (64,7) | |
| 3 | - | 2(4,3) | 1(5,9) | |
| 4 | - | - | - | |
| PCFS scale at diagnosis | ||||
| 0 | 2 (3,0) | - | - | <0,001** |
| 1 | 8 (11,9) | 2 (4,3) | - | |
| 2 | 10 (14,9) | 1 (2,1) | - | |
| 3 | 42 (62,7) | 37 (78,7) | 9 (52,9) | |
| 4 | 5 (7,5) | 7 (14,9) | 8 (47,1) | |
| PCFS scale at 1. month post-diagnosis | ||||
| 0 | 7 (10,4) | 7 (14,9) | 1 (5,9) | <0,001** |
| 1 | 4 (6,0) | - | - | |
| 2 | 11 (16,4) | 6 (12,8) | - | |
| 3 | 44 (65,7) | 32 (68,1) | 9 (52,9) | |
| 4 | 1 (1,5) | 2 (4,3) | 7 (41,2) | |
| PCFS scale at 3rd month post-diagnosis | ||||
| 0 | 17 (25,8) | 14 (29,8) | 1 (5,9) | 0,003** |
| 1 | 9 (13,6) | 1 (2,1) | - | |
| 2 | 17 (25,8) | 9 (19,1) | 4 (23,5) | |
| 3 | 23 (34,8) | 22 (46,8) | 10 (58,8) | |
| 4 | - | - | 2 (11,8) | |
| D | - | 1(2,1) | - | |
| PCFS scale at 6th month post-diagnosis | ||||
| 0 | 26 (40,0) | 17 (36,2) | 2 (11,8) | 0,121 |
| 1 | 9 (13,8) | 2 (4,3) | 1 (5,9) | |
| 2 | 17 (26,2) | 15 (31,9) | 5 (29,4) | |
| 3 | 13 (20,0) | 11 (23,4) | 8 (47,1) | |
| 4 | - | 1 (2,2) | 1 (5,9) | |
| D | - | 1(2,1) | - | |
| PCFS scale at 12th month post-diagnosis | ||||
| 0 | 36 (55,4) | 16 (34,8) | 2 (11,8) | 0,003** |
| 1 | 7 (10,8) | 2 (4,3) | 1 (5,9) | |
| 2 | 16 (24,6) | 18 (39,1) | 8 (47,1) | |
| 3 | 6(9,2) | 7(15,2) | 6(35,3) | |
| 4 | - | - | - | |
| D | - | 3(6,5) | - |
* p<0,05, **p<0,001, a: ki-kare ve fisher exact test.
Table 6.
Scores on the SF-36 Scale at 1st, 3rd, 6th, and 12th Months Post-Diagnosis.
| 1st month | 3rd month | 6th month | 12th month | |
|---|---|---|---|---|
| (mean ± SD) |
(mean ± SD) |
(mean ± SD) |
(mean ± SD) | |
| Physical Function | 65,6±32,9 | 80,9±24,5 | 89,1±18,7 | 91,1±14,2 |
| Physical Role Difficulty | 34,5±42,9 | 67,4±42,3 | 79,6±35,1 | 85,4±30,9 |
| Emotional Role Difficulty | 44,3±46,3 | 74,9±40,4 | 83,2±33,8 | 92,3±25,8 |
| Energy vitality | 34,9±23,8 | 55,1±21,4 | 58,7±20,9 | 63,6±15,2 |
| Mental health | 54,3±22,3 | 66,5±17,7 | 68,8±17,2 | 68,7±12,6 |
| Social Functioning | 43,4±31,8 | 62,5±28,9 | 71,1±27,1 | 80,1±18,2 |
| Pain | 56,0±33,8 | 76,2±26,7 | 82,5±23,9 | 91,0±17,7 |
| General Health Perception | 51,1±21,1 | 60,5±18,6 | 65,6±18,3 | 70,5±15,5 |
In our study, comparing the eight SF-36 subscale scores at 1- and 3-months post-diagnosis to normative data from the Turkish population revealed significantly lower scores across all domains. However, significant improvements in these scores were observed at 6- and 12-months post-diagnosis (Figure 2).
Analysis of the SF-36 scale scores at one-month post-diagnosis revealed that patients initially treated in the intensive care unit (ICU) had significantly lower scores in physical function (p<0.001), physical role difficulty (p=0.001), energy vitality (p=0.028), social functioning (p=0.001), and general health perception (p<0.001) compared to those treated on general wards or as outpatients. At twelve months, these differences persisted for physical function (p=0.001), physical role difficulty (p=0.025), and social functioning (p=0.031), with ICU patients still reporting lower scores. To assess the change in quality of life over time, delta scale values were calculated between the 12th and 1st month scores (Table 7).
This analysis demonstrated that ICU patients experienced greater improvement in physical function (p=0.001), emotional role difficulty (p=0.049), and general health perception (p<0.001) compared to the other groups.
4. Discussion
This study demonstrated that individuals treated in hospital wards or intensive care units (ICUs) due to COVID-19 had a higher incidence of Long COVID and experienced greater impairment in their quality of life and functional status compared to those treated as outpatients. These findings contribute to the growing body of literature elucidating the impact of persistent post-COVID-19 symptoms on patients’ well-being and daily functioning. Notably, this is the first study in the Turkish population to assess both quality of life using the SF-36 Health Survey and functional status using the Post-COVID-19 Functional Status (PCFS) scale in individuals with Long COVID.
COVID-19 related symptoms are quite heterogeneous, likewise a wide variety of symptoms have been reported in the post-COVID-19 period. In this study, the rate of at least one symptom in patients was found to be 87% in the 1st month, 68.7% in the 3rd month, 55.6% in the 6th month, and 48.9% in the 12th month. In a study conducted on 143 patients in Italy, patients were evaluated for persistent symptoms 60 days after discharge, only 18 (12.6%) reported no symptoms related to COVID-19, while 32% had 1 or 2 symptoms and 55% It was observed that 3 or more symptoms were present. The most common symptoms were reported as fatigue (53.1%), shortness of breath (43.4%), arthralgia (27.3%), and chest pain (21.7%) [2]. In a meta-analysis of 21 studies evaluating 47,910 Long-COVID-19 patients, 55 long-term symptoms associated with COVID-19 were reported. In this study, fatigue (58%), headache (44%), attention deficit (27%), hair loss (25%), and shortness of breath (24%) were the 5 most common symptoms that persisted in patients recovering from COVID-19 [8]. In the current study, the most common symptoms experienced by patients during the first month post-COVID-19 infection were: fatigue during exertion (74.8%), fatigue (56.5%), myalgia (34.4%), arthralgia (27.5%), and dyspnea (26.7%). These five symptoms emerged as the most prevalent in the initial phase of recovery. Notably, fatigue, weakness, and fatigue during exertion persisted as the most commonly reported symptoms at the 3, 6, and 12-month follow-up assessments. Huang et al and Peghin et al reported the results of patient evaluation at an average of 6 months after acute COVID-19. Huang et al. evaluated 1733 COVID-19 patients at an average of 6 months from symptom onset. In this study, 76% of the patients stated that they still had ongoing symptoms, and this rate was found to be even higher in those with severe disease [9]. Peghin et al. (2023) reported a prevalence of 40.2% for persistent COVID-19 symptoms in their 6-month follow-up study, which included 599 patients with a range of disease severities from asymptomatic to severe and critical. The study found that dyspnea, fatigue, and neurological symptoms were significantly associated with the severe disease group, while loss of taste and smell and other sensory disorders were significantly associated with individuals who experienced mild illness. [10] Consistent with the literature, patients were assessed at 1-, 3-, 6-, and 12-months post-diagnosis in the current study. When evaluated at each time point, symptoms of fatigue during exertion, weakness/fatigue, dyspnea, sleep disturbance, forgetfulness, and palpitations were significantly more prevalent in the ICU-treated patient group compared to those treated in outpatient and ward settings. As in the study by Peghin et al, taste and smell disorders at diagnosis and at 3 months were significantly higher in the outpatient group (p<0.05) [10]. COVID-19 has affected millions of people worldwide, impacting both short- and long-term quality of life. Quality of life, an important concept in evaluating the impact of diseases on a person, can be affected by a combination of factors such as psychological, social, emotional, physical, and mental health [11]. The effect of COVID-19 on health-related quality of life in people who have recovered from COVID-19 has been examined in many studies. It is possible to assess quality of life through numerous general or disease-related questionnaires. The SF-36 test is one of the widely used scales for this purpose. This study found that some of the SF-36 subparameters were more negatively affected, and SF-36 scale scores were found to be lower in the seriously ill patient group treated in intensive care compared to the outpatient and ward-treated patient group. This finding aligns with an observational cohort study conducted in America, where 62 patients who recovered from COVID-19 were evaluated with the SF-36 quality of life scale. Participants were categorized as having mild, moderate, or severe disease based on their oxygen requirements during the acute phase of the disease. The SF-36 scale was applied at least 15 days after SARS-Cov-2 PCR positivity. When SF-36 subscale scores were evaluated, patients with moderate and severe disease were reported to have significantly lower scores in physical function, role limitation due to physical health, energy/vitality, social functionality, and general health subscale scores when compared to participants with mild disease. This study emphasized that severe and moderate COVID-19 had a greater impact on quality of life compared to those with mild disease, particularly on the SF-36 subscales that encompass physical function, role limitations due to physical health, energy/fatigue, pain, social function, and general health [12] In another prospective observational study involving 124 patients, health status was as sessed at the 3-month mark after COVID-19 infection. Patients were classified as having mild, moderate, or critical illness, and their health status was evaluated using both the SF-36 scale and the Nijmegen Clinical Screening Instrument (NCSI). The study revealed that individuals with moderate to critical illness experienced significantly lower scores across all SF-36 subscales, particularly in the domains of functionality, energy/fatigue, and general health, when compared to those with mild illness [13] Our analysis revealed that, when the SF-36 scale was applied at the 1st month post-infection, patients treated in the intensive care unit (ICU) demonstrated significantly lower scores in the following subscales compared to those treated in outpatient and ward settings: physical function (p<0.001), physical role difficulty (p=0.001), energy vitality (p=0.028), social functionality (p=0.001), and general health perception (p<0.001). This disparity persisted at the 12-month follow-up, with ICU-treated patients still exhibiting lower scores in physical function (p=0.001), physical role difficulty (p=0.025), and social functionality (p=0.031) compared to the other groups. These findings underscore the sustained impact of severe COVID-19 on multiple dimensions of health-related quality of life. Additionally, in this investigation, SF-36 quality of life scores across all 8 subscales were found to be lower than the Turkish society norm values at both the 1st and 3rd-month follow-ups. This observation is consistent with the findings of Stefan et al. (2022), who reported lower physical and mental health-related quality of life scores in outpatients with symptoms lasting longer than 4 weeks, compared to pre-pandemic population norms[14]. Similarly, in another observational cohort study involving 101 patients, the SF-36 scores were significantly lower in all subscales except pain when compared to the general healthy population at 6 weeks post-discharge [15].
The Post-COVID-19 Functional Status (PCFS) scale, proposed by Klok et al., is designed as a quick and easy tool to identify individuals who have not fully recovered from COVID-19, focusing on daily life limitations due to persistent symptoms. In a French observational, single-center, prospective study, 121 patients hospitalized with severe COVID-19 pneumonia were assessed using the PCFS over a median period of 125 days (range: 59-284 days). This study found that only 44 patients (36.4%) had returned to their pre-COVID-19 functional status. Overall, 106 patients (88%) had a PCFS Scale Score of 0, 1, or 2, indicating minimal to mild functional limitations [16]. In another study, the PCFS scale was applied to 239 patients at both the 3-month and 6-month follow-up points. The results demonstrated a significant improvement in functional status over time, with patients exhibiting better scores on the PCFS scale at 6 months compared to 3 months (mean ± standard deviation: 2.4 + 0.9 vs. 2.2 + 0.8; p < 0.001). This indicates a decrease in self-reported functional limitations over the recovery period [17]. In our study, when patients were assessed in the pre-COVID period, 71.8% had PCFS scale scores of 0 (no functional limitation) or 1 (negligible functional limitation). However, at the 6-month follow-up, this percentage decreased to 44.2%, and at 12 months, it rose slightly to 50%. While our data aligns with the literature in showing an improvement in PCFS scores over time, it also highlights that a substantial proportion of patients do not fully regain their pre-COVID functional status. Furthermore, this study revealed that the rate of patients with a PCFS score of 0 (no functional limitation) at both diagnosis and the 12-month follow-up was significantly higher in the outpatient group compared to those treated in the intensive care and ward settings. Additionally, at the 1st month, the frequency of PCFS grade 4 (severe functional limitation) was significantly lower in outpatients (p<0.001), and at the 3rd month, the frequency of grades 3 and 4 (moderate and severe functional limitations) was also lower in this group (p=0.002).These findings align with the results of a prospective cohort study conducted by Taboada et al. (2022) on 183 patients (151 ward admissions and 32 ICU admissions), which evaluated functional status using the PCFS scale at 6 months post-discharge. This study also demonstrated a higher incidence of limitations in daily life (PCFS grades 2-4) in ICU patients (56.4%) compared to ward patients (17.9%) (p<0.001), highlighting the greater functional impairment experienced by those requiring intensive care during their acute COVID-19 illness [18] In a study conducted in Egypt, which evaluated 444 COVID-19 patients with outpatient, ward, and ICU admissions using the PCFS scale in the post-COVID period, 20% of patients reported no functional limitation, 63% had negligible functional limitations, 14% had mild functional limitations, 2% had moderate limitations, and 0.5% had severe functional limitations. The study identified several factors associated with higher PCFS scores, including female gender, older age, presence of comorbid diseases, requiring ICU admission, need for oxygen therapy, not having received a seasonal flu vaccine and smoking status. Notably, only 3% of those hospitalized in the ICU reported no functional limitations [19]. Our findings align with these observations, revealing higher PCFS scores and a greater prevalence of functional limitations in the intensive care-treated patient group.
5. Conclusions
ICU admission for COVID-19 often involves invasive interventions like mechanical ventilation, which can have lasting effects on respiratory function. Moreover, the systemic inflammation and organ damage associated with severe COVID-19 can lead to a multitude of complications that contribute to Long COVID symptoms. The PCFS scale has highlighted that functional limitations are most frequent in patients treated in the ICU during the Long COVID period and may persist, albeit to a lesser extent, even at the 12-month follow-up. Additionally, our analysis showed that quality of life, as measured by the SF-36 scale, was lower in patients treated in intensive care, particularly in the subscales assessing physical function, role limitations due to physical health, social functionality, and general health perception. While significant improvements were observed in patients receiving outpatient or ward treatment from the 1st to the 12th month, these improvements were more limited in those treated in the ICU. These data underscore the differential treatment processes and outcomes experienced by COVID-19 patients across care settings and emphasize the more challenging Long COVID course in those hospitalized in intensive care. Likewise, these findings highlight the need for long-term follow-up and comprehensive rehabilitation and support programs for patients who require intensive care during their acute COVID-19 illness.
Author Contributions
Conceptualization, S.H.S, S.K. ; methodology, S.K, F.K. and A.C ; investigation, S.K. and S.H.S.,A.S.İ, B.K.,Y.T ; writing—original draft preparation, S.H.S; writing—review and editing, S.H.S, S.K, A.S.İ, B.K, and Y.T .; All authors have read and agreed to the published version of the manuscript.”
Funding
This project was supported by Çukurova University Scientific Research Project as project number TTU-2021-13739
Institutional Review Board Statement
The study was conducted in accordance with the Declaration of Helsinki and approval was obtained from Çukurova University Faculty of Medicine Ethics Committee (decision no: 24 , dated: 12 February 2021).
Informed Consent Statement
Informed consent was obtained from all subjects involved in the study.
Data Availability Statement
The original contributions presented in this study are included in this article; further inquiries can be directed to the corresponding authors.
Conflicts of Interest
The authors declare no conflicts of interest. The funders had no role in the design of the study; in the collection, analyses, or interpretation of data; in the writing of the manuscript; or in the decision to publish the results.
References
- Han Q, Zheng B, Daines L, Sheikh A. Long-Term Sequelae of COVID-19: A Systematic Review and Meta-Analysis of One-Year Follow-Up Studies on Post-COVID Symptoms. Pathogens. 2022,11, 269. [CrossRef]
- Carfì A, Bernabei R, Landi F; Gemelli Against COVID-19 Post-Acute Care Study Group. Persistent Symptoms in Patients After Acute COVID-19. JAMA. 2020,324,603-605. [CrossRef]
- Ahmed H, Patel K, Greenwood DC, Halpin S, Lewthwaite P, Salawu A, et al. Long-term clinical outcomes in survivors of severe acute respiratory syndrome (SARS) and Middle East respiratory syndrome coronavirus (MERS) outbreaks after hospitalisation or ICU admission: A systematic review and meta-analysis. J Rehabil Med . 2020,52, 1-11.
- Soriano JB, Murthy S, Marshall JC, Relan P, Diaz JV; WHO Clinical Case Definition Working Group on Post-COVID-19 Condition. A clinical case definition of post-COVID-19 condition by a Delphi consensus. Lancet Infect Dis. 2022,22, e102-e107.
- Nalbandian A, Desai AD, Wan EY. Post-COVID-19 Condition. Annu Rev Med. 2023,74, 55-64.
- Klok FA, Boon GJAM, Barco S, Endres M, Miranda Geelhoed JJ, Knauss S, et al. The Post-COVID-19 Functional Status scale: a tool to measure functional status over time after COVID-19. Eur Respir J. 2020,56,2001494. [CrossRef]
- Ware JE Jr, Sherbourne CD. The MOS 36-item short-form health survey (SF-36). I. Conceptual framework and item selection. Med Care. 1992,30, 473-483.
- Lopez-Leon S, Wegman-Ostrosky T, Perelman C. More than 50 Long-term effects of COVID- 19: a systematic review and meta-analysis. medRxiv 2021. [CrossRef]
- Huang C, Huang L, Wang Y, Li X, Ren L, Gu X, et al. 6-month consequences of COVID-19 in patients discharged from hospital: a cohort study. The Lancet. 2023, 401, e21-e33.
- Peghin M, Palese A, Venturini M, De Martino M, Gerussi V, Graziano E, et al. Post-COVID-19 symptoms 6 months after acute infection among hospitalized and non-hospitalized patients. Clin Microbiol Infect. 2021,27,1507-1513. [CrossRef]
- Khoddami SM, Aghadoost S, Aghajanzadeh M, Molazeinal Y. The Health-related Quality of Life and Voice Handicap Index in Recovered COVID-19 Patients in Comparison to Healthy Subjects. J Voice. 2023. [CrossRef]
- McFann K, Baxter BA, LaVergne SM, et al. Quality of Life (QoL) Is Reduced in Those with Severe COVID-19 Disease, Post-Acute Sequelae of COVID-19, and Hospitalization in United States Adults from Northern Colorado. Int J Environ Res Public Health. 2021,18,11048. [CrossRef]
- Van den Borst B, Peters JB, Brink M, et al. Comprehensive Health Assessment 3 Months After Recovery From Acute Coronavirus Disease 2019 (COVID-19). Clin Infect Dis. 2021,73,e1089-e1098. [CrossRef]
- Malesevic S, Sievi NA, Baumgartner P, et al. Impaired health-related quality of life in long-COVID syndrome after mild to moderate COVID-19. Sci Rep. 2023,13, 7717. [CrossRef]
- Van der Sar-van der Brugge S, Talman S, Boonman-de Winter L, et al. Pulmonary function and health-related quality of life after COVID-19 pneumonia. Respir Med. 2021,176, 106272.
- Benkalfate N, Eschapasse E, Georges T, et al. Evaluation of the Post-COVID-19 Functional Status (PCFS) Scale in a cohort of patients recovering from hypoxemic SARS-CoV-2 pneumonia. BMJ Open Respir Res. 2022, 9, e001136.
- Vaes AW, Goërtz YMJ, Van Herck M, et al. Recovery from COVID-19: a sprint or marathon? 6-month follow-up data from online long COVID-19 support group members. ERJ Open Res. 2021,7,00141-2021. [CrossRef]
- Taboada M, Cariñena A, Moreno E, et al. Post-COVID-19 functional status six-months after hospitalization. J Infect. 2021,82,e31-e33. [CrossRef]
- Mohamed Hussein AA, Saad M, Zayan HE, et al. Post-COVID-19 functional status: Relation to age, smoking, hospitalization, and previous comorbidities. Ann Thorac Med. 2021,16,260-265.
Figure 1.
Frequency of symptoms observed in patients at the time of diagnosis and in the 1st, 3rd, 6th, and 12th month.
Figure 1.
Frequency of symptoms observed in patients at the time of diagnosis and in the 1st, 3rd, 6th, and 12th month.
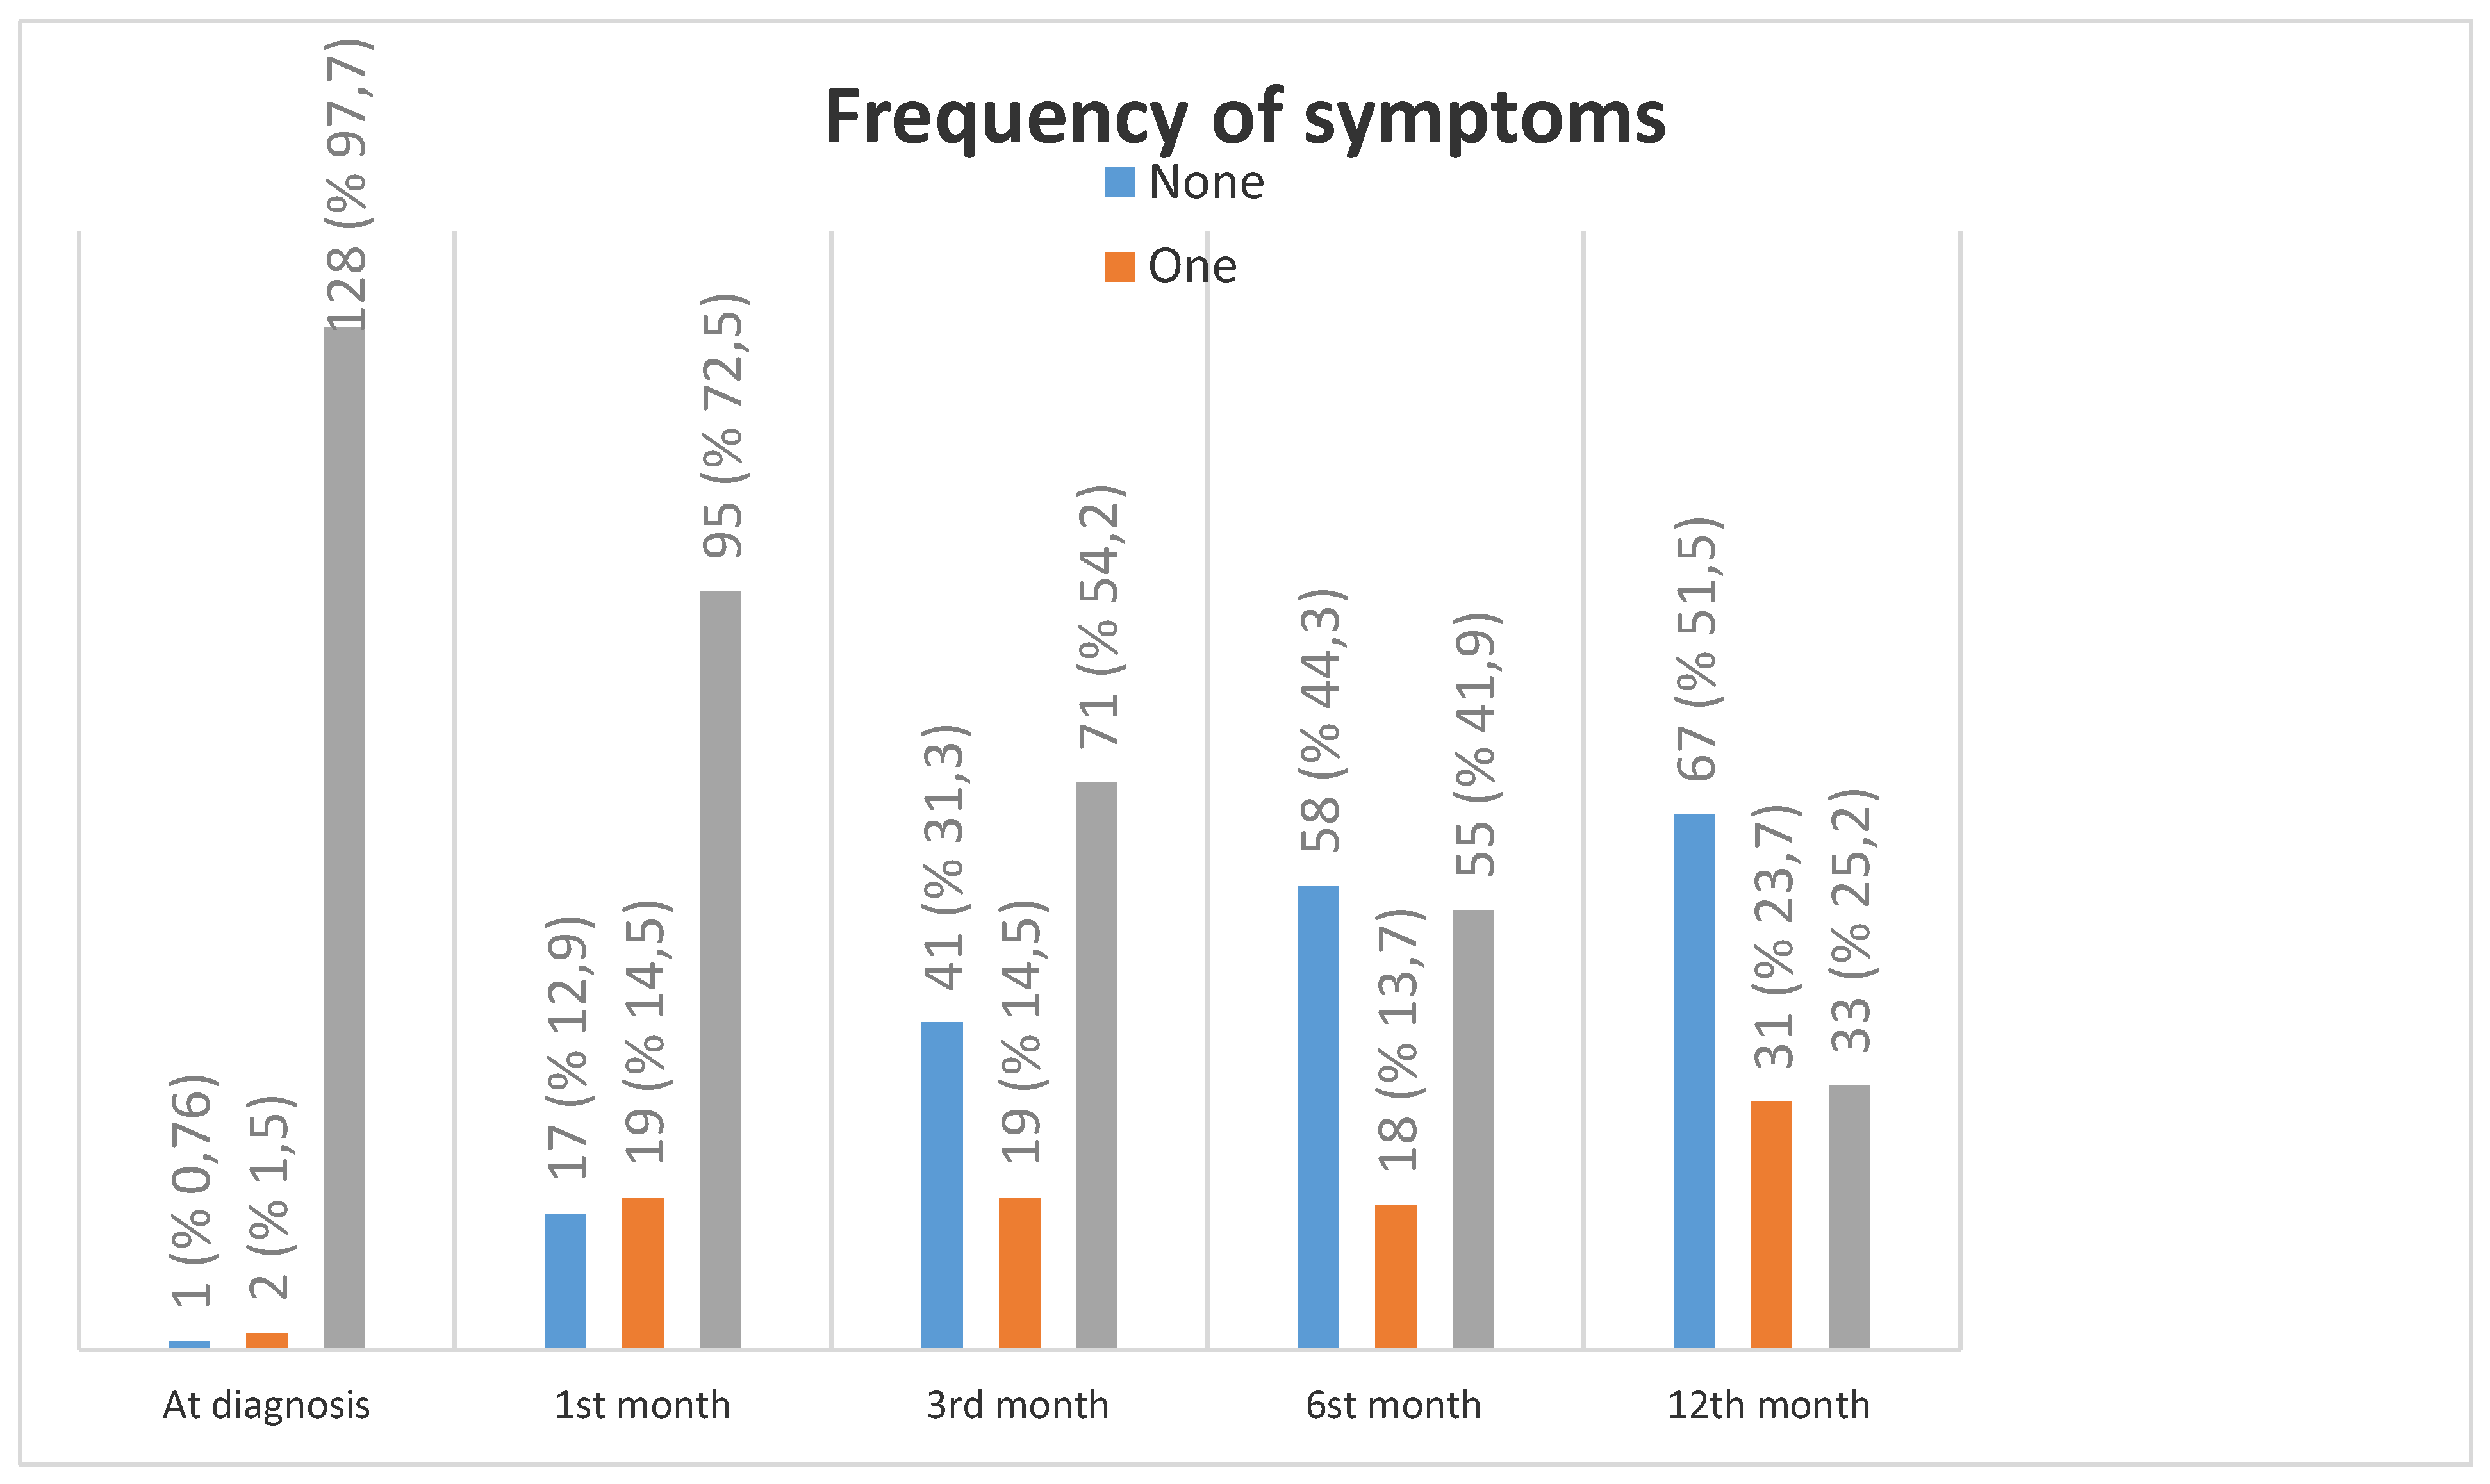
Figure 2.
Comparison of SF-36 quality of life 8 subscales with Turkish society norm values in 1-3-6-12 months.
Figure 2.
Comparison of SF-36 quality of life 8 subscales with Turkish society norm values in 1-3-6-12 months.
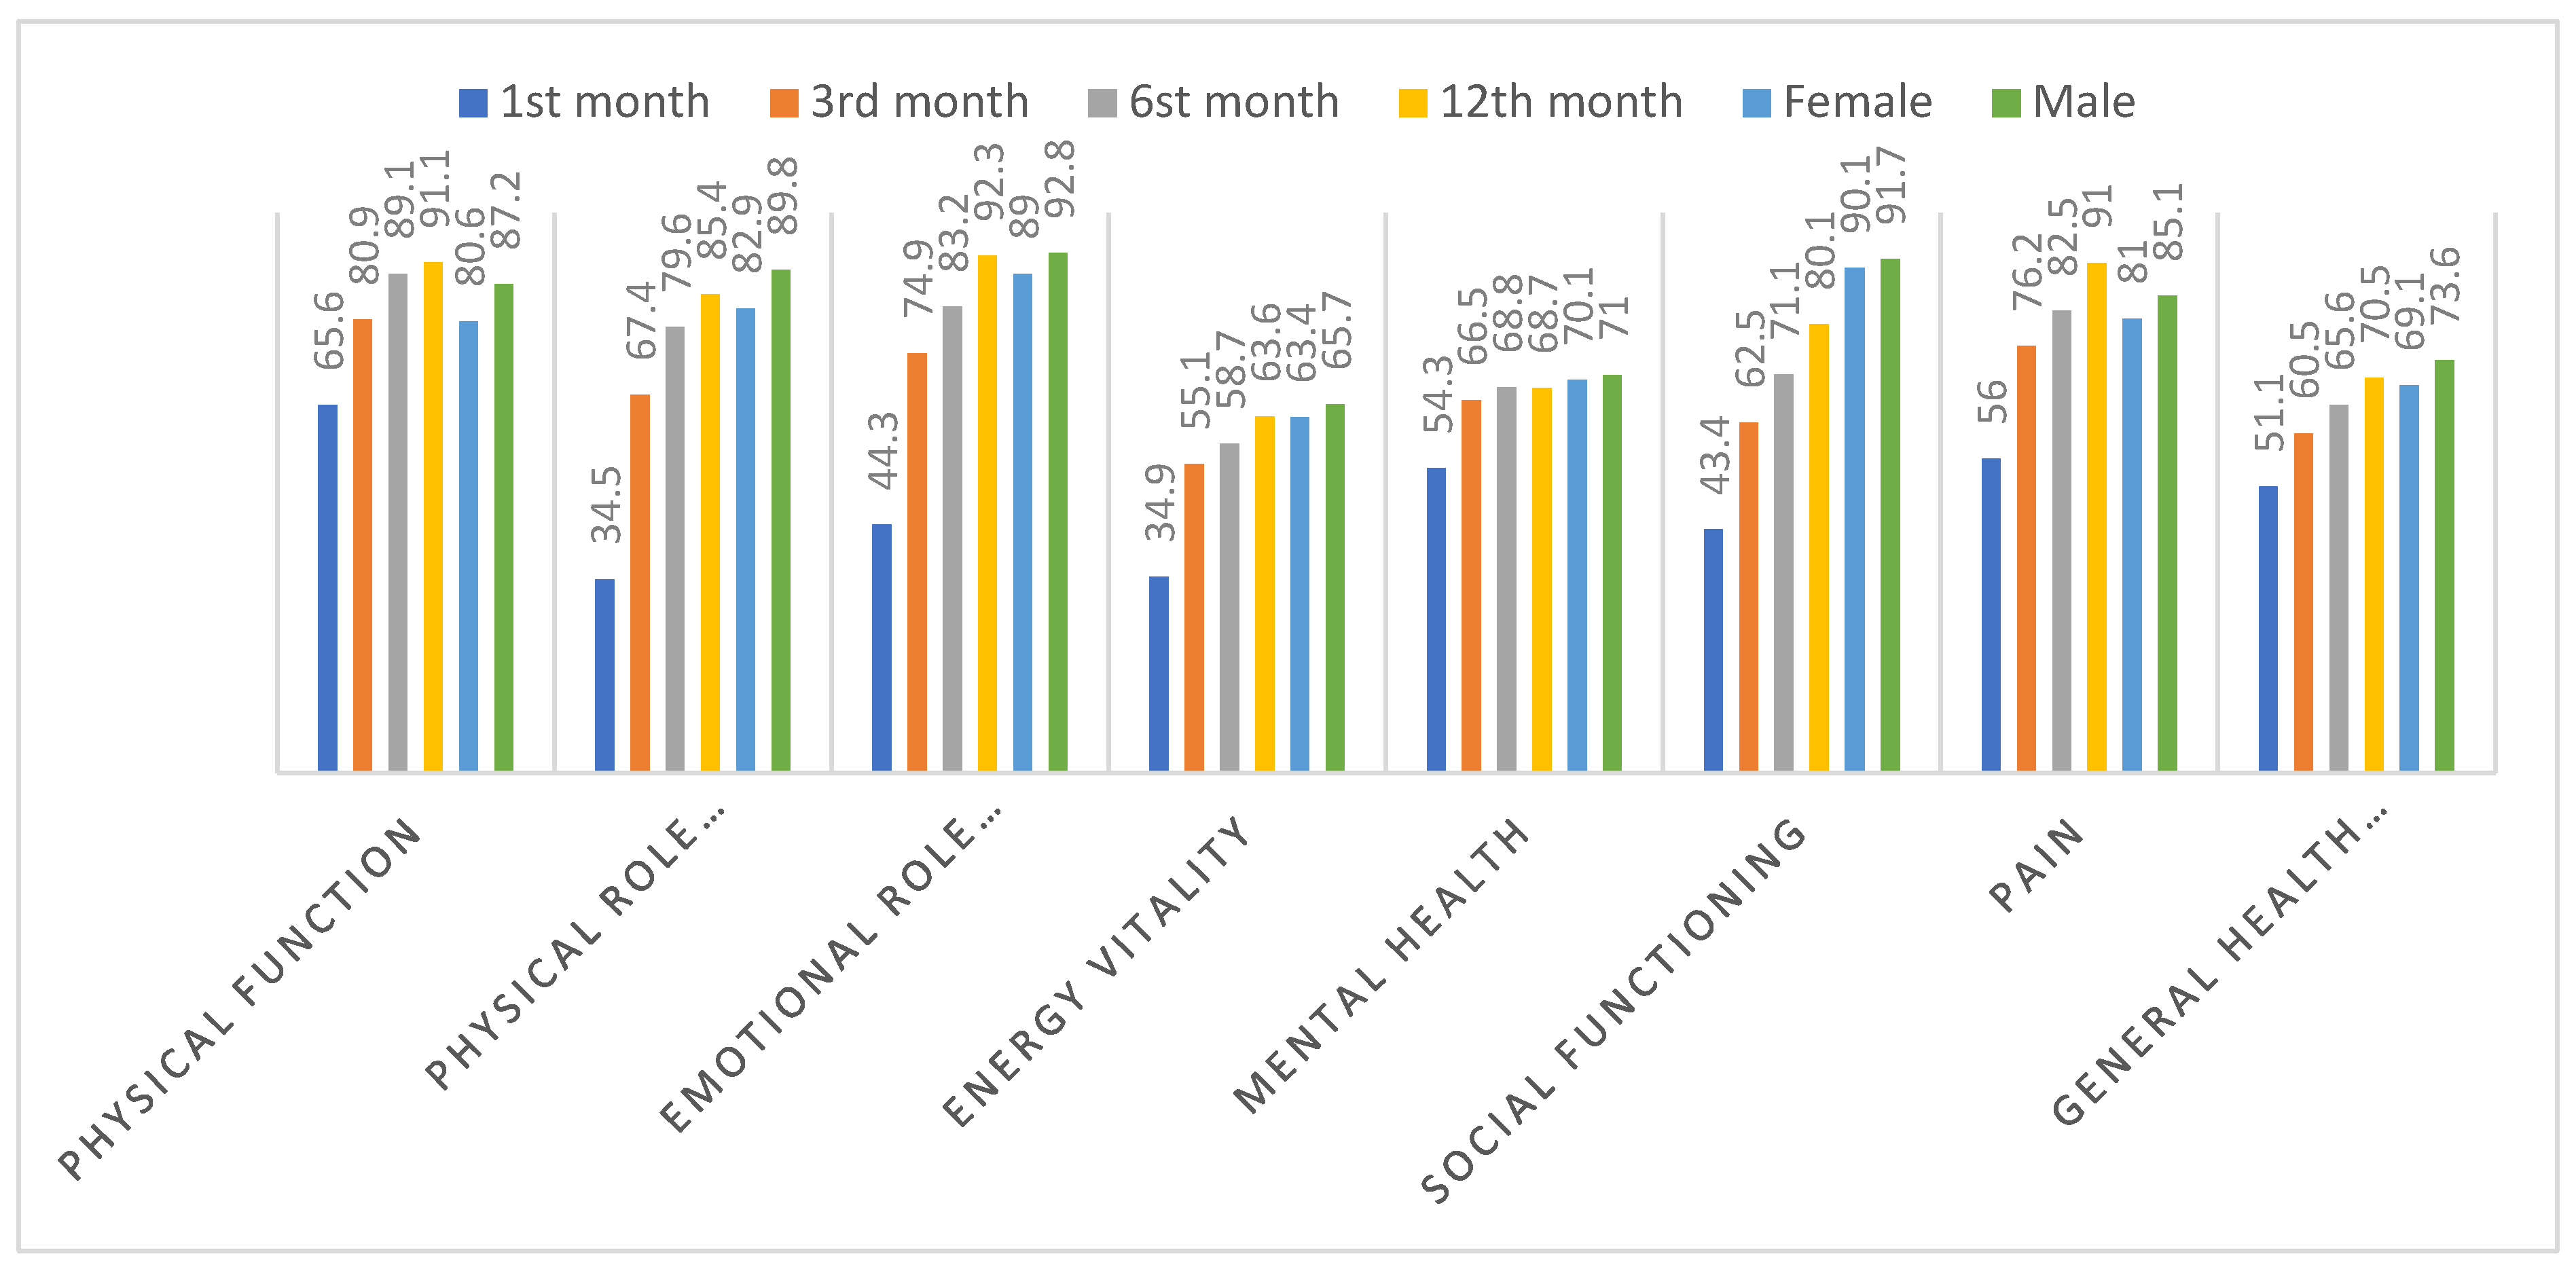
Table 1.
Differences between the patient characteristics and the study groups.
| Total | Outpatient (n=67) | General ward (n=47) | Intensive care unit (n=17) | pa | |
| n(%) | n(%) | n(%) | n(%) | ||
| Gender | |||||
| Female | 60(45,8) | 44 (65,7) | 14 (29,8) | 2 (11,8) | <0,001** |
| Male | 71(54,2) | 23 (34,3) | 33 (70,2) | 15 (88,2) | |
| Comorbidities | 81(61,8) | 30 (44,8) | 36 (76,6) | 15 (88,2) | <0,001** |
| Diabetes mellitus | 15(11,5) | 3 (4,5) | 8 (17,0) | 4 (23,5) | 0,029* |
| Hypertension | 23(17,6) | 6 (9,0) | 13 (27,7) | 4 (23,5) | 0,028* |
| Cardiovascular disease | 18(13,7) | 3 (4,5) | 8 (17,0) | 7 (41,2) | <0,001** |
| COPD/Asthma | 14(10,7) | 3 (4,5) | 5 (10,6) | 6 (35,3) | 0,001** |
| Obesity | 8(6,1) | 3 (4,5) | 3 (6,4) | 2 (11,8) | 0,531 |
| Chronic Renal Failure | 2(1,5) | 1 (1,5) | 1 (2,1) | - | 0,828 |
| HIV infection | 15(11,5) | 13 (19,4) | 1 (2,1) | 1 (5,9) | 0,013* |
|
Outpatient (n=67) |
General ward (n=47) |
Intensive care unit (n=17) |
pb | ||
|
(mean ± SD) Med (Min-Max) |
(mean ± SD) Med (Min-Max) |
(mean ± SD) Med (Min-Max) |
|||
| Age | 43,7±15,3 45(18-83) |
36,4±13,2 31 (18-76) |
48,9±13,2 51 (20-83) |
58,0±12,1 57 (32-81) |
<0,001** |
*p<0.05, **p<0.001, Mean: Average, SD: Standard deviation, Med: Median, Min: Minimum, Max: Maximum, a: chi-square and fisher exact test, b: Kruskal Wallis test, Post Hoc Tamhane’s T2 test was used to examine the differences between groups .
Table 2.
Frequency of Symptoms in Patients at Diagnosis, 1st, 3rd, 6th, and 12th Months.
| At diagnosis | 1st month | 3rd month | 6st month | 12th month | |
|---|---|---|---|---|---|
| n(%) | n(%) | n(%) | n(%) | n(%) | |
| Symptoms | 127 (96,9) | ||||
| Symptoms | |||||
| Fever | 74 (56,5) | 5 (3,8) | - | - | - |
| Weakness and Fatigue | 113 (86,3) | 74 (56,5) | 52 (39,7) | 34 (26,0) | 21 (16,0) |
| Easy fatigue during exertion | 92 (70,2) | 98 (74,8) | 66 (50,4) | 50 (38,2) | 48 (36,6) |
| Cough | 91 (69,5) | 34 (26,0) | 11 (8,4) | 6 (4,6) | 3 (2,3) |
| Dyspnea | 66 (50,4) | 35 (26,7) | 14 (10,7) | 8 (6,1) | 2 (1,5) |
| Myalgia | 93 (71,0) | 45 (34,4) | 24 (18,3) | 14 (10,7) | 9 (6,9) |
| Arthralgia | 76 (58,0) | 36 (27,5) | 17 (13,0) | 9 (6,9) | 9 (6,9) |
| Palpitation | 42 (32,1) | 25 (19,1) | 14 (10,7) | 10 (7,6) | 12 (9,2) |
| Headache | 72 (55,0) | 25 (19,1) | 17 (13,0) | 7 (5,3) | 3 (2,3) |
| Sleep disturbance | 64 (48,9) | 31 (23,7) | 17 (13,0) | 15 (11,5) | 3 (2,3) |
| Forgetfulness | 48 (36,6) | 32 (24,4) | 29 (22,1) | 18 (13,7) | 6 (4,6) |
| Difficulty concentrating | 39 (29,8) | 26 (19,8) | 11 (8,4) | 10 (7,6) | 4 (3,1) |
| Loss of appetite | 77 (58,8) | 20 (15,3) | 8 (6,1) | 5 (3,8) | 4 (3,1) |
| Loss of smell | 79 (60,3) | 32 (24,4) | 19 (14,5) | 12 (9,2) | 3 (2,3) |
| Loss of taste | 76 (58,0) | 24 (18,3) | 12 (9,2) | 9 (6,9) | 2 (1,5) |
| Diarrhea | 28 (21,4) | 4 (3,1) | 1 (0,8) | - | 1 (0,8) |
| Skin findings | 6 (4,6) | - | - | - | - |
| Vision problems | 3 (2,3) | 1 (0,8) | 1 (0,8) | - | 1 (0,8) |
Table 3.
Comparison of Symptom Presence at Diagnosis, 1st, 3rd, 6th, and 12th Months.
| Diagnostic Findings |
At diagnosis | 1st month | 3rd month | 6th month | 12th month |
|---|---|---|---|---|---|
| n(%) | n(%) | n(%) | n(%) | n(%) | |
| Fever | |||||
| Outpatient (n=67) | 30 (44,8) | 1 (1,5) | - | - | - |
| General ward (n=47) | 32 (68,1) | 3 (6,4) | - | - | - |
| Intensive care unit (n=17) | 12 (70,6) | 1 (5,9) | - | - | - |
| p | 0,021* | 0,363 | |||
| Weakness and Fatigue | |||||
| Outpatient (n=67) | 54 (80,6) | 31 (46,3) | 23 (34,3) | 16 (23,9) | 9 (13,4) |
| General ward (n=47) | 45 (95,7) | 29 (61,7) | 18 (38,3) | 10 (21,3) | 6 (12,8) |
| Intensive care unit (n=17) | 14 (82,4) | 14 (82,4) | 11 (64,7) | 8 (47,1) | 6 (35,3) |
| p | 0,061 | 0,018* | 0,071 | 0,099 | 0,067 |
| Easy fatigue during exertion | |||||
| Outpatient (n=67) | 41 (61,2) | 45 (67,2) | 30 (44,8) | 15 (22,4) | 13 (19,4) |
| General ward (n=47) | 37 (78,7) | 38 (80,9) | 22 (46,8) | 22 (46,8) | 21 (44,7) |
| Intensive care unit (n=17) | 14 (82,4) | 15 (88,2) | 14 (82,4) | 13 (76,5) | 14 (82,4) |
| p | 0,066 | 0,100 | 0,018* | <0,001** | <0,001** |
| Cough | |||||
| Outpatient (n=67) | 41 (61,2) | 15 (22,4) | 4 (6,0) | 2 (3,0) | 1 (1,5) |
| General ward (n=47) | 38 (80,9) | 11 (23,4) | 3 (6,4) | 3 (6,4) | 1 (2,1) |
| Intensive care unit (n=17) | 12 (70,6) | 8 (47,1) | 4 (23,5) | 1 (5,9) | 1 (5,9) |
| p | 0,080 | 0,103 | 0,054 | 0,668 | 0,555 |
| Dyspnea | |||||
| Outpatient (n=67) | 25 (37,3) | 12 (17,9) | 3 (4,5) | 1 (1,5) | - |
| General ward (n=47) | 27 (57,4) | 12 (25,5) | 5 (10,6) | 4 (8,5) | - |
| Intensive care unit (n=17) | 14 (82,4) | 11 (64,7) | 6 (35,3) | 3 (17,6) | 2 (11,8) |
| p | 0,002** | <0,001** | 0,001** | 0,032* | 0,001** |
| Myalgia | |||||
| Outpatient (n=67) | 49 (73,1) | 21 (31,3) | 14 (20,9) | 5 (7,5) | 4 (6,0) |
| General ward (n=47) | 33 (70,2) | 18 (38,3) | 7 (14,9) | 6 (12,8) | 3 (6,4) |
| Intensive care unit (n=17) | 11 (64,7) | 6 (35,3) | 3 (17,6) | 3 (17,6) | 2 (11,8) |
| p | 0,783 | 0,741 | 0,715 | 0,405 | 0,691 |
| Arthralgia | |||||
| Outpatient (n=67) | 41 (61,2) | 15 (22,4) | 8 (11,9) | 2 (3,0) | 4 (6,0) |
| General ward (n=47) | 27 (57,4) | 16 (34,0) | 6 (12,9) | 4 (8,5) | 5 (10,6) |
| Intensive care unit (n=17) | 8 (47,1) | 5 (29,4) | 3 (17,6) | 3 (17,6) | - |
| p | 0,571 | 0,383 | 0,821 | 0,088 | 0,304 |
| Palpitation | |||||
| Outpatient (n=67) | 23 (34,3) | 14 (20,9) | 7 (10,4) | 2 (3,0) | 3 (4,5) |
| General ward (n=47) | 13 (27,7) | 7 (14,9) | 4 (8,5) | 6 (12,8) | 4 (8,5) |
| Intensive care unit (n=17) | 6 (35,3) | 4 (23,5) | 3 (17,6) | 2 (11,8) | 5 (29,4) |
| p | 0,720 | 0,639 | 0,577 | 0,121 | 0,006** |
| Headache | |||||
| Outpatient (n=67) | 41 (61,2) | 16 (23,9) | 9 (13,4) | 2 (3,0) | 1 (1,5) |
| General ward (n=47) | 24 (51,1) | 7 (14,9) | 6 (12,8) | 4 (8,5) | 1 (2,1) |
| Intensive care unit (n=17) | 7 (41,2) | 2 (11,8) | 2 (11,8) | 1 (5,9) | 1 (5,9) |
| p | 0,266 | 0,346 | 0,982 | 0,432 | 0,555 |
| Sleep disturbance | |||||
| Outpatient (n=67) | 31 (46,3) | 13 (19,4) | 8 (11,9) | 3 (4,5) | - |
| General ward (n=47) | 23 (48,9) | 8 (17,0) | 5 (10,6) | 5 (10,6) | 2 (4,3) |
| Intensive care unit (n=17) | 10 (58,8) | 10 (58,8) | 4 (23,5) | 7 (41,2) | 1 (5,9) |
| p | 0,652 | 0,001** | 0,374 | <0,001** | 0,186 |
| Forgetfulness | |||||
| Outpatient (n=67) | 24 (35,8) | 15 (22,4) | 13 (19,4) | 9 (13,4) | 2 (3,0) |
| General ward (n=47) | 16 (34,0) | 9 (19,1) | 10 (21,3) | 3 (6,4) | 3 (6,4) |
| Intensive care unit (n=17) | 8 (47,1) | 8 (47,1) | 6 (35,3) | 6 (35,3) | 1 (5,9) |
| p | 0,622 | 0,062 | 0,365 | 0,012* | 0,668 |
| Difficulty concentrating | |||||
| Outpatient (n=67) | 24 (35,8) | 13 (19,4) | 6 (9,0) | 6 (9,0) | 2 (3,0) |
| General ward (n=47) | 10 (21,3) | 7 (14,9) | 2 (4,3) | 2 (4,3) | 2 (4,3) |
| Intensive care unit (n=17) | 5 (29,4) | 6 (35,3) | 3 (17,6) | 2 (11,8) | - |
| p | 0,247 | 0,194 | 0,227 | 0,512 | 0,682 |
| Loss of appetite | |||||
| Outpatient (n=67) | 35 (52,2) | 7 (10,4) | 3 (4,5) | 4 (6,0) | 1 (1,5) |
| General ward (n=47) | 31 (66,0) | 8 (17,0) | 2 (4,3) | - | 2 (4,3) |
| Intensive care unit (n=17) | 11 (64,7) | 5 (29,4) | 3 (17,6) | 1 (5,9) | 1 (5,9) |
| p | 0,297 | 0,139 | 0,103 | 0,234 | 0,538 |
| Loss of smell | |||||
| Outpatient (n=67) | 51 (76,1) | 22 (32,8) | 16 (23,9) | 10 (14,9) | 3 (4,5) |
| General ward (n=47) | 23 (48,9) | 8 (17,0) | 2 (4,3) | 1 (2,1) | - |
| Intensive care unit (n=17) | 5 (29,4) | 2 (11,8) | 1 (5,9) | 1 (5,9) | - |
| p | <0,001** | 0,066 | 0,008** | 0,058 | 0,231 |
| Loss of taste | |||||
| Outpatient (n=67) | 46 (68,7) | 15 (22,4) | 9 (13,4) | 7 (10,4) | 2 (3,0) |
| General ward (n=47) | 25 (53,2) | 8 (17,0) | 2 (4,3) | 1 (2,1) | - |
| Intensive care unit (n=17) | 5 (29,4) | 1 (5,9) | 1 (5,9) | 1 (5,9) | - |
| p | 0,010* | 0,279 | 0,218 | 0,221 | 0,379 |
| Diarrhea | |||||
| Outpatient (n=67) | 12 (17,9) | 4 (6,0) | - | - | - |
| General ward (n=47) | 13 (27,7) | - | 1 (2,1) | - | - |
| Intensive care unit (n=17) | 3 (17,6) | - | - | - | - |
| p | 0,422 | 0,139 | 0,406 | ||
| Skin findings | |||||
| Outpatient (n=67) | 6 (9,0) | - | - | - | - |
| General ward (n=47) | - | - | - | - | - |
| Intensive care unit (n=17) | - | - | - | - | - |
| p | 0,050 | ||||
| Vision problems | |||||
| Outpatient (n=67) | 3 (4,5) | 1 (1,5) | 1 (1,5) | - | 1 (1,5) |
| General ward (n=47) | - | - | - | - | - |
| Intensive care unit (n=17) | - | - | - | - | - |
| p | 0,231 | 0,618 | 0,618 | 0,618 | |
* p<0,05, **p<0,001, ki-kare ve fisher exact test.
Table 4.
Review of findings related to PCFS.
| Grade | Frequency (n) | Percentage (%) |
|---|---|---|
| PCFS scale at pre-COVID-19 | ||
| 0 | 94 | 71,8 |
| 1 | 0 | 0 |
| 2 | 34 | 26 |
| 3 | 3 | 2,2 |
| 4 | 0 | 0 |
| PCFS scale at diagnosis | ||
| 0 | 2 | 1,5 |
| 1 | 10 | 7,6 |
| 2 | 11 | 8,4 |
| 3 | 88 | 67,2 |
| 4 | 20 | 15,3 |
| PCFS scale at 1. month post-diagnosis | ||
| 0 | 15 | 11,5 |
| 1 | 4 | 3,1 |
| 2 | 17 | 13,0 |
| 3 | 85 | 64,9 |
| 4 | 10 | 7,6 |
| PCFS scale at 3rd month post-diagnosis | ||
| 0 | 32 | 24,6 |
| 1 | 10 | 7,7 |
| 2 | 30 | 23,1 |
| 3 | 55 | 42,3 |
| 4 | 2 | 1,5 |
| D | 1 | 0,8 |
| PCFS scale at 6th month post-diagnosis | ||
| 0 | 45 | 34,9 |
| 1 | 12 | 9,3 |
| 2 | 37 | 28,7 |
| 3 | 32 | 24,8 |
| 4 | 2 | 1,6 |
| D | 1 | 0,8 |
| PCFS scale at 12th month post-diagnosis | ||
| 0 | 54 | 42,2 |
| 1 | 10 | 7,8 |
| 2 | 42 | 32,8 |
| 3 | 19 | 14,8 |
| 4 | 0 | 0 |
| D | 3 | 2,3 |
Table 7.
Differences between the 1st month, 12th month, and delta scores of the scale scores. and the study groups
Table 7.
Differences between the 1st month, 12th month, and delta scores of the scale scores. and the study groups
| 1st month | 12th month | Delta (12th -1st ) | |
|---|---|---|---|
| (mean ± SD) | (mean ± SD) |
||
| Physical Function | |||
| Outpatient (n=67) | 77,2±24,1 | 93,9±11,6 | 17,1±21,5 |
| General ward (n=47) | 63,7±30,7 | 89,5±14,0 | 24,9±26,5 |
| Intensive care unit (n=17) | 25,6±37,3 | 84,1±20,6 | 58,5±35,6 |
| p | <0,001** | 0,001** | 0,001** |
| Physical Role Difficulty | |||
| Outpatient (n=67) | 44,8±44,1 | 90,8±24,4 | 46,2±42,7 |
| General ward (n=47) | 30,3±41,7 | 84,3±32,3 | 52,9±48,9 |
| Intensive care unit (n=17) | 5,88±24,3 | 67,6±43,1 | 61,8±45,2 |
| p | 0,001** | 0,025* | 0,758 |
| Emotional Role Difficulty | |||
| Outpatient (n=67) | 44,8±44,0 | 92,8±23,9 | 46,7±48,2 |
| General ward (n=47) | 51,1±49,1 | 90,7±29,4 | 36,4±52,4 |
| Intensive care unit (n=17) | 23,5±43,7 | 94,1±24,3 | 70,6±46,9 |
| p | 0,106 | 0,907 | 0,049* |
| Energy Vitality | |||
| Outpatient (n=67) | 38,6±21,9 | 63,8±16,3 | 24,9±25,1 |
| General ward (n=47) | 33,8±24,9 | 63,1±15,7 | 27,8±23,9 |
| Intensive care unit (n=17) | 23,2±25,2 | 64,1±9,7 | 40,9±23,7 |
| p | 0,028* | 0,607 | 0,064 |
| Mental health | |||
| Outpatient (n=67) | 54,9±19,5 | 68,2±13,8 | 12,2±8,6 |
| General ward (n=47) | 57,4±23,9 | 69,8±11,5 | 10,7±24,1 |
| Intensive care unit (n=17) | 43,8±26,6 | 68,2±11,1 | 24,5±26,5 |
| p | 0,121 | 0,877 | 0,060 |
| Social Functioning | |||
| Outpatient (n=67) | 50,4±25,6 | 83,3±18,1 | 31,5±32,5 |
| General ward (n=47) | 41,6±37,1 | 78,2±19,1 | 35,7±36,5 |
| Intensive care unit (n=17) | 20,6±28,6 | 72,8±13,4 | 52,2±29,4 |
| p | 0,001** | 0,031* | 0,061 |
| Pain | |||
| Outpatient (n=67) | 55,5±32,7 | 91,9±14,8 | 36,3±31,8 |
| General ward (n=47) | 55,9±35,6 | 88,1±22,5 | 31,3±36,4 |
| Intensive care unit (n=17) | 58,5±34,8 | 95,3±13,4 | 36,8±32,1 |
| p | 0,968 | 0,245 | 0,335 |
| General Health Perception | |||
| Outpatient (n=67) | 57,5±21,1 | 72,9±13,9 | 14,3±18,1 |
| General ward (n=47) | 48,4±17,5 | 68,9±17,5 | 19,9±18,1 |
| Intensive care unit (n=17) | 33,5±19,2 | 65,3±14,7 | 31,8±17,0 |
| p | <0,001** | 0,078 | <0,001** |
*p<0.05, **p<0.001, Kruskal Wallis test, Post Hoc Tamhane’s T2 test was used for the source of difference between groups.
Disclaimer/Publisher’s Note: The statements, opinions and data contained in all publications are solely those of the individual author(s) and contributor(s) and not of MDPI and/or the editor(s). MDPI and/or the editor(s) disclaim responsibility for any injury to people or property resulting from any ideas, methods, instructions or products referred to in the content. |
© 2024 by the authors. Licensee MDPI, Basel, Switzerland. This article is an open access article distributed under the terms and conditions of the Creative Commons Attribution (CC BY) license (http://creativecommons.org/licenses/by/4.0/).
Copyright: This open access article is published under a Creative Commons CC BY 4.0 license, which permit the free download, distribution, and reuse, provided that the author and preprint are cited in any reuse.


