
Submitted:
23 March 2025
Posted:
25 March 2025
You are already at the latest version
Preprints on COVID-19 and SARS-CoV-2
Abstract
Clinical manifestations and mortality caused by SARS-CoV-2 change, consistent with circulating viral variants and population immunity. Our retrospective study analyses the hospitalized COVID-19 cases from Romania in 2024 comparative with 2020. The circulation of SARS-CoV-2 in the fourth year of the pandemic led to changes in the characteristics of the hospitalized population, including clinical, biological, and radiological profiles, as well as an increase in 90-day mortality after hospitalization. The hospitalized population became predominantly older with multiple comorbidities. Notable changes in symptomatology included an increase in the frequency of rhinorrhoea and syncope, while disturbances in taste and smell were less frequent. The mortality rate within the first 90 days increased in 2024 to 9%. Older age and a higher index of chronic comorbidities were associated with a higher frequency of severe forms and deaths within 90 days post-COVID-19. Hospitalization for COVID-19 may be an unfavorable prognostic factor for the elderly population.
Keywords:
COVID-19
; pneumonia
; prognosis
; clinical variations
; 90- day mortality
1. Introduction
In December 2019, a new virus associated with severe acute respiratory syndrome, named SARS-CoV-2, was identified and rapidly spread globally, leading to a pandemic. It was soon observed that the manifestations of this infection vary from asymptomatic forms to critical forms, with symptoms and severity fluctuating during the illness. The clinical presentation is diverse and can include nasal congestion or runny nose, cough, diarrhea, fatigue, fever or chills, headache, muscle or body aches, recent loss of taste or smell, nausea or vomiting, difficulty breathing or shortness of breath, and sore throat. The risk of severe progression increases in elderly patients with preexisting conditions, especially obesity, diabetes, and hypertension. Global public health organizations have developed case definitions for COVID-19, included in clinical guidelines and epidemiological surveillance protocols. However, the application of these definitions can be subjective when triaging hospitalized patients [1,2,3].
Although COVID-19 continues to be a public health issue, compared to the first pandemic year, the impact on human health in 2024 has decreased due to post-infectious or post-vaccination immunity in the population, the attenuation of the virulence of circulating strains, and more efficient management of cases. The number of intensive care unit admissions and deaths has decreased compared to the 2020-2022 period, but the information is limited as these data are not reported by all countries. The emergence of variants with increased virulence and the broad implications of post-COVID syndrome continue to be concerns for healthcare systems [4].
By 2023, the acute phase of the COVID-19 pandemic has ended. Moving forward, it is essential to monitor the virus's ongoing evolution, especially considering the widespread immunity in the global population [5].
Several scenarios remain possible for the evolution of SARS-CoV-2 and human immunity: optimistic, realistic, and pessimistic, as well as a potential 'reset' of the pandemic through the emergence of a completely new SARS-CoV-2 virus, originating from an existing animal reservoir or a recently emerged one, or through the recombination of two co-infecting variants within the same patient [6].
During the pandemic, authorities in numerous countries reported an 'excess mortality' in the population, which decreased in 2023 but remained higher than the pre-pandemic period. COVID-19 can contribute to mortality both directly and indirectly, through its impact on lifestyle and metabolic disorders, accompanied by obesity and diabetes. Extensive studies from clinical trials, as well as sociological and financial studies, have recently drawn attention to concerns within social insurance systems about the persistence of excess mortality for a longer period, projected until 2033, when mortality is expected to decrease by 3-4 times compared to 2023. Post-COVID effects could impact various causes of morbidity for many years, particularly cardiovascular diseases, which are leading causes of death, requiring careful monitoring [7].
Our study hypothesizes that the clinical manifestations, severity, and mortality of hospitalized patients in 2024 have changed compared to the first pandemic year. The objectives of the study are to evaluate the demographic characteristics, clinical and biological manifestations of hospitalized COVID-19 patients in 2024, compared to 2020, as well as the mortality rate in the first 90 days post-COVID-19.
2. Materials and Methods
We conducted a retrospective study of COVID-19 hospitalized cases at the “Sf. Cuv. Parascheva” Clinical Infectious Diseases Hospital in Galați, Romania, during the periods 01.07.2020–31.12.2020 and 01.01.2024–31.12.2024. These time intervals are representative for characterizing the morbidity of COVID-19 in the first pandemic year (SARS-CoV-2 Alpha variant) and for observing changes in the clinical-evolutionary expression of infection with derived viral variants over the next four years in hospitalized patients. From the hospital's database, we selected cases of patients aged over 18 years at the time of hospitalization, who were discharged (either sent home or transferred to other medical or socio-medical institutions) and had the diagnostic code U07.1, corresponding to 'COVID-19, virus identified' cases [8].
From the hospital’s database, we retrospectively collected demographic data (age, sex, residence area, education level, occupation), the Charlson comorbidity index score [9,10], as well as the association with other comorbidities such as hypertension and obesity (defined by BMI = Weight (kg) / Height (m)² ≥ 30 kg/m²).
We also collected clinical data such as the duration of symptoms from onset to hospitalization, the type and frequency of clinical symptoms, vital parameters upon admission, associated radiological phenotypes (interstitial, unilateral or bilateral opacities), biological markers, the severity of the infection, and reported complications. The evaluation of the biological status included hematological markers (white blood cell count, neutrophil/lymphocyte ratio, hemoglobin, and platelets), D-dimers, C-reactive protein, alanine and aspartate aminotransferases (ALT, AST), and creatine kinase (CK). Management of hospitalized COVID-19 cases was performed according to the current national protocols at the time of patient admission [11,12].
Survival at 90 days after discharge was verified using the national health insurance database, recording deceased cases. Statistical analysis was performed using the XL-Stat software, version 2020.1. Descriptive statistical analyses were conducted based on the type of variables, calculating the mean, standard deviation, median, extreme values (maximum, minimum), frequency, and distribution. Data comparison was done using Pearson’s tests, 2-tailed Student’s t-test (χ²), Kruskal-Wallis, Mann-Whitney tests, or correlation and linear regression tests, considering a statistical significance level of p < 0.05.
3. Results
A total of 721 patients were evaluated in the study, of whom 583 were hospitalized for COVID-19 in 2020 and 138 in 2024.
3.1. Demographic Data
The average age of hospitalized COVID-19 patients was 55.66 ±15.27 years in 2020, compared to 65.13 ± 18.90 years in 2024, with median values of 53 and 70 years, respectively, indicating older patients in 2024 (p < 0.001).
In both 2020 and 2024, more women were hospitalized, but the difference was not statistically significant compared to men (OR = 1.02; p = 0.879). In both periods, patients from urban areas predominated (OR = 4.06; p < 0.001).
3.2. Medical History and Comorbid Conditions
The age-adjusted Charlson comorbidity index ranged from 0 to 13, with higher values in 2024 compared to 2020, both in terms of the mean (2.01 ± 2.22 vs. 5.07 ± 3.25) and the median (1 vs. 5) [Figure 1].
Except for collagen diseases and AIDS, the other comorbidities included in the Charlson comorbidity index were more prevalent in 2024 [Table 1].
Hypertension was reported in 59.6% of patients in 2024 and in 30% of patients in 2020, making it the most common comorbidity among hospitalized COVID-19 patients [Table 1]. The prevalence of obesity was also higher in 2020 compared to 2024, although the interpretation of this result is limited due to the lack of anthropometric measurements (weight and waist circumference) in some cases [Table 1].
All patients hospitalized with COVID-19 in 2020 were experiencing their first confirmed episode of the disease and were not vaccinated, as no COVID-19 vaccine was available in Romania at that time. Among the patients hospitalized with COVID-19 in 2024, 2 patients reported a previous episode of COVID-19, and only 12 were vaccinated against COVID-19 (with 1 to 3 doses of one of the available vaccine types), but none had received a booster dose in the past year. Thus, only 8.69% of the hospitalized COVID-19 cases had a vaccination history against COVID-19. However, the level of post-infectious natural immunity may be higher due to asymptomatic or oligosymptomatic forms of COVID-19 from previous pandemic waves.
3.3. Clinical Manifestations of COVID-19
The duration of symptoms from onset to hospitalization was significantly longer in the first pandemic year compared to 2024, with an average of 5.87 ± 3.67 days versus 2.81 ± 2.40 days, and a median of 5 [1;21] versus 2 [1;18].
COVID-19 symptoms are typically categorized under respiratory viral infections and are characterized by fever, chills, pain syndrome (headache, myalgias, arthralgias), respiratory symptoms (dysphagia, dysphonia, rhinorrhea, cough, dyspnea), along with varying digestive (diarrhea, vomiting) or neurological symptoms.
When comparing the clinical picture in 2024 to that of 2020, we observed differences, such as an increase in the frequency of fever, chills, rhinorrhea, and asthenia, while disturbances in taste and smell, myalgias, and loss of appetite were less frequent [Table 2].
The significance of the changes in symptomatology should be interpreted with caution, considering the higher proportion of elderly patients with neurocognitive disorders, who may express certain symptoms in a distorted manner.
The vital parameters reported during the initial examination at the time of admission for patients showed no significant differences in heart rate, systolic blood pressure, and oxygen saturation. However, diastolic blood pressure and respiratory rate were higher in 2024 compared to the median values of 2020, which were normal [Table A1]. The higher respiratory rate in 2020 may be due to the longer duration of the disease from onset to admission compared to 2024, indicating an association with the onset of more common acute pulmonary complications.
3.4. Laboratory Findings
In accordance with the updated national protocols, the diagnosis of COVID-19 was based on clinical and epidemiological criteria. RT-PCR-SARS-CoV-2 tests confirmed the laboratory diagnosis in all cases in 2020, but only 16.6% of cases in 2024, when rapid tests, accepted for diagnostic purposes, were also used.
Among the known markers with a severe prognostic value for the progression of COVID-19, the Neutrophil/Lymphocyte ratio (NLR) >5 and elevated D-dimers levels were more frequently increased in patients hospitalized in 2024, while the CRP levels were higher in 2020, although the difference was not statistically significant [Table A1]. The severity and frequency of cytolysis were less pronounced in 2024 compared to 2020, indicating a reduced hepatic impact in the clinical and biological dynamics of COVID-19 [Figure 2].
3.5. Radiological Findings
Radiological findings in COVID-19 patients were predominantly characterized by interstitial changes in 2024, in contrast to 2020, when nearly half of the cases had bilateral opacities, corresponding to forms with a potential for severe progression. Complex radiological descriptions, combining interstitial changes with unilateral or bilateral opacities, were noted in both periods, but the proportion of normal radiographs was higher in 2020 compared to 2024 [Table A2].
3.6. Clinical Forms, Complications, and Post-COVID-19 Deaths
Pneumonia was the main clinical form of COVID-19, with a higher frequency in 2024, but complications such as respiratory failure and associated hepatitis decreased compared to the first pandemic year [Table A3].
The frequency of severe forms and deaths within 90 days of hospitalization for COVID-19 was higher in 2024 compared to 2020 [Figure A1; Table 3].
This evolution can be explained by the more stringent selection of hospitalized cases in 2024, considering the risk of severe progression, with a predominance of older patients and those with a higher comorbid burden.
Co-infection with Clostridioides difficile, either as an infection that developed in COVID-19 patients or as a pre-existing infection upon which COVID-19 was contracted, was significantly more common in 2024 compared to 2020. It served as an additional factor for a severe prognosis in these patients [13].
The average duration of hospitalization for COVID-19 decreased from 10.77 ± 5.10 days in 2020 to 6.30 ± 3.97 days in 2024 (p < 0.001), noting that regulations regarding admission and discharge criteria were modified with the updating of local protocols.
Mortality in the following 90 days after COVID-19 hospitalization was associated with male sex, a Charlson comorbidity index >5, elevated CRP (>100 mg/dL), D-Dimers (>1000 mg/L), NLR >5, and the presence of comorbidities such as dementia, chronic heart disease, and co-infection with Clostridioides difficile.
3.7. Dynamics of COVID-19 Infection and Characteristics of Hospitalized Patients
The circulation of SARS-CoV-2 in the fourth year since the start of the pandemic led to changes in the characteristics of the hospitalized population, including clinical, biological, radiological profiles, and 90-day mortality after hospitalization. The hospitalized population with COVID-19 became increasingly focused on elderly individuals with multiple comorbidities. The most evident changes in symptomatology included an increase in the frequency of rhinorrhoea and syncope, while disturbances in taste and smell were reported much less frequently. The mortality rate within the first 90 days of COVID-19 hospitalization increased in 2024. Adverse prognostic factors included male sex, a Charlson comorbidity index greater than 5, elevated levels of prognostic markers (CRP, NLR, and D-Dimers), and the presence of dementia or chronic heart disease. Although obesity and diabetes were identified as risk factors for severe COVID-19 progression in 2020, they were not correlated with 90-day survival after COVID-19 hospitalization [Figure 2].
4. Discussion
The dynamics of the epidemiological and clinical criteria observed during the COVID-19 pandemic highlight the evolution of knowledge regarding the new infection at the virological, pathogenic, clinical, and therapeutic levels. This evolution is a result of clinical studies and technological advancements, which have allowed for the improvement of diagnostic, treatment, and prevention methods.
The characteristic clinical manifestations of the disease can change depending on factors such as the variation in attack rates across different populations with varying age pyramids, geographic conditions, access to healthcare services, prevalence of comorbidities, and cultural differences that influence the recognition of certain symptoms [14].
The use of updated vaccines and booster doses, as well as the spread of SARS-CoV-2 variants with lower virulence, have contributed to the reduction in morbidity, hospitalization rates, and COVID-19-related deaths. However, moderate and severe cases continue to be diagnosed, with mortality rates higher than those associated with influenza and other respiratory diseases [15].
Infection with the Omicron variant of SARS-CoV-2 in hospitalized adults was less severe compared to infection with the Delta variant [16]. Approximately 20% of hospitalizations during the Omicron period in adults who tested positive for SARS-CoV-2 via RT-PCR were due to non-COVID-19-related conditions, which helps explain the high community transmission of SARS-CoV-2. COVID-19 vaccination was associated with a lower likelihood of hospitalization in intensive care units (ICU) during the circulation of the Omicron variant [17].
Recent studies have shown that the clinical expression and severity of COVID-19 are correlated with the impact of viral variants on changes in the oral microbiome. In infections with the Omicron variant, microbiome disruption worsens disease severity, possibly through the secretion of endotoxins that trigger an increase in inflammatory cytokine secretion [18].
In recent years, COVID-19 has increasingly been likened to the flu, especially in terms of its symptoms and patterns of transmission. The concurrent circulation of seasonal influenza viruses and SARS-CoV-2 may favor the emergence of new coronavirus variants accompanied by changes in clinical symptoms, contributing to difficulties in differentiating the two viral infections [19,20].
Each wave of COVID-19 and its viral variant have led to distinct clinical phenotypes, which have evolved throughout the course of the pandemic. As time passed, the pandemic coronavirus continuously evolved, gradually adapting to environmental conditions and the human immune response. The variation in symptoms presented can be attributed to the influence of new variants and the interference of immunity through vaccination, necessitating a revision of the clinical diagnostic criteria and case definitions, as well as the constant adaptation of healthcare systems to these changes [21].
This reality is also reflected in the results of our study, where the demographic, clinical, biological, and radiological characteristics of COVID-19 changed in hospitalized patients in 2024 compared to the early stages of the pandemic. Older age and a higher index of chronic comorbidities were associated with a higher frequency of severe forms and an increased 90-day mortality rate post-COVID-19, rising from 4% in 2020 to 9% in 2024.
90-day post-COVID mortality has also been evaluated by other previous retrospective studies.
In a UK study at the beginning of the pandemic, 90-day mortality after COVID-19 hospitalization was 34%, increasing in institutionalized individuals, men, the elderly, and those with chronic comorbidities such as renal, neurological, pulmonary, and cardiac conditions, as well as cumulative comorbidities [22].
In a 2021 study from Malaysia, 90-day mortality after COVID-19 hospitalization was 13.5%, correlated with age over 60 years, the need for supplemental oxygen with high flow, and the presence of diabetes [23].
A meta-analysis on morbidity and mortality within the first 90 days after hospitalization for COVID-19 reported a rehospitalization rate of 12% based on 295,892 patients and a mortality rate (regardless of cause) of 5% based on 176,920 patients. These data highlight the persistent risks after COVID-19 hospitalization, including complications and deaths, underscoring the need for the development of monitoring strategies and public health interventions to limit adverse events [24].
5. Conclusions
The demographic, clinical, biological, and radiological characteristics of COVID-19 are dynamic, with differences observed in hospitalized patients in 2024 compared to the early stages of the pandemic. Older age and a higher index of chronic comorbidities were associated with a higher frequency of severe forms and deaths within 90 days post-COVID-19. Hospitalization for COVID-19 may be an unfavorable prognostic factor for the elderly population.
Author Contributions
Conceptualization, M.A.; Methodology: C.-M.V. and A.P.-C.; software, R.-E.G.-B.; validation, C.G.; formal analysis, A.-A.A.; investigation, C.M.V., M.A., A.P.-C., A.-A.A., R.-E.G.-B. and C.G.; data curation, A.-A.A.; writing—original draft preparation C.M.-V., A.P.-C., C.G., and R.-E.G.-B.; writing—review and editing, M.A. and A.-A.A.; visualization, C.G. and A.P.-C.; supervision, M.A. All authors have read and agreed to the published version of the manuscript.
Funding
This research received no external funding.
Institutional Review Board Statement
The study was conducted in accordance with the Declaration of Helsinki and approved by the Institutional Review Board of “Sf. Cuvioasa Parascheva” Infectious Diseases Clinic Hospital Galati No. 1/6 date 21.01.2025.
Informed Consent Statement
Informed consent was not applicable due to the retrospective nature of this study, but all the patients signed the informed consent of agreement to be used the personal data for medical statistical analysis.
Data Availability Statement
This study was conducted in accordance with the Declaration of Helsinki, for studies involving humans, and approved by the Institutional Board of Clinic Hospital for Infectious Diseases Galati (No.1/6 date of 21 January 2025).
Acknowledgments
The authors acknowledge the financial support of “Dunarea de Jos” University scientific committee from Galati for the article publication.
Conflicts of Interest
The authors declare no conflicts of interest.
Abbreviations
The following abbreviations are used in this manuscript:
| ALT | alanine aminotransferases |
| AST | aspartate aminotransferases |
| BMI | Body Mass Index |
| CK | creatine kinase |
| COVID-19 | Coronaviral Infection Disease - 2019 |
| CRP | C Reactive Protein |
| NLR | Neutrophil/Lymphocyte ratio |
| OR | Odds Ratio |
| SARS-CoV-2 | Severe Acute Respiratory Syndrome Coronavirus-2 |
Appendix A
Appendix A.1
Figure A1.
Distribution of COVID-19 patients by clinical severity of the disease.
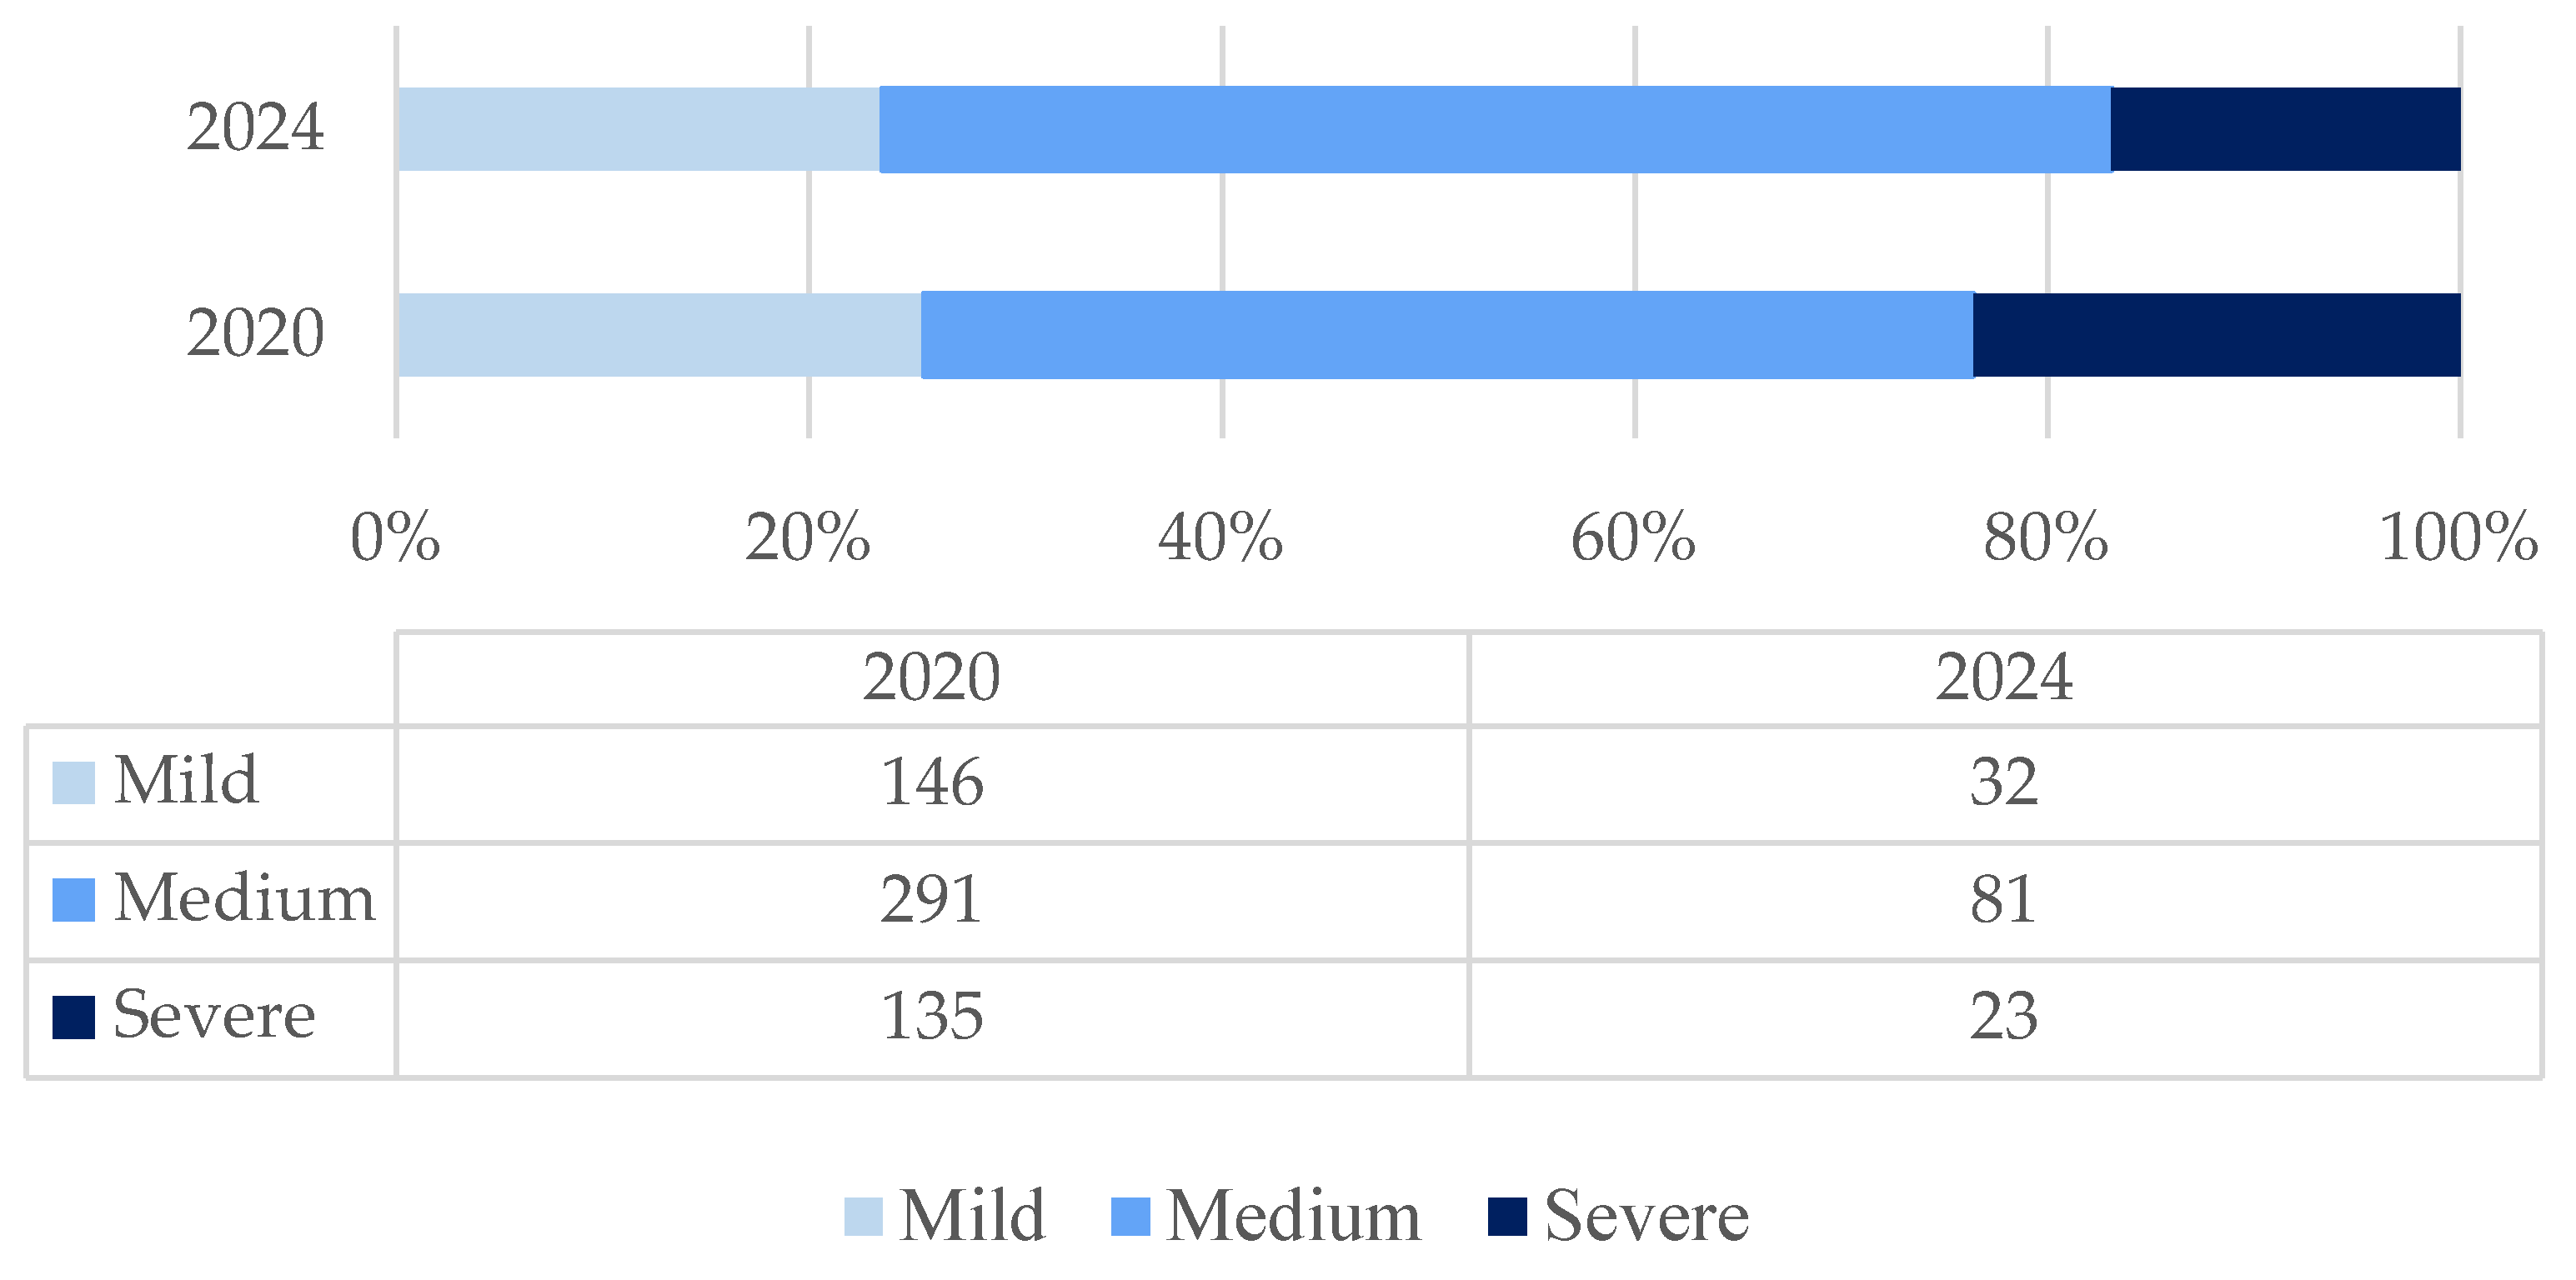

Table A1.
Comparison of vital parameter values during the initial examination at the time of hospitalization for COVID-19 patients in 2024 and 2020.
Table A1.
Comparison of vital parameter values during the initial examination at the time of hospitalization for COVID-19 patients in 2024 and 2020.
| 2024: n1 = 138 | 2020: n2 = 583 | P * | |||||
|---|---|---|---|---|---|---|---|
| Average ± SD | Median | Max;min | Average ± SD | Median | 39.2;35.4 | ||
| Temperature °C | 36.9 ± 0.75 | 36.7 | 39.3;36 | 36.24 ± 0.61 | 36 | 0.6;27.8 | 0.010 |
| Heart Ratio/min | 89.7 ± 15.92 | 89 | 28;16 | 90.38 ± 2.90 | 89 | 42;11 | 0.598 |
| Systolic BP mmHg | 131.22 ± 19.87 | 129.5 | 195;80 | 131.43 ± 19.37 | 130 | 80;204 | 0.981 |
| Diastolic BP mmHg | 79.53 ± 11.88 | 80 | 113;49 | 83.29 ± 13.84 | 82 | 144;40 | 0.002 |
| Respiratory Rate/min | 19.35 ± 2.69 | 18 | 16.5;6.4 | 20.35 ± 1.86 | 20 | 18.3;5.1 | <0.001 |
| Oxygen Saturation (%) | 95.54 ± 3,32 | 96 | 99;79 | 95.38 ± 3.68 | 96 | 70;100 | 0.993 |
* Mann-Whitney Test.
Table A2.
Comparison of laboratory markers in COVID-19 hospitalized patients in 2024 and 2020.
| 2024: n1 = 138 | 2020: n2 = 583 | P * | |||||
|---|---|---|---|---|---|---|---|
| Average ± SD | Median | Max;min | Average ± SD | Median | Max;min | ||
| NL ×103/mm3 | 7.42 ± 3.38 | 6.55 | 17.1;0.87 | 6.78 ± 3.49 | 6 | 0.6;27.8 | 0.010 |
| N/Ly | 4.24 ± 3.78 | 3 | 22.2;0.44 | 3.61 ± 3.58 | 2.43 | 38.15;0.16 | 0.010 |
| Hb [g/dL] | 12.17 ± 2.01 | 12.1 | 16.5;6.4 | 13.47 ± 1.86 | 13.5 | 18.3;5.1 | <0.001 |
| PTL ×103/mm3 | 212.54 ± 84.40 | 195 | 528;45 | 230.77 ± 93.51 | 213.5 | 691;14 | 0.018 |
| PCR | 72.59 ± 75.21 | 54 | 373;0.15 | 81.26 ± 81.40 | 48 | 330;1 | 0.518 |
| ALT UI/L | 37.47 ± 45.26 | 31 | 340;6 | 50.75 | 33.5 | 706;11 | <0.001 |
| AST UI/L | 38.29 ± 37.94 | 23.25 | 208;18 | 43.99 ± 34.79 | 33 | 287;12 | <0.001 |
| CK | 157.86 ± 182.19 | 93 | 1322;16 | 177.26 ± 480.72 | 96 | 8752 | 0.511 |
| D-Dimers | 1619.71 ± 1946.5 | 933 | 10000;109.7 | 944.90 ± 1312.31 | 544.5 | 10000;100 | <0.001 |
Mann-Whitney Test (diferenta Medianelor).
Table A3.
Radiological characteristics associated with COVID-19 in 2024 and 2020.
| n1-2024 | % | n2-2020 | % | p | CI 0.95 | |
|---|---|---|---|---|---|---|
| Interstitial pattern | 103 | 74.6 | 197 | 33.7 | <0,001 | 0.325; 0.491 |
| Unilateral opacities | 17 | 12.3 | 50 | 8.5 | 0.173 | -0.022; 0.097 |
| Bilateral opacities | 12 | 8.6 | 263 | 45.5 | <0.001 | -0.431; -0.306 |
| Normal | 16 | 11.5 | 116 | 19.8 | 0.023 | -0.145; -0.020 |
Table A4.
Comparison of clinical forms of COVID-19 in 2024 and 2020.
| 2024 N1 = 137 | % | 2020 N2 = 583 | % | OR | CI95 | P * | |
|---|---|---|---|---|---|---|---|
| Pneumonia | 127 | 92% | 439 | 75.3% | 4.165 | 2.22;7.78 | <0.001 |
| ARF | 25 | 18% | 175 | 30% | 1.98 | 1.22;3.07 | 0.004 |
| Hepatitis | 7 | 5% | 278 | 47.6% | 17.39 | 9.52;31.78 | <0.001 |
| CDD | 23 | 16.7% | 11 | 1.9% | 10.4 | 5.57;19.39 | <0.001 |
| Severe forms | 23 | 23.1% | 135 | 16.6% | 1.50 | 0.92;2.44 | 0.097 |
| Survival > 90 days | 125 | 91% | 561 | 96% | 2.652 | 1.33;5.28 | 0.005 |
ARF: Acute Respiratory Faillure; CDD: Clostridioides difficile diarrhoea.
References
- CDC. Coronavirus Disease 2019 (COVID-19) 2020 Interim Case Definition. 2021. Available online: https://ndc.services.cdc.gov/case-definitions/coronavirus-disease-2019-2021/ (accessed on 21 January 2025).
- ECDC. Case definition for coronavirus disease 2019 (COVID-19), as of 3 December 2020. 2020. Available online: https://www.ecdc.europa.eu/en/covid-19/surveillance/case-definition (accessed on 21 January 2025).
- WHO (World Health Organization). WHO COVID-19: case definition. Updated in public health surveillance for COVID-19. 2020. Available online: https://www.who.int/publications/i/item/WHO-2019-nCoV-Surveillance_Case_Definition-2020.2 (accessed on 21 January 2025).
- WHO Team. Epidemic and Pandemic Preparedness and Prevention (EPP)/ Technical document: COVID-19 Global Risk Assessment. Available online: https://www.who.int/publications/m/item/covid-19-global-risk-assessment (accessed on 16 February 2025).
- Ulrichs, T.; Rolland, M.; Wu, J.; Nunes, M.C.; El Guerche-Séblain, C.; Chit, A. Changing epidemiology of COVID-19: potential future impact on vaccines and vaccination strategies. Expert Rev Vaccines 2024, 23(1), 510–522. [Google Scholar] [CrossRef] [PubMed]
- Strategic Preparedness, Readiness and Response Plan to End the Global COVID-19 Emergency in 2022. World Health Organization: Geneva, 2022. (WHO/WHE/SPP/2022.01) Licence: CC BY-NC-SA 3.0 IGO. Available online: https://www.who.int/publications/i/item/WHO-WHE-SPP-2022.1 (accessed on 12 January 2025).
- Swiss Re Institute. The future of excess mortality after COVID-19. Available online: https://www.swissre.com/institute/research/topics-and-risk-dialogues/health-and-longevity/covid-19-pandemic-synonymous-excess-mortality.html (accessed on 10 March 2025).
- World Health Organization. ICD-11 revision. Available online: https://icd.who.int/en (accessed on 11 January 2025).
- Drosdowsky, A.; Gough, K. The Charlson Comorbidity Index: problems with use in epidemiological research. J Clin Epidemiol 2022, 148, 174–177. [Google Scholar] [CrossRef] [PubMed]
- Charlson Comorbidity Index (CCI). Available online: https://www.mdcalc.com/calc/3917/charlson-comorbidity-index-cci (accessed on 11 January 2025).
- Ministerul Sanatatii. ORDIN nr. 487 din 23 martie 2020 pentru aprobarea protocolului de tratament al infecției cu virusul SARS-Cov-2. MONITORUL OFICIAL nr. 242 din 24 martie 2020.
- Ministerul Sanatatii. ORDINUL nr. 1.274 din 28 februarie 2024 pentru aprobarea PROTOCOL NAȚIONAL de practică medicală privind tratamentul infecției cu virusul SARS-CoV-2. MONITORUL OFICIAL nr. 179 din 5 martie 2024.
- Stoian, M.; Andone, A.; Boeriu, A.; Bândilă, S.R.; Dobru, D.; Laszlo, S.Ș.; Corău, D.; Arbănași, E.M.; Russu, E.; Stoian, A. COVID-19 and Clostridioides difficile Coinfection Analysis in the Intensive Care Unit. Antibiotics 2024, 13, 367. [Google Scholar] [CrossRef]
- Baruch, J.; Rojek, A.; Kartsonaki, C.; Vijayaraghavan BK, T.; Gonçalves, B.P.; Pritchard, M.G.; Merson, L.; Dunning, J.; Hall, M.; Sigfrid, L.; Citarella, B.W.; Murthy, S.; Yeabah, T.O.; Olliaro, P.; ISARIC Clinical Characterisation Group. Symptom-based case definitions for COVID-19: Time and geographical variations for detection at hospital admission among 260,000 patients. Influenza Other Respir Viruses 2022, 16, 1040–1050. [Google Scholar] [CrossRef] [PubMed]
- Maison, D.P.; Tasissa, H.; Deitchman, A.; Peluso, M.J.; Deng, Y.; Miller, F.D.; Henrich, T.J.; Gerschenson, M. COVID-19 clinical presentation, management, and epidemiology: a concise compendium. Front Public Health 2025, 13, 1498445. [Google Scholar] [CrossRef] [PubMed]
- Vasile, M.C.; Arbune, A.A.; Lupasteanu, G.; Vlase, C.M.; Popovici, G.C.; Arbune, M. Epidemiologic and Clinic Characteristics of the First Wave of the COVID-19 Pandemic in Hospitalized Patients from Galați County. J Clin Med 2021, 10, 4210. [Google Scholar] [CrossRef] [PubMed]
- Sankar, K.; Modi, N.; Polyak, A.; Directo, M.P.; Johnson, L.R.; Kho, N.; Isonaka, S.K.; Pedraza, I.; Chen, P.; Modes, M.E. Comparison of clinical characteristics and outcomes of critically ill adults with SARS-CoV-2 infection during Delta and Omicron variant predominance periods: a single-hospital retrospective cohort study. BMJ Open Respir Res 2023, 10. [Google Scholar] [CrossRef] [PubMed]
- Cui, G.; Sun, Y.; Zou, Y.; Sun, R.; Gao, Y.; Liu, X.; Zhou, Y.; Zhang, D.; Wang, X.; Li, Y.; et al. Dynamic changes of Bacterial Microbiomes in Oropharynx during Infection and Recovery of COVID-19 Omicron Variant. PLoS Pathog 2024, 20, e1012075. [Google Scholar] [CrossRef] [PubMed]
- Vlase, C.M.; Stuparu Cretu, M.; Vasile, M.C.; Popovici, G.C.; Arbune, M. Comparative Epidemiological and Clinical Outcomes on COVID-19 and Seasonal Influenza Hospitalized Patients during 2023. Infect Dis Rep 2024, 16, 783–793. [Google Scholar] [CrossRef] [PubMed]
- Han, Y.; Guo, J.; Li, X.; Zhong, Z. Differences in clinical characteristics between coronavirus disease 2019 (COVID-19) and influenza: a systematic review and meta-analysis. NPJ Prim Care Respir Med 2025, 35, 8. [Google Scholar] [CrossRef] [PubMed]
- Ho, M.; Levy, T.J.; Koulas, I.; Founta, K.; Coppa, K.; Hirsch, J.S.; Davidson, K.W.; Spyropoulos, A.C.; Zanos, T.P. Longitudinal dynamic clinical phenotypes of in-hospital COVID-19 patients across three dominant virus variants in New York. Int J Med Inform 2024, 181, 105286. [Google Scholar] [CrossRef] [PubMed]
- Murphy, S.A.; Khalil, F.; Fayaz, M.; Robinson, L.; Cummings, N.M. Mortality 30 and 90 Days After Hospitalisation for COVID-19: Prognostic Factors on Admission to Hospital. J Global Med 2021, 1, e13. [Google Scholar] [CrossRef]
- Hor, C.P.; Teo, L.K.; Wang, H.X.; Teoh, Y.J.; Chong, T.L.; Yen, C.H.; Mutalib, N.A.; Cheng, J.T. Morbidity and Mortality Outcomes for Patients with Moderate-to-Severe COVID-19 Diseases: A Post-Hospitalization Follow-Up Study. Int J Infect Dis 2023, 130, S152–S153. [Google Scholar] [CrossRef] [PubMed Central]
- Newman, J.; Flower, L.; Jones, R.; Phillips, V.; Couturier, D.L.; Law, M.; Toshner, M.; Summers, C. Longer term post-hospital morbidity and mortality following admission with COVID-19: a systematic review and meta-analysis. ERJ Open Research 2025. [Google Scholar] [CrossRef]
Figure 1.
Comparison of the Charlson Index in COVID-19 Patients Hospitalized in 2020 and 2024.
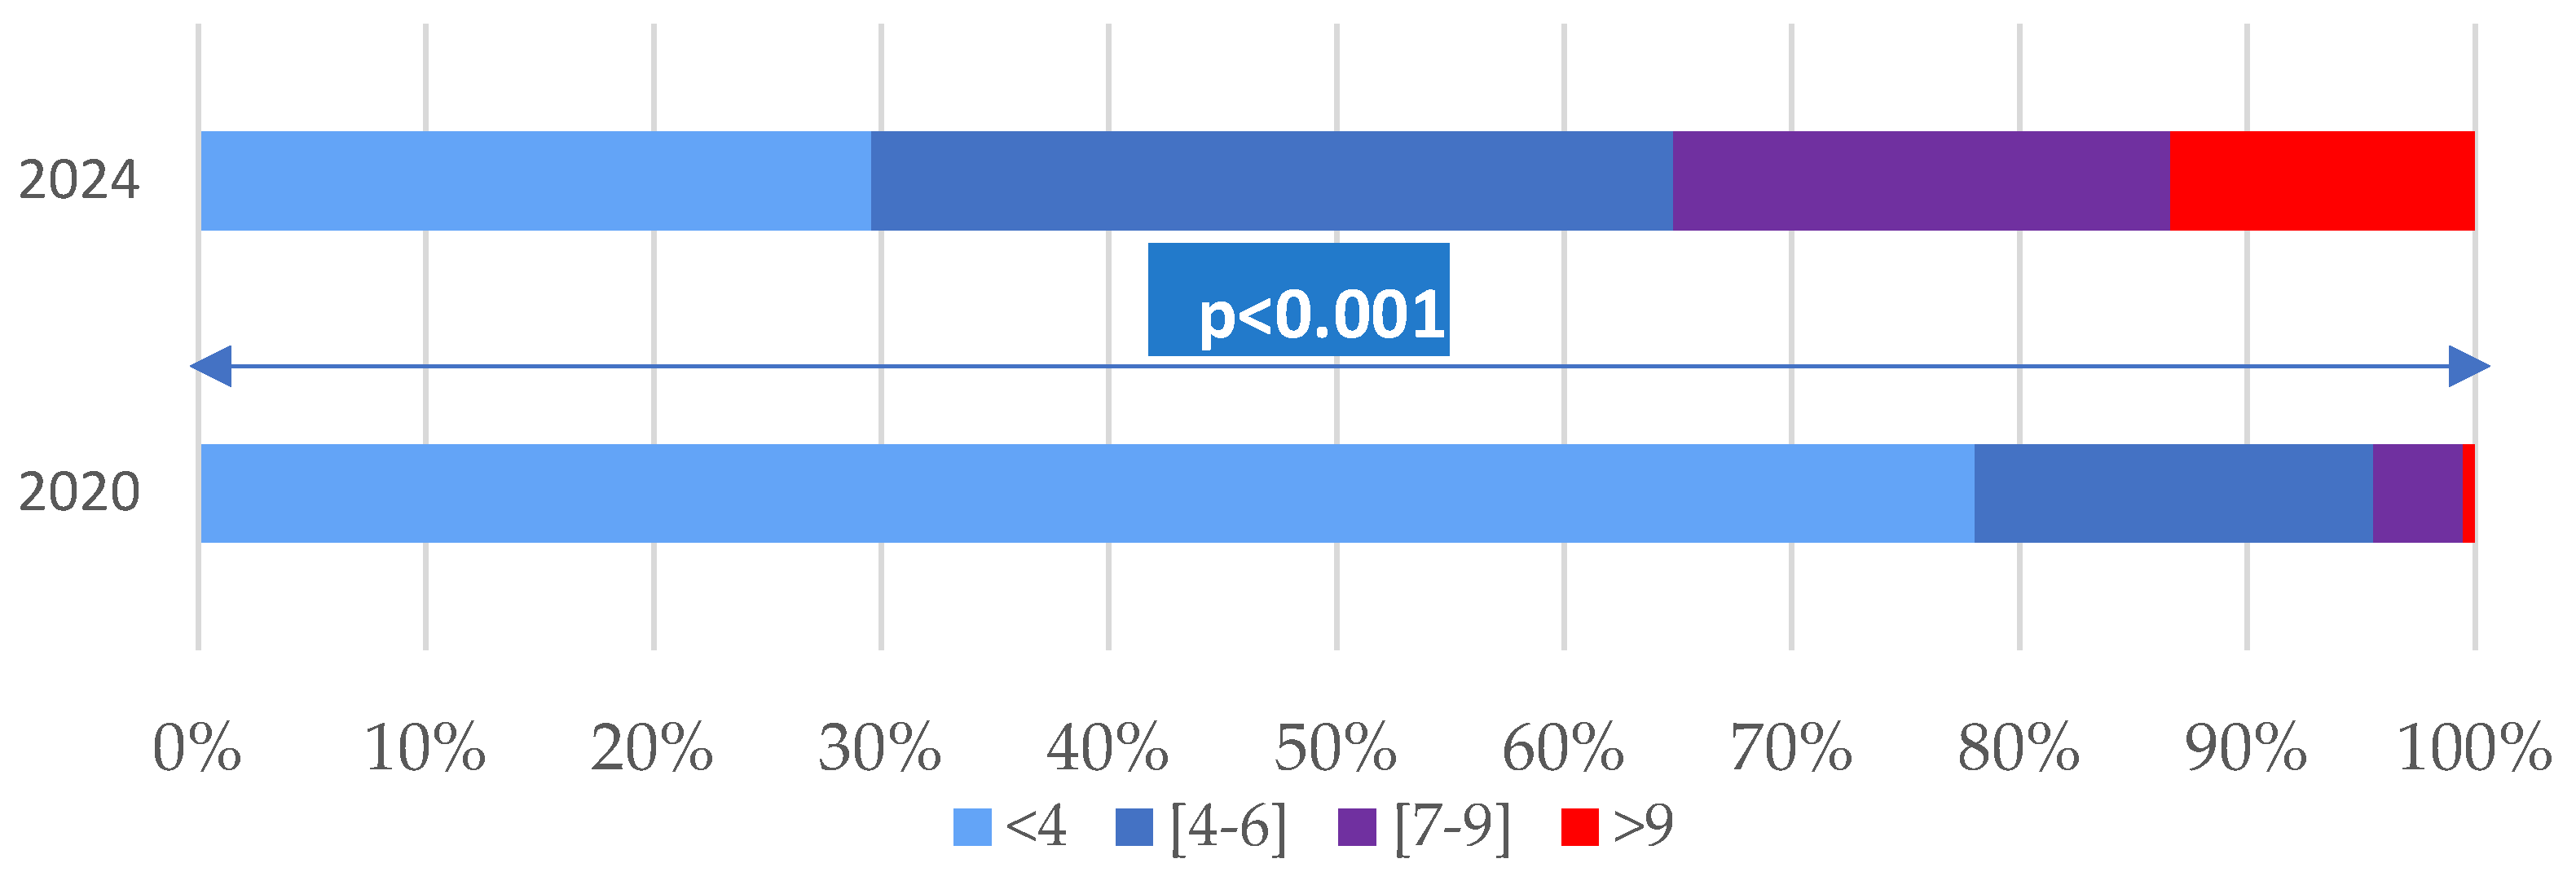
Figure 2.
Forest plot illustrating the odds ratios and 95% confidence intervals to identify the differences in COVID-19 characteristics between 2020 and 2024; level of significance p < 0.01, two-tailed.
Figure 2.
Forest plot illustrating the odds ratios and 95% confidence intervals to identify the differences in COVID-19 characteristics between 2020 and 2024; level of significance p < 0.01, two-tailed.
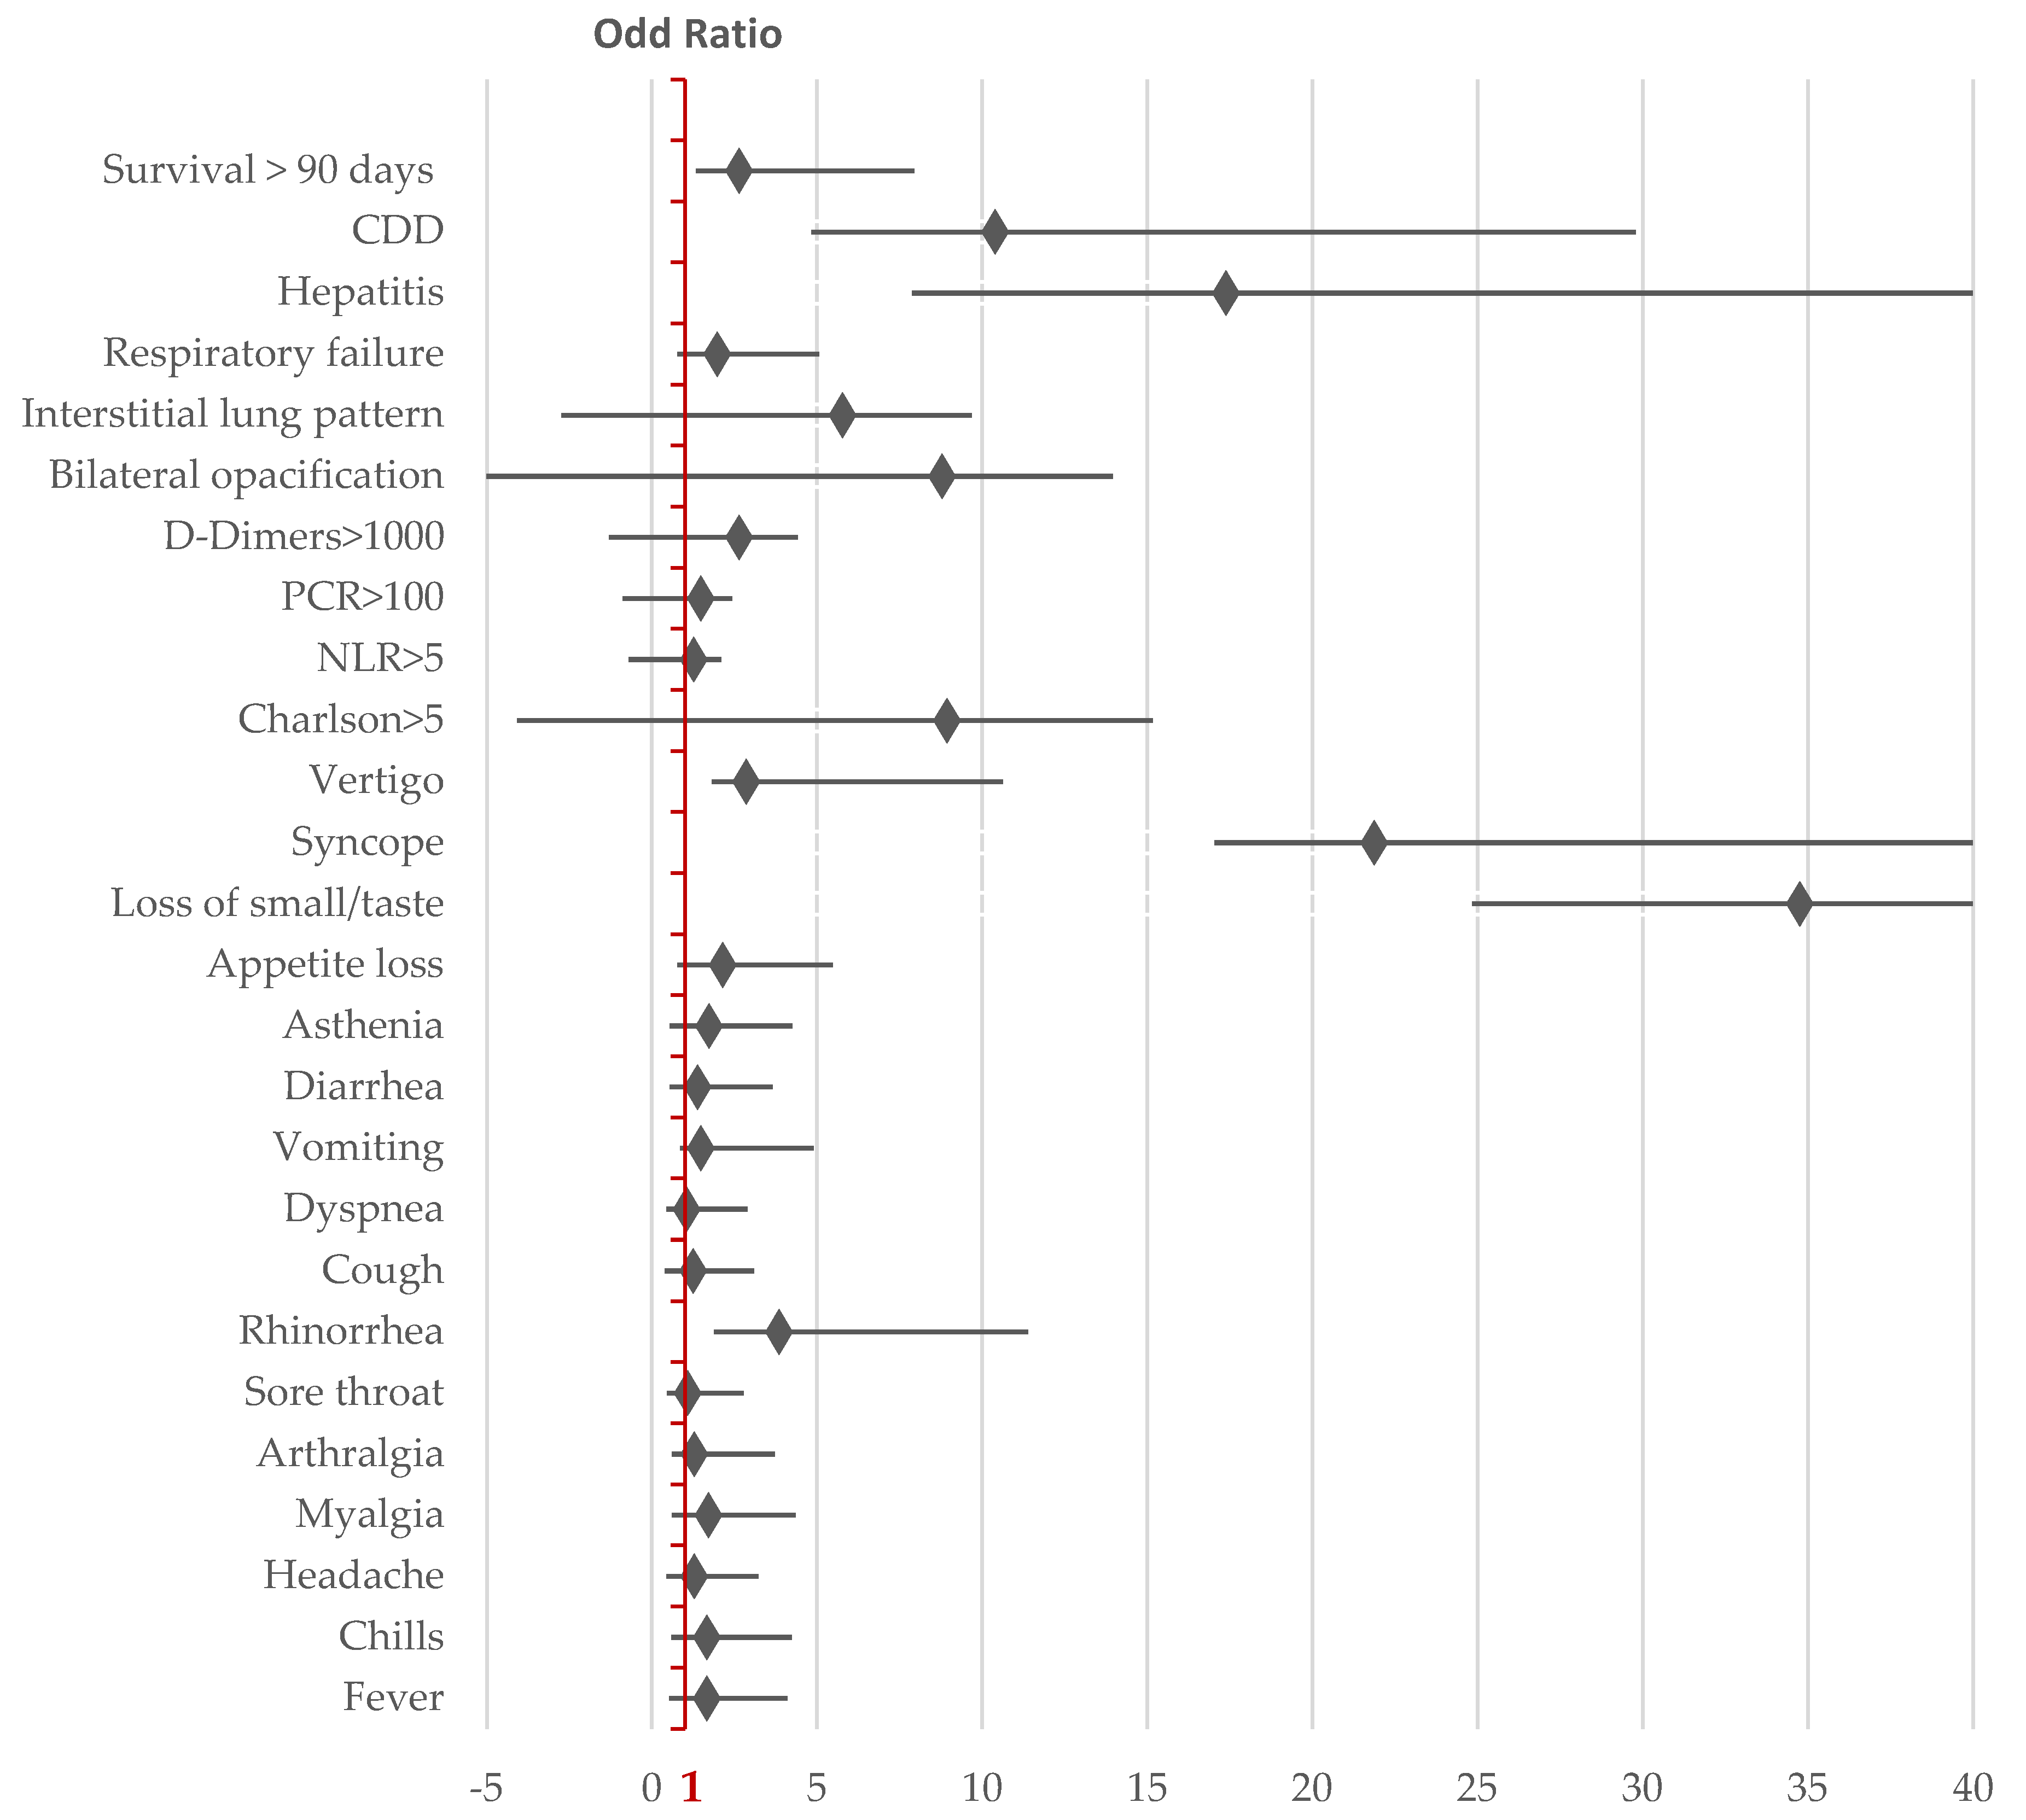
Table 1.
Comparison of Comorbidities in Hospitalized COVID-19 Patients in 2024 and 2020.
| 2024 | % | 2020 | % | OR | CI95 | P * | ||
|---|---|---|---|---|---|---|---|---|
| Dementia | YES NO |
22 115 |
16.1% | 22 561 |
3.77% | 4.878 | 2.74;8.66 | <0.001 |
| Cerebrovascular Accident | YES NO |
17 119 |
12.5% | 15 568 |
2.57% | 5.409 | 2.81;10.409 | <0.001 |
| Chronic Heart Faillure | YES NO |
74 63 |
54% | 59 524 |
10.1% | 10.43 | 7.09;15.34 | <0.001 |
| Myocardial infarction | YES NO |
7 131 |
5.07% | 8 575 |
1.37% | 3.84 | 1.46;10.06 | 0.006 |
| Chronic Pulmonary Disease | YES NO |
27 110 |
19.7% | 15 568 |
2.57% | 9.29 | 5.26;16.39 | <0.001 |
| Liver disease | YES NO |
37 101 |
26.82% | 27 556 |
4.63% | 7.69 | 4.73;12.52 | <0.001 |
| Chronic kidney disease | YES NO |
17 121 |
12.3% | 24 559 |
4.12% | 3.27 | 1.75;6.08 | <0.001 |
| Diabetes mellitus | YES NO |
25 113 |
18.1% | 60 523 |
10.3% | 1.92 | 1.16;3.18 | 0.010 |
| Hemiplegia | YES NO |
7 131 |
5.07% | 7 576 |
1.2% | 4.39 | 1.65;11.70 | 0.003 |
| Peripheral vascular disease | YES NO |
15 123 |
10.9% | 6 577 |
1.03% | 11.72 | 5.37;25.59 | <0.001 |
| Connective tissue disease | YES NO |
1 137 |
0.72% | 5 578 |
0.86% | 1.18 | 0.13;10.20 | 0.877 |
| Peptic ulcer disease | YES NO |
23 115 |
16.62% | 5 578 |
0.86% | 22.11 | 10.76;45.43 | <0.001 |
| AIDS | YES NO |
3 135 |
2.17% | 5 578 |
0.86% | 2.56 | 10.76;45.43 | 0.184 |
| Tumors/leukemia lymphoma/ | YES NO |
19 119 |
13.8% | 27 556 |
4.63% | 3.28 | 1.82;5.93 | <0.001 |
| Hypertenssion | YES NO |
81 55 |
59.6% | 175 408 |
30% | 3.43 | 2.36;4.98 | <0.001 |
| Obesity | YES NO |
28 70 |
28.6% | 176 269 |
39.6% | 1.63 | 1.01;2.62 | 0.042 |
* Chi-Square Test.
Table 2.
Comparison of COVID-19 Symptoms in Hospitalized Patients in 2024 and 2020.
| 2024 | % | 2020 | % | OR | CI95 | P * | ||
|---|---|---|---|---|---|---|---|---|
| Fever | Yes No |
86 52 |
62.3% | 290 292 |
49.8% | 1.66 | 1.14;2.43 | 0.008 |
| Chills | Yes No |
36 102 |
26.1% | 102 481 |
17.5% | 1.66 | 1.07;2.56 | 0.021 |
| Headache | Yes No |
41 97 |
29.7% | 144 439 |
24.7% | 1.28 | 0.85;1.94 | 0.225 |
| Myalgia | Yes No |
31 106 |
22.6% | 195 388 |
33.4% | 1.71 | 1.11;2.64 | 0.014 |
| Arthralgia | Yes No |
14 123 |
10.2% | 47 536 |
8.06% | 1.29 | 0.69;2.42 | 0.507 |
| Sore throat | Yes No |
31 107 |
22.5% | 123 460 |
21.1% | 1.08 | 0.639;1.693 | 0.724 |
| Rhinorrhea | Yes No |
15 118 |
10.9% | 18 565 |
3.9% | 3.85 | 1.97;7.53 | <0.001 |
| Cough | Yes No |
79 59 |
57.2% | 217 366 |
62.8% | 1.25 | 0.86;1.835 | 0.229 |
| Dyspnea | Yes No |
19 119 |
13.8% | 76 507 |
13% | 1.06 | 0.62;1.82 | 0.819 |
| Vomiting | Yes No |
8 130 |
5.8% | 23 560 |
3.95% | 1.49 | 0.65;3.40 | 0.334 |
| Diarrhea | Yes No |
25 112 |
18.2% | 81 502 |
13.9% | 1.38 | 0.84;2.26 | 0.195 |
| Asthenia | Yes No |
72 66 |
52.2% | 225 358 |
38.6% | 1.73 | 1.19;2.51 | 0.003 |
| Appetite loss | Yes No |
28 108 |
20.4% | 207 376 |
35.5% | 2.14 | 1.37;3.33 | 0.007 |
| Loss of small/taste | Yes No |
1 137 |
0.72% | 118 465 |
20.2% | 34.76 | 9.93;121.64 | <0.001 |
| Syncope | Yes No |
5 133 |
3.62% | 1 582 |
0.17% | 21.87 | 4.84;98.72 | <0.001 |
| Vertigo | Yes No |
4 134 |
2.9% | 46 537 |
7.89% | 2.86 | 1.06;7.76 | 0.037 |
* Chi-Square Test.
Table 3.
90-Day Mortality After COVID-19 Hospitalization (all patients).
| 90 days after-COVID-19 Hospitalization |
Survive N1 = 687 |
Death N2 = 35 |
OR | CI95 | P | |
|---|---|---|---|---|---|---|
| Male | Yes No |
396 326 |
23 12 |
2.42 | 1.21;4.86 | 0.012 |
| Charlson > 5 | Yes No |
553 134 |
22 13 |
6.98 | 3.73;13.06 | <0.001 |
|
Clostridioides difficile Diarrhoea |
Yes No |
26 661 |
9 26 |
8.80 | 4.26;18.14 | <0.001 |
| CRP > 100 mg/dL | Yes No |
95 592 |
18 17 |
6.59 | 3.55;12.25 | <0.001 |
| NLR > 5 | Yes No |
129 558 |
19 16 |
5.13 | 2.73;9.66 | <0.001 |
| D-Dimers > 1000 mg/L | Yes No |
131 556 |
22 13 |
4.28 | 3.84;13.41 | <0.001 |
| Dementia | Yes No |
37 650 |
7 28 |
4.39 | 1.92;9.99 | <0.001 |
| Chronic Heart Disease | Yes No |
120 566 |
13 22 |
2.78 | 1.40;5.54 | 0.003 |
| Diabetes | Yes No |
80 607 |
6 29 |
1.56 | 0.63;3.87 | 0.327 |
| Obesity | Yes No |
198 329 |
6 11 |
0.906 | 0.33;2.48 | 0.848 |
Disclaimer/Publisher’s Note: The statements, opinions and data contained in all publications are solely those of the individual author(s) and contributor(s) and not of MDPI and/or the editor(s). MDPI and/or the editor(s) disclaim responsibility for any injury to people or property resulting from any ideas, methods, instructions or products referred to in the content. |
© 2025 by the authors. Licensee MDPI, Basel, Switzerland. This article is an open access article distributed under the terms and conditions of the Creative Commons Attribution (CC BY) license (http://creativecommons.org/licenses/by/4.0/).
Copyright: This open access article is published under a Creative Commons CC BY 4.0 license, which permit the free download, distribution, and reuse, provided that the author and preprint are cited in any reuse.


