
Submitted:
07 December 2024
Posted:
10 December 2024
Read the latest preprint version here
Abstract
Building decarbonization is a major challenge for cities. Deciding what, when, and how to retrofit a building is difficult, given the complex interaction between energy costs and investment requirements. Several tools have been developed in the last years to help public and private stakeholders with these decisions, but none cover aspects the authors think are fundamental. For this reason, an urban building retrofit tool was developed and is presented in this article. This new tool is based on a bottom-up approach, with all buildings simulated individually, considering aspects such as shading or adjacencies. As a second step, three scenarios with different levels of ambition have been implemented in the tool, and the energy demand and emissions resulting from these scenarios have been calculated. As a third step, the retrofitting scenarios' initial investment and operational costs have been implemented via a detailed Life Cycle Costs (LCC) approach. The authors describe the robust and scalable structure that has been developed and the application of this structure to calculate the LCCs of different retrofitting scenarios in Montréal.
Keywords:
Urban Building Energy Models
; retrofitting
; Life Cycle Costs
1. Introduction
One of the most demanding segments of urban-scale decarbonization is building retrofits. The building sector accounts for more than 35% of global energy consumption and almost 38% of CO2 emissions if we consider embodied energy [1].
The decision of what we do to existing buildings can significantly impact future CO2 emissions. In the scientific community, there are significant doubts that demolishing and rebuilding net zero is a better option than retrofitting because of the reduced CO2 embodied emissions of the latter option [2,3,4], but a strong effort must be made to ensure that it can be attractive to all stakeholders.
According to [5], even after 90 years of lifetime, retrofitting seems a better option than demolishing. In most cases, retrofitting seems to be the best option from a multi-factor social, environmental, and economic perspective. According to recent references, the stock of existing buildings will account for 75% of GreenHouse Gases (GHG) emissions, whilst new buildings will account for 25% (2021 World Green Building Council. WorldGBC Net Zero Carbon Buildings Commitment). According to recent references, the stock of existing buildings will account for at least 75% of GHG emissions while new buildings will account for 25% [6] until 2050.
In Canada, the retrofitting for low-rise residential buildings is less than 1%, and, for commercial buildings, 1.4% of floor area per year [7]. However, although the goal seems clear for most policymakers in different countries, massive and large-scale retrofitting is not happening. Very interesting examples of successful case studies have been happening worldwide if life cycle costs are taken into account[8], but large-scale implementation is not successful for several reasons. The most significant reasons [9] are the knowledge gap, the expertise gap, the lack of political commitment, inadequate policies, the speed to scale up, the huge necessary investment capital, and the long return on investment.
Some of those, especially the ones related to policymaking and the knowledge gap, linked to the lack of detailed life cycle information on the impact of these measures [10], could be overcome using tools such as Urban Building Energy Modelling (UBEM). The demand for low-carbon and energy-efficient urban development has made UBEM a crucial technique for evaluating the energy efficiency of buildings at the city scale. Reinhart and Cerezo Davila [11] define UBEM as a bottom-up, meta-scale, physics-based engineering model that combines mass flow and heat models to forecast indoor-outdoor environmental conditions and energy consumption for groups of buildings. Considering interdependencies between buildings and their surroundings, such as the impacts of height, density, and radiation exchange on energy consumption, it goes beyond conventional Building Energy Modelling (BEM), which concentrates on individual structures [12]. By offering insights into energy consumption patterns at the daily, seasonal, and annual levels, UBEM helps urban planners and decision-makers assess energy-efficient designs, retrofit options, and renewable energy potential [13,14]. UBEM is a vital instrument for sustainable urban energy planning because of its applications in grid integration, urban planning, and carbon reduction strategies.
Therefore, an Urban Building Energy Retrofit Tool based on UBEMs could be a step forward thanks to its scientific, modular, and scalable approach and ease of application to any city, given the reduced datasets necessary to implement it in a first rough approach.
2. Literature Review on UBEM and Retrofit Tools
2.1. Existing Urban Modelling Tools
Many tools have been developed in the last years to model energy flows in cities, trying to simplify the use and access to urban energy models but covering only partially the complexity of the energy system [15]. The so-called UBEM aims to provide understanding in all aspects of a city’s energy flows, from building energy "consumption" to on-site renewable "production", including traffic or waste management. Within this broad field, many have focused on building stock, which is the aspect the authors will focus on in this article.
UBEM analyses the building demands in their urban context, and it is important to consider their interactions within urban areas with other buildings and other urban area objects. In their review paper on urban models and tools, Allegrini et al. [16] pointed out the importance of building-to-building thermal and solar interactions, i.e. the importance of adjacencies between buildings and the shading of different buildings caused by neighboring surfaces, Urban Heat Island (UHI) or urban vegetation and their impacts on the results of urban energy system simulations.
This interaction between a building and other objects in an urban area, like another building that causes shading views from façades to the sky and sun, was considered for the first time in 2005 in the Sustainable Urban Neighbourhood modeling tool, SUNtool [17]. A thermal model of the building, coupled with Heating, Ventilation, and Air Conditioning (HVAC) was integrated into the tool, also including an urban-sensitive radiation model, the Simplified Radiosity Algorithm (SRA) [18].
Heavily inspired by SUNtool, but further refined with more rigorous thermal and behavioral models was the comprehensive software CitySim. Citysim was a step forward with respect to previous UBEM tools, and it used a Reduced Order Models (ROM) developed at EPFL in Switzerland. The tool also allowed for the calculations with a simplified Dynamic Simulation Tool and integrations with other tools, like the transportation tool MATSIM[19].
Another tool developed later was Simstadt. SimStadt is an urban workflow engine written in Java and developed by the University of Applied Sciences Stuttgart [20] in 2013. SimStadt can use both simplified geometry (extrusion of footprint) and, when available, it can use City Geography Markup Language (CityGML) format for detailed geometry (Level of Detail (LoD) 2) while considering the roof shapes. A study done by [21] modeled about 1000 buildings in Rotterdam, Netherlands, using the geometry format of CityGML. SimStadt benefits from the direct integration of , which contains thermophysical building attributes in a machine-readable format as an extension of CityGML [22]. Like other UBEM tools, SimStadt requires several preprocessing steps of input data to be suitable for energy analysis and has monthly output resolution. Finally, it does not account for transportation and mobility calculations and their connection with the UBEM. However, it provides life-cycle analysis using embodied carbon for building construction in a seamless tool [23].
At the same time, the Urban Modeling Interface (UMI) was developed at MIT in 2013, using EnergyPlus as the energy simulation engine. The input geometry used in the UMI is provided by Rhinoceros software.[24]
CityBES was also developed running EnergyPlus as the simulation engine, but in this case, using the City Geography Markup Language (CityGML) format for 3D urban building modeling in LoD1 and LoD2 (considering the roof shapes). It can also be linked to EnergyADE for using the thermophysical building attributes.[25].
Two other UBEM tools that use Resistance Capacitance (RC) models as a base engine are OpenIDEAS (an open-source platform) and CEA [26]. The former uses an interesting approach to structure the entering data sources and the workflows to allow good input preprocessing, output postprocessing, and workflows to happen outside the main structure of the tool. CEA is one tool that integrates more aspects, including several input sources, incorporating cost-benefit analysis, transportation use cases, and greenhouse gas emissions. Shadow analysis is also incorporated.
Urban Renewable Building and Neighborhood Optimization (URBANOPT) is one of the latest tools developed by the National Renewable Energy Laboratory (NREL). This tool uses EnergyPlus and is open-source [27,28]. It also contains lighting simulation but does not include transportation/mobility, life cycle, or cost-benefit analysis.
The Tool for Energy Analysis and Simulation for Efficient Retrofit (TEASER), developed at Aachen University (RWTH), is based on RC models, and it looks at several carbon emission accounting strategies[27] .
In the last years, new developments have been made. An example of one of the tools that incorporates a similar approach to the one that the authors have undertaken in the last years is AutoBPS, A tool for urban building energy modeling to support energy efficiency improvement at city-scale [29]. Two other interesting recent developments in this field are CityBEM [30], based on own developed heat transfer equation methods and UECC [29], based on reduced order models (R.O.M). In parallel, an interesting approach to infer occupancy for UBEMs using mobility-related data has been undertaken by the tool Dest-urban (Development of a Platform of Urban Building Energy Modeling Based on DeST) [25]. A chronology to the tools is shown in Figure 1.
2.2. Gaps to Be Overcome
The different UBEMs described in the previous sections have established the seed for deploying relevant future urban system energy tools.
However, several research questions arise from the literature review and the tables mentioned. The capacity of these tools to answer real cost-benefit questions from the building decarbonization sector is often under doubt for several reasons. When dealing with such complex problems, the usual question is whether the UBEMs are designed with a goal in mind and whether they will be useful for more than this goal.
The capacity, therefore, for the aforementioned UBEMs for adaptability and modularity is small. Although they try to be multi-faceted tools, the design of a tool, if not considered modular from the beginning, tends to be adapted to the use case for which it was first developed. Each UBEM was developed with a back-end calculation methodology in mind, which is applicable in the field for which this methodology is useful.
Another important aspect is the lack of scalability to a large number of buildings and different locations. For example, most of the aforementioned tools have been applied to one or a few (under 5) use cases and, in most cases, linked to a small set of buildings. The use, in some cases, of simplified Reduced Order Models (Suntool, CitySIM, OpenIDEAS, CEA, TEASER), the quality of the results for the use of very simplified models makes it difficult to extend to . Conversely, using detailed dynamic simulation tools (UMI, CityBES, UrbanOPT) makes it hard to develop large-scale scenarios.
These tools lack of capacity to deal with several types of input datasets (as seen in Table 2) make it necessary to clean and adapt the input data sources every time. This is a highly cumbersome process that sometimes takes months and limits the scaling up of the methodology. The typically incoherent input datasets from cities also make it necessary to compare several sources of information and choose the cleanest, which, in the cases of most current UBEMs, is a process that has to happen before using the tools.
The fourth is the lack of data input automation. Many authors [15,16,31,32,33] have delved deeply into the relevance of data input automation, which reduces the chance of input errors and also human costs as the data processing is, in most cases, one of the highest time consumers [34]. Lack of open source developments is also an issue, at least in some aspects of the different UBEM. UBEMs deal with very different sectors of GHG emitters (buildings, transportation, water), and the will to break the silos and integrate attractive models from academia in all those fields should be the goal. The development of UBEMs using proprietary software can partially block researchers from accessing these tools.
2.3. Reasons for the Development of a New Model
The research question that arises from the literature review and the gap detection is whether the current UBEM tools are designed to address the challenges required by different use cases. Is the structure behind the development of each UBEM conditioned by the use case for which each UBEMs was developed? After reviewing the previous chapter, I found a clear link between the use case and the structure of the tools.
The current tools have developed ad-hoc solutions to enter city-based data, populate them with structured information about building archetypes, and directly produce the necessary building simulation input. Some of them have done so using open-source structures, but some others have focused on their engines and developments. Moreover, very few are working in different sectors (such as buildings and transportation), and even fewer (only UMI) are linking the results of those different sectors.
The main problems lay, therefore, in the flexibility of these tools to capture different types of data sources and to use different simulation tools. Using different simulation tools is crucial for working with different sectors and working at different levels of detail in each sector. The new developed model is, thus, based on creating a central data model with a clear definition of all the processes in cities that could be used for decarbonization. This central data model would be where different sources of information would be stored and structured, and the structure could produce the necessary input files for different typologies of software, depending on the use case. It would also be the framework that could allow different processes to store information and chain different software, using the output of one process as an input for the following.
Therefore, the answer to all those gaps is creating an open-source, flexible, and structured framework that allows multiple input files of city characteristics and tools to be used and integrated.
This framework should allow for the development of different use cases, all related to improving the sustainability of cities. The non-adherence to any concrete software, but the decision to create a framework to integrate them all is essential for this purpose. Some tools will be preferable to others when analyzing several use cases, and the platform will deal with them.
So, the research question comes to understanding the essential structure of an Urban Energy Modeling tool with limited data that can help foster retrofitting the building stock in cities.
As an answer to this question, the framework described in the present paper, the TOOLS4Cities hub, has been developed in the last three years, and the application of this framework to the concrete case of an Urban Scale Retrofit Tool.
3. Materials and Methods
The previously defined TOOLS4Cities UBEM framework is the basis for developing a tool to analyze the potential of deploying large-scale retrofitting strategies in cities. The current paper will explain the structure of the retrofit tool and some aspects of the software architecture. The goal is to show the framework’s basic structure and prove its modularity and scalability with a use case. The details of the implemented software structure are out of the scope of this paper, and interested readers can refer to Appendix A to familiarize themselves with details of the software architecture. The developed code is open source and available for cloning in the git [38].
3.1. General Overview
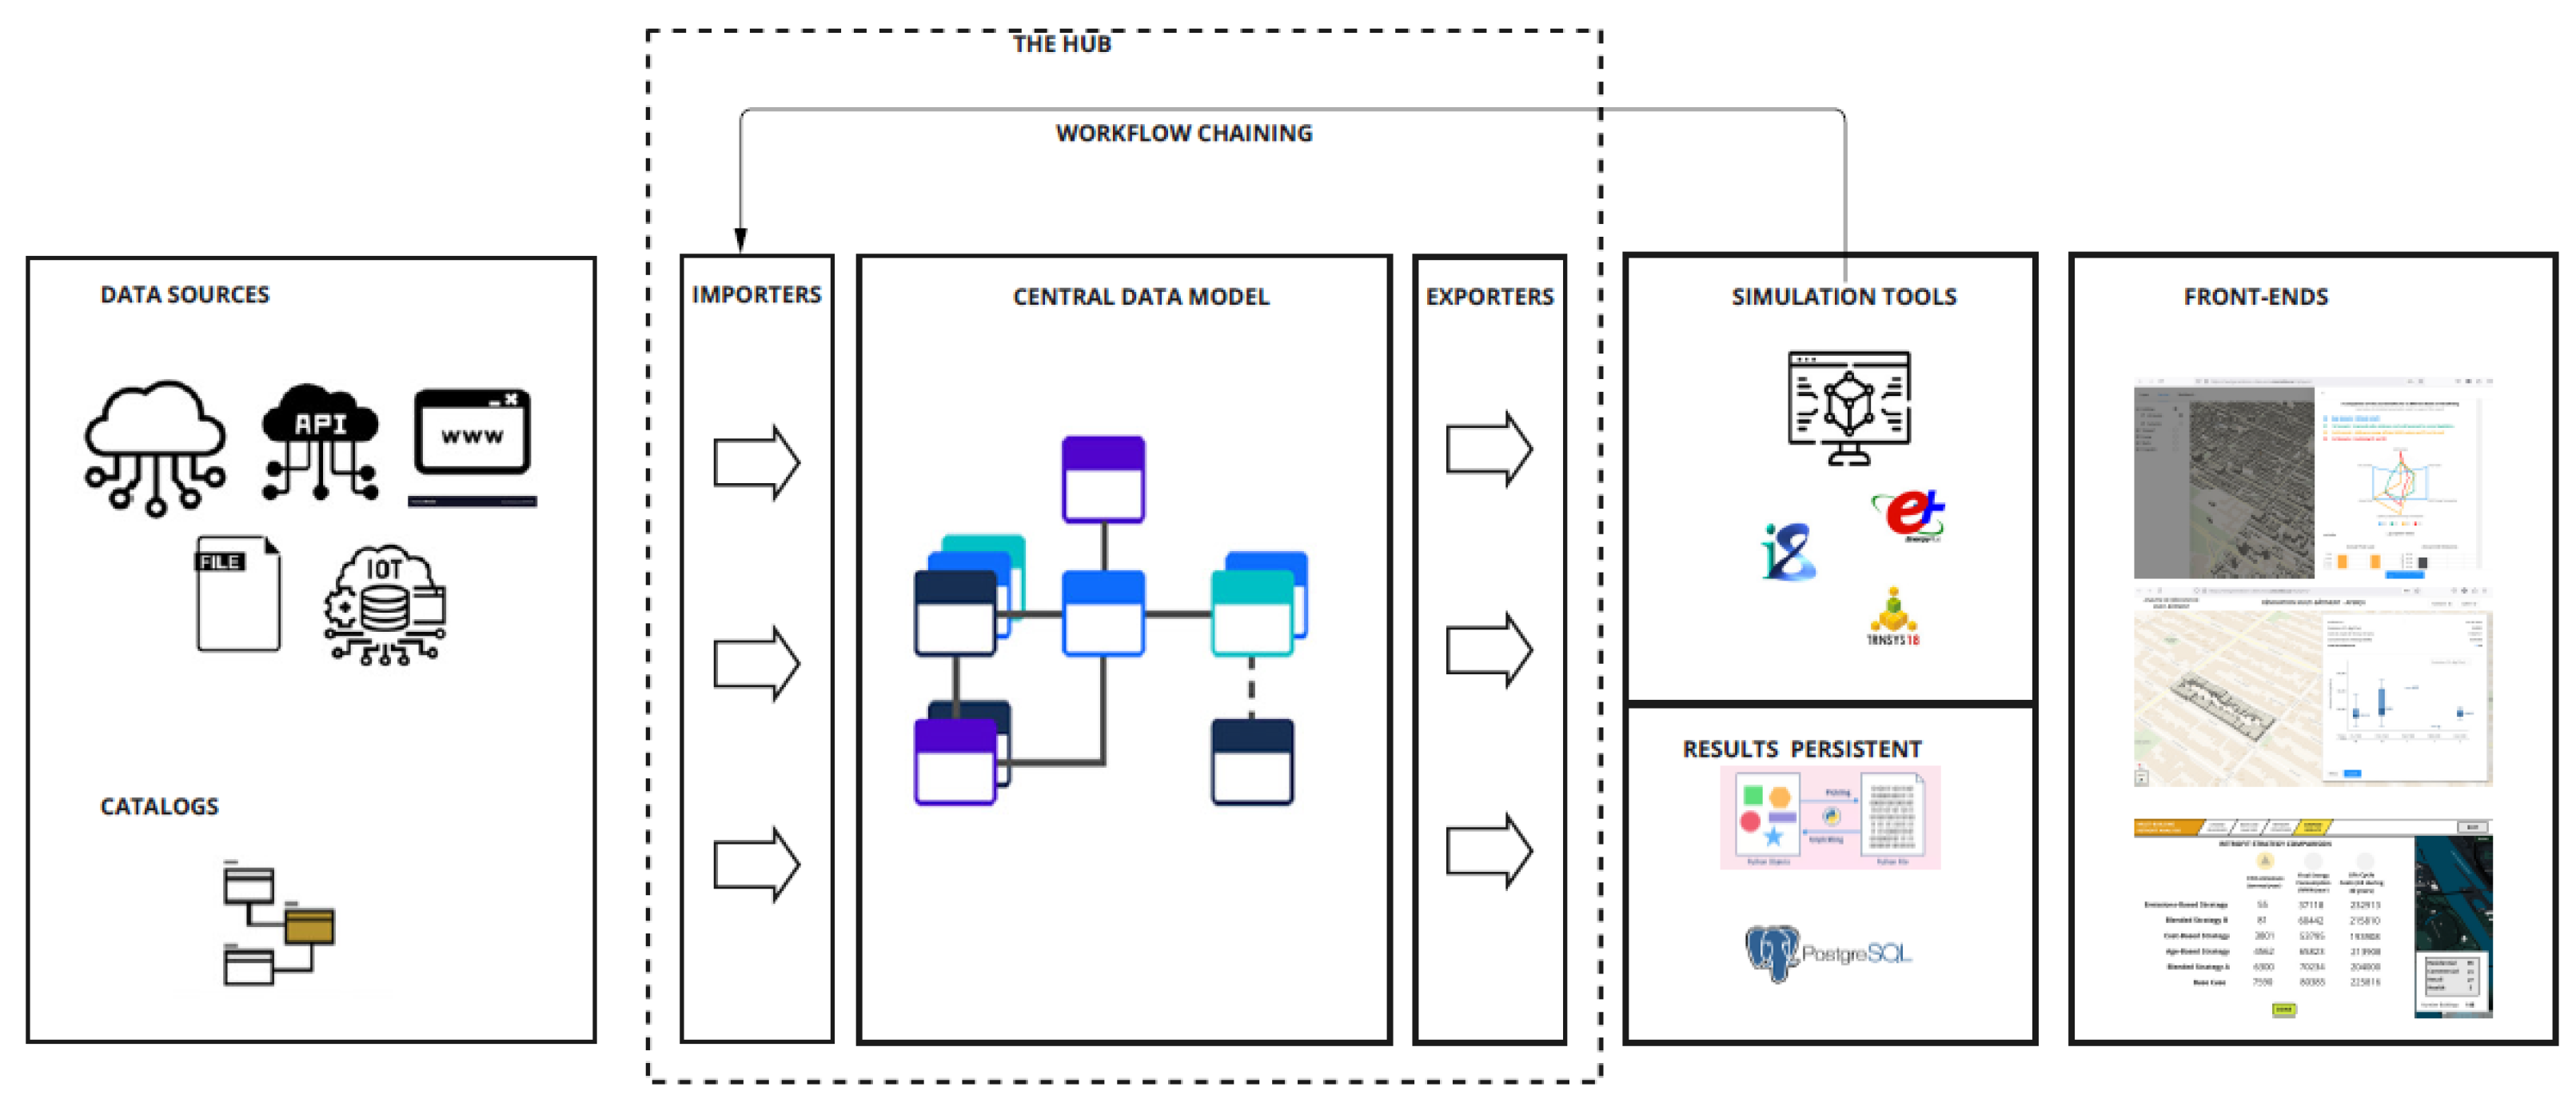
The general overview of the retrofitting workflow is shown in Figure 2. The workflow is part of the TOOLS4Cities urban simulation platform, developed at the Next Generation Cities Institute of Concordia University, aiming to simulate urban areas holistically. The main part of this simulation platform is a set of pipelines, data models, datasets, and catalogs called the TOOLS4Cities Hub. The building retrofit tool comprises building modeling, energy system modeling, scenario selection, techno-economic assessment of scenarios, and visualization modules using different parts of the TOOLS4Cities Hub. These modules will be explained in detail in the following sections.
The retrofit workflow’s essential objective is to analyze the energetic, environmental, and economic impact of retrofitting any building in a city. The idea is to pick any building in a city and get the investment costs, operational costs, and environmental emissions of leaving the building as-is or implementing some pre-defined retrofitting strategies. In the first approximation (or Minimum Value Product (MVP)) to the retrofit workflow, three basic retrofitting strategies were implemented (skin retrofit, energy systems retrofit, and deep retrofit) for all the buildings of the city. However, the tool’s structure would allow for more detailed large-scale retrofitting strategies and heuristics to apply different strategies depending on the different typologies of buildings. As an example, probably the oldest buildings might require a complete skin retrofit, but maybe the newest will only require changing windows or retrofitting the energy systems.
3.2. Building Energy Modeling Workflow
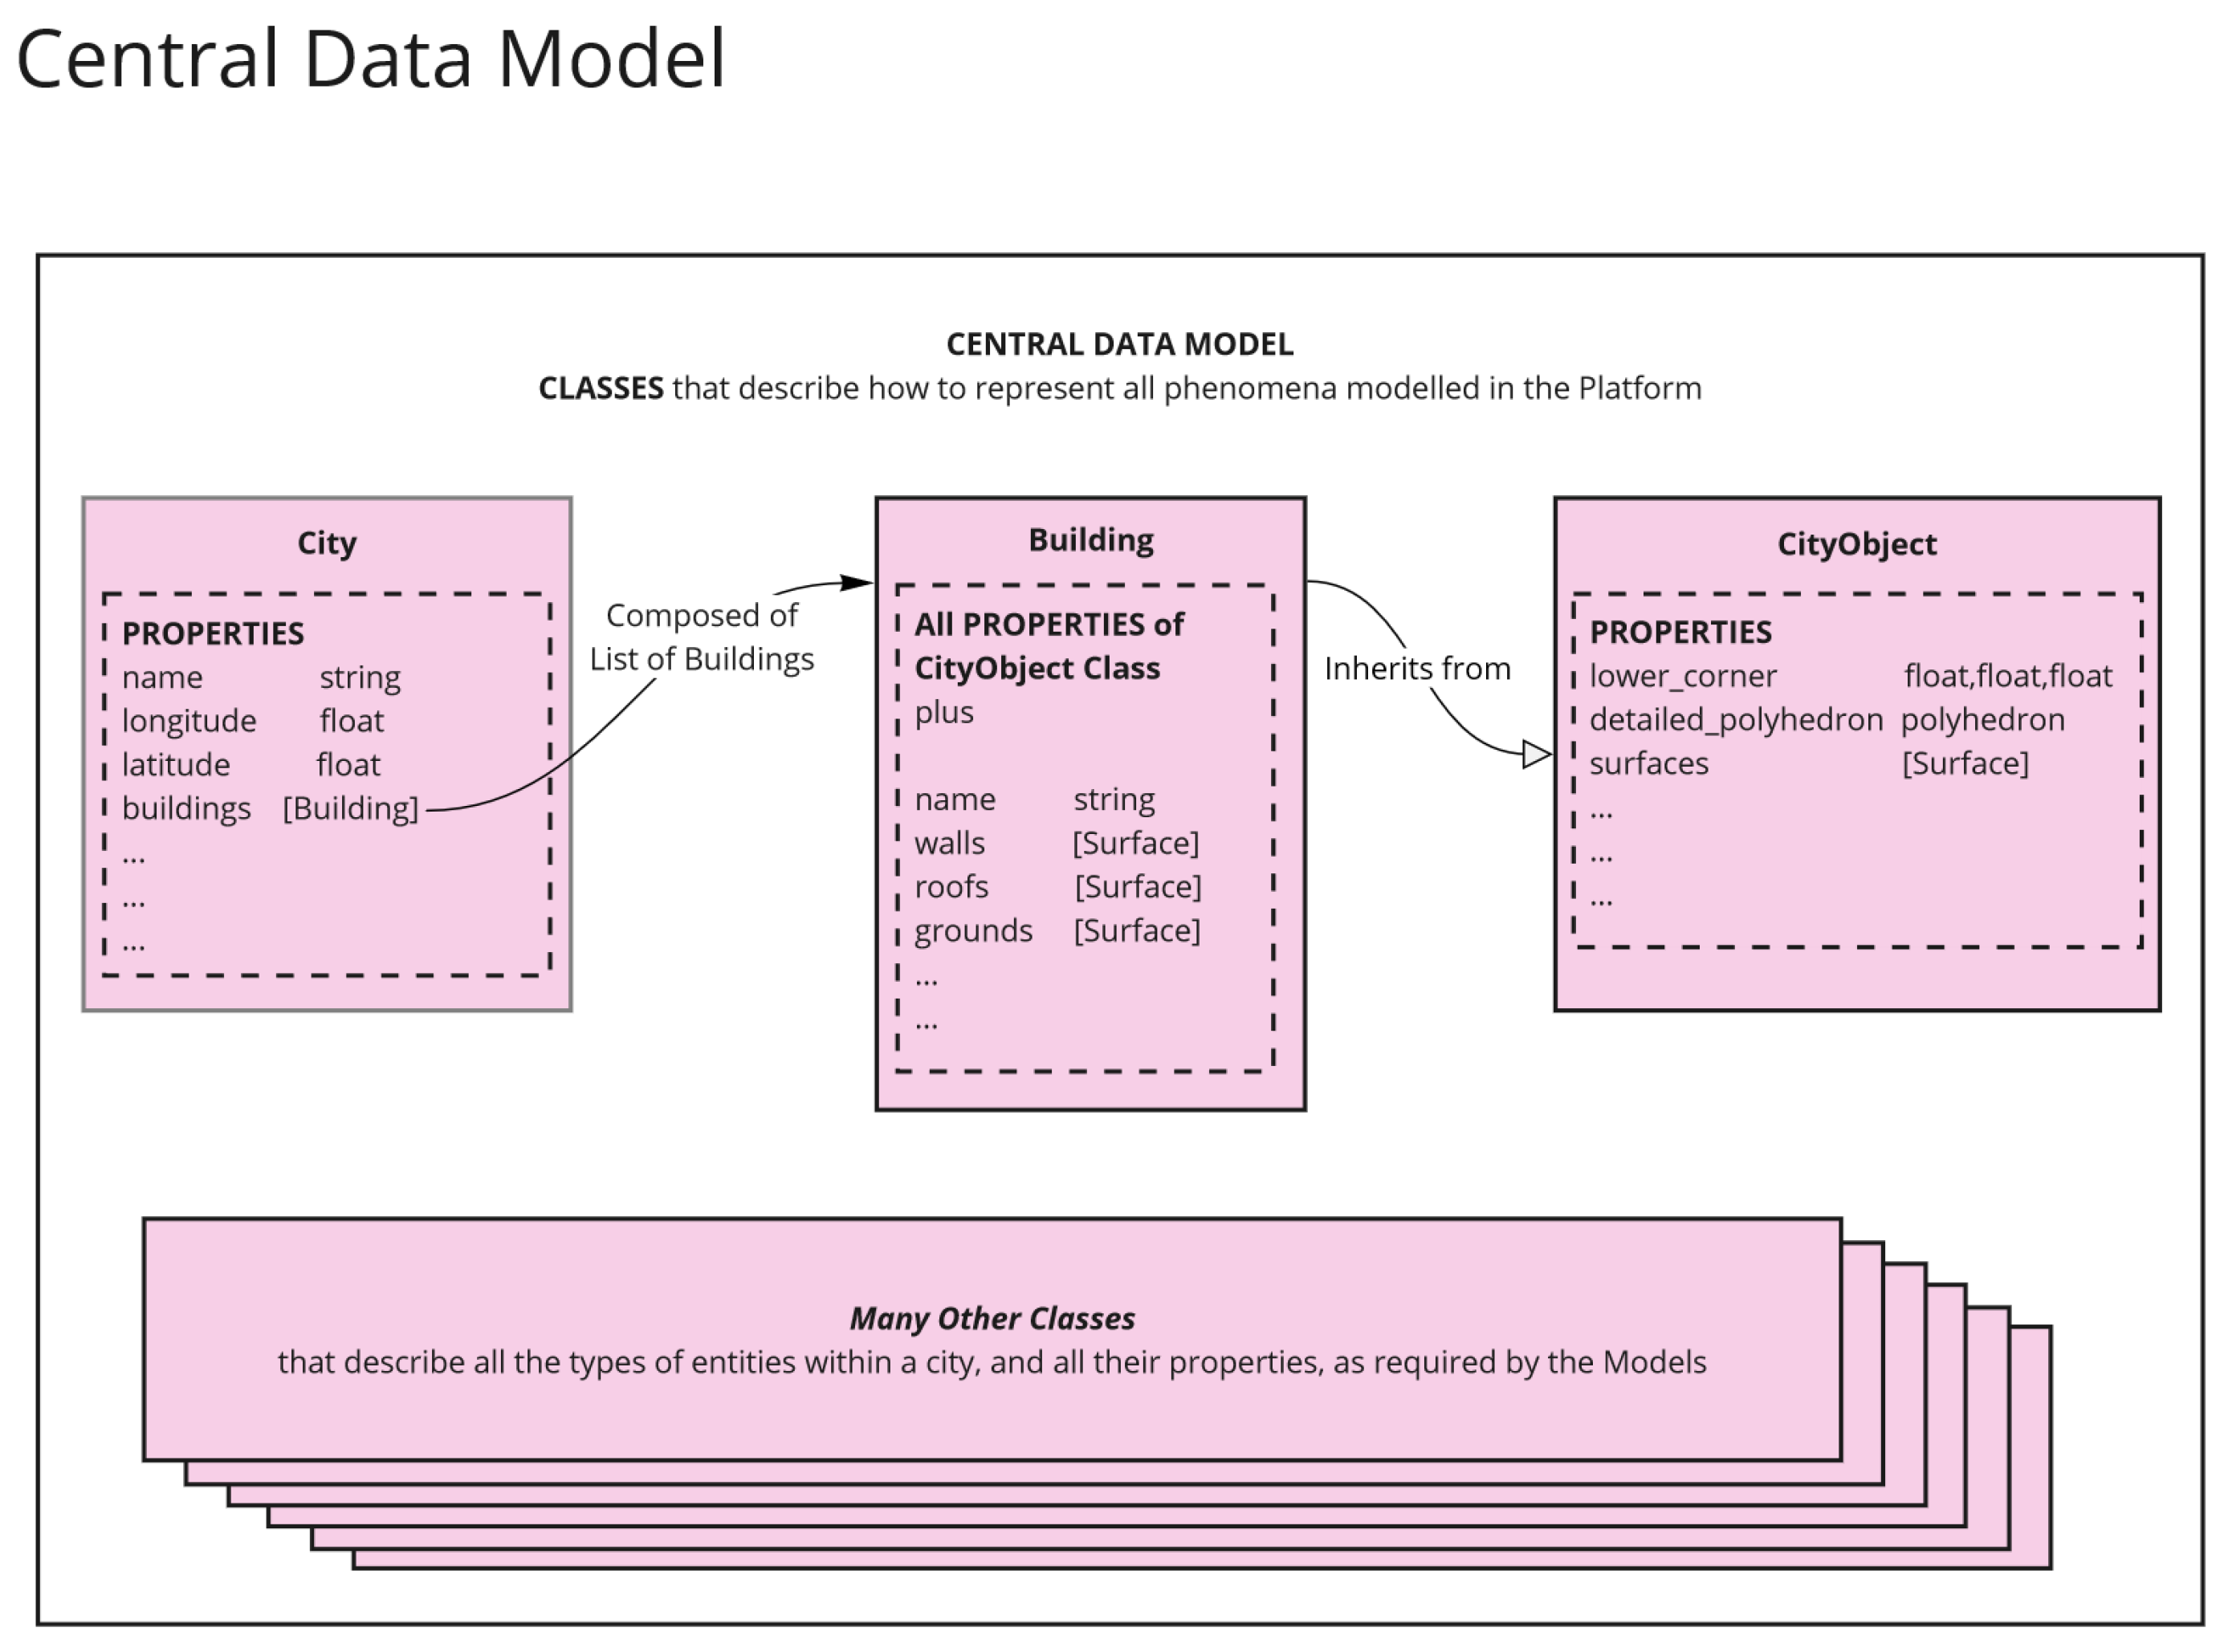
For good scalability, a comprehensive software structure has to be developed to allow for the evolution of the datasets and the adaptation to different tools while maintaining a robust ontology. As shown in Figure 2, the UBEM structure of the TOOLS4Cities consists of importers, exporters, and a representation of the ’City’ with as many objects, like buildings, green spaces, roads, etc., that come from the input file the user provides. The creation of this city replica is made possible through object-oriented programming where a ’City’ class includes different attributes, some of which are objects from other classes that represent different city objects. Therefore, from this point onward, in this paper, when ’City’ is referred to, it is an object from the ’City’ class in the tool’s backend, which can have 0 to many buildings and other real objects in any urban area.
The objective in developing the UBEM workflow was to provide a platform where the input file for running different simulation tools like EnergyPlus or INSEL could be exported, and these tools could be run externally. The handling of the needed data is made possible through different data models and catalogs [39]. A data model is a formalized framework that defines how data is structured and represented within a system. It is distinct from the data itself and does not dictate where it is physically stored. Instead, it serves as an abstract blueprint that helps us understand the relationships and interactions among all the data components within the system.
At the core of the platform are the Data Models. Addressing the gaps mentioned above in existing UBEM models highlights the critical need for a well-organized data structure. Such a structure is essential to facilitate clear and effective interactions among various sectors involved in urban decarbonization use cases. Furthermore, it will enable UBEM tools to function as versatile, multi-purpose instruments, allowing for adaptability and customization of the final tool to meet evolving requirements. The following sections explain what data are needed and how they are used in UBEM workflow.
3.2.1. Building Geometry
The first step in modelling buildings is creating a 3D city model. In the TOOLS4Cities Hub, the 3D model could be generated from different formats, including GeoJSON and CityGML. In the case of buildings, the input file must have information about the year of construction, building function, and height. First, an instance from the ’City’ class is created in this process. Then, it is populated with the city object information from the input file using a specifically designed importer to enrich the city with data from the geometry file.
Once the extruded model of the city objects is created, the internal zones of buildings are defined. Currently, each building has a single internal zone, but different modes of multi-zoning are being developed.
3.2.2. Construction
After creating the ’City,’ the buildings need to be enriched with physics or construction data to create the thermal zones inside the building. The whole process of urban modelling in the TOOLS4Cities is archetype-based, meaning that the buildings are enriched with construction data purely based on their construction archetype. Therefore, before starting the UBEM process, the sets of archetypes need to be created. The standards followed by the Next-Generation Institute in distinguishing archetypes are based on their function, period of construction, and climate zone. Therefore, this standard must be followed in new case studies where their archetypes still need to be created in the TOOLS4Cities Hub.
3.2.3. Usage
The usage archetypes contain data on a building’s internal gains and profiles. These archetypes are assigned to a building solely based on the building’s function. The profiles refer to the heating and cooling setpoint schedules, HVAC availability, occupancy, lighting, appliance usage, and domestic hot water consumption. For each category, 3 sets of schedules are defined and used for weekdays, Saturdays, and Sundays/holidays. The schedules contain hourly fractions of the density values for the mentioned categories.
3.2.4. Weather
The climatic data is an essential part of building modeling. The hourly outdoor temperature, direct normal irradiance, diffuse irradiance, etc., values are read from a weather file that could come from any source. If the user provides no weather file, that location’s ’.epw’ file will be downloaded automatically and used for simulations.
3.2.5. Modeling Tools
Once the ’City’ buildings are enriched with the required data for modeling, a factory of different exporters could export the input file for different simulation tools. The exporters capture the necessary data from the central data model, which describes the city’s parameters, and convert them into input data files for different software. At the moment, version 2.0 of the framework is exporting data models to the following simulation tools:
- Simplified Radiosity Algorithm (SRA), a tool designed to calculate the plane of array irradiance on all surfaces, allows for a detailed radiation calculation to deploy solar photovoltaic analysis.
- INSEL [40], a tool which is capable of calculating the monthly and yearly energy demands for the buildings of the city using a static and dynamic methodology
- EnergyPlus, one of the best known and extended tools to calculate energy demand and consumption of buildings
- TRNSYS, another one of the reference tools for building and energy system simulation.
The process includes running methodologies, which run the different tools and then store the results back in the central data model, as the results paragraph will define. Although some of the tools have the same objectives (TRNSYS, Insel dynamic and EnergyPlus), the inclusion of the different exporters has been made to facilitate the integration of different research teams to the methodology, as well as to compare the capacities of each software, and be able to pick each of them depending on the use case. As an example, the capacity of TRNSYS or INSEL to integrate external sources of radiation seems interesting as an option to integrate the SRA methodology into a simulation engine. EnergyPlus, on the other hand, has an internal radiation methodology.
EnergyPlus Workflow
Given that the retrofit costing methodology only involves using Energyplus, we have explained in more detail the methodology used for Energyplus. One of the aforementioned gaps is the scalability to a large number of buildings, and one of the main reasons is the long computing times that running white box models take. One of the software developments to speed up the process has been the Energyplus workflow. The EnergyPlus workflow exports the central data model with all the details of the buildings into an IDF file. Buildings are modeled as one-zone models in the current version. To speed up the process, buildings are created in the idf as zones of the building, but incorporating the shadings and adjacencies between the different zones. The eppy library was initially used to create idf files, but the software characteristics of the library (repeating the different schedules per zone and having to access extended dictionaries) caused that when simulating more than 500 buildings, the idf creation was significantly slowing down the process. Therefore, a new library has been developed to reduce the exporting time. It will have to be updated for different versions of Energyplus, but it allows for large-size IDF exporting, which is essential for Urban Simulations. Although the main reason for the use of more simplified models is the time used in the simulation of white box models, the current improved process can simulate up to 3000 buildings in less than 2 hours using a 1x Intel® Xeon® E-2400 processor, up to 8 cores at 95W.
SRA
The simplified radiosity algorithm used by the tool uses the methodology developed by [17], that applies radiosity to predict external irradiance (shortwave and longwave) and internal illuminance in an accurate and very efficient way, in a single computational module. Although for the Energyplus simulation, the internal radiation calculation engine is used, the SRA is used to calculate the radiation on surfaces to implement solar PV calculations. The SRA importer makes use of the geometry imported and the physical characteristics of the materials at the external layers of the walls, together with the weather data, to calculate the short wave radiation exchange between external walls and roofs
3.2.6. Results
After running the simulations, the Results importer is used to enrich the buildings with the results of the simulations. This step helps us to use the ’City’ structure as it is for further analysis, but this time, buildings have energy demands.
3.3. Energy System Modeling
For each location, research is done to identify the dominating energy systems used to supply HVAC and DHW demands. These systems comprise energy generation, distribution, storage, and heat emission components. All these systems together form an energy system archetype or template. This explained structure is the basis of the energy system data model in the TOOLS4Cities Hub.
The created data model (Figure 3) functions as a thorough and well-structured framework intended to record and handle the intricacies of energy system setups methodically. The "EnergySystemCatalogue," a conceptual entity that functions as a flexible library with multiple subclasses, is at the centre of it. These subclasses, divided into areas including distribution, generation, storage, and emissions, are essential for providing specifics about particular components. The versatility of the model is demonstrated by its capacity to represent components in two different ways: real-world components available on the market or template structures with predefined attributes and no assigned size. This two-pronged strategy produces a flexible framework that can handle various situations.
Once the energy demands are calculated, the energy system template is assigned to the building based on its function and vintage. The associated data of the template components, like the efficiency of generation components, will be retrieved from different ’.xml’ files that contain energy system data. An importer enriches buildings with data that can be easily used to calculate energy consumption in any area.
3.4. Retrofitting Scenarios
Although set of three retrofit scenarios for the first retrofit workflow have been established as a first test case to validate the full methodology. These scenarios are the following:
- Scenario 0, Business as usual: current status of the building, with its skin, but replacing the energy systems once its lifetime is finished (with the same performance as the original).
- Scenario 1, Skin retrofit: the building’s envelope has been updated to current legislation.
- Scenario 2, HVAC systems optimization + PV: an update on HVAC systems to best available technologies is done, coupled with using the available roof space for Solar Photovoltaics, in case the shaded area is less than 30% of the total area.
- Scenario 3, Deep retrofit: a scenario including both previous scenarios
3.5. Costing Workflow
In the case of the Life Cycle Costing (LCC) process, we have dealt with them in a separate Classes structure. The different nature of economic hypotheses, which are much more volatile than energy calculations, has pushed the team to develop a parallel structure coupled with the hub structure. This parallel structure will allow for further analysis, from the perspectives of economic scientists, like implementing dynamic cash flow modeling with sensitivity and risk analysis, a topic that has been detected as essential [41], or monetizing the externalities. The methodological approach for the economic analysis of the retrofit scenarios comprises the general LCC framework approach and the evaluation of externalities included in the general cost modeling methodology. LCC analysis, also known as total cost accounting, compares full costs during their useful life while defining alternative investment options in buildings or operating activities. For example, a baseline case can be compared with a potentially attractive one using the LCC of a retrofit scenario. LCC can showcase the different cost allocations of both scenarios, given that one of them already exists and does not imply extra investment costs. The new proposed scenario implies an extra investment but, on the other hand, minimizes yearly costs and, potentially, other externalities. LCC analysis design and practice is standardized in ISO 15686-5 [42], establishing the necessary criteria for analyzing Life Cycle Costing in the built environment. The global formulation is shown in equation (1)
where
- = initial investment (product acquisition + installation and commissioning);
- = investment cost for the reposition of the equipment after the end of life of the equipment;
- = refers to the variable costs of operation;
- = refers to the variable costs of maintenance;
- = refers to the variable incomes of operation, i.e. solar PV feed-in tariff;
- = refers to the variable costs of externalities, like CO2 or other emissions;
- = consumer price index increase. series of yearly values
- = energy price index increase, which depends on the fuel type. series of yearly values
- = externalities price index increase, which depends on the future externalities market, such as CO2 markets
- d = discount rate for the retrofitting
CAPEX calculation In our tool, we are using a data catalog structure to calculate the CAPEX costs. In the case of CAPEX, UNIFORMATII has been chosen as the format to classify building elements and related site work [43]. The level of detail used in the first validation of the tool is significantly low, as the solutions are looked at from a global perspective. Within this LoD1, and for the sake of the first tests, only additional costs of the retrofitting have been considered, with average values per surface of the different elements, not distinguishing different solutions. The first structure of the data catalog for CAPEX costs is shown in Table 5.
3.6. Visualization of Outputs
A significant effort has been made in the presentation and accessibility to the results for the general public. As mentioned in Section 2.2, this is one of the big gaps we detected in other tools.
A web page showing all the buildings in the city is used to facilitate access to the city-simulated data and let the user interact with the data. The results are shown using two different services in the Citylayers test web page (https://nextgenerations-cities.encs.concordia.ca/citylayers/).
4. Results and Discussion
4.1. Case Study: Montreal
The first proof of concept for developing a retrofit calculation for an entire city was implemented on the island of Montréal. Over time, various geospatial, construction, usage, and system data were collected for Montreal to enable the tool development team to create different archetypes. To validate the process, a focus has been put to analyse two residential areas and a set of institutional buildings and compare the results of the tool with statistical and real operational data.
4.2. Selected Areas
To validate the surface and consumption for single-family houses, duplexes, and triplex, we focused on two big residential low-height areas in Montréal. The choice of the two sectors was to find homogeneous areas that could be compared with a concrete typology of building, for which we could have statistical data. Although in the two chosen neighbourhoods there were some taller buildings and some commercial buildings, more than 95% of the built surface in both is occupied by single-family, duplex and triplex buildings. The first is in Pointe-Saint-Charles neighbourhood (between Wellington, Ash, Leber and Congrégation streets), with a total of 313 buildings, most of which were built before 1946. The second subset of buildings are located in Saint Leonard neighbourhood(between Langelier boulevard, Robert boulevard, de Guyenne street and Louis Sicard street), with a subset of 249 buildings from the 1960s-1990s. Figure 4 shows the zones that have been simulated. This gave rise to a total of 563 buildings.
Following the results of the first simulations, we analyzed in detail the origin of the differences between simulated and actual consumption. The sources of error were analyzed from two points of view: (i) input data and (ii) simulation assumptions. In the first stage, the analysis focused on discrepancies in area calculated by our tool, based on the city’s various geospatial data sources (CityGML, geojson, and land valuation data) and consumption per square meter.
The validation was done in two steps: the first was the consumption data analysis for specific typologies of buildings for which we had available metadata. We analyzed the data about two typologies of buildings: single-family homes/duplexes and public buildings.
The first level of validation checks whether the yearly results from the two use cases match real yearly consumption data. The sources of this data used as a comparison set are different.
For the single-family homes/plexes, the values to which the urban simulation has been compared has been a set of 19.111 buildings from the Energuide dataset [44], filtered only for Montréal and for single-family/duplex/triplex houses. This dataset gives yearly final energy consumption data for all the houses, and metadata for the year of construction of the buildings and the typology of buildings is described in the metadata.
For tertiary sector buildings, we analyzed the list of 186 municipal buildings published by the City of Montreal, with metadata and their energy consumption [45]. For the process of validation, we focused only on a subset of 15 buildings.
4.2.1. Geometry Data
The geospatial data cleaning process has been extremely time-consuming, especially because of the deficient quality of the input datasets and the necessary data cleaning. The dataset was created by combining several open-source datasets provided by NRCan and the Montreal city government (Montreal property assessment units [46], Montreal 3D buildings (LoD2 model with textures), LiDAR aerial dataset of Montreal [47], Building Footprints NRCAN [48] and Layer 2 cadastral data for disaggregated building use type [49].
However, even if the initial datasets were quite complete, the differences in quality and completeness have forced us to follow specific necessary steps, like (i) splitting the satellite-derived footprints based on information from the city’s cadastral parcel data, (ii) correcting building heights using LiDAR data, improving the accuracy of the analysis and, especially, (iii) incorporating an algorithm to detect and clean the overlap between the buildings. The final integrated result was a geojson database, with corrected building heights and an essential number of characteristics of each building (vintage, function, out of a list of more than 250 functions, number of households, number of stories). This geojson database was finally refined with a methodology to recognize neighbouring walls in 2D and 3D. This process has been used to generate a unique geojson file that contains all the necessary elements for the building simulated. The data has been validated by comparing the number of households by postal code from the census of Canada and the number of households resulting from the footprints and the heights. The difference in all the neighborhoods, except from Nun’s Island, is less than 5% of the total number of households. The quality of this set of data from the city is poor. The geometry factory from the TOOLS4Cities has used the footprint and height data to generate 3D surfaces for all the buildings. Depending on the function and vintage of the building, a window-to-wall ratio has been assigned to each of the buildings; the same process has been applied to the division of buildings into stories to understand the total surface of the buildings. An essential aspect of the process is that all the surfaces in contact with other surfaces have been considered neighboring surfaces, and they will be simulated as such for radiation and thermal purposes. One of the important aspects of the geometry factory is assigning a building archetype to each of the functions that the Montréal dataset of functions has. More than 500 building functions are described by the tax evaluation data [50], and they were converted into the set of archetypes developed in the hub. The archetypes used are based on the 17 archetypes developed by NREL and used by the BTAP tool[51] developed by Natural Resources Canada.
4.2.2. Construction Data
As explained in the general methodology, the tool uses a dictionary of archetypes that, given the vintage of each building, populates the constructive characteristics of each building. The first archetypes developed for Montréal were based on the developments of NRCAN for the BTAP tool, which inherits a significant amount of work done by NREL. Those archetypes, however, have a limited amount of vintage buckets regarding constructive solutions. For example, all the buildings before 1980 (which, in Montréal, account for more than 65 percent of the overall surface) are considered to have the same construction type. For that, several sources have been consulted, and, based on an initial effort using BTAP data sets [51] as a basis, we developed new constructive types based on references from academic studies [52,53] and analysis from consultancies [54]. The result has been a compilation of different constructive types depending on if the building is residential or non-residential and on the vintage of the building. The detailed constructive types used for the Montréal use case (and developed, as well, for other climates) can be found in Table A1 and Table A2, in Appendix B.
4.2.3. Usage Data
For Montreal, the National Energy Code for Buildings of Canada dataset, which uses fixed profiles for each building, is used as the basis to populate the usage data for all types of buildings and spaces, based on the previously defined archetypes per building. We have two steps, one for the gains and another for the profiles. Those separate steps currently use a direct link to the repository of [51], where the NRCAN team has been updating the base data sources for the tool BTAP. As detailed in section , using public online data is a decision from the authors to reduce the maintenance costs of the Tools4Cities hub and allow for continuous updating.
Moreover, the factory structure already allows the integration of external stochastic generation profiles derived from [39], although it was decided not to use it for the retrofit use case.
4.2.4. Energy System Data
For the latter, the yearly balance in each sector was used to divide the buildings by gas and electricity consumption. Regarding the systems typologies, the NECB equivalence[55] from table Table 8.4.4.7.-A was used. These typologies show that a concrete HVAC system typology is suggested for every type of building. The systems, from System 1 to System 6 are shown in Table 6.
The main challenge in using the table above is that the energy source is not mentioned. Therefore, another data source was used to find the primary energy sources used in building consumption in Quebec. Figure 5 and Figure 6 show the share of different fuels in the heating system from the Survey of Household Energy Use (SHEU) conducted by Statistics Canada [56] and from the [57] for commercial.
4.3. Geospatial and Energy Consumption Validation for Montreal
4.3.1. Single Family Houses/Duplex/Triplex
The results concerning the building area inferred from the geospatial inputs show higher values than the actual values obtained through property valuation data. The fact that the methodology captures the 3d exterior volume incorporates errors such as overestimating the surface area of second floors or incorporating partially covered outer volumes into the analysis. Figure 7 shows that the average floor area calculated with the models is 60% higher than the values extracted from the property data. The lack of good data is at the root of this error. Some novel methodologies are being applied to detect cleaner methodologies via AI and ML and will be incorporated into future platform developments [58].
Given the fact that the methodology developed by the CERC uses real geometry, including shadings and adjacencies, and scaling down these geometries without losing the geometrical links, the CERC team has decided to incorporate a downsizing factor based on the value of the real surface from tax evaluation data and apply the factor between the surface tax data and the simulated surface data to the final energy results. Regarding energy consumption, as described in the methodology, the simulation data has been compared to a set of data coming from Energuide audits. More than 19.111 values were filtered for the typology of simulated buildings located in Montréal. The values for the Energuide cases are compared by vintage groups with the simulated cases in Figure 8. Although some vintages have relatively limited data, the values obtained with the simulation are very aligned in most cases. Only the vintage between 1978 and 1983 shows significantly different values, but the limited number of buildings simulated for this vintage (4) makes it less significant.
4.3.2. Institutional Buildings
For tertiary sector buildings, we analyzed the list of buildings published by the City of Montreal and their energy consumption. We evaluated 15 of these buildings regarding surface area and consumption in Figure 9. In terms of surface area, the results are uneven. In 5 cases, the differences are more than 30% of the surface. Overall, using the 3d models extracted from the city’s data gives us 30% more surface area than the data published by the City. The reason behind this seems the same as in the residential building case and is linked to a low Level Of Detail in the current 3d data sources (currently between LoD1 and LoD2); this can be improved if the city agents develop better and more coherent geospatial models.
Concerning energy consumption (final energy), we compare the results with the municipality’s list. We note that the difference is significant (more than 20% of the base case consumption) in 3 cases, but we align with the magnitude of specific energy consumption. When we don’t match the results, the difference may be attributed to indoor environmental quality issues or other discrepancies from the assumed operating conditions. The impact of using different weather data files has been analyzed (HQ data for the MacTavish weather station in Montreal compared with the Energyplus file used in the simulations [59]), and the difference between using one or the other is less than 5%. The results from the validation for individual buildings show that the tool can also be used to find inconsistencies between different datasets. The fact of having a tool that can help fill the gaps and detect anomalies in consumptions and geometrical data seems an exciting capability, complementary to the tasks that are being done using Machine Learning (ML) techniques in other areas of geospatial data treatment [60].
4.3.3. Energy Impact of Retrofitting Scenarios in Single-Family Buildings
Once the methodology was validated, we tested the full workflow, analyzing the impact of the three retrofit scenarios on the pilot cases. For the single-family/duplex areas, the impact of the three retrofitting scenarios was analyzed, and the workflow automatically updates the different parameters and assigns different costs to the scenarios. The results are shown in Figure 10 and Figure 11. Regarding energy consumption, we see that the impact of retrofitting is more critical in small and older buildings, although there is no complete homogeneity. The fact that some buildings have adjacencies and, therefore, the impact of retrofitting affects them less might have an influence. Standalone buildings will benefit more from retrofitting. The results from the tool show that, even if some trends are clear and there is no need for a detailed analysis, the real impact of the measures in different typologies and locations of these buildings has to be analyzed for more focused policy-making.
4.3.4. Energy Impact of Retrofitting Scenarios in Institutional Buildings
In the case of institutional buildings, trends are more complicated to detect, given the small number of buildings and the different uses between them. Nevertheless, within the different building sets, we see that a tool such as ours can be used to prioritize investments in specific typologies of municipal buildings and to see which scenario would be more beneficial depending on the different buildings.
4.4. Economic Results
Once the energy consumption for each building in Montréal has been calculated, the retrofit costs workflow has been implemented with the following economic parameters:
- number of years=40,
- percentage credit=0,
- interest rate=0.04,
- consumer price index=0.04,
- electricity peak index=0.05,
- CO2 price=30 $/ton ,
- CO2 price index=0.06 (increase of CO2 price),
- electricity price index=0.05,
- gas price index=0.05,
- discount rate=0.03[61],
- retrofitting year construction=2020,
The number of years for calculating the Life Cycle Costs has been established in 40 years. The decision was taken because, although the [61] used 30 years, the new proposed EU [62] aims at calculations using 50 years. The midpoint of 40 years was chosen.
We have used the same sets of buildings in the validation phase to evaluate the economic impact of the different measures in the final set of buildings. Although this part of the process is not cross-validated with any actual project, references such as [63] and [64] have helped us see if we were aligned with the real economic costs of retrofitting.
Small Residential Buildings
The two residential neighborhoods have helped us understand the economic impact of retrofitting with the previously established hypotheses. The results for the Life Cycle Costs of both areas are plotted in Figure 12 and Figure 13.
We observe that from a Life Cycle perspective, retrofitting the building brings solutions that, at least, have the same costs as the base case. The impact of the retrofitting is different depending on the vintage of the building.
We observe that skin retrofit is interesting for buildings built before 2000. Energy systems retrofit alone is interesting depending on the vintage; the newer buildings are, generally, more interesting from an energy systems perspective. As a last point, deep retrofits don’t seem economically feasible, even from the Life Cycle perspective.
Tertiary Buildings
In the case of tertiary buildings, Figure 14 shows a scatter plot of the Life Cycle costs of the buildings under different scenarios; given the small size, no boxplot depending on vintage was produced .
In the case of tertiary buildings, the Life Cycle Costs of the base case are lower than any of the retrofitting scenarios. The low electricity prices in large buildings in Montréal (under 0.07 CAD/kWh on average) make it very difficult to implement economically feasible energy efficiency solutions. The results show that the values mentioned above in the literature are coherent with CAPEX and OPEX of similar building types[65].
5. Research Limitations
Despite the efforts done in the development of the tool, there are still some aspects that need to be improved:
- Data quality: The simulation results heavily depend on the quality of the geometry data used to create the ’City.’ Currently, only LOD1 geojson files can be used for running EnergyPlus simulations, which should be improved soon.
- Lack of data: In addition to data quality, the existence of data for all different types of buildings is a big challenge. Also, finding compatible datasets for construction and usage based on the building function is another problem. Moreover, as mentioned in the text, there is not enough data about the existing energy systems in buildings, which affects the base case simulations heavily.
- Multi-zoning: Currently, all buildings are simulated as a single zone. This is one of the tool’s limitations, which could affect the simulation results.
- Occupancy modeling : The utilization of fixed schedules for modeling occupancy is another tool limitation. The stochastic occupancy modelling workflow is currently under development.
- Economic Analysis: Life Cycle Costing (LCC) analysis used generalized economic parameters, which might not be representative for broader applications or for specific local economic conditions.
6. Conclusions and Next Steps
We presented a tool that can fully automatedly simulate large city areas (even in a big city such as Montréal) using a white-box approach and filling the gaps related to low-quality input datasets. The process of validation of the results has been generally satisfactory. However, the next stage of parameter calibration will be initiated in the following months to understand if the discrepancies between simulated data and real/statistical data can be adjusted by changing specific parameters.
This tool uses an open-source modular approach that allows for the integration of the work of other researchers on the topic and the analysis of future building scenarios considering cross-sectoral criteria.
In conclusion, the TOOLS4Cities hub enables rapid analysis of the costs and carbon emissions of every building in a city. Based on archetypes for different building uses, the models allow for comparing different renovation options. In this way, we hope to support and accelerate actions to decarbonize the municipal built environment.
7. Future Steps
The goal for the UBEM that we have developed, based on open-source criteria, modularity, flexibility, and integrability, is that it never stops evolving in the following years.
The development goal is to make the framework available to the full research community and allow for the integration of new workflows. Although any researcher can use the repository from the CERC, clone it, and use it mainly, we encourage using the manuals and the hub methodology to increase the tool’s capabilities.
The scalability of the tool is being proved at the time of the publication of this paper, with new pilot cases being developed in Palma de Mallorca (Spain), Québec City (Québec, Canada), and Toronto (Ontario, Canada).
Author Contributions
Conceptualization, O.G. ; Literature search: P.A.M. and O.G. ; Methodology, O.G., P.A.M. and S.R.; Formal analysis, O.G.; Investigation, O.G., S.R.; Resources, O.G. and C.G.; Data curation, O.G.; Writing—original draft and review, O.G.; Writing—review & editing, S.R., P.A.M. and U.E. All authors have read and agreed to the published version of the manuscript.
Funding
This project has received funding from the Canada Excellence Research Chair in Sustainable Cities and Communities and the McConnell Family funds, through its UniverCity2030 initiative.
Data Availability Statement
All code and data used in this project are available in the web page of the Next Generation Cities Institute. Please contact the authors to have access to the necessary folders and the open-source tools from the NGCI. The gitea with the source code for the TOOLS4Cities hub is in https://ngci.encs.concordia.ca/gitea/CERC/hub.git and the costs library is in https://ngci.encs.concordia.ca/gitea/CERC/costs.git. The CKAN is in https://nextgenerations-cities.encs.concordia.ca/ckan/.
Conflicts of Interest
The authors declare no conflicts of interest.
Abbreviations
The following abbreviations are used in this manuscript:
| AI | Artificial Intelligence. 15 |
| BTAP | Building Technology Assesment Platform. 14, 15 |
| CAPEX | Capital Expenditures. 12 |
| CEA | City Energy Analyst. 3 |
| CERC | Canada Excellence Research Chair for Sustainable Cities and Communities. 15, 16 |
| CityGML | City Geography Markup Language. 2, 3 |
| EnergyADE | Energy Application Domain Extension. 3 |
| GHG | GreenHouse Gases. 1, 6 |
| GIS | Geographic Information System. 6 |
| HVAC | Heating, Ventilation, and Air Conditioning. 2, 11, 15, 25 |
| IoT | Internet of the Things. 25 |
| LCC | Life Cycle Costing. 1, 11 |
| LiDAR | Laser Imaging Detection and Ranging. 14 |
| LoD | Level of Detail. 3, 12, 14 |
| ML | Machine Learning. 15, 18 |
| MVP | Minimum Value Product. 7 |
| NECB | National Energy Code for Buildings Canada. 15 |
| NRCAN | Natural Resources Canada. 14, 15 |
| NREL | National Renewable Energy Laboratory. 3, 14 |
| PV | Solar Photovoltaics. 11 |
| RC | Resistance Capacitance. 3 |
| ROM | Reduced Order Models. 2 |
| SRA | Simplified Radiosity Algorithm. 2 |
| TEASER | Tool for Energy Analysis and Simulation for Efficient Retrofit. 3 |
| UBEM | Urban Building Energy Modelling. 2, 3, 4, 5, 6, 8, 22, 24, 25 |
| UHI | Urban Heat Island. 2 |
| UMI | Urban Modeling Interface. 3 |
| URBANOPT | Urban Renewable Building and Neighborhood Optimization. 3 |
Appendix A. Software Perspective
Delving more into the details of each software component will allow a more detailed understanding of the full architecture of the development used to create the data structure that lies at the core of the UBEM.
Models
A model is specific to a particular domain (e.g., Transport or Waste or Building Physics, etc.) and focuses on representing a single system (or a small number of closely related systems) within that domain. A model is an algorithmic representation of an urban system capable of making predictions of the system’s behavior or properties based on a definable set of inputs.
The TOOLS4Cities Platform architecture is designed to integrate with any model, provided it can run on a computer. This way, the Platform has no theoretical restriction on the scope of urban phenomena it can simulate, and it is also infinitely extendable over time as more models are added. Therefore, the platform uses ‘Model’ solely as defined above and will use the full names of these other models to differentiate them. Those models do not necessarily need to be developed with the same structure as the rest of the code developed by the CERC team, but they can be adapted to match the inputs and outputs required by the platform. However, they must be ‘free-to-use’ to be incorporated seamlessly into the platform. As such, they do not form part of the coding environment of the Platform; instead, they are separate programs that must be accessible to the Platform via their API (Application Programming Interface). The requirements established by the CERC platform, as with any model used by the platform, all third Party Models must support the following:
- Use a definable and program-accessible set of Input Data
- Algorithms or calculations that use the Input Data.
- Product a definable and program-accessible set of Output Data.
Figure A1.
General view of the platform
Central Data Model
A data model is a formalized structure that shows how data is to be represented within a system. Importantly, the data model is separate from the data itself and says nothing about where the data is physically stored. A data model is an abstract structure that allows us to understand the relationships between all pieces of data in the system.
Data Models
At the heart of the platform are the Data Models. Given all the aforementioned gaps in the existing UBEM models, it appears that it is a clear necessity to structure all the data. This data structure will be used to create clear interactions between the different sectors of urban decarbonization use cases and, at the same time, be able to use UBEM tools as multi-faceted tools and adapt the final tool at any moment.
For this reason, the authors developed a clear structure of how a city should be developed in Python classes. Each class (see UML diagram) has clear relationships with others and can propose association, multiplicity, aggregation, composition, inheritance, or realization [66]. The objective is to create a metamodel of the full city, with clear relationships of the essential parameters of each element that compose it and the relationships between its agents.
Developing a generic metamodel of building data (especially energy data) has been an objective in the last years from several initiatives, especially from energy utilities and the HVAC IoT sector. IFC, Brick, Haystack, and Bigg [67,68] are examples of metamodels and ontologies that have tried to structure and organize the metadata from the buildings to be able to understand their behavior and, in most cases, act over it.
The building-level perspective, though, is too detailed, and although some of the members of the same team have been developing a metamodel [67], the goal of the platform is to capture less data but is still compatible with the previously developed model.
The central data model consists, essentially, of a class called city that contains several components that will be stored in a structured manner. Buildings, roads, networks, public spaces, and waste separation plants are some of the objects that compose the city. Since the present article focuses on developing an urban retrofit model, a more detailed description of the building class will be developed.
The building class contains all the necessary information to develop global decarbonization analyses on buildings. The structure of internal zones, thermal zones, and thermal boundaries (surfaces, thermal openings, layers,..) contains all the input metadata that will allow for export to tools that can develop analyses such as energy consumption calculation, life cycle analysis, energy retrofitting analyses, demand response strategies (at urban level) or others. The flexible construction of the classes, with an orientation more similar to an ontology than a fixed metamodel, with links and relationships that can be changed, allows for future code re-structuring. Using classes in Python instead of fixed XML structures allows for the fast use of links and the flexibility of connections.
A data model can have classes with duplicated properties, but the Central Data Model uses the concept of inheritance to remove this duplication. The benefit of this is massively reducing the coding effort, making the code more reusable and easier to read. It also explicitly defines a relatedness between entities that helps the data model reflect their real interactions.
It is essential to underline that classes are only templates that guide how to represent the data of different entities. Once the classes are called, the values that fill the templates are objects that are instantiated, reserving RAM memory and initializing the property values. These objects disappear once the process is finished. Therefore, the goal of the central data model is not to produce anything but to give adequate structure for the later usage of the captured values.
Data
In the case of the Platform, the data used by the different workflows and models is divided between catalogs, datasets prepared by the CERC group, and online available data. The strategy of the CERC is to access, as much as possible, open data sources and, using the factories, link them to the central data model. Whenever a source of data requires deeper development or the origins of the data sources are unclear, a catalog is developed. The XML format is encouraged because of its clear structure and access facility. However, when the sources are well documented and maintained, external sources are directly accessed by the platform code. This strategy ensures that the amount of catalogs and data to be maintained is minimized and relies on maintaining these data sources by the external entities that are the data stewards. For example, the GitHub repository of the BTAP tool from NRCAN is used [69].
Figure A2.
Characteristics of the central data model
Factories
As described in Figure A4, there are two blocks with coding components called ‘Import Factories’ and ‘Export Factories’. Factories are essential, and most of the authors’ efforts to achieve homogenization of different datasets come from those factories. The Factories are specialized functions that manage exchanging data between various external (non-platform) data representations and the Platform’s internal Central Data Model.
Figure A3.
Detail on the platform workflow regarding input datasets
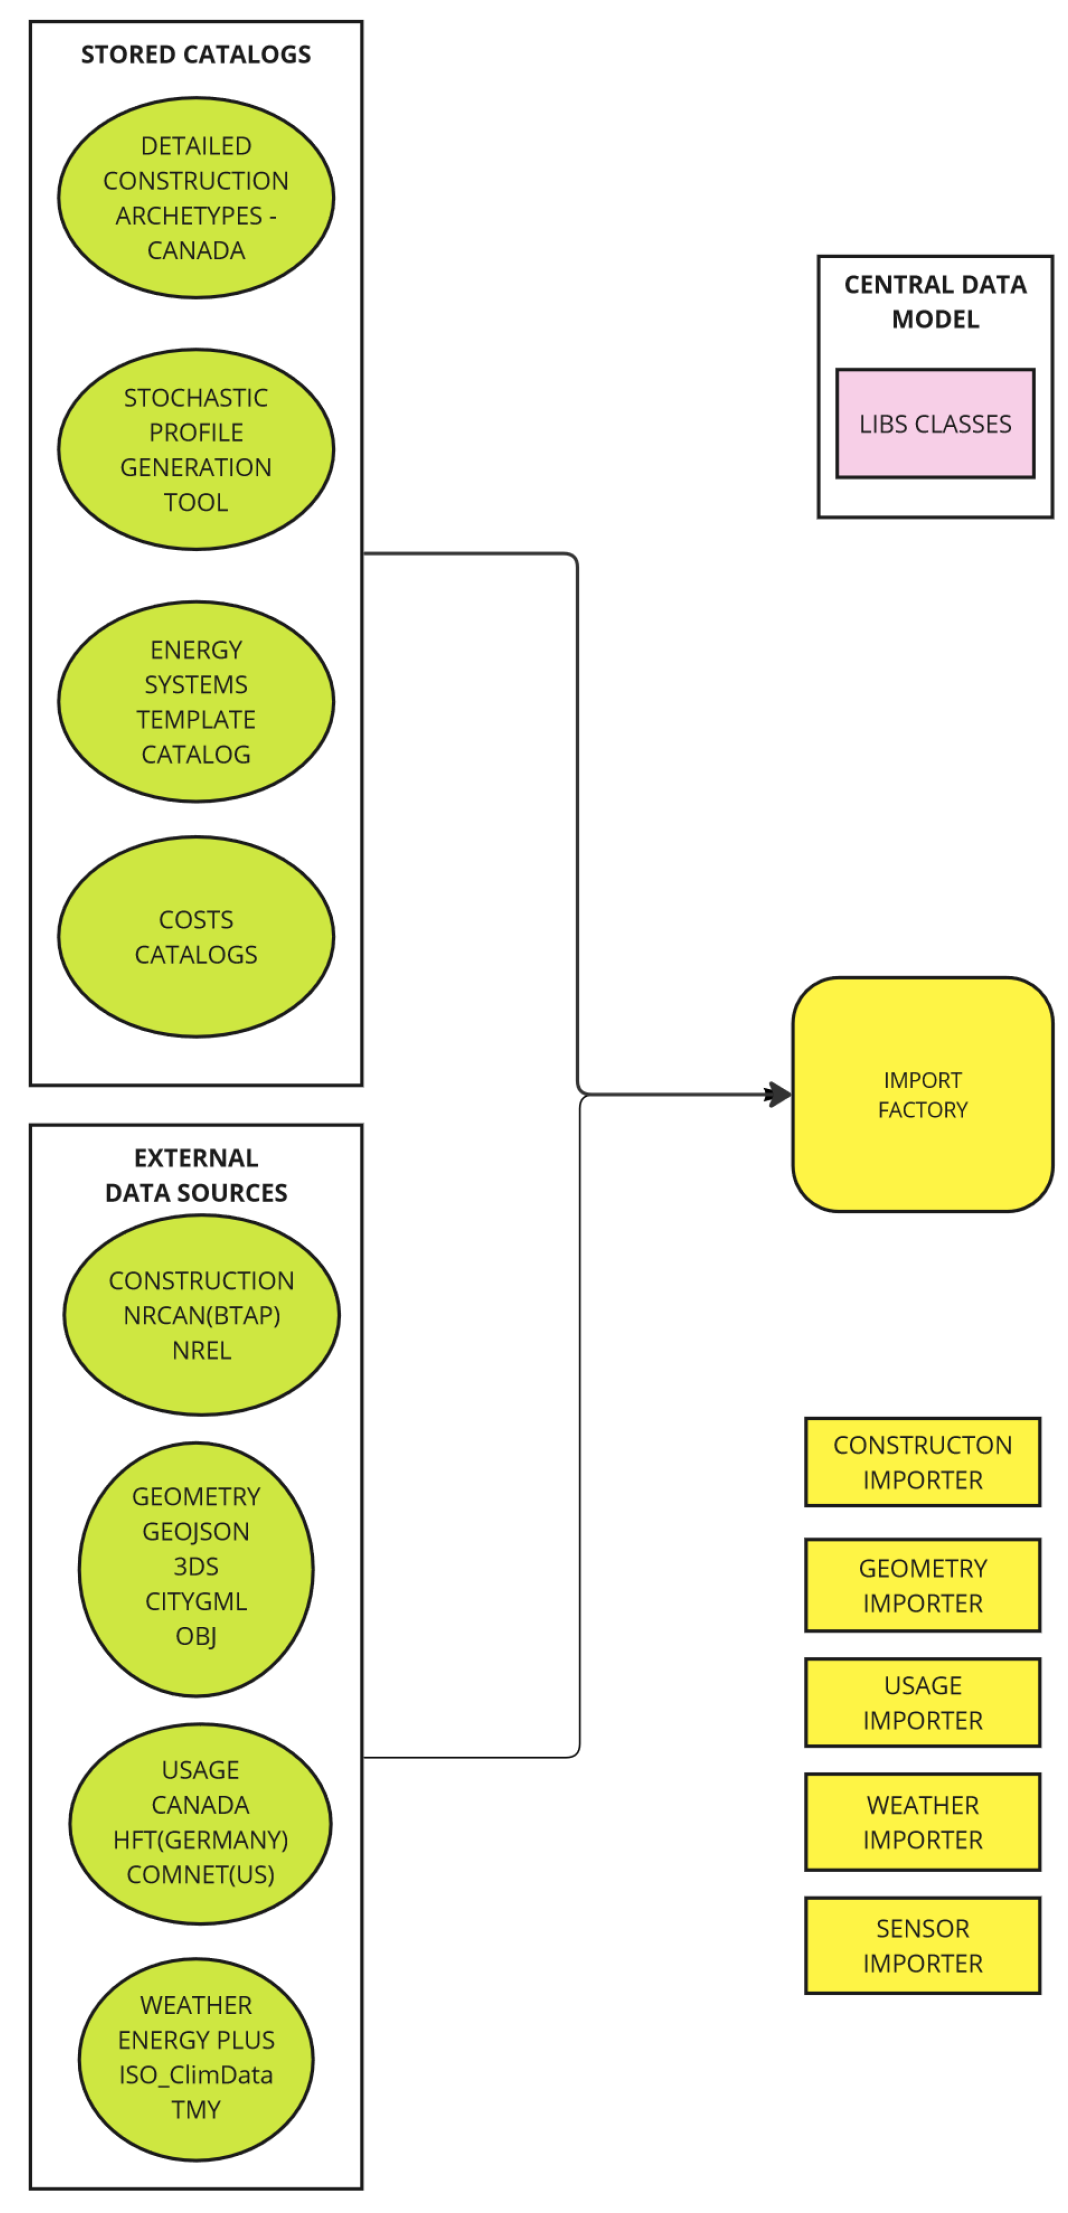
When data is converted into the Central Data Model representation, it is said to be ‘imported’. When data is taken out of the Central Data Model into an external representation, it is said to be ‘exported’. All factories need a handler to know which type of format is being imported, as several ones are supported by each factory.
Figure A4.
Steps of a complete workflow using the platform
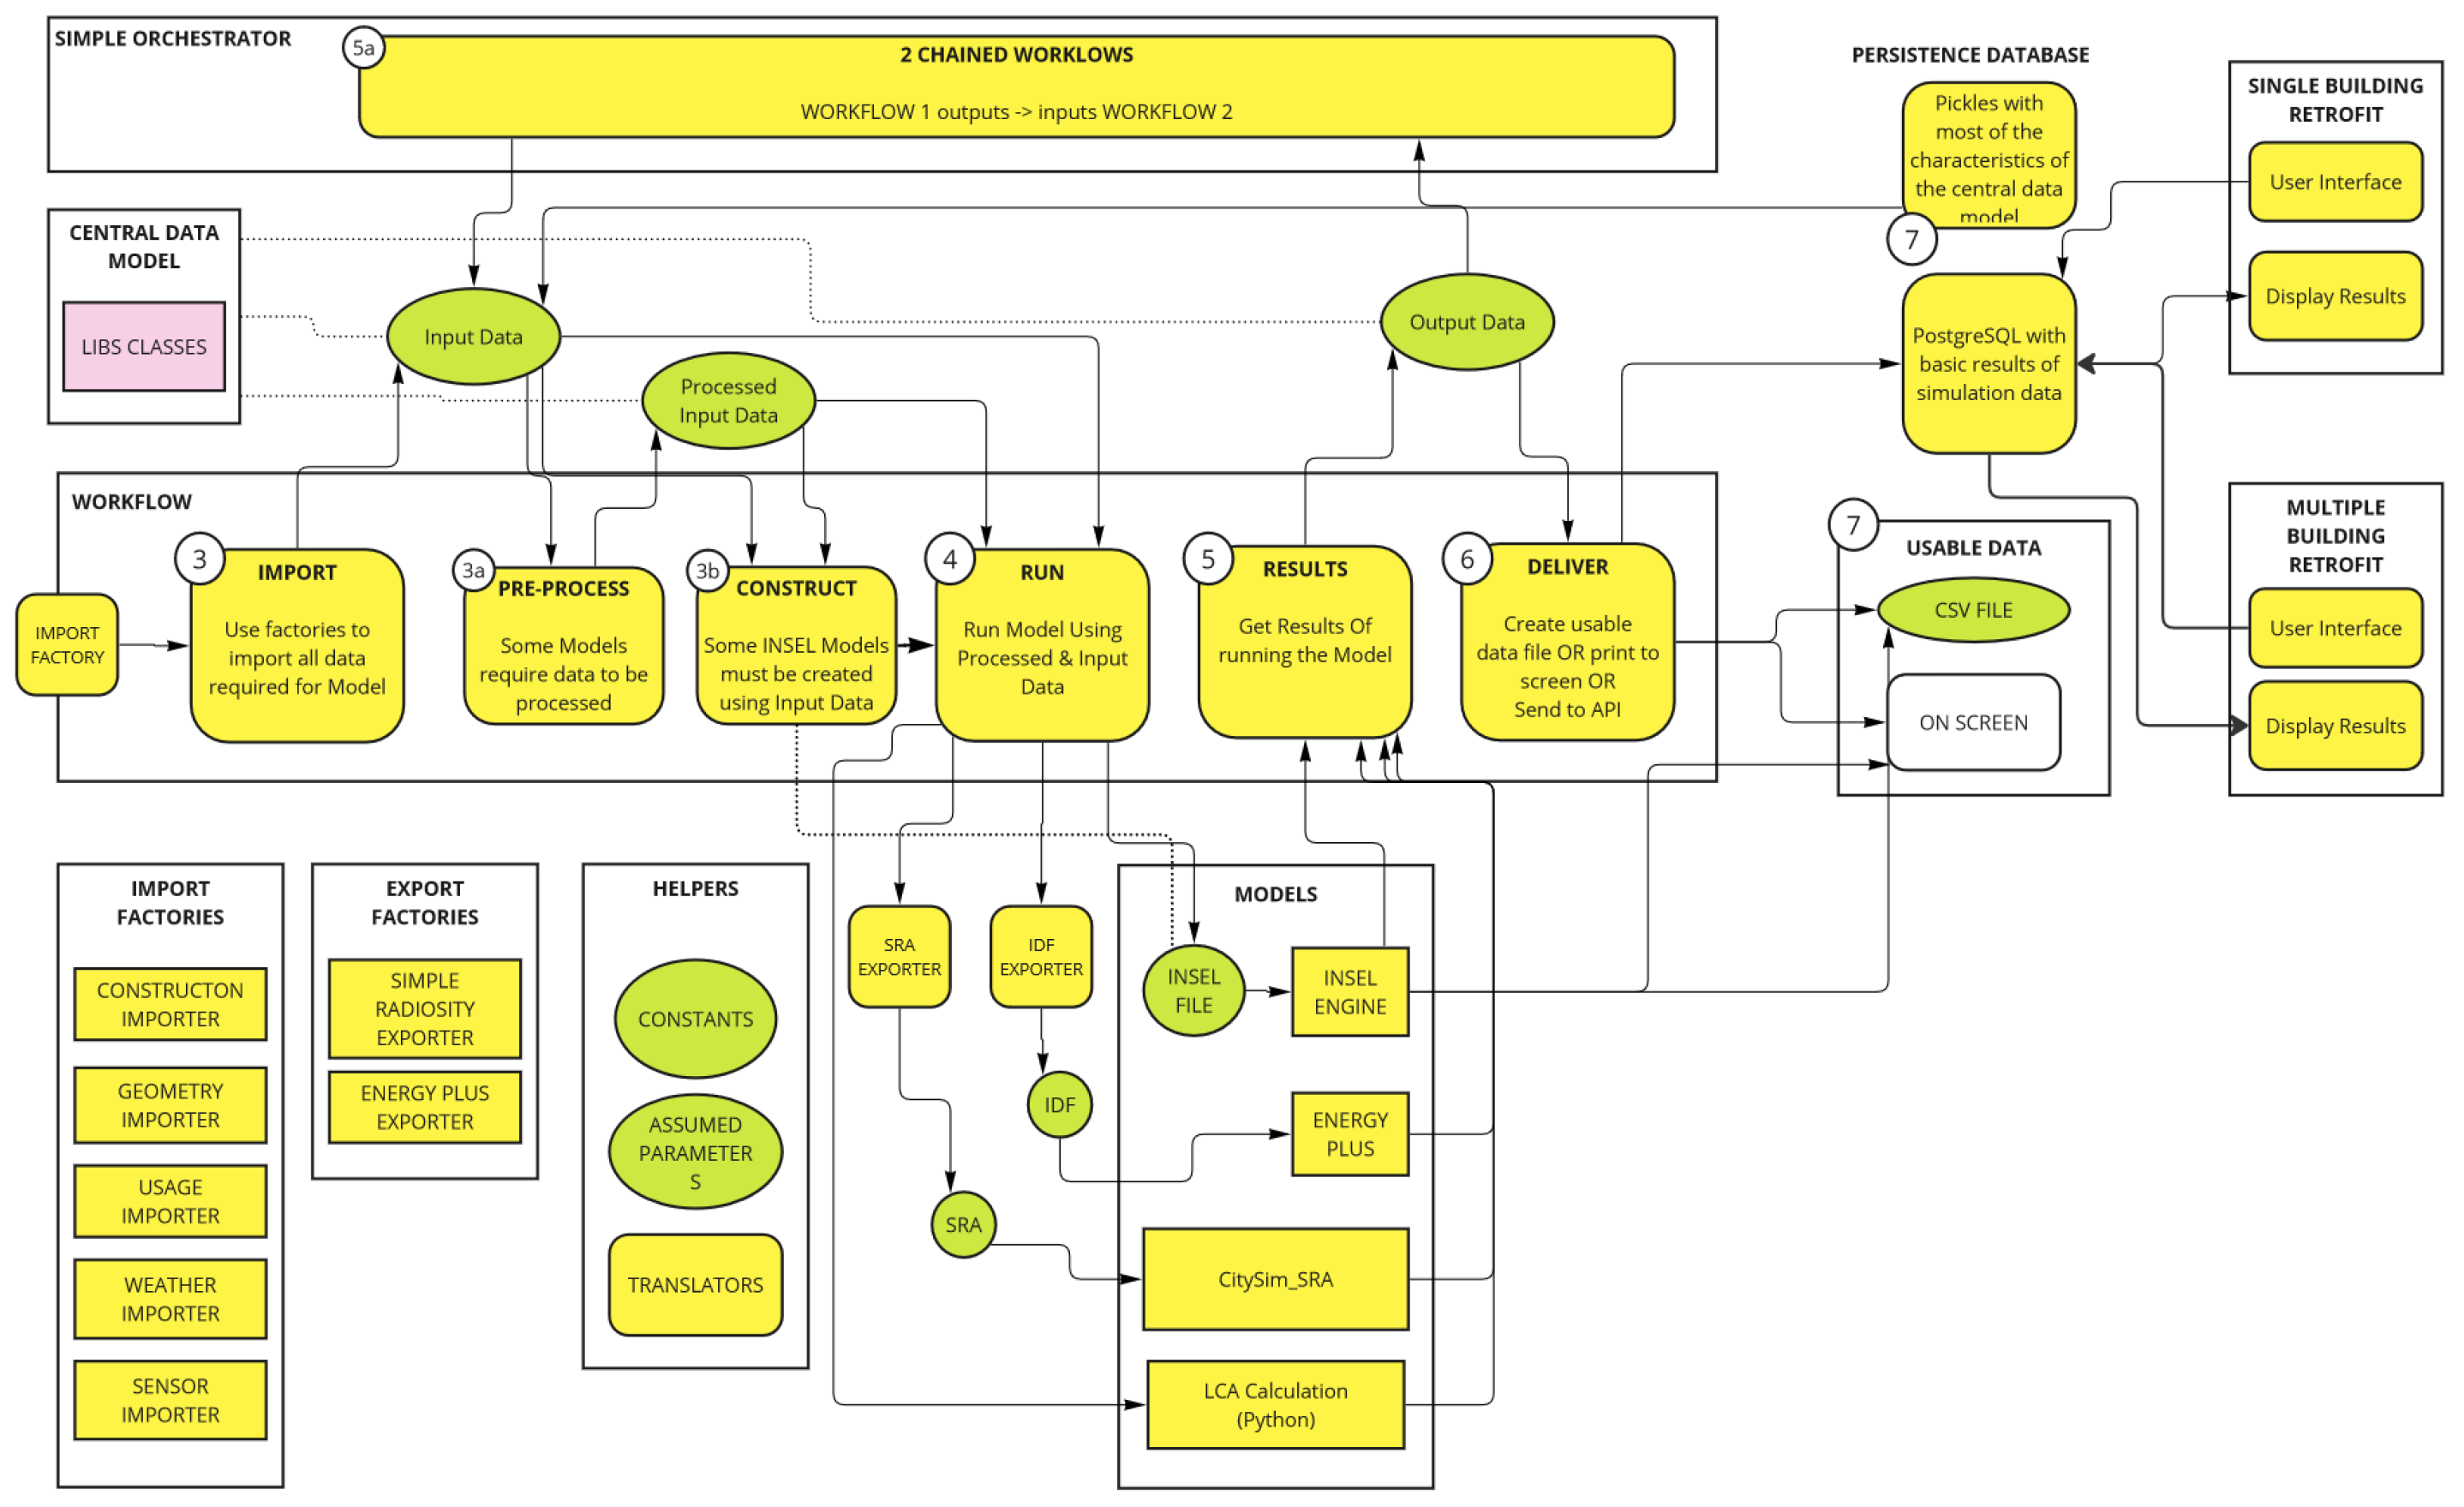
Import Factories
At the time of writing, there are Import Factories to handle the following categories of data: Construction, Geometry, Weather, Building Usage and Sensors. The Import Factory for each data category can then handle various data formats. For example, the Geometry Importer can import data in both CityGML format, Geospatial JavaScript Object (GeoJSON) format,STL format, 3DS (Rhino) and also OBJ format. The same platform includes the capacity to convert one object type into another. In this case, the handler of the Geometry factory supports at least cityGML, OBJ, rhino, and geojson. If a geojson file will be imported, we must provide the handler geojson. Weather importers incorporate how to enrich a City Object with weather data (from an EPW or a TMY file). The construction factory imports constructive characteristics for each of the buildings of a city class, which are structured in constructive archetypes. The constructive handlers available at the moment are NREL, using the data from the DOE archetypes, and NRCAN, using BTAP standards, The usage factory, at the moment, enriches each of the buildings with the usage associated with each of the building functions/archetypes and has three handlers: one using the COMNET values and profiles, another using the data from the National Energy Code of Canada, and the third using a stochastic profile generator developed by one of the researchers of the team.
xport Factories
These do the same thing in reverse, taking some category of the data represented within a City Object and converting it into an externally recognized format. This externally recognized format will be used in the different models to run use cases. At the moment, several handlers have been developed in the hub and some more are being developed. The stable handlers, at the moment, are the Energyplus handler, the Monthly Energy Balance handler, the SRA handler. The handlers being built are an RC model handler based on an R1C1 model (CityBEM) and the TRNSYS handler.
Helpers
Helpers are considered part of the factories and are the tools used to perform several functions in support of the homogenization of the central data model parameters. Helpers are used to define assumptions for models, declare constants, and perform data translations.
Development of workflows
Once the pieces of the structure have been developed, the composition between its parts is to be defined. So far, we have considered a generalized Workflow and noted how its primary role is to manage the flow of data from external sources to one or more Models, which it runs and then collects their resulting output data.
Looking at more details, workflows need to do several specialized things to carry out this role. The schema above includes more workflow components, explaining the different workflow relationships. The schema also shows a series of numbered steps. These are the fundamental steps that every Workflow needs to take, regardless of which Model it is managing. The different steps followed by workflows are:
Step 1 – IMPORT
Every Workflow must first retrieve all the required data as input for the Model(s) it manages. Data sources may be in proprietary formats (for example, building geometry may be in CityGML or OBJ format, while weather information may be in EPW, TMY2 or ISO CLIM format). Whenever a new Model is integrated into the Platform, we also develop new Factory Importers if data formats are not already supported. The Import step is completed when the imported data is converted into a format that all other Workflows in the Platform can understand. This format is known as the Central Data Model and has been explained more fully previously. Sufficed it to say, once the IMPORT step is complete, all the data from external sources is now fully represented internally in the Platform,
Step 1a – PRE-PROCESS (Optional)
Some Models require that the input data retrieved from external data sources be altered in some way, before it is ready to be used by the Model. There are many examples of this: ‘Data Cleaning’ (detecting and removing erroneous values; ‘Data Calibrating’(modifying values based on auxiliary reference data); ‘Data Pruning’ (removing unnecessary data branches); ‘Data Compression’ (making the size of data more manageable). We call these steps ‘Pre-Processing’ and the Workflow is responsible for carrying these out across all of the Input Data, as required.
Step 1b – CONSTRUCT (Optional)
For some models, the Input Data itself can change the Model. For example, an INSEL Model for calculating building energy demand may depend on the building geometry. The connectedness of thermal zones and surfaces within a building directly impacts the logic connections in a building simulation Model. As a result, the Input Data must be analyzed and used to create the required building simulation Model (INSEL, Energyplus, or TRNSYS). This is done programmatically by the CONSTRUCT step of the Workflow.
Step 2 – RUN
Once the Workflow has the Input Data ready it is time to RUN the Model(s). This could be as simple as making one call to the Model with one data set. Or it could involve calling the Model multiple times with subsets of the data. For example, the Input Data may include 300 buildings in a city district, and the model can calculate them all, either using a multi-zone approach to calculate different buildings or running all the buildings in a model one by one. If the Model is a Custom Model, written in Python, the Input Data can be sent using the format described by the Central Data Model. However, if the Model is an INSEL Model, the Input Data needs to be sent using an INSEL file template. And if the Model is a 3rd Party Model (e.g. Energy Plus), the Input Data must be sent in the proprietary format(s) understood by that Model. (e.g. IDF files for Energy Plus). As with importing different data formats, the Platform helps Workflows here, providing the Factories that can easily export data to the format required. Again, whenever a new model is integrated into the platform, we also develop new factory exporters if any data formats are not already supported. The RUN step is complete once the Workflow has called the Model across all the necessary Input Data.
Step 3 – RESULTS
All Models generate some result or Output Data. The workflow must collect this data so that it can be used. INSEL Models can output their data directly to the screen. They can also write their data to files (CSV and other formats). Energy Plus outputs text files. Custom Models may do any of the above or return their results programmatically. The Workflow must retrieve the Output Data from any of these sources, using Factory Importers again where necessary, and convert the Output Data once more into the format described by the Central Data Model. This allows the data to be accessed by other Models later in the same Workflow or even other Workflows after this one completes. When the Workflow calls a Model multiple times with different subsets of Input Data, the Workflow must also retrieve the results after each call, building up a full set of Output Data.
Step 4 – DELIVER
With the Output Data now retrieved and stored, the final responsibility of the Workflow is to make the data available to whoever needs it. There are multiple options here. The Workflow may write the data to output files, display the data on the screen, and ensure the data is available for new Workflows; it may ensure the data is available for 3rd party Apps. In future versions of the Platform, this part of the Workflow is expected to be more formalized. Figure A4 shows the relationship between the Central Data Model and the Factories. The next two sections explain how these both support the Workflow
Appendix B. Detailed Hypotheses of the Archetypes
Appendix B lists the hypotheses used for construction materials for the different buildings from the different data sources compiled by the authors listed in the reference section.

Table A1.
Composition of the walls. Archetypes for residential buildings.
| Area | Opaque walls | Transparent walls |
|---|---|---|
| Pre-1950 | Wall with 10 cm brick, 10 cm LW concrete, 10 cm air gap, 1.2 cm plasterboard. U=1.498 W/m2K | Window with a glazing conductivity value of U=3.10 W/m2K, a marc conductivity of U=4.20 W/m2K, and an SHGC of 0.66. |
| Roof membrane, insulation to achieve U=0.823 W/m2K, metal surface | ||
| Floor with insulation to U=0.678 W/m2K, 4-inch concrete, carpeting | ||
| 1950-1980 | Wall with 10 cm brick, 10 cm LW concrete, 5 cm insulation, 10 cm air gap, 1.2 cm plasterboard. | Window with a glazing conductivity value of U=3.10 W/m2K, a marc conductivity of U=4.20 W/m2K and an SHGC of 0.66. |
| Roof membrane, insulation reaching U=0.823 W/m2K, metal surface | ||
| Floor with insulation to U=0.678 W/m2K, 4-inch concrete, carpeting | ||
| 1980-2010 | Wall with 25 mm stucco, 5/8" plaster, virtual insulation to achieve U=0.426 W/m2K | Window with a glazing conductivity value of U=2.8 W/m2K, a marc conductivity of U=4.20 W/m2K and an SHGC of 0.66. |
| Roof membrane, insulation reaching U=0.276 W/m2K, metal surface | ||
| Floor with insulation to achieve U=0.459 W/m2K, 4-inch concrete, carpet | ||
| 2011-2020 | Wall with 25 mm stucco, 5/8" plaster, virtual insulation to achieve U=0.247 W/m2K | Window with a glazing conductivity value of U= 2.2 W/m2K, a frame conductivity of U=3.1 W/m2K and an SHGC of 0.39. |
| Roof membrane, insulation reaching U=0.183 W/m2K, metal surface | ||
| Floor with insulation to reach U=0.183 W/m2K, 4-inch concrete, carpet | ||
| >2020 | Wall with 25 mm stucco, 5/8" plaster, virtual insulation to achieve U=0.247 W/m2K | Window with a glazing conductivity value of U=1.9 W/m2K, a frame conductivity of U=2.20 W/m2K and an SHGC of 0.39. |
| Roof membrane, insulation reaching U=0.138 W/m2K, metal surface | ||
| Floor with insulation to reach U=0.156 W/m2K, 4-inch concrete, carpet |
Table A2.
Composition of the walls. Archetypes for non-residential buildings.
| Area | Opaque walls | Transparent walls |
|---|---|---|
| Pre-1950 | Brick/ Stone/ Terracotta/Concrete with an overall U value of U=0.9 W/m2K | Window with a glazing conductivity value of U=5 W/m2K, a frame conductivity of U=4.20 W/m2K, and an SHGC of 0.8. |
| Roof membrane, insulation to achieve U=0.823 W/m2K, metal surface | ||
| Floor with insulation to U=0.678 W/m2K, 4-inch concrete, carpeting | ||
| 1950-1980 | Steel structure/Curtain wall, Brick/Stone Cladding: 0.1, Concrete: 0.1, Gypsum Plastering: 0.013. | Window with a glazing conductivity value of U=3.10 W/m2K, a frame conductivity of U=4.20 W/m2K and an SHGC of 0.66. |
| Roof membrane: 0.002 m, Asphalt cover board: 0.01 m, Rigid insulation (e.g., MW Glass Wool): 0.10 m - 0.12 m, Steel trusses, joists, concrete decks, parallel-chord trusses and joists | ||
| Floor with insulation to U=0.678 W/m2K, 4-inch concrete, carpeting | ||
| 1980-2010 | Curtain wall with veneer or precast cladding: 0.1 m, Insulation (e.g., Rigid board insulation): 0.10 m - 0.12 m, Interior gypsum plastering: 0.013 m. / Metallic Cladding: 0.006 m, Gypsum Plastering: 0.013 m, Insulation (e.g., Rigid board insulation): 0.10 m - 0.12 m. U=0.426 W/m2K | Window with a glazing conductivity value of U=2.8 W/m2K, a frame conductivity of U=4.20 W/m2K and an SHGC of 0.66. |
| Roof membrane: 0.002 m, Asphalt cover board: 0.01 m, Rigid insulation (e.g., MW Glass Wool): 0.10 m - 0.12 m, Steel trusses, joists, concrete decks, parallel-chord trusses and joists U=0.276 W/m2K | ||
| Floor with insulation to achieve U=0.459 W/m2K, 4-inch concrete, carpet | ||
| 2011-2020 | Brick veneer, with air space and insulation on steel or wood framing. U=0.247 W/m2K | Window with a glazing conductivity value of U= 2.2 W/m2K, a frame conductivity of U=3.1 W/m2K and an SHGC of 0.39. |
| Roof membrane, insulation reaching U=0.183 W/m2K, metal surface | ||
| Floor with insulation to reach U=0.183 W/m2K, 4-inch concrete, carpet | ||
| >2020 | Brick veneer, with air space and insulation on steel or wood framing. U=0.247 W/m2K U=0.247 W/m2K | Window with a glazing conductivity value of U=1.9 W/m2K, a frame conductivity of U=2.20 W/m2K and an SHGC of 0.39. |
| Roof membrane, insulation reaching U=0.138 W/m2K, metal surface | ||
| Floor with insulation to reach U=0.156 W/m2K, 4-inch concrete, carpet |
References
- Programme, U.N.E.; .; Construction, G.A.f.B. 2020 Global Status Report for Buildings and Construction: Towards a Zero-emissions, Efficient and Resilient Buildings and Construction Sector - Executive Summary 2020.
- Ding, G. Demolish or refurbish – Environmental benefits of housing conservation. Australasian Journal of Construction Economics and Building 2013, 13, 18–34. [CrossRef]
- Power, A. Does demolition or refurbishment of old and inefficient homes help to increase our environmental, social and economic viability? Energy Policy 2008, 36, 4487–4501. Foresight Sustainable Energy Management and the Built Environment Project, . [CrossRef]
- Schwartz, Y.; Raslan, R.; Mumovic, D. Refurbish or replace? The Life Cycle Carbon Footprint and Life Cycle Cost of Refurbished and New Residential Archetype Buildings in London. Energy 2022, 248, 123585. [CrossRef]
- Crawford, K.; Johnson, C.; Davies, F.; Joo, S.; Bell, S. Demolition or Refurbishment of Social Housing?. Technical report, UCL Urban Lab and Engineering Exchange for Just Space and the London Tenants Federation, 2014.
- Tetteh, M.O.; Boateng, E.B.; Darko, A.; Chan, A.P.C. What Are the General Public’s Needs, Concerns and Views about Energy Efficiency Retrofitting of Existing Building Stock? A Sentiment Analysis of Social Media Data. Energy and Buildings 2023, p. 113721. [CrossRef]
- Brendan Haley, R.T. Canada’s Climate Retrofit Mission, 2021.
- Lohse, R.; Mørck, O.C.; Zhivov, A., Eds. Deep Energy Retrofit—Case Studies: Business and Technical Concepts for Deep Energy Retrofit of Public Buildings; Energy in Buildings and Communities Programme; Annex 61, Subtask A; Springer International Publishing: Cham, 2023. [CrossRef]
- Volans. Pattern and APPG on Fair Banking. (2021), 2021.
- Prabatha, T.; Hewage, K.; Karunathilake, H.; Sadiq, R. To Retrofit or Not? Making Energy Retrofit Decisions through Life Cycle Thinking for Canadian Residences. Energy and Buildings 2020, 226, 110393. [CrossRef]
- Reinhart, C.F.; Cerezo Davila, C. Urban building energy modeling – A review of a nascent field. Building and Environment 2016, 97, 196–202. [CrossRef]
- Li, Z.; Ma, J.; Tan, Y.; Guo, C.; Li, X. Combining physical approaches with deep learning techniques for urban building energy modeling: A comprehensive review and future research prospects. Building and Environment 2023, 246, 110960. [CrossRef]
- Dabirian, S.; Panchabikesan, K.; Eicker, U. Occupant-centric urban building energy modeling: Approaches, inputs, and data sources - A review. Energy and Buildings 2022, 257, 111809. [CrossRef]
- Dahlström, L.; Broström, T.; Widén, J. Advancing urban building energy modelling through new model components and applications: A review. Energy and Buildings 2022, 266, 112099. [CrossRef]
- Keirstead, J.; Jennings, M.; Sivakumar, A. A review of urban energy system models: Approaches, challenges and opportunities. Renewable and Sustainable Energy Reviews 2012, 16, 3847–3866. [CrossRef]
- Allegrini, J.; Orehounig, K.; Mavromatidis, G.; Ruesch, F.; Dorer, V.; Evins, R. A review of modelling approaches and tools for the simulation of district-scale energy systems. Renewable and Sustainable Energy Reviews 2015, 52, 1391 – 1404. [CrossRef]
- Robinson, D.; Campbell, N.; Gaiser, W.; Kabel, K.; Le-Mouel, A.; Morel, N.; Page, J.; Stankovic, S.; Stone, A. SUNtool–A new modelling paradigm for simulating and optimising urban sustainability. Solar Energy 2007, 81, 1196–1211. CISBAT 2005, . [CrossRef]
- Robinson, D.; Stone, A. Holistic radiation modelling with a fast simplified radiosity algorithm. In Proceedings of the Proc. Ninth Int. IBPSA Conf., Building Simulation. Citeseer, 2005.
- Community, M. MATSim Documentation.
- Scartezzini, J.L.; Nouvel, R.; BRASSEL, K.H.; BRUSE, M.; Duminil, E.; Coors, V.; Eicker, U.; Robinson, D. SimStadt, a new workflow-driven urban energy simulation platform for CityGML city models 2015.
- Monien, D.; Strzalka, A.; Koukofikis, A.; Coors, V.; Eicker, U. Comparison of building modelling assumptions and methods for urban scale heat demand forecasting. Future Cities and Environment 2017. [CrossRef]
- Agugiaro, G.; Joachim, B.; Cipriano, P.; Nouvel, R. The Energy Application Domain Extension for CityGML: enhancing interoperability for urban energy simulations. Open Geospatial Data Software and Standards 2018, 3. [CrossRef]
- Weiler, V.; Harter, H.; Eicker, U. Life cycle assessment of buildings and city quarters comparing demolition and reconstruction with refurbishment. Energy and Buildings 2017, 134, 319–328. [CrossRef]
- Reinhart, C.; Dogan, T.; Jakubiec, J.A.; Rakha, T.; Sang, A. UMI - An urban simulation environment for building energy use, daylighting and walkability. In Proceedings of the 13th Conference of International Building Performance Simulation Association, Chambery, France, 2013.
- Wu, W.; Dong, B.; Wang, Q.R.; Kong, M.; Yan, D.; An, J.; Liu, Y. A novel mobility-based approach to derive urban-scale building occupant profiles and analyze impacts on building energy consumption. Applied Energy 2020, 278, 115656. [CrossRef]
- Baetens, R.; De Coninck, R.; Jorissen, F.; Picard, D.; Helsen, L.; Saelens, D. OpenIDEAS – An Open Framework for integrated District Energy Simulations. 12 2015. [CrossRef]
- Ferrando, M.; Causone, F.; Hong, T.; Chen, Y. Urban building energy modeling (UBEM) tools: A state-of-the-art review of bottom-up physics-based approaches. Sustainable Cities and Society 2020, 62, 102408. [CrossRef]
- El Kontar, R.; Polly, B.; Charan, T.; Fleming, K.; Moore, N.; Long, N.; Goldwasser, D. URBANopt: An Open-Source Software Development Kit for Community and Urban District Energy Modeling. 10 2020.
- Deng, Z.; Chen, Y.; Yang, J.; Causone, F. AutoBPS: A tool for urban building energy modeling to support energy efficiency improvement at city-scale. Energy and Buildings 2023, 282, 112794. [CrossRef]
- Rayegan, S.; Katal, A.; Wang, L.L.; Zmeureanu, R.; Eicker, U.; Mortezazadeh, M.; Tahmasebi, S. Modeling building energy self-sufficiency of using rooftop photovoltaics on an urban scale. Energy and Buildings 2024, 324, 114863. [CrossRef]
- Kavgic, M.; Mavrogianni, A.; Mumovic, D.; Summerfield, A.; Stevanovic, Z.; Djurovic-Petrovic, M. A review of bottom-up building stock models for energy consumption in the residential sector. Building and Environment 2010, 45, 1683–1697. [CrossRef]
- Shaikh, P.H.; Nor, N.B.M.; Nallagownden, P.; Elamvazuthi, I.; Ibrahim, T. A review on optimized control systems for building energy and comfort management of smart sustainable buildings. Renewable and Sustainable Energy Reviews 2014, 34, 409–429. [CrossRef]
- Monsalvete Alvarez de Uribarri, P. A multiscale framework for predicting distributed renewable thermal energy integration, 2020. Publisher: University of Nottingham.
- Huber, J.; Nytsch-Geusen, C. Development of modeling and simulation strategies for large-scale urban districts. In Proceedings of the Proceedings of Building Simulation, 2011, pp. 1753–1760.
- Bollinger, L.A.; Evins, R. Facilitating model reuse and integration in an urban energy simulation platform. Procedia Computer Science 2015, 51, 2127–2136. International Conference On Computational Science, ICCS 2015, . [CrossRef]
- Nouvel, R.; Mastrucci, A.; Leopold, U.; Baume, O.; Coors, V.; Eicker, U. Combining GIS-based statistical and engineering urban heat consumption models: Towards a new framework for multi-scale policy support. Energy and Buildings 2015, 107, 204 – 212. [CrossRef]
- Xu, Z.; Coors, V. Application of system dynamics, GIS and 3D visualization in a study of residential sustainability. In Proceedings of the International Conference on Computational Science and Its Applications. Springer, 2011, pp. 300–314.
- CERC. hub.
- Dabirian, S.; Saad, M.M.; Hussain, S.; Peyman, S.; Rahimi, N.; Monsalvete Alvarez U, P.; Yefi, P.; Eicker, U. Structuring heterogeneous urban data: A framework to develop the data model for energy simulation of cities. Energy and Buildings 2023, 296, 113376. [CrossRef]
- Schumacher, J. INSEL Documentation. http://insel.eu/index.php?id=301.
- Bleyl, J.; Bareit, M.; Casas, M.; Chatterjee, S.; Coolen, J.; Hulshoff, A.; Lohse, R.; Mitchell, S.; Robertson, M.; Ürge Vorsatz, D. Office building deep energy retrofit: life cycle cost benefit analyses using cash flow analysis and multiple benefits on project level. Energy Efficiency 2019, 12, 1–19. [CrossRef]
- ISO. ISO 15686-5:2017. https://www.iso.org/standard/61148.html, 2017.
- Charette, R.P.; Marshall, H.E. UNIFORMAT II Elemental Classification for Building Specifications, Cost Estimating, and Cost Analysis. Technical Report NIST IR 6389, National Institute of Standards and Technology, Gaithersburg, MD, 1999. [CrossRef]
- Canada, N.R. EnerGuide energy efficiency home evaluations, 2018. Last Modified: 2023-11-29 Publisher: Natural Resources Canada.
- Consommation d’énergie et émissions de gaz à effet de serre des bâtiments municipaux de 2000 m² et plus - Site web des données ouvertes de la Ville de Montréal.
- Unités d’évaluation foncière - Site web des données ouvertes de la Ville de Montréal.
- LiDAR aérien 2015 - Site web des données ouvertes de la Ville de Montréal.
- Canada, N.R. Automatically Extracted Buildings - Prepackaged Shapefiles (download directory) - Open Government Portal.
- Laval, U. Geoindex - Public.
- Unités d’évaluation foncière - Site web des données ouvertes de la Ville de Montréal.
- NRCAN. OpenStudio-Standards. National Renewable Energy Laboratory, 2023.
- Charbonneau, M. Simulating the Effects of Enclosure Retrofits on Post-War High-Rise Apartment Buildings in Cold Climates. PhD thesis, University of Waterloo, 2011.
- Jadaa, D.A.; McArthur, J.J. Development of Granular Archetypes for Canadian Existing Commercial Office and Multi-Unit Residential Buildings in Climate Zone 5 2024.
- Canada, G.B.C. Decarbonizing Canada’s Large Buildings. https://www.cagbc.org/news-resources/research-and-reports/decarbonizing-canadas-large-buildings/.
- Canada, N.R.C. National Energy Code of Canada for Buildings 2020. https://nrc.canada.ca/en/certifications-evaluations-standards/codes-canada/codes-canada-publications/national-energy-code-canada-buildings-2020, 2022.
- Government of Canada, N.R.C. Energy Use in Canada: Publications, 2011. Last Modified: 2023-11-29 Publisher: Government of Canada, Natural Resources Canada.
- Montréal.
- Chowdhury, S. Rapid Building Feature Extraction and Geometry Formulation Using Machine Learning. In Proceedings of the Eleventh National Conference of IBPSA-USA Denver, Colorado, May 21 – 23, 2024, 2024.
- EnergyPlus.
- Hecht, R.; Danke, T.; Herold, H.; Hudson, P.; Munke, M.; Rieche, T. Colouring Cities: A Citizen Science Platform for Knowledge Production on the Building Stock - Potentials for Urban and Architectural History. In Proceedings of the Research and Education in Urban History in the Age of Digital Libraries; Münster, S.; Pattee, A.; Kröber, C.; Niebling, F., Eds., Cham, 2023; pp. 145–164. [CrossRef]
- Directive, E.E. EU Energy Efficiency Directive 2012/27/EU. Journal reference 2012, 50, 1–56.
- Mazzarella, L. The Revised Energy Performance Buildings Directive (EPBD) in the Frame of 55 Program, 2024.
- Echeverria, A.; Palacios, J.; Davila, C.; Zheng, S. Quantifying the financial value of building decarbonization technology under uncertainty: Integrating energy modeling and investment analysis. Energy and Buildings 2023, 297, 113260. [CrossRef]
- Zhivov, A.; Lohse, R. Deep Energy Retrofit—A Guide for Decision Makers; 2021. [CrossRef]
- Kennedy, M.; Frappé-Sénéclauze, T.P. Canada’s renovation wave.A plan for jobs and climate. Technical report, The Pembina Institute, 2021.
- Admin. What are the six types of relationships in UML class diagrams?, 2022.
- Yefi, P.; Menon, R.; Eicker, U.; Guéhéneuc, Y.G. MetamEnTh: A Object-Oriented Metamodel for IoT Systems in Buildings. IEEE Internet of Things Journal 2024, PP, 1–1. [CrossRef]
- project, B. biggproject/Ontology, 2024. original-date: 2022-09-07T08:50:03Z.
- NREL/openstudio-standards, 2024. original-date: 2014-01-09T23:40:42Z.
Figure 1.
UBEM development timeline
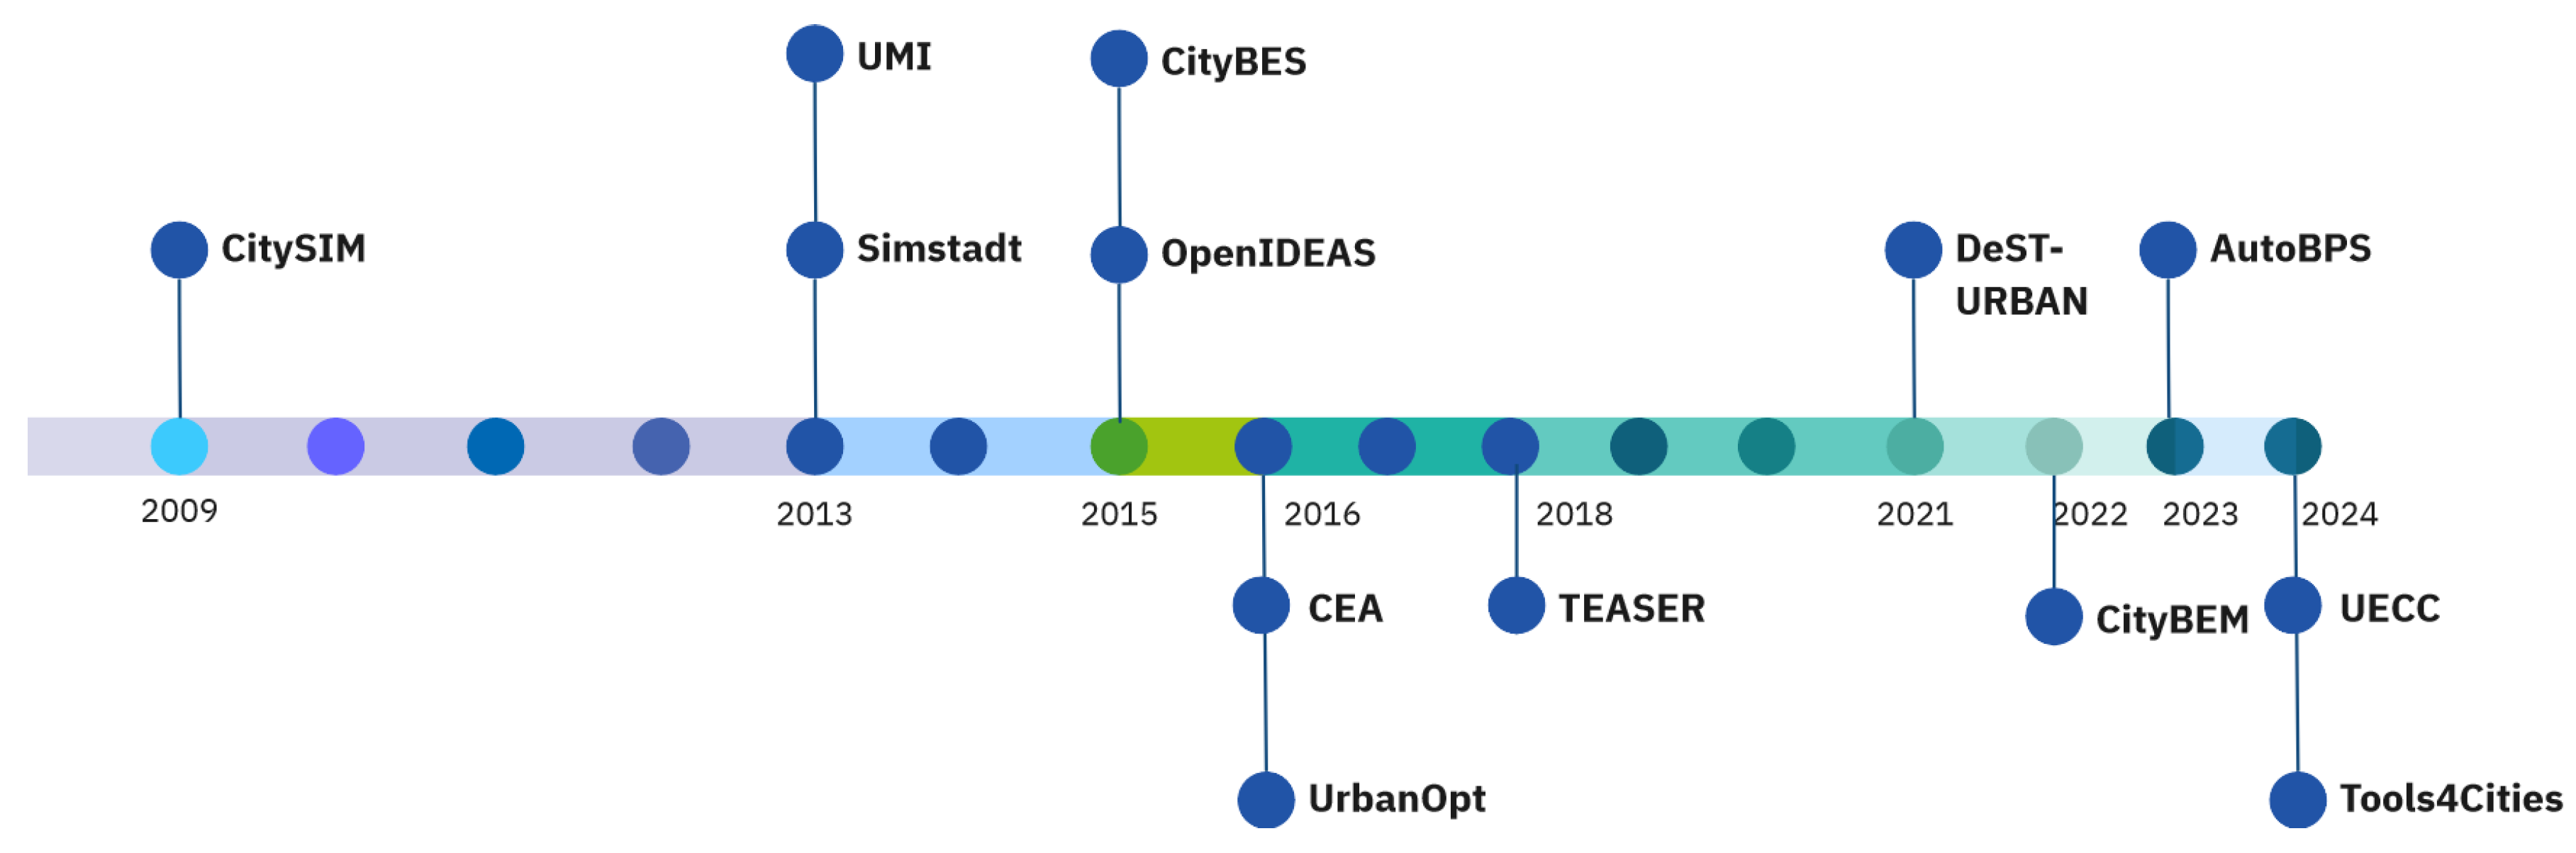
Figure 2.
Retrofitting workflow overview
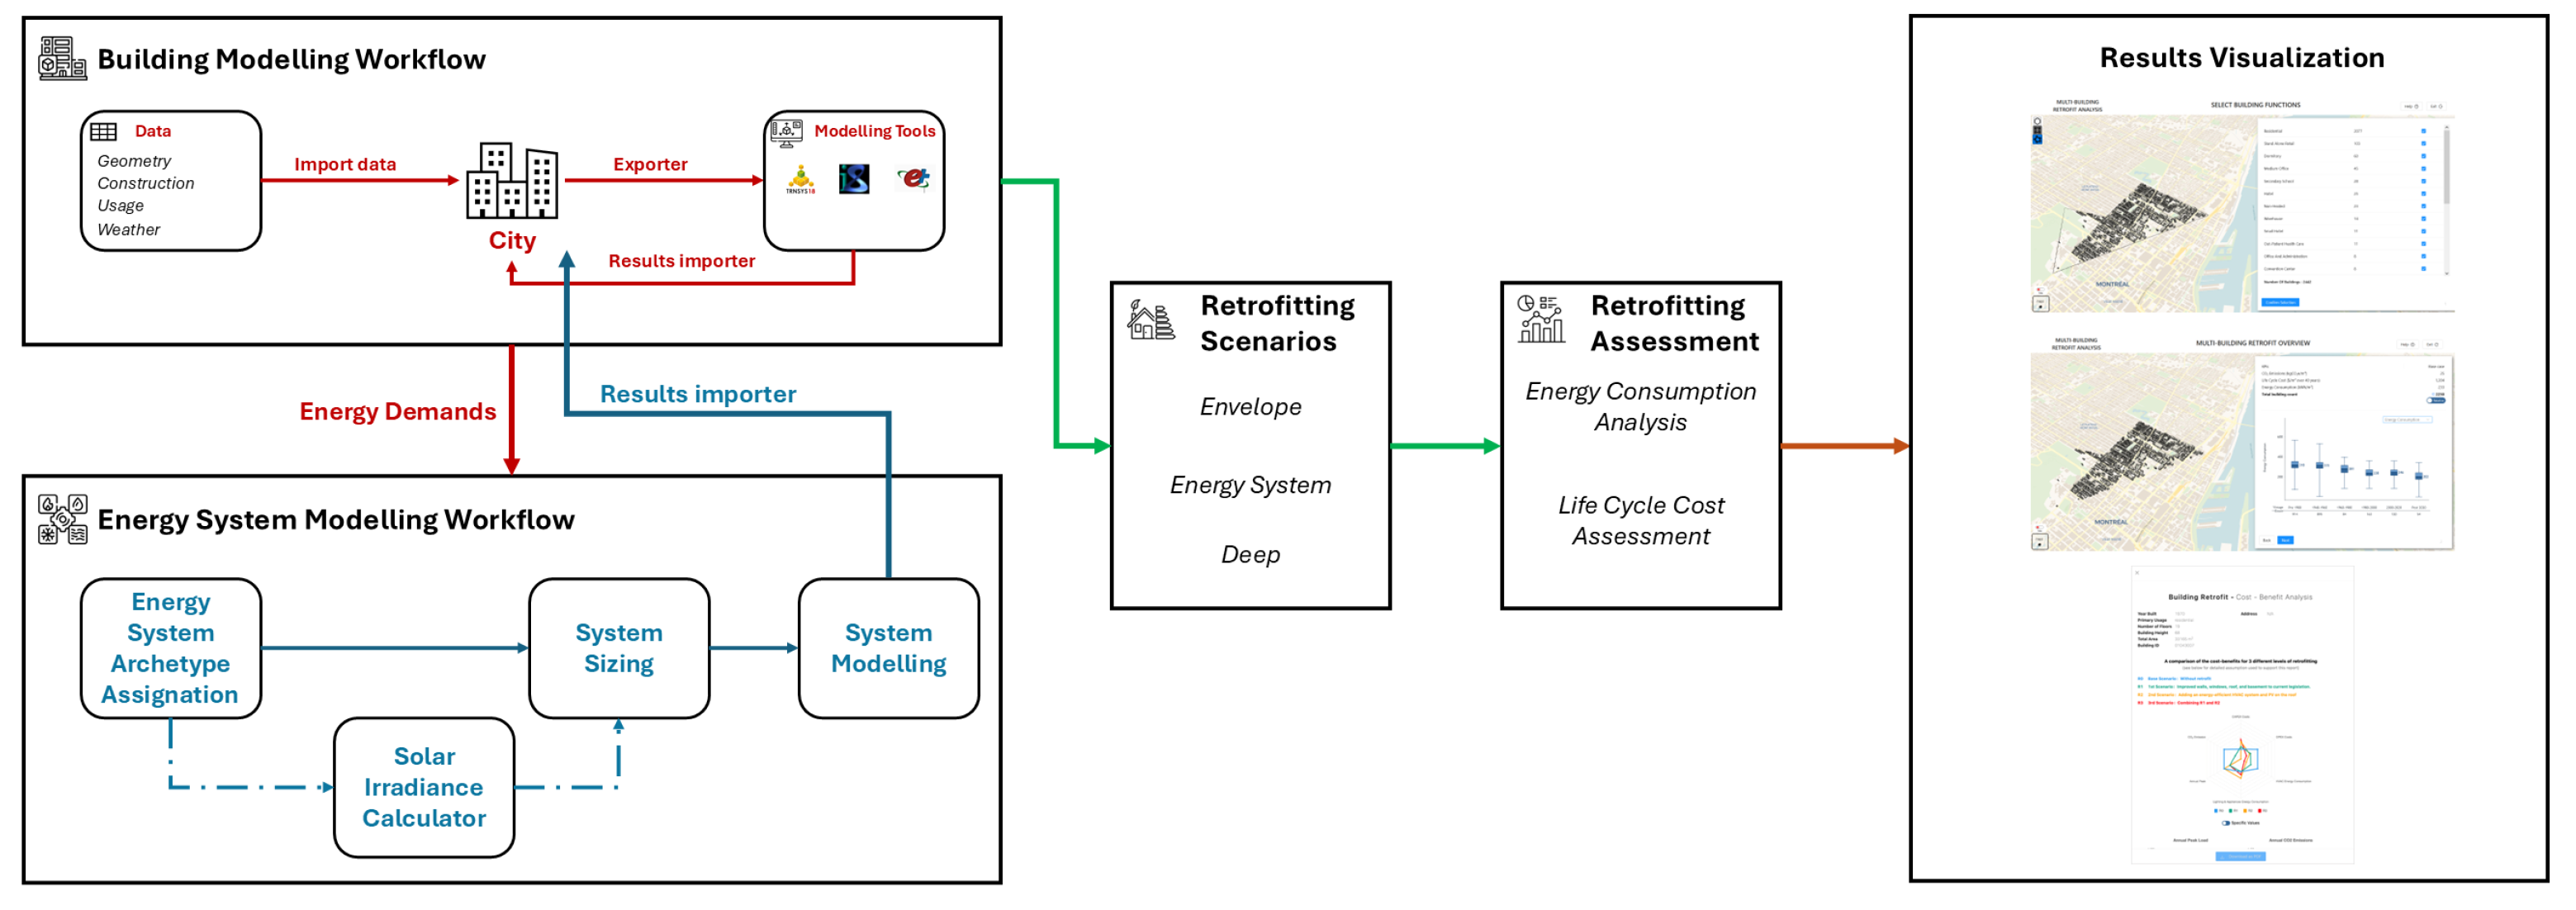
Figure 3.
A snippet from the UML diagram of the energy system data model.
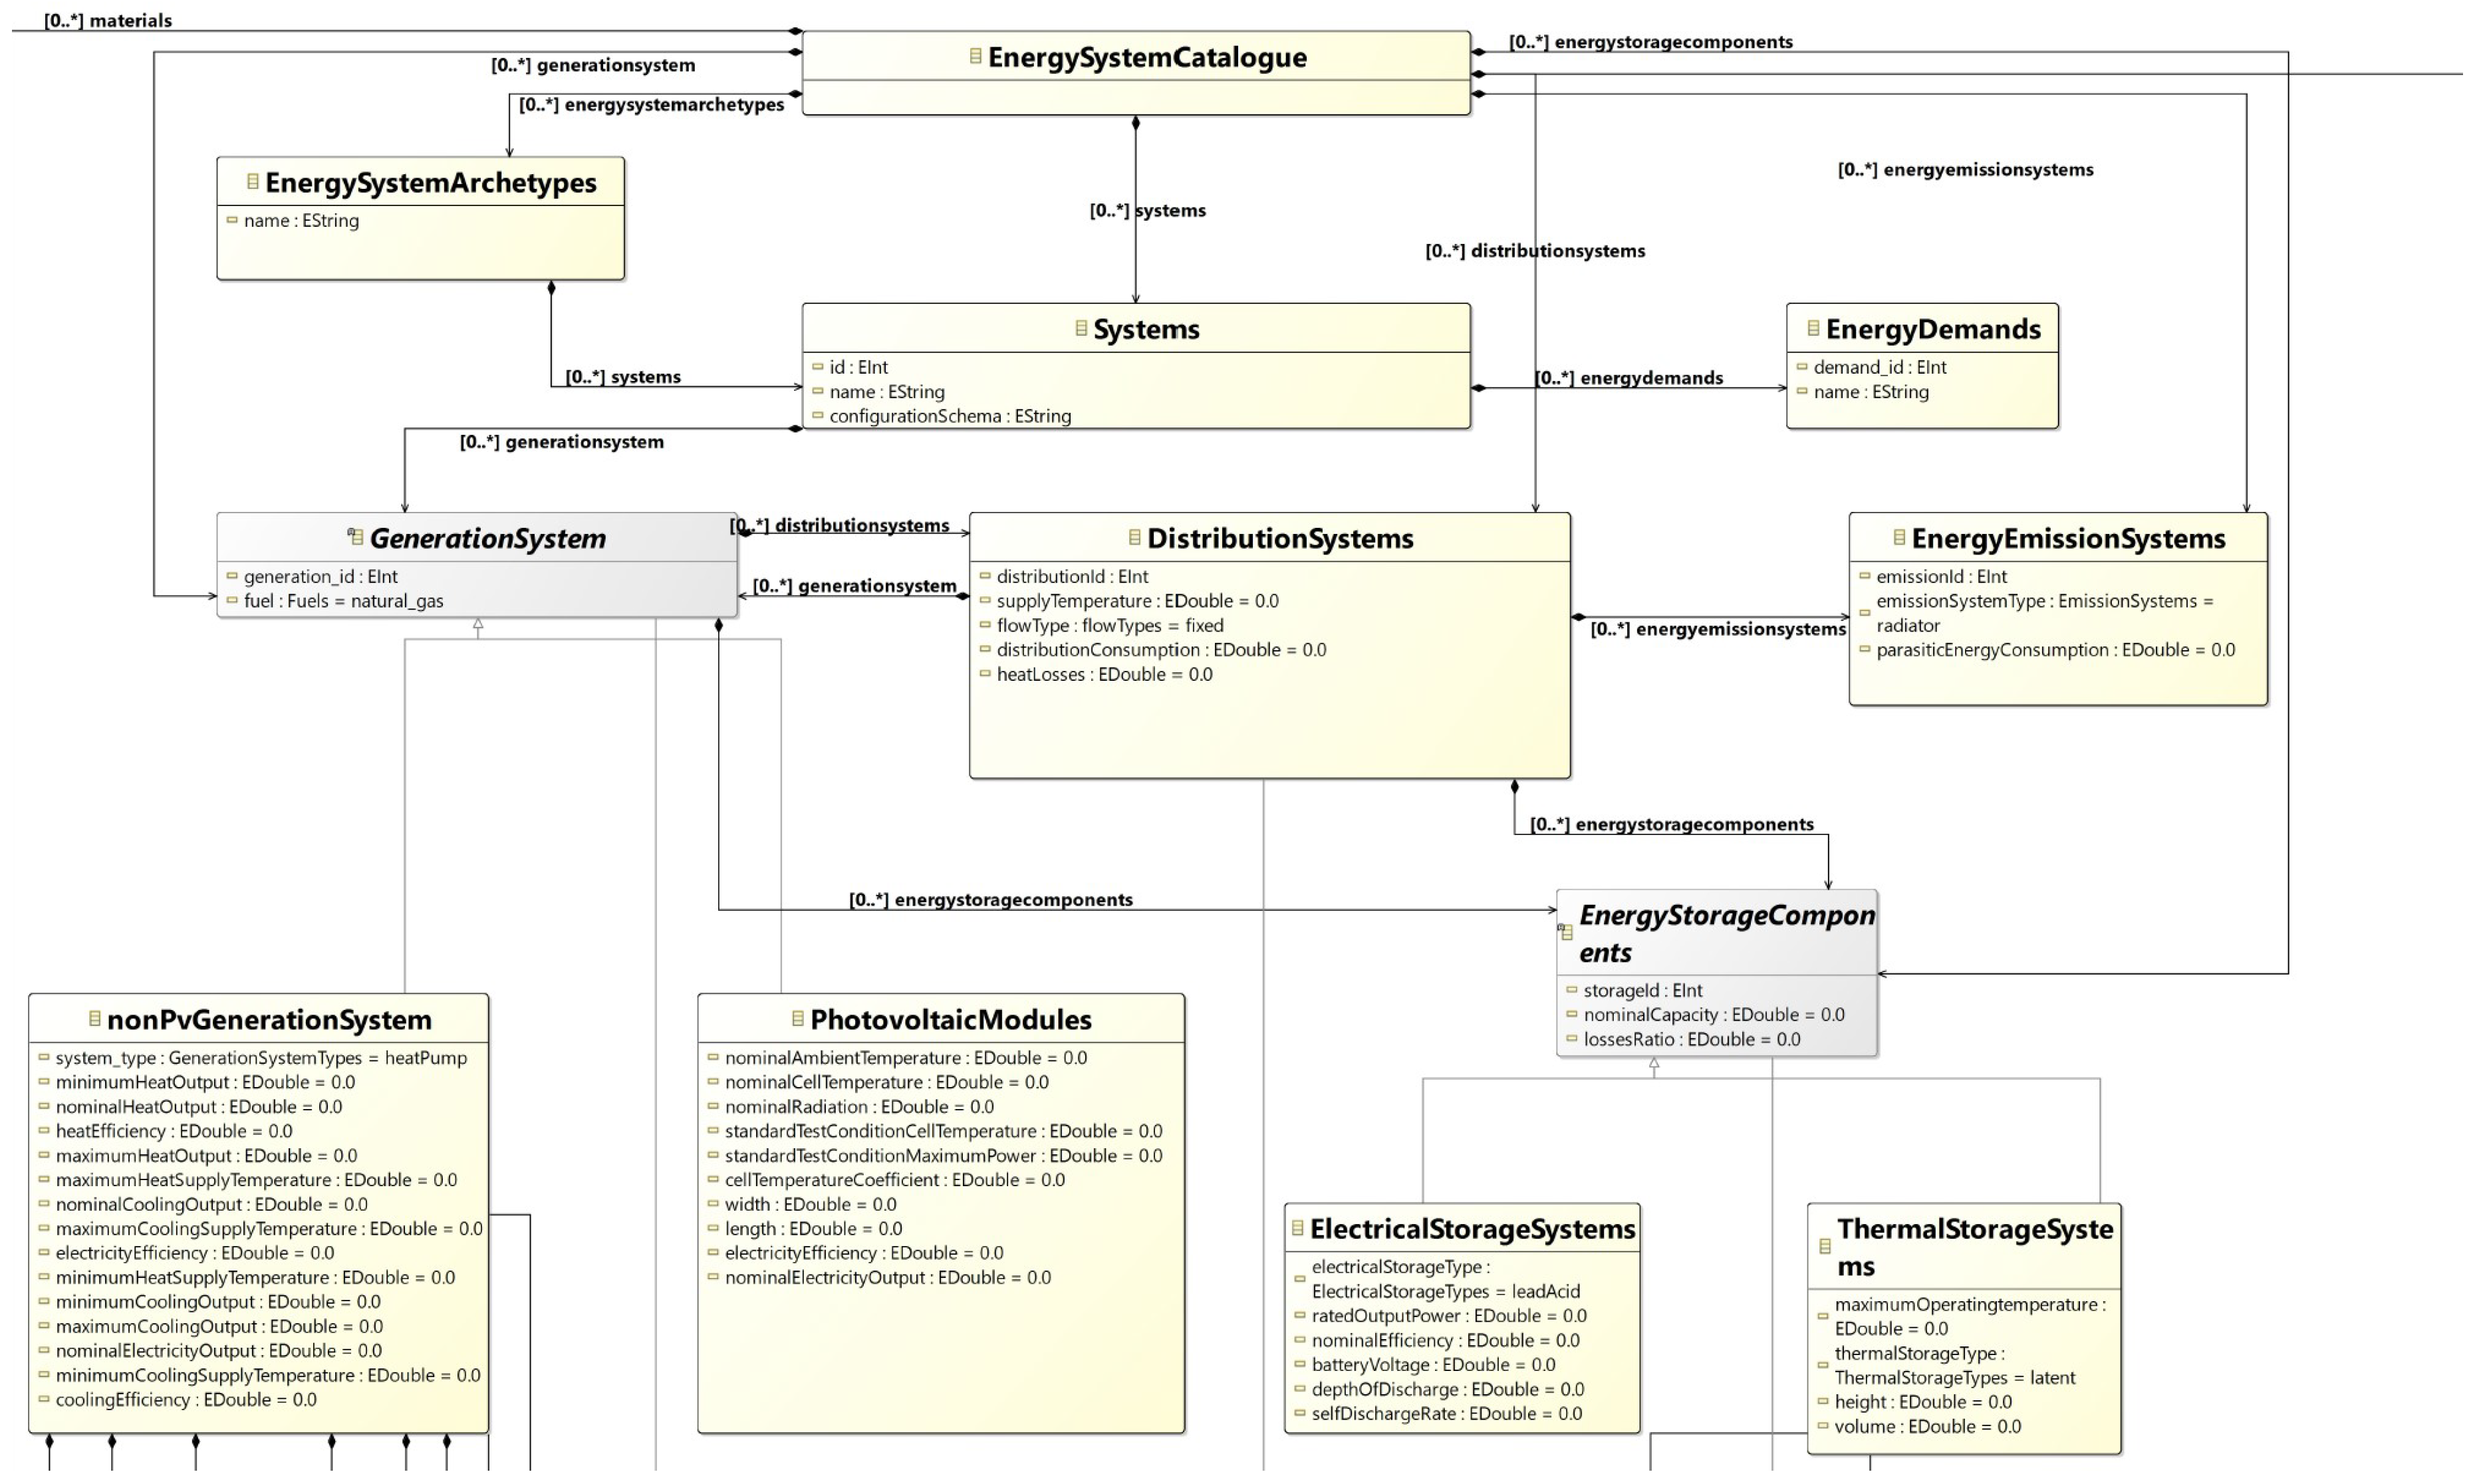
Figure 4.
Simulated buildings, colour-coded by vintage
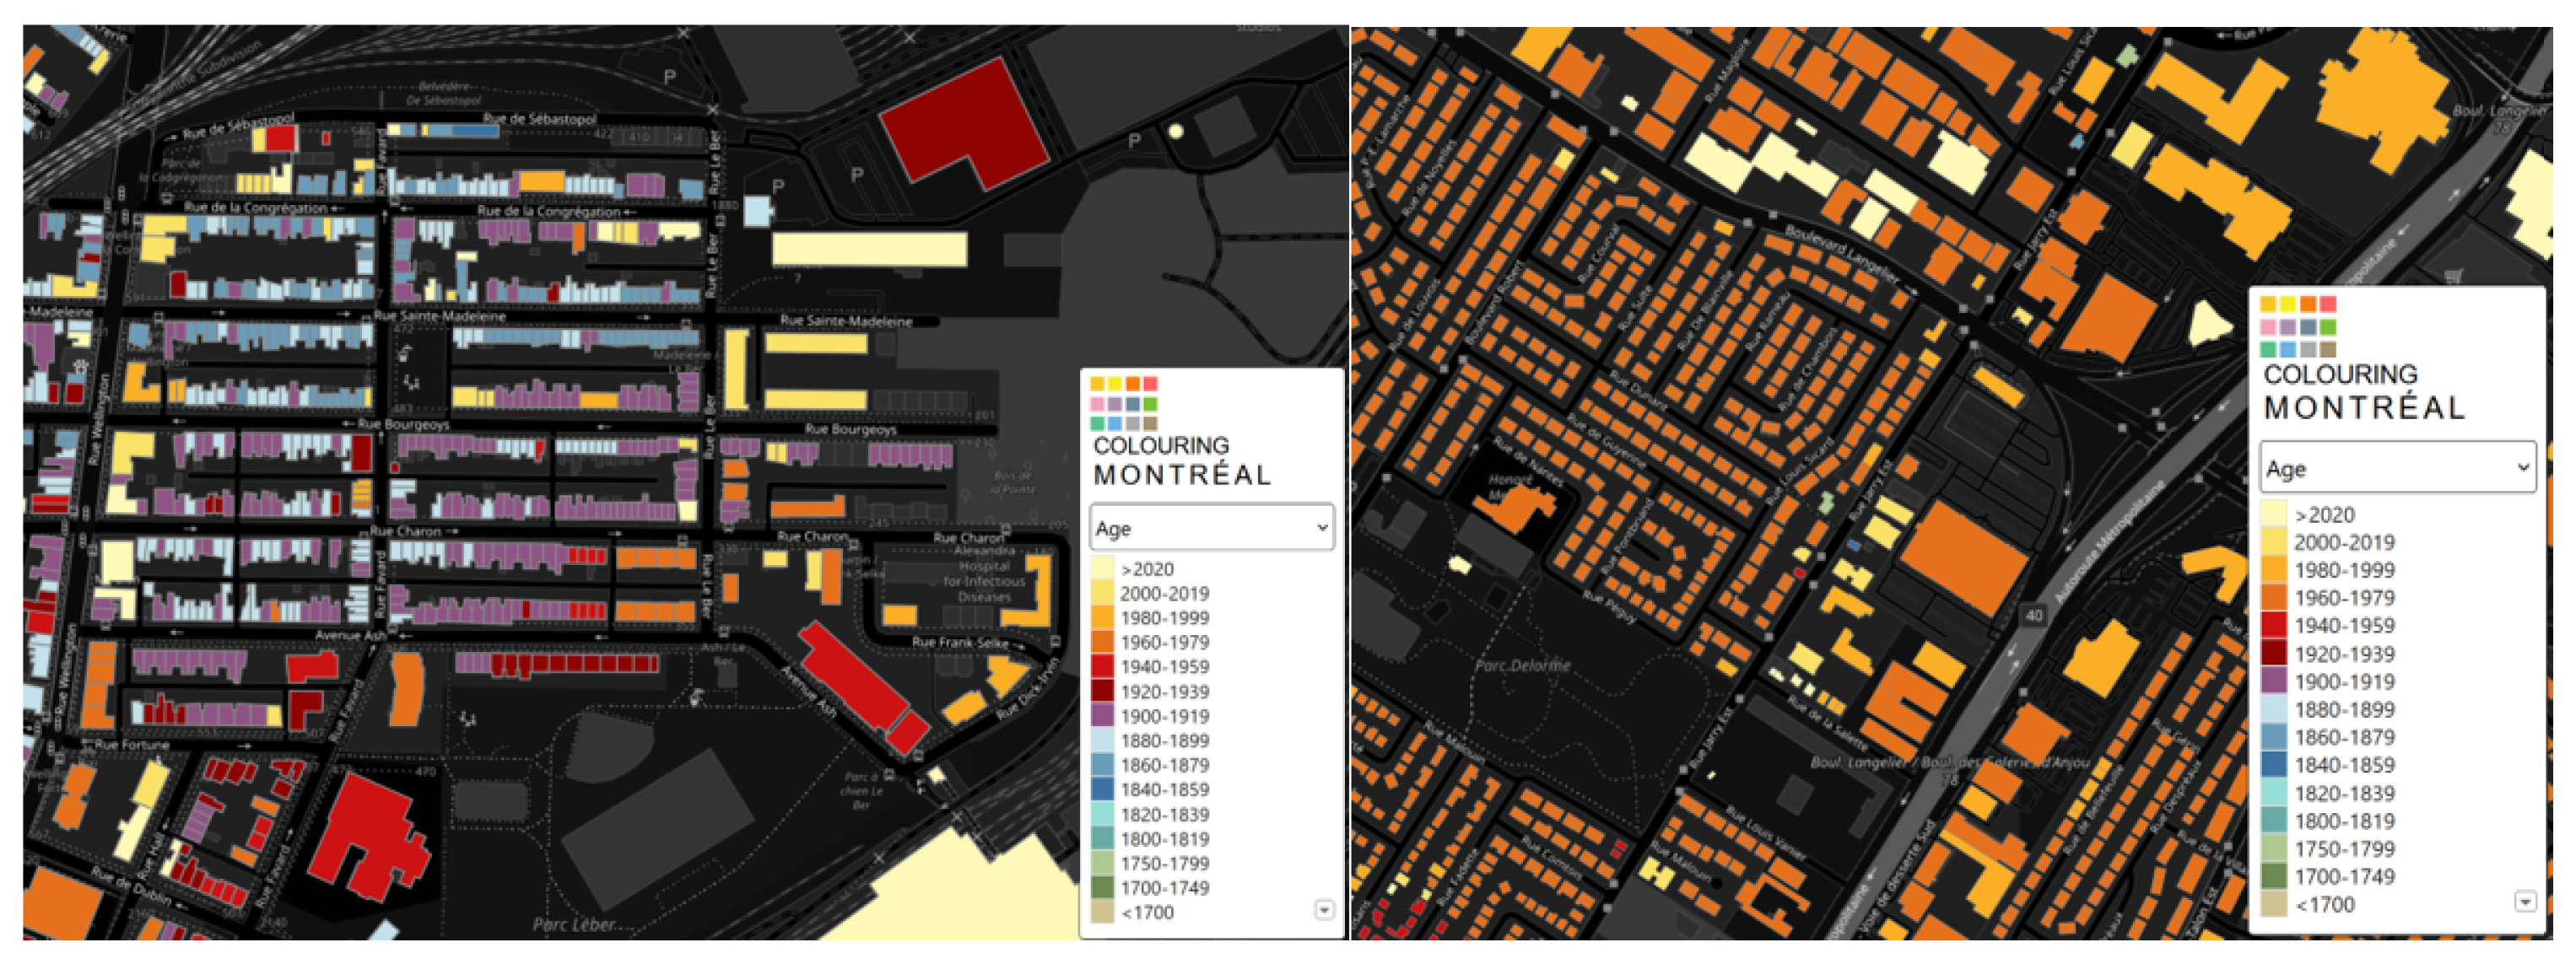
Figure 5.
Splitting between different data sources for residential buildings.
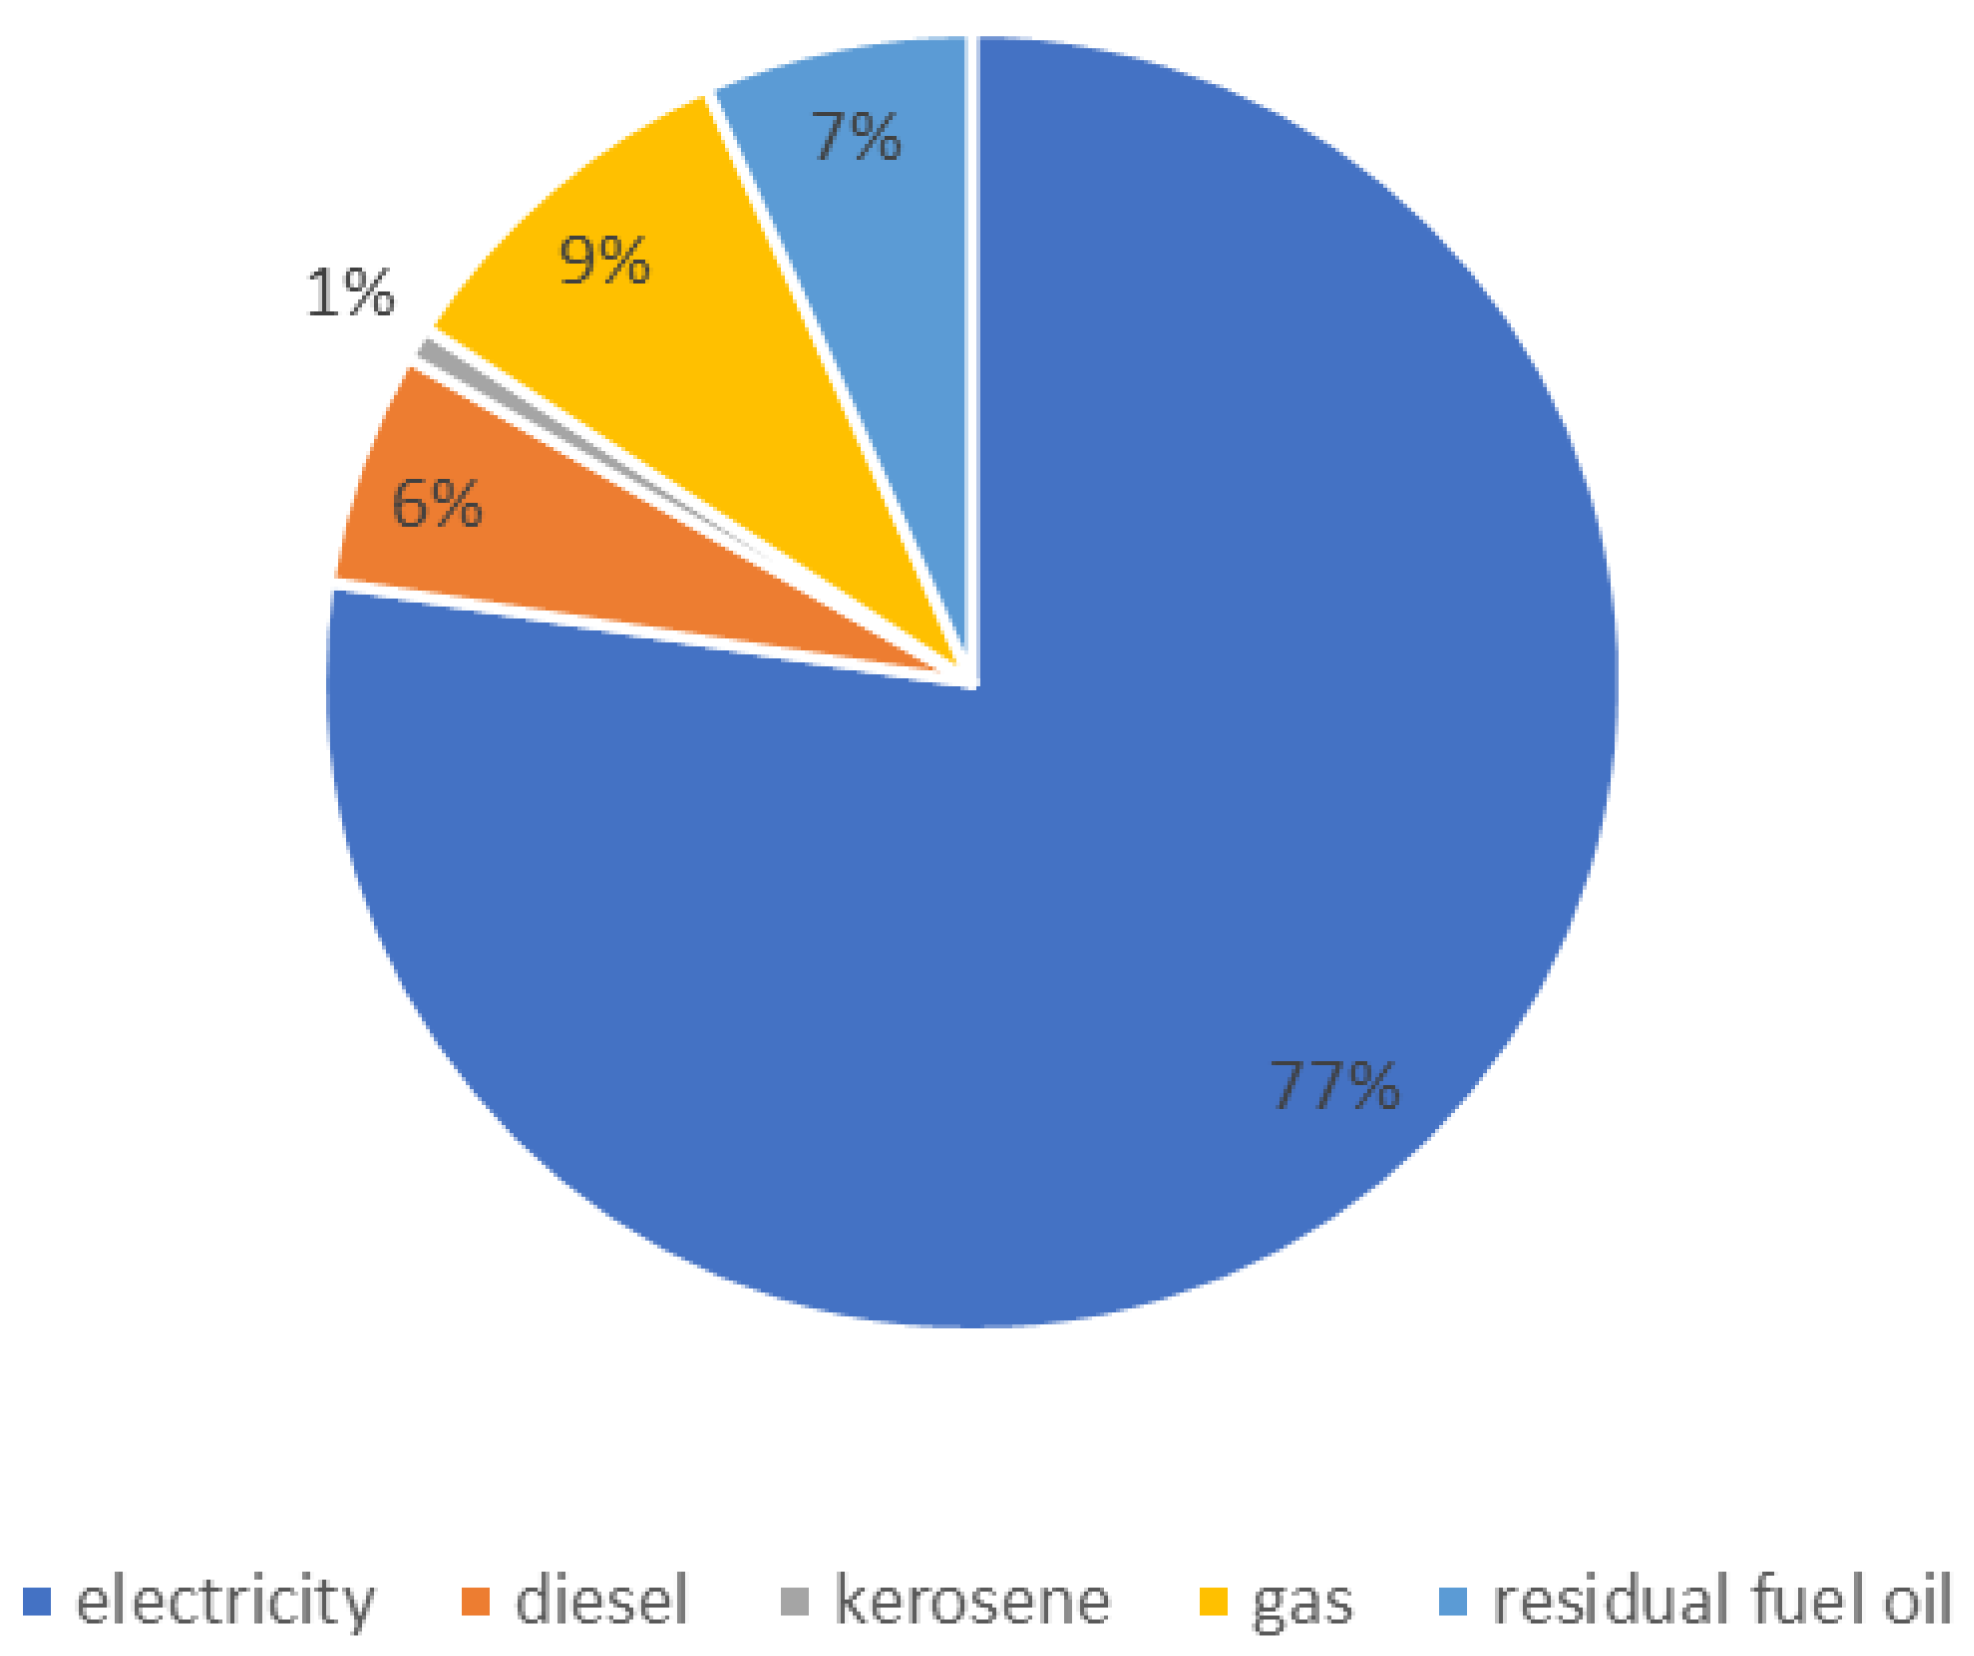
Figure 6.
Splitting between different data sources for commercial buildings.
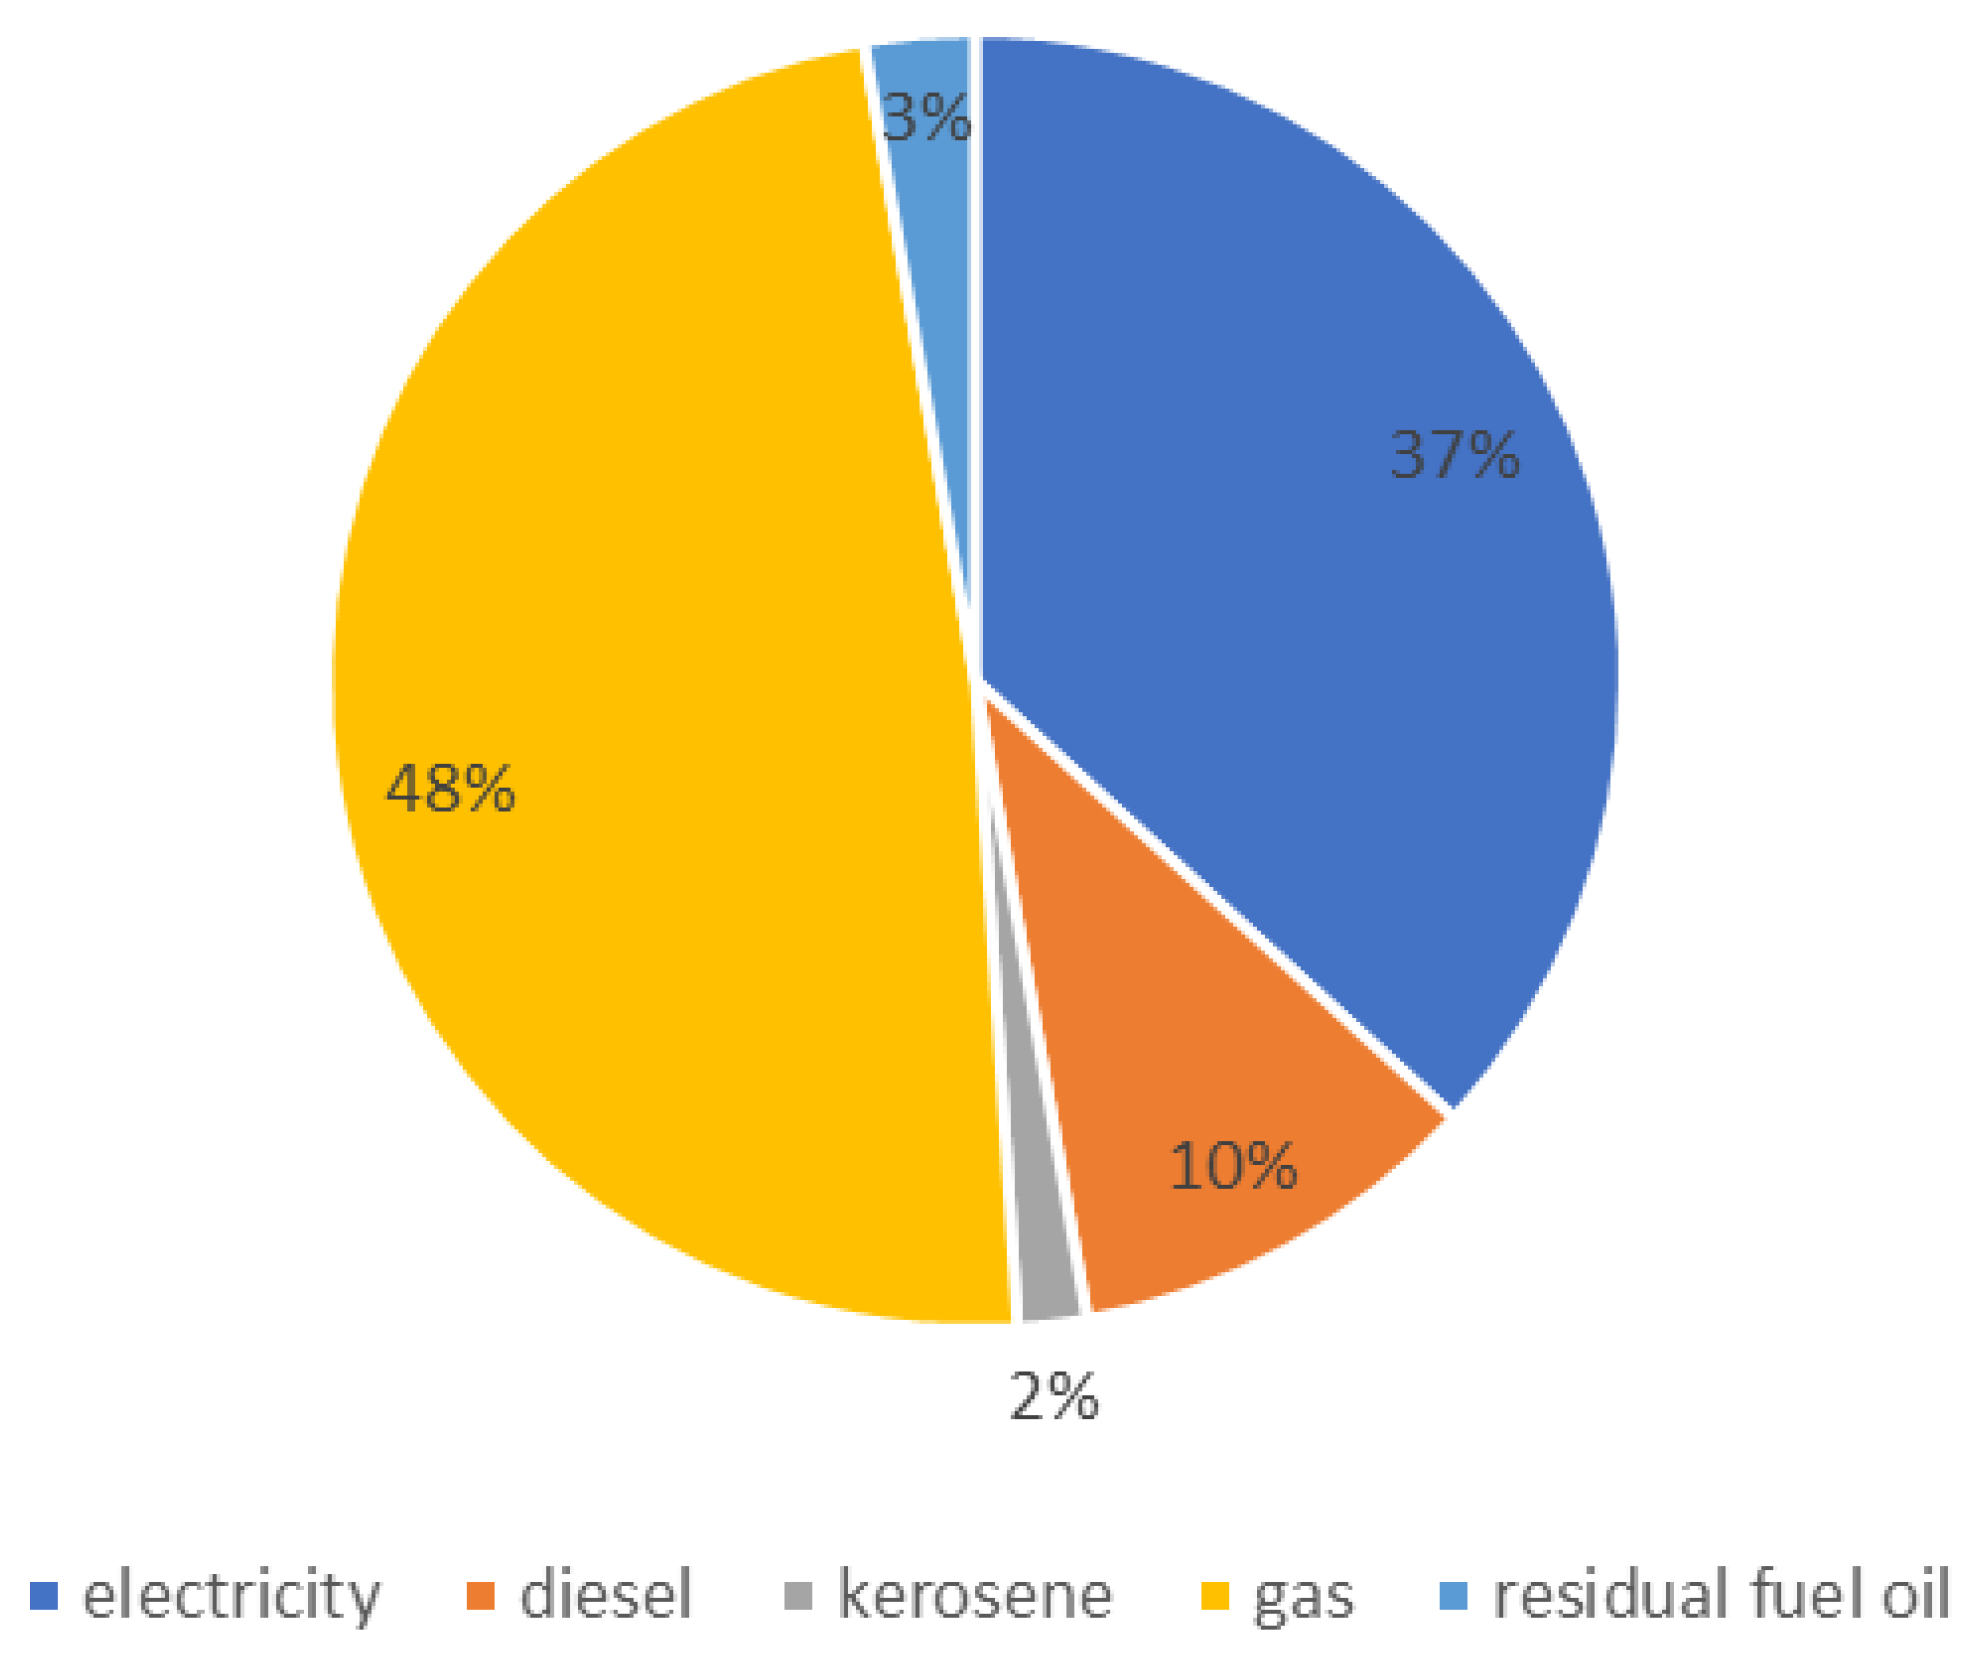
Figure 7.
Comparison surface between tax office datasets and geojson extrapolated surface
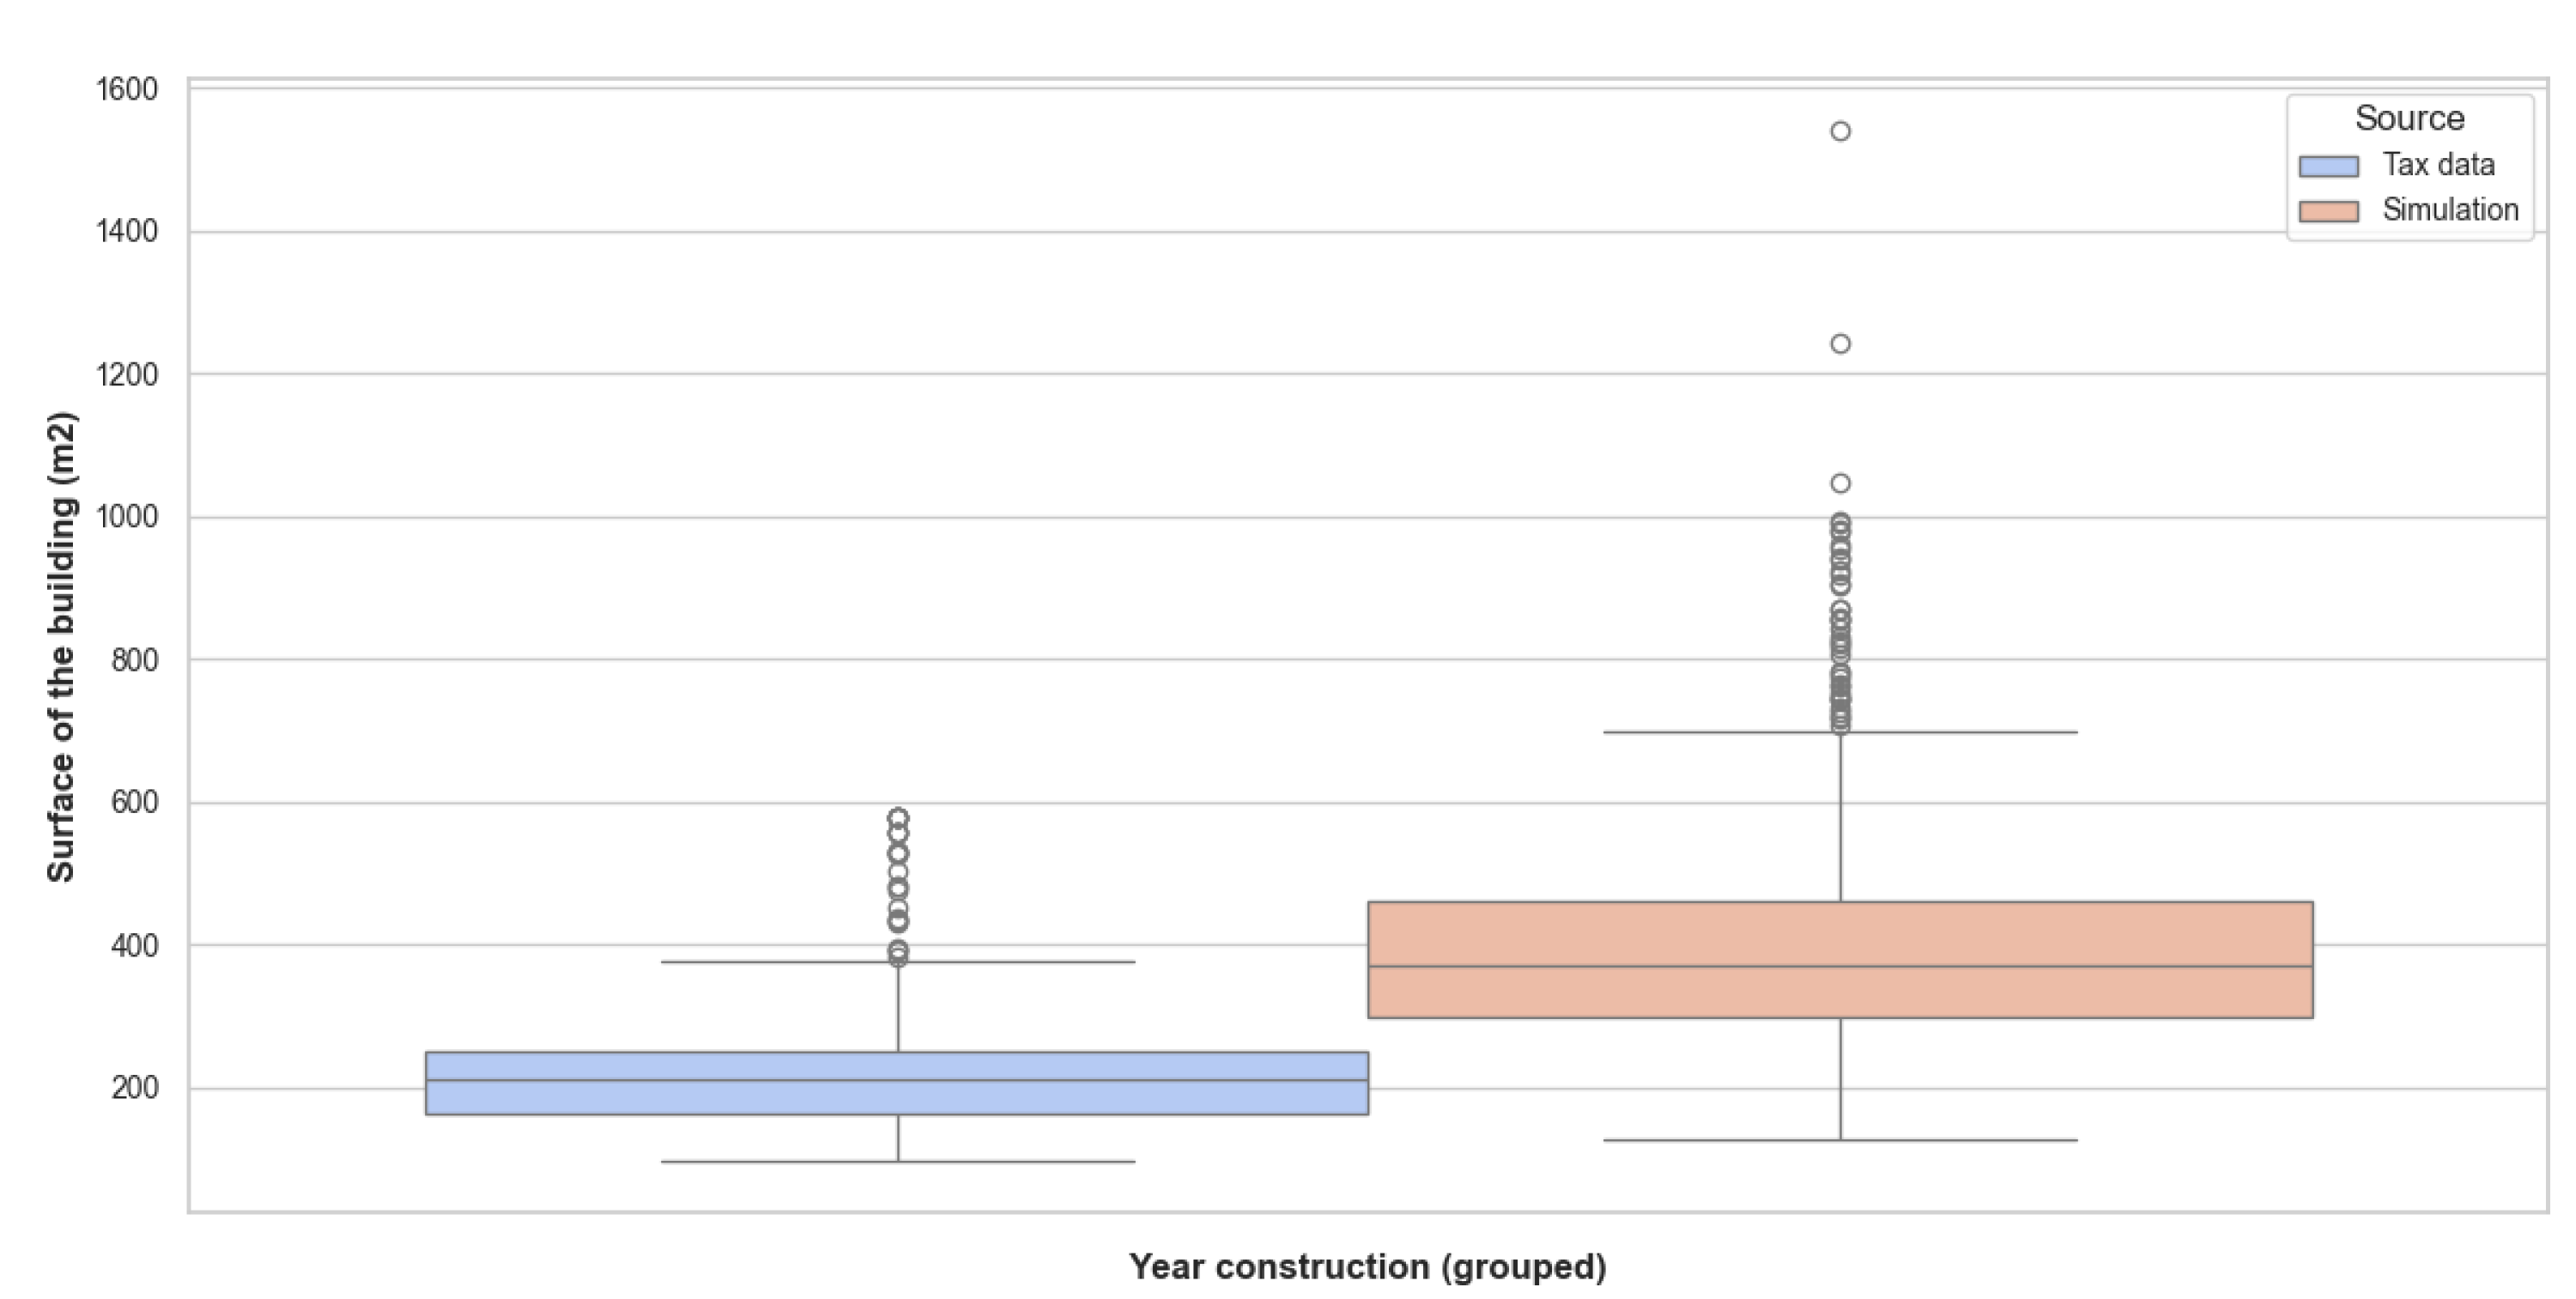
Figure 8.
Final specific energy in single-family/duplex/triplex buildings from Energuide dataset compared to simulation data
Figure 8.
Final specific energy in single-family/duplex/triplex buildings from Energuide dataset compared to simulation data
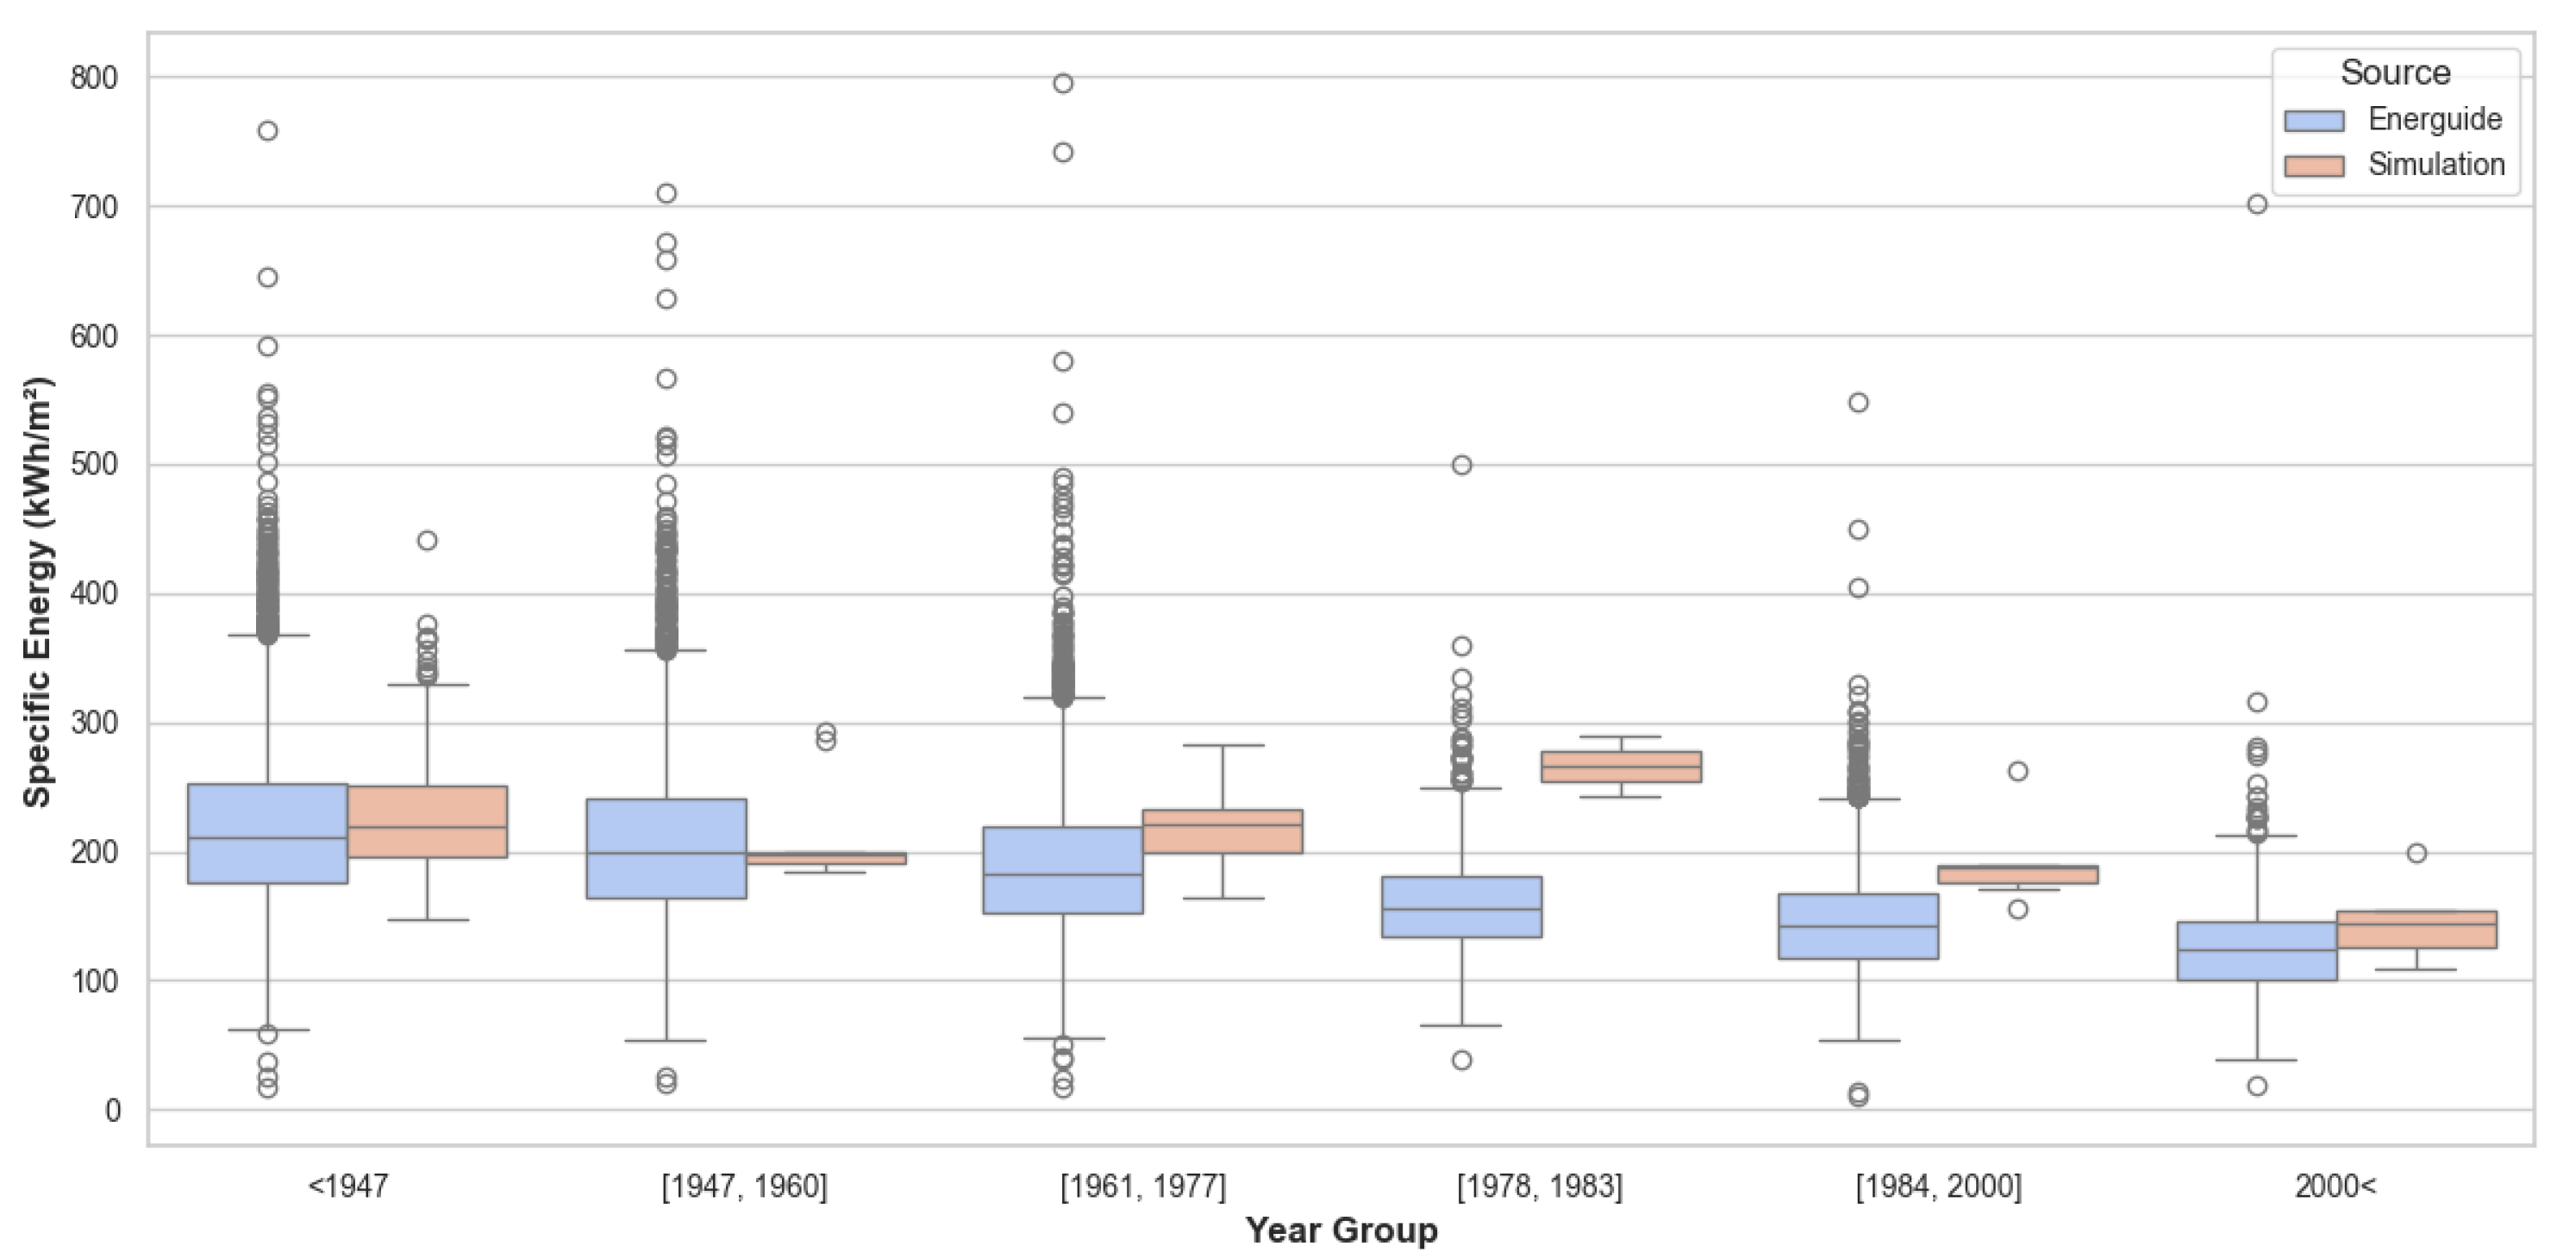
Figure 9.
Comparison surface institutional buildings between city source and extracted data
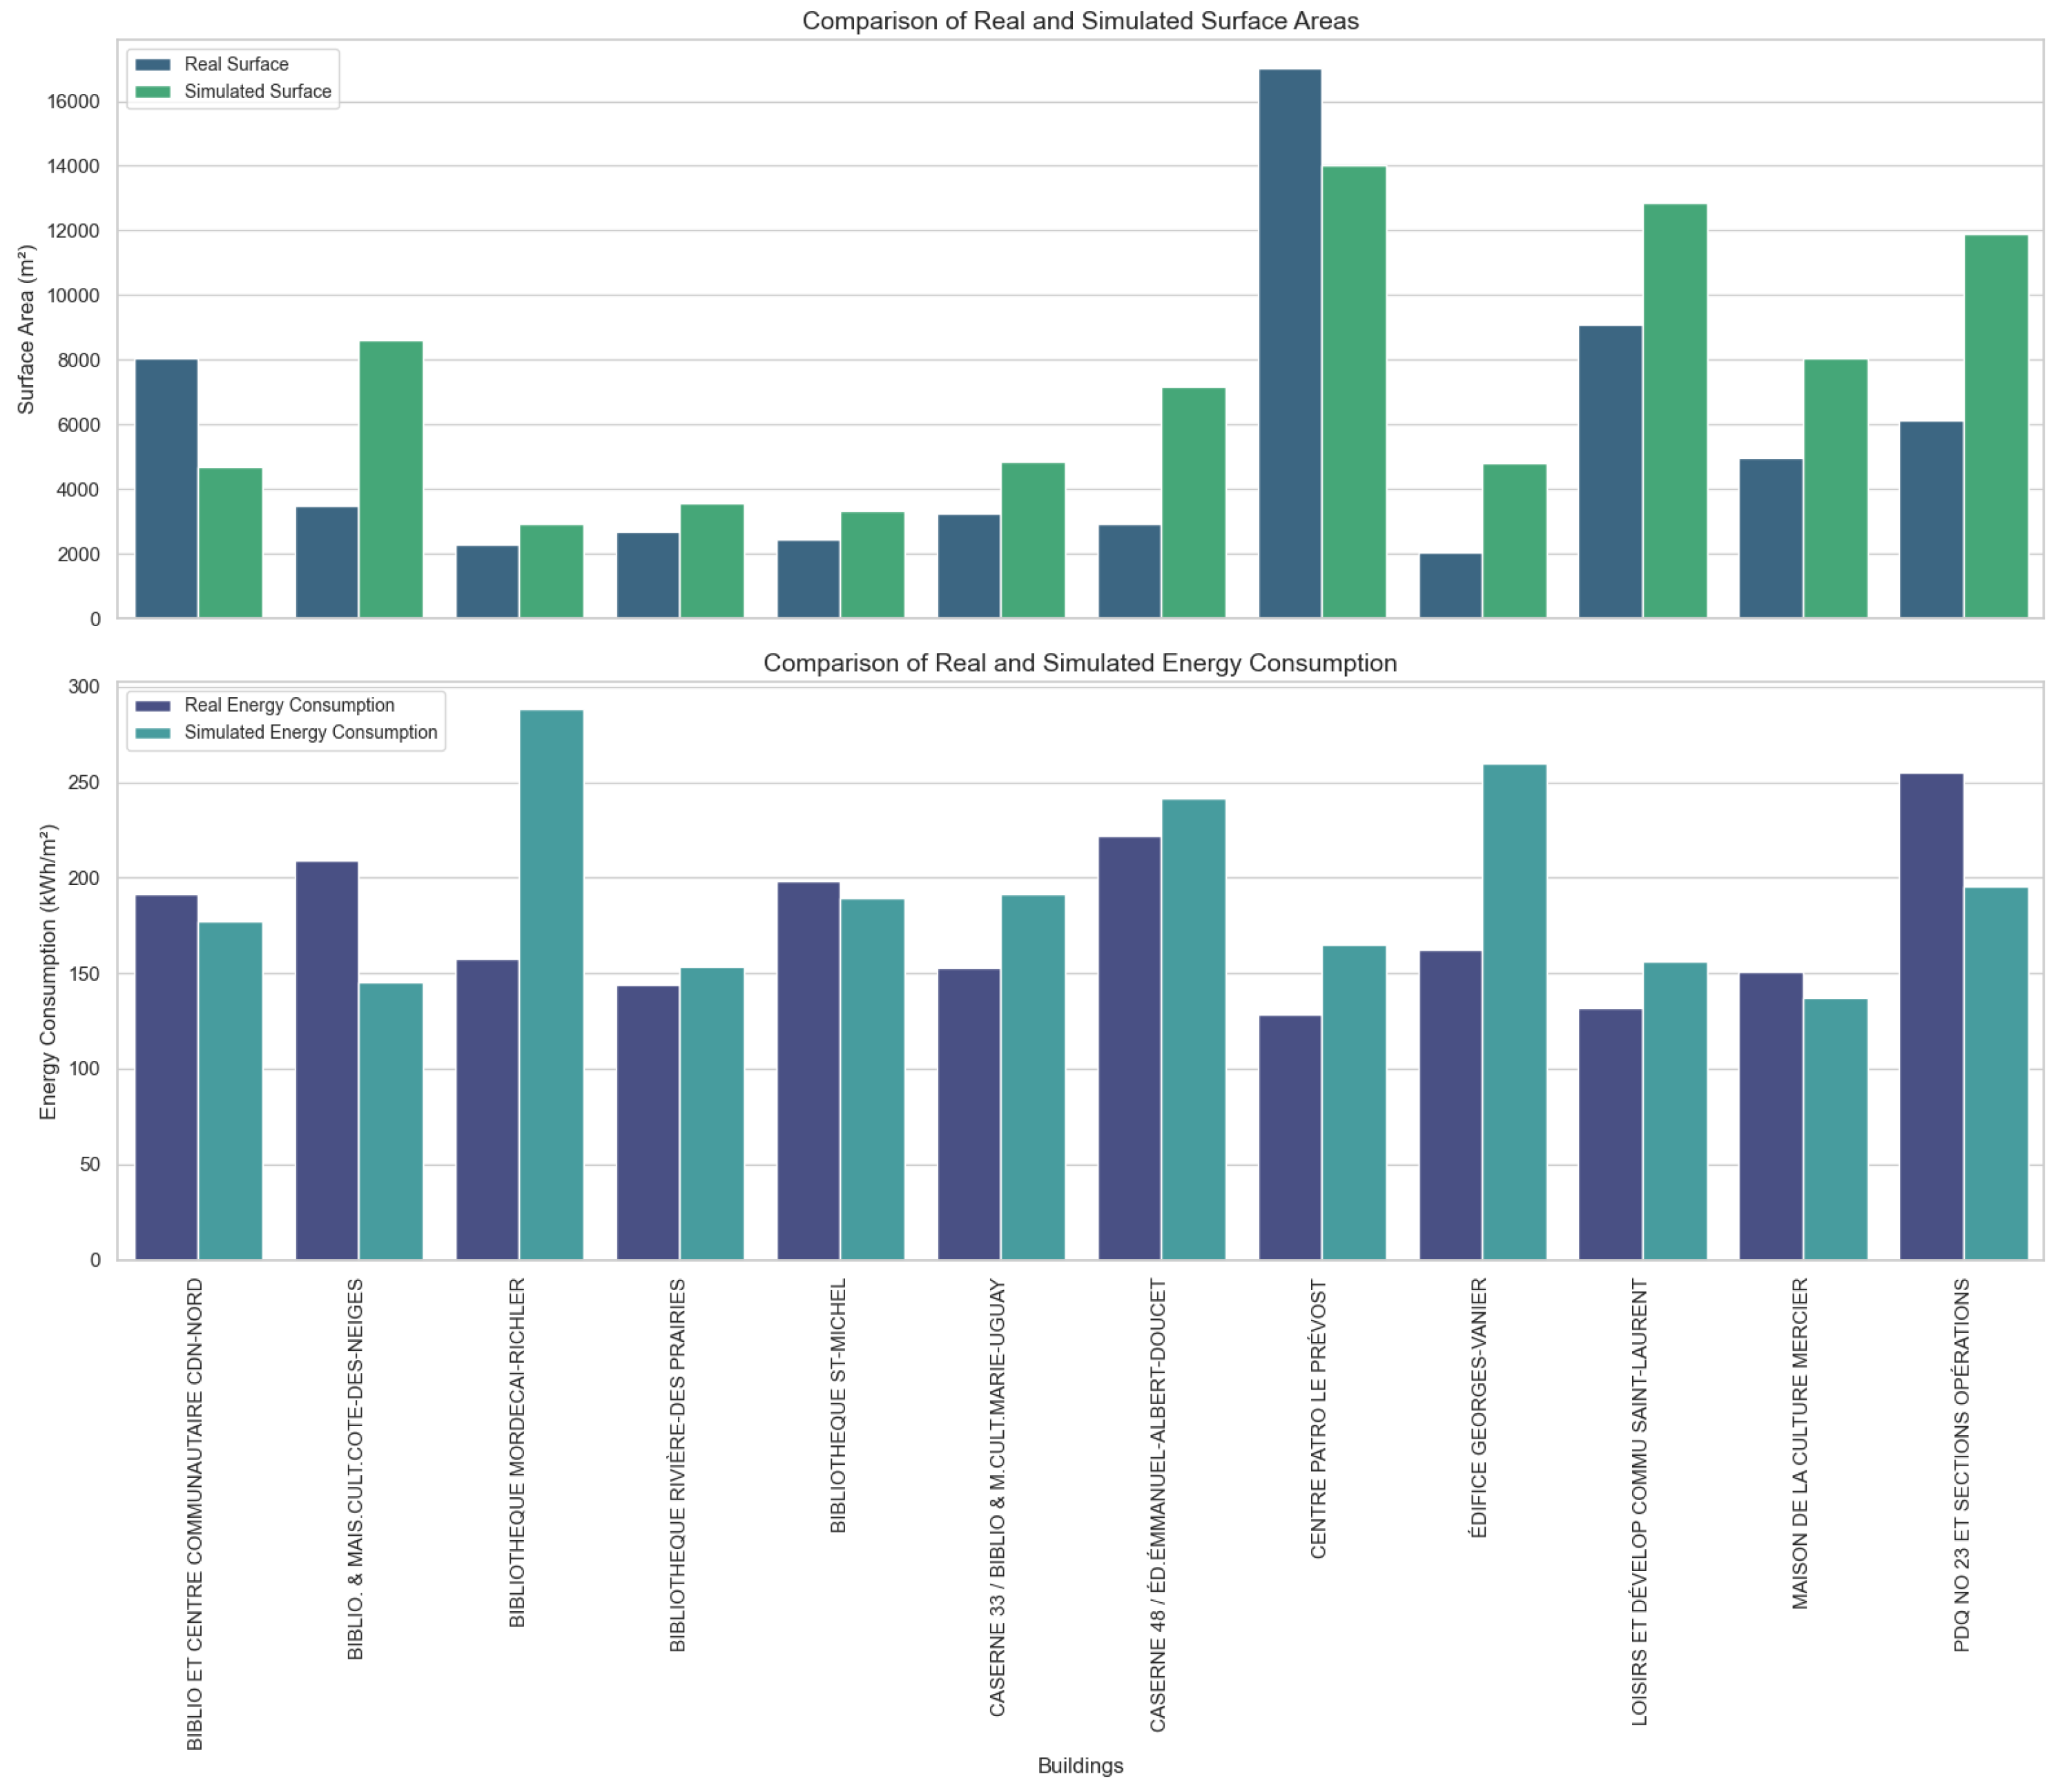
Figure 10.
Specific final energy consumption per floor area group for the two neighborhoods
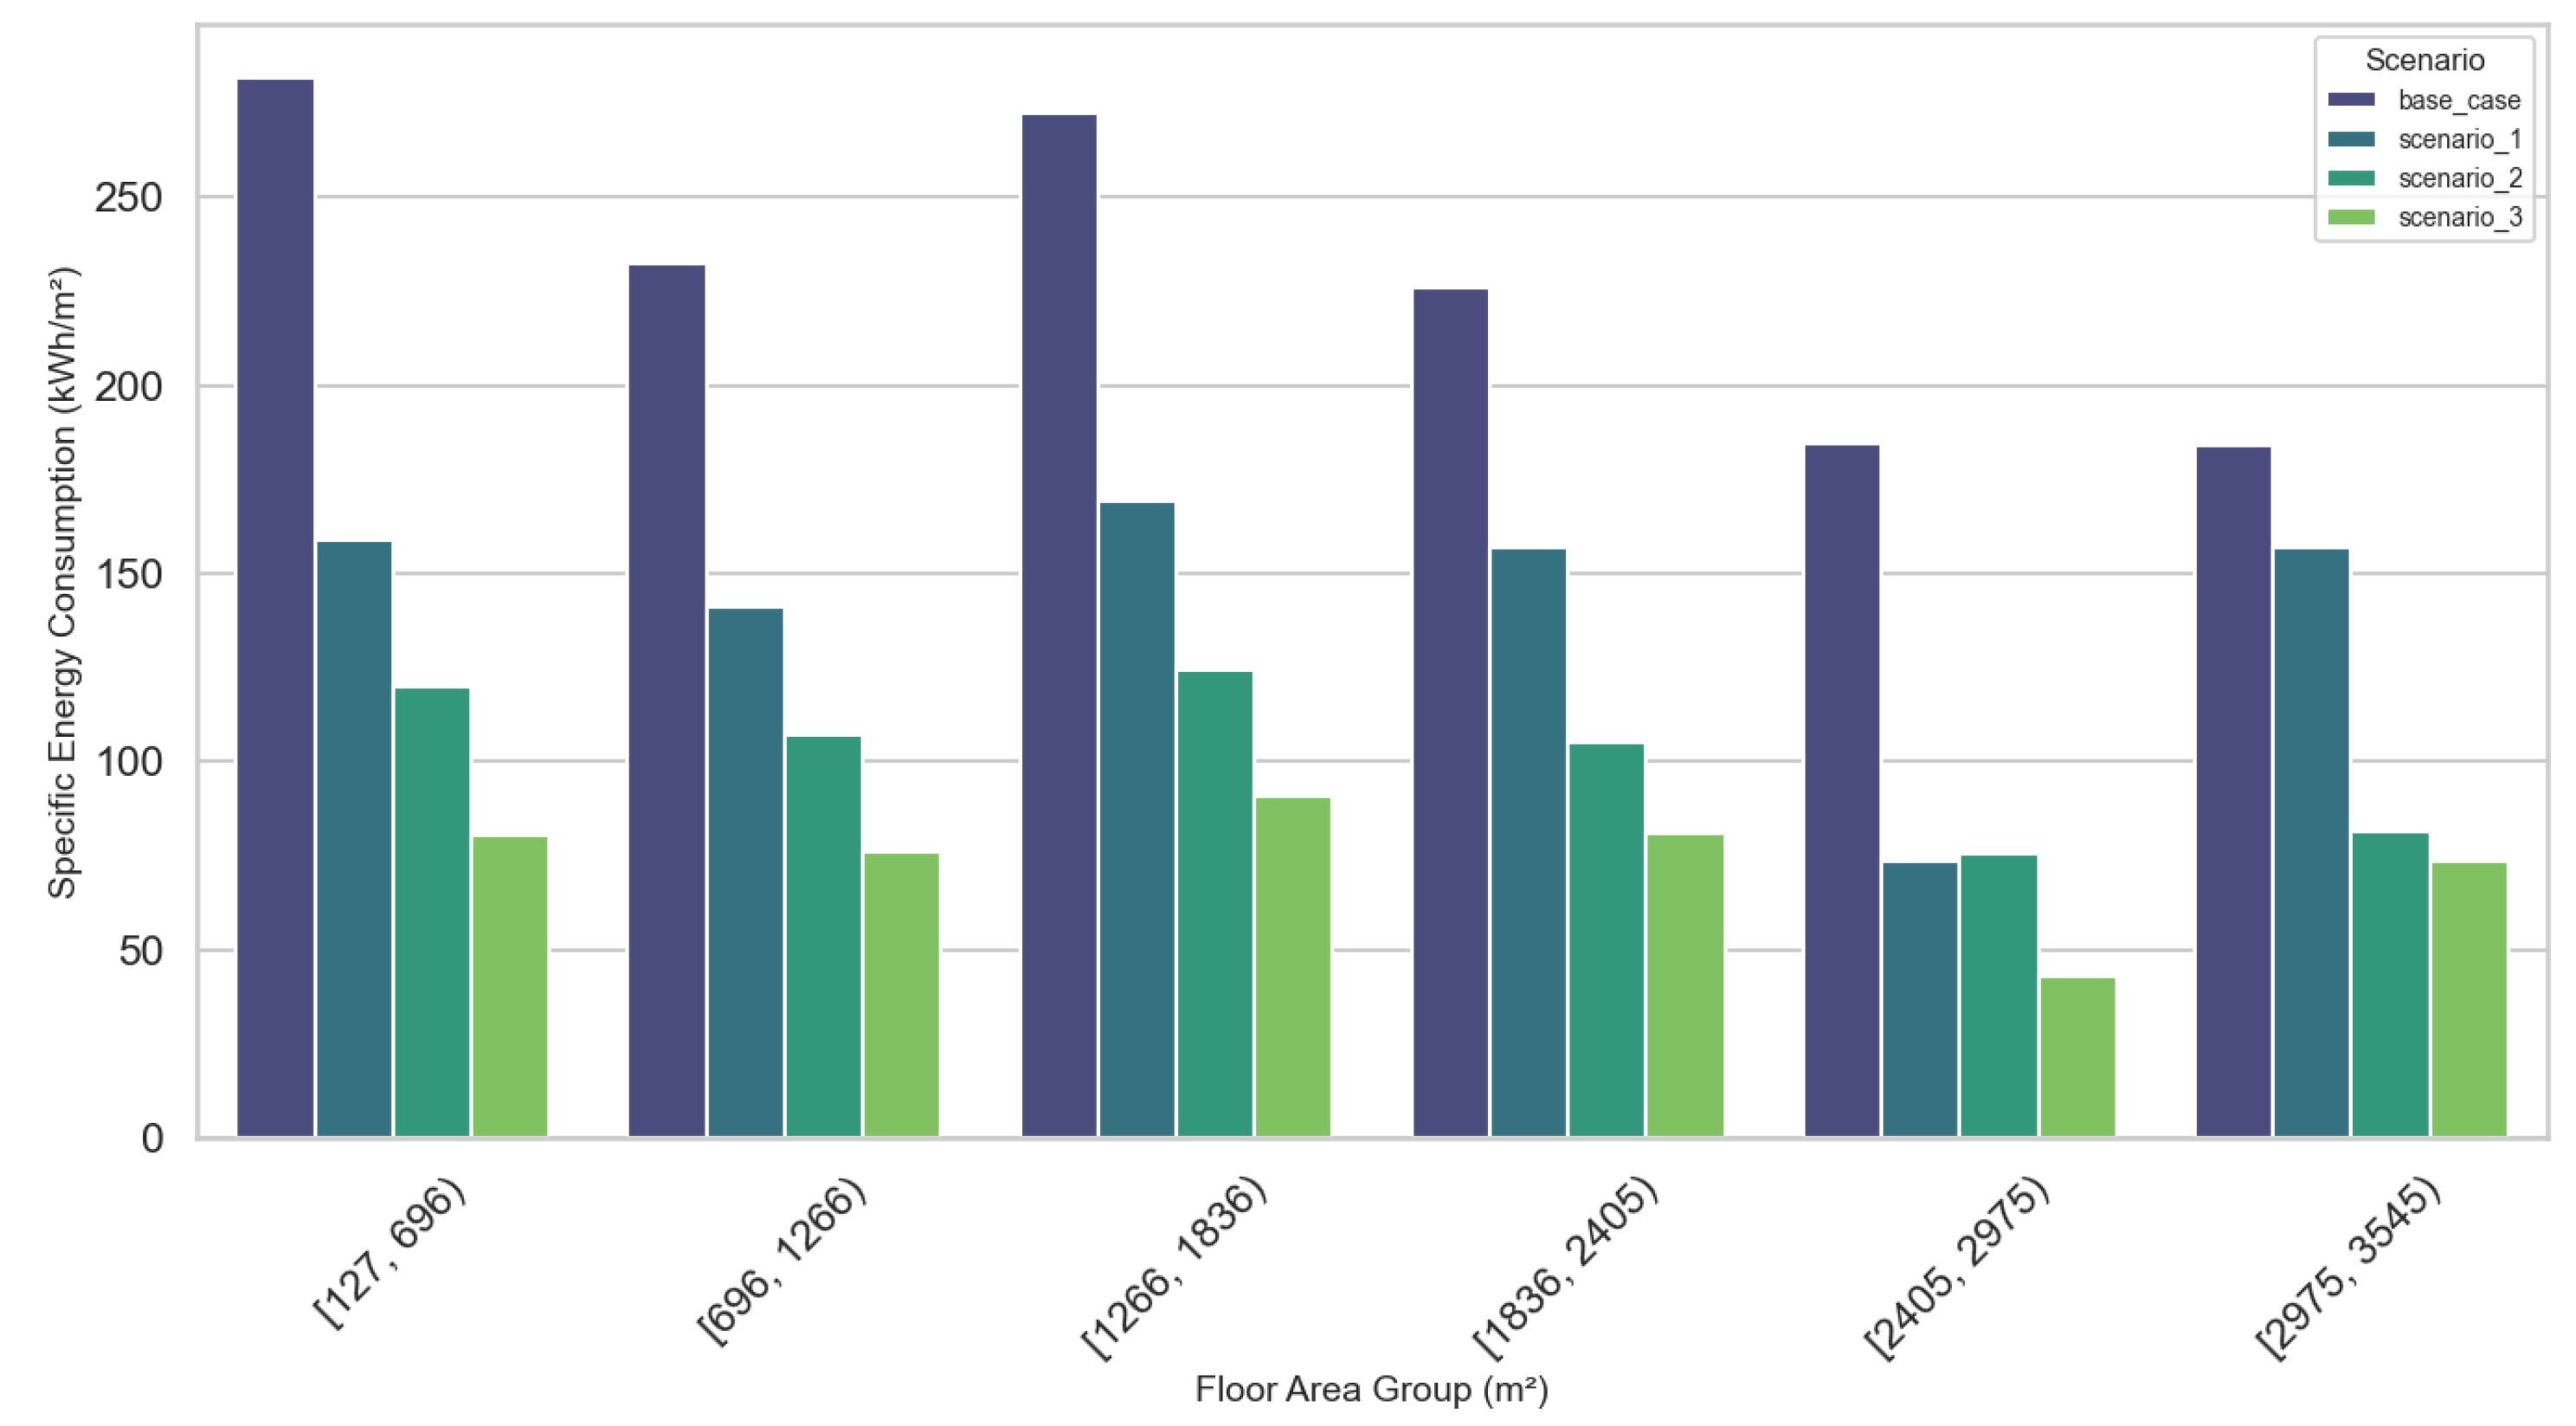
Figure 11.
Specific final energy consumption per vintage group for the two neighborhoods
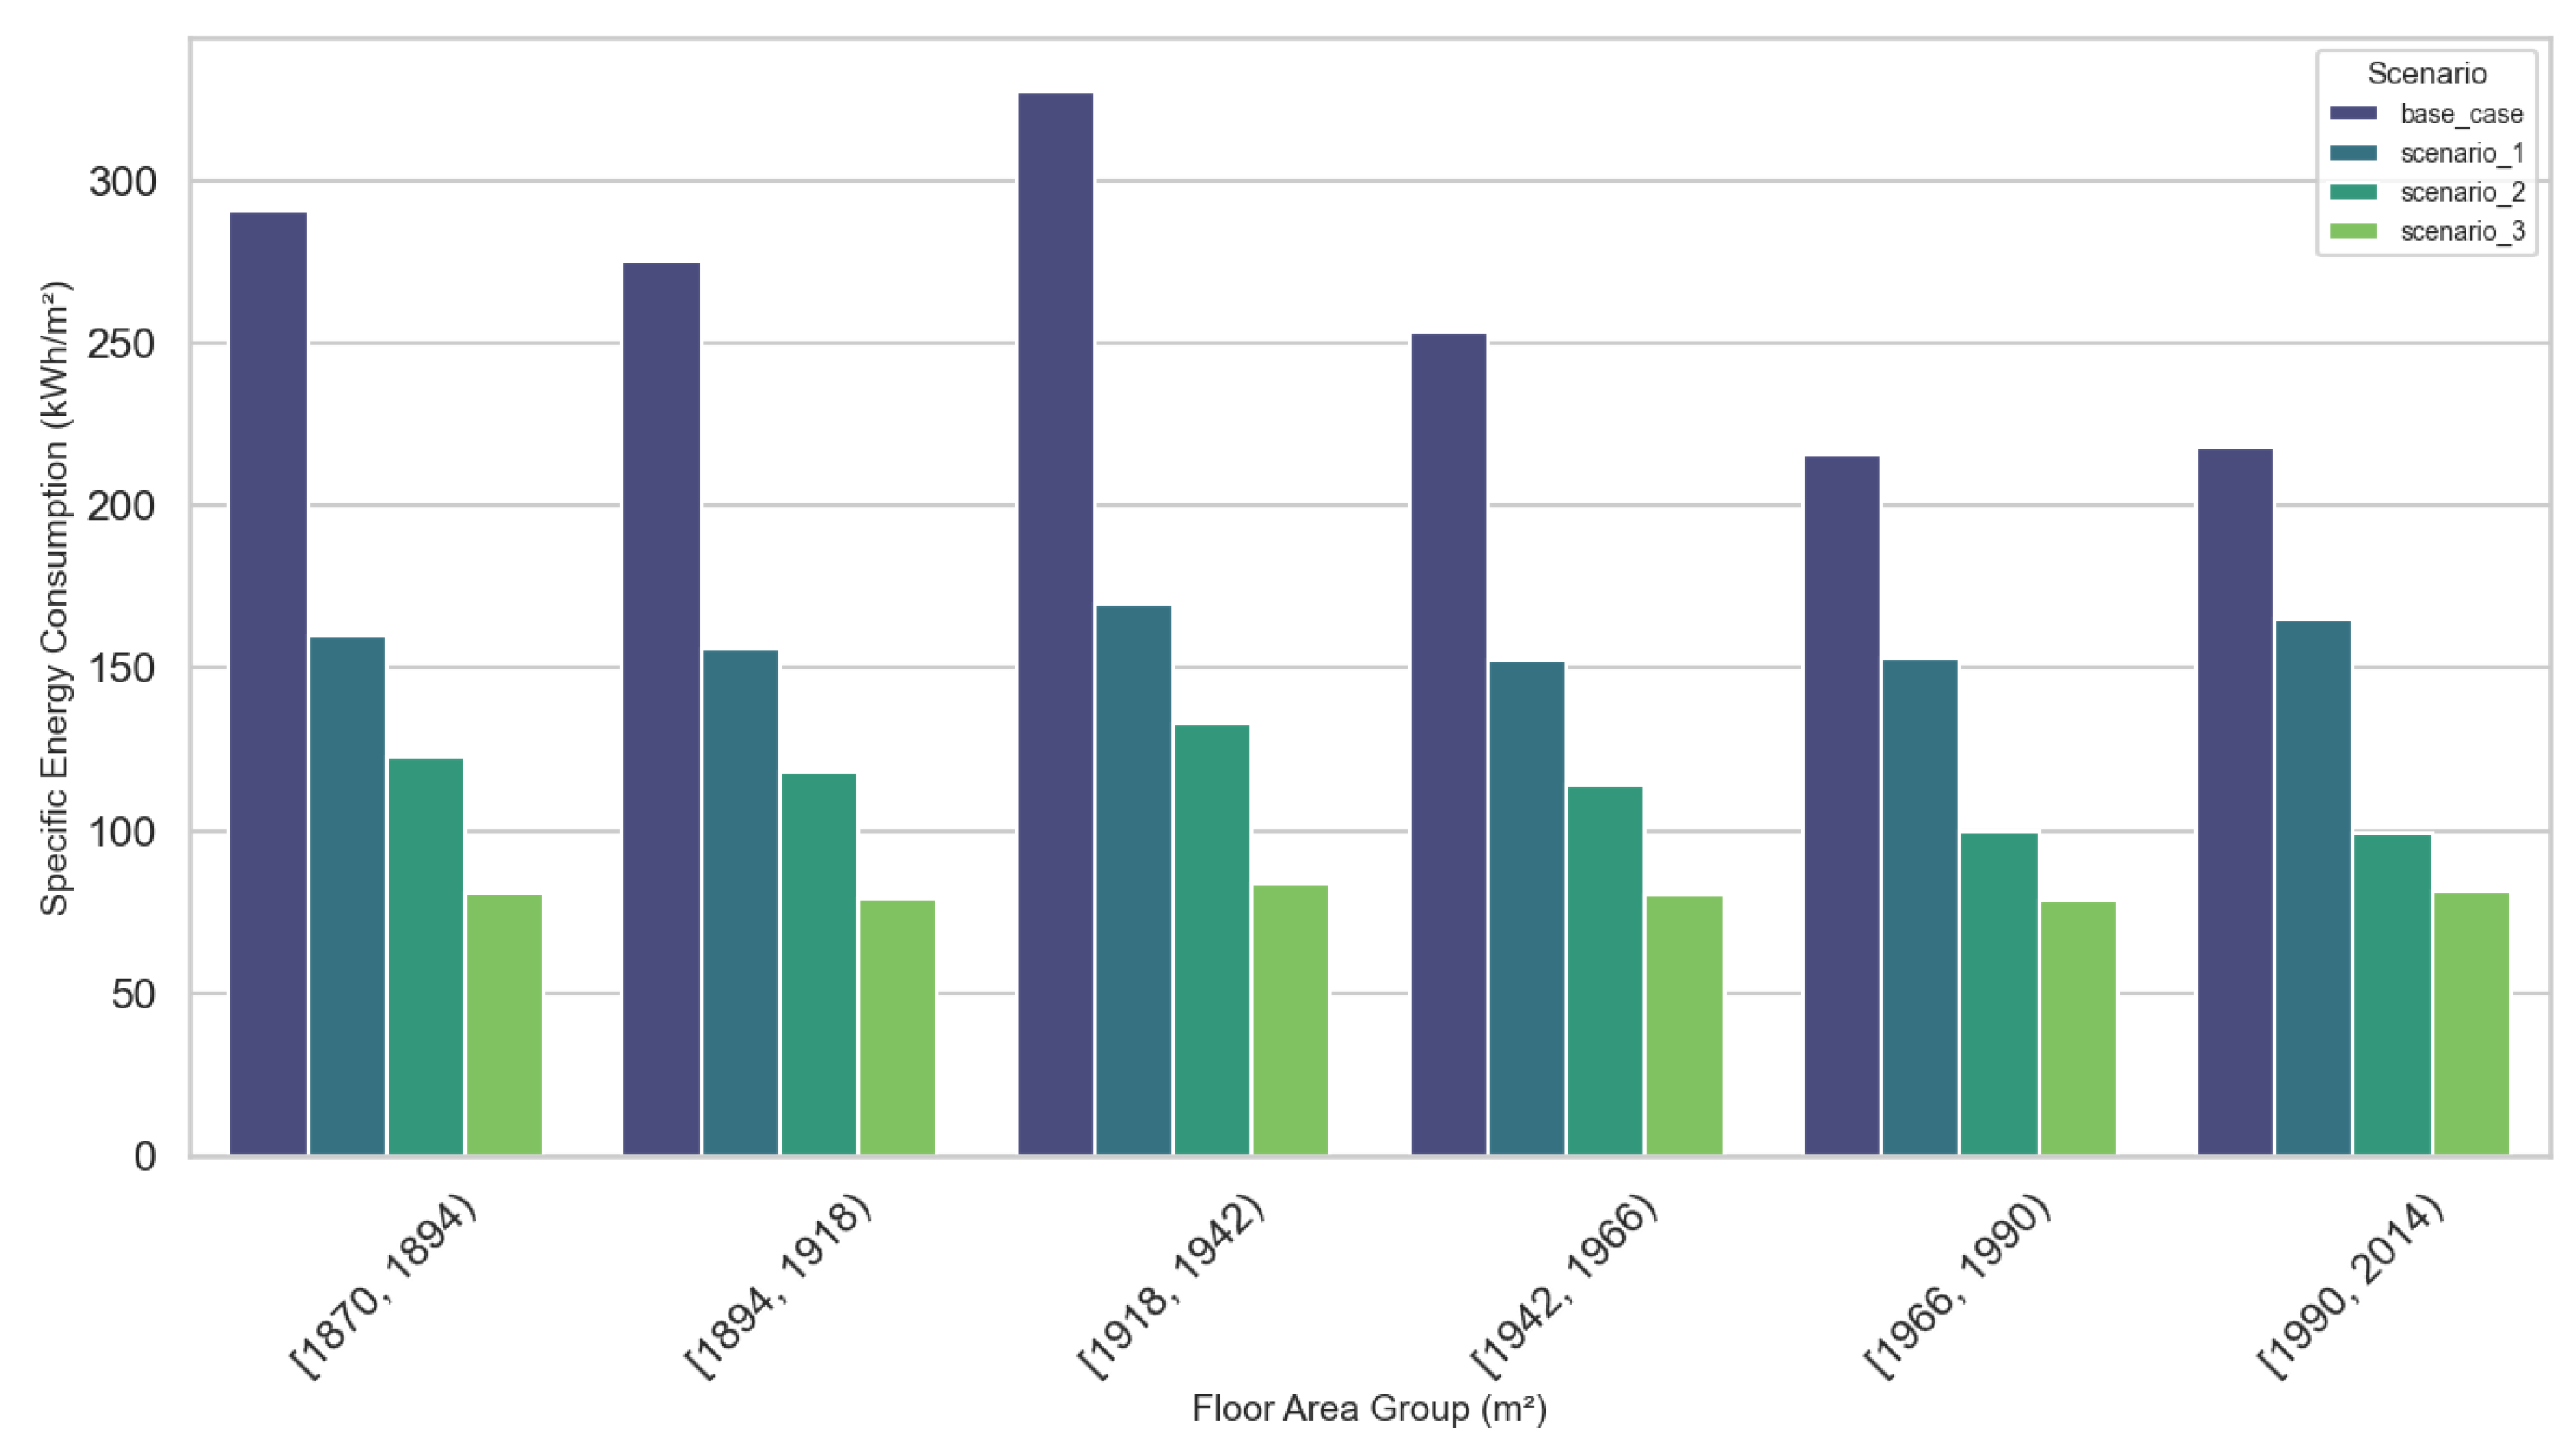
Figure 12.
Scatter plot for the different scenarios divided by retrofit scenario and neighborhood
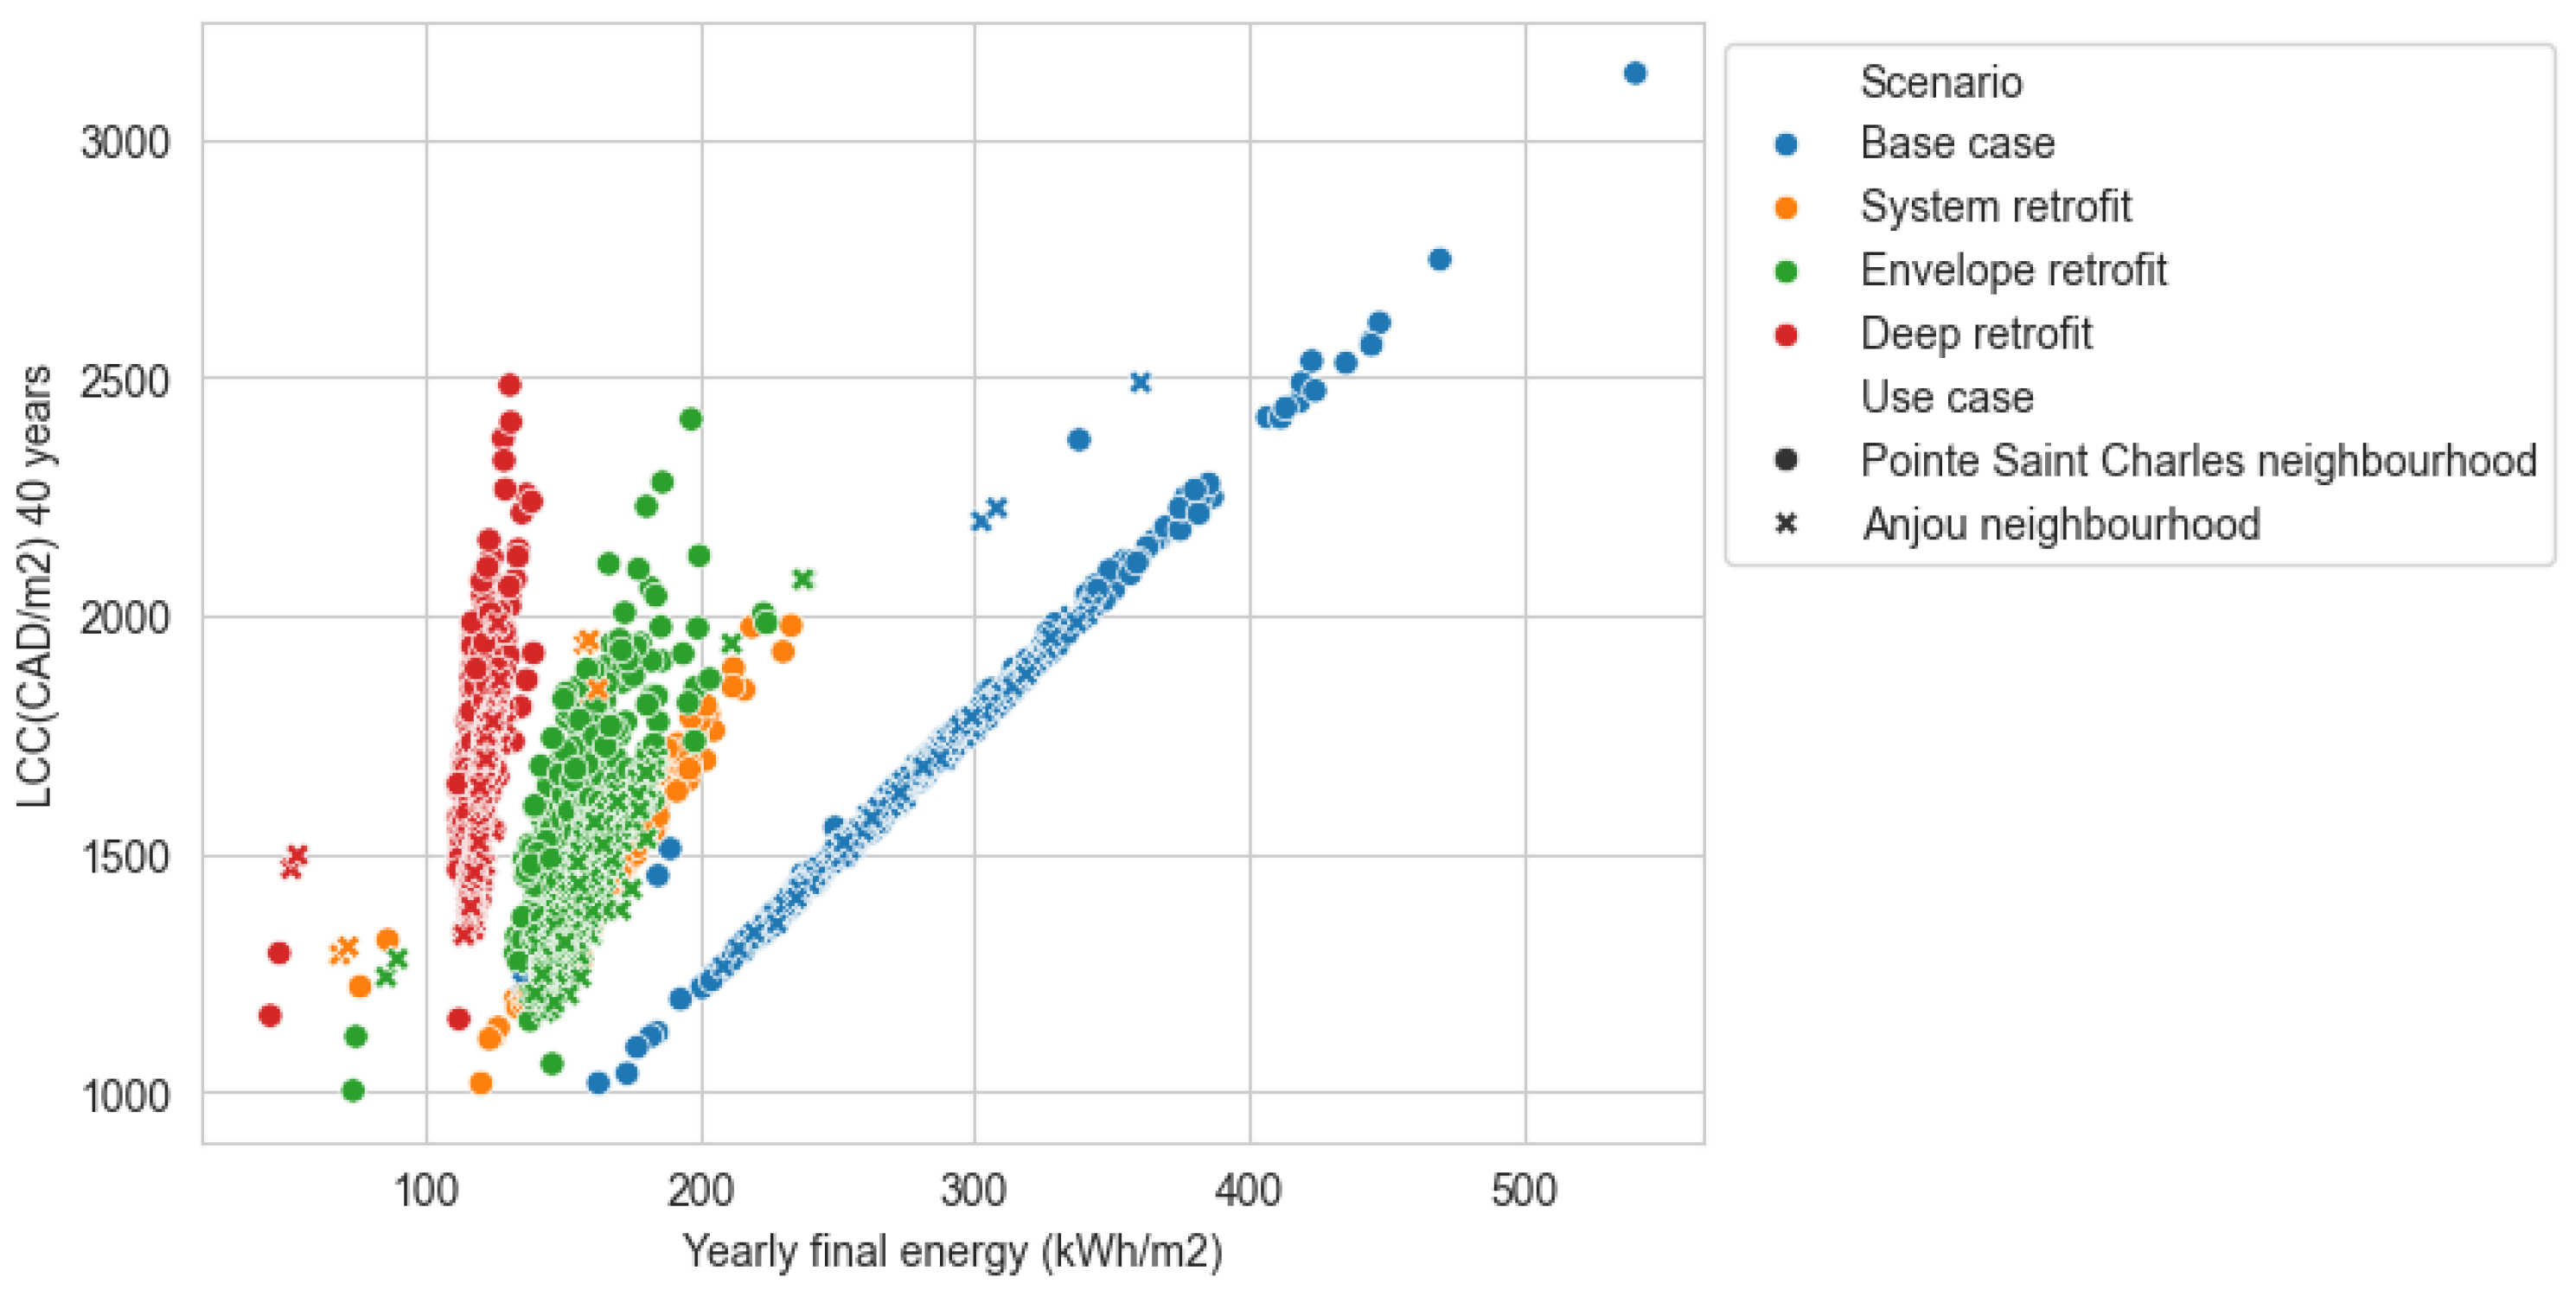
Figure 13.
Boxplot costs per categories and per vintage different scenarios
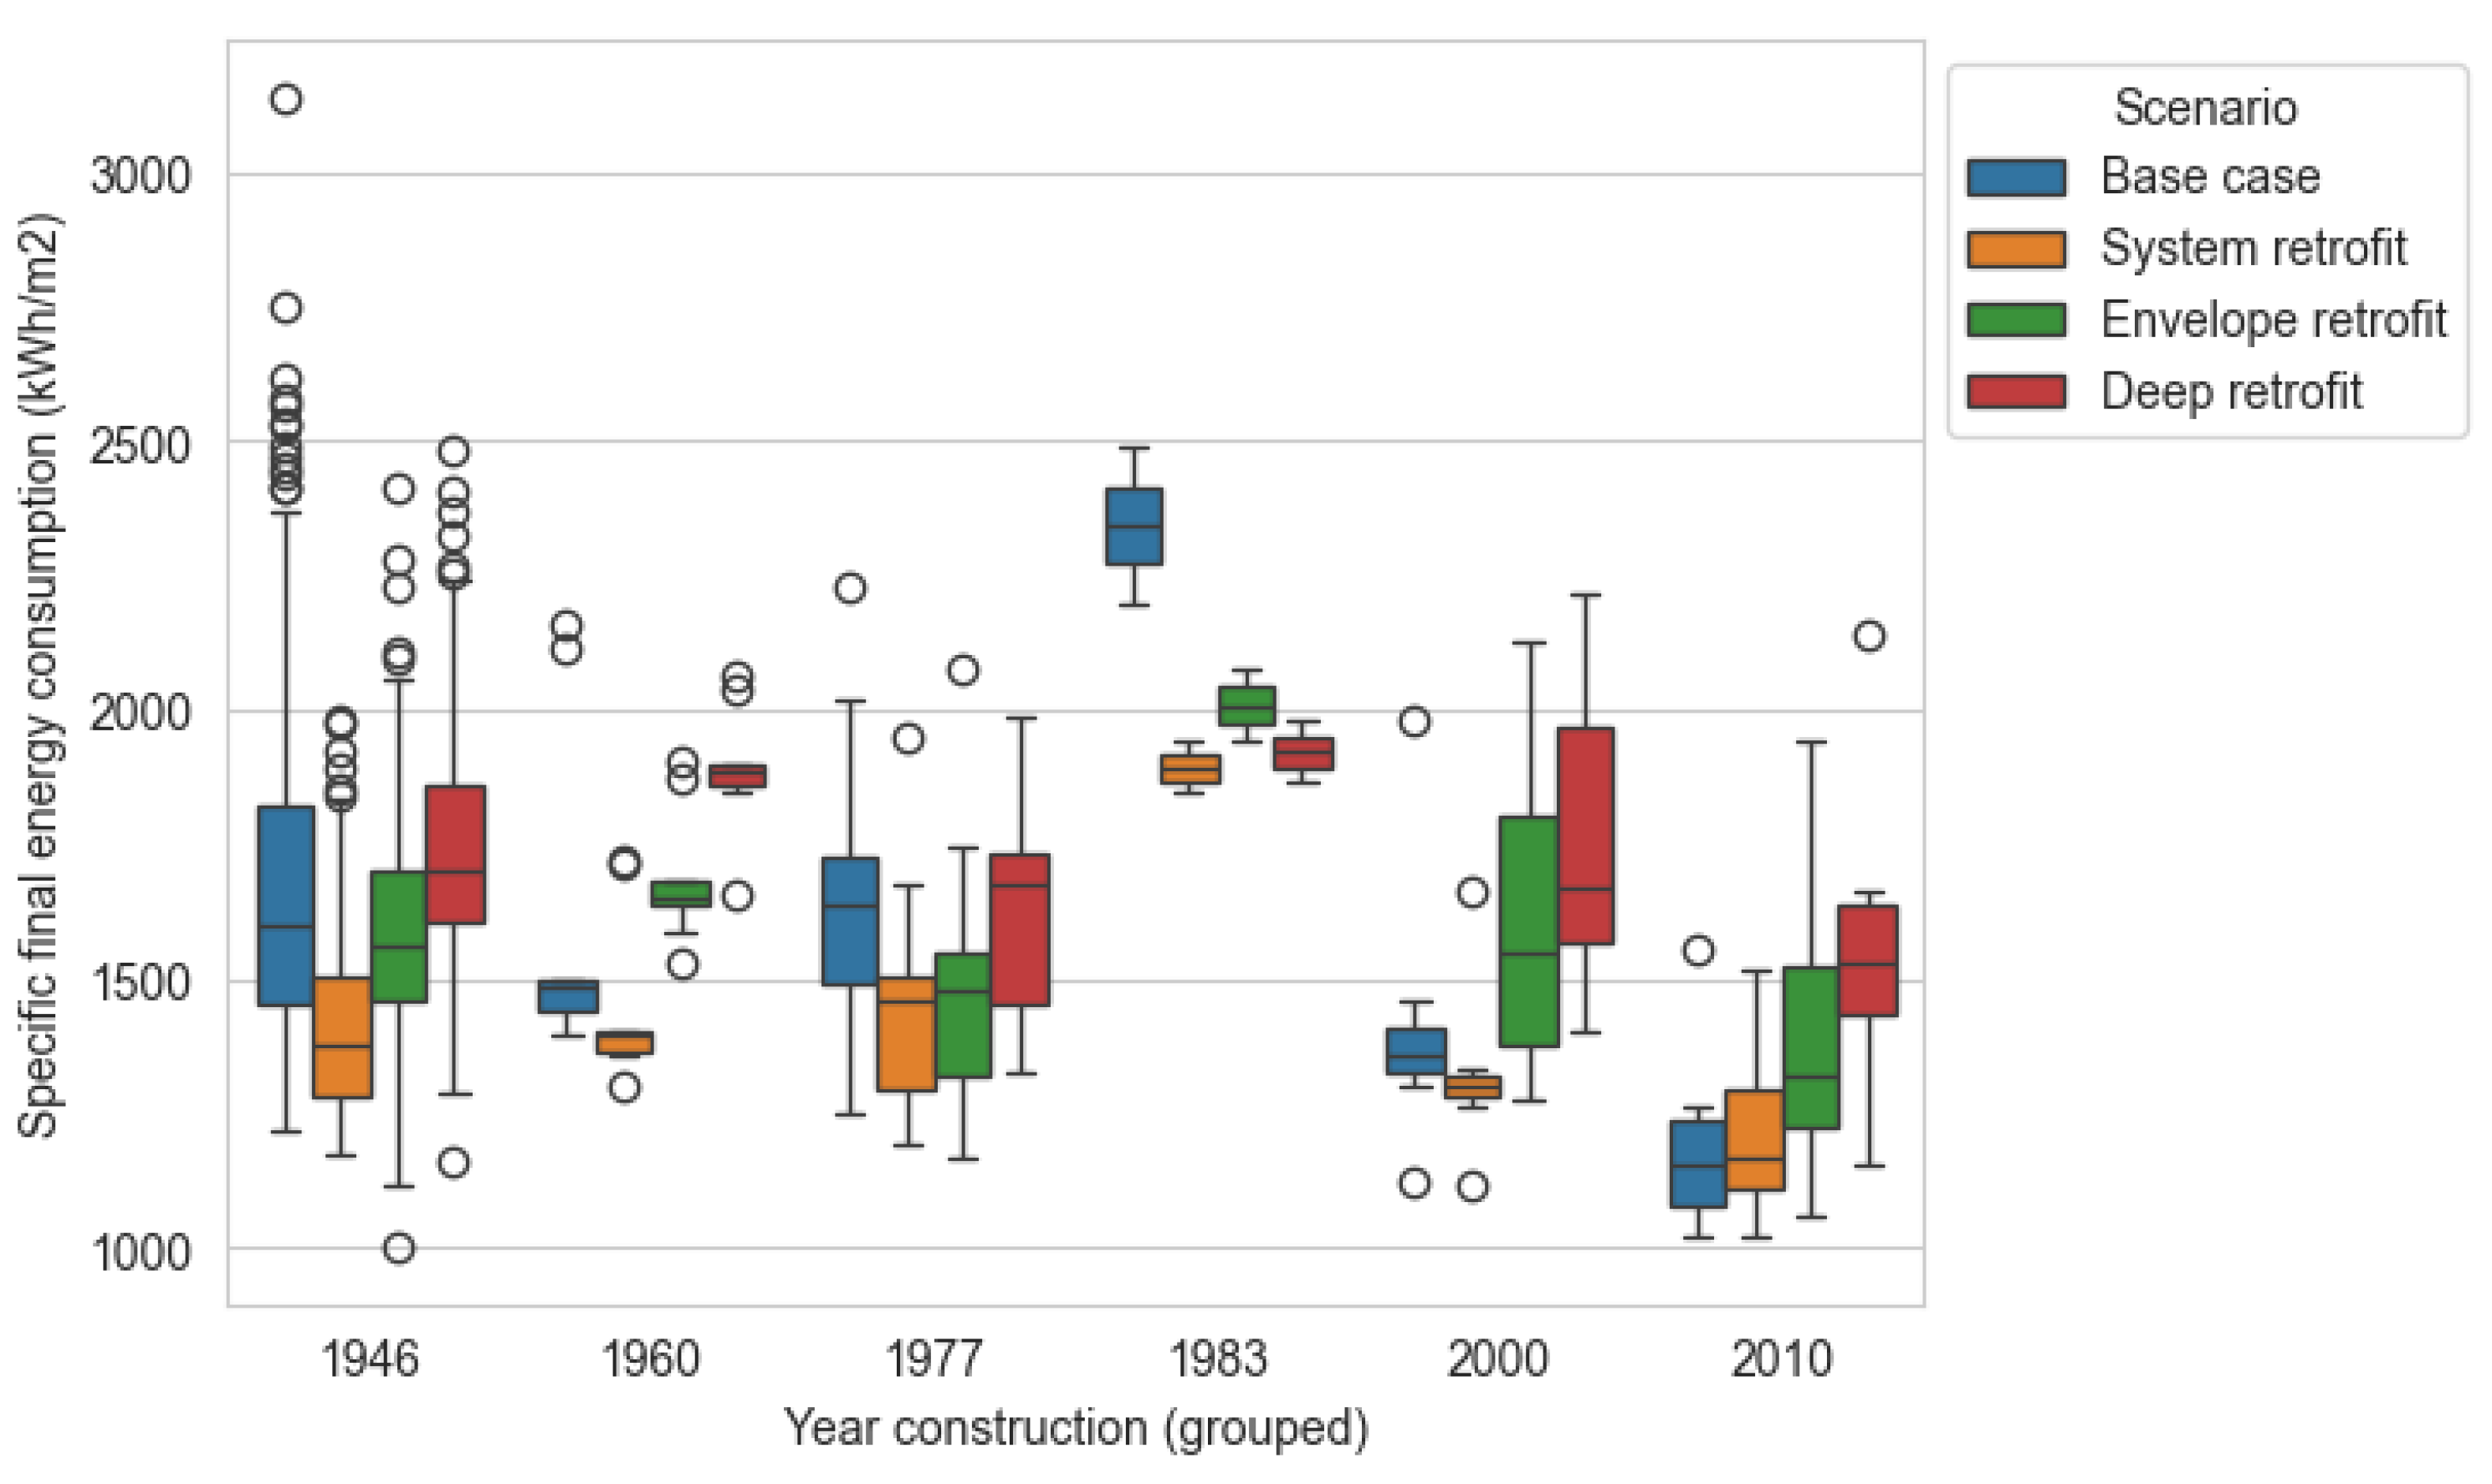
Figure 14.
Scatter plot for the individual tertiary buildings
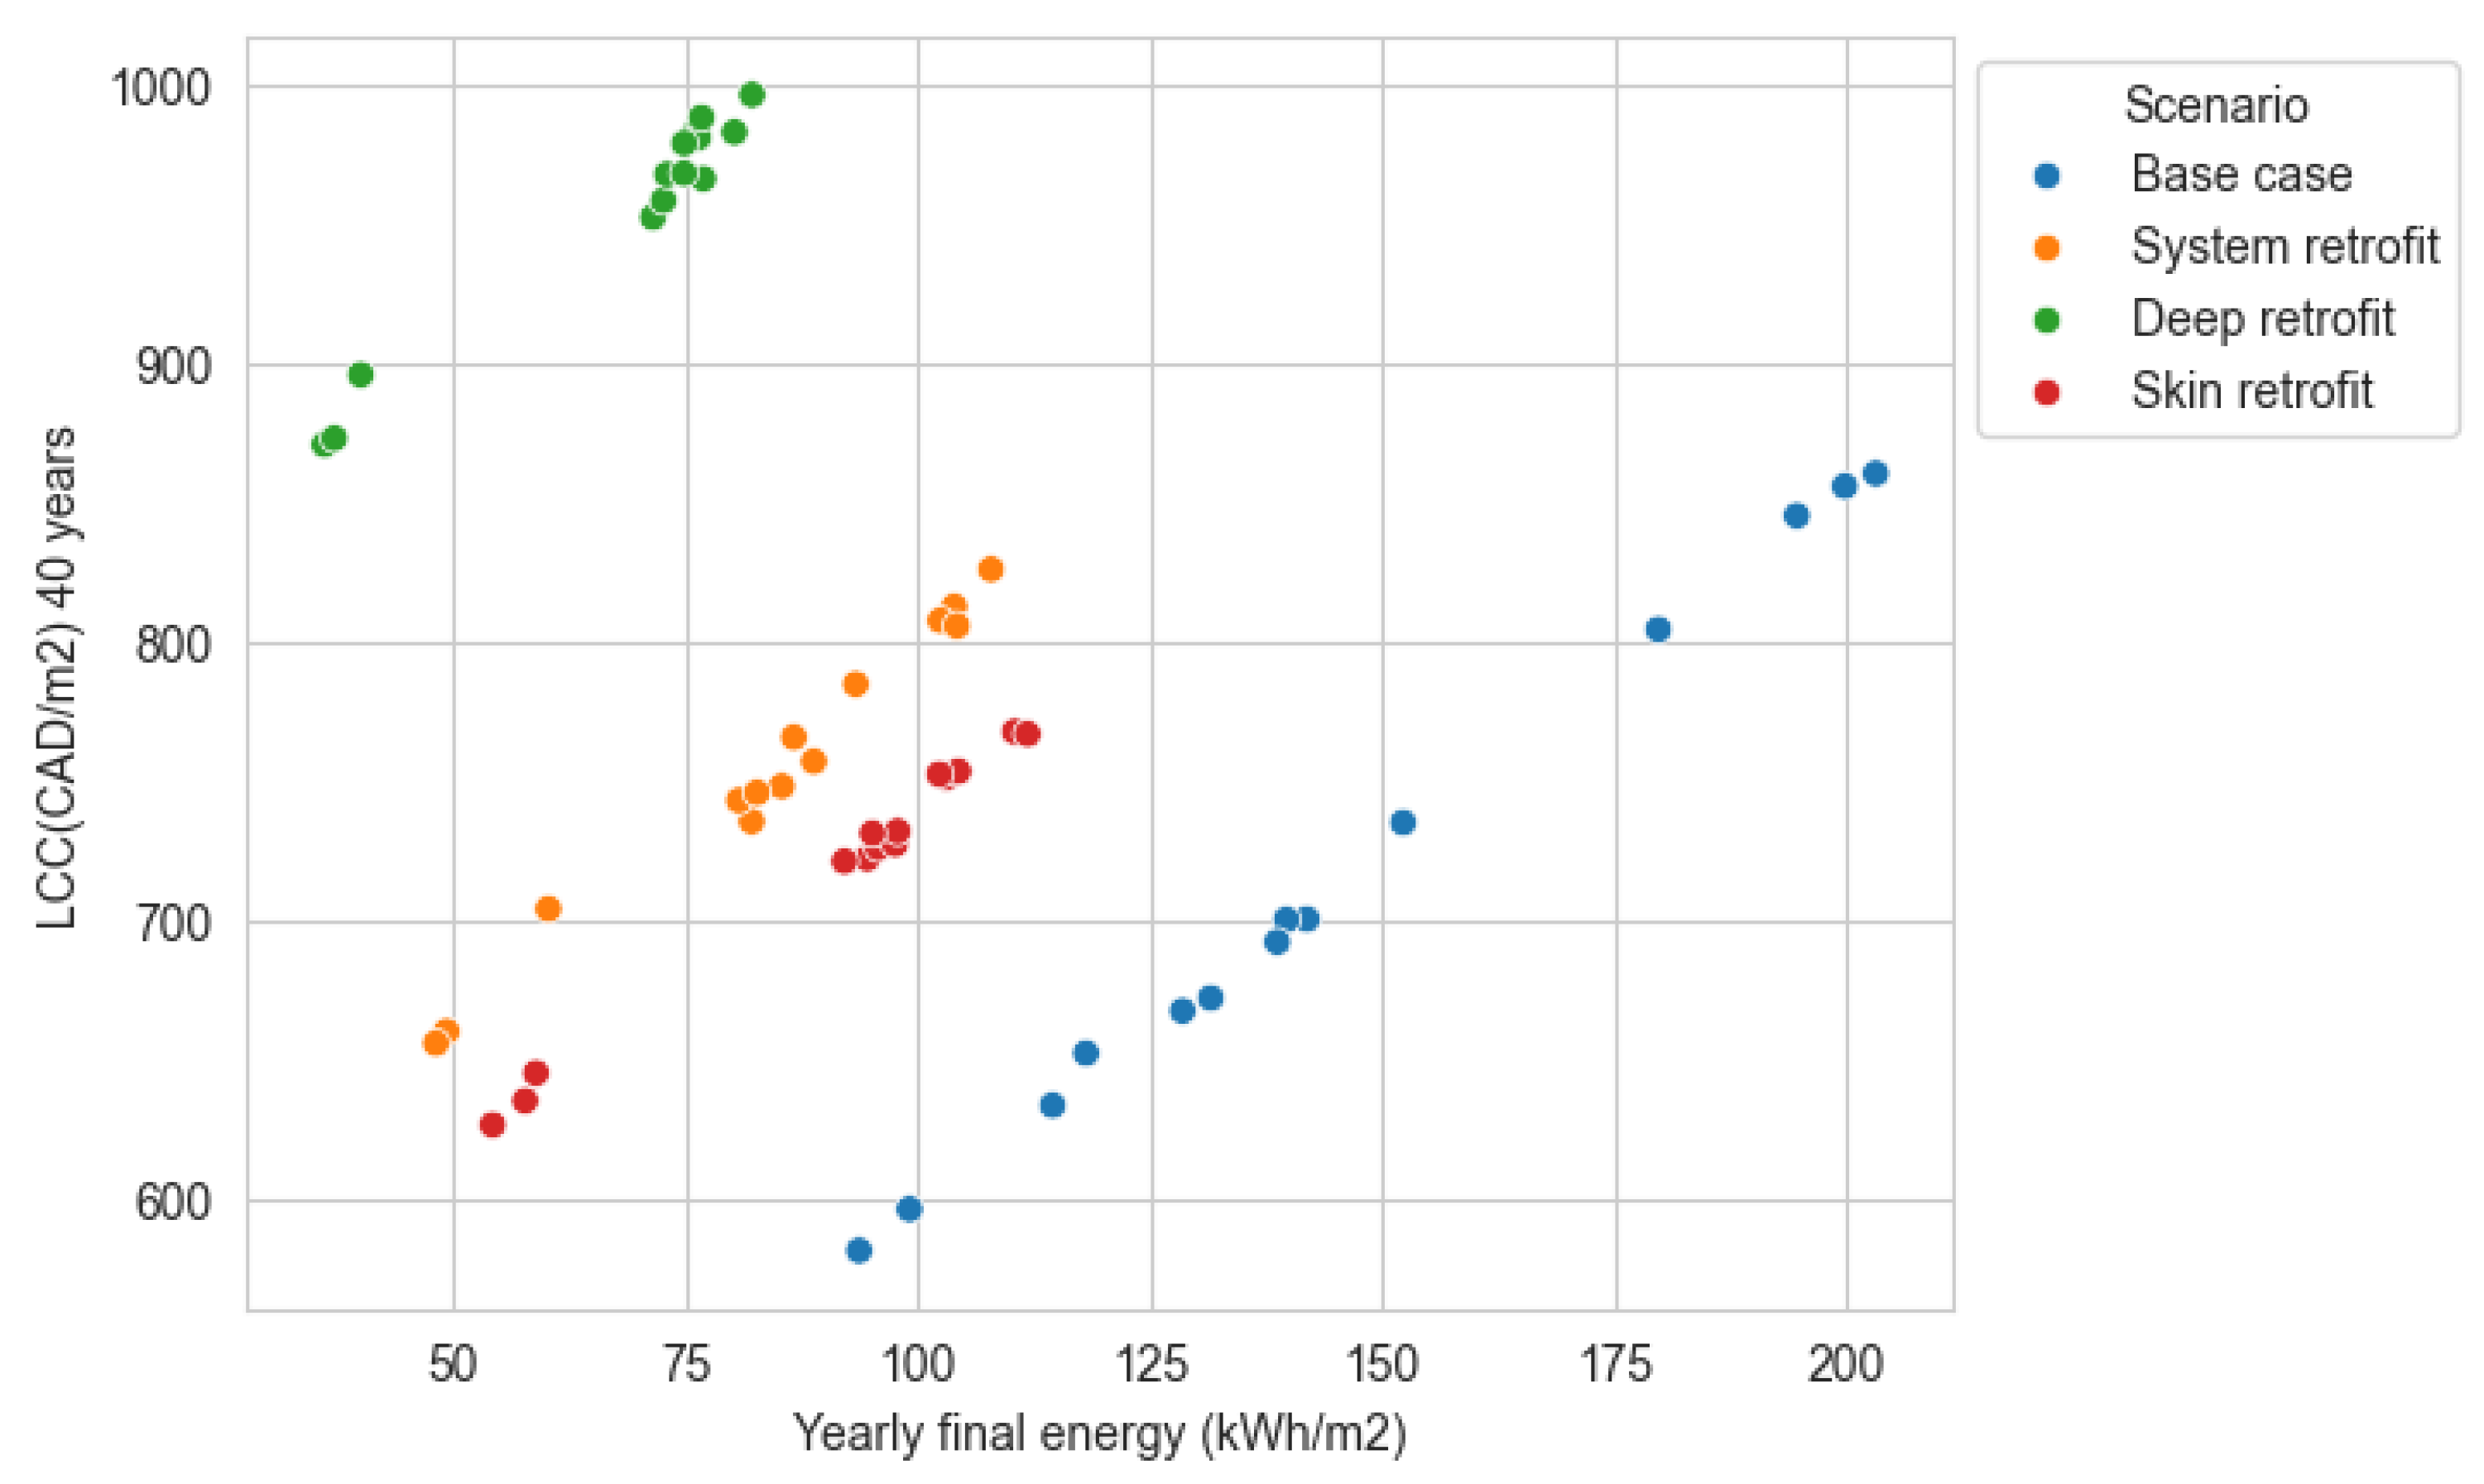
Table 1.
UBEM tools and fields of work.
| Tools | Buildings operational | Buildings Life Cycle | Transport | Microclimate | Waste | Other aspects |
|---|---|---|---|---|---|---|
| SUNTOOL | Yes | No | No | Yes | Yes | No |
| CITYSIM | Yes | No | Yes | No | No | No |
| SIMStadt | Yes | Yes | No | No | No | No |
| UMI | Yes | Yes | Yes | Yes | Yes | Food production, daylighting |
| CityBES | Yes | No | Yes | No | No | No |
| OpenIDEAS | Yes | No | No | No | No | No |
| CEA | Yes | Yes | Yes | Yes | Yes | No |
| UrbanOPT | Yes | No | No | No | No | Daylighting |
| TEASER | Yes | No | No | No | No | No |
| Dest-Urban | Yes | No | No | No | No | No |
| AutoBPS | Yes | No | No | No | No | No |
| UECC | Yes | No | No | No | No | No |
| CityBEM | Yes | No | No | No | No | No |
Table 2.
UBEM tools and input formats(based on all the mentioned references).
| Tool | Geospatial Input formats accepted | Constructive inputs | Usage inputs defined | Shading analysis | Microclimate possibilities | Other aspects |
|---|---|---|---|---|---|---|
| SUNTOOL | Bespoke interface | To be defined by users | Static, deterministic and probabilistic | Yes, SRA | Yes | No |
| CITYSIM | CityGML, EnergyADE | To be defined by user, based on archetypes | Static, deterministic | Yes, SRA | No | No |
| SIMStadt | CityGML, EnergyADE | To be defined by user, based on archetypes | Static, deterministic | Yes, SRA | No | No |
| UMI | Rhino3D | To be defined by user, based on archetypes | Static, deterministic | Yes, based on Eplus | Yes (UWG) | Food production, daylighting |
| CityBES | CityGML, EnergyADE | To be defined by user, based on individual buildings | Static, deterministic | Yes, based on Eplus | No | No |
| OpenIDEAS | CityGML, EnergyADE | To be defined by user, based on archetypes | Static, deterministic and probabilistic | Not well explained and detailed (missing?) | No | No |
| CEA | CityGML, osm | To be defined by user, based on archetypes | Static, deterministic and probabilistic | Yes | Yes, EnviMET can be coupled to the models | No |
| UrbanOPT | CityGML, GeoJSON, osm, IDF | To be defined by user, based on archetypes | Static, deterministic | Yes, based on Eplus | No | Daylighting |
| TEASER (part of IDEAS) | CityGML, EnergyADE | To be defined by user, based on archetypes | Static, deterministic and probabilistic | Not well explained and detailed (missing?) | No | No |
| DeST-URBAN | Own processing | To be defined by user, based on archetypes | Very detailed. Static, deterministic and probabilistic | Based on archetypes | No | No |
| AutoBPS | CityGML, EnergyADE | To be defined by user, based on archetypes | Static, deterministic and probabilistic | Not well explained and detailed (missing?) | No | No |
| UECCC | Not described (seems obj) | To be defined by user, based on archetypes | Static | Detailed shading, based on previous work | Not described | No |
| cityBEM | obj | To be defined by user, based on archetypes | Static | Yes | No | No |
Table 3.
USEM tools and software engine characteristics(based on all the mentioned references).
| Tool | Engine for building simulation | Engine for energy systems calculations | Engine for mobility calculations | Programming language | Output processing | Open-source architecture | Frequency data |
|---|---|---|---|---|---|---|---|
| SUNTOOL | R.O.M (grey-box model) | Yes | No | Java | No | No | Hourly |
| CITYSIM | R.O.M (RC model) | Own engine | MATSIM-c | C++ and java | Yes | Yes | Hourly |
| SIMStadt | Simplified energy balance methodology | Own engine | No | Java | Yes | Yes | Monthly |
| UMI | Energyplus | Energyplus | Own engine (python), and walkability based | Rhino Grasshopper (python) | Yes | Partly dependent on Rhino. | Hourly and sub-hourly |
| CityBES | Energyplus | Energyplus | No | Yes | Yes | Hourly and sub-hourly | |
| OpenIDEAS | R.O.M (RC model) | Modelica | No | Python | Yes | Yes | Hourly |
| CEA | R.O.M (RC model) | No | Python | Yes | Yes | Hourly | |
| UrbanOPT | Energyplus | Energyplus | No | Ruby, C++, Python | Yes | Yes | Hourly and sub-hourly |
| TEASER | R.O.M (RC model) | Modelica | No | Python | Yes | Yes | Hourly |
| Dest-URBAN | Energyplus | Enerygplus | No | Python | Yes | Yes | Hourly |
| AutoBPS | Energyplus | Energyplus | No | Python | Yes | Yes | Hourly |
| UECC | R.O.M (RC model) | Own | No | Own tool | Yes | Yes | Hourly |
| CityBEM | Own heat transfer model | Not considered | No | CSharp | Yes | Yes | Hourly |
Table 4.
USEM tools and scenario creation (based on all the mentioned references).
| Tools | Incorporation of cost/benefit analysis | Incorporation of scenarios | UI tool | Level of scaling up of the UBEM tool |
|---|---|---|---|---|
| SUNTOOL | No | No | Yes | Low scaling-up |
| CITYSIM | No | No | Yes | Low scaling-up |
| SIMStadt | No | Yes | Yes | High scaling-up |
| UMI | No | Yes | Yes | High scaling-up |
| CityBES | Yes | Yes | Low scaling-up | |
| OpenIDEAS | No | No | Low scaling-up | |
| CEA | Yes | Yes | Yes | High scaling-up |
| UrbanOPT | No | Yes | Yes | High scaling-up |
| TEASER | No | Yes | Low scaling-up |
Table 5.
Breakdown of UNIFORMATII costs used in the platform.
| Id | Concept |
|---|---|
| B | Shell |
| B10 | Superstructure. Ground refurbishment |
| B20 | Envelope |
| B2010 | Opaque walls |
| B2020 | Transparent walls |
| B30 | Roofing |
| B3010 | Roofing opaque |
| B3020 | Roofing transparent |
| D | Services |
| D30 | HVAC |
| D3010 | Energy supply (PV systems) |
| D3020 | Heat generating systems |
| D3030 | Cooling generating systems |
| D3040 | Distribution systems |
| D3060 | Control and instrumentation |
| D3080 | Other HVAC systems. AHU |
| D50 | Electrical |
| D5020 | Lighting and branch wiring |
| Z | Allowances |
| Z10 | Design allowance |
| Z20 | Overhead and profit |
Table 6.
Description of the different considered energy systems, based on the NECB.
| Systems | System | Fan control | Cooling system | Heating system |
|---|---|---|---|---|
| System 1 | Unitary air conditioner with baseboard heater | CV | Air cooled DX with external condenser | Fuel-fired water boiler with baseboards |
| System 2 | 4-pipe fan-coil | CV | Water cooled, water chiller | Fuel-fired or electrical resistance water boiler |
| System 3 | Single zone packaged rooftop unit with baseboard heaters | CV | Air-cooled DX | Fuel-fired or electrical resistance furnace, hot water or electrical resistance for baseboards |
| System 4 | Single zone make-up air unit with baseboard heating | CV | Air-cooled DX | Fuel-fired or electrical resistance furnace, hot water or electrical resistance for baseboards |
| System 5 | Two pipe fan-coil | CV | Water cooled, water chiller | None |
| System 6 | Multi-zone built-up system with baseboard heater | VV | Water cooled, water chiller | Baseboards : electrical resistance or hydronic with fuel boiler |
Disclaimer/Publisher’s Note: The statements, opinions and data contained in all publications are solely those of the individual author(s) and contributor(s) and not of MDPI and/or the editor(s). MDPI and/or the editor(s) disclaim responsibility for any injury to people or property resulting from any ideas, methods, instructions or products referred to in the content. |
© 2024 by the authors. Licensee MDPI, Basel, Switzerland. This article is an open access article distributed under the terms and conditions of the Creative Commons Attribution (CC BY) license (http://creativecommons.org/licenses/by/4.0/).
Copyright: This open access article is published under a Creative Commons CC BY 4.0 license, which permit the free download, distribution, and reuse, provided that the author and preprint are cited in any reuse.


