
Submitted:
22 October 2024
Posted:
23 October 2024
You are already at the latest version
Abstract
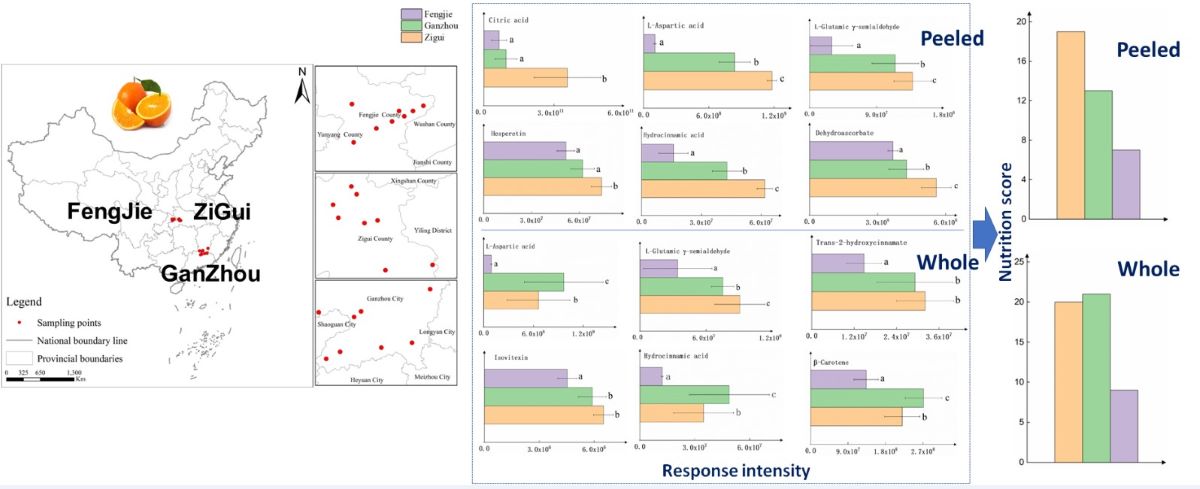
The metabolomics of Newhall navel oranges with geographical indication (GI) was measured by LC-MS/MS from three areas Ganzhou, Fengjie, and Zigui in China. Orthogonal partial least squares-discriminant analysis was performed for samples classification and important metabolites identification. This approach identified the best markers (i.e. tricarboxylic acid, amino acids, and phenolics) of the geographical origin able to discriminated Fengjie, Ganzhou, and Zigui organge samples. The results showed that peeled-samples from Zigui were richest and those from Fengjie lowest in all of the top ten most important markers. In whole samples, the highest levels of seven important markers occurred in those from Zigui, and the other three important markers appeared the highest levels in those from Ganzhou. According to the variation of the best markers, and the highest value of titratable acidity in those from Zigui, the samples planted in Ganzhou have the best balance between taste and nutrition. This work confirms the approach of metabolomics combined with OPLS-DA is an effective way for origin tracing and overall quality evaluation.
Keywords:
Top ten most important metabolites
; geographical origin
; amino acids
; flavonoids
; phenolic acids
1. Introduction
The geographical information of the planting locations for agricultural products has attracted more attention from consumers. For the same variety of fruit planted in different areas, even if cultivated by the same method, the quality may vary greatly, since the growing soil and climate can influence the quality of fruits [1]. Therefore, authentic information on the geographical origin of agricultural products appears to be important in market transactions. To this end, the Ministry of Agriculture and Rural Affairs of China has proposed geographical indications (GI) for agricultural products, aiming to protect geographical origin brands and add potential economic value. Under this condition, there has been a phenomenon of counterfeit GI agricultural products in the market, which can affect the commercial values of GI agricultural products and mislead consumers. Thus, how to distinguish GI agricultural products effectively is one of the current research focuses.
Citrus, extensively cultivated in southern China, also holds the position of being the foremost in this region [2]. Newhall navel orange (Citrus sinensis L. Osbeck) is a predominant citrus variety highly favored by Chinese consumers on account of its delectable taste, high moisture content, and potential nutrition value. The navel oranges grown in Ganzhou (GZ) city in the south of Jiangxi Province, Zigui (ZG) County in Hubei Province, and Fengjie (FJ) County in Chongqing City, have been incorporated into the list of GI agricultural products by the Ministry of Agriculture and Rural Affairs of the People’s Republic of China, signifying their superior quality. Nearly all GI navel oranges available in the market originate from these three areas. Present studies on citrus primarily concentrate on the impacts of diverse cultivation methods or varieties on conventional quality parameters (taste, flavor, etc.)[3] and routine chemical properties such as soluble solid, titratable acid, vitamin C content, etc [4]. In fact, assessing the chemical composition (metabolites) of economically important fruits, such as the Newhall navel orange, is of great theoretical value for the identification of the source of their origin and their scientific utilization. Although they all share the geographical indication as navel oranges, there may exist disparities in the chemical composition due to varying planting locations, which in turn gives rise to differences in their nutritional functions.
Previous study revealed that metabolomics serves as a potential valuable tool for identifying the geographical origin and quality of olive oil, [5,6,7] wine, [8,9,10] and honey, [11,12,13] as well as determining whether the milk is an organic product as indicated on the product label [14,15] or revealing the differences in functional substances of milk at different altitudes [16]. For instance, Ben Mohamed et al. [6] employed metabolomics integrated with multivariate statistics orthogonal projections to latent structures discriminant analysis (OPLS-DA) to distinguish the geographical origin of the extra virgin olive oil. They discovered that hydroxybenzoic acids, cholesterol, and stigmasterol derivatives are the optimal markers capable of discriminating Tunisian and Italian [5]. This method was also utilized to identify the differences between propolis from Greece and China, and the results demonstrated that Chinese samples overexpressed compounds characteristic of the poplar type propolis, whereas Greek samples overexpressed those characteristic of the Mediterranean propolis type [17]. Thus, it is hypothesized that metabolomics in combination of OPLS-DA could identify the metabolite markers for discriminating of geographic origins of these three GI Newhall navel oranges. Additionally, the application of metabolomics enables precise characterization of metabolite profiles, particularly the compounds correlated with the flavor, such as sugars, acids, flavones, phenols, or other functional substances [16,17,18]. Markers identified through metabolomics can disclose the general differences in their flavor or nutrition [18,19,20].
The purpose of this study was: (1) to explore the differences in metabolic profiles of GI Newhall navel orange samples planted in the three different areas in China; (2) to verify whether metabolomics could identify the planting location of GI Newhall navel oranges; and (3) to further assess the nutrition of GI Newhall navel orange samples based on the metabolomics. The results of this study will enhance the understanding of the characteristics of GI Newhall oranges planted in different areas, and provide evidence for whether metabolomics can identify and distinguish the origins of geographical indication navel oranges.
2. Materials and Methods
2.1. Sampling
Newhall navel oranges originated from three areas of Ganzhou, Fengjie, and Zigui in China. Eight orchards were selectively picked from each of these areas. Because of the concentrated cultivation of navel oranges in areas of Fengjie and Zigui, our sampling orchards appeared to be shown next to each other in Figure 1. Fengjie and Zigui are both located in the Three Gorges Reservoir area of the Yangtze River in China, and are geographically close to each other. The navel oranges underwent uniform field management and were harvested in December 2022 due to the slight variation of ripening period from place to place. 10 kg of the oranges with a uniform size ranging from 65 to 70 mm in diameter were acquired.
The climatic data of the planting areas in 2022, including the rainfall, lighting time, average temperature, and temperature difference between day and night, obtained from the China Meteorological Administration (http://data.cma.cn), were shown in Figure 2. The maximum rainfall appeared in the Zigui area, and the average temperature in Ganzhou area higher than that of Fengjie and Zigui. The temperature difference between day and night in the three areas ranged from 3.4oC to 10.6oC. In the Ganzhou area, temperature difference kept increasing from September to November and reached the maximum value in November, while it demonstrated the opposite trend in the other two areas. The amount of lighting in Fengjie and Ganzhou was similar, higher than that in Zigui.
The collected oranges were immediately stored in a chamber maintained at 4oC with a relative humidity of 90% and subsequently transported to the laboratory. The soluble solids (SS), titratable acidity (TA), vitamin C (VC), and metabolomics were analyzed within three days.
2.2. Determination of Quality Attributes
Soluble solids (SS) content and titratable acidity (TA) of peeled or whole samples were determined in this work. SS content was measured by a digital sugar refractometer (WAY-2S, China), and TA was determined through sodium solution titration. Vitamin C (VC) was measured by the method of the 2, 6-dichloroindophenol (2, 6-D) solution titration. According to this method, the samples need to be peeled, meaning that only the VC data of peeled samples are available in following results.
2.3. Metabolomics Analysis
2.3.1. Sample Preparation
Four Newhall navel oranges were collected and each was divided into four flaps. Subsequently, one-quarter were taken out and re-substituted as an unpeeled sample. To identify the differences in metabolic profiles resulted from peeling or not, another flap was peeled from each orange, and reconstituted a peeled sample. Thus, there were eight peeled samples and eight non-peeled samples from each terroir. The reconstituted samples designated for metabolite extraction were immediately frozen in liquid nitrogen, freeze-dried, grinded to obtain a homogeneous powder, and ultimately stored at -80oC until extraction and analysis were carried out.
2.3.2. Metabolites Extraction
Orange metabolites was extracted for LC-MS/MS analysis based on the method of Yang et al. [21] The details were as follows: 3 mL of ice methanol (80%, v/v) was added to 0.5 g of frozen orange powder. Then, samples were placed in a high-throughput tissue grinder for 60 s. After sonicating for 30 min, sample were transferred to ice for 20 min and centrifuged at 15, 000 ×g for 20 min. Supernatants were concentrated during drying in a vacuum. Finally, the samples were reconstituted in acetonitrile (50%, v/v) and filtered through 0.45 µm membrane for LC-MS/MS analysis.
2.3.3. LC-MS/MS Analysis
The metabolomics were assessed by a Thermo Scientific Q-Extractive high-resolution instrument interfaced with a heated electrospray ionization source and Orbitrap mass analyzer. The details of LC-MS/MS parameters were referred to the previous study by Yang et al [21]. All samples were maintained at 4oC, and gradient elution was performed with an Acquity UPLC HSS T3 (2.1 mm × 150 mm, 1.8 µm) column at a flow rate of 0.25 ml/min. The mobile phase consisted of water (A) and acetonitrile (B), each containing 0.1% formic acid. The MS/MS analysis was executed using an electrospray ionization source, and data were acquired in both positive and negative modes. A primary full scan was conducted at 70, 000 resolutions with a primary ion scan range of m/z 81–1000 and a secondary scan at 17, 500 resolutions, while dynamic exclusion was employed to eliminate unnecessary MS/MS information.
2.3.4. Data Processing
The LC-MS/MS data were converted into m/z XML format, and the metabolites were identified. Automatic peak detection, retention time calibration, and peak alignment were executed in XC-MS software. The data matrix including mass-to-charge ratio, retention time, and peak area was imported into SIMCA-P (V13, Sweden) for multivariate data analysis. Principal component analysis (PCA) was conducted to generate an overview of group clustering. OPLS-DA was conducted to obtain metabolites with significant intergroup differences in order to accentuate differences between groups. The validity of the model was assessed by the model prediction rate Q2. Commonly, a relatively larger variable importance to projection (VIP) value indicates a relatively greater contribution to the classification model. Metabolites with ions with p < 0.01 and VIP > 1.0 were selected as important metabolites or named metabolite markers. The univariate patterns of the intensities of these metabolites were re-examined.
2.3.5. Metabolites Identification
Metabolites was identified by consulting metabolites database, MassBank, MS-DIAL software. Structural identification of unknown metabolites was performed considering retention time, exact molecular mass, characteristic fragments, and neutral losses. The MS/MS fragmentation of the metabolites was compared with those found in databases and verified with earlier literature.
2.4. Statistical Analyses
The error bars in figures represent the standard deviation (n=8). Shapiro–Wilk and Levene’s tests were employed for verifying the normality and homogeneity of variance. Differences in indices between peeled or non-peeled samples in different areas were determined by analysis of variance (ANOVA) by Tukey’s post hoc test. Differences were significant at p < 0.05. Microsoft Excel, SPSS 16.0, and Origin 9.0 were applied for data analysis and drawings.
3. Results
3.1. Quality Attributes
As shown in Figure 3, the content of vitamin C in GI Newhall naval orange was in the order of Ganzhou > Fengjie > Zigui. In the whole or peeled samples, the titratable acidity were in the order of Zigui > Ganzhou > Fengjie, and the highest content of soluble solids were observed in Ganzhou, while the lowest in Fengjie. The maximum SS/TA value was shown in peeled samples from Ganzhou. For the whole fruits, the maximum SS/TA value appeared in Fengjie-planted samples. Regardless of peeled or not, the minimum SS/TA value occurred in Zigui-planted samples (Figure 3). It is worth noting that, unlike SS or TA, vitamin C was not measured in the whole sample due to the requirement of peeling for determination.
3.2. Compound Identification
The identified compounds were classified into organic acids, amino acids, sugars, flavonoids, and so on (Figure 4). These compounds were related to taste and nutritional value of the navel oranges. For peeled citrus, 23 organic acids were identified and 15 for sugars, 21 for amino acids, and 5 for phenolic acids. In comparison, in the whole citrus, the number of identified compounds goes up to 16 for organic acids and19 for sugars, and declines to 12 for amino acids, and keeps to 7 for phenolic acids.
3.3. Metabolic Markers Discrimination
3.3.1. PCA and OPLS-DA Results
As illustrated in Figure 5a, the first two principal components (PCs) explained 25.9% of the total variance of peeled samples, and a poor separation between samples from Ganzhou and Fengjie was presented. OPLS-DA is a multivariate statistical analysis able to effectively separate Y-predictive variation from Y-uncorrelated variation in X, highlighting the differences between groups by eliminating errors between samples and other random errors [21]. In our work, a complete separation discrimination between the three classes of peeled-samples were achieved from the score plot of OPLS-DA score (Figure 5b). Similar to the peeled samples, the first two PCs by PCA interoperated 27.0% of the total variance (Figure 5c). The whole samples completely divided in three groups by OPLS-DA model as well (Figure 5d). In this work, the model cross validation parameters of all the OPLS-DA were excellent, being R2Y and Q2 Y with the value of more than 0.9, suggesting the obtained model from supervised OPLS-DA for peeled or unpeeled samples are stable and reliable. Despite the large number of differential metabolites screened by metabolomics (Figure 4), we focused on the top 10 most important markers based on VIP values in the following analysis due to their greater contribution to the samples grouping [21].
3.3.2. Top Ten Most Important Markers
With regards of peeled citrus, the top 10 most important markers were categorized into five groups: (1) carboxylic acids 2-isopropylmalic acid, succinic acid, and citric acid, with VIP values of 2.68, 2.64, and 2.43, respectively, (2) amino acid L-aspartic acid, L-glutamic γ-semialdehyde, and D-β-phenylalanine, with VIP values of 2.88, 2.51, and 2.49, respectively, (3) phenolic compounds including flavonoid hesperetin with VIP value of 2.59, and two phenolic acids hydrocinnamic acid, and 4-hydroxycinnamic acid, with VIP values of 2.61 and 2.46, respectively, (4) active substances dehydroascorbate (DHA) with VIP value 2.49, which cannot be strictly classified as sugars, organic acids, or flavonoids (Figure 6a).
The level of citric acid was about three orders of magnitude higher than that of succinic acid (Figure 6a). The content of 2-isopropylmalic acid is approximately one order of magnitude lower than that of succinic acid (Figure 6a). Among GI navel oranges from the three terroirs, the citric acid in peeled navel orange planted in ZG was about three times higher than that in samples planted in the other two regions, representing the high acidity of the ZG sample. Compared to the peeled samples planted in ZG area, the contents of 2-isopropylmalic acid and succinic acid in GZ-planted peeled samples were slightly higher, but not significantly. Since the level of citric acid determines the acidity and even taste of the sample, our results indicate that ZG-planted peeled samples possess the highest acidity. Since L-aspartic acid had the highest VIP value among the top 10 most important markers, it could be regarded as the most important metabolite marker. Three amino acid markers were similarly distributed among the samples from the three terroirs, with the highest levels appearing in the samples from ZG and the lowest values in the samples from FJ (Figure 6a). Similar to the amino acids, the highest level of hesperetin, phenolic acid hydrocinnamic acid, and 4-hydroxycinnamic acid markers or DHA was found in peeled samples planted in ZG, followed by GZ and FJ (Figure 6a).
As for the whole samples, among the top ten most important markers, two amino acid markers L-aspartic acid and L-glutamic γ-semialdehyde were observed with the corresponding VIP value 2.04 and 2.17, and both of them were found as the most important metabolites in peeled samples as well (Figure 6b). The number of carboxylic acid marker decreased to one, namely 2-isopropylmalic acid with the VIP value 2.21. The number of phenolics increased to six, including isovitexin 2′-O-β-D-glucoside, isovitexin, diosmetin, trans-2-hydroxycinnamate, trans-cinnamate, and hydrocinnamic acid, the last of which is observed as the marker in the peeled-samples as well. The VIP values of isovitexin 2′-O-β-D-glucoside and isovitexin are 2.77 and 2.51, respectively, ranking the first and second, representing that they made a significant contribution in distinguishing peeled citrus samples. Unlike peeled samples, the active substance-like markers in unpeeled samples were β-carotene with the VIP value 1.85 (Figure 6b).
All the top ten most important markers in whole citrus from FJ area reached their lowest level (Figure 6b). The distribution of the following compounds 2-isopropylmalic acid, isovitexin, trans-2-hydroxycinnamate, trans-cinnamate, and diosmetin in whole citrus originated from different areas is similar. That is, all of them were slightly more abundant in the ZG-planted samples than the GZ-planted samples. Differently from the variation of markers in peeled samples, L-aspartic acid, hydrocinnamic acid and β-carotene were all significantly higher in unpeeled citrus samples from GZ than those from ZG. On the contrary, L-glutamic γ-semialdehyde, isovitexin 2'-O-β-D-glucoside were found to be significantly higher in samples from ZG than in samples with peels from GZ (Figure 6b).
3.4. Nutrition Evaluation
The sugar-acid ratio generally determines the taste of the fruit [1]. In both peeled and unpeeled samples, the sugar-acid ratio were in descending order as: FJ>GZ >ZG. This indicates that the taste is the best from FJ and worst from ZG.
After removing the organic acids from the top 10 most important markers, we further calculated the total nutritional score of the samples (with or without peel), and the results were presented in Table 1. The details about the calculation of nutritional score were shown as following: For a certain compound, the lowest significant level was assigned as 1. If no significant difference from the lowest level was observed, a value of 1 was assigned. A value of 2 was assigned if there was no significant difference from the highest level, and the highest significant level was assigned as 3. After assigning metabolic markers one by one, the final total nutritional value of the samples (with or without peel) planted in a certain area is obtained by adding them up.
As demonstrated in Table 1, the highest nutritional score of peeled samples was found in ZG, followed by GZ and FG. Differently, the whole samples possessed slightly higher nutritional score value from GZ than those in ZG, and the lowest score was found in the whole samples from FJ. Thus, the samples in ZG have higher nutritional value, and the worst taste due to the lowest sugar-acid ratio. The samples from GZ achieved the best balance between nutrition and taste.
4. Discussion
4.1. Quality Attributes
VC in fruits is one of the most important health-promoting traits. [22] Soluble solids content can reflect internal quality characteristics for the taste of fruits and affect the consumer acceptance of products [23]. A high content of VC represents high nutrition, and a high level of SS indicates a good taste [22]. The samples from GZ possessed the highest VC and SS contents (Figure 3), suggesting that the samples from GZ have the best taste and highest nutrition. The higher TA means a more acidic taste [22]. Regardless of the presence of peels, the ZG sample is the most acidic with the maximum TA value. Since the higher SS/TA ratio represents the higher maturity level and better flavor, [23] the ZG samples with the minimum value of SS/TA ratio appeared to be the lowest ripeness and worst flavor (Figure 3). Thus, the best taste and highest nutrition was occurred in GZ-planted samples through the VC, SS, and TA analysis.
4.2. The Discrimination of GI Orange Samples and Top Ten Most Important Markers
Multivariate analysis of the metabolomics is usually performed by applying supervised tools such as OPLS-DA together with unsupervised methods such as PCA. Since OPLS-DA is able to effectively separate Y-predictive variation from Y-uncorrelated variation in X, an unparalleled advantage in terms of sample grouping was demonstrated. In our work, from the OPLS-DA score plots, a complete separation between peeled or whole samples with different geographical origins was presented compared to PCA (Figure 5). In addition, the value of R2Y and Q2Y more than 0.9 suggests the robustness of the OPLS-DA to discriminate GI orange samples according to geographic origin. These preliminary results suggest that metabolomics analysis followed by robust OPLS-DA model could be efficient approach for studying GI oranges traceability. Subsequently, the variables importance (VIP) in projection of the OPLS-DA model was analyzed, considering the VIP score for each compound identified. Commonly, those variables with VIP>1.0 could be considered to mostly contribute to class grouping in the OPLS-DA model. In current work, the number of the markers with VIP value greater than 1.0 exceeded fifty. Since the higher VIP value of the marker possessed represents the greater contribution to class discrimination, the markers possessing the top ten highest VIP value in the supervised OPLS-DA model received particular attention. For peeled samples or whole fruits, the top ten most important markers differed significantly, but these best markers were mainly attributed to carboxylic acids, amino acids, and phenolic compounds.
For peeled samples, three carboxylic acids (citric acid, succinic acid, and 2-isopropylmalic acid) were identified as top ten important markers. The citric acid is well known as the predominant organic acid in citrus [24,25]. We found that the level of citric acid is 3 orders and 4 orders of magnitude higher than that of succinic acid and 2-isopropylmalic acid in peeled samples (Figure 6a), respectively. The above three organic acids reached the maximum level in the peeled-samples from ZG (Figure 6a), indicating that the TCA cycle was more active in ZG-planted samples than those from the other two areas. No sugars appeared in the top 10 most important markers, reflecting that the levels of sugars in GI navel oranges with different geographical origin are comparable with no significance. Due to the highest levels of organic acids in the samples from ZG area, obviously, the value of sugar-acid ratio, which reflects the citrus flavor, is the smallest in the samples from ZG area. As the fruit ripens, the organic acid level decreases simultaneously, and the maturity of fruit can thus be judged by the acidic or sweet flavors [26]. The highest level of acids occurred in ZG-planted peeled samples suggests that the maturity of samples from this area is lower than those from the other two areas, which is coincident with the results of SS/TA (Figure 3).
Amino acids participate in fruit quality formation together with other flavor substances. Also, fruits with higher contents of amino acids are more nutritious [27]. L-aspartic acid, L-glutamic γ-semialdehyde were observed to be among top ten important markers contributing to discriminating the samples (peeled or unpeeled) with diverse origins (Figure 6). The variations in these amino acids in peeled samples directly mirror their flavor disparities [1]. The intermediate products of TCA cycle can be converted into amino acids, among which citric acid can be directly converted into glutamic acid through GABA pathway and 2-ketoglutaric acid involved in the formation of L-Glutamic γ-semialdehyde [28]. This can be understood why the distribution of amino acids markers in Newhall navel oranges grown in different places is similar to that of organic acids.
Phenolic compounds, including flavonoids and phenolic acid, are associated with a variety of health benefits, [29] such as natural antioxidant, anti-inflammatory, immunomodulatory, and anti-cancer activity and so on [30,31]. Flavonoid and phenolic acids usually reflect typical sensory properties such as color, astringency, and irritability as well [32,33]. Flavonoid hesperetin and phenolic acids hydrocinnamic acid, and 4-hydroxycinnamic acid were observed in the top 10 markers to distinguish peeled samples with different geographical origin (Figure 6b). The formation of phenolic acids is closely related to the amino acid metabolism [34,35]. Based on KEGG analysis, the generation of hydrocinnamic acid and trans-2-hydroxycinnamate can be affected by phenylalanine metabolism. Higher phenylalanine naturally produces more phenolic acids [36]. The difference in phenylalanine levels among the peeled samples can explain the phenomenon that the peeled samples in ZG had the highest level of hydrocinnamic acid, and 4-hydroxycinnamic acid, followed by GZ and FJ (Figure 6a).
Diosmetin can inhibit carcinogenic activation and fight against lipopolysaccharide-induced acute lung injury by inhibiting nucleotide-binding domain-like receptor protein 3 inflammasome and activating nuclear factor erythroid 2–related factor 2 [37]. The content of hesperidin and diosmetin in fruits could increase greatly at 90-120 days after flowering, and then began to decline [38]. Thus, the maturity of samples should be lower from ZG area than others due to the highest levels of diosmetin and hesperidin (Figure 6b), which is in line with the results of SS/TA (Figure 3). From the perspective of the nutrient of fruit peel, navel orange originated from GZ or ZG should be preferred.
Vitamin C (VC) has both oxidation and reduction forms. DHA is the reversible oxidizing form of VC. Since the ratio of reduction to oxidation forms of VC is approximately 15:1, reduction form of VC is used to reflect the level of VC [39]. We observed that in peeled samples, VC is most abundant from GZ, followed by ZG, and DHA is the highest in ZG, followed by GZ. Although the DHA is minimal compared to reduction VC, it does have its unique health benefits. Clinical trials found that pre-treatment with DHA can protect the brain in a shocked mouse, increasing blood flow after ischemia, and reducing nerve damage before reversible occlusion occurs, while VC does not have this effect [39]. By combining the results of DHA with VC in peeled samples, the nutritional value of GZ and ZG samples seems to be higher than that of FJ samples. β-carotene as a natural vitamin has potential health benefits in preventing chronic diseases, including age-related macular degeneration and cataracts, and cardiovascular disease [40,41]. The β-carotene level was much higher in GZ-peeled samples followed by ZG, and no difference was observed between GZ and ZG (Table 1), indicating that navel oranges produced in GZ may prevent more chronic diseases compared to FJ and ZG.
Differently from the top ten most important markers screened from the peeled group, in whole citrus, the number of organic acid metabolic biomarkers decreased, and the number of phenolic compounds increased. This phenomenon is mainly attribute to the presence of the peel, which account for 20%-35% of the fruit weight, and possess rich essential oils, flavonoids, and pigments. Our results suggest that the peel should be a valuable food resource. Being consistent with our results, some previous studies found that in citrus fruits phenolic compounds are more abundant in the skin than in the flesh [1,42]. Therefore, if the nutritional benefits of flavonoids are to be fully utilized, it is crucial to increase the utilization of the peel [38,43,44].
In summary, in this work the identification of markers including carboxylic acids, amino acids and phenols by the metabolomics followed by multivariate statistics could be exploited to discriminate samples according to their geographical origin. Using the similar method with us, Ben et al. identified phenolic and steroid markers in Tunisian and Italian extra-virgin olive oil samples [6]. Kasiotis et al. disclosed the potential markers as flavonoids, terpenoids, iridoids and fatty acid ester derivative for the differentiation of the three orange blossom honeys from Italy, Greece, and Egypt, respectively [11]. The combined use of carboxylic acids, amino acids, and phenols is a promising method, likely since these three classes have different biosynthetic pathways, which have been discussed in this section, and thus might be differentially affected by pedo-climatic factors (the details in the Section 4.4). In addition, these above markers also can indicate the variation in the quality or the nutrition of samples according to geographical origins.
4.3. Nutritional Comparison
Exception of acids, important markers (including amino acids, phenol, and other active substances) screened by metabolomics have been reported as nutrients [45,46]. Actually, evaluating the nutrition of foods is complex and still challenging. The Nutrient-Rich Food (NRF) model, an internationally recognized method for evaluating food nutrition, is integrated multiple index method based on nutrient density,[45] which is the ratio of the nutrient composition of a food to the nutrient requirements of the human consumer. However, corresponding nutrient density for most of the important markers in this study is still unknown [47]. To compare with the nutrition of samples, the integrated index based on the statistical results was attempted to be applied.
As shown in Table 1, there are the close scores for nutritional evaluation between the whole samples from GZ and ZG, being much higher than that from FJ, the final nutrition score is ordered from GZ>ZG>FJ. While for peeled samples, the final nutrition score is ordered from ZG>GZ>FJ, suggesting the presence of the peel has prominent effect on the nutrition of oranges. However, the taste of samples from ZG area is the worst evidenced by the lowest sugar-acid ratio. Therefore, navel orange cultured in GZ area is more palatable in taste and flavor and higher in nutritional value. It seems that the metabolomics results are not completely consistent with the conclusions obtained solely based on VC, which supports the necessity to combine metabolomics approaches in this study. Due to the fact that the metabolomics results cover more compounds, the conclusions based on the metabolomics are preferred. It is worth noting that no perfect food nutrition evaluation method has been reported till now, the nutrition evaluation method applied in this study can provide some insights into the nutrition of Newhall navel oranges.
4.4. The Potential Association between the Terroir and the Quality of Navel Orange
Climatic factors, such as temperature, rainfall, and temperature difference between day and night, may affect the quality of fruits as well [22]. Higher temperatures and larger temperature differences between day and night favor the photosynthesis and sugar accumulation of fruits, resulting in higher fruit sweetness. Among the three areas, both the average temperature and the difference in temperature between day and night in GZ area are higher than those in the remaining two areas (Figure 2), which helps to explain our observation that GZ-planted navel oranges have a good taste and low acidity. The expansion period of navel orange fruit usually occurs in August or September, and excessive rainfall is adverse to the accumulation of sugar. The rainfall in the ZG area during this period was apparently higher than in the other two planting areas (Figure 2), and this may contribute to the highest level in organic acid metabolites in samples.
The chemical properties of soil may affect the quality of citrus fruits as well. For instance, soil pH can directly influence the availability of nutrients for plant growth. The previous study reported that soil pH ranging from 4.8 to 5.5 in the acidic range and from 6.6 to 7.8 in the alkaline range, are suitable for the growth of Newhall Navel orange [1]. The most soil in GZ area planting Newhall Navel orange was red soil with pH about 4.8, and in areas of ZG and FJ, soil pH was between 7.0 and 7.1 [1,48]. Differences in soil pH may contribute to differences in metabolic markers in samples across areas. These findings indicated that the differences of metabolomics in oranges from different areas were the result of a combination of environmental factors. Although the average temperature and soil acidity in areas of ZG and FJ are similar, the GI navel oranges planted in both two areas have significant differences in taste and nutrition, indicating that there are other factors existing to affect the growth of navel oranges. However, the details are still unknown and need further research.
5. Conclusions
Based on the obtained variations of the top ten most important markers in samples with different origins, we confirmed that metabolomics could be a potential tool for discriminate the geographical origin of navel. For peeled samples, those from ZG area have the highest level of phenolic compounds, organic acids, amino acids and VC, followed by those produced in GZ. In contrast to peeled samples, GZ-planted whole samples possessed highest levels of L-asparatic acid, hydrocinnamic acid, and β-carotene, and isovitexin, trans-cinnamate. Regardless of whether the samples were peeled or not, all the lowest level of the top ten most important markers appeared in samples from FJ. Our results showed that GZ samples have the best balance between the taste and the nutrition. This balance should be closely related to the superiority of climate and soil conditions. We believe that the obtained metabolite profile of citrus with GI but different origin will enhance the knowledge on the quality of navel oranges, and contribute to further improving and scientifically utilizing the quality of navel oranges.
Author Contributions
Xiao Shu: Methodology, Validation, and Writing-Original draft. Manli Xie: Methodology. Xuemei Zhang: Methodology and Validation. Na Wang: Methodology. Wei Zhang: Software. Junjie Lin: Writing - review and editing. Junying Yang: Supervision. Xiaoxia Yang: Conceptualization, Visualization, Writing-Revision. Yingkui Li: Supervision, Writing-Revision. All authors have read and agreed to the published version of the manuscript.
Funding
This research was funded by the following grants: Municipal Financial Project of Chongqing Academy of Agricultural Sciences, grant number: KYLX20240500057, KYLX20240500041, and NKY-2022AB023.
Data Availability Statement
The original contributions presented in the study are included in the article, further inquiries can be directed to the corresponding author.
Conflicts of Interest
The authors declare no conflicts of interest.
Abbreviations
GI, geographical indication; LC-MS/MS, liquid chromatography tandem mass spectrometry; OPLS-DA, Orthogonal partial least squares-discriminant analysis; GZ,Ganzhou; ZG, Zigui; FJ, Fengjie; SS, soluble solids; TA, titratable acidity; VC, vitamin C; PCA, principal component analysis; VIP, variable importance to projection; PCs, principal components; ANOVA, analysis of variance; DHA, dehydroascorbate; TCA, tricarboxylic acid; GABA, Gamma-aminobutyric acid; KEGG, Kyoto Encyclopedia of Genes and Genomes; NRF, Nutrient-Rich Food.
References
- Li, Y H; Liang, L; Xu, C H; Yang, T M; Wang, Y X. UPLC-Q-TOF/MS-based untargeted metabolomics for discrimination of navel oranges from different geographical origins of China. Lwt-Food Sci. Technol. 2021, 137, 110382. [CrossRef]
- Ollitrault, P; Terol, J; Chen, C; Federici, C T; Lotfy, S; Hippolyte, I; Ollitrault, F; Berard, A; Chauveau, A; Cuenca, J; Costantino, G; Kacar, Y; Mu, L; Garcia-Lor, A; Froelicher, Y; Aleza, P; Boland, A; Billot, C; Navarro, L; Luro, F; Roose, M L; Gmitter, F G; Talon, M; Brunel, D. A reference genetic map of C. clementina hort. ex Tan.; citrus evolution inferences from comparative mapping. BMC Genomics 2012, 13, 593.
- Lin, H; He, C; Liu, H; Shen, G; Xia, F; Feng, J. NMR-based quantitative component analysis and geographical origin identification of China's sweet orange. Food Control 2021, 130, 108292. [CrossRef]
- Hu, D Y; Liao, Q H; Xie R J; He, S L; Qian, C; Lv, Q; Yi, S L; Zheng, Y Q; Deng, L. Effect of geographical location on physical characteristics and chemical compositions of Newhall navel orange (Citrus sinensis (L.) Osbeck). Food Sci. 2015, 36, 18–28.
- Sales, C; Cervera, M I; Gil, R; Portolés, T; Pitarch, E; Beltran, J. Quality classification of Spanish olive oils by untargeted gas chromatography coupled to hybrid quadrupole-time of flight mass spectrometry with atmospheric pressure chemical ionization and metabolomics-based statistical approach. Food Chem. 2017, 216, 365–373.
- Ben Mohamed, M; Rocchetti, G; Montesano, D; Ben Ali, S; Guasmi, F; Grati-Kamoun, N; Lucini, L. Discrimination of Tunisian and Italian extra-virgin olive oils according to their phenolic and sterolic fingerprints. Food Res. Int. 2018, 106, 920–927. [Google Scholar] [CrossRef]
- Senizza, B; Ganugi, P; Trevisan, M; Lucini, L. Combining untargeted profiling of phenolics and sterols, supervised multivariate class modelling and artificial neural networks for the origin and authenticity of extra-virgin olive oil: A case study on Taggiasca Ligure. Food Chem. 2023, 404, 134543. [Google Scholar] [CrossRef] [PubMed]
- López-Rituerto, E; Savorani, F; Avenoza, A; Busto, J H; Peregrina, J M; Engelsen, S B. Investigations of La Rioja terroir for wine production using 1H NMR metabolomics. J. Agr. Food Chem. 2012, 60, 3452–3461. [Google Scholar] [CrossRef] [PubMed]
- Gougeon, L; Da Costa, G; Le Mao, I; Ma, W; Teissedre, P L; Guyon, F; Richard, T. Wine analysis and authenticity using 1H-NMR metabolomics data: Application to Chinese wines. Food Anal. Methods 2018, 11, 3425–3434. [Google Scholar] [CrossRef]
- Pan, Y; Gu, H W; Lv, Y; Yin, X L; Chen, Y; Long, W J; Fu, H Y; She, Y B. Untargeted metabolomic analysis of Chinese red wines for geographical origin traceability by UPLC-QTOF-MS coupled with chemometrics. Food Chem. 2022, 394.
- Kasiotis, K M; Baira, E; Iosifidou, S; Manea-Karga, E; Tsipi, D; Gounari, S; Theologidis, I; Barmpouni, T; Danieli, P P; Lazzari, F; Dipasquale, D; Petrarca, S; Shairra, S; Ghazala, N A; Abd El-Wahed, A A; El-Gamal, S M A; Machera, K. Fingerprinting chemical markers in the mediterranean orange Blossom Honey: UHPLC-HRMS metabolomics study integrating melissopalynological analysis, GC-MS and HPLC-PDA-ESI/MS. Molecules 2023, 28, 3967.
- Li, Y; Jin, Y; Yang, S P; Zhang, W W; Zhang, J Z; Zhao, W; Chen, L Z; Wen, Y Q; Zhang, Y X; Lu, K Z; Zhang, Y P; Zhou, J H; Yang, S M. Strategy for comparative untargeted metabolomics reveals honey markers of different floral and geographic origins using ultrahigh-performance liquid chromatography-hybrid quadrupole-orbitrap mass spectrometry. J. Chromatogr. A 2017, 1499, 78–89. [Google Scholar] [CrossRef] [PubMed]
- Jandric, Z; Frew, R D; Fernandez-Cedi, L N; Cannavan, A. An investigative study on discrimination of honey of various floral and geographical origins using UPLC-QToF MS and multivariate data analysis. Food Control 2017, 72, 189–197. [Google Scholar] [CrossRef]
- Suh, J H. Critical review: Metabolomics in dairy science-Evaluation of milk and milk product quality. Food Res. Int. 2022, 154, 110984. [Google Scholar] [CrossRef] [PubMed]
- Tomassini, A; Curone, G; Solè, M; Capuani, G; Sciubba, F; Conta, G; Miccheli, A; Vigo, D. NMR-based metabolomics to evaluate the milk composition from Friesian and autochthonous cows of Northern Italy at different lactation times. Nat. Prod. Res. 2019, 33, 1085–1091. [Google Scholar] [CrossRef] [PubMed]
- Pu, J H; Vinitchaikul, P; Gu, Z B; Mao, H M; Zhang, F L. The use of metabolomics to reveal differences in functional substances of milk whey of dairy buffaloes raised at different altitudes. Food Funct. 2021, 12, 5440–5450. [Google Scholar] [CrossRef] [PubMed]
- Stavropoulou, M I; Termentzi, A; Kasiotis, K M; Cheilari, A; Stathopoulou, K; Machera, K; Aligiannis, N. Untargeted ultrahigh-performance liquid chromatography-hybrid quadrupole-orbitrap mass spectrometry (UHPLC-HRMS) metabolomics reveals propolis markers of Greek and Chinese origin. Molecules 2021, 26, 456. [Google Scholar] [CrossRef] [PubMed]
- Colantonio, V; Ferra, L F V; Tieman, D M; Bliznyuk, N; Sims, C; Klee, H J; Munoz, P; Resende, M F R. Metabolomic selection for enhanced fruit flavor. PNAS. 2022, 119, e2115865119. [Google Scholar] [CrossRef] [PubMed]
- Septembre-Malaterre, A; Remize, F; Poucheret, P. Fruits and vegetables, as a source of nutritional compounds and phytochemicals: Changes in bioactive compounds during lactic fermentation. Food Res. Int. 2018, 104, 86–99. [Google Scholar] [CrossRef]
- Wang, X L; Wu, L X; Qiu, J; Qian, Y Z; Wang, M. Comparative metabolomic analysis of the nutritional aspects from ten cultivars of the strawberry fruit. Foods 2023, 12, 1153. [Google Scholar] [CrossRef]
- Yang, X X; Gong, J P; Zhang, X M; Huang, Y C; Zhang, W; Yang, J Y; Lin, J J; Chai, Y; Liu, J F Evaluation of the combined toxicity of multi-walled carbon nanotubes and cadmium on earthworms in soil using multi-level biomarkers. Ecotoxicol. Environ. Saf. 2021; 221, 112441. [CrossRef]
- Xu, L; Wang, L; Xu, Z; Zhang, X; Zhang, Z; Qian, Y. Physicochemical quality and metabolomics comparison of the green food apple and conventional apple in China. Food Res. Int. 2021, 139, 109804. [Google Scholar] [CrossRef] [PubMed]
- Li, Q; Yang, S; Li, B; Zhang, C; Li, Y; Li, J. Exploring critical metabolites of honey peach (Prunus persica (L.) Batsch) from five main cultivation regions in the north of China by UPLC-Q-TOF/MS combined with chemometrics and modeling. Food Res. Int. 2022, 157, 111213. [Google Scholar] [CrossRef] [PubMed]
- Huang, Y; He, J; Xu, Y; Zheng, W; Wang, S; Chen, P; Zeng, B; Yang, S; Jiang, X; Liu, Z; Wang, L; Wang, X; Liu, S; Lu, Z; Liu, Z; Yu, H; Yue, J; Gao, J; Zhou, X; Long, C; Zeng, X; Guo, Y-J; Zhang, W-F; Xie, Z; Li, C; Ma, Z; Jiao, W; Zhang, F; Larkin, R M; Krueger, R R; Smith, M W; Ming, R; Deng, X; Xu, Q. Pangenome analysis provides insight into the evolution of the orange subfamily and a key gene for citric acid accumulation in citrus fruits. Nature Genetics 2023, 55, 1964–1975.
- Katz, E; Boo Kh Fau - Kim, H Y; Kim Hy Fau - Eigenheer, R A; Eigenheer Ra Fau - Phinney, B S; Phinney Bs Fau - Shulaev, V; Shulaev V Fau - Negre-Zakharov, F; Negre-Zakharov F Fau - Sadka, A; Sadka A Fau - Blumwald, E; Blumwald, E. Label-free shotgun proteomics and metabolite analysis reveal a significant metabolic shift during citrus fruit development. J. Exp. Bot., 2011, 62, 5367–5384.
- Jayarajan, S.; Sharma, R.R.; Sethi, S.; Saha, S.; Sharma, V.K.; Singh, S. Chemical and nutritional evaluation of major genotypes of nectarine (Prunus persica var nectarina) grown in North-Western Himalayas. J. Food Sci. Technol. -Mysore 2019, 56, 4266–4273. [CrossRef] [PubMed]
- Sogvar, O B; Rabiei, V; Razavi, F; Gohari, G. Phenylalanine alleviates postharvest chilling injury of plum fruit by modulating antioxidant system and enhancing the accumulation of phenolic compound. Food Technol. Biotech. 2020, 58, 433–444. [CrossRef] [PubMed]
- Cercos, M; Soler, G; Iglesias, D J; Gadea, J; Forment, J; Talon, M. Global analysis of gene expression during development and ripening of citrus fruit flesh. A proposed mechanism for citric acid utilization. Plant Mol. Biol. 2006, 62, 513–27. [CrossRef] [PubMed]
- Rashmi, H B; Negi, P S. Phenolic acids from vegetables: A review on processing stability and health benefits. Food Res.Int. 2020, 136, 109298. [CrossRef] [PubMed]
- Anantharaju, P G; Gowda, P C; Vimalambike, M G; Madhunapantula, S V. An overview on the role of dietary phenolics for the treatment of cancers. Nutr. J. 2016, 15, 99. [CrossRef]
- Stuper-Szablewska, K; Perkowski, J. Phenolic acids in cereal grain: Occurrence, biosynthesis, metabolism and role in living organisms. Crit. Rev. Food Sci. and Nutr. 2017, 59, 664–675.
- dos Santos Rocha, C; Magnani, M; Jensen Klososki, S; Aparecida Marcolino, V; dos Santos Lima, M; Queiroz de Freitas, M; Carla Feihrmann, A; Eduardo Barão, C; Colombo Pimentel, T. High-intensity ultrasound influences the probiotic fermentation of Baru almond beverages and impacts the bioaccessibility of phenolics and fatty acids, sensory properties, and in vitro biological activity. Food Res. Int. 2023, 173, 113372.
- Wan, X; Wu, J; Wang, X; Cui, L; Xiao, Q. Accumulation patterns of flavonoids and phenolic acids in different colored sweet potato flesh revealed based on untargeted metabolomics. Food Chem.-X 2024, 23, 101551. [CrossRef] [PubMed]
- Pang, L L; Chen, L; Jiang, Y Q; Zhou, C; Liang, F H; Duan, L H. Role of exogenous melatonin in quality maintenance of sweet cherry: Elaboration in links between phenolic and amino acid metabolism. Food Biosci. 2023, 56, 103223.
- Clifford, M N; Ludwig, I A; Pereira-Caro, G; Zeraik, L; Borges, G; Almutairi, T M; Dobani, S; Bresciani, L; Mena, P; Gill, C I R; Crozier, A. Exploring and disentangling the production of potentially bioactive phenolic catabolites from dietary (poly)phenols, phenylalanine, tyrosine and catecholamines. Redox Biol. 2024, 71, 103068.
- Portu, J; López-Alfaro, I; Gómez-Alonso, S; López, R; Garde-Cerdán, T. Changes on grape phenolic composition induced by grapevine foliar applications of phenylalanine and urea. Food Chem. 2015, 180, 171–180. [CrossRef]
- Androutsopoulos, V P; Papakyriakou, A; Vourloumis, D; Tsatsakis, A M; Spandidos, D A. Dietary flavonoids in cancer therapy and prevention: substrates and inhibitors of cytochrome P450 CYP1 enzymes. Pharmacol. Ther. 2010, 126, 9–20. [CrossRef] [PubMed]
- Zhu, C; Zhou, X; Long, C; Du, Y; Li, J; Yue, J; Pan, S. Variations of flavonoid composition and antioxidant properties among different cultivars, fruit tissues and developmental stages of Citrus fruits. Chem. Biodivers. 2020, 17, 201900690.
- Carr, A C; Rosengrave, P C; Bayer, S; Chambers, S; Mehrtens, J; Shaw, G M. Hypovitaminosis C and vitamin C deficiency in critically ill patients despite recommended enteral and parenteral intakes. Critical Care 2017, 21, 300. [CrossRef] [PubMed]
- Maiani, G; Periago Castón, M J; Catasta, G; Toti, E; Cambrodón, I G; Bysted, A; Granado-Lorencio, F; Olmedilla-Alonso, B; Knuthsen, P; Valoti, M; Böhm, V; Mayer-Miebach, E; Behsnilian, D; Schlemmer, U. Carotenoids: Actual knowledge on food sources, intakes, stability and bioavailability and their protective role in humans. Mol. Nutr. Food Res. 2009, 53 (Suppl. 2), S194–S218.
- Bernstein, P S; Li, B; Vachali, P P; Gorusupudi, A; Shyam, R; Henriksen, B S; Nolan, J M. Lutein, zeaxanthin, and meso-zeaxanthin: The basic and clinical science underlying carotenoid-based nutritional interventions against ocular disease. Prog. Retin. Eye Res. 2016, 50, 34–66. [CrossRef] [PubMed]
- Sakushima, A; Maoka, T; Ohno, K; Coskun, M; Guvenc, A; Erdurak, C S; Ozkan, A M; Seki, K; Ohkura, K. Major antioxidative substances in Boreava orientalis(Cruciferae). Nat. Prod. Lett. 2000, 14, 441–446.
- Assefa, A D; Saini, R K; Keum, Y-S. Fatty acids, tocopherols, phenolic and antioxidant properties of six citrus fruit species: a comparative study. J. Food Meas. Charact. 2017, 11, 1665–1675. [CrossRef]
- Matsuo, Y; Miura, L A; Araki, T; Yoshie-Stark, Y. Proximate composition and profiles of free amino acids, fatty acids, minerals and aroma compounds in Citrus natsudaidai peel. Food Chem. 2019, 279, 356–363. [CrossRef] [PubMed]
- Drewnowski, A; Smith, J; Fulgoni, V L. The new hybrid nutrient density score NRFh 4:3:3 tested in relation to affordable nutrient density and healthy eating index 2015: analyses of NHANES data 2013-16. Nutrients 2021, 13, 1734. [CrossRef]
- Fu, H; Lee, C H; Nolden, A A; Kinchla, A J; Chen, B. Nutrient density, added sugar, and fiber content of commercially available fruit snacks in the United States from 2017 to 2022. Nutrients 2024, 16, 292. [CrossRef]
- Drewnowski, A; Fulgoni, V L. New nutrient rich food nutrient density models that include nutrients and myplate food groups. Front. Nutr. 2020, 7, 107.
- Lin, J J; Hui, D F; Kumar, A; Yu, Z G; Huang, Y H. Climate change and/or pollution on the carbon cycle in terrestrial ecosystems. Front. in Env. Sci. 2023, 11, 1253172.
Figure 1.
Locations of Newhall navel oranges with geographical indications from Fengjie, Ganzhou, and Zigui in China.
Figure 1.
Locations of Newhall navel oranges with geographical indications from Fengjie, Ganzhou, and Zigui in China.
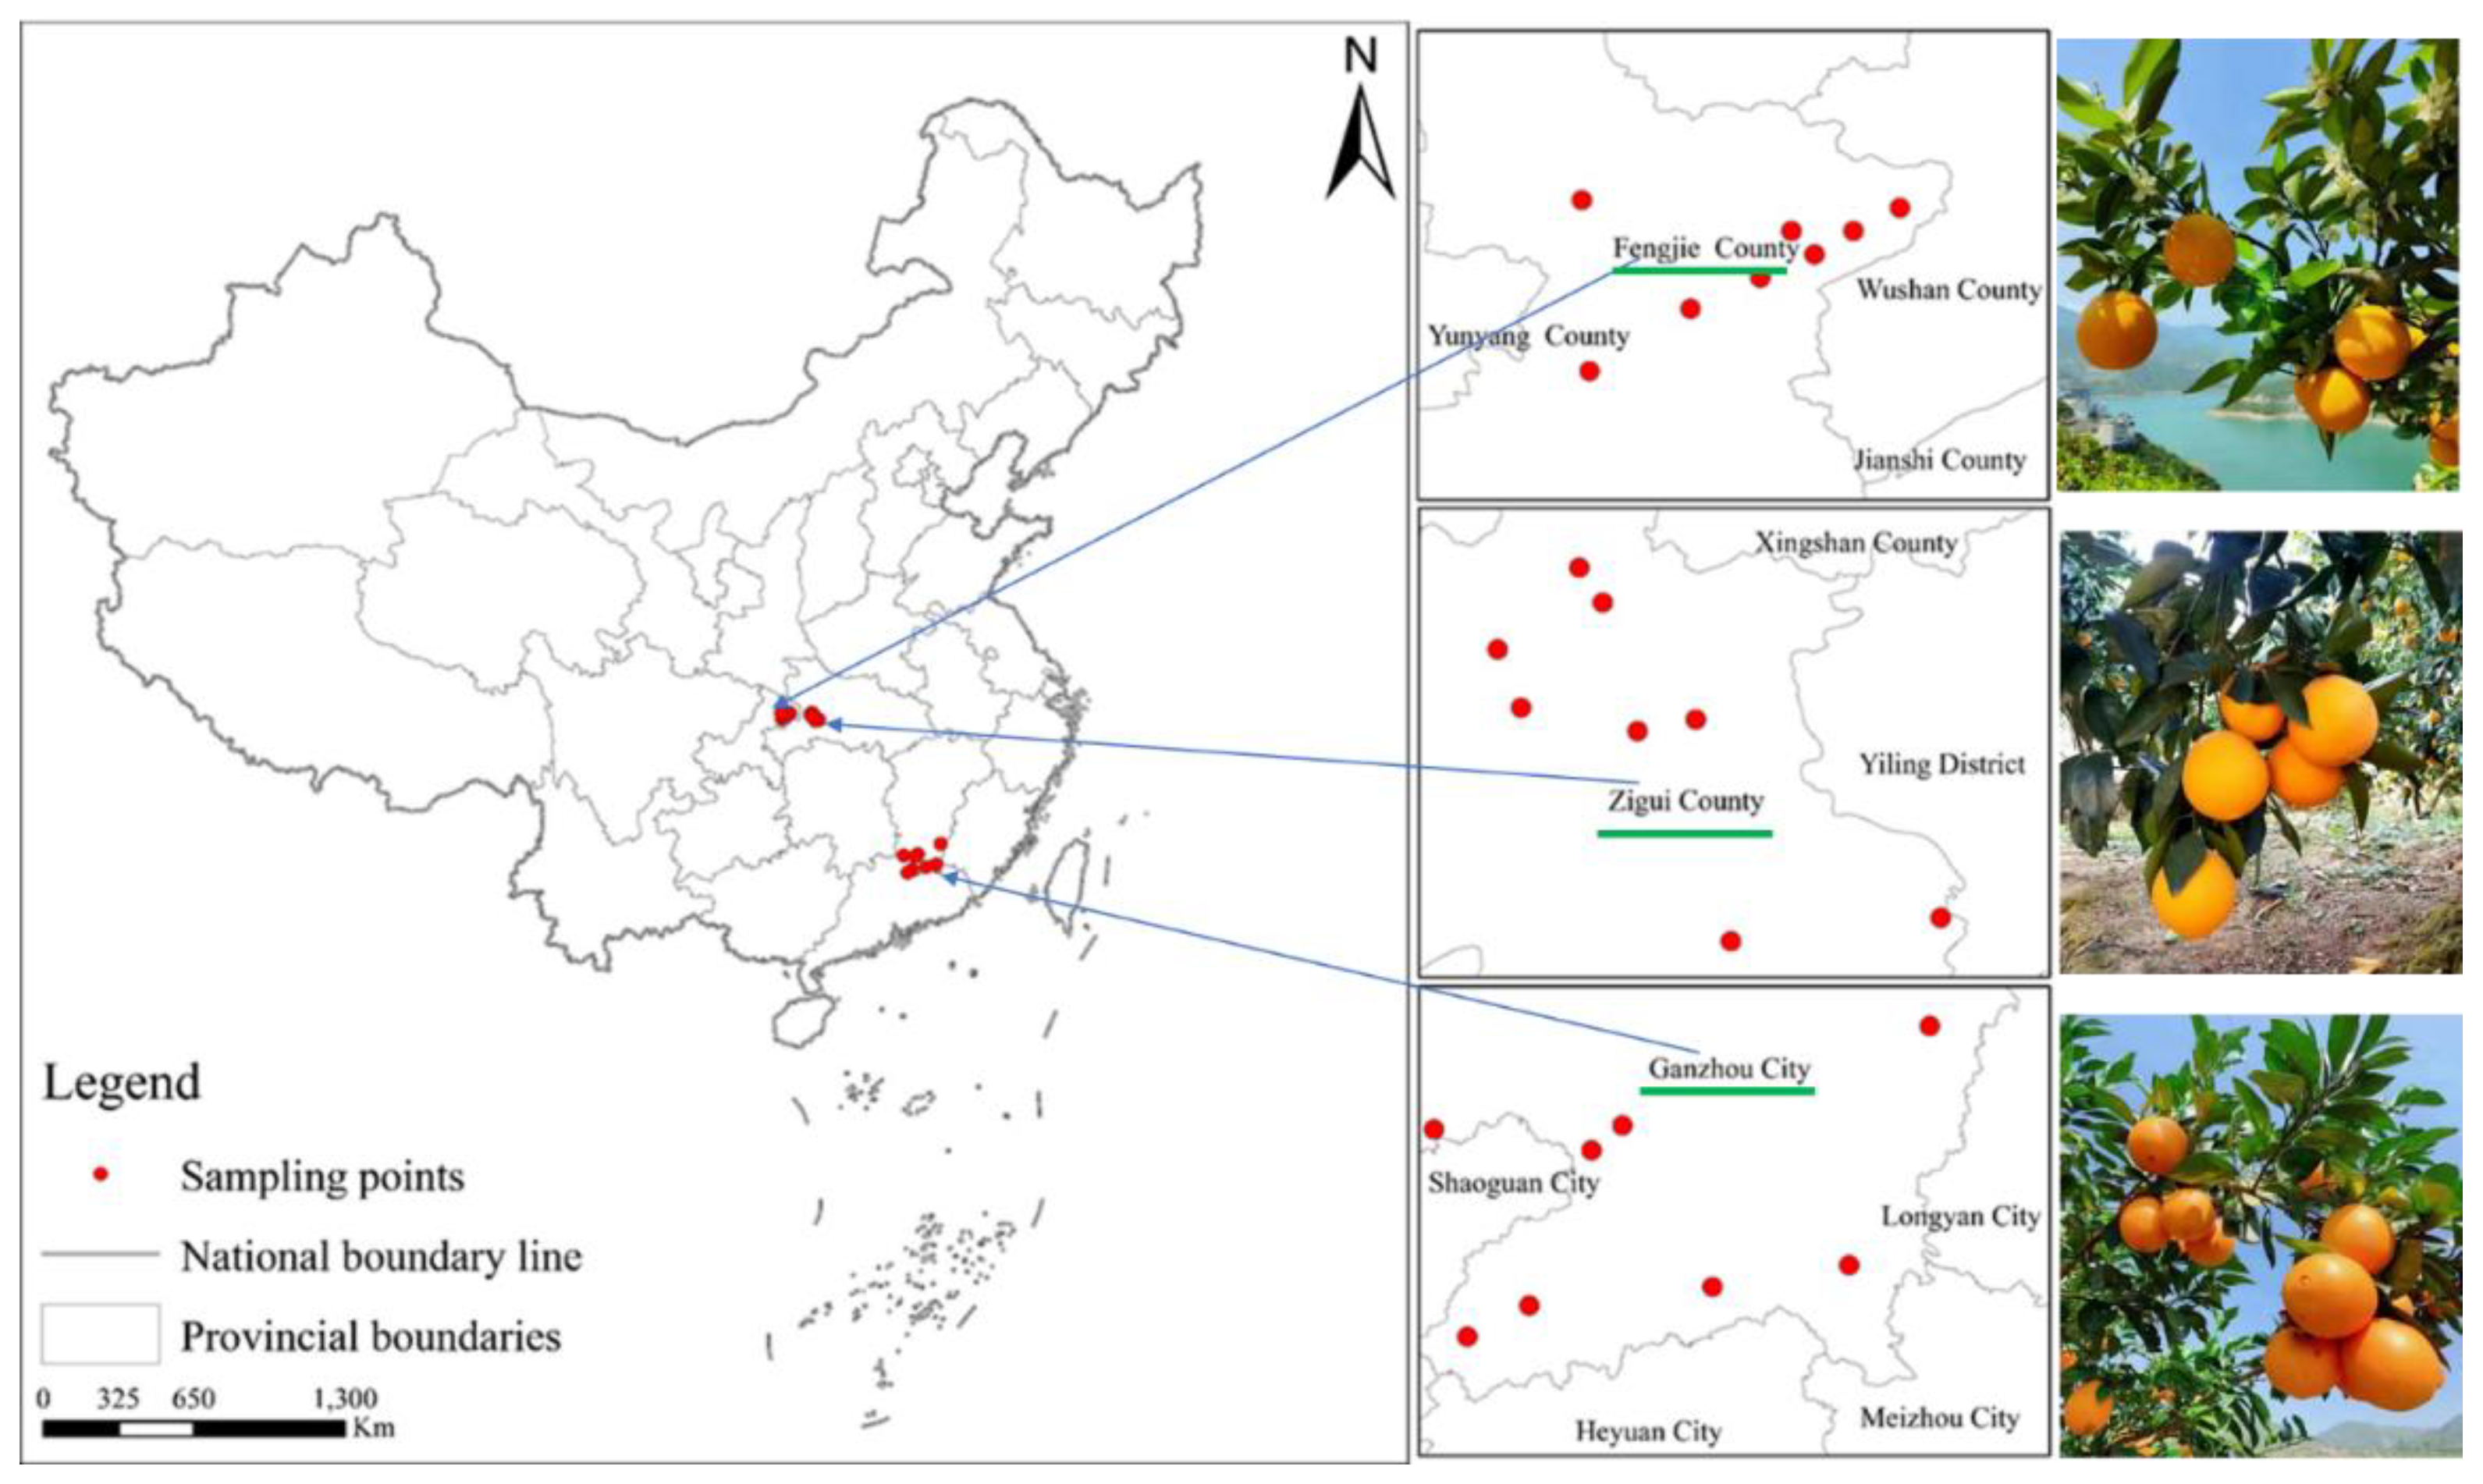
Figure 2.
Climatic conditions of Fengiie, Ganzhou, and Zigui in 2022.
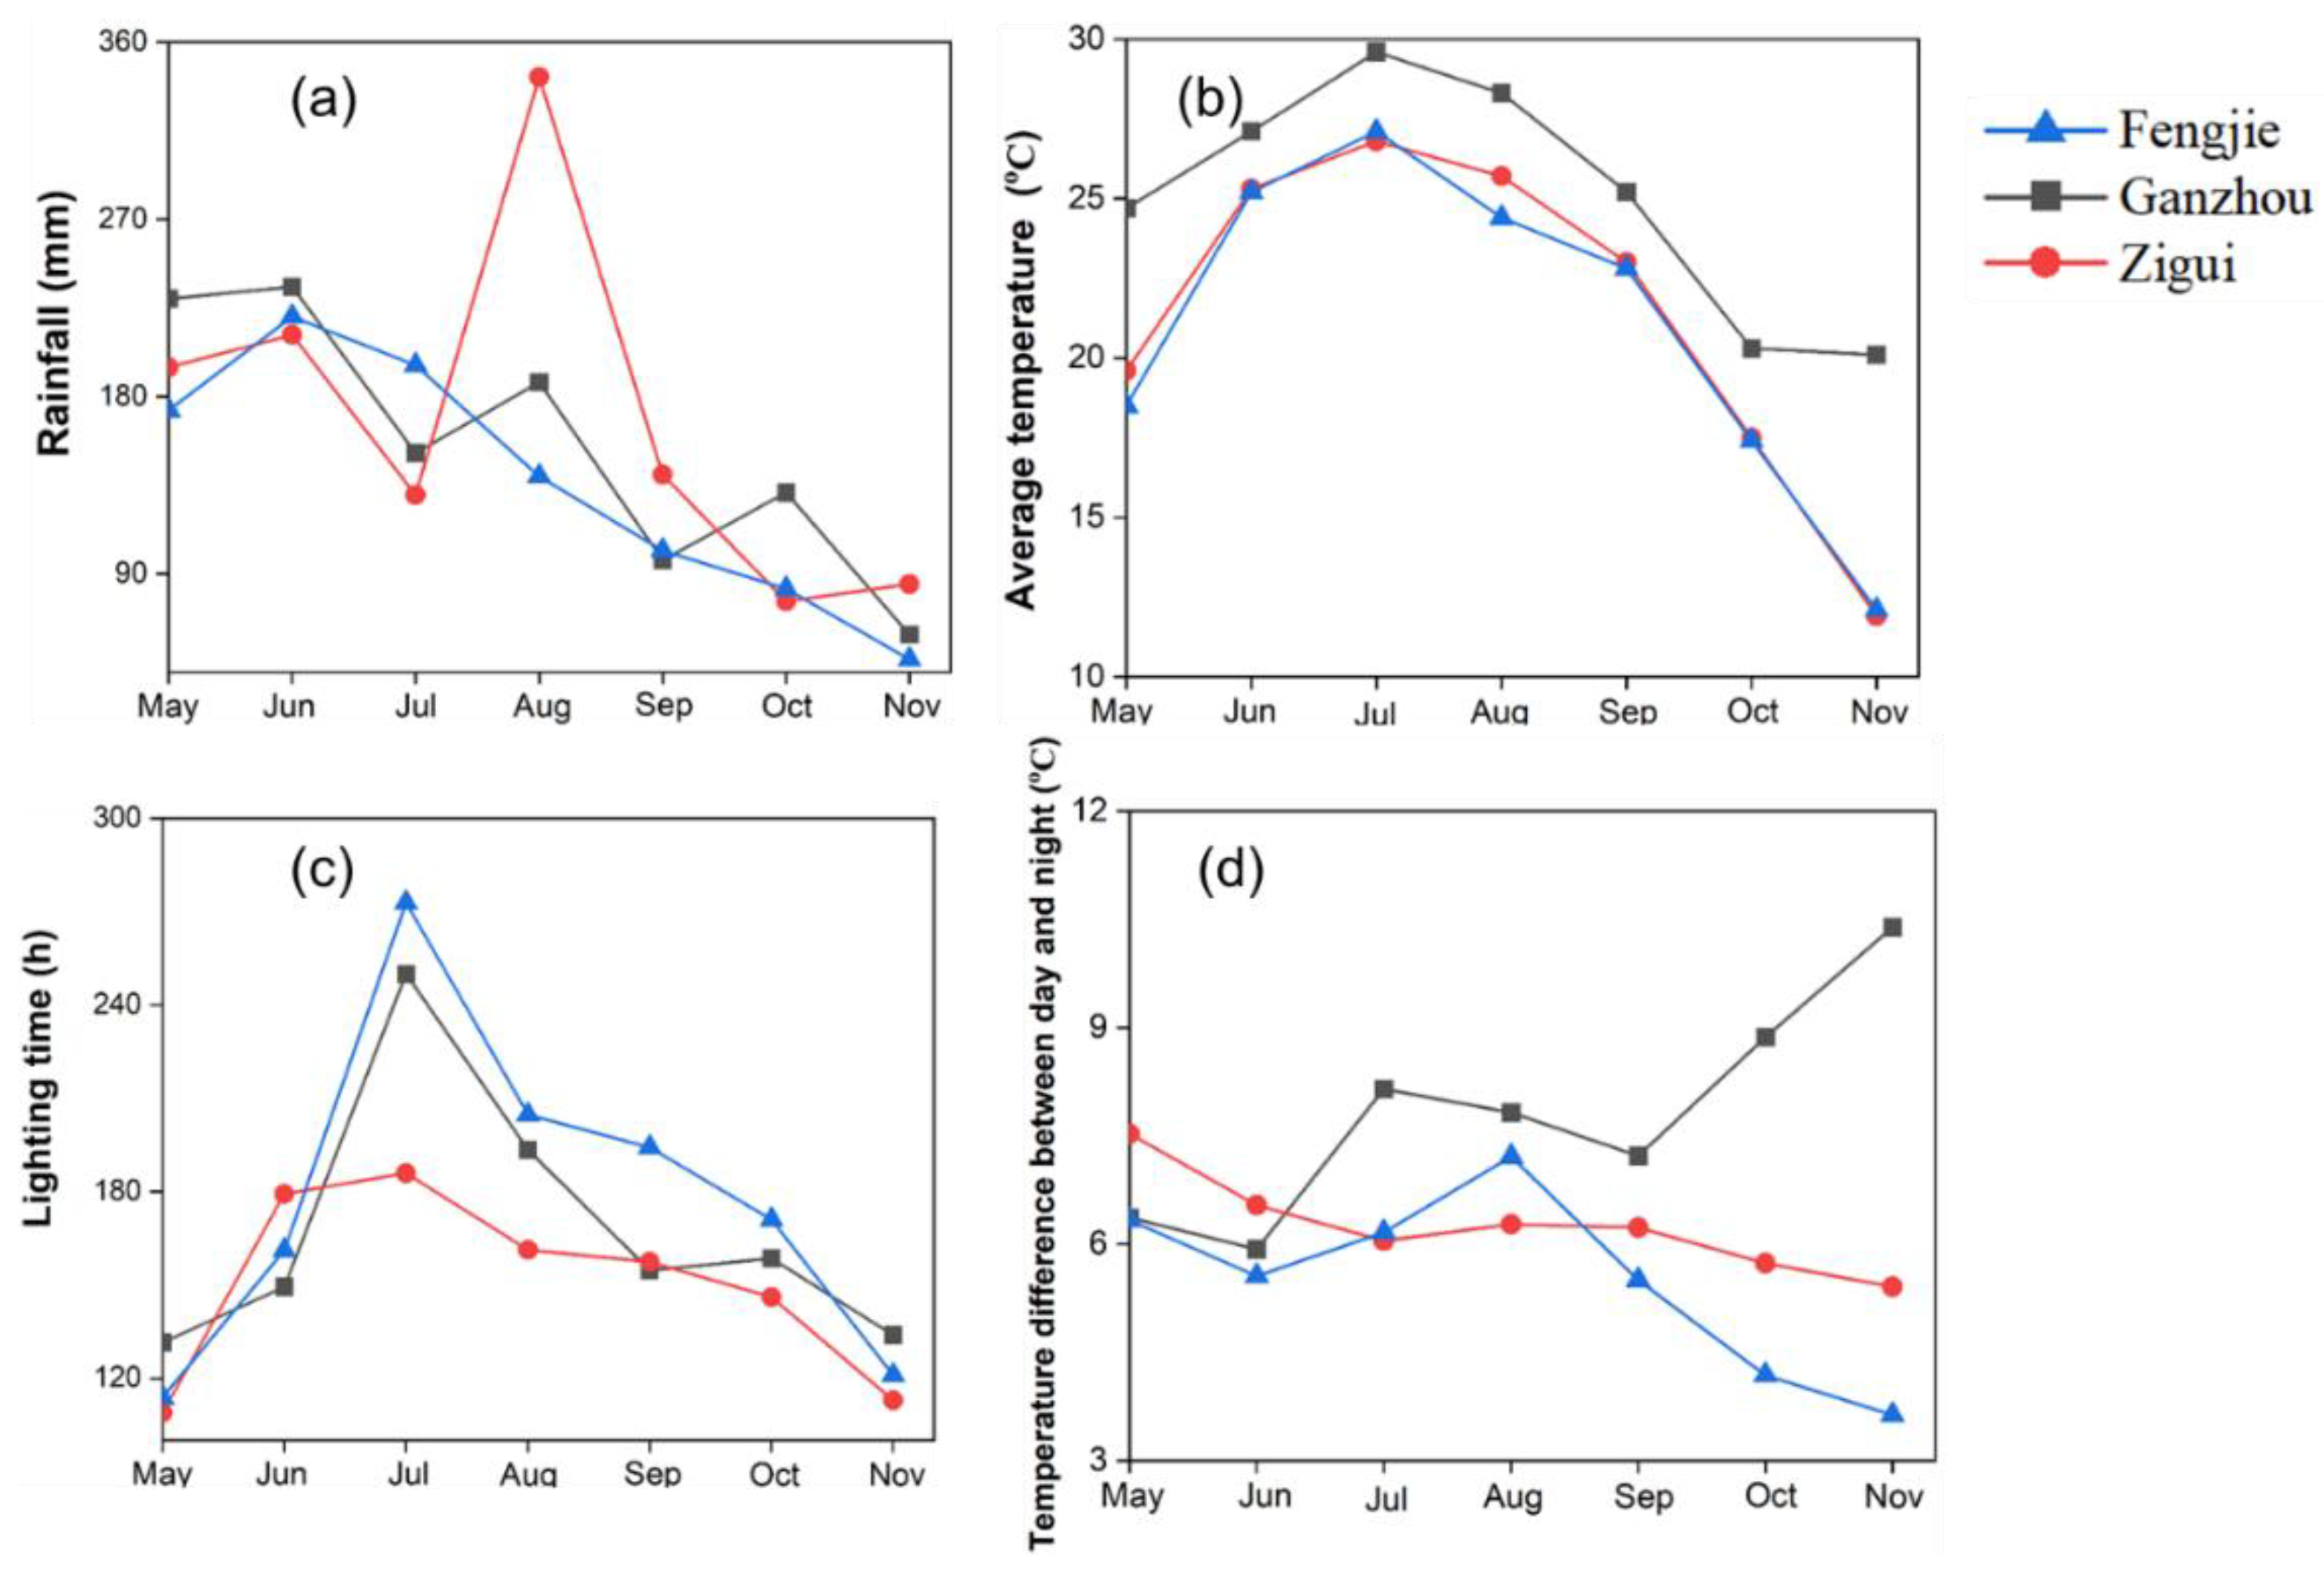
Figure 3.
The titratable acidity, soluble solids, and vitamin C contents in peeled or whole citrus. The different lowercase letters above the error bars indicate the significance difference in the same index between samples with different origins under the same treatment.
Figure 3.
The titratable acidity, soluble solids, and vitamin C contents in peeled or whole citrus. The different lowercase letters above the error bars indicate the significance difference in the same index between samples with different origins under the same treatment.
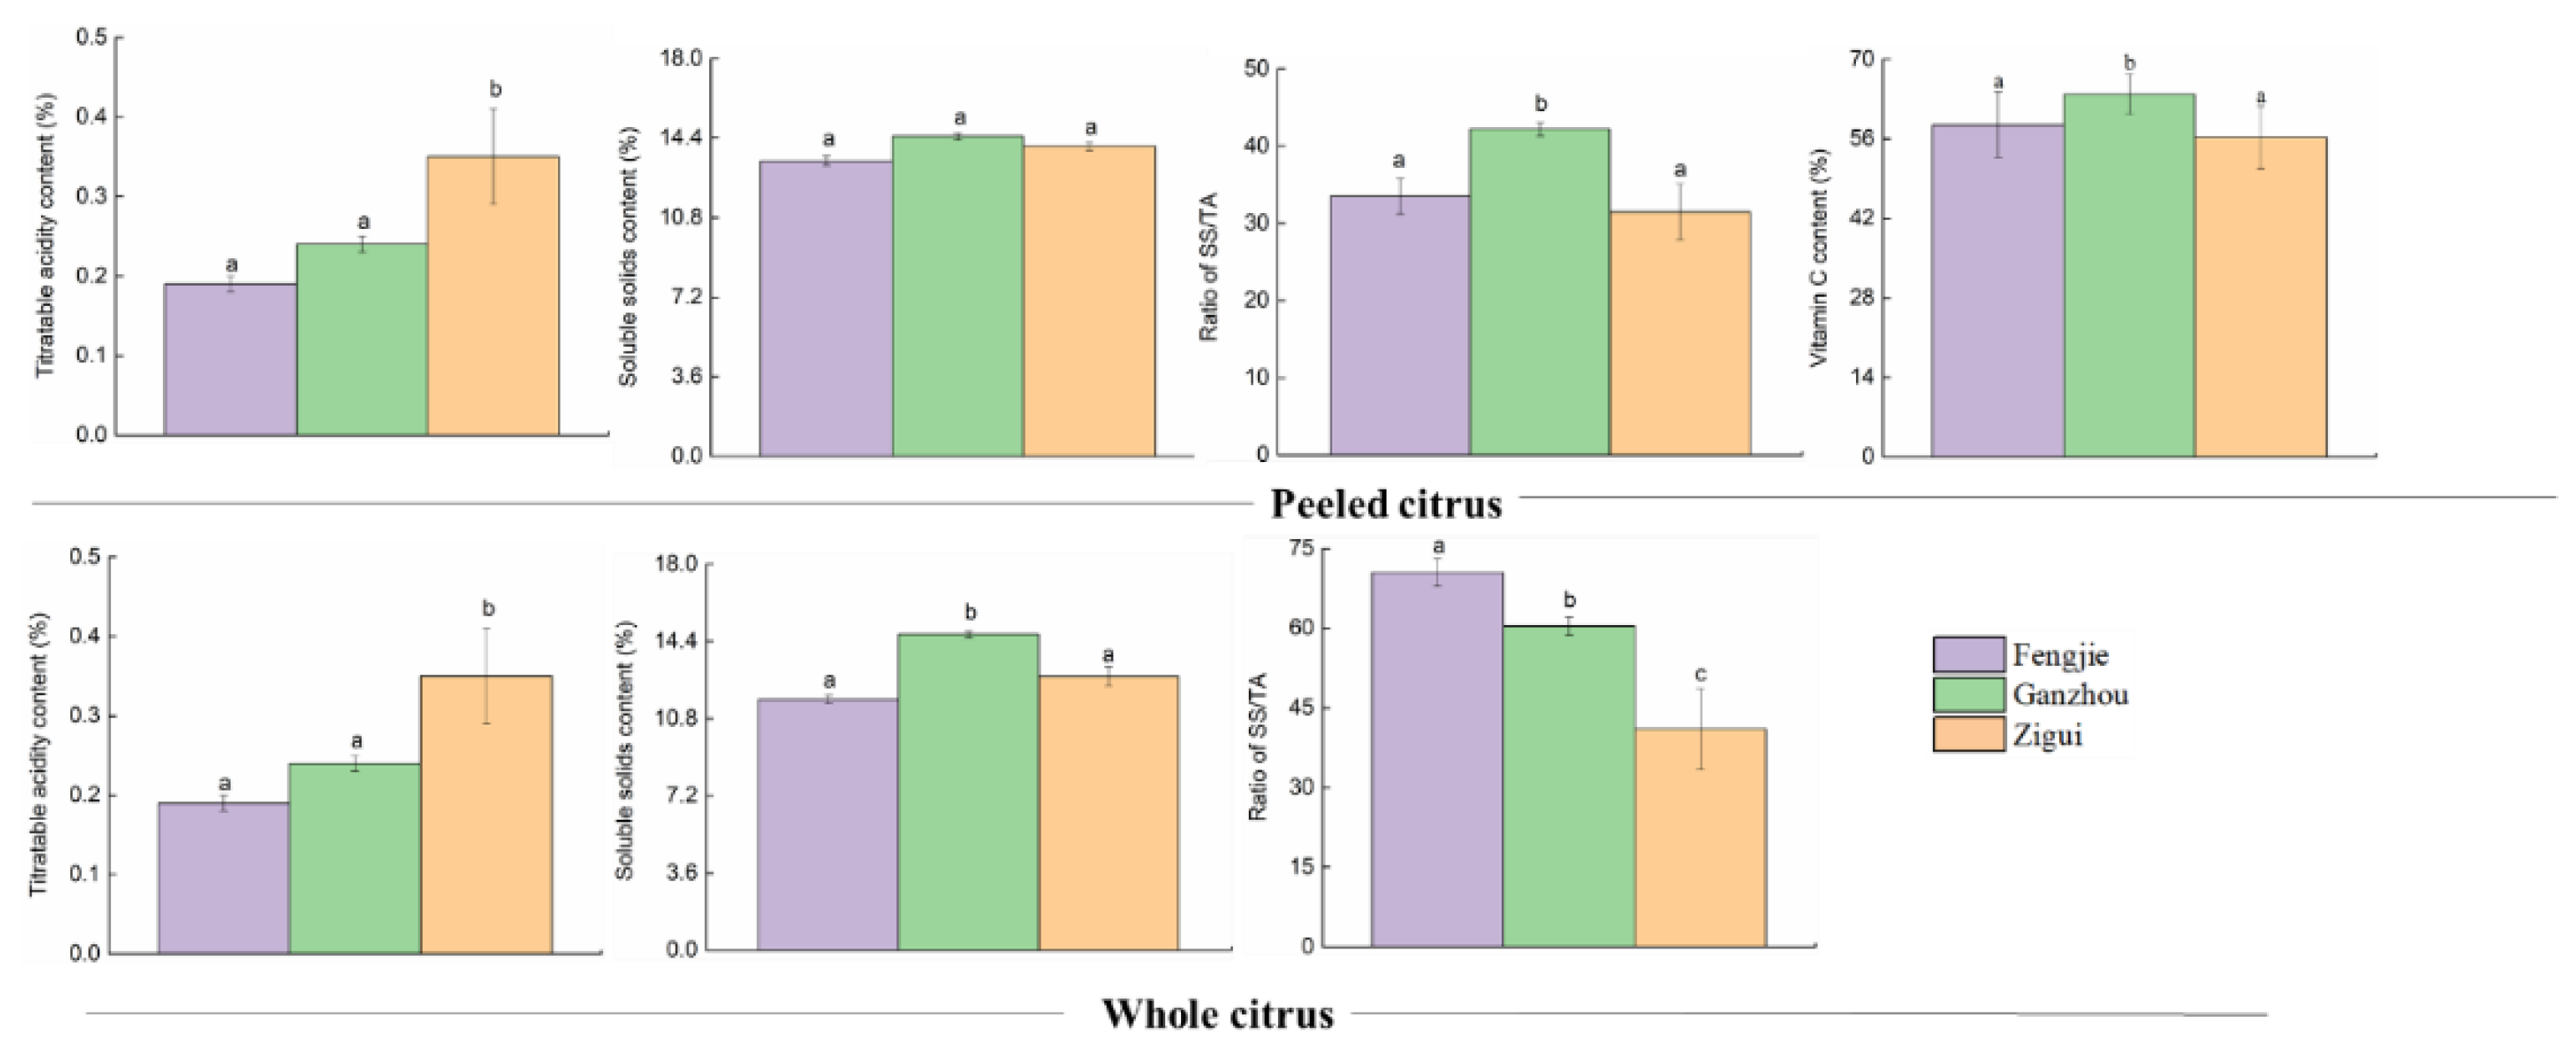
Figure 4.
Classification and quantity of screened metabolites. "Others" refers to compounds that cannot be classified into the above categories.
Figure 4.
Classification and quantity of screened metabolites. "Others" refers to compounds that cannot be classified into the above categories.
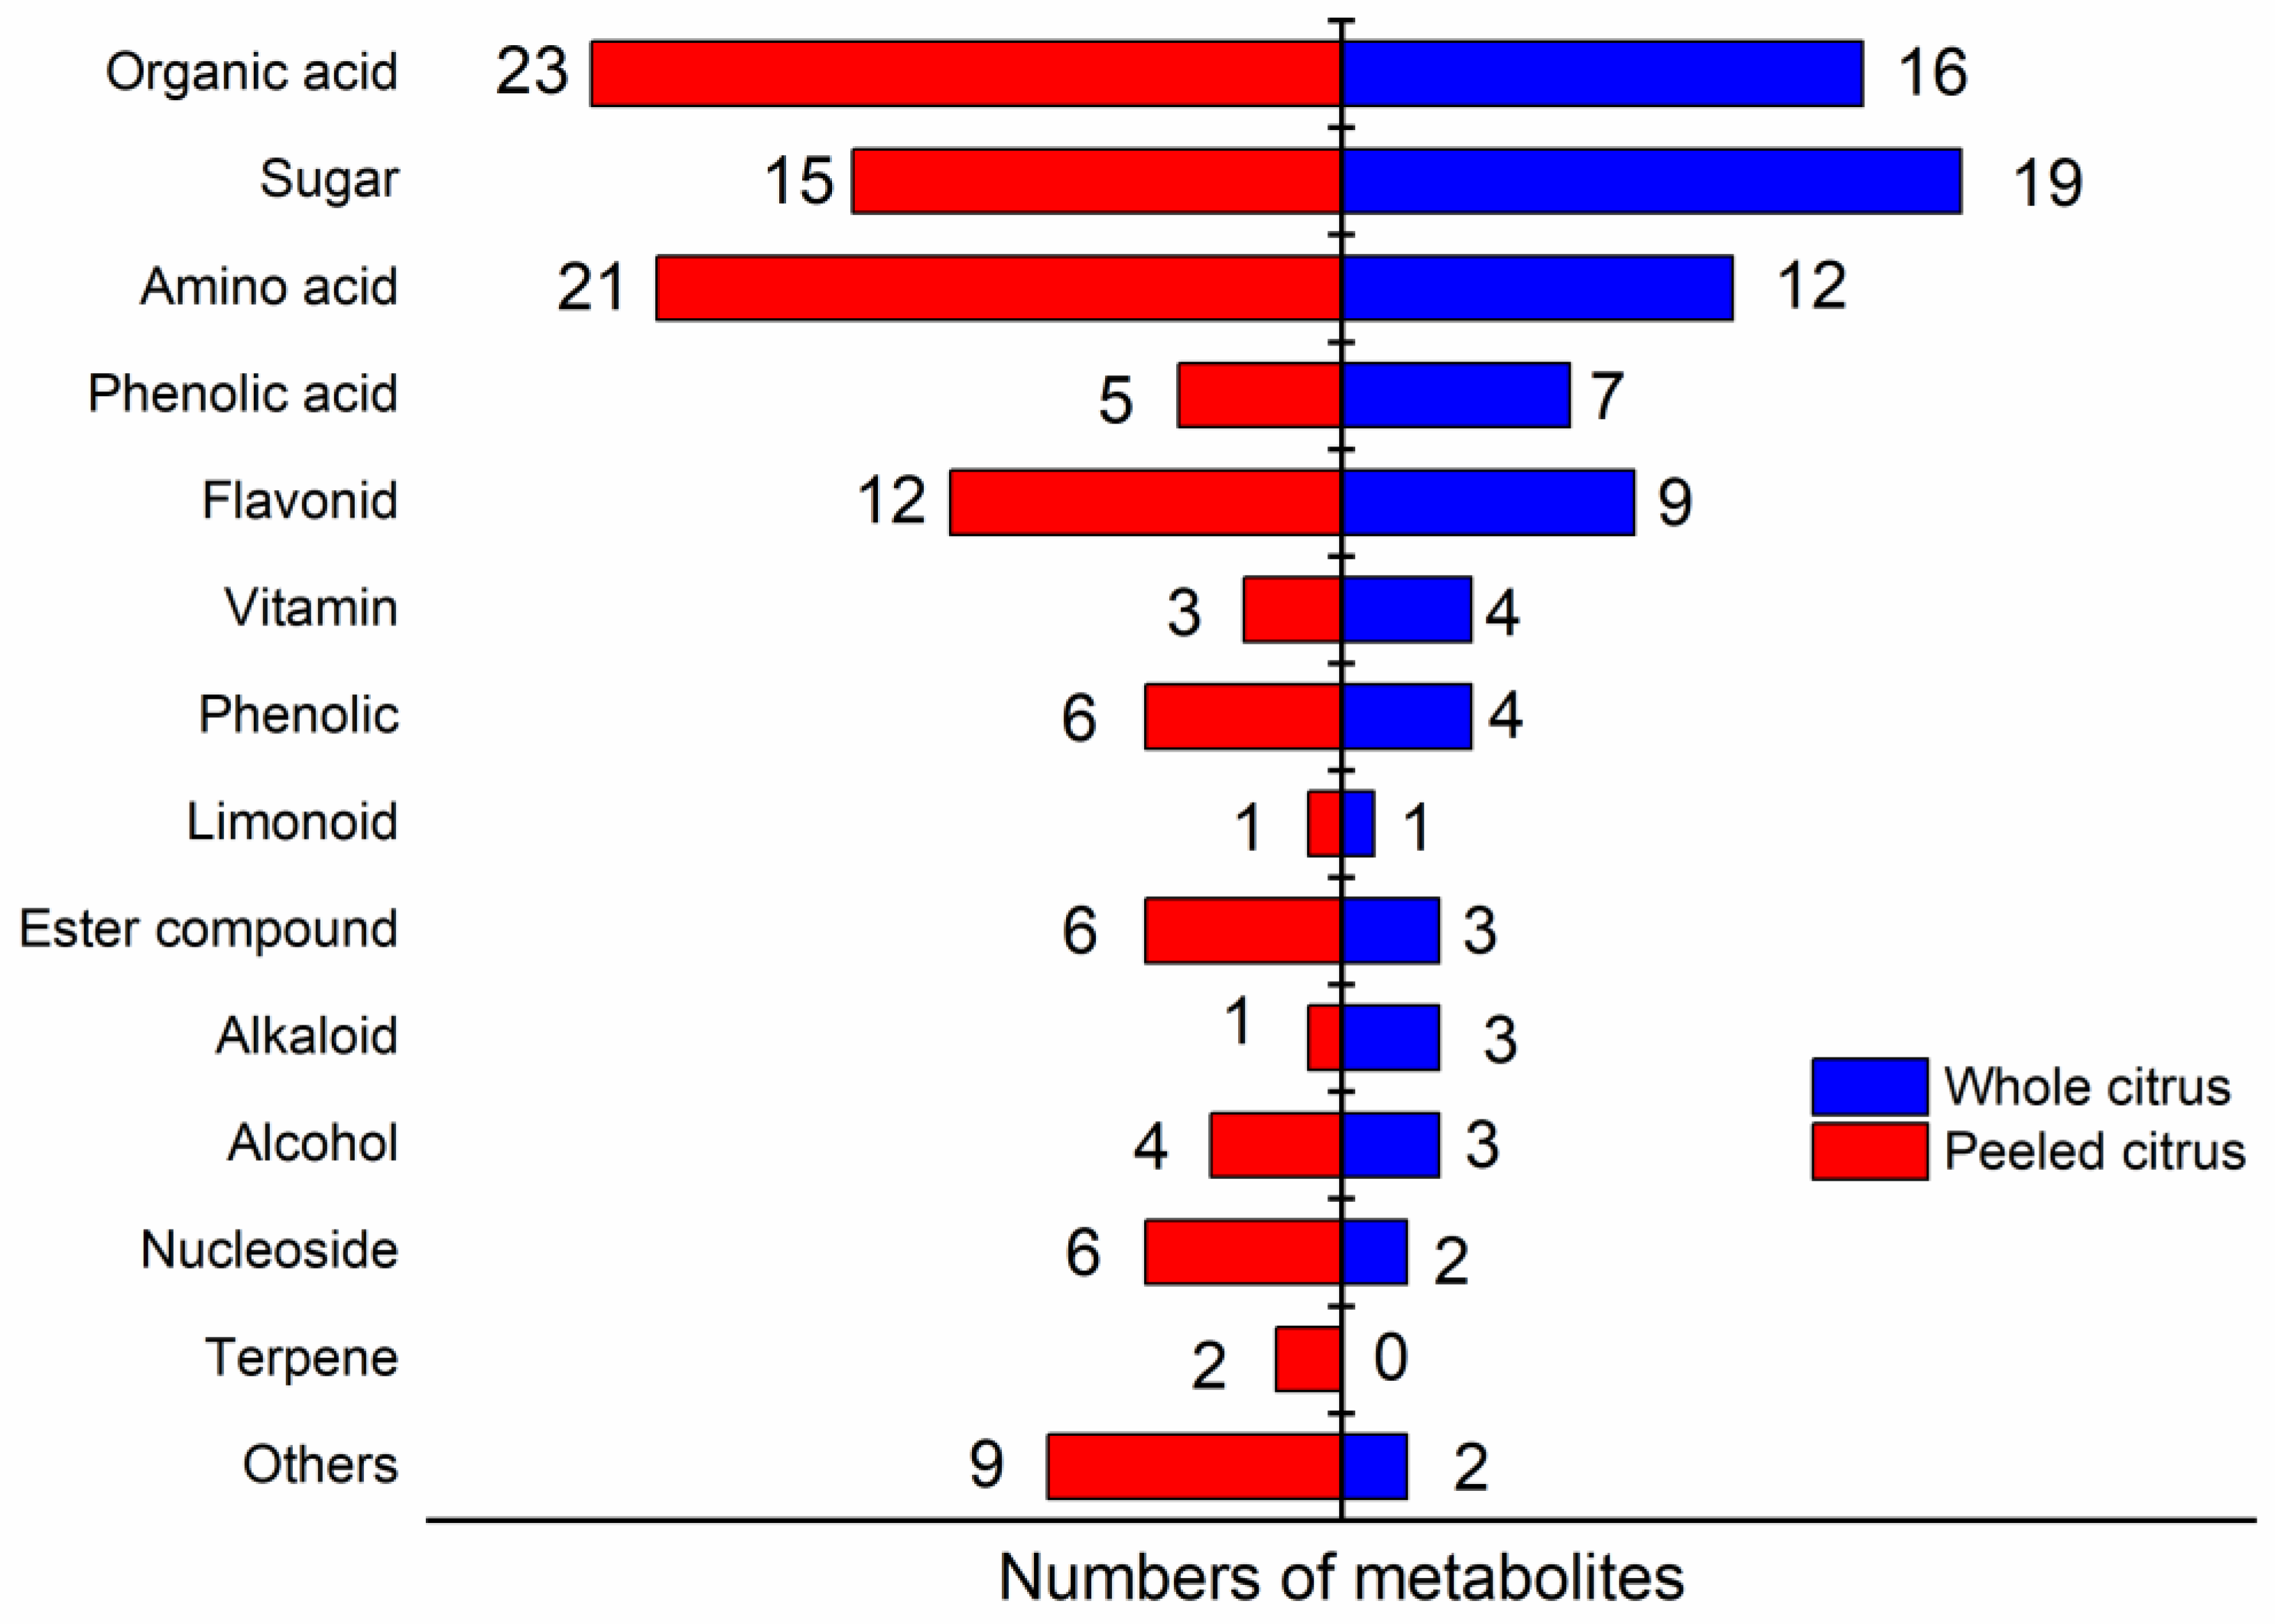
Figure 5.
PCA and OPLS-DA score plots of peeled samples or unpeeled samples.
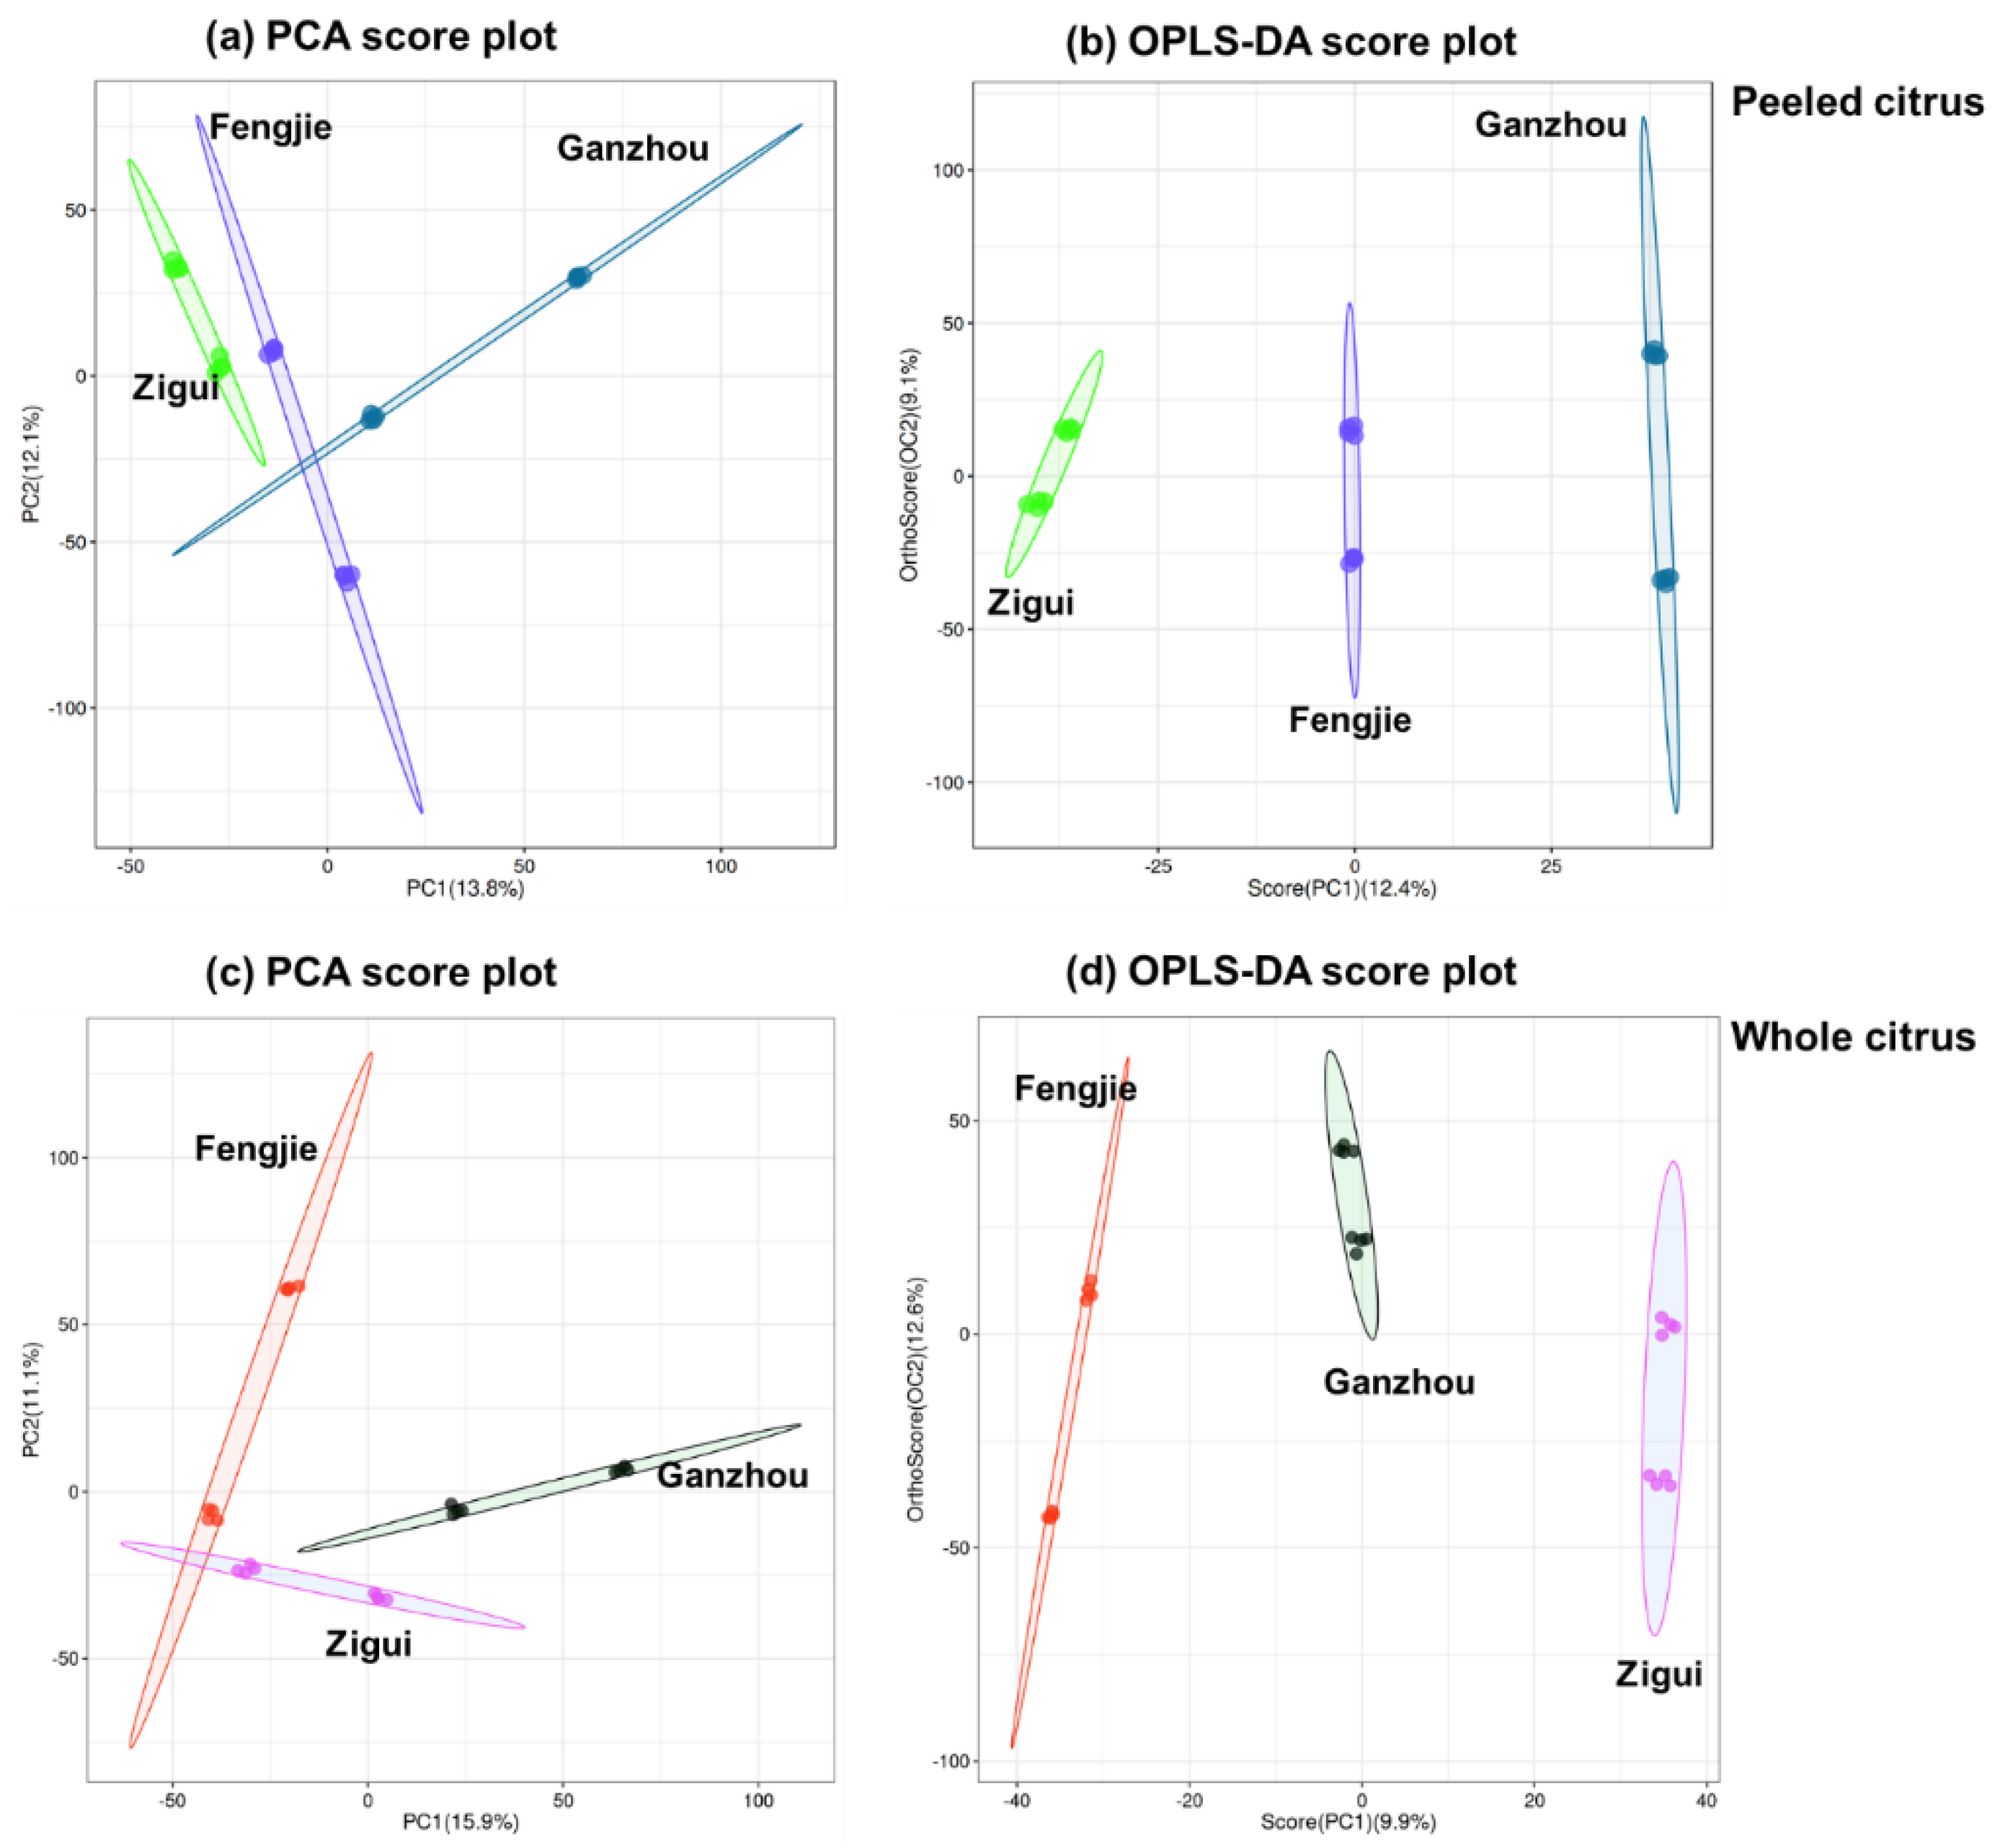
Figure 6.
The top 10 most important metabolites identified by metabolomics in the peeled (a) and the whole citruses (b). The number in parentheses in each subgraph represents the variable importance to projection value of this metabolite. Different Lowercase letters indicate significant difference between areas (p < 0.05).
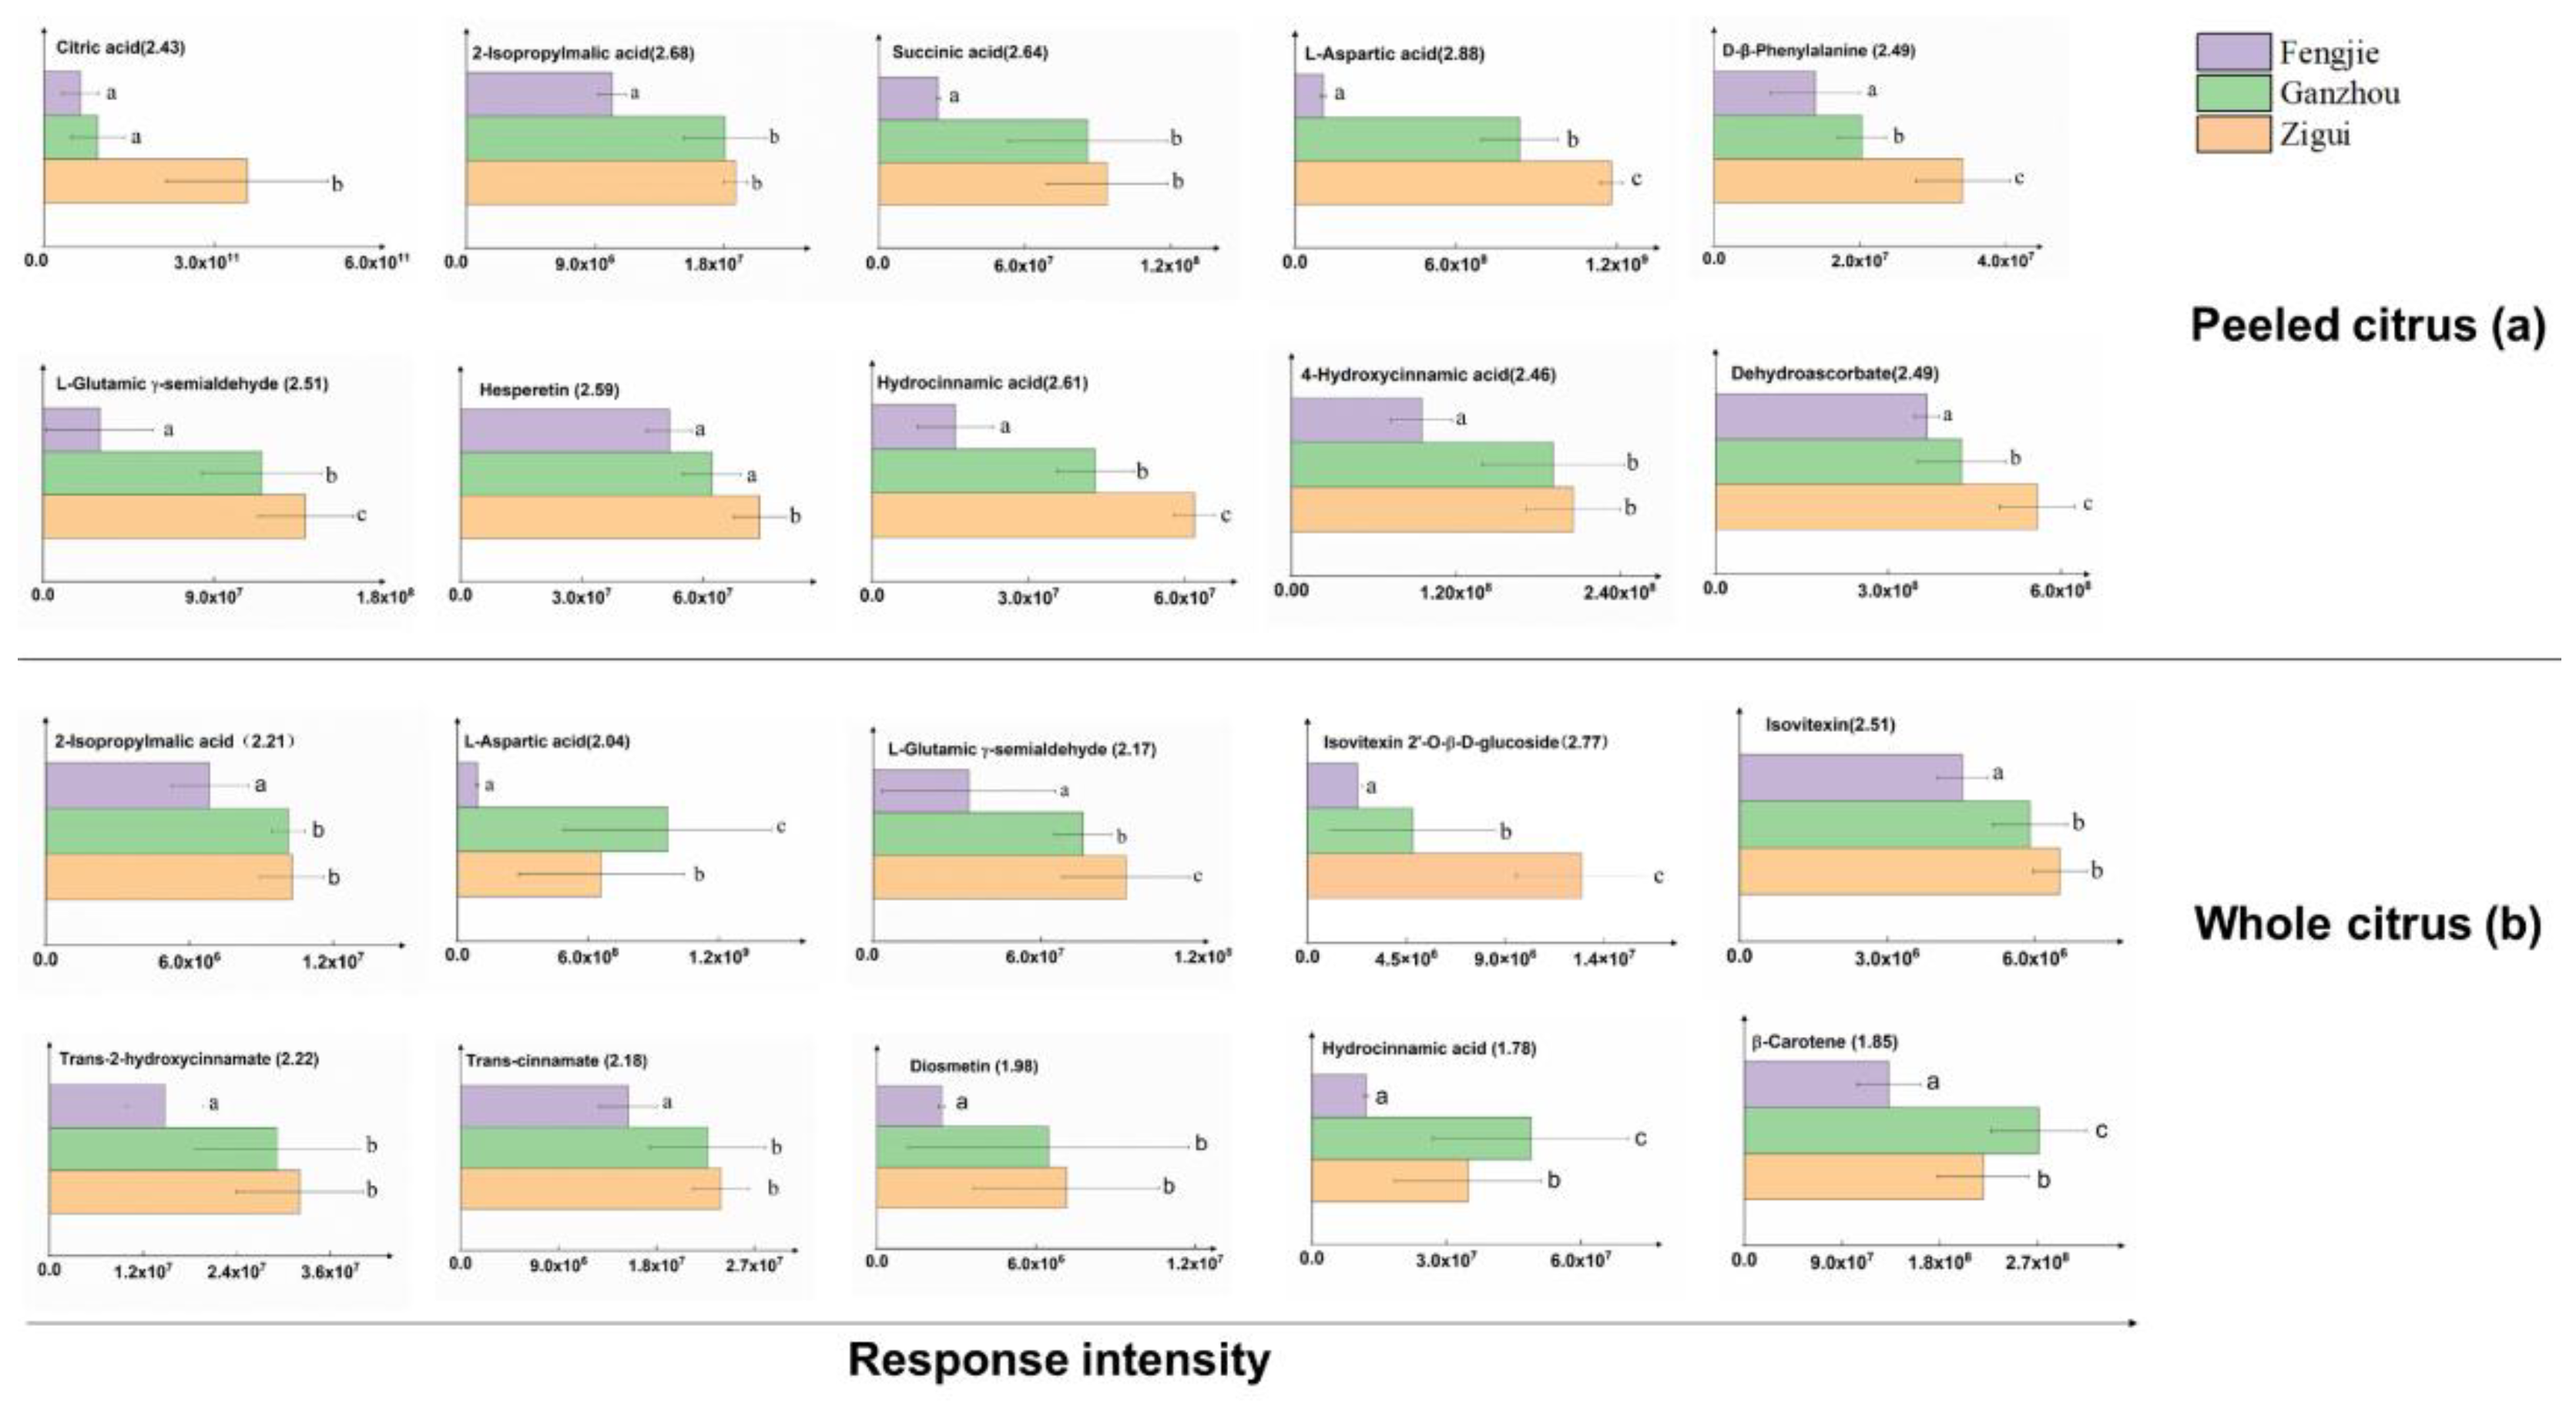

Table 1.
Nutritional assessment of the peeled and whole citruses from Fengjie (FJ), Ganzhou (GZ), and Zigui (ZG) based on the ten most important metabolites selected from peeled or peeled samples after removing the organic acids.
Table 1.
Nutritional assessment of the peeled and whole citruses from Fengjie (FJ), Ganzhou (GZ), and Zigui (ZG) based on the ten most important metabolites selected from peeled or peeled samples after removing the organic acids.
| samples | number | Metabolites | Assigned score | ||
| FJ | GZ | ZG | |||
| Peeled | 1 | L-aspartic acid | 1 | 2 | 3 |
| 2 | D-β-phenylalanine | 1 | 2 | 3 | |
| 3 | L-glutamic γ-semialdehyde | 1 | 2 | 3 | |
| 4 | Hesperetin | 1 | 1 | 2 | |
| 5 | Hydrocinnamic acid | 1 | 2 | 3 | |
| 6 | 4-hydroxycinnamic acid | 1 | 2 | 2 | |
| 7 | DHA | 1 | 2 | 3 | |
| Total score | 7 | 13 | 19 | ||
| Whole | 1 | L-aspartic acid | 1 | 3 | 2 |
| 2 | L-glutamic-semialdehyde | 1 | 2 | 3 | |
| 3 | Isovitexin 2′-O-β-D-glucoside | 1 | 2 | 3 | |
| 4 | Isovitexin | 1 | 2 | 2 | |
| 5 | Trans-2-hydrocinnamate | 1 | 2 | 2 | |
| 6 | Trans-cinnamate | 1 | 2 | 2 | |
| 7 | Diosmetin | 1 | 2 | 2 | |
| 8 | Hydrocinnamic acid | 1 | 3 | 2 | |
| 9 | β-carotene | 1 | 3 | 2 | |
| Total score | 9 | 21 | 20 | ||
Disclaimer/Publisher’s Note: The statements, opinions and data contained in all publications are solely those of the individual author(s) and contributor(s) and not of MDPI and/or the editor(s). MDPI and/or the editor(s) disclaim responsibility for any injury to people or property resulting from any ideas, methods, instructions or products referred to in the content. |
© 2024 by the authors. Licensee MDPI, Basel, Switzerland. This article is an open access article distributed under the terms and conditions of the Creative Commons Attribution (CC BY) license (http://creativecommons.org/licenses/by/4.0/).
Copyright: This open access article is published under a Creative Commons CC BY 4.0 license, which permit the free download, distribution, and reuse, provided that the author and preprint are cited in any reuse.


