Submitted:
22 October 2024
Posted:
22 October 2024
You are already at the latest version
Abstract
A common technique for producing large-scale hollow plastic items is rotomoulding. Rotation speed, mould design, and temperature management significantly affect the quality of finished products. The growing demand may cause the rotomoulding industry to reach a peak soon. Few studies have been applied in the industrial sector. Meanwhile, the lack of sufficient research on the phase transition from the heat source for the rotomoulding procedure led to a great research gap in this field. Although, their conclusions contribute significantly to the topic but cannot be considered accurate in the analysis. Proper temperature variations in both the heating and cooling phases impact the final product quality. Moreover, if the required temperature is not achieved it may result in raw material ( HDPE, LLDPE) loss. To produce the necessary amount of hot air by convection, this review article focuses on the use of ducts as the medium for hot air circulation to the mould, ducting model analysis, and mould model adjustments. Additionally, insulation has been discussed concerning sustainable heat, which could help the industry to better comprehend the procedure.
Keywords:
Rotational moulding
; convection
; mould area enhancement
; cycle time reduction
; pressure drop
; air flow rate
; near-wall treatment
; insulation
; carbon emission
1. Introduction
A Rotational Moulding, often known as the rotomoulding process is a method to fabricate hollow plastic products. This process is suitable for the manufacturing of hollow plastic products which are complex in design, shape, size and precise surface texture[1]. The high-quality products rely on critical parameters like heating, melting, and cooling of the raw material and the rotational speed of the mould. The rotational moulding process has gained popularity in the last two decades in producing hollow seamless products [2,3,4] such as large container tanks. Rotational moulding processes are mostly renowned for making tanks (Industrial or Agricultural) using HDPE (High-density polyethylene) and LLDPE (Linear low-density polyethylene). Polyethylene (PE) is the widely used material in the process for its versatile characteristics and properties such as high rigidity, flexibility, high tensile strength and impact resistance. Existing research works do not consider the importance of heat transfer through ducting systems that are used in rotational moulding. The global market for rotational moulding machines, which was projected to reach US$ 918.7 million in 2023, has not seen enough discussion of the technique to predict significant growth shortly. The market is anticipated to grow at a compound annual growth rate (CAGR) of 3.7% from 2023 to 2033, reaching US$ 1,321 million. The international packaging machinery market, estimated to be worth US$60.91 billion in 2022, was dominated by 1% to 2% by rotational moulding machines[5].
Heating a charged mould at a constant temperature during the RM process is considered the most critical setting. Achieving stability of the required high temperature at atmospheric air in a melting stage is the major challenge in the rotational moulding process. Polypropylene (PP) exhibits more thermal instability compared to polyethylene (PE). Since the flared behaviour in the monomer unit is due to the presence of hydrogen atom (H) and lower reactivity of peroxyl radicals (P [6,7], which influences the overall stability and polymer chain formation during the moulding process. Although, Sarrabi et al.[8] illustrated the thermal degradation of polypropylene(PP) by proposing a model composed of two distinct levels simulating the enthalpy method derived from the thermal transfer mechanism occurring during a processing operation and oxidation mechanism scheme of free additive polymer in the melt state but they have not compared it with polyethylene which is high in demand nowadays for industries.
The melting of the plastic coating needs proper heat distribution which will finally result in consistent wall thickness and high-quality product. On the contrary, the cooling process is essential in the process to prevent warping, wrinkles and shrinkage which will result if proper cool air or water is not being directed to the mould. All the process comes under the thermal control system technique, which can be performed within a proper ducting system. Long ducts of temperature distribution latency have a dynamic difficulty. The delay is due to the time it takes for the fluid to travel along the ducts. Gerardo et al.[9] gave a general solution to a single duct's dynamic problem with time-dependent inlet and ambient temperatures. Periodic heating time was calculated in the model correlating the effect of the thermal inertia of the heater located at the entrance to a duct for the time-dependent temperature field. The solution effectively addresses the instability of the thermal control system, influencing the design of a duct with a suitable thermal control system. Most importantly, RM's potential as a manufacturing process for polymeric components is limited by several concerns, including difficulties in the clarity of process control, long cycle time, narrow range of applicable polymers, and poor surface finish [10]. Results are limited to the limitations of experimental data, even if the fixed domain model consigns the most trustworthy data in the theoretical model and the semi-empirical approaches to the melting and crystallization state [11,12,13,14,15,16,17,18]. Researchers primarily assessed surface quality in terms of porosity prevalence[19,20,21], degradation severity[22], and warpage degree[22,23,24], given its significance in rotational moulding systems. Nevertheless, other sources assert that because pressurizing bubbles accelerate the rate of breakdown, pressurizing moulding conditions eliminate surface imperfections[25,26,27].
This review paper aims to investigate the past and current development of the heat transfer methods which are being used in the rotational moulding process using ducted. The current analysis estimates that the Australian polyethylene market was worth $2.1 billion in 2018 and will reach $3.8 billion in 2024. Considering that Australia is the driest country in the world, it is crucial to store rainwater for harvesting purposes using sizable tanks and containers [28]. In 2022, the marketplace for water storage systems in Australia was projected to be valued at USD 152.08 million. BlueWeave[29] forecasts that the size of the Australian market for water storage systems will increase at a noteworthy CAGR of 8.49% between 2023 and 2029, to reach a value of USD 282.59 million.
2. Heat Transfer in the Rotational Moulding Process
Rotational moulding is unique among moulding methods for plastic and hollow products. A table of comparison is shown between blow moulding, thermos forming and rotational moulding.

Table 1.
Comparison of Blow Moulding, Thermoforming, and Rotational Moulding [30].
Table 1.
Comparison of Blow Moulding, Thermoforming, and Rotational Moulding [30].
| Factor | Blow Moulding | Thermo Forming | Rotational Moulding |
|---|---|---|---|
| Typical product volume range (c | |||
| Plastic available | Limited | Broad | Limited |
| Feedstock | Pellets | Sheet | Powder/liquid |
| Raw material preparation cost | None | Up to +100% | Up to 100 % |
| Reinforcing fibres | Yes | Yes | Yes, very difficult |
| Mould Materials | Steel / Aluminium | Aluminium | Steel / Aluminium |
| Mould pressure | <1 MPa | <0.3 MPa | <0.1 MPa |
| Mould cost | High | Moderate | Moderate |
| Wall thickness tolerance | 10%-20% | 10%-20% | 10%-20% |
| Wall thickness uniformity | Tends to be nonuniform | Tends to be nonuniform | Uniformity possible |
| Inserts | Feasible | No | Yes |
| Orientation in part | High | Very high | None |
| Residual stress | Moderate | High | Low |
| Part detailing | Very good | Good, with pressure | Adequate |
| In-Mold graphics | Yes | Possible | Yes |
| Cycle time | Fast | Fast | Slow |
| Labor intensive | No | Moderate | Yes |
The slow characteristics in cycle time of the RM process can be highlighted as an alarming issue in mass production. The process completion time for a rotational moulding machine is between 40 -80 minutes [31].Figure 1 shows its process, which is based on four basic steps: (a) mould charging, (b) mould heating, (c) mould cooling, and (d) part ejection.
The rotational moulding machine process can be divided into six distinct phases. [32]
- Induction: Inserted powder form of the mould picks up the heat through the mould wall though it remains free until point 1.
- Sintering: A sufficiently high temperature of the mould and the powder reaches while the successive layering of the powder attached to the inner surface starts. Absorption of energy during the melting of the polymer slows down the increase in temperature within the mould. There is a natural separation of particle size during sintering—smaller particles adhere first, followed by progressively larger particles.
- Consolidation: The heating continues to fuse and consolidate the material into a solid homogenous mass when the powder has adhered to the mould completely.
- Melt-phase cooling: The molten polymer should be kept in moving condition to prevent wilting.
- Crystallization: The energy will be released when the polymers will reach its crystallization temperature when the polymer is in cool condition. which maintains the internal temperature on a second plateau. This will not occur for amorphous materials.
- Solid-phase cooling: Beyond the point at which the material has crystallized, the part is solidified and may pull away from the mould surface.
Regarding polyethylene moulds, several regular transition points are discernible. Phases are shown in the Figure 2:
The process has been evacuated since stage 1, and a semi-plateau in the graph can be seen where the powdery bed is being depleted with ill-homogeneous melt containing numerous air bubbles. Point 2 depicts the densification period, which occurs when the peak internal air temperature (PIAT) is attained at point 3. At point 3, the pattern inverts, and cooling continues gradually until point 4. The end of crystallization and solidification occurs at point 5 when a semi-plateau is detected. A slight modification in the graph is noted at point (6), and the demolding temperature is attained after this point. [33]. Paul Nugget placed two thermocouples in the same process to measure and analyse the temperature profile in two different positions (shown in Figure 3), one thermocouple was placed to measure the external environment of the mould and the second one measured the internal temperature of the mould (the enclosed inner volume). Variation in the temperature of the rotomoulding cycle was observed due to the rapid movement of the air inside the oven and rotating mould passing the hot air inlet. After completion of the oven cycle, the environment temperature drops drastically to the cooling bay temperature. For enclosed coolers, heat radiating from the mould can raise the surrounding temperature initially, but this falls over a period as the mould cools [32].
Figure 3.
External and internal temperature profiles during a typical moulding cycle for a polyethylene part.[32].
Figure 3.
External and internal temperature profiles during a typical moulding cycle for a polyethylene part.[32].
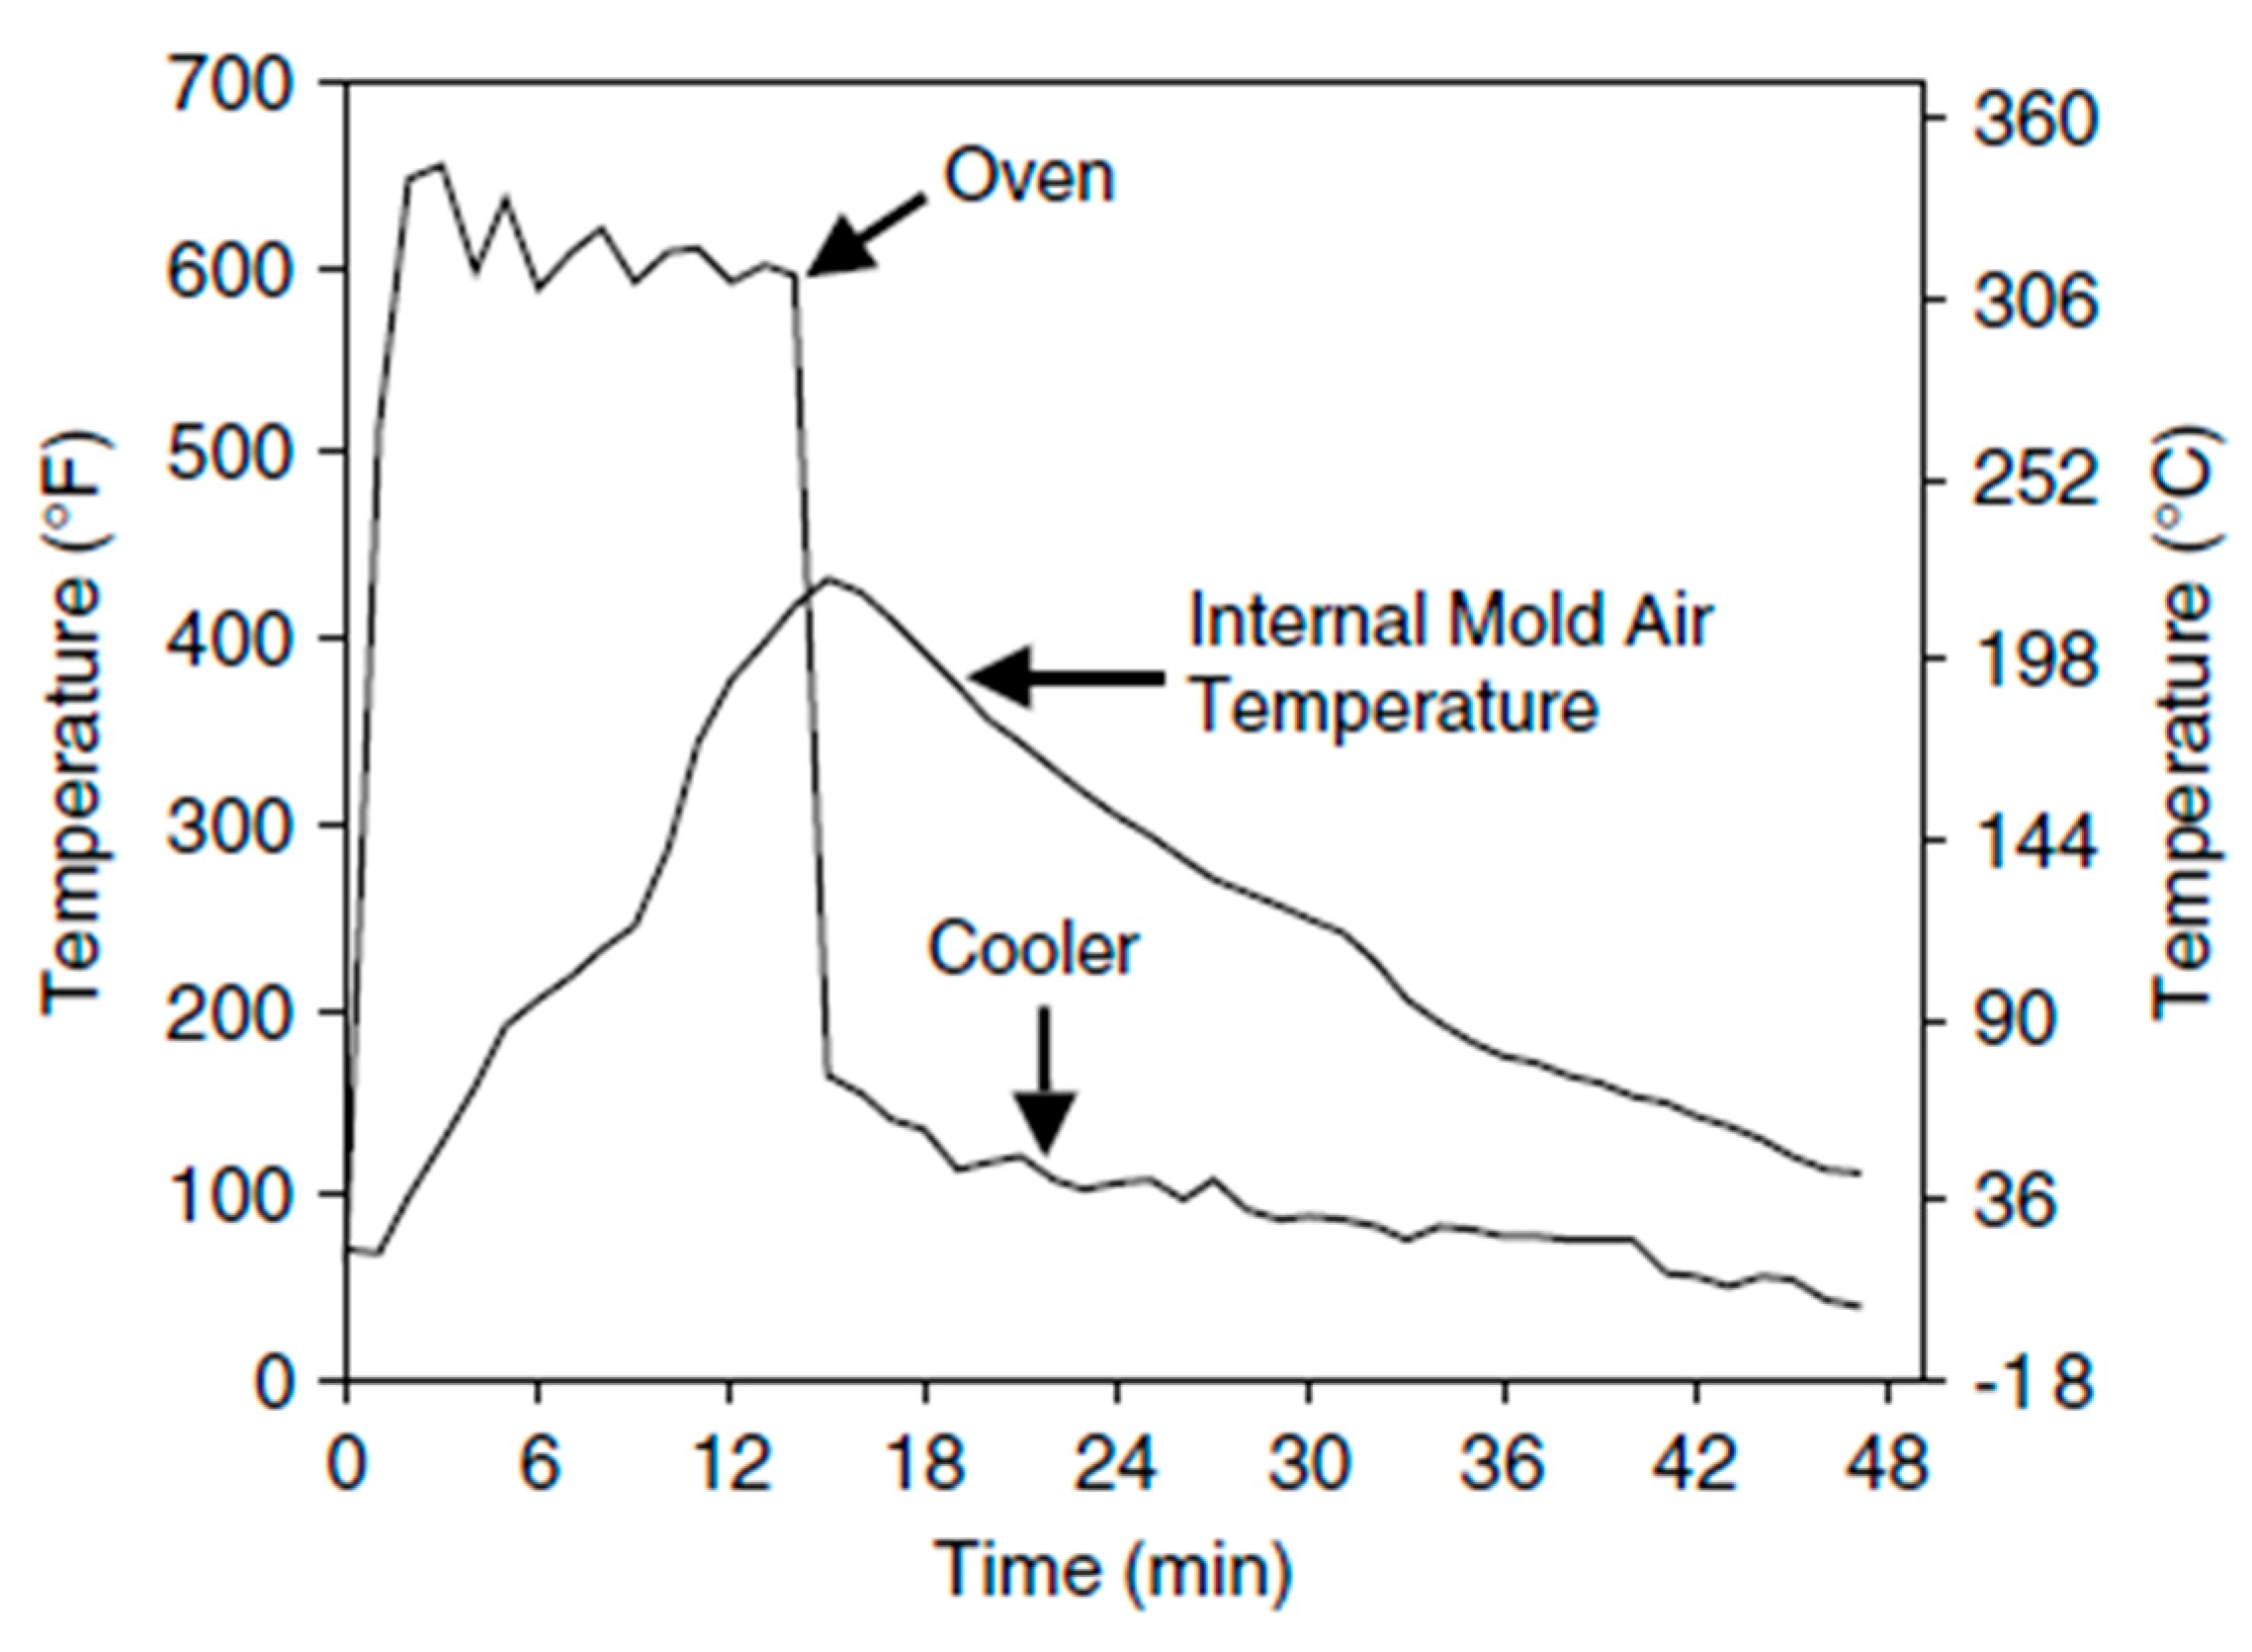
Figure 2.3.
Internal air temperature profile during the moulding cycle ( polyethylene part ) [32].
Figure 2.3.
Internal air temperature profile during the moulding cycle ( polyethylene part ) [32].
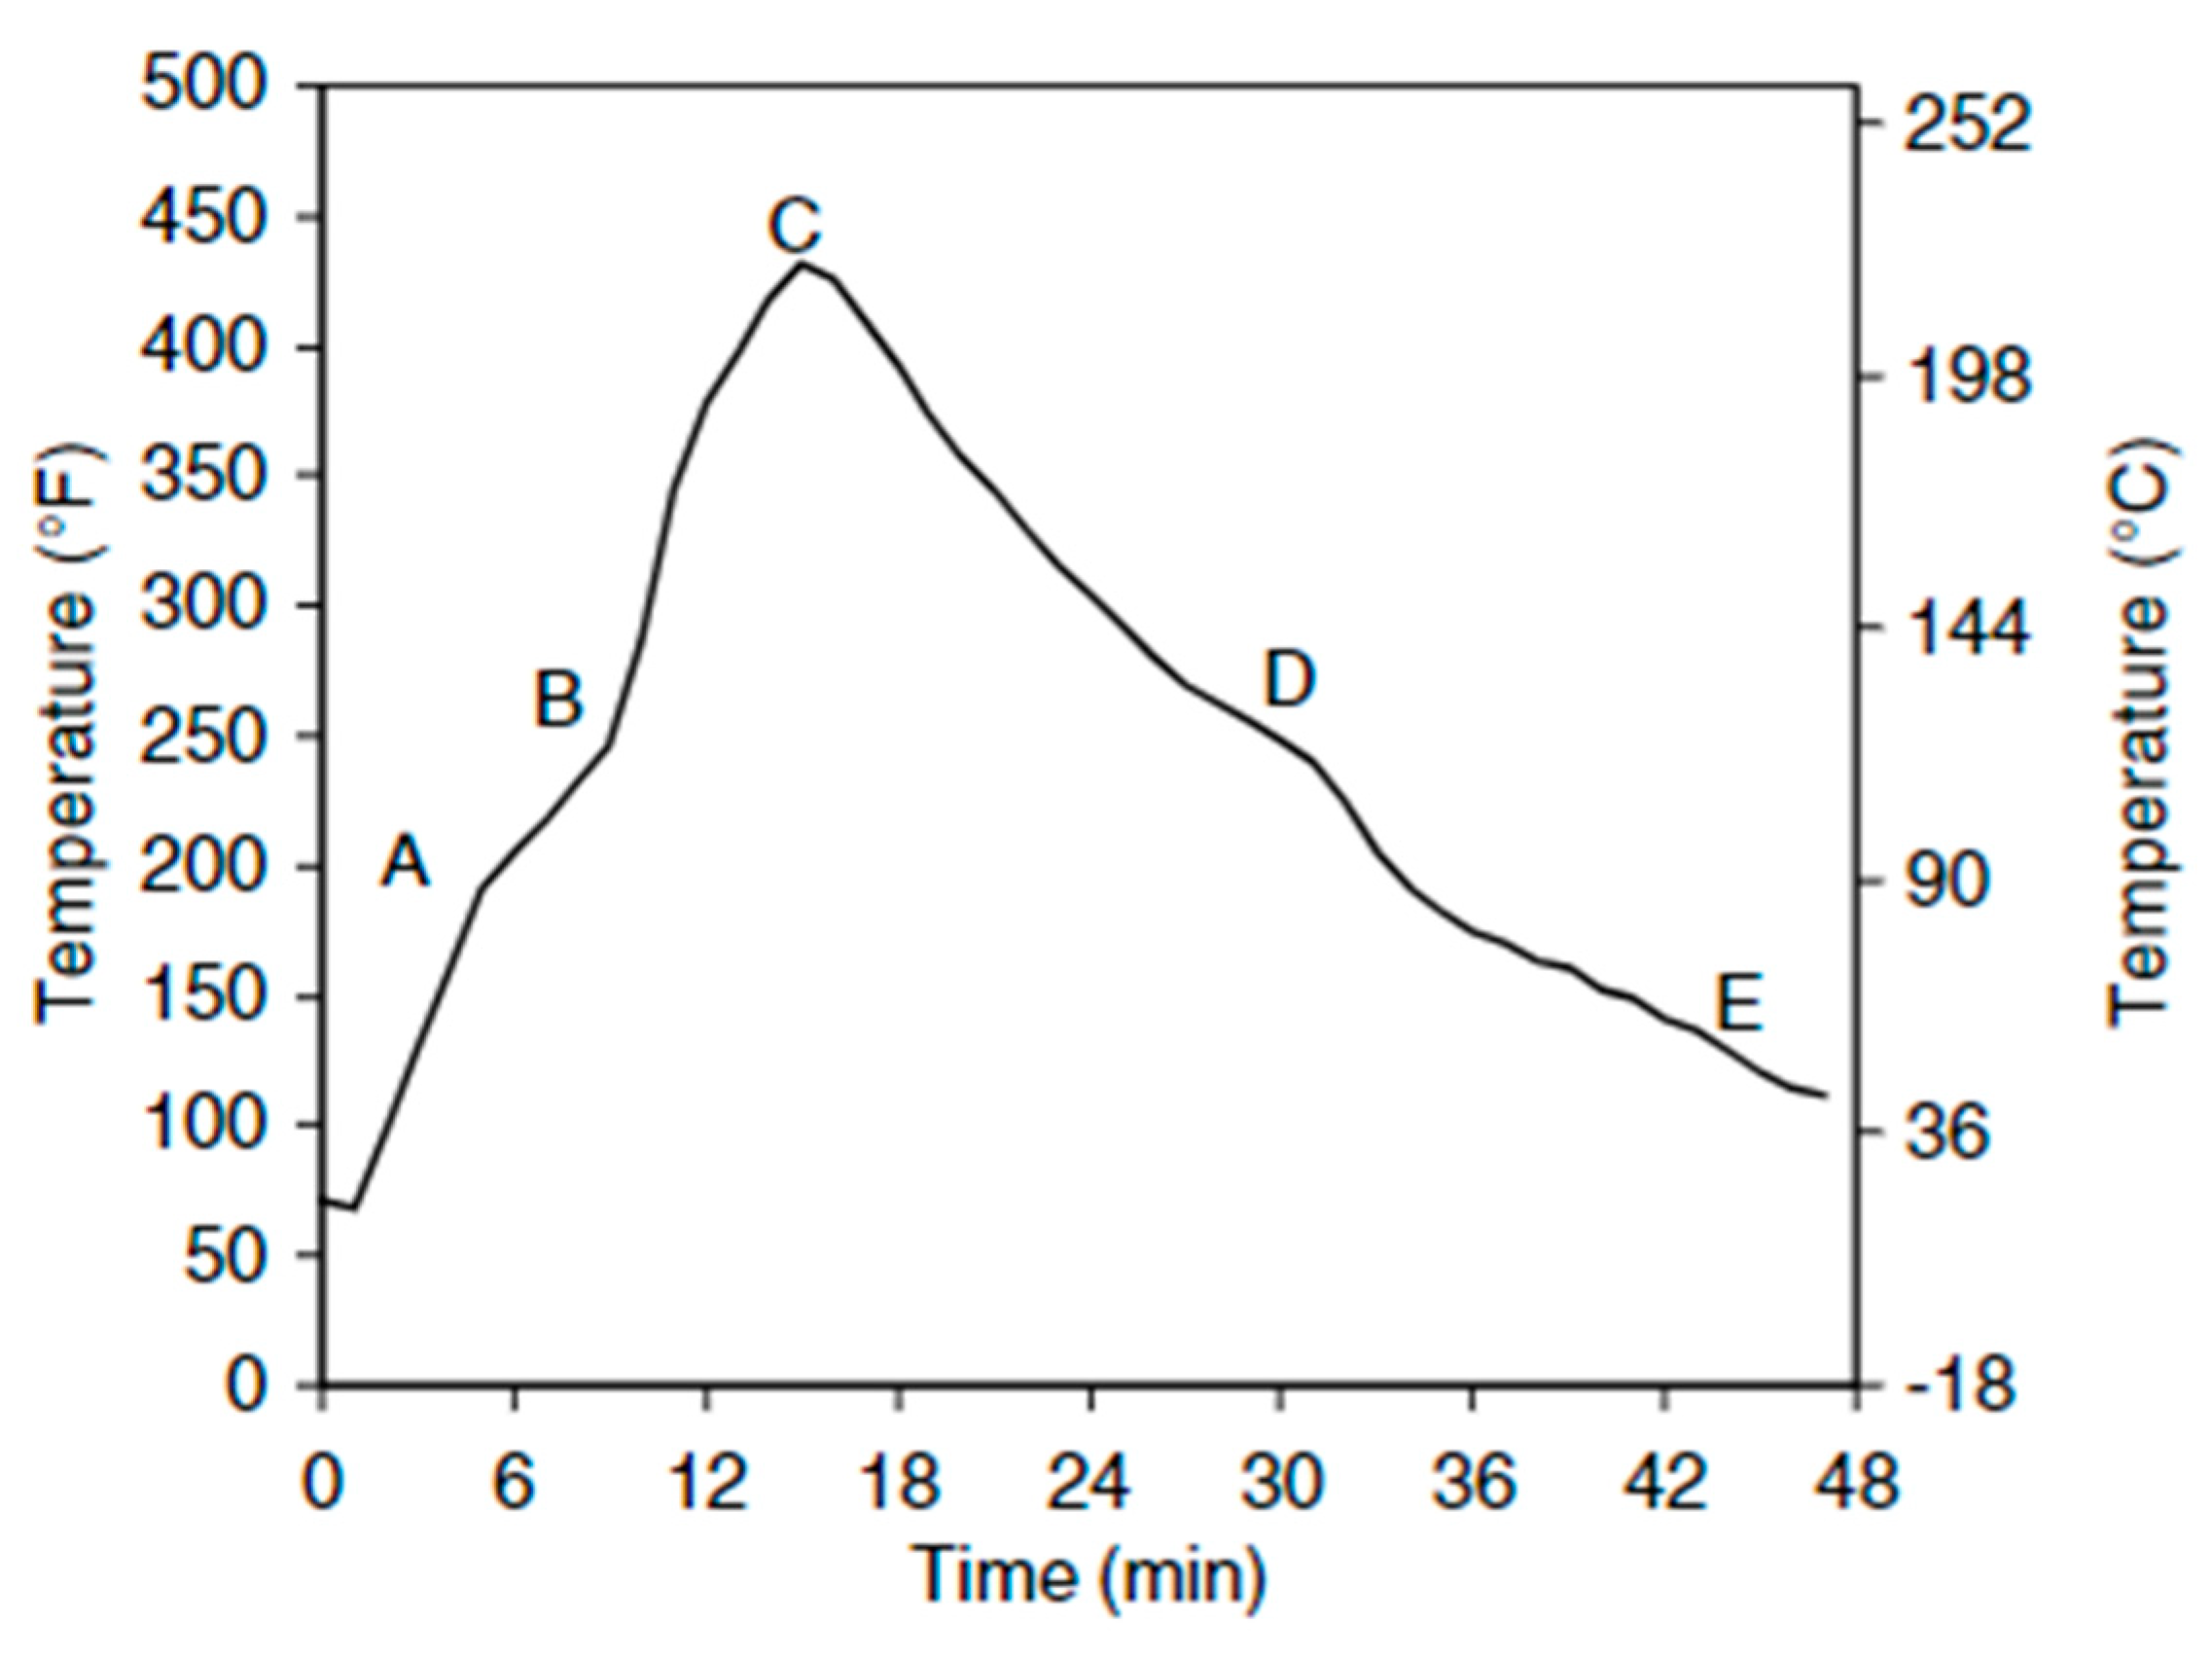
Material fuses to the mould in waves as heating proceeds between points A and B. The rate at which the internal air temperature rises slows down and reaches a plateau as a result of the material absorbing energy during the melting process, which turns it from a powder to a solid molten mass. When all the material has attached to the mould surface at point B, the plateau ends, and energy is once again delivered directly to the inside air, causing the temperature to rise faster. Up to point C, there is still heating. The peak internal temperature recorded within may correlate with the final level of "cure" or "cook." The part's temperature decreases as the mould gradually begins to cool. The mould’s exterior surface temperature increases faster than the mould's interior air temperature decreases. This rate is mostly determined by the cooling technique (cooling through a fan before the cycle starts) and the external environment (summer cooling can be much slower than winter cooling). The mould continuously cools until crystallization occurs. This second plateau, which resembles the melting plateau discovered during the cycle's heating stage, is created by energy generated during the formation of a crystalline structure, which keeps the part's temperature constant. This takes place at point D . Paul Nugget has tried to provide the phases of temperature variation in his book’s chapter.
Hollow profiles and tubes are formed with centrifugal forces. Because of this, there must be a minimum revolution speed and a greater centrifugal force than the actual weight [34] .The gravitational acceleration (g) and the tube's radius (r) determine the minimum speed (), according to Neitzel et al. [35].
Current models put forth the assumption that polymer powders undergo constant turbulent stirring, maintaining a uniform powder temperature and allowing convection to control heat exchange at the interface[36,37]. Regardless, it is important to remember that, in this cycle, the amount of time spent using the powder is little concerning the overall processing time.
Establishing the real issue is a key challenge throughout the rotational moulding process because the polymer powders undergo several stages of transition, including heating, melting, and solidification in biaxial rotational moulds. Nonetheless, both the endothermic and exothermic transitions have an impact on this heat transition process[38].
When rotating moulding or undergoing any other material phase transition operation, the latent heat of transition of the material is considered in the q˙ term. As crystallisation occurs, the q˙ term takes on negative values, whereas during melting it takes on positive ones.
The total enthalpy is introduced.
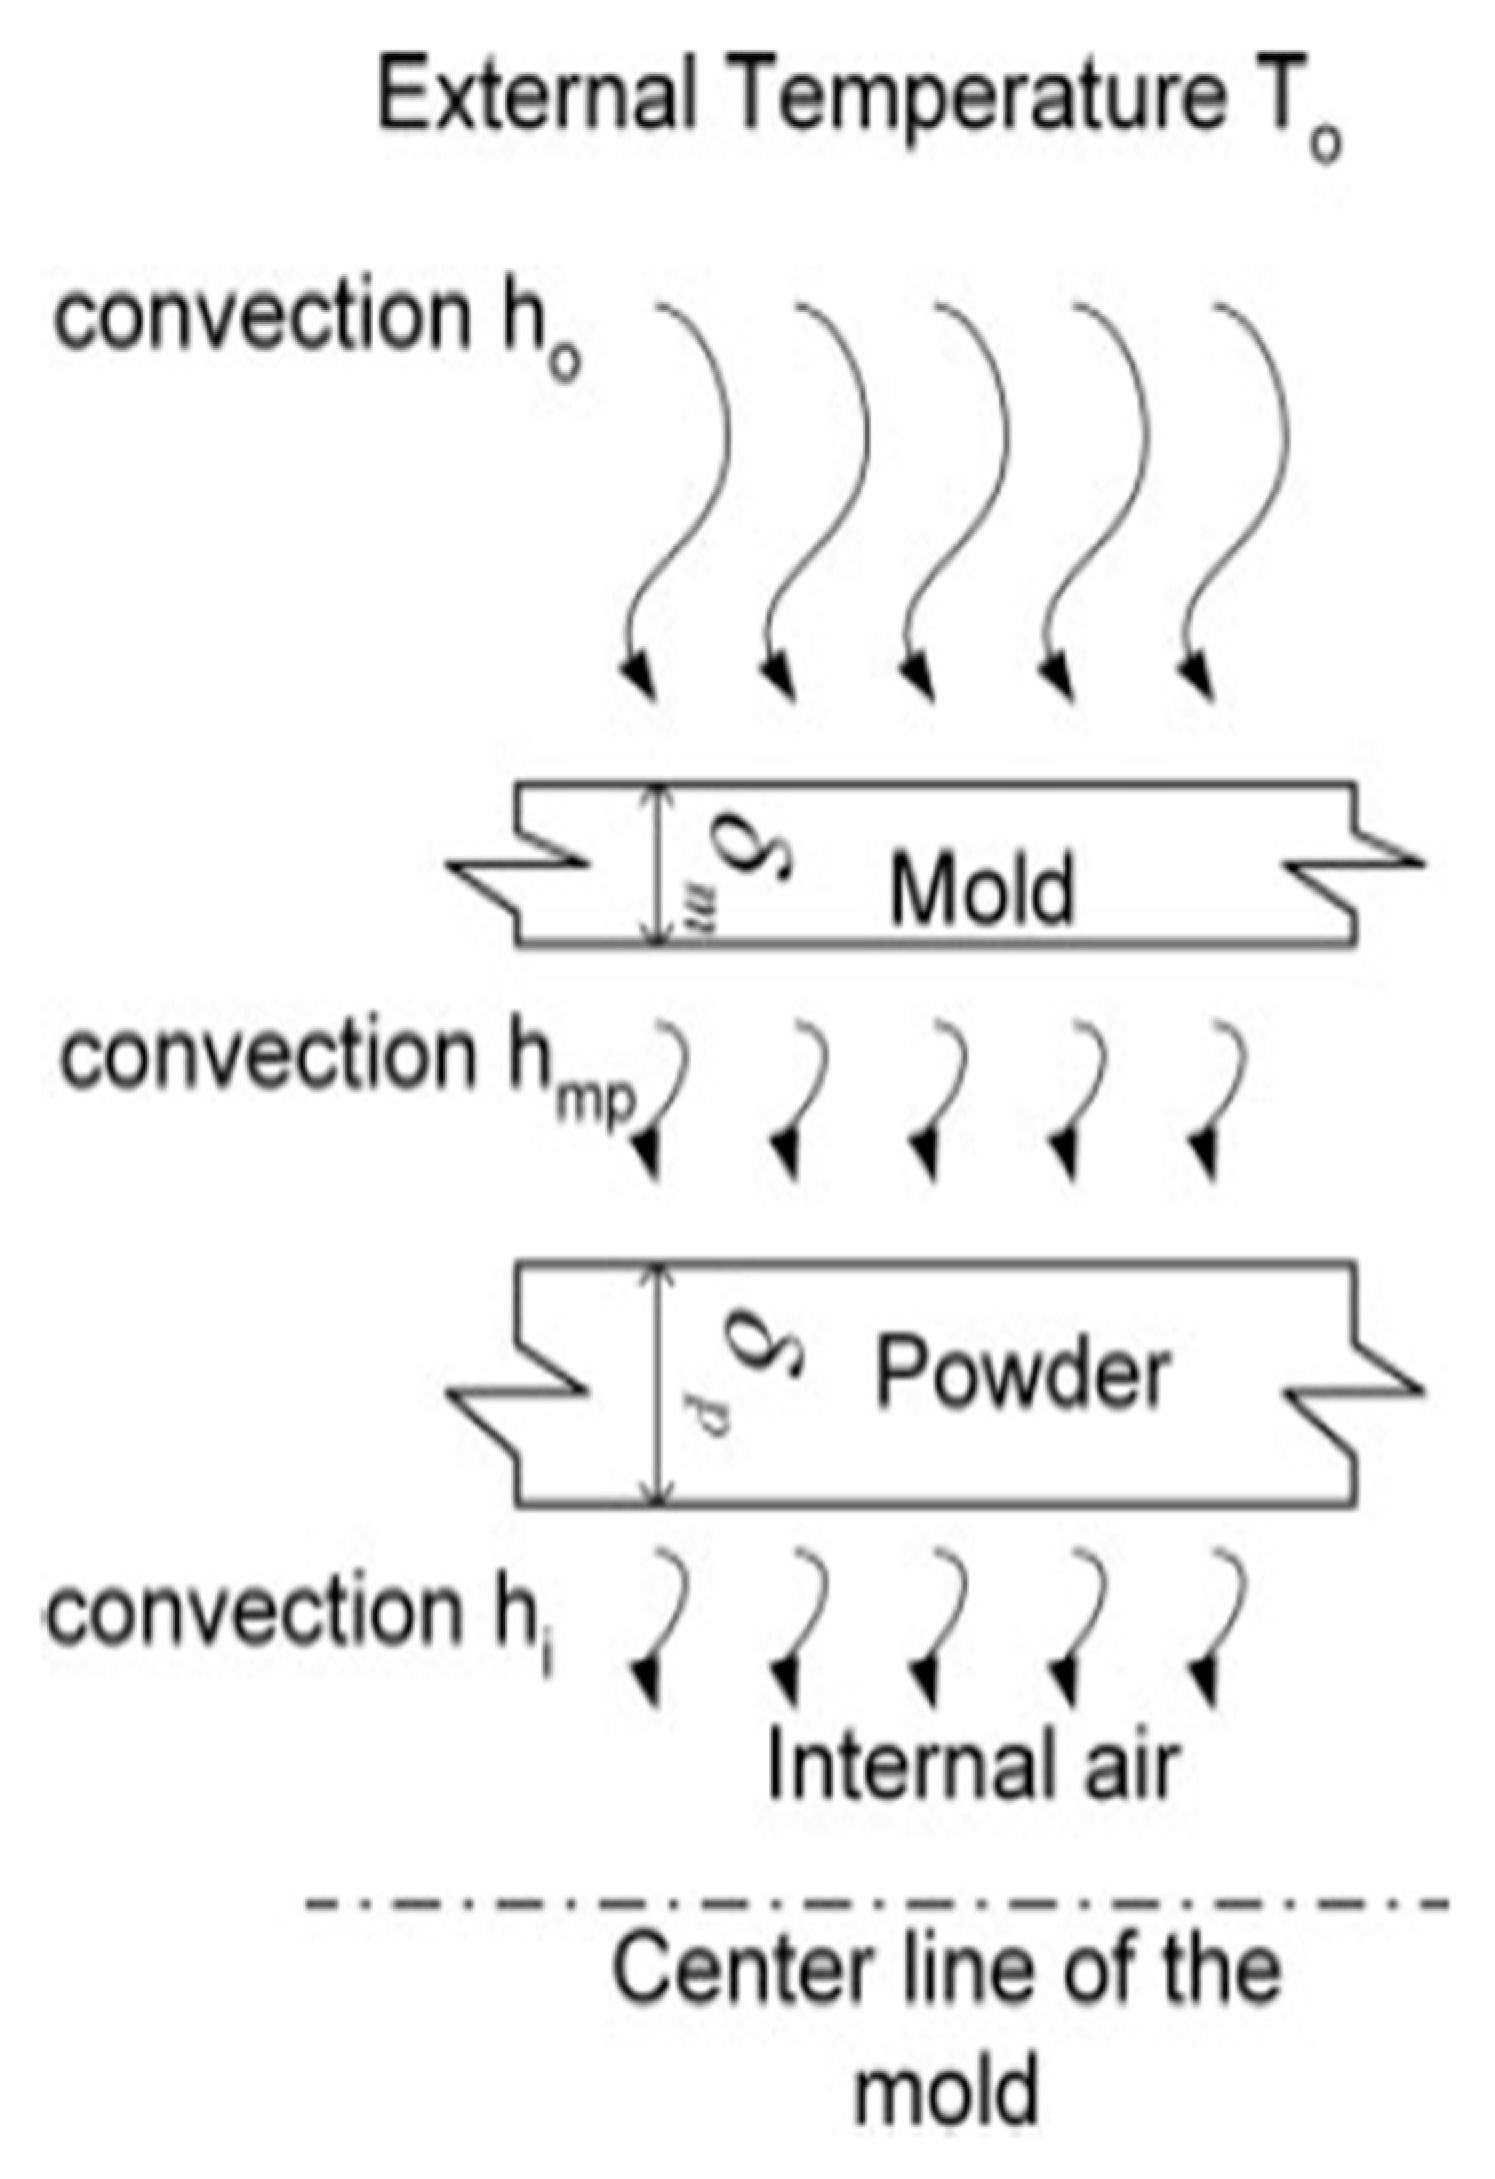
Once the problem has been defined through the enthalpy method, the different boundary conditions (BC) at the interface of regions characterized by different material properties need to be written. The BC at the external mould surface, in contact with the heating gases in the oven, has been assumed to be governed by convection [39,40].
Where Ti and Tm represent the temperature of the lower surface of the powder and the inner surface of the mould respectively, is the convection heat transfer coefficient at the mould polymer surface. z and represents the dimension of spatial coordinates measured from the centre of the mould and coordinate of the mould's inner surface, respectively. The powder temperature history can be calculated through Fourier’s Law of unsteady heat conduction in the following form [37]
The variables in this case are t, the time variable, , the coordinate of the top surface of the powder layer and is the coordinate of the inner surface of the mould. The density, specific heat, and thermal conductivity of the powder, respectively. Planar, axisymmetric, and spherical moulds are represented, respectively, by the values of q = 0, q = 1, and q =2. Because of the product's size concerning its thickness, it is reasonable to exclude heat transmission in the circumferential direction for the spherical and cylindrical moulds.
The heat transfer from the plastic to the mould can be represented by Equation (2) with a single heat transfer coefficient at the mould-plastic interface. The representation of the equation from plastic to air mould can be expressed in the form –
Where, - the heat transfer coefficient at the air gap, heat flux at the mould–air and plastic–air interfaces. Thus, the effect of the plastic shrinkage on the overall heat transfer is reduced to estimating a suitable heat transfer coefficient at the mould–plastic interface[41].
Though Banerjee et al. [41] proposed a modified model where he hypothesised the heat transition at mould-powder interface is done because of convection along with heating up of powder particles due to conduction but has not discussed the effect of endothermic and exothermic heat transition process. It was later modified by A. Greco et al.[38] approaching a kinematic model where he solved a one-dimensional unsteady heat conduction equation using the finite difference method an increase in the product wall thickness due to the contact resistance between the powder and the mould affects the powder heating temperature and cycle time [41].
Figure 4.
Heat transfer from the oven to mould, powder and internal air [41].
Figure 4.
Heat transfer from the oven to mould, powder and internal air [41].
3. Mould Area Enhancement and Cycle Time Reduction
According to Khouri et al.[42], the mould to the cooling fluid, the polymer melts to internal air, and the oven to mould has the highest convective heat transfer coefficients. As per their research, the mould is essential for cutting down on process cycle times. They concluded that ,air amplifiers were the best option, with 25% and 14% reductions in the cooling time and the overall cycle time, respectively. To validate his finding M.Z Abdullah et al. [43] conducted both experimental and theoretical analysis on three types of mould ex: (a) Plain mould, (b) roughness-enhanced mould and (c) pin-enhanced mould and organised the CFD flow arrangement into three categories (a) Flow across, (b) Flow across at 45°,(c) flow normal to pin -enhanced mould.
Figure 5.
CFD flow arrangement in Phoenix [43].
Figure 5.
CFD flow arrangement in Phoenix [43].
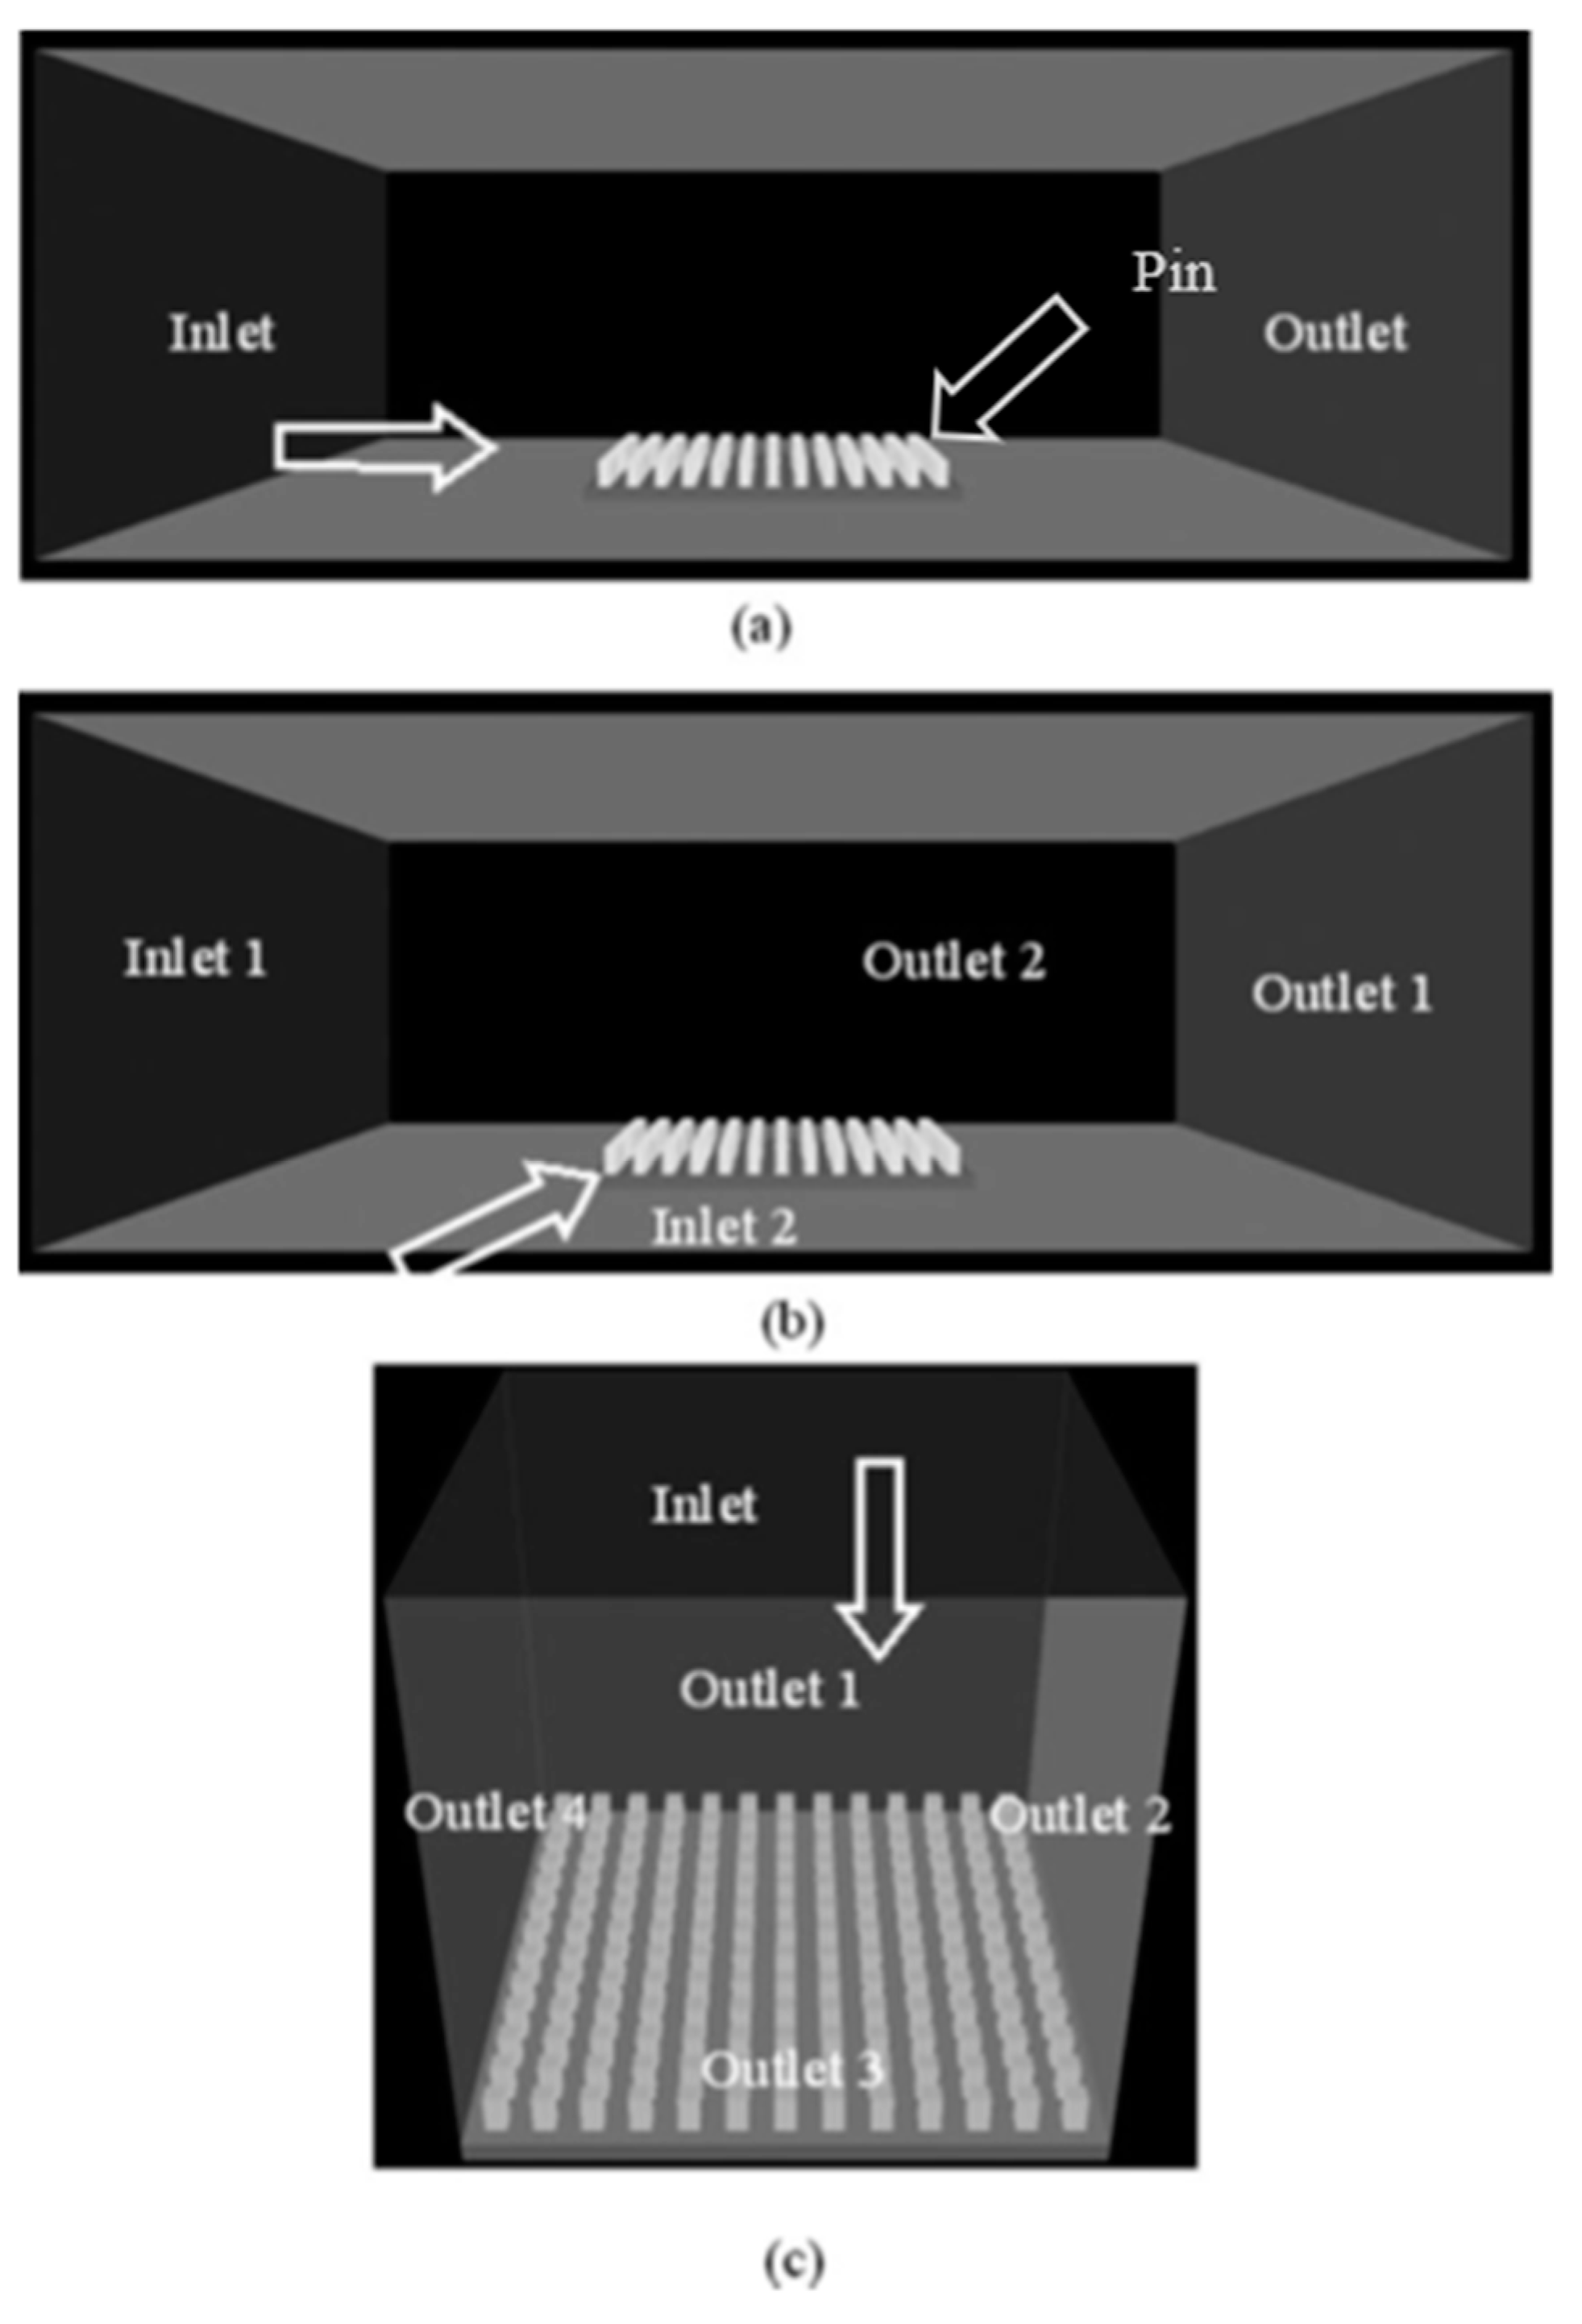
It was observed from the experiment that the closer the tips of the pin the higher the air velocity. The representative value should be within the pin height and the steam passing between them.
From the leading edge to the trailing edge of the pin-enhanced plate, the average air speed data for each case were determined. The average airspeeds around pins produced by the CFD simulations as well as the average airspeeds according to the flow directions are shown in Table 2. Based on the spacing-to-thickness ratio, a chart representing average air speed was created using the identical data from Table 2 (refer to Figure 6). The findings imply minimal gain by increasing pin spacing above an intrepid separation twice the pin thickness.
On the contrary, mould thickness plays a significant role in the cycle time reduction for the rotomoulding machine. Using less energy during the heating process allows for a variety of thinner moulds, which not only cut cycle times but also enhance energy efficiency. Faster cycle time results in a higher productivity rate and helps industries save production costs. Abdullah et al. [44] wanted to validate the assumption by taking different types of part wall thicknesses (3.2 mm, 6.0 mm,3.2mm, 6.0 mm and 9.0mm). It was carried out in two distinct oven temperatures:
a defines oven temperature of 300° C and
b defines oven temperature of 380° C ; using two forms of improved mould roughness enhanced mould and pin-enhanced mould.
From Table 3, experimental cycle time reduction was ̴18 % and 28 % for the roughness-enhanced mould and pin-enhanced mould respectively. On the other hand, predicted cycle time reductions were ̴ 21% and 32%, respectively However, the report demonstrates a correlation between the experimental and anticipated cycle time, further information from various component wall thicknesses and part sizes would be beneficial for a more thorough analysis.
Although the author illustrated cycle time reduction as the foundation for mould enhancement for the rotational moulding process, his theoretical[43] & experimental [44]investigations were limited to an aluminium cubic mould. The benefits and drawbacks of mould upgrades for additional geometrically formed moulds were not further clarified.
4. Impact of Duct Size on Air Flow Rate
If an RM machine industry is using a duct to flow the hot air through the duct to the oven, then there are some basic perspectives to highlight. In most cases, it is hard to maintain the same air velocity and temperature through the duct during the air-flowing condition. Thus, we tried to focus on the concepts of sustainable temperature and air distribution. Since, hot air flows through a duct and faces a variety of disputes ex: heat loss, air leakage, pressure drop, air quality, corrosion, thermal expansion, contraction etc.
In the context of air distribution, proper duct design is crucial because unplanned ducting design can result in resistance to inadequate airflow. If ducts are too large may lead to low velocity, stratification, and poor mixing on the other hand if the duct is too minuscule, resulting in pressure drop, noise, vibration and inadequate airflow.
Figure 7.
A large size duct along with a reducer and a smaller duct.
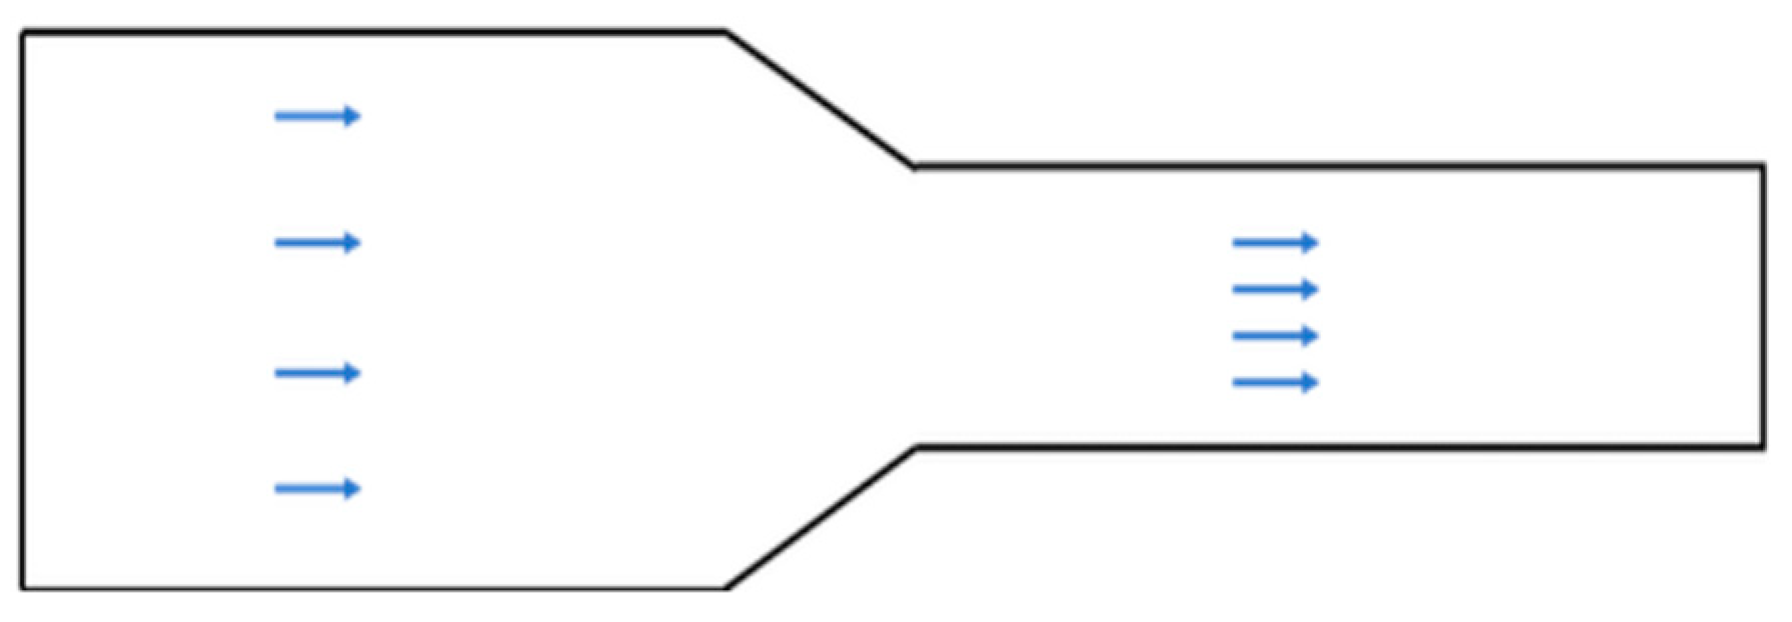
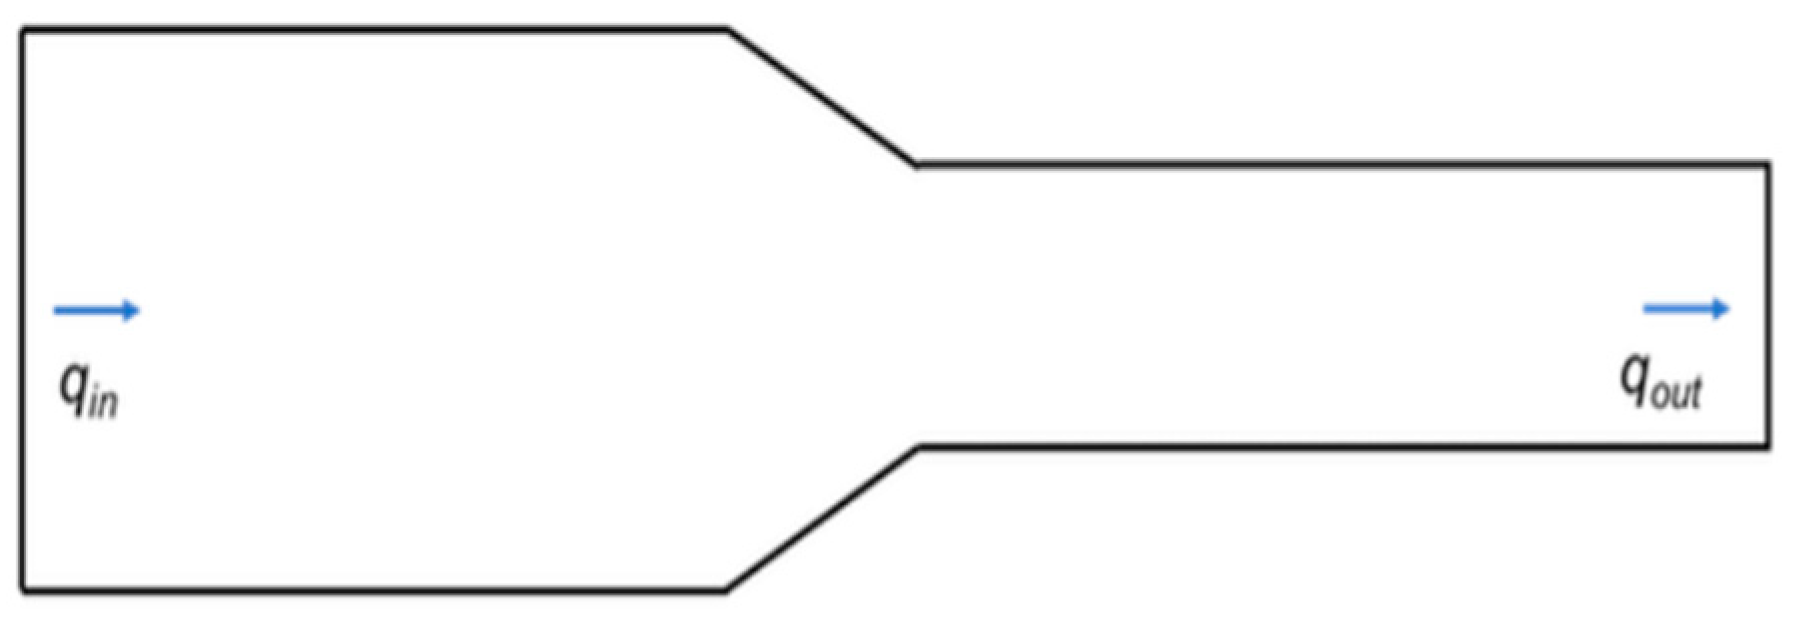
If the duct is completely sealed and no air leaks along the way we can assume that as per conservation law, every bit of the air that enters the duct on the left must come out of the duct from somewhere.
Figure 8.
The air flow rate entering the duct is the same as the air leaving the duct.
Moreover, the Mach number of air is very small (lower than 0.3), hence considered an incompressible fluid [45]. But there can be a change of temperature if there will be considerable change in density. The equation becomes simpler for incompressible flow, which is frequently a realistic assumption for air at moderate speeds.
The cross-sectional areas of the duct at the inlet and outlet are denoted as and , respectively. The air velocities at the intake and outlet are denoted by and , respectively.
Moreover, conservation of energy is important in the ducting system for maintaining efficiency, ensuring proper operation, predicting flow behaviour, designing efficient systems and optimising performance. But, in the case of high-temperature air flow, there can be a change in temperature and pressure. Due to high temperature, there will be a change in density.
The kinetic theory of gases and ideal gas law plays the role of basic principle in this situation.
Bernoulli’s equation describes the conservation of energy in a flowing fluid and can be applied to air in the duct. This equitation is used at the time of change in temperature and pressure in a small duct. Assuming steady, incompressible flow and negligible viscosity, Bernoulli's equation is P++ρgh=constant (5)
For horizontal ducts, ρgh can be ignored as ∆h=0. Thus, P+=constant (6)
Here, P, , , g, h denotes pressure at a point in the duct density in the air, velocity in the air, gravity due to acceleration, and height above a reference level. Furthermore, changes in the duct cross-sectional area refer to changes in the velocity and the pressure of the incompressible fluid. Gao et al. [46] have focused on the aspect ratio and curvature radius of the bend. In their study, he expressed the aspect ratio by , the curvature ratio as R/ . Moreover, the authors explored the aspect ratio and the radius of curvature on the drag and core speed in “U” and “S” shaped ducts. Numerical simulation can give better outcomes in subtle changes in the fluid flow rate and dragging the duct system than experiments [47,48]. Moreover, duct diameter has prime importance in reaching adequate airflow to the face [49].
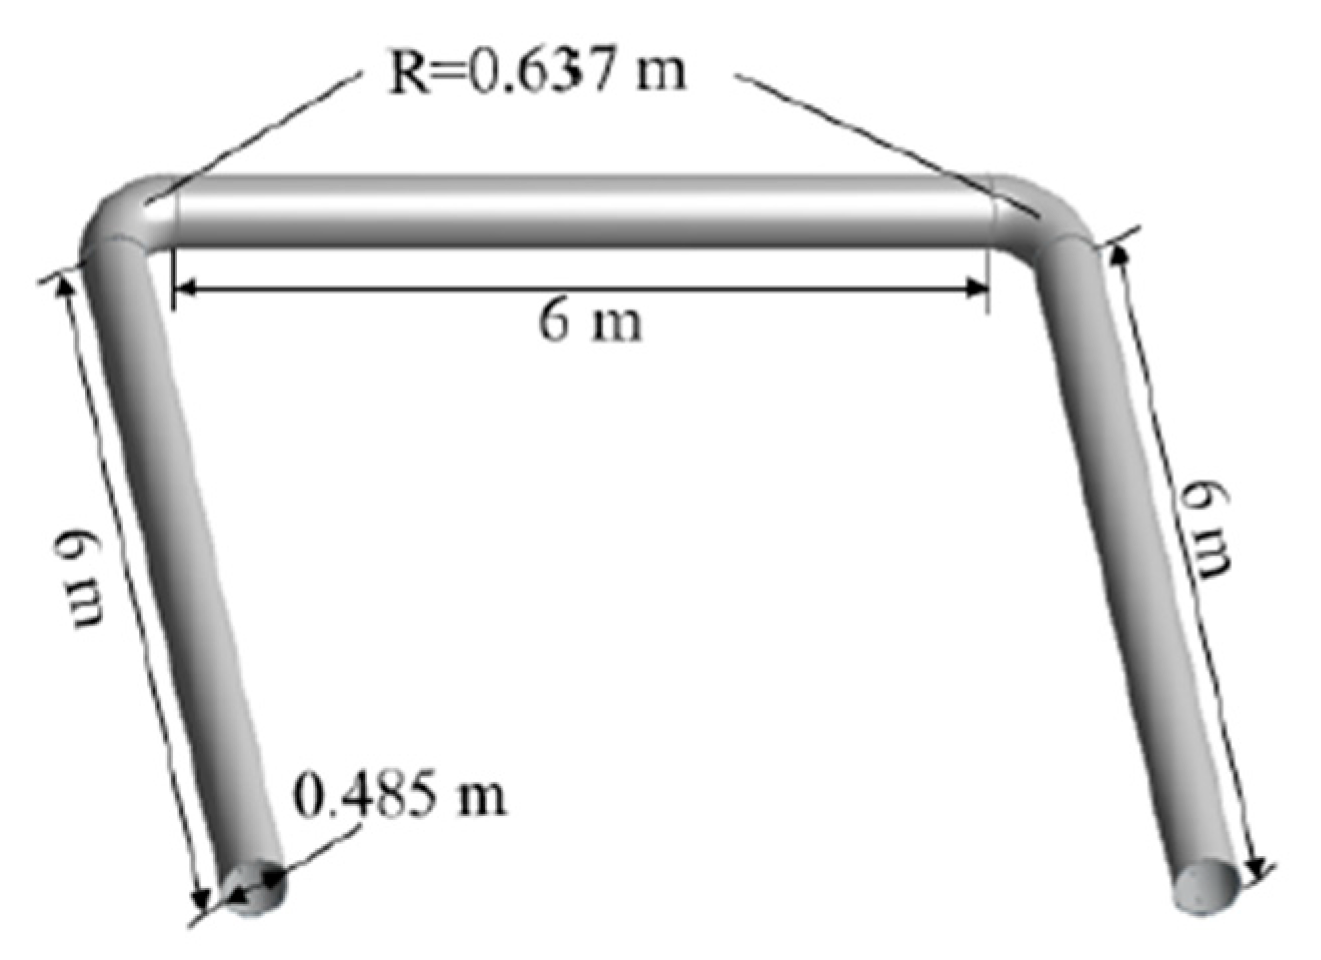
In Figure 9, The S-shaped bend has a lower inertia force of the downstream fluid than the U-shaped curve as it mainly depends on pressure gradient force. Hence, there is a minimal effect of R/D in downstream ducts. As a result, R/D has a minimal impact on the force of inertia. Increased R/D does not significantly reduce the inertial force of the S-shaped bend, resulting in a slight drop in core speed. It represents the authenticity of the continuity equation in an incompressible fluid. The cross-sectional area in the geometry of a duct changes due to the bend therefore the area may decrease. Hence, the velocity increases in the local resistance areas to maintain a constant mass flow rate, which we can see in Figure 9.
5. Geometrical Model Analysis of Ducts
Proper design of ducting is essential for air flow due to several reasons, encompassing efficiency, high performance and cost reduction. Generally, a proper ducting system helps in heat loss and gain (properly insulated and sealed), air distribution, and pressure balancing. Here in this review paper, we will highlight some ducting models which can be effective for proper hot air distribution through the duct.
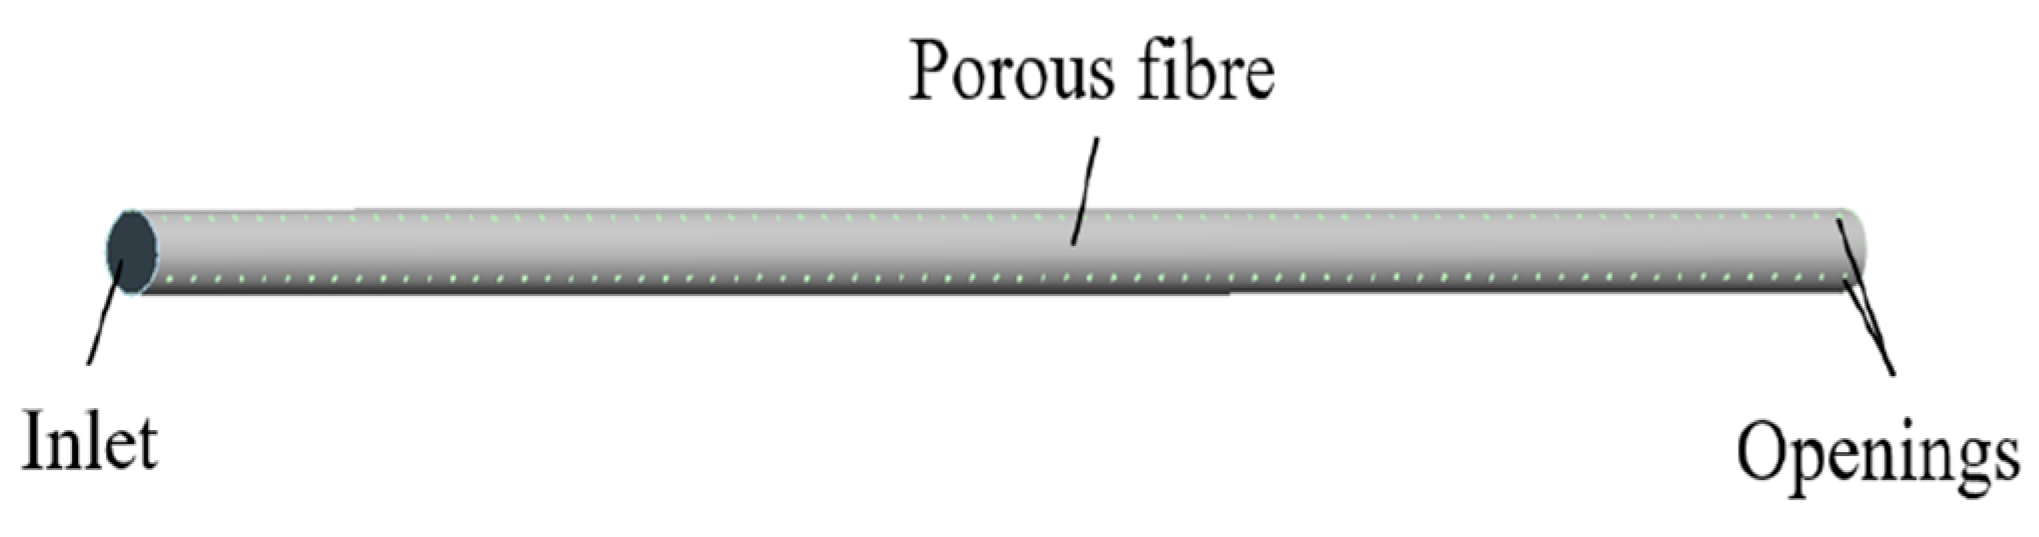
Fabric air dispersion system (FADS) has been introduced due to the limitation of the air conditioning system. FADS is made of a special type of polyester fibre and comprises a set of air distribution and supply ducts. Moreover, it offers numerous advantages such as a uniform air supply, easy installation no blowing sensation, quiet operation, lightweight design, and simple cleaning and disinfection. However, it also has some drawbacks like air leakage due to seams and joints, pressure drop due to friction, duct length and configuration, and poor air distribution efficiency due to design and perforation. Nowadays, FADS has gained significant attention in various sectors such as shopping malls, factories, stadiums and theatres [50]. The number of rows, hole spacing and other parameters that result in various opening configurations can be varied due to duct opening [51].
Figure 10.
Schematic diagram of an ejection permeable FADS[52].
Figure 10.
Schematic diagram of an ejection permeable FADS[52].
When there is the same number of openings, increasing the number of rows results in a faster wind speed decay within the tube. The number of open rows in the FADS is negatively correlated with the flow velocity in the tube, and higher numbers of rows result in lower flow velocity and greater temperature rises. Therefore, FADS with more rows of openings exhibit a higher temperature rise and higher temperatures at the same location inside the perforated tube [52].
From Figure 11, we can see 0-7 m there is a uniform air velocity but from 8 m -20m there is a slight change in the air velocity of the row opening tube. In 19 m where two-row openings have a velocity of 0.5 m/s, on the other hand, a one-row opening is slightly higher than 0.5 m/s.To enhance the jet influence area, the air supply requirements in bigger areas using FADS are conceptualized with numerous rows of openings[53]. The concept of the rise of temperature inside the duct tube is completely inverse to the amount of air velocity. Natural convection is considered rather than forced convection when there is low air velocity. Natural convection relies on buoyancy-driven airflow since it is slower and less effective in removing heat than forced convection. If there are more holes this can lead to thermal stratification and result in poor air mixing due to variations in different phases of temperature, and hot air remains at a higher level in graphical representation. Therefore, the wind velocity inside one row of openings is always higher than the two rows of openings. On the other hand, the temperature rise in the one-row opening is lesser than the temperature rises in the two-hole opening. Figure 12 indicates uniform temperature distribution from 0-11 m, but the temperature in the two-row opening started to rise from 11 m. In 20m, where the one-row opening has a temperature of 296.75K on the other hand two-row opening temperature is slightly higher than 296.75K, Hence, it can be concluded by stating that the situation with the same number of opening FADS with more rows opening will result in a higher temperature rise inside the tube. The diagram below draws upon the concept of temperature rise with two different opening concepts.
Yang et al.[52] has considered three different FADS shapes to verify their statement regarding the flow velocity and temperature variation.
Here, no of opening = 72 No’s; opening spacing = 0.276 m and opening diameter = 0.276 m
Figure 13.
“1” – shape FADS [52].
Figure 13.
“1” – shape FADS [52].
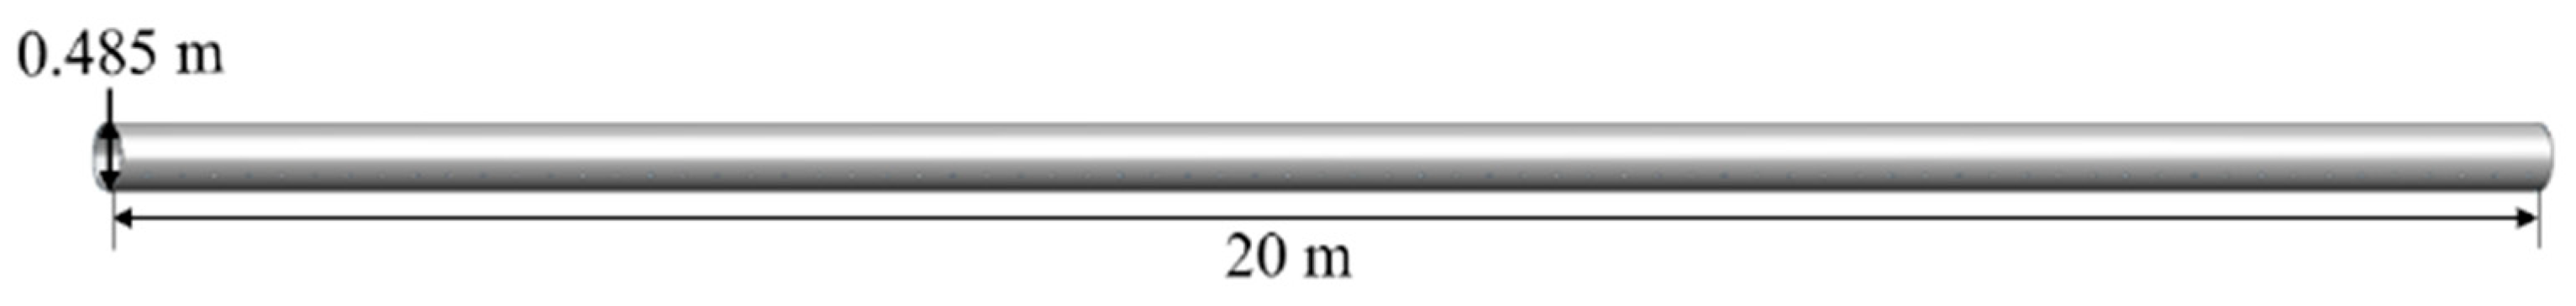
Figure 14.
“L” – shape FADS [52].
Figure 14.
“L” – shape FADS [52].
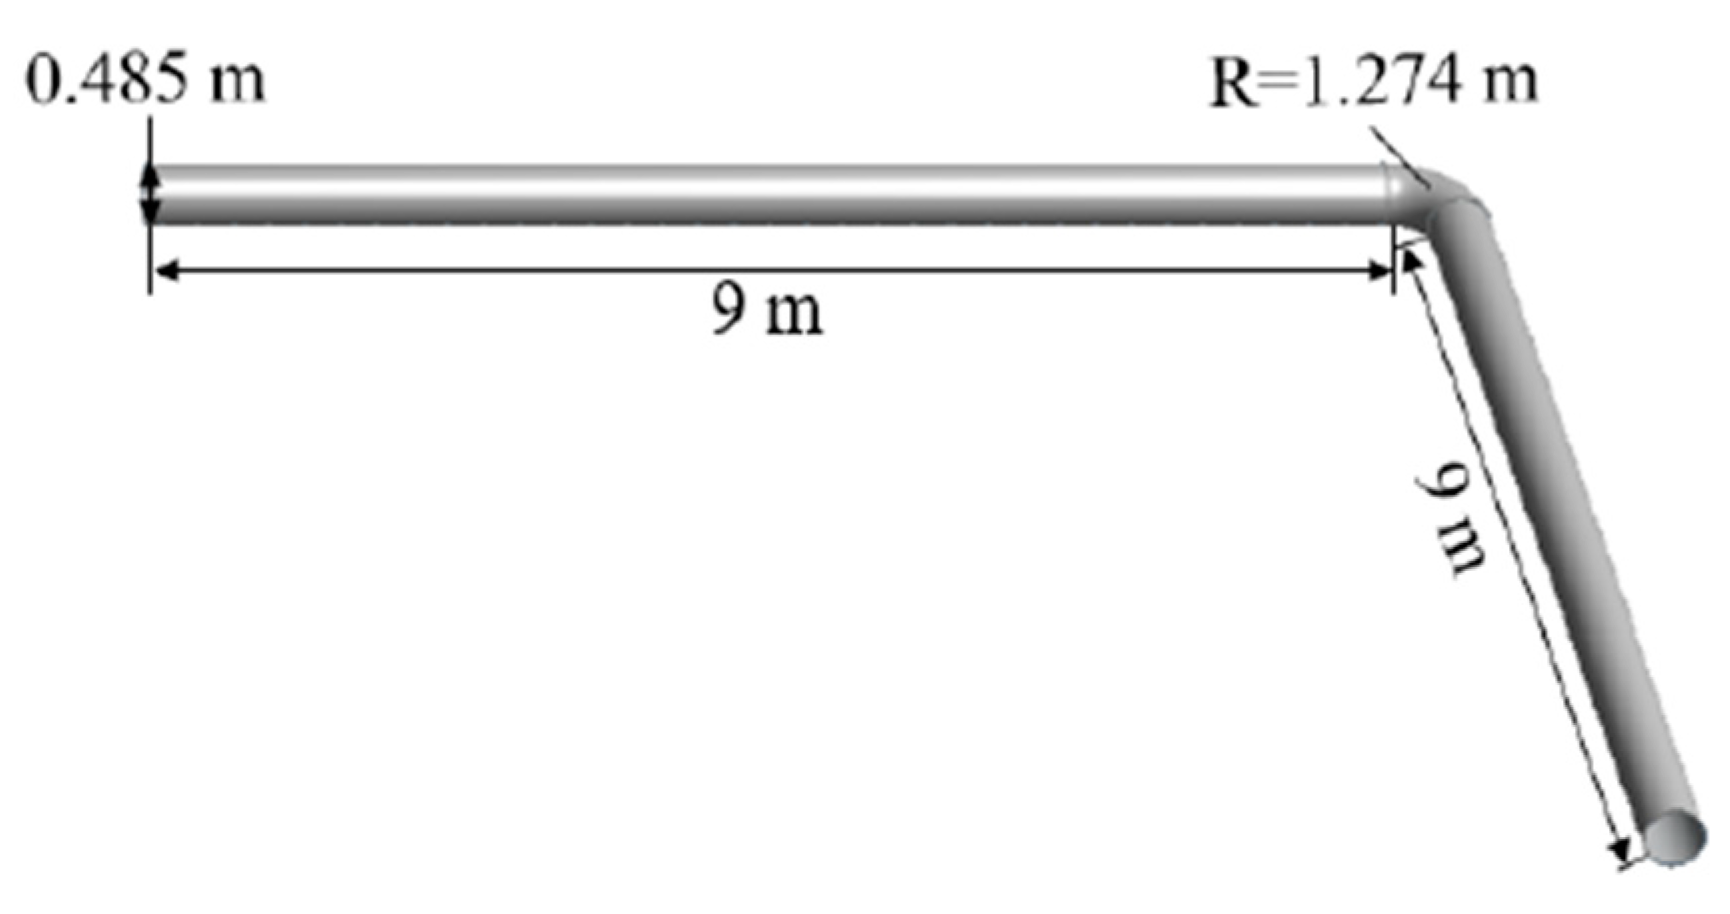
Figure 15.
“U” – shape FADS [52].
Figure 15.
“U” – shape FADS [52].
5.1. Air-Flow Field Characteristics
In Figure 16, “1 “-shaped FADS shows the slowest decrease of speed followed by the “L” – shaped FADS. Whereas the “U “-shaped FADS shows the fastest decrease in speed. “U”-shaped FADS increases tend to 6.4 m/s at the first elbow location, on the contrary, it becomes the lowest achieving 3 m/s getting a sharp decrease than the other two FADS. But after the second elbow, it rockets up the reduction flow and becomes the lowest than the other two FADS at the distance of 14.1 m.
5.2. CFD Field Characteristics
In Figure 20, temperature variation is evident due to the local resistance aka elbows' sudden temperature rise and sudden drop of temperature being seen especially in “L “-shaped and “U” -shaped FADS, whereas the “1” shape shows smooth temperature distribution and temperature rise with low turbulence than “L”- shaped and “U “shaped FADS.
Figure 17.
“1”-shaped FADS temperature distribution [52].
Figure 17.
“1”-shaped FADS temperature distribution [52].
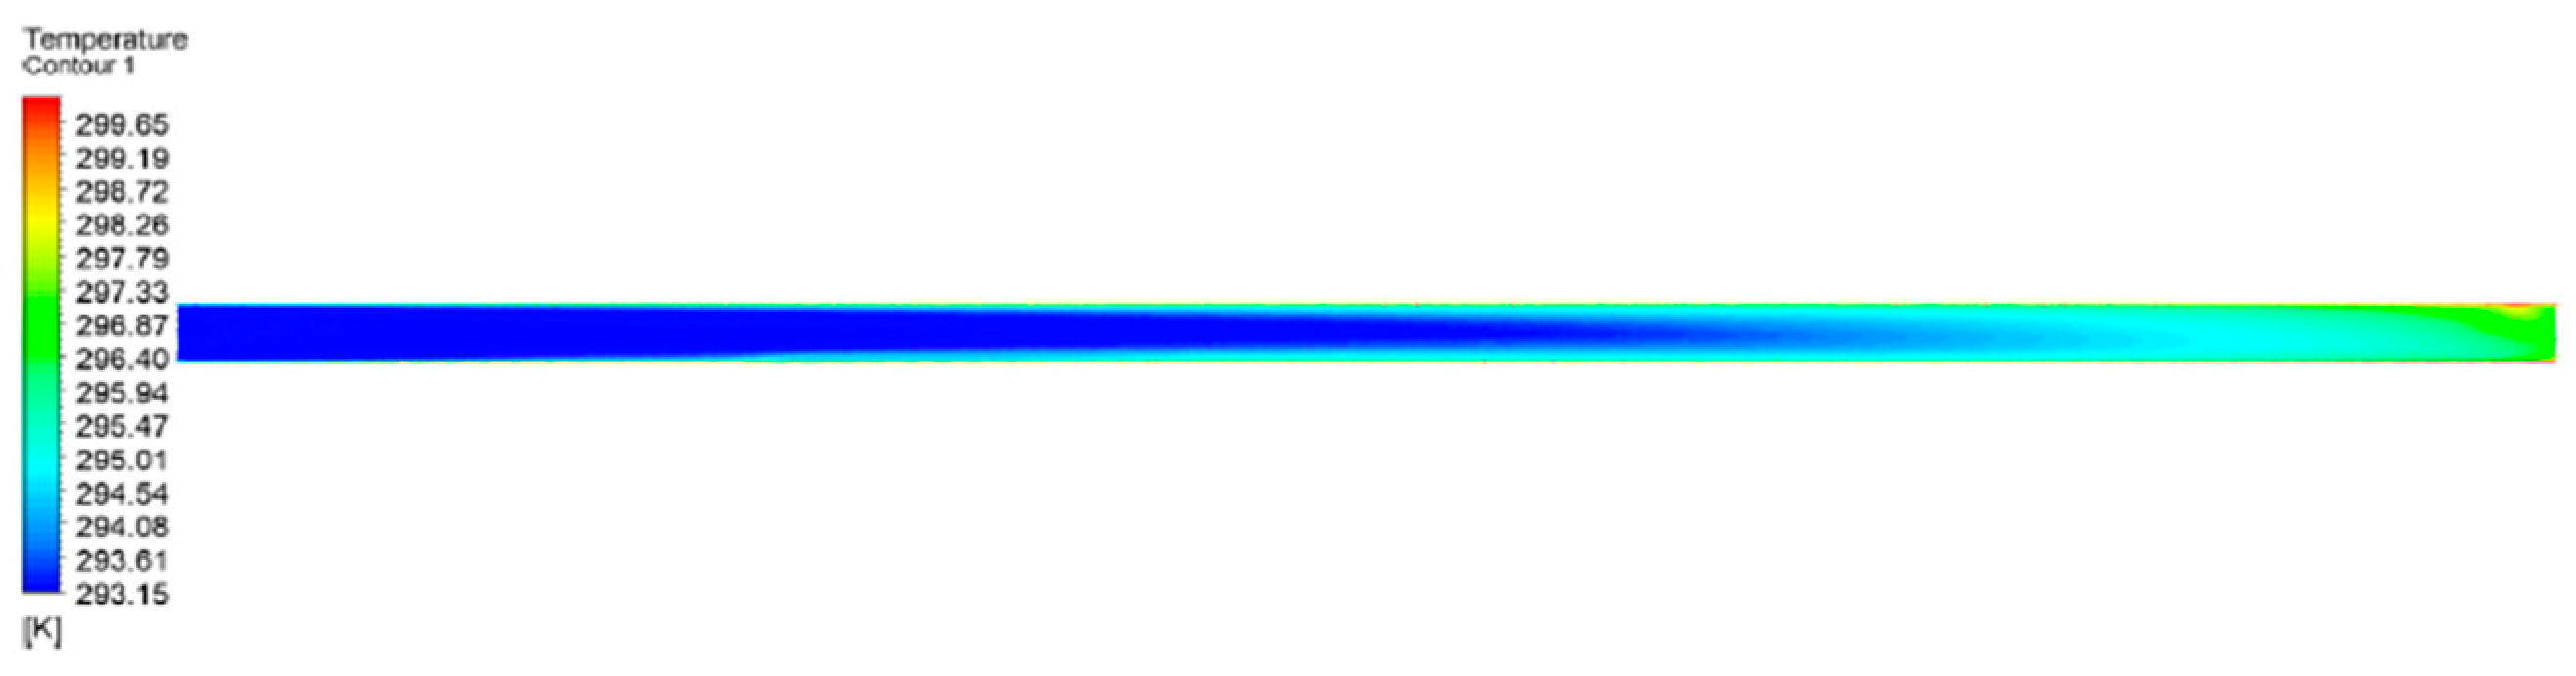
Figure 18.
“L”-shaped FADS temperature distribution[52].
Figure 18.
“L”-shaped FADS temperature distribution[52].
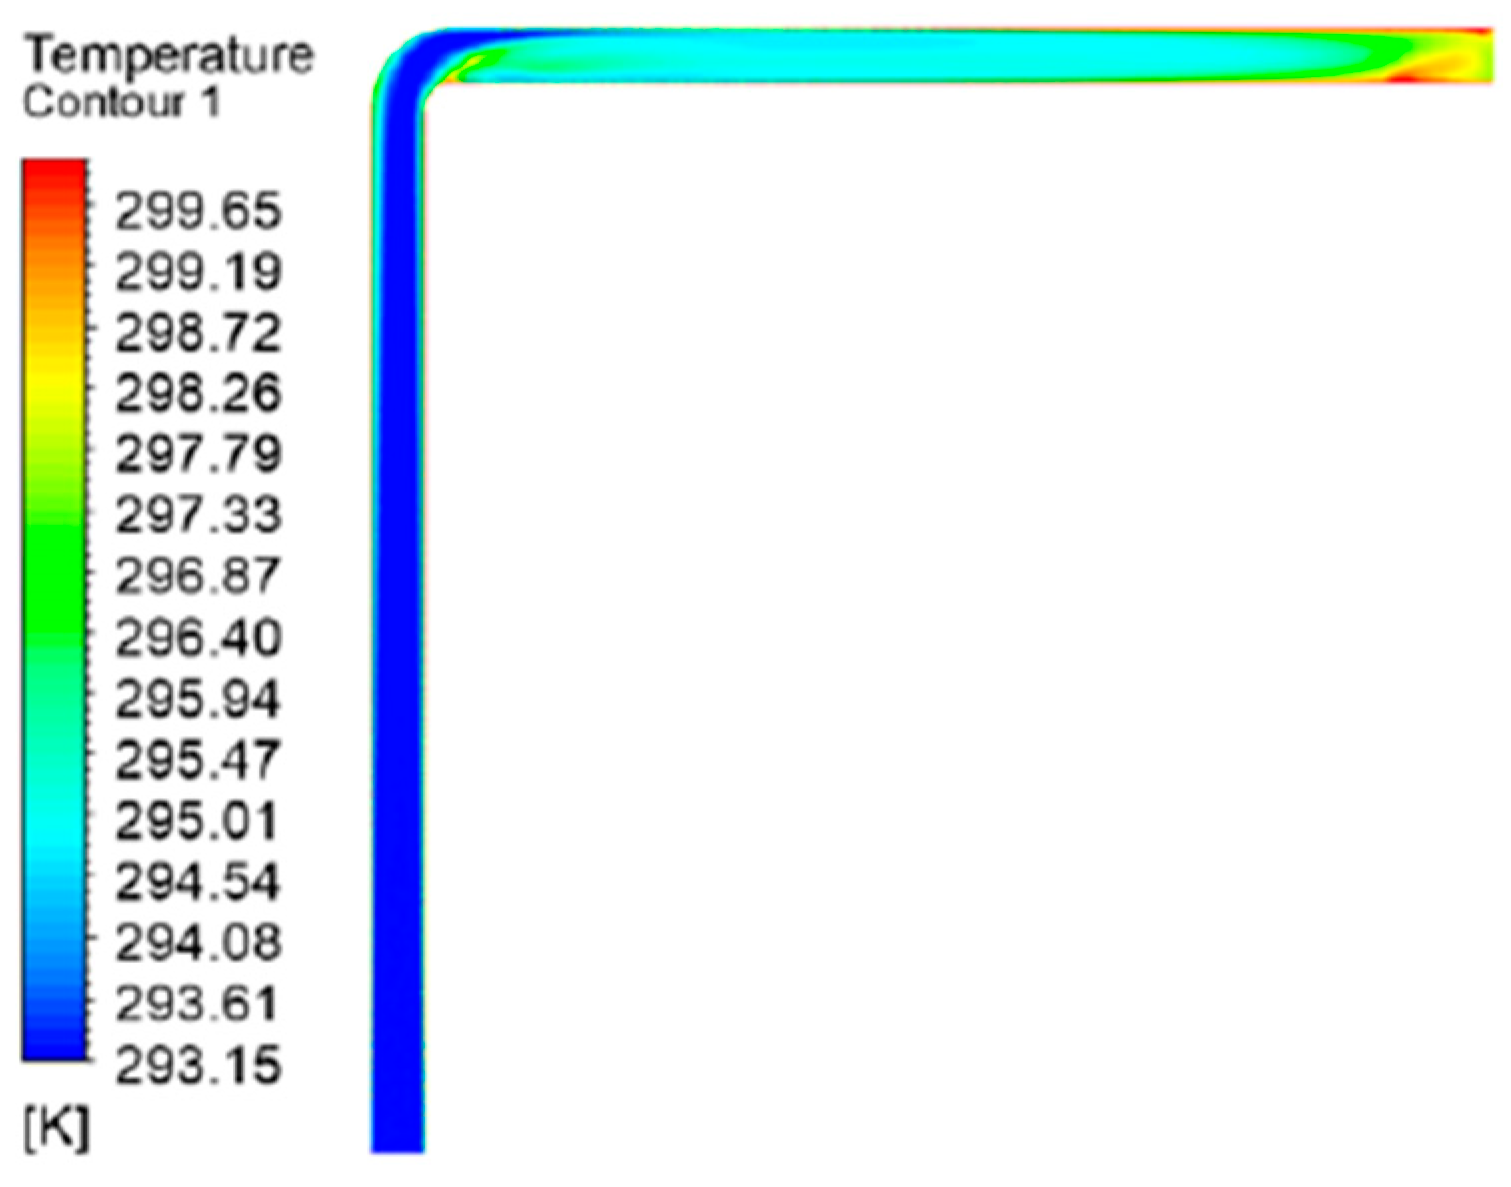
Figure 19.
“U”-shaped FADS temperature distribution[52].
Figure 19.
“U”-shaped FADS temperature distribution[52].
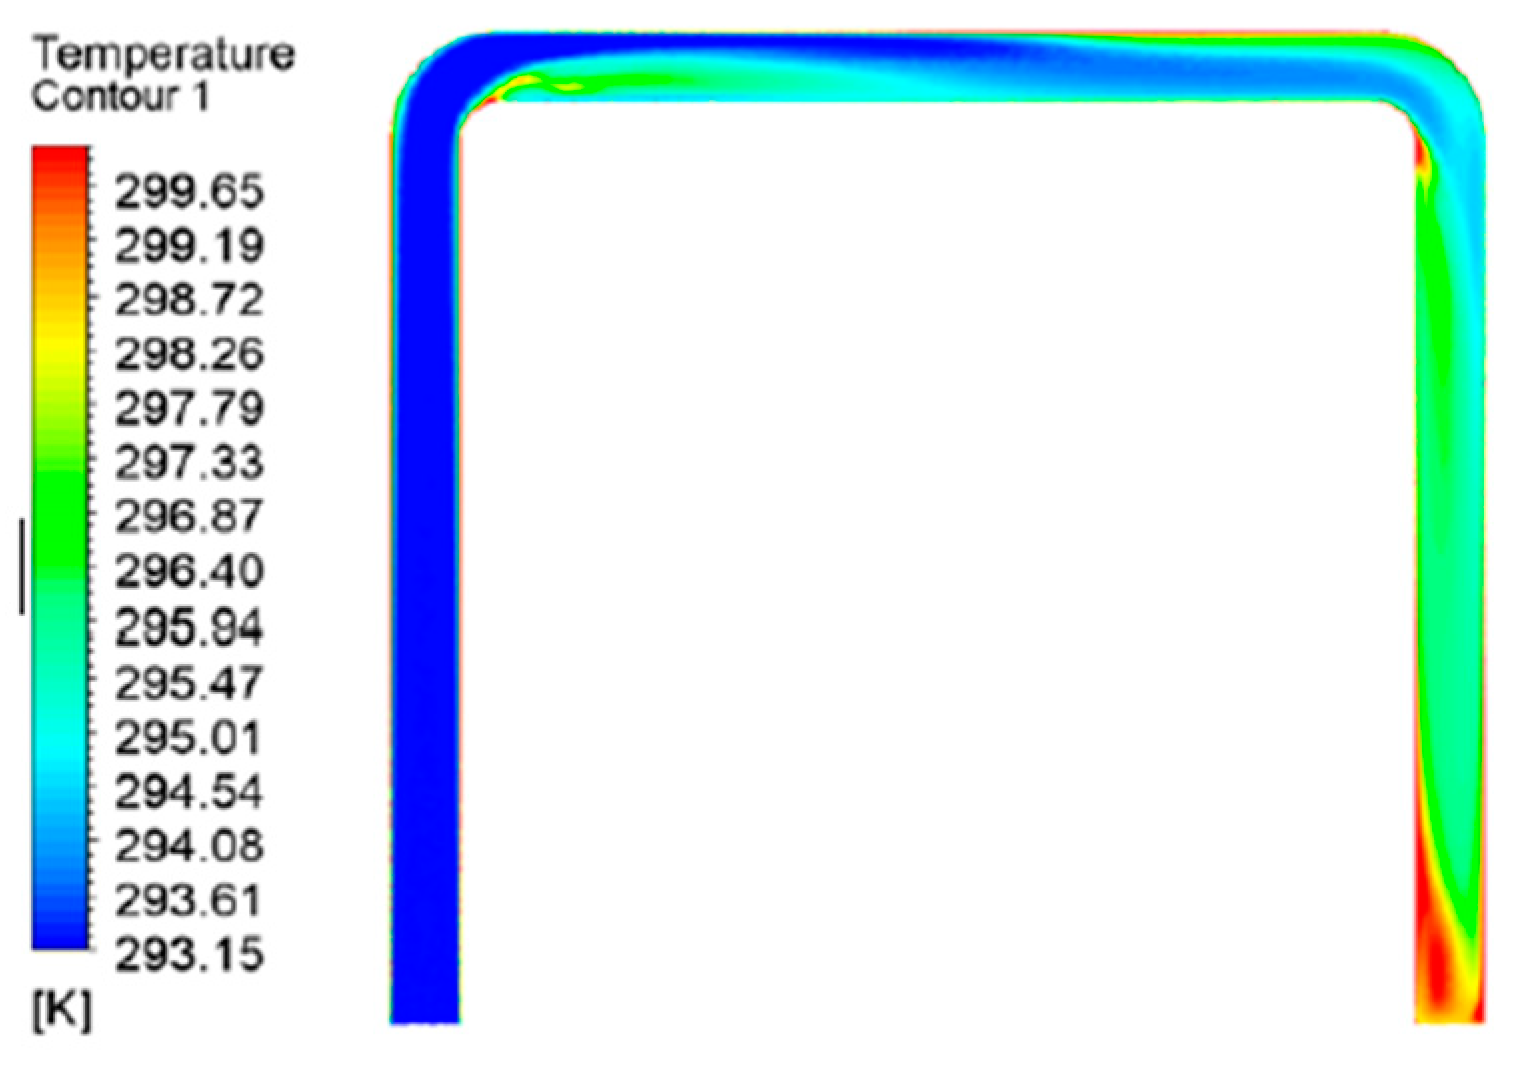
Figure 20.
Temperature variation along internal resistance of three different shaped FADS [52].
Figure 20.
Temperature variation along internal resistance of three different shaped FADS [52].
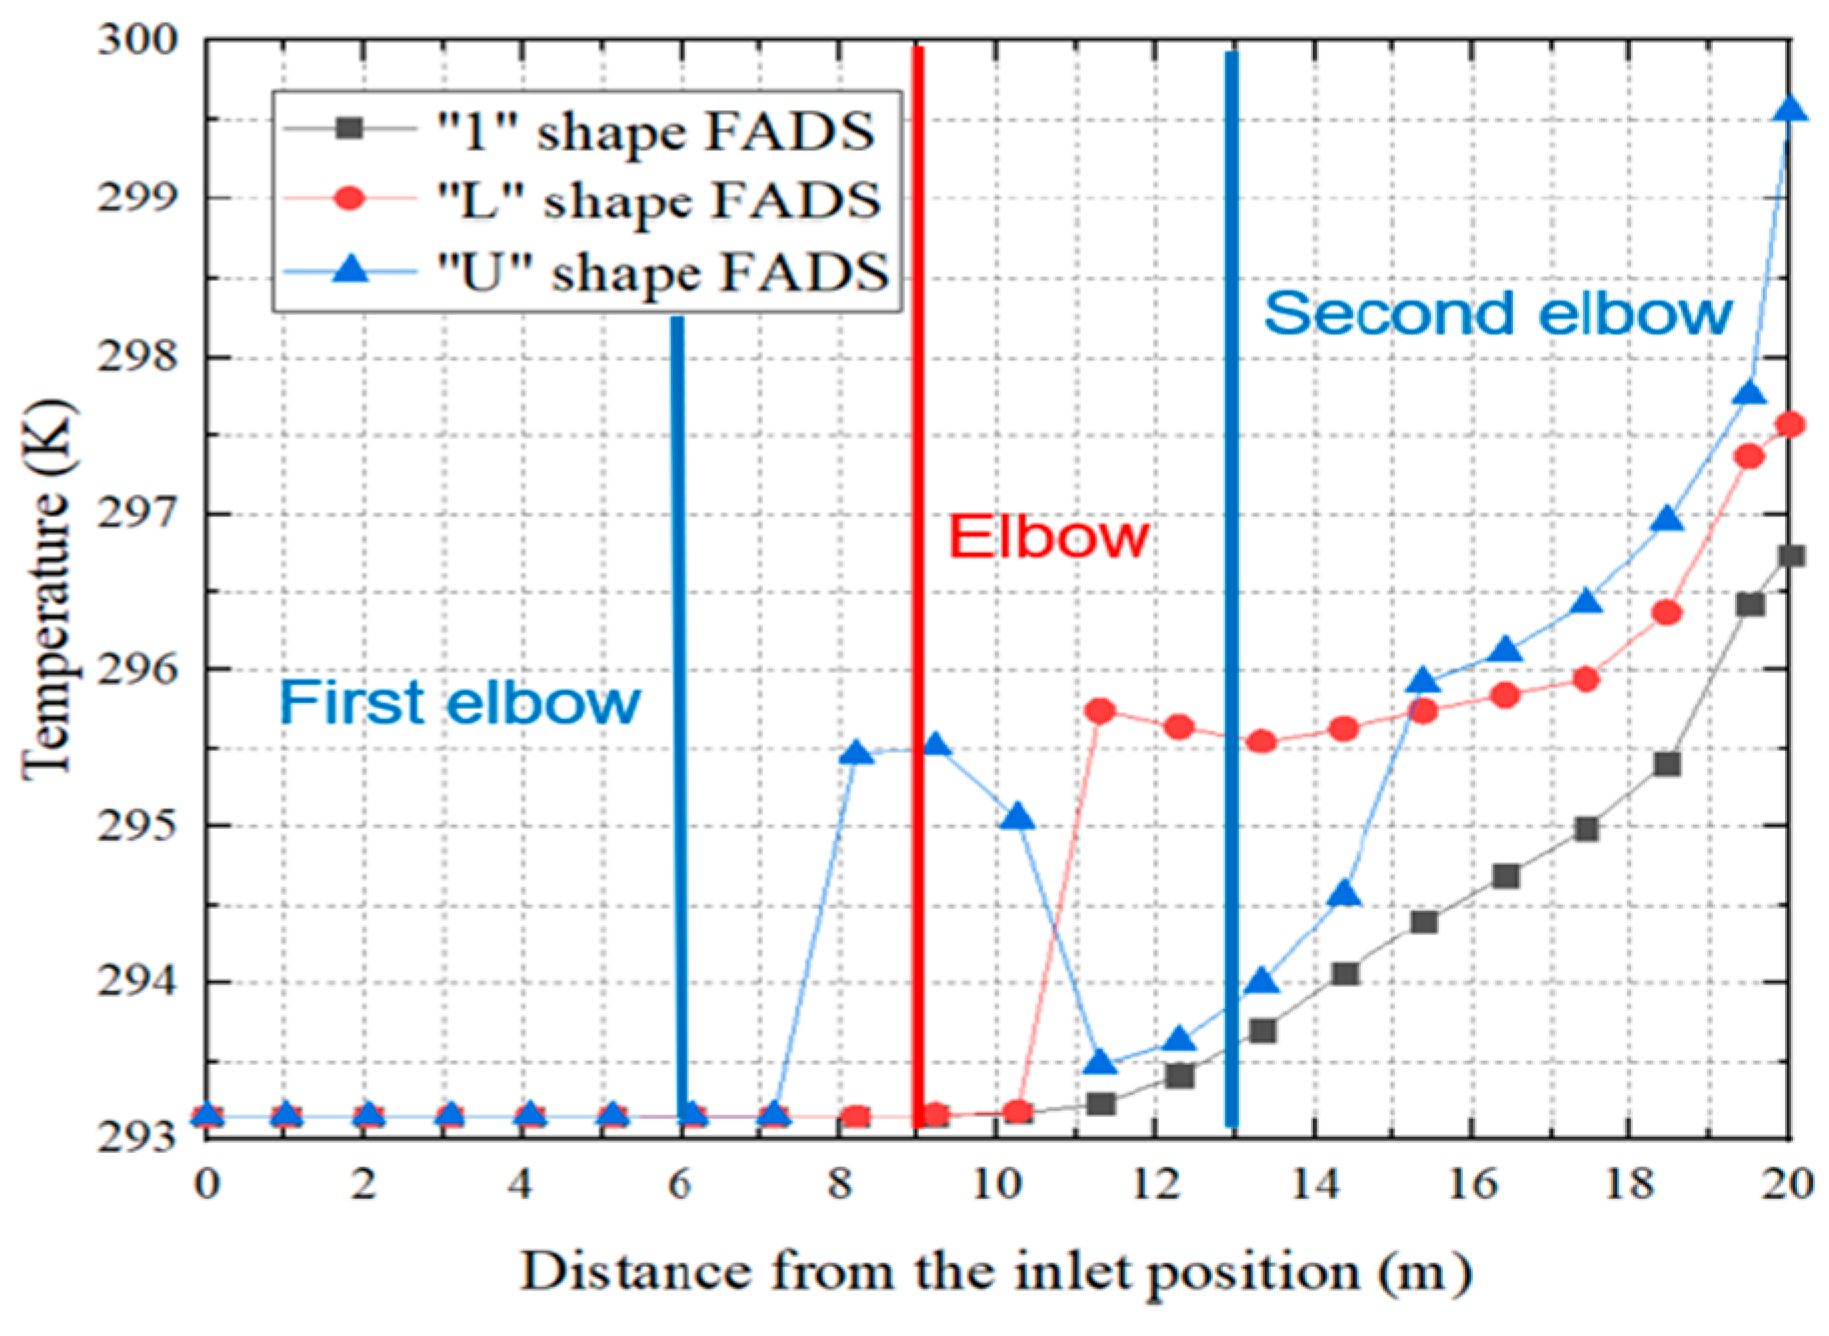
The authors found that, while air velocity affects the temperature rise inside the duct, a higher number of rows opening causes the air velocity to decay and raises the temperature. Due to the disruption of the duct's airflow caused by the elbows used as resistance in the midpoints, there is increased turbulence and primarily non-uniform air distribution. The author advised minimizing elbow engagements and recommended straight ducts. The accuracy at the industrial level was not emphasized, despite the author's ability to establish a novel concept that warrants further investigation.
6. Pressure Drops and Near-Wall Treatment Inside the Duct
Designing ducts plays an important role in influencing pressure drop ( ∆P ), along with duct geometry ( Length, diameter and surface roughness) of the duct. A region of recirculation of flow and turbulence is created due to the airflow separation. Hence, it causes additional friction and energy dissipation. Bends or friction between the air and the duct surface make the pressure difference [54]. Moreover, it is suggested by Kunabeva et al. [55] to use divergence for changing the direction of the airflow instead of a sharp 90° bend. Later on, Walunj et al. [56] made an analysis based on ducts having two different types of bends (a) 90° sharp bands and (b) Y-section bends and concluded stating, the gradual bend instead of sharp bends for branching in the ducting system reduces the pressure loss.
Figure 21.
Ducts having bends (a) 90° sharp bend & (b) Y-shaped gradual bend with having three outlets. [56].
Figure 21.
Ducts having bends (a) 90° sharp bend & (b) Y-shaped gradual bend with having three outlets. [56].
The graph in Figure 22 shows, the pressure drops across the duct having Y- a shaped bend has less pressure drop than the duct with a sharp 90 ° bend. Other than duct bend, slop angles (ꞵ) have some vital importance in reducing the pressure loss as well as the impact on Nusselt (Nu) and Reynolds ( Re ) numbers. Zhang et al. [57]have taken the reference data from Kays et al. [58] and Junqi et al.[59] for justifying the statement of pressure drop in the trapezoidal and rectangular duct increases with the increase in Re number.TPF (Thermal performance factor ) is being introduced to consider the influence of convective heat transfer performance and pressure drop ∆P and assess heat transfer enhancement degree[60].
Here, Nu = Nusselt number, f = flow resistance co-efficient, j =different slope angles & y =rectangular duct having 0 ° slope angle.
From Table 4, The Nu number increases with the increase in the slope angle, which results in convective heat transfer intensity. Increased slop angles also increase pressure drop (∆P) The test was performed in a rectangular duct and a trapezoidal duct. Wang et al. [61] they have performed numerical simulations in regular polygonal ducts (Figure 24) to identify the turbulent flow and heat transfer coefficient. They proposed a correction factor to predict the turbulent heat transfer in regular polygonal ducts through these simulations.
A high Re number indicates more turbulence inside the duct. Furthermore, the discrepancy between the average Nusselt values for the circular tube and regular polygonal ducts rises as the regular polygon's number of sides decreases, as demonstrated by Table 4. In other words, using hydraulic diameter for noncircular ducts—like the equilateral triangular duct—will lead to unacceptably high inaccuracies, roughly 27.5%. Meanwhile, Chandratilleke et al. [62] investigated the airflow through a heated horizontal rectangular duct where they considered the natural convection (Gr<1000,000) heat transfer and thermal radiation from the duct wall. Traditionally, thermal radiation has been linked to high temperatures. However, new research indicates that thermal radiation can also contribute to mixed-mode heat transfer at moderate surface temperatures. It may additionally enhance natural convection, which in turn increases overall heat dissipation rates in heated ducts [63,64,65,66]. Nu fluctuations are supposed to be created due to the wall surface radiation, which refers to the thermal instability of the flow. Incropra et al. [67] note similar behaviour for bottom heated ducts and Maughan [68], which was further considered [62] and gave an investigative demonstration on the instability with side wall heating due to turbulence and erected a standard significance of thermal radiation in heated ducts. Maximilian et al.[69] sought to highlight the heat transfer and fluid flow contrast in the stator duct utilising two distinct turbulence models (a) Stage model & (b) Frozen Rotor model; in addition to various near-wall treatments using CFD (ANSYS CFX).As per Boglietti et al.[70] and Kral et al. [71] simulation time in CFD depends on the number of elements used in it. Moreover, for better analysis of turbulence inside the duct SST (Shear Stress and Transport) appears with more precise results. Versteeg et al. [72] said the SST model concludes the RANS ( Reynold-averaged Navier -Strokes ) equation system by defining two more equations. As stated in Ansys CFX [73], the SST model combines the advantage of k-ω and validity at the distance flow field with the privilege of k-ε model. Furthermore, Menter et al. highlighted the accuracy of the SST model for precise calculation of heat transfer coefficients. [74], Wilcoxet et al. [75] and Launder et al. [76]. Chaube et al .[77] used ANSYS FLUENT for a duct with 10 different ribs and concluded by stating SST k-ω model came up with good predictions of results. In comparison, with the transitional flow, fully rough flow demonstrated a slight increase in transmission of heat but a notable increase in friction. Apart from this Automatic near-wall treatment is used in simulation to define a function which switches automatically from a low Reynolds number to a wall function treatment[73,78].
It is crucial to locate the initial cell adjacent to the surface in the logarithmic wall treatment and the scalable wall treatment using merely the logarithmic wall function is used in the k−ε turbulence model.
) For = 11.06 (12); where, = [79]
The k−ε turbulence model parameters remain unchanged when compared to the SST turbulence model solution. Using the SST turbulence model, the computed value of the heat transfer coefficient changes when the mesh is refined. When the linear and logarithmic wall treatments cross and the largest error deviation is found, the maximum peak is at around y+ ≤ 11.06 [80].
An investigation conducted by different researchers states enhanced performance in heat exchangers using different turbulators (ribs, baffles, delta winglets, vortex generator, rings, perforated blocks/baffles) which results in better heat transfer and reduced pressure drop. High heat resistance is primarily caused by the presence of a laminar sub-layer between the absorber plate and the moving air. The two repeating ribs' artificial geometry causes flow separation and reattachment, which causes turbulence in the laminar sublayer along with heat transfer enhancement. By implementing perforated ribs, to lowering pressure drop, the roughness element's height could be kept low[81].
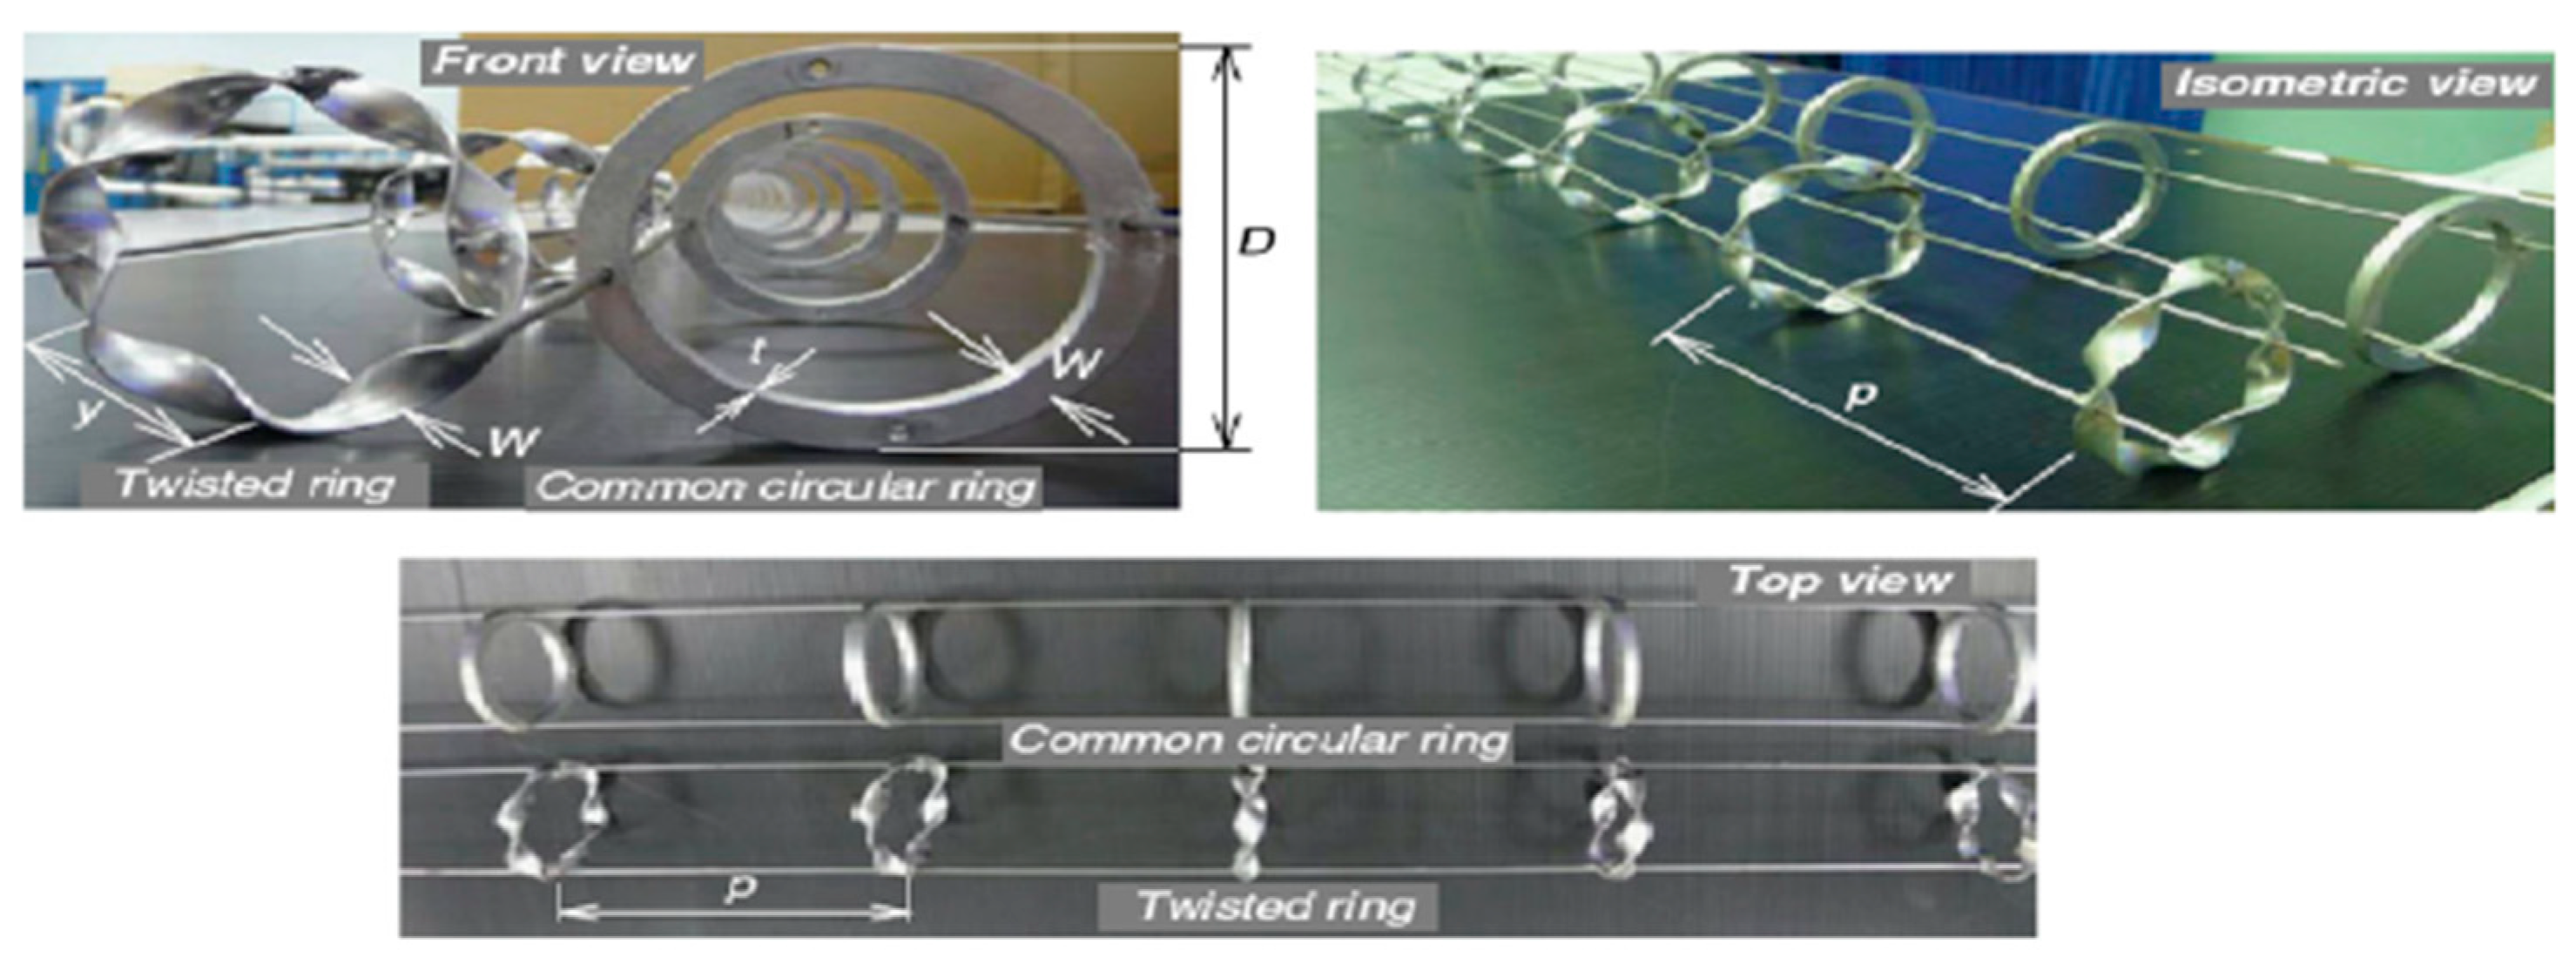
Gee et al.[82] analysed the friction factor and heat transfer in three different (30°,49°,70°) angled helical-rib surfaces and concluded that the 49° helix angle rib provides the best performance. According to Thianpong et al.[83]. twisted rings give lower Nu and f, except at the largest (W/D =0.15) and (p/D =1.0) than common circular rings (CRs).
Figure 25.
Twisted ring studied by Thianpong et al.[83].
Figure 25.
Twisted ring studied by Thianpong et al.[83].
Apart from these, authors found maximum thermal performance congruous with a smaller width and pitch ratio values. Tabish et al.[84] in there review highlighted that perforated bafflers are thermos-hydraulically better than solid bafflers. The authors recommended that the perforated delta compound winglets can better minimise pressure drop than the vortex generator. An investigation by Webb et al. [85] for the enhancement of heat transfer techniques and developing correlations for different fin configurations indicates that the inserts and ribs enhance the heat transfer rate at the cost of low-pressure drop increase. Ranjan. et al. [86] evaluated the hydrothermal performance for the combined use of five different enhancement techniques (1) transverse ribs with twisted tape insert with oblique teeth, (2) integral transverse corrugation and centre-cleared twisted-tape insert, (3) transverse rib and helical screw-tape insert, (4) axial ribs and centre-cleared twisted-tape insert and (5) integral transverse rib and centre-cleared twisted-tape insert and as per performance evaluation the performance of combination was better than that of all kind of individual inserts. Moreover, with the combination techniques industries can achieve a 31-52% increase in heat duty at constant pumping power and in the point of energy saving these techniques reduce 25-36% pumping power at constant heat duty.
7. Insulation Reduces Production Costs and Energy Consumption
In industry, the focus always is on low production costs with the highest efficiency and low energy consumption. Insulation systems can play a vital role in the field for effective heat transfer rates with low energy consumption. The rotational moulding machine needs convective heat flow through the duct where insulations minimize the heat loss from the duct surface to the surrounding ambient air. Moreover, a constant internal temperature can be gained by dint of the insulation. It is suggested to use low thermal conductivity materials to minimize heat loss and improve energy. Ceramic fibre insulation, calcium silicate insulation, mineral wool insulation, high-temperature blanket insulation and Refractory insulation are some recommended to insulate the heat source of the rotational moulding machine. The thickness of the insulation plays a vital role since the thickness of the insulation increases, the more heat loss decreases [87,88].
Table 5.
Different thermal insulation for the heat source with high-temperature resistance.
| Sl | Author | Insulated fibre material | Density (kg/m3) | Thermal Conductivity (W/Mk) | Specific heat capacity (J/kg.K) | Temperature range °C | Remarks |
|---|---|---|---|---|---|---|---|
| 1 | Avikal et al.[89] | Calcium Silicate (Ca₂O₄Si) | 250 | 0.014 | 1030 | - | - |
| 2 | Rock mineral wool | 144 | 0.044 | 840 | - | - | |
| 3 | Cellulose | 65 | 0.04 | 2020 | - | - | |
| 4 | Phenolic foam | 35 | 0.02 | 1000 | - | - | |
| 5 | Polyurethane | 35 | 0.023 | 1450 | - | - | |
| 6 | Aerogel | 1.5 | 0.014 | 1000 | - | - | |
| 7 | Mittenbuhler et al. [90] |
Kao wool ( ) |
- | - | - | 450° 800° | - |
| 8 | SiO2(Pure) | - | - | - | 700°-900° | - | |
| 9 | Alkan et al [91] |
Bonded Fibre Ceramic |
320 | 0.25 | - | max = 1200° | Elastic behaviour, isotropic fibre distribution |
| 10 | Mineral Wool | 0.04 | - | - | - |
||
| 11 | Levinson et al. [92] | Fibreglass (Flexible branch duct) | 13 | 0.047 | - | - | - |
| 12 | Fibreglass (Rigid duct) | 24 | 0.018 | - | - | No temperature range mentioned | |
| 13 | Barkhad et al. [93] | Polylactic Acid (PLA) | - | 0.0682 | - | - | - |
According to Wong et al. [94], critical heat transfer occurs when the outer radius of the insulated circular duct is less than its critical insulation radius for small-sized ducts, especially in conditions of low ambient air/gas convective coefficient ( . Insulation material’s thermal conductivity changes due to changes in both moisture content and temperature. Moreover, condensation in the insulation occurs if the water vapour concentration reaches saturation [95].
8. Insulation Thickness in Duct Reducing Carbon Emission
Apart from that Bahadori et al. [96] proposed a method which inclines in excellent agreement with the reported data for a wide range of conditions where the average absolute deviation is calculated between the reported data and the proposed method which is ~ 3.25 % correlating to the thermal thickness. Moreover, the author claimed the acceptance of the simplification of the method to any industrial application.
There is a correlation between insulation thickness and carbon emission. The reduction in carbon emission due to Optimum insulation thickness (OIT) varies for the different heat sources (NG, bagasse, coal, LPG, RH ) between 11.23 -34.04 kg/m-year for NG. Moreover
Figure 26 shows that it varies from 81.81 -318.33 kg/m-year for bagasse,40.73-123.43 kg/m-year for coal, 14.57-50.14 kg/m-year for LPG,20.38-56.39 kg/m-year and 37.04-141.59 kg/m-year for RH. Not only but also CO and varies between the range of emission between 53.64-81.8%,53.62-81.76% and 49.64-76.66% respectively for different parts and energy sources [97].
9. Conclusions
The rotational moulding is a widely used fabrication process for manufacturing hollow and large-size plastic products. Moreover, in recent years the revaluation in the industry has made it one of the growing industries of the near future. To support and indulge in in-depth knowledge for the development of the process, researchers have researched external and internal temperature profiles during cycle time, based on geometrical and mould enhancement, and tried to reduce cycle time up to ~ 18 % to ~28%. Moreover, depicted overviews on changes in air velocity magnitude and temperature distribution phase based on slop angles, shape change, and impact of design changes in Nusselt and Reynolds numbers. Apart from these researchers worked on the accurate prediction of temperature using various CFD software as well as near-wall treatment of the duct, correlation with insulation thickness and heat sources which results reduction in carbon emission due to optimum insulation thickness (OIT). Most of the researchers have shown their analysis, but their study's lack of accuracy is evident as they could not give the accuracy of their findings, which shows a big gap in that research field. Moreover, there is hardly any research has been conducted to analyse the heat flow through the duct to the rotational moulding process. This review paper aims to correlate the appropriate and sustainable heat transfer mechanism through a duct that results in obtaining the requisite temperature for time-efficient and profitable production. However, the conclusions are already being studied by other researchers but justifying theories through in real-life implementation in the rotational moulding machine industrial arena is missing. Learning more about improved product results in terms of reduced manufacturing costs and carbon emissions will be beneficial.
Nomenclature
| Latin Symbol | |
| Minimum speed (1/s)/(rpm) | |
| g | Acceleration of gravity [m∕] |
| r | Tube radius [m] |
| T | Temperature, K |
| t | Time, s |
| ρ | Density, kg/ |
| Total enthalpy , J/kg | |
| Specific heat [J.] | |
| k | Thermal conductivity [W/(m.k)] |
| h | Convection heat transfer coefficient [W/ |
| υ | velocity in air [m/s] |
| Shear stress velocity [ m/s] | |
| ˉu | Average speed [ m/s] |
| Dimensionless | |
| Dimensionless wall distance | |
| Re | Reynolds number |
| Nu | Nusselt number |
| Gr | Grashof number |
| B, C | Constant |
| Greek symbol | |
| ε | Turbulent dissipation rate (kg/m-s) |
| ω | Specific rate of dissipation (kg/m-s) |
| Subscript | |
| z | Coordinate of the surface |
References
- Rahner, S. The latest trend: rotational moulding; Europe, K.P.1998) 24–26.
- Nugent, P.; Molding, R. in: Applied Plastics Engineering Handbook: Processing and Materials, Elsevier, 2011: pp. 311–332. [CrossRef]
- Torres, F.; Aragon, C. Final product testing of rotational moulded natural fibre-reinforced polyethylene. Polym. Test. 2006, 25, 568–577. [Google Scholar] [CrossRef]
- Liu, S.-J.; Fu, K.-H. Effect of enhancing fins on the heating/cooling efficiency of rotational molding and the molded product qualities. Polym. Test. 2008, 27, 209–220. [Google Scholar] [CrossRef]
- Sutaria, I. Rotational Molding Machine Market , 2023. https://www.futuremarketinsights.com/reports/rotational-molding-machine-market (accessed June 28, 2024).
- Rincon-Rubio, L.; Fayolle, B.; Audouin, L.; Verdu, J. A general solution of the closed-loop kinetic scheme for the thermal oxidation of polypropylene. Polym. Degrad. Stab. 2001, 74, 177–188. [Google Scholar] [CrossRef]
- Richaud, E.; Farcas, F.; Bartoloméo, P.; Fayolle, B.; Audouin, L.; Verdu, J. Effect of oxygen pressure on the oxidation kinetics of unstabilised polypropylene. Polym. Degrad. Stab. 2006, 91, 398–405. [Google Scholar] [CrossRef]
- Sarrabi, S.; Colin, X.; Tcharkhtchi, A. Kinetic modeling of polypropylene thermal oxidation during its processing by rotational molding. J. Appl. Polym. Sci. 2010, 118, 980–996. [Google Scholar] [CrossRef]
- Dı́az, G.; Sen, M.; Yang, K. Effect of delay in thermal systems with long ducts. Int. J. Therm. Sci. 2003, 43, 249–254. [Google Scholar] [CrossRef]
- Ogila, K.O.; Shao, M.; Yang, W.; Tan, J. Rotational molding: A review of the models and materials. Express Polym. Lett. 2017, 11, 778–798. [Google Scholar] [CrossRef]
- Lim, K.; Ianakiev, A. Modeling of rotational molding process: Multi-layer slip-flow model, phase-change, and warpage. Polym. Eng. Sci. 2006, 46, 960–969. [Google Scholar] [CrossRef]
- Lim, K.; Ianakiev, A. Two-dimensional slip-flow model of rotational moulding, (2004).
- Lim K., K. Ianakiev A.: Numerical studies of the... - Google Scholar, (n.d.). https://scholar.google.com.au/scholar?hl=en&as_sdt=0%2C5&q=Lim+K.+K.%2C+Ianakiev+A.%3A+Numerical+studies+of+the+phase+change+and+warpage+under+various+process+conditions+for+rotational+molding.+in+%E2%80%98SPE-ANTEC+Annual+Technical+Conference.+Chicago%2C+USA%E2%80%99+Vol+1%2C+897%E2%80%93901+%282004%29.&btnG= (accessed July 7, 2024).
- Banerjee, S.; Yan, W.; Bhattacharyya, D. Modeling of heat transfer in rotational molding. Polym. Eng. Sci. 2008, 48, 2188–2197. [Google Scholar] [CrossRef]
- Greco, A.; Maffezzoli, A.; Vlachopoulos, J. Simulation of heat transfer during rotational molding. Adv. Polym. Technol. 2003, 22, 271–279. [Google Scholar] [CrossRef]
- Bellehumeur, C.; Medina, A.; Xu, H. Dimensional stability of single-site ethylene copolymers in rotational molding. Polym. Eng. Sci. 2009, 49, 1400–1409. [Google Scholar] [CrossRef]
- Xu, H.; Bellehumeur, C.T. Modeling the morphology development of ethylene copolymers in rotational molding. J. Appl. Polym. Sci. 2006, 102, 5903–5917. [Google Scholar] [CrossRef]
- Xu, H.; Bellehumeur, C. Thermal residual stress development for semi-crystalline polymers in rotational molding. Polym. Eng. Sci. 2007, 48, 283–291. [Google Scholar] [CrossRef]
- Spence, A.G.; Crawford, R.J. The effect of processing variables on the formation and removal of bubbles in rotationally molded products. Polym. Eng. Sci. 1996, 36, 993–1009. [Google Scholar] [CrossRef]
- Crawford, R. J.S.-P. and rubber processing and, undefined 1987, The formation and removal of gas bubbles in a rotational moulding grade of PE, Pascal-Francis.Inist.Fr (n.d.). https://pascal-francis.inist.fr/vibad/index.php?action=getRecordDetail&idt=7585550 (accessed July 7, 2024).
- Spence, A.G.; Crawford, R.J. Removal of Pinholes and Bubbles from Rotationally Moulded Products. Proc. Inst. Mech. Eng. Part B: J. Eng. Manuf. 1996, 210, 521–533. [Google Scholar] [CrossRef]
- Cramez, M.; Oliveira, M.; R.C.-P.D.; Stability; undefined 2002, Optimisation of rotational moulding of polyethylene by predicting antioxidant consumption, ElsevierMC Cramez, MJ Oliveira, RJ CrawfordPolymer Degradation and Stability, 2002•Elsevier (n.d.). https://www.sciencedirect.com/science/article/pii/S0141391001002348 (accessed July 7, 2024).
- Bawiskar, S.; White, J.L. Comparative study of warpage, global shrinkage, residual stresses, and mechanical behavior of rotationally molded parts produced from different polymers. Polym. Eng. Sci. 1994, 34, 815–820. [Google Scholar] [CrossRef]
- Pop-Iliev R.; Park C. B.; Scholar, T.P..-G.; n.d.). https://scholar.google.com.au/scholar?hl=en&as_sdt=0%2C5&q=Pop-Iliev+R.%2C+Park+C.+B.%2C+Lee+K.+H.%3A+The+potentials+for+processing+metallocene+pe+grades+in+rotational+molding.+in+%E2%80%98Proceedings+of+PPS-18%2C+International+Conference+of+the+Polymer+Processing+Society.+Guimaraes%2C+Portugal%E2%80%99+p.6+%282002%29.&btnG= (accessed July 7, 2024).
- Kontopoulou, M.; Vlachopoulos, J. Bubble dissolution in molten polymers and its role in rotational molding. Polym. Eng. Sci. 1999, 39, 1189–1198. [Google Scholar] [CrossRef]
- Gogos, G. Bubble removal in rotational molding. Polym. Eng. Sci. 2004, 44, 388–394. [Google Scholar] [CrossRef]
- Spence, A.G.; Crawford, R.J. Removal of Pinholes and Bubbles from Rotationally Moulded Products. Proc. Inst. Mech. Eng. Part B: J. Eng. Manuf. 1996, 210, 521–533. [Google Scholar] [CrossRef]
- Australian Polyethylene Market Growth Insights, 2014-2024: Blow Moulding, Pipe Extrusion, Film Extrusion, Rotational Moulding, Injection Moulding - ResearchAndMarkets.com | Business Wire, (n.d.). https://www.businesswire.com/news/home/20200403005373/en/Australian-Polyethylene-Market-Growth-Insights-2014-2024-Blow-Moulding-Pipe-Extrusion-Film-Extrusion-Rotational-Moulding-Injection-Moulding---ResearchAndMarkets.com (accessed June 29, 2024).
- Australia Water Storage System Market Size, Share & Forecast 2029 | BlueWeave, (n.d.). https://www.blueweaveconsulting.com/report/australia-water-storage-system-market (accessed July 7, 2024).
- Throne, J.L. Opportunities for the next decade in blow molding: Plastics processing technology: Opportunities for the next decade. Plastics Engineering 1998, 54, 41–43. [Google Scholar]
- Crawford, R.J. RECENT ADVANCES IN THE MANUFACTURE OF PLASTIC PRODUCTS BY ROTOMOULDING, 1996.
- Harper, C.A. Handbook of plastic processes, Wiley-Interscience, 2006.
- Crawford, R.J. Rotational moulding of plastics, (No Title) (1996).
- Fleischer, J.; Koch, S.; Engineering, S.C.-P.; undefined 2015, Manufacturing of polygon fiber reinforced plastic profiles by rotational molding and intrinsic hybridization, Springer (n.d.). https://link.springer.com/article/10.1007/s11740-015-0620-0 (accessed July 7, 2024).
- Neitzel, M.; Mitschang, P.; Breuer, U. Handbuch verbundwerkstoffe: werkstoffe; verarbeitung; anwendung, Carl Hanser Verlag GmbH Co KG, 2014.
- Gogos, G.; Liu, X.; Olson, L.G. Cycle time predictions for the rotational molding process with and without mold/part separation. Polym. Eng. Sci. 1999, 39, 617–629. [Google Scholar] [CrossRef]
- Gogos, G.; Olson, L.G.; Liu, X.; Pasham, V.R. New models for rotational molding of plastics. Polym. Eng. Sci. 1998, 38, 1387–1398. [Google Scholar] [CrossRef]
- Greco, A.; Maffezzoli, A.; Vlachopoulos, J. Simulation of heat transfer during rotational molding. Adv. Polym. Technol. 2003, 22, 271–279. [Google Scholar] [CrossRef]
- Bawiskar, S.; White, J.L. Simulation of Heat Transfer and Melting in Rotational Molding. Int. Polym. Process. 1995, 10, 62–67. [Google Scholar] [CrossRef]
- Crawford, R.J.; Nugent, P. Computer simulation of the rotational moulding process for plastics. Plastics and Rubber Processing and Applications 1989, 11, 107–124. [Google Scholar]
- Banerjee, S.; Yan, W.; Bhattacharyya, D. Modeling of heat transfer in rotational molding. Polym. Eng. Sci. 2008, 48, 2188–2197. [Google Scholar] [CrossRef]
- Reducing cycle times in rotational moulding of plastics: A theoretical and experimental analysis — Queen’s University Belfast, (n.d.). https://pure.qub.ac.uk/en/studentTheses/reducing-cycle-times-in-rotational-moulding-of-plastics-a-theoret (accessed June 28, 2024).
- Abdullah, M.; Bickerton, S.; Bhattacharyya, D. Rotational molding cycle time reduction through surface enhanced molds: Part A—Theoretical study. Polym. Eng. Sci. 2007, 47, 1406–1419. [Google Scholar] [CrossRef]
- Abdullah, M.; Bickerton, S.; Bhattacharyya, D. Rotational molding cycle time reduction through surface-enhanced molds, Part B: Experimental study. Polym. Eng. Sci. 2007, 47, 1420–1429. [Google Scholar] [CrossRef]
- Ranganayakulu, C.; Luo, X.; Kabelac, S. The single-blow transient testing technique for offset and wavy fins of compact plate-fin heat exchangers. Appl. Therm. Eng. 2017, 111, 1588–1595. [Google Scholar] [CrossRef]
- Gao, R.; Chen, S.; Zhao, J.; Zhang, Y.; Li, A. Coupling effect of ventilation duct bend with different shapes and sizes. Build. Simul. 2015, 9, 311–318. [Google Scholar] [CrossRef]
- Berrier, B.L.; Allan, B.G. Experimental and computational evaluation of flush-mounted, S-duct inlets, AIAA Paper (2004) 8780–8792. [CrossRef]
- Spicka, P.; Dias, M.; Science, B.J.C.-C.E.; undefined 2001, Gas–liquid flow in a 2D column: comparison between experimental data and CFD modelling, ElsevierP Spicka, MM Dias, BL Jose’e CarlosChemical Engineering Science, 2001•Elsevier (n.d.). https://www.sciencedirect.com/science/article/pii/S0009250901002767 (accessed June 28, 2024).
- Onder, M.; Sarac, S.; Cevik, E. The influence of ventilation variables on the volume rate of airflow delivered to the face of long drivages. Tunn. Undergr. Space Technol. 2006, 21, 568–574. [Google Scholar] [CrossRef]
- Agafonova, V.V.; Skibin, A.P.; Volkov, V.Y. Modeling of Air Distribution in an Office Building Using Microperforated Textile Air Duct. IOP Conf. Ser. Mater. Sci. Eng. 2021, 1079. [Google Scholar] [CrossRef]
- Raphe, P.; Fellouah, H.; Poncet, S.; Ameur, M. Ventilation effectiveness of uniform and non-uniform perforated duct diffusers at office room. Build. Environ. 2021, 204, 108118. [Google Scholar] [CrossRef]
- Yang, K.; Shi, T.; Ming, T.; Wu, Y.; Chen, Y.; Yu, Z.; Ahmadi, M.H. Study of Internal Flow Heat Transfer Characteristics of Ejection-Permeable FADS. Energies 2023, 16, 4377. [Google Scholar] [CrossRef]
- Yang, J.; Dong, Z.; Yang, H.; Liu, Y.; Wang, Y.; Chen, F.; Chen, H. Numerical and Experimental Study on Thermal Comfort of Human Body by Split-Fiber Air Conditioner. Energies 2022, 15, 3755. [Google Scholar] [CrossRef]
- Cai, J.; Thierauf, G. DISCRETE OPTIMIZATION OF STRUCTURES USING AN IMPROVED PENALTY FUNCTION METHOD. Eng. Optim. 1993, 21, 293–306. [Google Scholar] [CrossRef]
- Kunabeva, N.D.; Professor, A. Engineering and Technology (A High Impact Factor, International Journal of Innovative Research in Science 6 (2017). [CrossRef]
- Walunj, S.; Shirsath, S.; Biradar, A.; Salvi, A.; Deore, M. STUDY AND ANALYSIS OF AIR FLOW THROUGH DUCT, JETIR, 2021. www.jetir.org.
- Zhang, Y.; Li, M. Research on flow and heat transfer characteristics of heat transfer surface of trapezoidal duct. Heat Mass Transf. 2020, 56, 1475–1486. [Google Scholar] [CrossRef]
- W.M. Kays, A.L. London, Compact heat exchangers, (1984).
- Junqi, D.; Jiangping, C.; Zhijiu, C.; Yimin, Z.; Wenfeng, Z. Heat transfer and pressure drop correlations for the wavy fin and flat tube heat exchangers. Appl. Therm. Eng. 2007, 27, 2066–2073. [Google Scholar] [CrossRef]
- Saha, A.; Acharya, S. Parametric study of unsteady flow and heat transfer in a pin-fin heat exchanger. Int. J. Heat Mass Transf. 2003, 46, 3815–3830. [Google Scholar] [CrossRef]
- Wang, P.; Yang, M.; Wang, Z.; Zhang, Y. A New Heat Transfer Correlation for Turbulent Flow of Air With Variable Properties in Noncircular Ducts. J. Heat Transf. 2014, 136, 101701. [Google Scholar] [CrossRef]
- Chandratilleke, T.T.; Narayanaswamy, R.; Wangdhamkoom, P. Convective heat transfer in airflow through a duct with wall thermal radiation. IOP Conf. Ser. Mater. Sci. Eng. 2010, 10. [Google Scholar] [CrossRef]
- Narayanaswamy, R.; King, A.J.C.; Chandratilleke, T.T. Multimode heat transfer in an enclosure with multiple partitions. Aust. J. Mech. Eng. 2007, 4, 87–92. [Google Scholar] [CrossRef]
- Ramesh, N.; Venkateshan, S. Experimental study of natural convection in a square enclosure using differential interferometer. Int. J. Heat Mass Transf. 2001, 44, 1107–1117. [Google Scholar] [CrossRef]
- Ramesh, N.; Merzkirch, W. Combined convective and radiative heat transfer in side-vented open cavities. Int. J. Heat Fluid Flow 2001, 22, 180–187. [Google Scholar] [CrossRef]
- An Experimental Study of Natural Convection and Surface... - Google Scholar, (n.d.). https://scholar.google.com.au/scholar?hl=en&as_sdt=0%2C5&q=An+Experimental+Study+of+Natural+Convection+and+Surface+Radiation+in+an+Open+Cavity%2C+&btnG.
- Maughan, J.; Incropera, F. Experiments on mixed convection heat transfer for airflow in a horizontal and inclined channel. Int. J. Heat Mass Transf. 1987, 30, 1307–1318. [Google Scholar] [CrossRef]
- Maughan, J.; Incropera, F. Regions of heat transfer enhancement for laminar mixed convection in a parallel plate channel. Int. J. Heat Mass Transf. 1990, 33, 555–570. [Google Scholar] [CrossRef]
- Schrittwieser, M.; Marn, A.; Farnleitner, E.; Kastner, G. Numerical Analysis of Heat Transfer and Flow of Stator Duct Models. IEEE Trans. Ind. Appl. 2013, 50, 226–233. [Google Scholar] [CrossRef]
- Boglietti, A.; Cavagnino, A.; Staton, D.; Shanel, M.; Mueller, M.; Mejuto, C. Evolution and Modern Approaches for Thermal Analysis of Electrical Machines. IEEE Trans. Ind. Electron. 2009, 56, 871–882. [Google Scholar] [CrossRef]
- Kral, C.; Haumer, A.; Haigis, M.; Lang, H.; Kapeller, H. Comparison of a CFD Analysis and a Thermal Equivalent Circuit Model of a TEFC Induction Machine With Measurements. IEEE Trans. Energy Convers. 2009, 24, 809–818. [Google Scholar] [CrossRef]
- An Introduction to Computational Fluid Dynamics—The... - Google Scholar, (n.d.). https://scholar.google.com.au/scholar?hl=en&as_sdt=0%2C5&q=An+Introduction+to+Computational+Fluid+Dynamics%E2%80%94The+Finite+Volume+Method%2C+2nd+ed.+Essex%2C+U.K.%3A+Pearson%2C+2007.&btnG.
- ANSYS CFX—Solver Modeling Guide, ANSYS Inc., Canonsburg... - Google Scholar, (n.d.). https://scholar.google.com.au/scholar?hl=en&as_sdt=0%2C5&q=ANSYS+CFX%E2%80%94Solver+Modeling+Guide%2C+ANSYS+Inc.%2C+Canonsburg%2C+PA%2CUSA%2C+2011%2C+Release+14.0.&btnG= (accessed June 28, 2024).
- Menter, F.R. Two-equation eddy-viscosity turbulence models for engineering applications. AIAA J. 1994, 32, 1598–1605. [Google Scholar] [CrossRef]
- HTurbulence Modeling for CFD: Solutions Manual.La... - Google Scholar, (n.d.). https://scholar.google.com.au/scholar?hl=en&as_sdt=0%2C5&q=HTurbulence+Modeling+for+CFD%3A+Solutions+Manual.La+Canada%2C+CA%2C+USA%3A+DCW+Industries%2C+1994&btnG= (accessed June 29, 2024).
- Mathematical Models of Turbulence Academic press... - Google Scholar, (n.d.). https://scholar.google.com.au/scholar?hl=en&as_sdt=0%2C5&q=Mathematical+Models+of+Turbulence+Academic+press+1972+B.+Launder&btnG= (accessed June 29, 2024).
- Chaube, A.; Sahoo, P.K.; Solanki, S.C. Effect Of Roughness Shape On Heat Transfer And Flow Friction Characteristics Of Solar Air Heater With Roughened Absorber Plate. WIT Transactions on Engineering Sciences 2006, 53, 43–51. [Google Scholar] [CrossRef]
- V. W. Heat Transfer Predictions Using Advanced Two-Equation Turbulence Models, CFX Technical Memorandum (CFX-VAL10/0602) (2002). https://cir.nii.ac.jp/crid/1573387450072178816 (accessed June 28, 2024).
- Boundary-Layer Theory - Hermann Schlichting (Deceased), Klaus Gersten - Google Books, (n.d.). https://books.google.com.au/books?hl=en&lr=&id=bOUyDQAAQBAJ&oi=fnd&pg=PR7&dq=Theory+of+Boundary+Layers+(in+German).+Berlin,+Germany:+Springer-Verlag,+2006&ots=trakJnLPfN&sig=R3PedqFFFOhGyhBvLs8p1DtRK70#v=onepage&q&f=false.
- Schlichting, H.; Gersten, K. Boundary-layer theory; springer, 2016.
- Alam, T.; Saini, R.; Saini, J. Use of turbulators for heat transfer augmentation in an air duct – A review. Renew. Energy 2014, 62, 689–715. [Google Scholar] [CrossRef]
- Gee, D.L.; Webb, R.L. Forced convection heat transfer in helically rib-roughened tubes. Int. J. Heat Mass Transf. 1980, 23, 1127–1136. [Google Scholar] [CrossRef]
- Thianpong, C.; Yongsiri, K.; Nanan, K.; Eiamsa-Ard, S. Thermal performance evaluation of heat exchangers fitted with twisted-ring turbulators. Int. Commun. Heat Mass Transf. 2012, 39, 861–868. [Google Scholar] [CrossRef]
- Alam, T.; Saini, R.; Saini, J. Heat and flow characteristics of air heater ducts provided with turbulators—A review. Renew. Sustain. Energy Rev. 2014, 31, 289–304. [Google Scholar] [CrossRef]
- Webb, R.L.; Kim, N.Y. Enhanced heat transfer; Taylor; Francis; NY (2005).
- Ranjan, H.; Bharti, A.K.; Emani, M.S.; Meyer, J.P.; Saha, S.K. New combined heat transfer enhancement techniques used in laminar flow through non-circular ducts. Appl. Therm. Eng. 2019, 163, 114325. [Google Scholar] [CrossRef]
- Cai, S. Thermal performance of mechanical pipe insulation systems at below-ambient temperature, Oklahoma State University, 2013.
- Masatin, V.; Volkova, A.; Hlebnikov, A.; Latosov, E. Improvement of District Heating Network Energy Efficiency by Pipe Insulation Renovation with PUR Foam Shells. Energy Procedia 2017, 113, 265–269. [Google Scholar] [CrossRef]
- Avikal, S.; Devi, R.; Bisht, A.S.; Kumar, K.C.N. Design and Thermal Analysis of Pipe Insulation, Lecture Notes in Mechanical Engineering (2021) 455–465. [CrossRef]
- Mittenbühler, A.; Jung, J. Ceramic materials under high temperature heat transfer conditions. J. Nucl. Mater. 1990, 171, 54–62. [Google Scholar] [CrossRef]
- Keçebaş, A.; Alkan, M.A.; Bayhan, M. Thermo-economic analysis of pipe insulation for district heating piping systems. Appl. Therm. Eng. 2011, 31, 3929–3937. [Google Scholar] [CrossRef]
- Levinson, R.; Delp, W.; Dickerhoff, D.; Modera, M. Effects of airflow infiltration on the thermal performance of internally insulated ducts. Energy Build. 2000, 32, 345–354. [Google Scholar] [CrossRef]
- Barkhad, M.S.; Abu-Jdayil, B.; Iqbal, M.Z.; Mourad, A.-H.I. Thermal insulation using biodegradable poly(lactic acid)/date pit composites. Constr. Build. Mater. 2020, 261, 120533. [Google Scholar] [CrossRef]
- Wong, K.-L.; Chen, W.-L.; Hsien, T.-L.; Chou, H.-M. The critical heat transfer characteristics of an insulated oval duct. Energy Convers. Manag. 2010, 51, 1442–1448. [Google Scholar] [CrossRef]
- Kaynakli, O. Economic thermal insulation thickness for pipes and ducts: A review study. Renew. Sustain. Energy Rev. 2014, 30, 184–194. [Google Scholar] [CrossRef]
- Bahadori, A.; Vuthaluru, H.B. A simple method for the estimation of thermal insulation thickness. Appl. Energy 2010, 87, 613–619. [Google Scholar] [CrossRef]
- Kumar, D.; Kumar, S.; Bhayo, B.A.; Hari̇jan, K.; Uqali̇, M.A. ECONOMIC AND ENVIRONMENTAL IMPACTS OF THERMAL INSULATION USED IN DIFFERENT DUCT SIZES. J. Therm. Eng. 2020, 6, 141–156. [Google Scholar] [CrossRef]
Figure 1.
Principle of rotational moulding, courtesy of The Queen’s University, Belfast [31].
Figure 1.
Principle of rotational moulding, courtesy of The Queen’s University, Belfast [31].

Figure 2.
Six -phases of rotational moulding [32].
Figure 2.
Six -phases of rotational moulding [32].
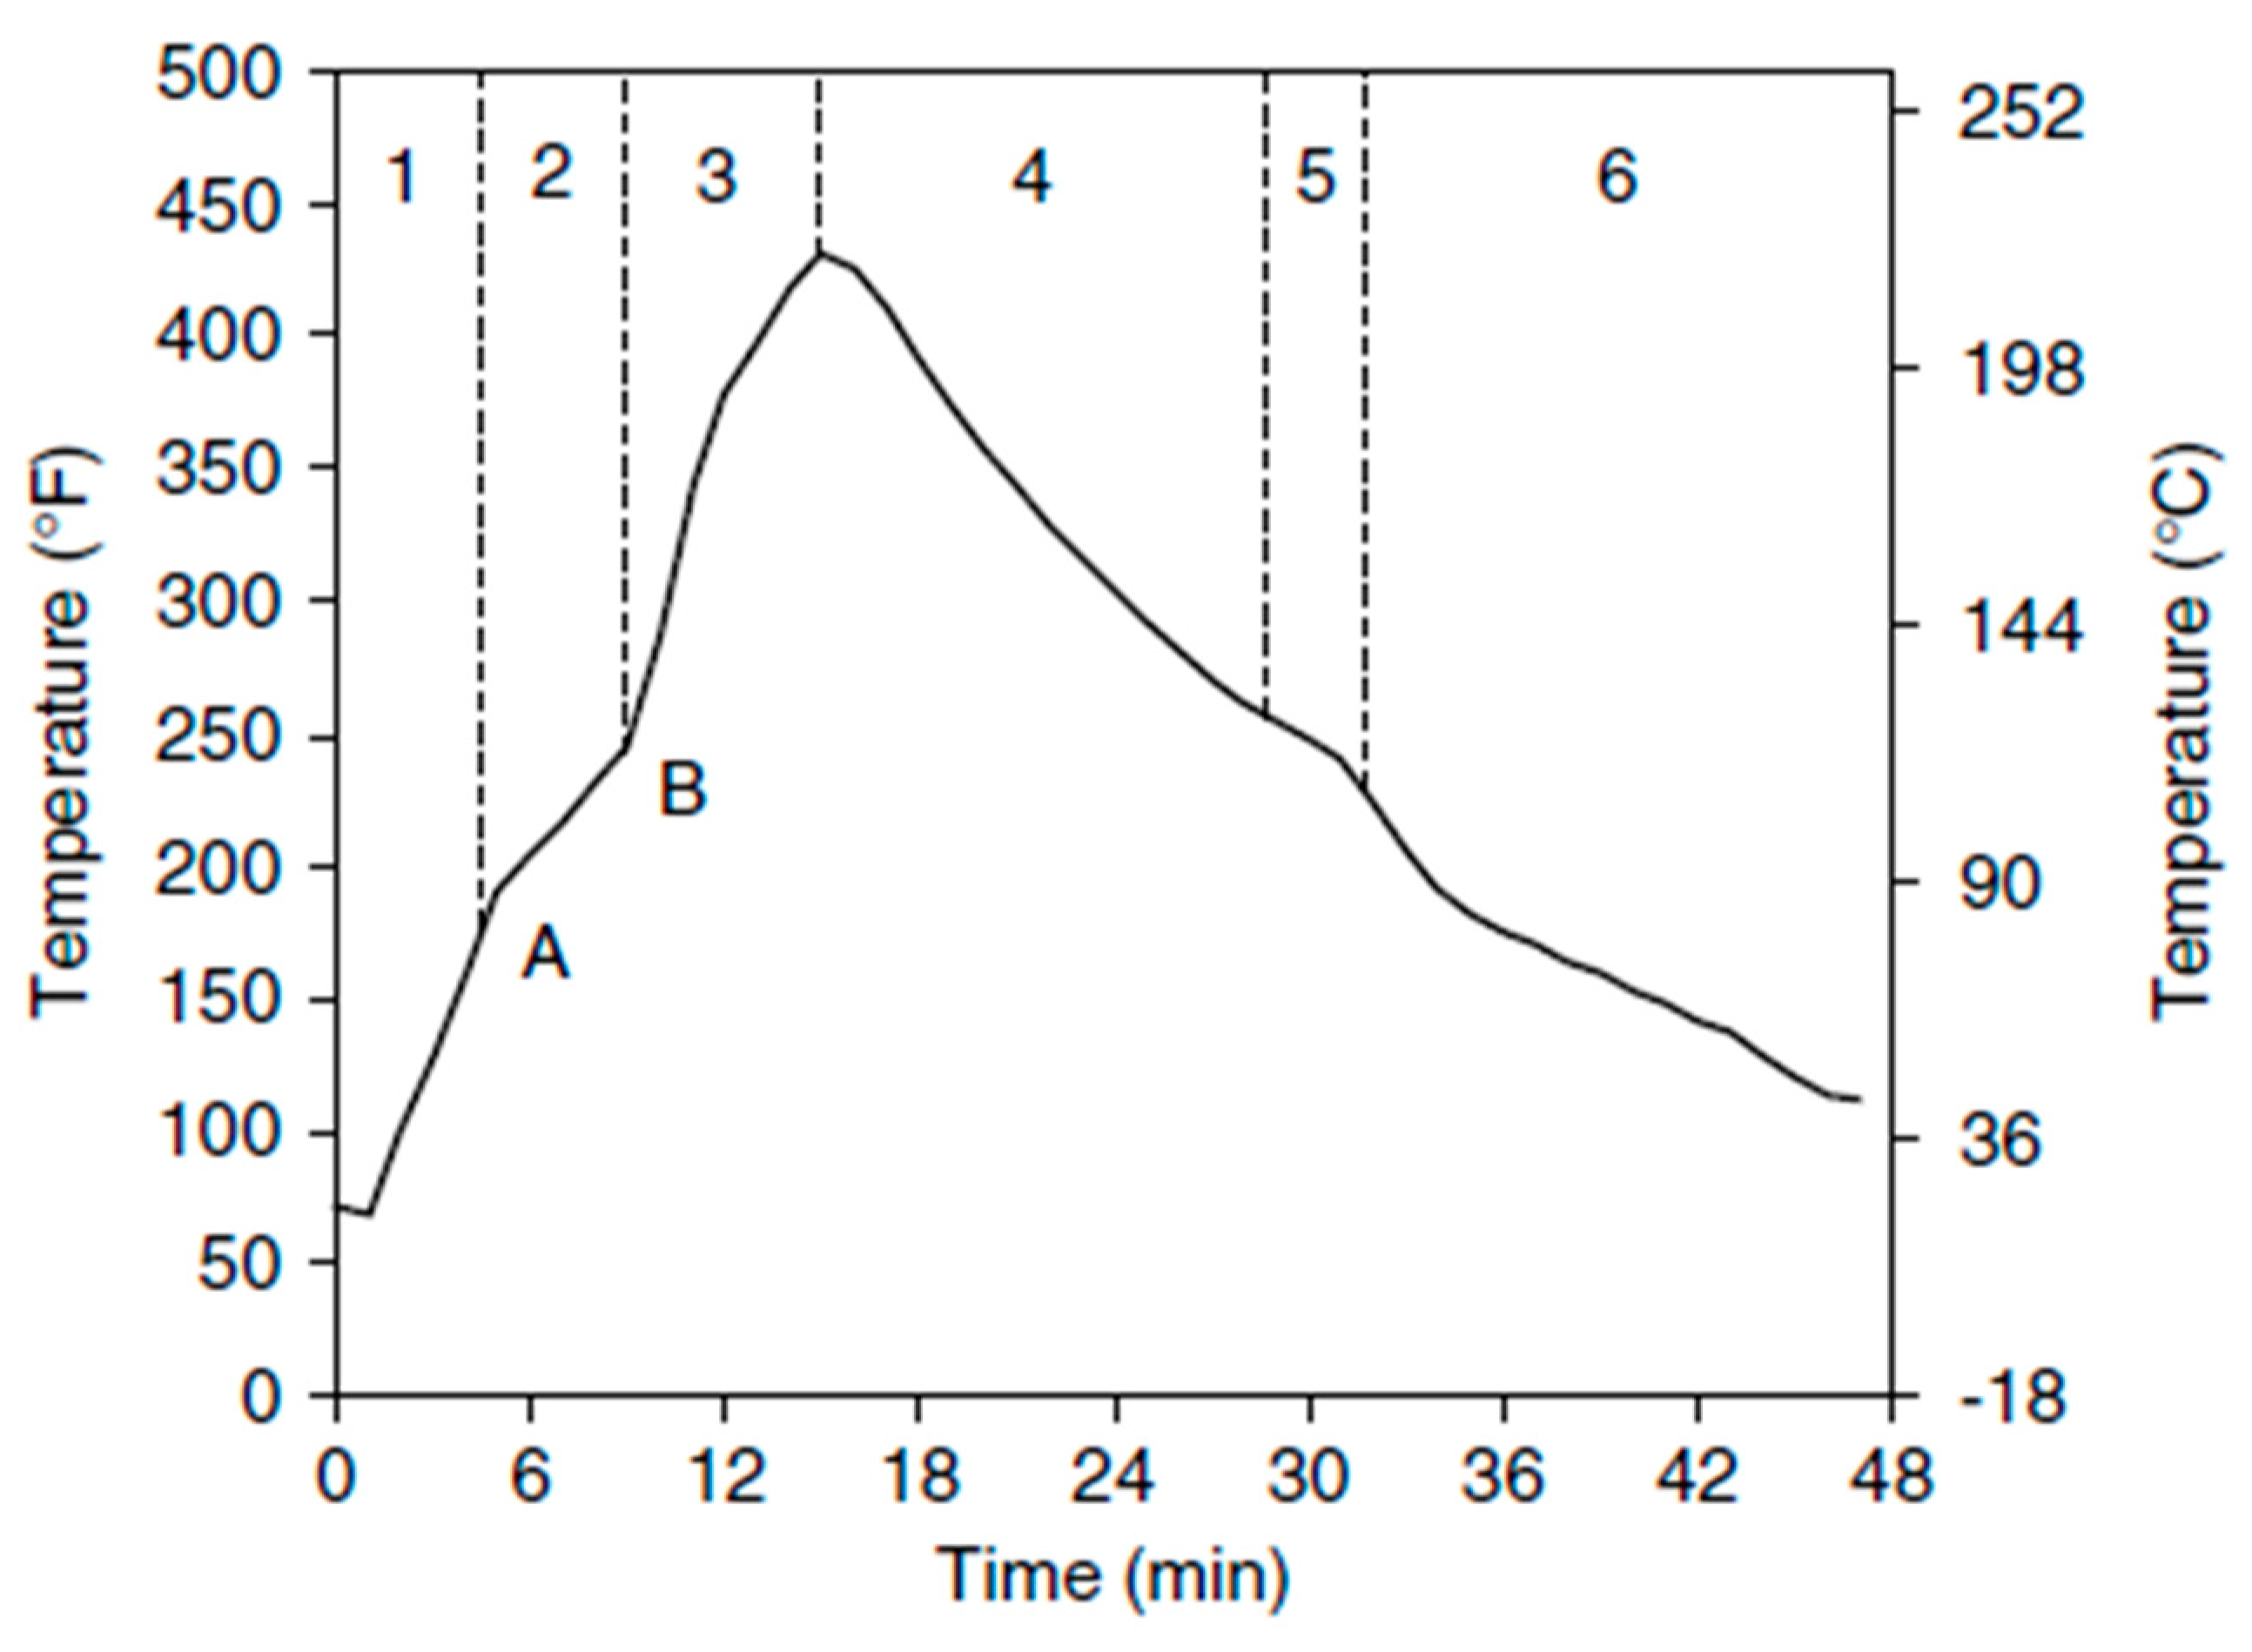
Figure 6.
The average air speed according to the flow directions and the overall average air speed between pins [43].
Figure 6.
The average air speed according to the flow directions and the overall average air speed between pins [43].
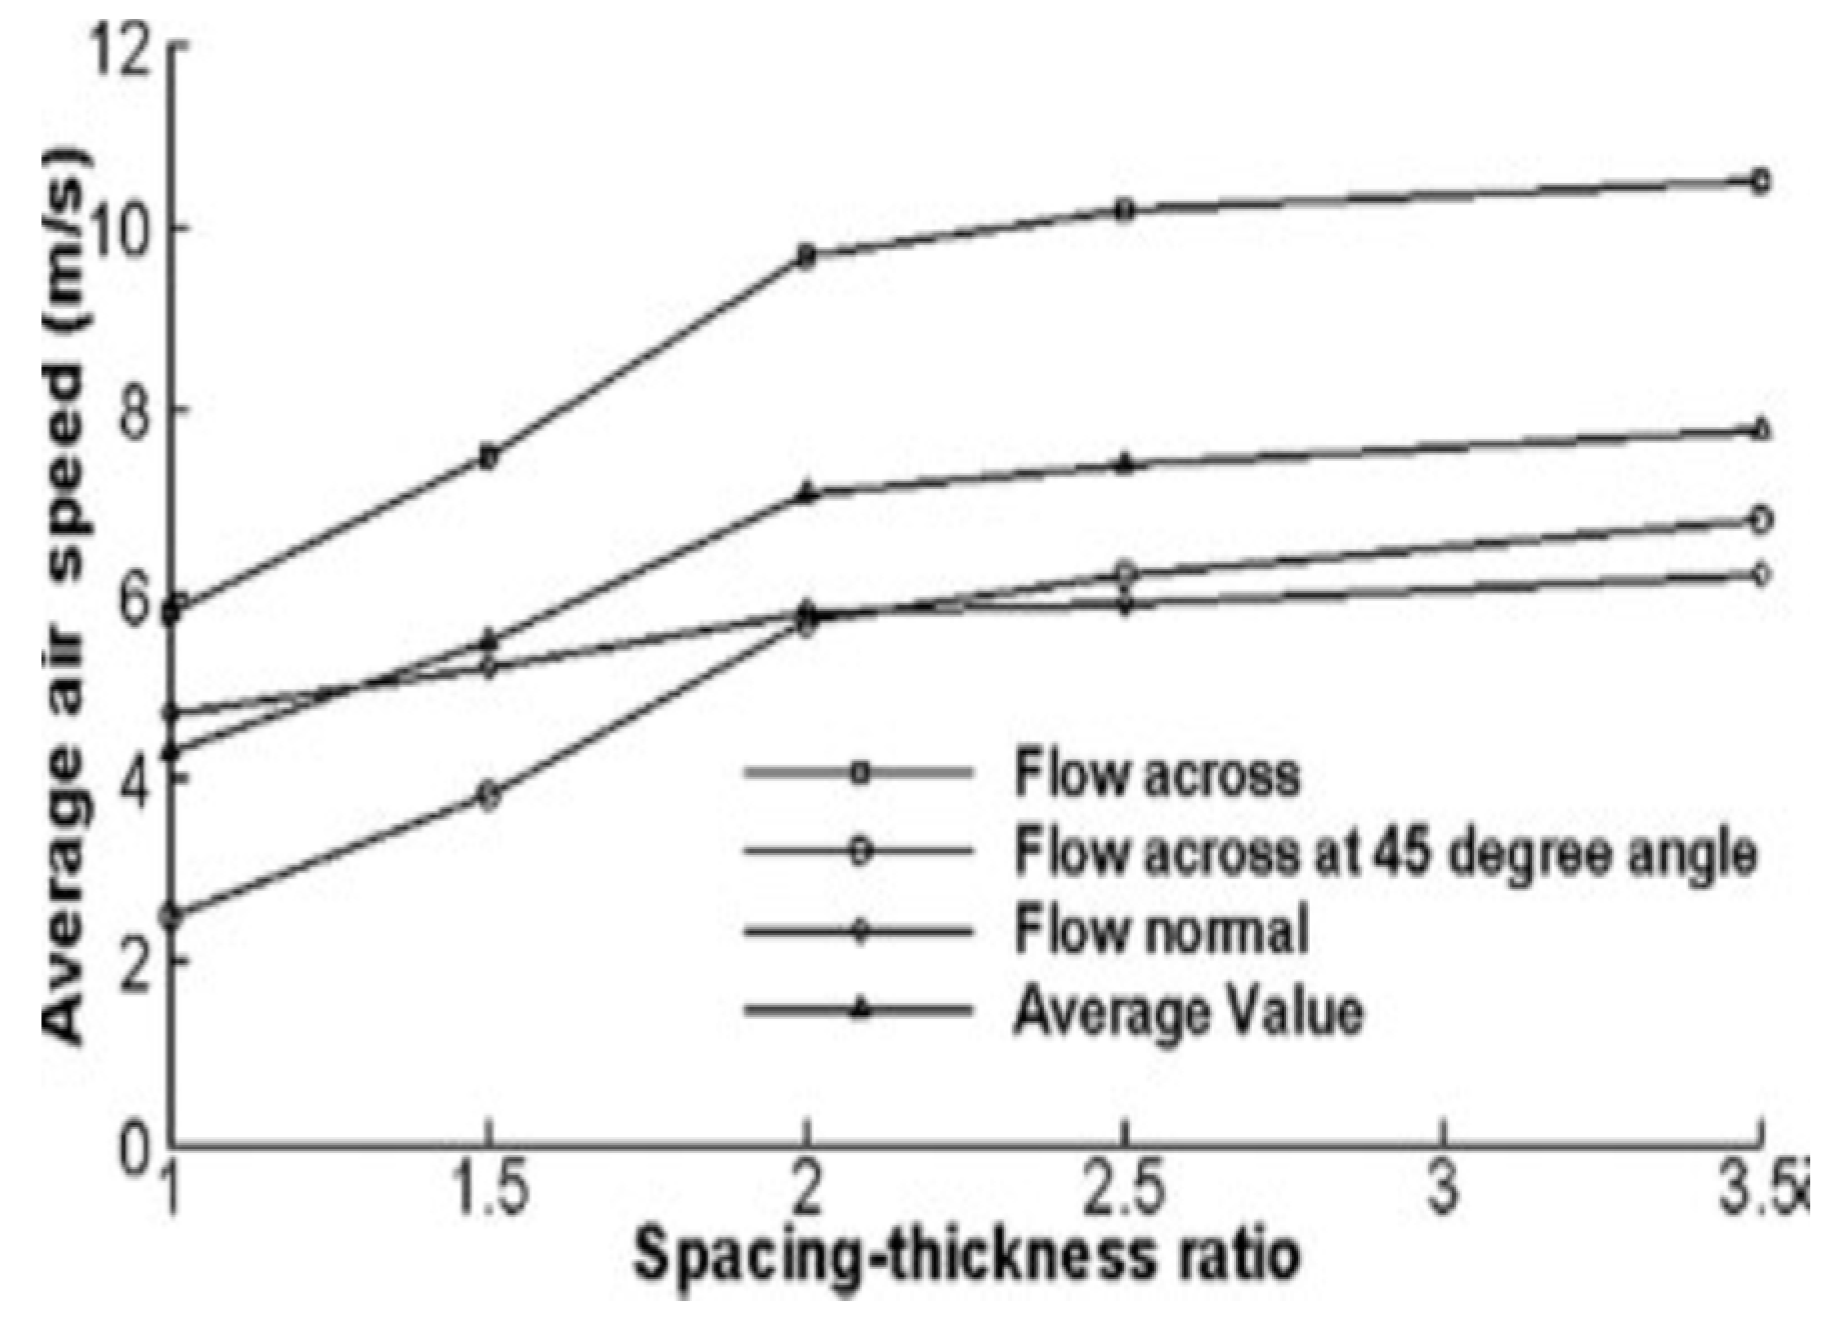
Figure 9.
Vertical section for the bend flow field: (a) with the S-shaped connection, D1/D2 = 5:1; (b) with the S-shaped connection, D1/D2 = 1:5; (c) with the U-shaped connection, D1/D2 = 5:1; and (d) with the U-shaped connection, D1/D2 = 1:5 [46] .
Figure 9.
Vertical section for the bend flow field: (a) with the S-shaped connection, D1/D2 = 5:1; (b) with the S-shaped connection, D1/D2 = 1:5; (c) with the U-shaped connection, D1/D2 = 5:1; and (d) with the U-shaped connection, D1/D2 = 1:5 [46] .
Figure 11.
Wind speed inside FADS tubes with two different opening configurations [52].
Figure 11.
Wind speed inside FADS tubes with two different opening configurations [52].
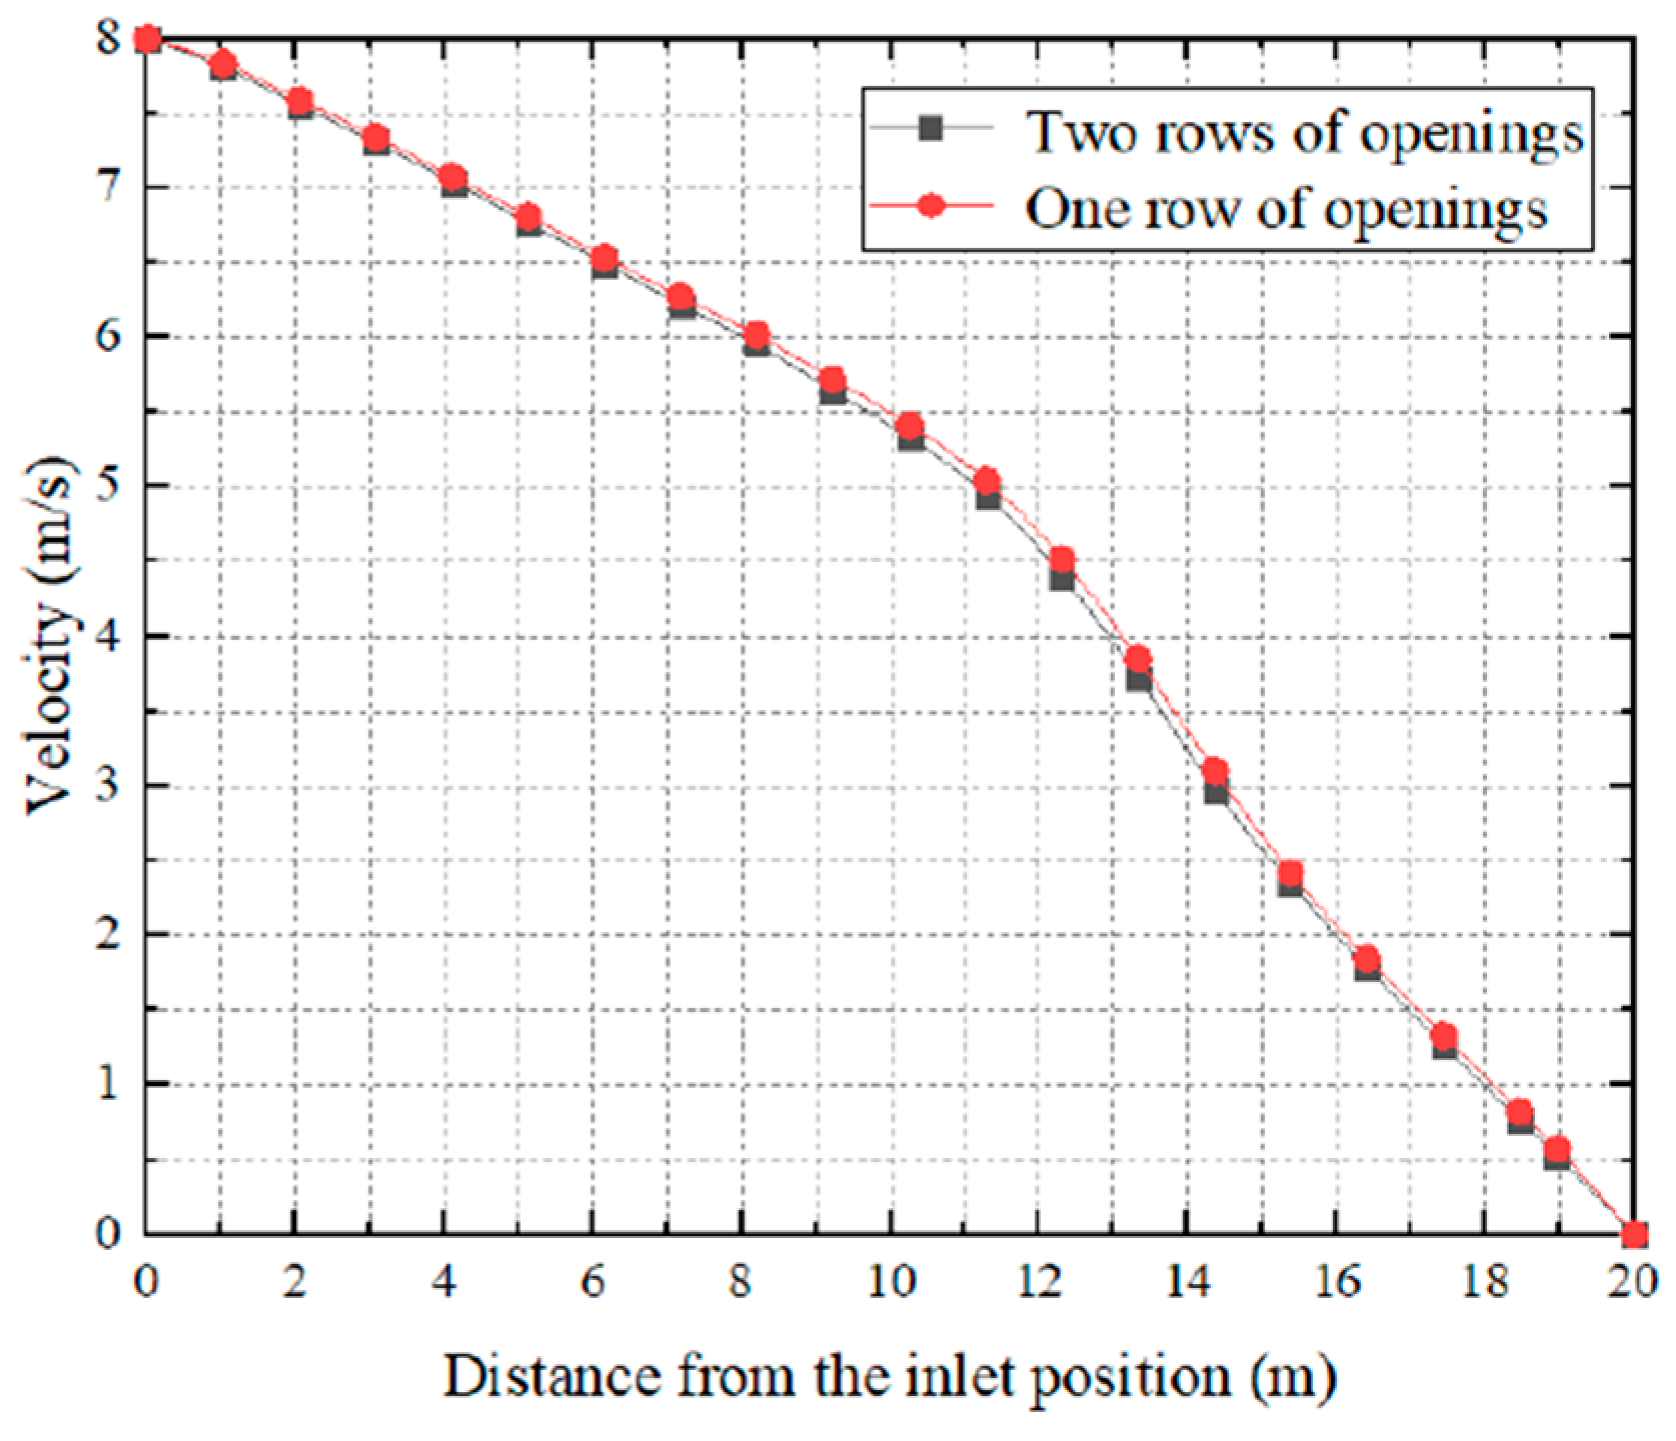
Figure 12.
Internal temperature of FADS with two different opening configurations. [52].
Figure 12.
Internal temperature of FADS with two different opening configurations. [52].
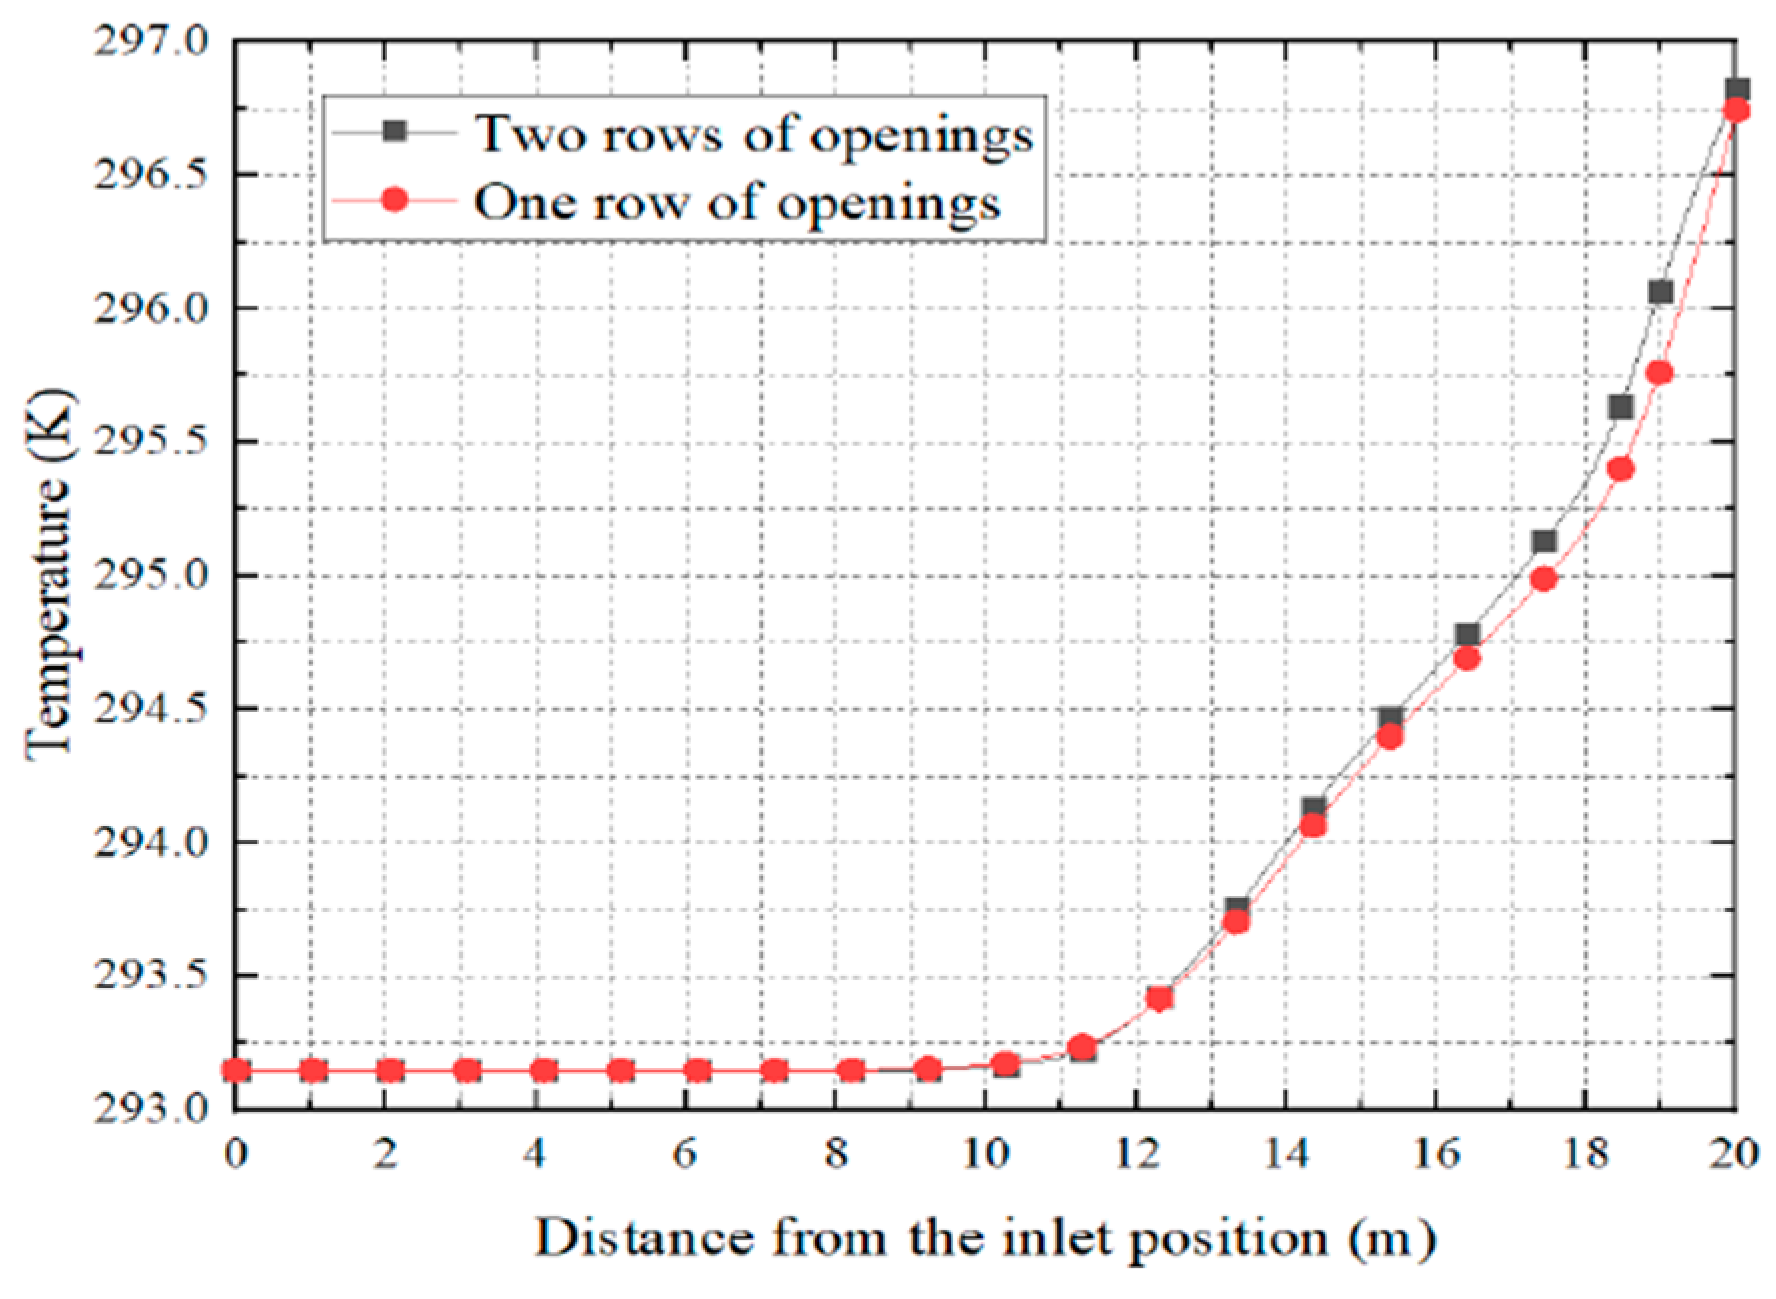
Figure 16.
Internal velocities for three different shapes of FADS [52].
Figure 16.
Internal velocities for three different shapes of FADS [52].
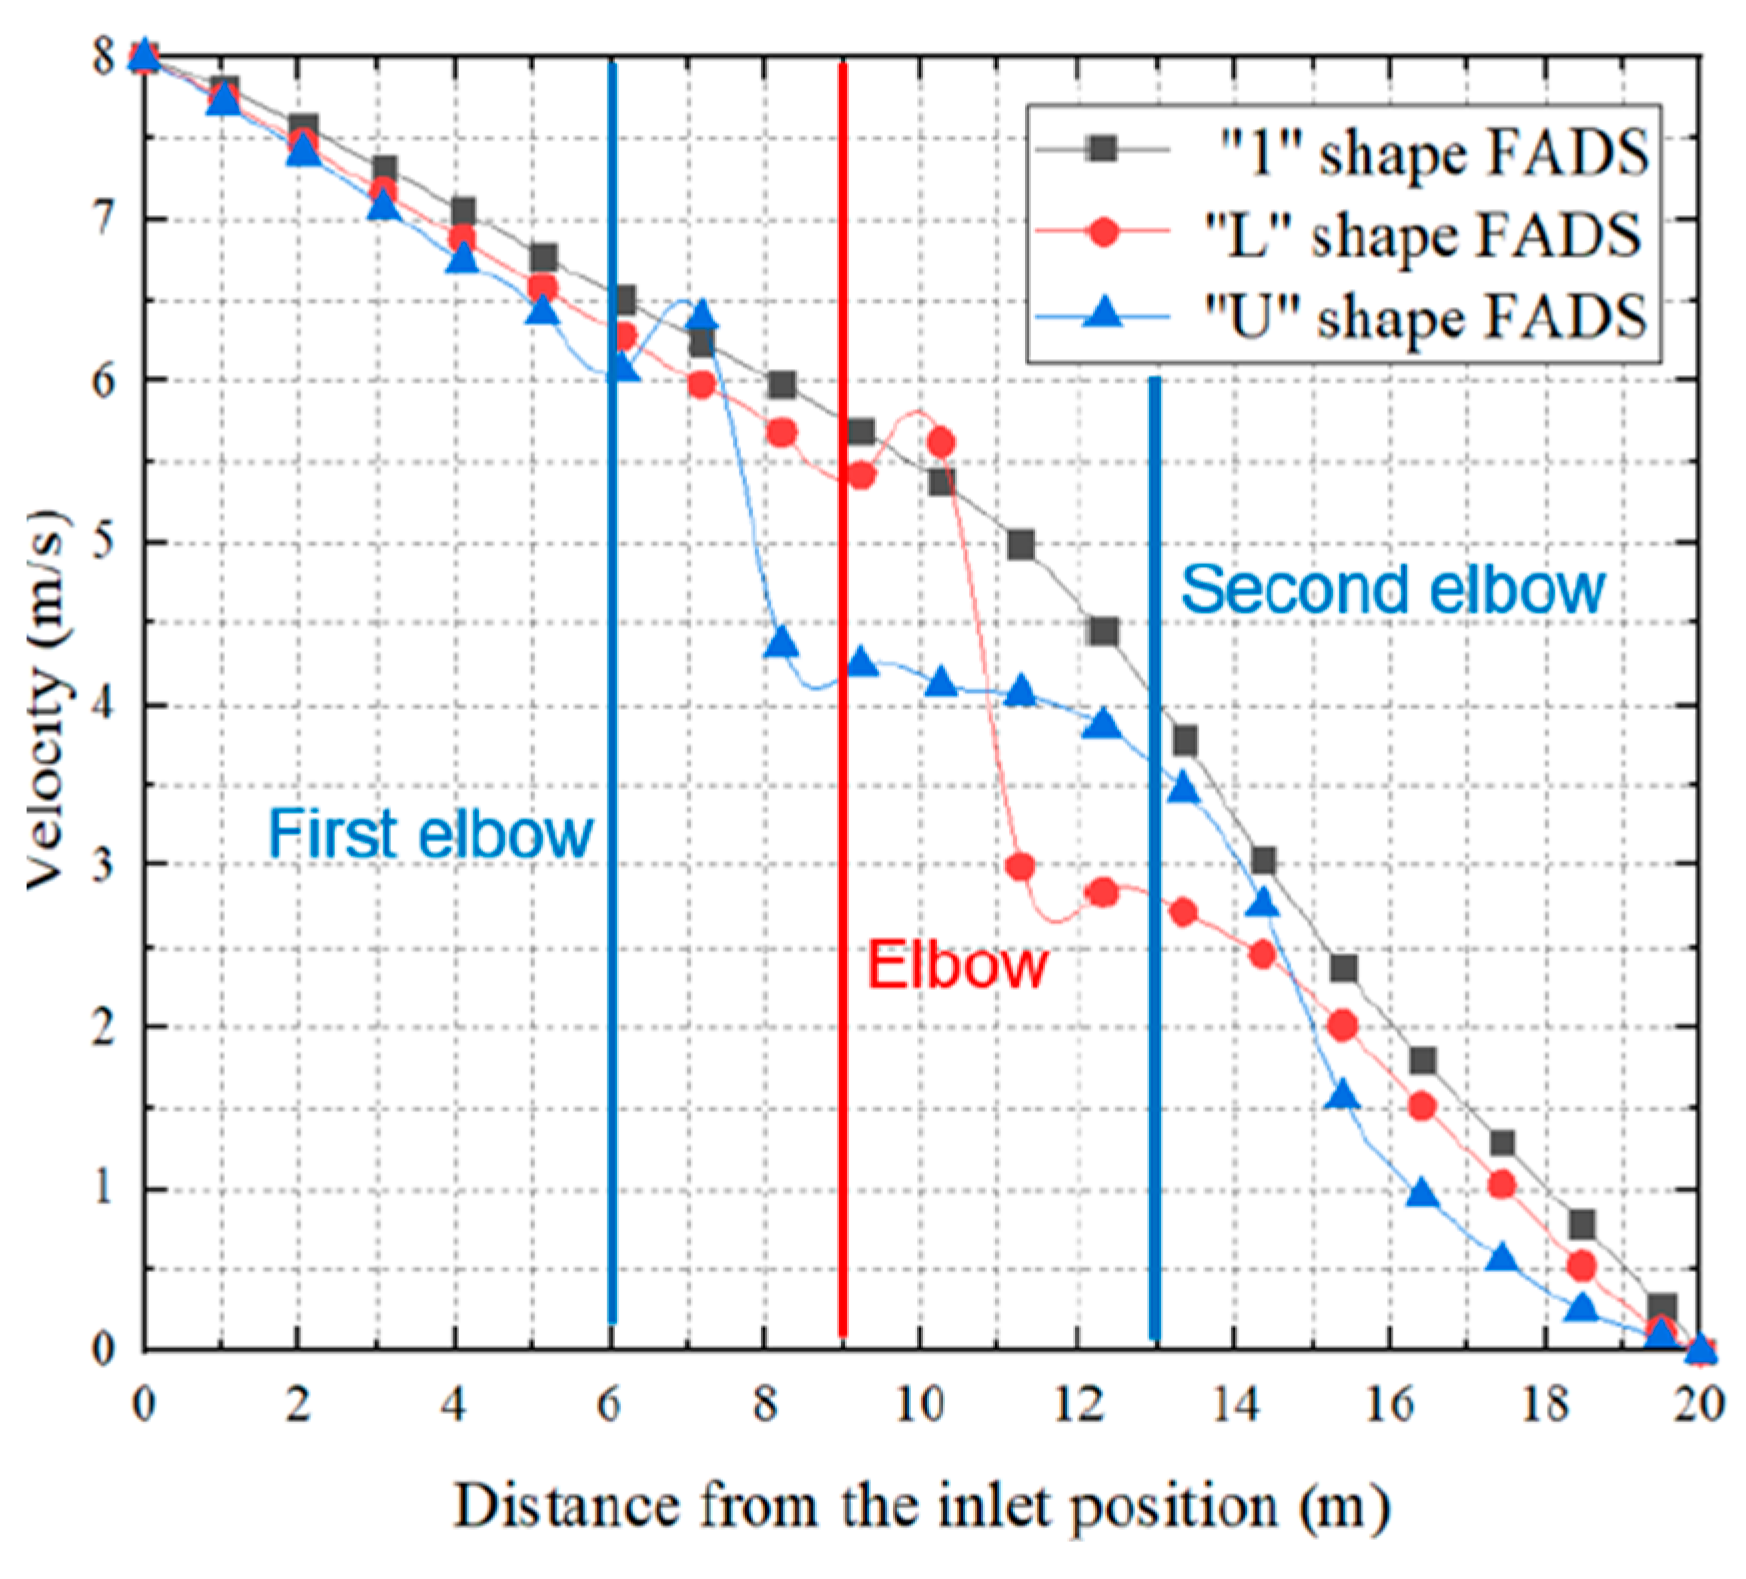
Figure 22.
Graph showing pressure drop across the duct. [56].
Figure 22.
Graph showing pressure drop across the duct. [56].
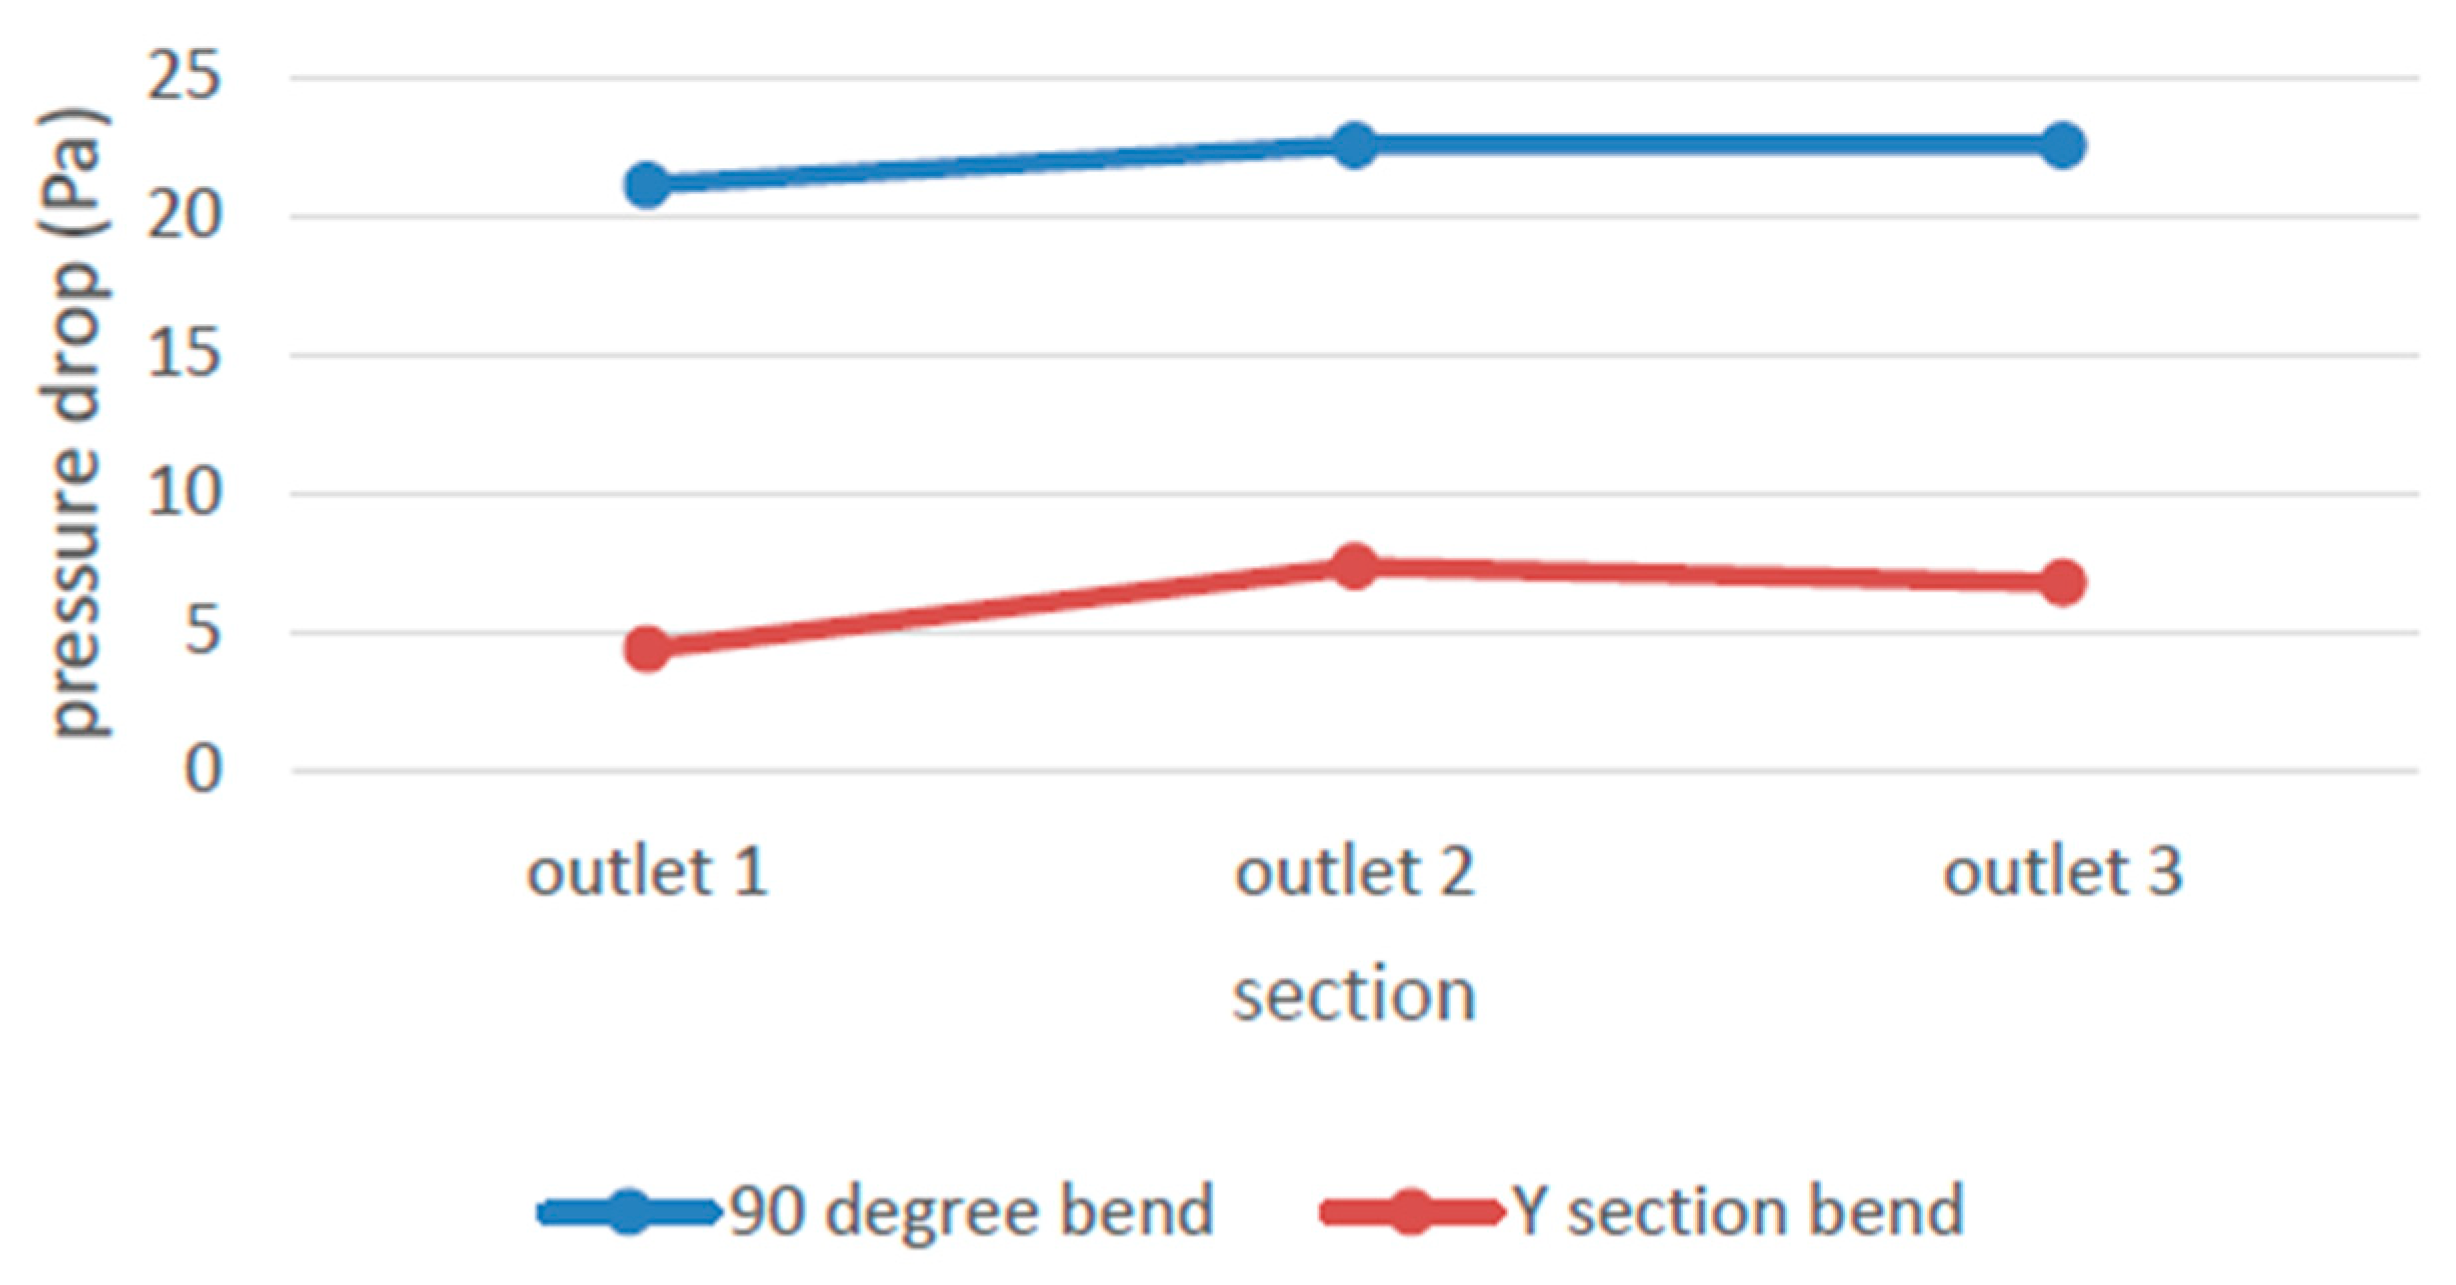
Figure 24.
Regular polygonal ducts.[61].
Figure 24.
Regular polygonal ducts.[61].
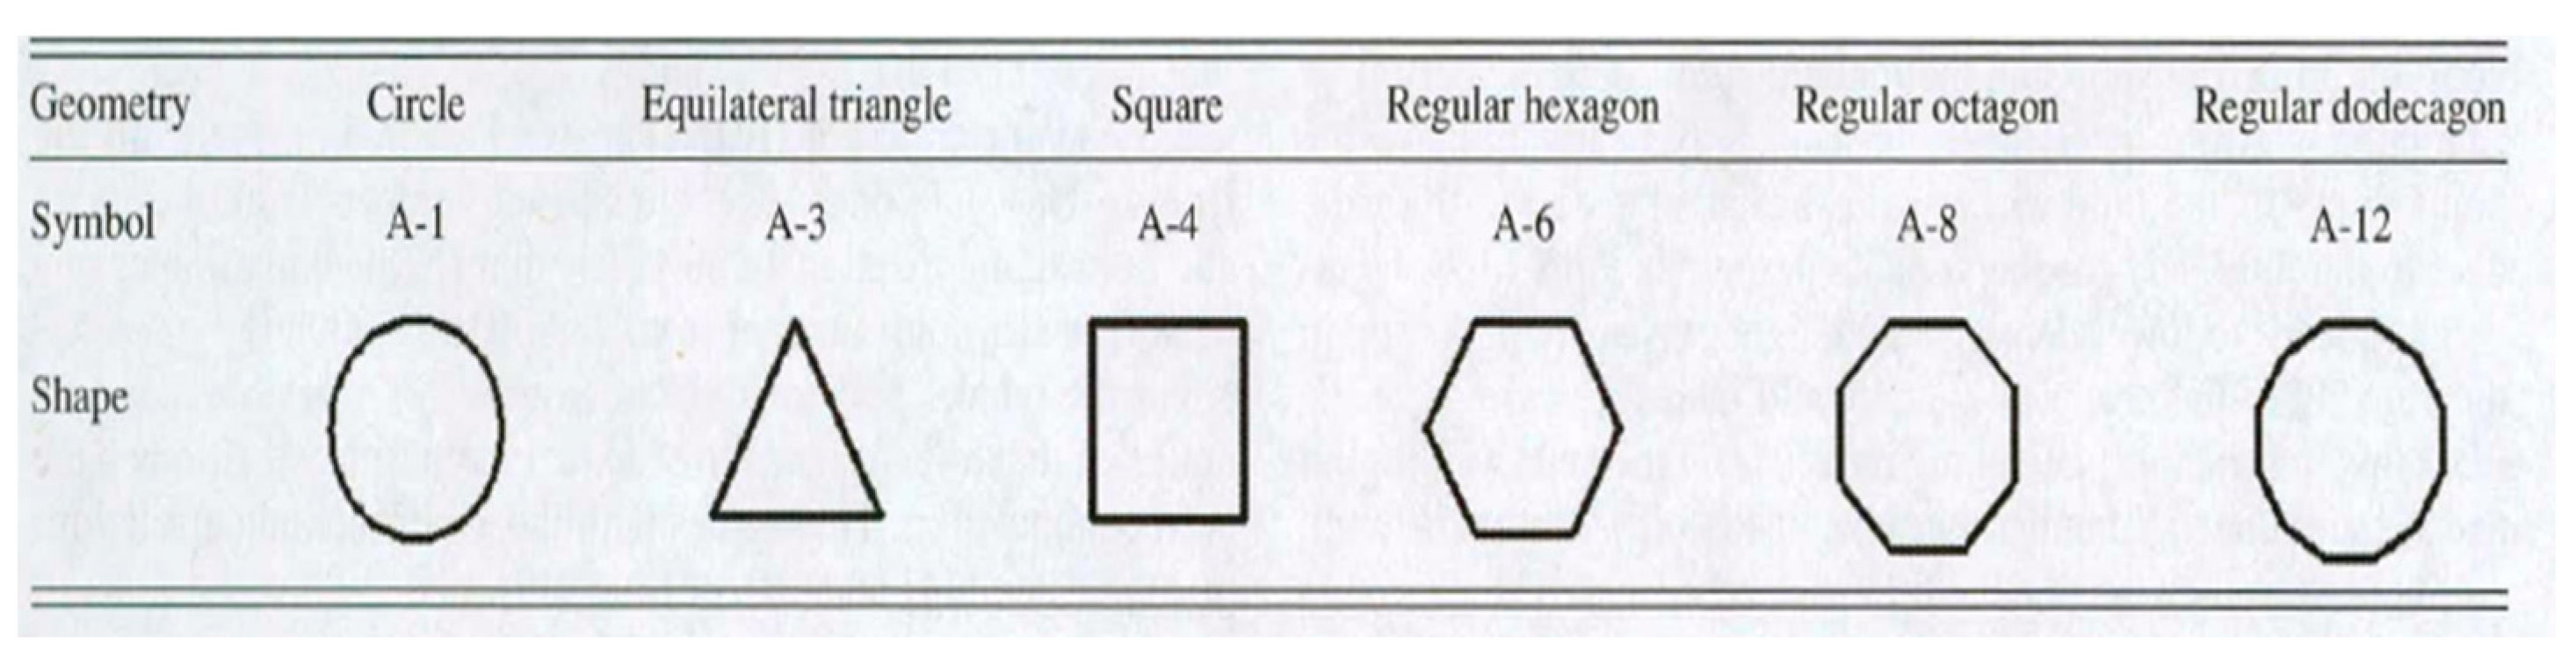
Figure 26.
Insulation thickness vs. emission [97].
Figure 26.
Insulation thickness vs. emission [97].
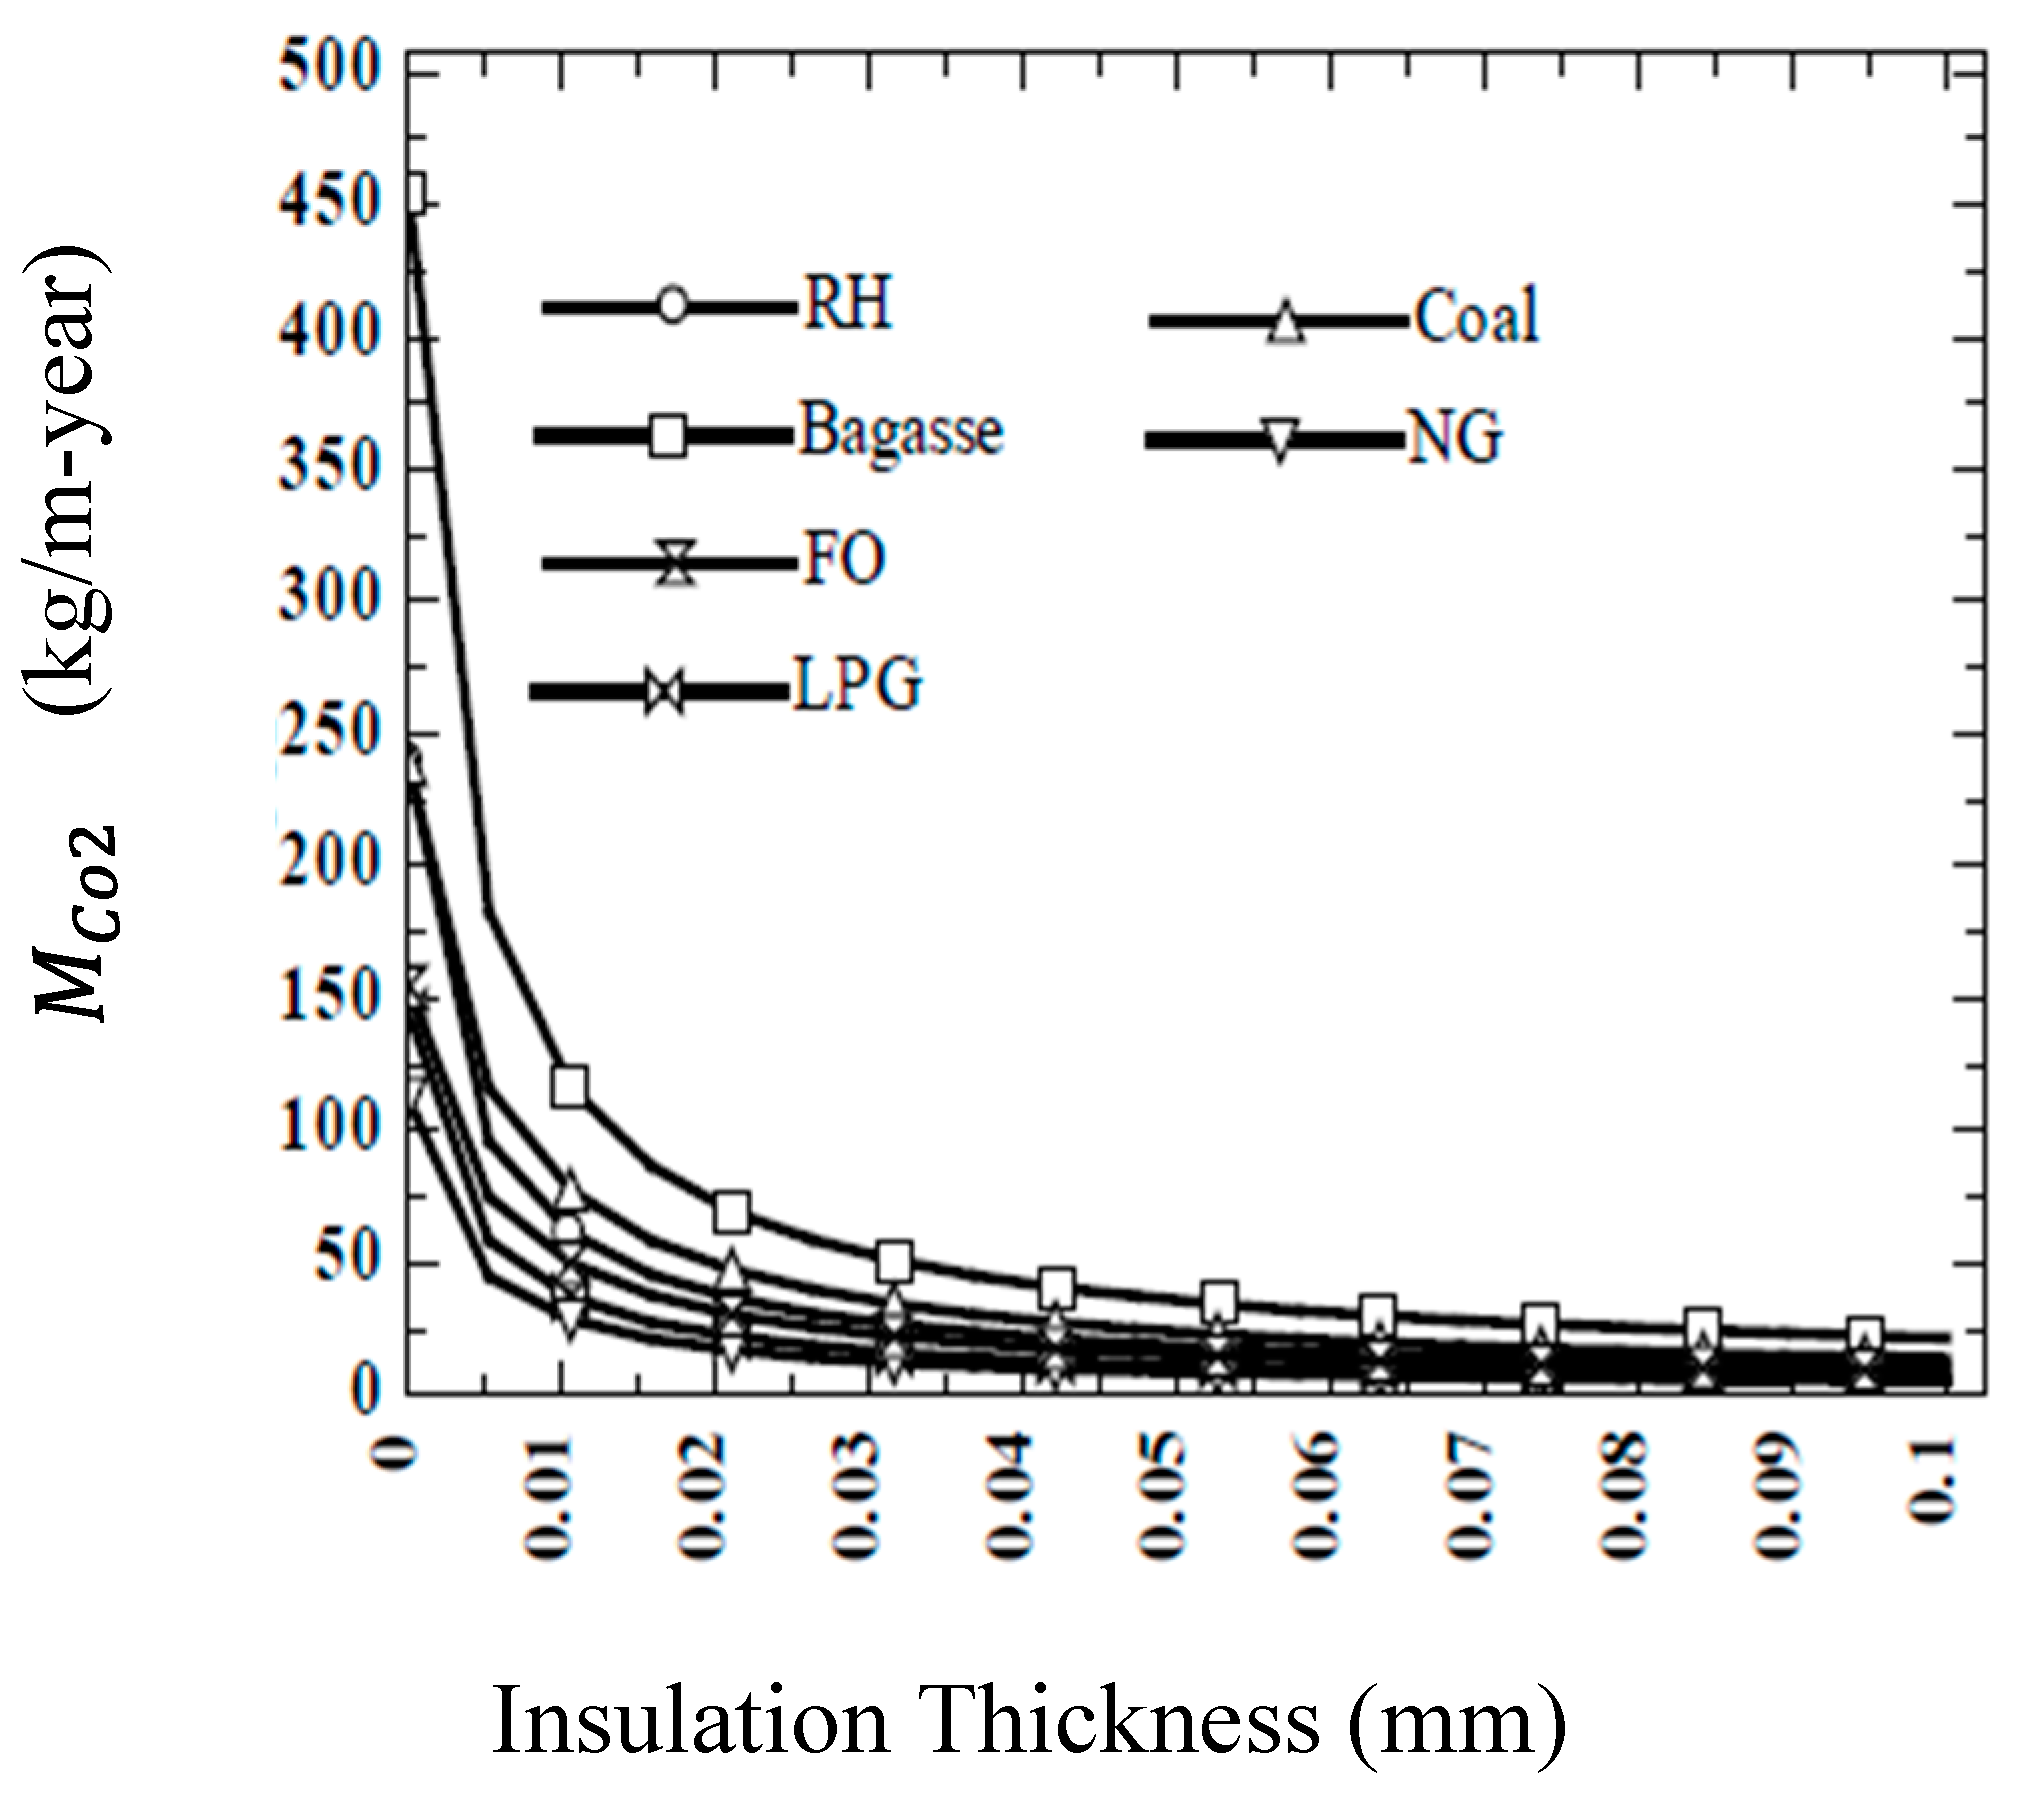
Table 2.
Average air speed values according to flow directions and the overall average air speed between the pins. [43] .
Table 2.
Average air speed values according to flow directions and the overall average air speed between the pins. [43] .
| Flow direction & Speed | Spacing to thickness ratio | ||||
|---|---|---|---|---|---|
| 1.00 | 1.50 | 2.00 | 2.50 | 3.50 | |
| Flow across a plate; Average speed ˉu (m/s) | 5.8 | 7.5 | 9.7 | 10.2 | 10.5 |
| Flow at 45° across a plate; Average speed ˉu (m/s) | 2.5 | 3.8 | 5.7 | 6.2 | 6.8 |
| Flow normal to a plate; Average speed ˉu (m/s) | 4.7 | 5.2 | 5.8 | 5.9 | 6.2 |
| Overall average speed; Average speed ˉu (m/s) | 4.3 | 5.5 | 7.1 | 7.4 | 7.8 |
Table 3.
Summary of the comparison between experimental and predicted cycle time.[44].
Table 3.
Summary of the comparison between experimental and predicted cycle time.[44].
| Mould type | % Cycle time reduction | ||||
|---|---|---|---|---|---|
| 3.2a | 6.0a | 3.2b | 6.0b | 9.0b | |
| Roughness enhanced mould (experimental) | 17 | 19 | 16 | 20 | 16 |
| Pin enhanced mould (experimental) | 32 | 28 | 26 | 25 | 28 |
| Roughness enhanced mould (prediction) | 21 | 21 | 21 | 21 | 20 |
| Pin enhanced mould (prediction) | 32 | 32 | 32 | 32 | 31 |
Table 4.
Value of average Nusselt number for different regular polygonal ducts which are obtained from numerical simulations. [61] .
Table 4.
Value of average Nusselt number for different regular polygonal ducts which are obtained from numerical simulations. [61] .
| Re | A-1 | A-3 | A-4 | A-6 | A-8 | A-12 | |
| Nu | |||||||
| 28,119 | 70.99 | 58.58 | 64.82 | 68.52 | 70.01 | 70.51 | |
| 33,576 | 81.35 | 65.86 | 74.18 | 78.05 | 79.53 | 81.05 | |
| 38,985 | 91.14 | 72.85 | 82.10 | 86.95 | 88.86 | 90.41 | |
| 46,085 | 103.22 | 81.78 | 93.00 | 99.29 | 101.60 | 102.19 | |
| 53,477 | 114.99 | 90.66 | 104.18 | 110.55 | 112.45 | 113.90 | |
| 62,507 | 128.37 | 100.91 | 117.16 | 123.36 | 125.55 | 126.96 | |
| 67,895 | 135.84 | 106.23 | 124.28 | 129.86 | 132.31 | 134.48 | |
| 71,468 | 140.52 | 110.33 | 128.76 | 134.06 | 137.01 | 139.26 | |
| 76,828 | 147.19 | 115.66 | 135.16 | 140.56 | 143.66 | 145.27 | |
Disclaimer/Publisher’s Note: The statements, opinions and data contained in all publications are solely those of the individual author(s) and contributor(s) and not of MDPI and/or the editor(s). MDPI and/or the editor(s) disclaim responsibility for any injury to people or property resulting from any ideas, methods, instructions or products referred to in the content. |
© 2024 by the authors. Licensee MDPI, Basel, Switzerland. This article is an open access article distributed under the terms and conditions of the Creative Commons Attribution (CC BY) license (http://creativecommons.org/licenses/by/4.0/).
Copyright: This open access article is published under a Creative Commons CC BY 4.0 license, which permit the free download, distribution, and reuse, provided that the author and preprint are cited in any reuse.


