
Submitted:
21 October 2024
Posted:
22 October 2024
You are already at the latest version
Abstract
Respiratory diseases are common in rabbits, but subclinical conditions can be challenging to diagnose and may cause respiratory problems during anesthesia. CT is the preferred method for diagnosing lung diseases, but anesthesia can alter lung volume and cause lung lobe collapse. In this study, seventeen healthy 5-month-old male New Zealand white rabbits underwent thoracic CT scans under different conditions. Rabbits were sedated with midazolam and butorphanol and scanned in a sphinx position they were then anesthetized with dexmedetomidine and ketamine and scanned again in sternal recumbency during spontaneous breathing. Lastly, apnea was induced using intermittent positive pressure ventilation (IPPV) for a final scan. Lung volume and density were measured using the 3D Slicer software, with thresholds set between -1050 and -100 Hounsfield Units (HU). Sedated animals had significantly higher total lung volume (69.39±10.04 cm³) than anesthetized (47.10±9.28 cm³) and anesthetized in apnea rabbits (48.60±7.40cm³). Mean lung attenuation during sedation was -611.26 HU (right) and -636.00 HU (left). After anesthesia induction, values increased to -552.75 HU (right) and -561.90 HU (left). Following apnea induction, attenuation slightly decreased to -569.40 HU (right) and -579.94 HU (left). The results indicate that sedation may be preferable for rabbit lung CT to minimize anesthesia-related changes.
Keywords:
rabbit
; computed tomography
; lung volume
; lung attenuation
; sedation
1. Introduction
Respiratory diseases are among the most common reasons for rabbits? admissions to veterinary practices. However, the unique anatomy and physiology of the rabbit respiratory system make accurate diagnosis challenging [1,2]. While thoracic radiography is the primary screening tool for lower respiratory tract diseases, it has limitations, particularly in identifying and characterizing lung lesions with precision[3,4].
Thoracic computed tomography (CT) is considered the gold standard for evaluating lung diseases in rabbits, offering superior sensitivity in detecting abnormalities in lung parenchyma[5,6]. Despite its advantages, the high cost and limited availability of CT equipment present significant barriers to its widespread use [5,6].
Although CT is regarded as the most reliable diagnostic method for rabbit lung disease, there is only one published study on normal tomographic images of rabbit lungs, in which some animals showed pathological changes [7]. The small size of rabbits necessitates proper positioning to achieve high-quality imaging, making sedation and/or anesthesia essential to ensure accurate results [2,3,6,8]. Unfortunately, respiratory diseases in rabbits are often subclinical, making them difficult to detect during routine examinations, and they frequently contribute to anesthesia-related complications [2,9].
General anesthesia, although recommended for immobilizing patients, can exacerbate imaging artifacts, particularly due to the more pronounced atelectasis observed in dependent lung regions [10]. Atelectasis has been shown to develop immediately after anesthesia induction [11]. In contrast, sedation minimizes anesthesia-related artifacts on thoracic CT images. Sedation protocols generally result in less muscle relaxation compared to anesthesia, leading to a lower risk of compression atelectasis [12]. Furthermore, animals breathing room air are less likely to develop diffusion atelectasis, which can occur due to the high oxygen fraction delivered during anesthesia [13]. However, prolonged sedation may lead to increased lung attenuation [14], and respiratory motion artifacts may become more pronounced [12].
The objective of this study was to investigate the effects of sedation and anesthesia on total lung volume and mean lung attenuation in healthy rabbits. We hypothesize that anesthesia leads to a reduction in lung volume and an increase in lung attenuation, potentially impairing the accuracy of lung CT evaluations.
2. Materials and Methods
2.1. Study Design and Subject Inclusion
A prospective study was designed to complement the use of animals involved in a separate study focused on CT imaging of hip joints. All procedures complied with European and national legislation concerning the protection of animals used for scientific purposes (European Directive 2010/63/EU and National Decree-Law 113/2013) and were approved by the relevant Portuguese authority, the Directorate-General for Food and Veterinary (DGAV_0421/000/000/2022). Seventeen healthy, male, five-month-old New Zealand White rabbits were used in this study. The sample size was based on a statistical significance level of 0.05, a large effect size of 1.0, and a power of 0.80 using a t-test table, which resulted in a minimum sample of 17 observations [15].
The rabbits were housed individually in cages measuring 80 cm x 55 cm x 55 cm, each with an elevated platform inside. The housing area was a ventilated room with a temperature maintained between 19–21°C and relative humidity levels of 50–60%. The animals were kept under a 12-hour light/dark cycle with controlled artificial lighting. They were fed a standard pellet diet and had free access to water, with no fasting protocols applied. On the day of the CT exams, each rabbit underwent a comprehensive physical exam to rule out any signs of respiratory disease and included the recording of body weights.
2.2. Sedation and Anesthesia Protocols and Computed Tomography Image Acquisition
The rabbits were sedated with butorphanol (Butomidor®, Richter Pharma AG, Austria, at 0.4 mg/kg, IM) and midazolam (Dormazolan®, Le Vet Beheer B.V., Netherlands, at 0.5 mg/kg, IM). All scans were acquired in a cranial-to-caudal direction using a lung algorithm, with a tube voltage of 100 kVp, a tube current of 80 mA, a slice thickness of 1.25 mm, a rotation time of 0.98 seconds, and a pitch of 1.38, performed on a 16-slice scanner (Revolution™ ACT, General Electric Medical Systems, United Kingdom).
For a 10-minute period, the rabbits were acclimated to a padded cardboard box secured on the CT bed. During this time, their body positions were checked to ensure they remained in the prone position before conducting the first CT scan.
The second CT scan was performed under general anesthesia with the rabbits breathing spontaneously. Anesthesia was induced using ketamine (Ketamidor®, Richter Pharma AG, Austria, at a dose of 20 mg/kg, intramuscularly) and dexmedetomidine (Sedadex®, Le Vet Beheer B.V., Netherlands, at a dose of 50 μg/kg, intramuscularly). The animals were placed in sternal recumbency, and following induction, tracheal intubation was achieved using a 3 mm cuffed endotracheal tube. Anesthesia was maintained with 1.5% isoflurane (IsoFlo100%®, Zoetis, Portugal) delivered in 100% oxygen at a flow rate of 2 L/minute. Throughout the procedure, the rabbits remained in sternal recumbency with their forelimbs extended forward, head positioned between them, and hindlimbs flexed in a natural resting posture. For the final CT scan, apnea was induced through positive pressure ventilation, after which the scan was promptly acquired.
All scans were acquired in a cranial-to-caudal direction using a lung algorithm, with a tube voltage of 100 kVp, a tube current of 80 mAs, a slice thickness of 1.25 mm, a rotation time of 0.98 seconds, and a pitch of 1.38, performed on a 16-slice scanner (Revolution™ ACT, General Electric Medical Systems, United Kingdom).
2.3. Image Analysis and Segmentation
Image evaluation, measurements, and computer-generated segmentations for all scans were made by a veterinarian with more than 10 years of diagnostic imaging experience in exotic animals (RS) under the supervision of MG. The images were evaluated using a lung window setting (WL: −500, WW: 1400).
This study used 3D Slicer[16], a free open-source medical software for visualization, processing, segmentation and image analysis of all acquired scans. The workstation used for this analysis was an HP Envy x360, equipped with an 11th Gen Intel® Core ™ i7-1195G7 @ 2.9GHz processor, a 512 GB SSD, 16 GB of RAM, and an Intel IRISxe graphics card.
Each scan was imported into the software, where masking techniques were applied using specific Hounsfield unit (HU) thresholds to differentiate anatomical structures and delineate tissue boundaries. The following threshold limits were applied: 350 HU to −100 HU for identifying the thoracic wall, abdominal soft tissues, mediastinal structures, and pulmonary vasculature; −1050 HU to −900 HU for the trachea and primary to tertiary bronchi; and −899 HU to −101 HU for the pulmonary parenchyma[12,17].
A semi-automated approach was utilized with the Lung CT Segmenter extension, as the AI-powered segmentation was unable to accurately define the boundaries of the pulmonary parenchyma. The volume was uploaded into LungCTAnalyzer, which used the previous segmentation to segment the lungs into different categories: emphysema (−1,050 to −900 HU), normal lung tissue (−899 to −500 HU), infiltrated lung/ground-glass opacity (GGO) (−499 to −101 HU), collapsed lung and vessels (-100 to 1000 HU)[12,18] (Figure 1). The software automatically calculated the volume and mean attenuation for each lung and for each defined threshold, generating a table with all the values. The volume of each segmented region was quantified in cubic millimeters (mm³) and attenuation in HU. Segmentation was performed for both lungs, including individual lobes, as well as subdividing the lungs into upper and lower halves, and dorsal and ventral regions. To facilitate this, the centroid of each lung was calculated, allowing for the creation of quadrants to separate the dorsal from the ventral regions, and vice versa. A similar methodology was applied to distinguish the upper and lower sections of the lungs. All measurements were repeated by the same operator (RS), within a month to calculate repeatability.
2.4. Statistical Analysis
The data collected was recorded using Microsoft Excel for Windows. Statistical analyses were conducted using IBM SPSS Statistics, Version 30.0.0.0 (171). The variables used for the analysis included lung volume (cm³), pulmonary index (PI; cm³/kg), and lung attenuation (HU). The pulmonary index was calculated by dividing the lung volume by the animal’s body weight in kilograms. Descriptive statistics were applied to each variable, which included calculating the mean, standard deviation, and range.
Linear regression was used to assess the relationship between body weight and total lung volume. To evaluate repeatability between repeated measurements generated by 3D Slicer for lung volume and lung attenuation (Session 1 and 2) and the reproducibility between Sessions 1 measurements from CT data acquired under sedation, anesthesia, and apnea, the paired t-test and the Intraclass Correlation Coefficient (ICC) were used.
3. Results
3.1. Study Population
A total of 17 male, 5-month-old New Zealand White rabbits were included in this study, each with a body condition score of 5/9. The body weight ranged from 3.202 to 4.432 kg, with a mean weight of 3.895 ± 0.305 kg (Table X). A statistically significant positive regression coefficient between body weight and total lung volume was found in sedated animals (p = 0.0027, R² = 0.46). However, no significant correlation was observed in anesthetized animals during spontaneous breathing or after apnea induction. The pulmonary index (PI) or mean total lung volume per kilogram of body weight, was 17.79 ± 1.93 cm³/kg for sedated animals.
3.2. Lung Volume and Attenuation
Under sedation, the mean total lung volume during Session 1 was 69.39 ± 10.04 cm³, with right and left lung mean volumes of 38.82 ± 5.11 cm³ and 30.57 ± 5.54 cm³, respectively. In Session 2, the mean total lung volume was 69.68 ± 9.89 cm³, with right and left lung mean volumes of 38.82 ± 4.95 cm³ and 30.97 ± 5.82 cm³, respectively. There were no statistically significant differences between sessions (P > 0.05, paired t-test). The ICC demonstrated strong agreement > 0.97 (P<0.05) (Table 1).
Anesthesia resulted in a significant reduction in lung volume. During Session 1, the mean total lung volume was 47.10 ± 9.28 cm³, with the right lung mean volume of 27.82 ± 5.40 cm³ and the left lung with 19.28 ± 4.41 cm³. In Session 2, the mean total lung volume was 47.29 ± 9.60 cm³, with individual mean lung volumes of 27.70 ± 5.62 cm³ for the right lung and 19.58 ± 4.56 cm³ for the left lung, showing no statistically significant differences (P > 0.05, paired t-test). The ICC demonstrated strong agreement > 0.97 (P<0.05) (Table 2).
During apnea, the mean total lung volume in Session 1 was 48.60 ± 7.40 cm³, with right and left lung mean volumes measuring 28.26 ± 3.88 cm³ and 20.34 ± 4.36 cm³, respectively. In Session 2, the mean total lung volume was 48.35 ± 7.81 cm³, with the right lung mean volume measuring 28.22 ± 4.56 cm³ and the left lung mean volume measuring 20.13 ± 4.11 cm³. There were no statistically significant differences between the two sessions (P > 0.05, paired t-test) The ICC demonstrated strong agreement > 0.91 (P < 0.05) (Table 3).
The repeatability of attenuation measurements was assessed across the two sessions. In Session 1, the mean attenuation for the aerated region of the right lung (ranging from -899 to -500 HU) was -675.08 ± 18.23 HU, while the left lung showed a mean attenuation of -690.03 ± 14.19 HU in sedated animals. In Session 2, the values were -675.21 ± 18.36 HU for the right lung and -689.96 ± 13.96 HU for the left lung. There were no statistically significant differences between the two sessions (P > 0.05, paired t-test). The ICC demonstrated strong agreement > 0.99 (P<0.05) (Table 1).
During anesthesia in Session 1, the mean attenuation for the aerated area of the right lung was measured at -633.47 ± 36.15 HU, and for the left lung, it was -632.24 ± 38.75 HU. In Session 2, the mean attenuation values were -632.73 ± 38.75 HU for the right lung and -631.20 ± 39.63 HU for the left lung, with no significant differences observed between the sessions (P > 0.05, paired t-test). The ICC demonstrated strong agreement > 0.99 (P<0.05) (Table 2).
Following the induction of apnea in Session 1, the mean attenuation for the aerated right lung was -627.23 ± 33.98 HU, while for the left lung, it was -632.77 ± 38.28 HU. In Session 2, the mean values were similar, with -627.05 ± 33.97 HU for the right lung and -632.23 ± 38.59 HU for the left lung. Again, no statistically significant differences were found between sessions (P > 0.05, paired t-test). The ICC demonstrated strong agreement > 0.99 (P<0.05) (Table 3).
For the reproducibility analysis, data based on Session 1, the paired t-test indicated highly statistically significant differences in total lung volumes, as well as in right and left lung volumes, when comparing rabbits under sedation with those under anesthesia during spontaneous breathing and after apnea induction (p < 0.001)(Table 1, Table 2 and Table 3). However, no significant differences were observed in total lung volume (p = 0.326), right lung volume (p = 0.672), or left lung volume (p = 0.105) when comparing measurements taken under anesthesia with those taken after apnea induction (Table 2 and Table 3).
The evaluation of inflated lung volumes in the dorsal and ventral regions was performed using regional segmentation data (-899 to -500 HU). Descriptive statistics were applied, and the results are summarized in Table 4. As anticipated, the dependent regions (ventral part) of the lungs showed a greater reduction in volumes after anesthesia. In the ventral regions, the mean reduction in lung volume was 50.26% for the left lung and 48.97% for the right lung. The dorsal regions also exhibited a notable reduction, with inflated volumes decreasing by 35.91% for the left lung and 34.25% for the right lung.
The mean lung attenuation during sedation was measured as -611.26 ± 35.01 HU for the right lung and -636.00 ± 30.67 HU for the left lung. Following anesthesia induction, the mean lung attenuation increased to -552.75 ± 47.76 HU and -561.90 ± 53.41 HU, respectively. After inducing apnea, there was a slight decrease in lung attenuation, with the mean values being -569.40 ± 37.78 HU for the right lung and -579.94 ± 34.21 HU for the left lung.
A paired t-test revealed a statistically significant difference in lung attenuation between the right and left lungs during sedation (p = 0.003). However, no statistically significant difference was found between the lungs during the spontaneous breathing period under anesthesia. The difference became significant again during apnea (p = 0.032).
A highly statistical difference was found in paired t-test between the mean attenuation values registered during sedation, after anesthesia induction and following apnea, for the right (p = 0.005 and p<0.001 respectively) and the left lung (p<0.001). No statistical difference was found for mean attenuation values for the right and left lungs between anesthesia with spontaneous breathing and apnea.
Concerning aerated areas, the results showed highly significant differences in the attenuation values for both lungs in sedated animals compared to those during spontaneous breathing under anesthesia (p < 0.0001) and during induced apnea (p < 0.0001) (Table 1). No statistically significant differences were observed in attenuation values between spontaneous breathing under anesthesia and induced apnea for either lung.
For poorly aerated lung tissue (-499 to -101 HU), the mean lung attenuation for the right lung was -338.13 ± 8.18 HU in sedated animals, -335.65 ± 14.87 HU during spontaneous breathing under anesthesia, and -340.38 ± 12.67 HU during induced apnea. For the left lung, the mean attenuation values were -340.626 ± 9.50 HU, -335.48 ± 18.12 HU, and -341.41 ± 17.00 HU for sedated, spontaneous breathing, and apnea conditions, respectively. No statistically significant differences were observed in a paired t-test between the values obtained in the other three groups, for poorly aerated lungs
4. Discussion
This study aimed to identify the impact of sedation and anesthesia on lung volume and attenuation, in CT scans. Both our initial research hypothesizes were statistically confirmed, the results show that anesthesia impact lung volume and attenuation resulting in a marked decrease in total lung volume and an increase in attenuation, that is similar in both lungs and potentially impairs the accuracy of lung CT evaluations. These findings are in line with studies in other species like dogs [19] and children [20].
Lung volume was calculated by means of threshold masking to select lung parenchyma in detriment of nearby tissues [12,17,21]. An Intraclass Correlation Coefficient (ICC) ranging from 0.957 to 0.999 for repeatability, with the lower limits of the 95% confidence intervals (CI) being ≥ 0.85, indicates a strong level of agreement between the two measurement sessions. These high ICC values demonstrate that the measurements can be considered highly repeatable, reflecting consistent performance across repeated tests [22].
The Pulmonary Index obtained was slightly higher than the one found in 1977 by Boatman (15,28 cm3/kg against 17,79 cm3/kg), although the reported volume was found by casting the excised lungs[23]. The low R2 of 0.42 indicates a moderate positive correlation meaning that there is a significant relationship, i.e., 42% of the lung volume is explained by the variation in weight, but it does not seem powerful enough to confidently predict lung volume based solely on the body weight [23].
Computed tomography is considered the gold standard for clinical evaluation of lung diseases in rabbits [6,24] but protocols for lung CT exams are lacking in the literature. In 2017, Müllhaupt et al. study was the first delivering information on normal lung volumes and attenuation in anesthetized rabbits. The mean volumes presented in that study for the right and left lungs were statistically different with the right lung volume being larger than that of the left lung. These findings were consistent with our data. The lung volumes calculated in the previous study were not statistically significantly different from tgose obtained in our study when the animals were under anesthesia, both during spontaneous breathing and apnea. Although the anesthetic protocols were different, both produce surgical anesthesia and the effects on the lung volume are found to be equal.
As expected, the dependent lung regions were more significantly affected by anesthesia, primarily due to the loss of diaphragmatic muscle tone. This reduction in muscle tone decreases the pressure gradient between the thoracic and abdominal cavities, leading to compression atelectasis [25]. The mean volume loss observed in the dependent lung areas was approximately 50%, while the non-dependent areas experienced a reduction of about 34%. In human medicine, it is estimated that anesthesia can cause a total lung volume decrease of around 20% [26].
A study on foals reported that sedation increased tidal volume by 28%, accompanied by a reduction in respiratory rate. However, subsequent anesthesia resulted in a 34% reduction in lung volume, without a compensatory increase in respiratory rate [27]. These findings suggest that sedation may account for the larger lung volumes observed in sedated rabbits in our study compared to those under anesthesia. Future studies should investigate the differences in lung volumes between awake and sedated states to clarify this observation.
Mean lung attenuation is expected to rise rapidly after anesthesia induction and remain stable during extended periods [18,28,29,30]. In our study, the mean lung attenuation rose rapidly after anesthesia induction. Positive pressure ventilation has been used in clinical settings and experimentally to reduce atelectasis during lung CT scans and to induce apnea [27,31,32]. A trivial decrease in lung attenuation was found in our study after apnea induction but it was not statistically different from the values obtained while on spontaneous breathing during anesthesia. A study in cats showed that apnea induction by hyperventilation did not decrease the areas of atelectasis [33] this finding can explain the trivial difference found in our study.
Mean lung attenuation for aerated tissue (-899 to -500 HU) was statistically different between sedation and anesthesia but it was not different between spontaneous breathing and apnea. On the other hand, the mean attenuation of poorly aerated lungs did not show any statistically significant difference between groups. These means were calculated by the application of the selected thresholds to produce segmentation, this rendered the division of the parenchyma in aerated and poorly aerated areas applying a bias to the results, and this was a limitation. On the other hand, global lung attenuation for the right and left lungs allowed us to compare our results with the previous published data, finding concordance between the mean lung attenuation registered for each lung, during anesthesia and values published. These findings allow us to say that mean lung attenuation for rabbits right and left lungs, under general anesthesia are expected to be close to the means in our study.
5. Conclusions
Our study demonstrates that sedated rabbits exhibit higher mean lung volumes and attenuation values on CT scans compared to those when they are anesthetized, even after undergoing hyperventilation. This suggests that sedation alone offers advantages in thoracic CT imaging by minimizing artifacts and distortions typically introduced by anesthesia. These artifacts can result from factors like reduced lung aeration and atelectasis caused by the loss of muscle tone during anesthesia. Consequently, sedation allows for a more accurate evaluation of lung structures and pathology.
Thus, our findings support the feasibility of using sedation as a practical alternative to general anesthesia when restraining rabbits during thoracic CT examinations. Sedation may be preferable in clinical practice for cases where the preservation of lung volume and accurate assessment of lung tissue attenuation are crucial, making it a potentially better choice for diagnostic imaging of the respiratory system in rabbits.
Author Contributions
Conceptualization and methodology R.S., M.G..; validation M.G. and F.S.; investigation: R.S., I.T., F.S. and M.G.; writing—original draft preparation R.S., and M.G.; writing—review and editing: R.S., I.T., F.S. and M.G.; project administration M.G.; funding acquisition M.G. All authors have read and agreed to the published version of the manuscript.
Funding
This work was supported by FCT—Fundação para a Ciência e Tecnologia, I.P. under the projects: UIDB/00772/2020 (https://doi.org/10.54499/UIDB/00772/2020, accessed on 1 June 2024) and LA/P/0059/2020.
Institutional Review Board Statement
All procedures complied with European and national legislation concerning the pro-tection of animals used for scientific purposes (European Directive 2010/63/EU and National Decree-Law 113/2013) and were approved by the relevant Portuguese au-thority, the Directorate-General for Food and Veterinary (DGAV_0421/000/000/2022).
Informed Consent Statement
Not applicable
Conflicts of Interest
The authors declare that the research was conducted in the absence of any commercial or financial relationships that could be construed as a potential conflict of interest.
References
- Johnson-Delaney, C.A.; Orosz, S.E. Rabbit Respiratory System: Clinical Anatomy, Physiology and Disease. Veterinary Clin. North Am. Exot. Anim. Pract. 2011, 14, 257–266. [CrossRef]
- Hedley, J. Respiratory Disease. In BSAVA Manual of Rabbit Medicine; Meredith, Lord, Eds.; British Small Animal Veterinary Association, 2014; pp. 160–167 ISBN 978-1-905319-49-7.
- Lennox, A.M.; Mancinelli, E. Respiratory Disease. In Ferrets, Rabbits, and Rodents; Elsevier, 2020; pp. 188–200 ISBN 978-0-323-48435-0.
- Jekl, V. Respiratory Disorders in Rabbits. Veterinary Clin. North Am. Exot. Anim. Pract. 2021, 24, 459–482. [CrossRef]
- Veraa, S.; Schoemaker, N. CT and MRI Scanning and Interpretation. In BSAVA Manual of Rabbit Surgery, Dentistry and Imaging; Harcourt-Brown, Chitty, Eds.; British Small Animal Veterinary Association, 2013; pp. 107–114 ISBN 978-1-905319-41-1.
- Capello, V.; Lennox, A.M. Diagnostic Imaging of the Respiratory System in Exotic Companion Mammals. Veterinary Clin. North Am. Exot. Anim. Pract. 2011, 14, 369–389. [CrossRef]
- Müllhaupt, D.; Wenger, S.; Kircher, P.; Pfammatter, N.; Hatt, J.-M.; Ohlerth, S. Computed Tomography of the Thorax in Rabbits: A Prospective Study in Ten Clinically Healthy New Zealand White Rabbits. Acta Vet. Scand. 2017, 59, 72. [CrossRef]
- Jekl, V. Respiratory Disorders in Rabbits. Veterinary Clin. North Am. Exot. Anim. Pract. 2021, 24, 459–482. [CrossRef]
- Grint, N. Anaesthesia. In BSAVA Manual of Rabbit Surgery, Dentistry and Imaging; Harcourt-Brown, Chitty, Eds.; British Small Animal Veterinary Association, 2013; pp. 1–25 ISBN 978-1-905319-41-1.
- Thrall, D.E. Principles of Radiographic Interpretation of the Thorax. In Textbook of Veterinary Diagnostic Radiology; Elsevier, 2018; pp. 568–582 ISBN 978-0-323-48247-9.
- Monte, V.D.; Grasso, S.; Marzo, C.D.; Crovace, A.; Staffieri, F. Effects of Reduction of Inspired Oxygen Fraction or Application of Positive End-Expiratory Pressure after an Alveolar Recruitment Maneuver on Respiratory Mechanics, Gas Exchange, and Lung Aeration in Dogs during Anesthesia and Neuromuscular Blockade. 2013. [CrossRef]
- Hunt, T.D.; Wallack, S.T. Minimal Atelectasis and Poorly Aerated Lung on Thoracic CT Images of Normal Dogs Acquired under Sedation. Vet. Radiol. Ultrasound 2021, 62, 647–656. [CrossRef]
- Magnusson, L.; Spahn, D.R. New Concepts of Atelectasis during General Anaesthesia. Br. J. Anaesth. 2003, 91, 61–72. [CrossRef]
- Reimegård, E.; Lee, H.T.N.; Westgren, F. Prevalence of Lung Atelectasis in Sedated Dogs Examined with Computed Tomography. Acta Vet. Scand. 2022, 64, 25. [CrossRef]
- Cohen, J. Statistical Power Analysis for the Behavioral Sciences; 2nd ed.; Taylor and Francis: Hoboken, 2013; ISBN 978-0-8058-0283-2.
- Slicer/SlicerLungCTAnalyzer 2024.
- Bumm, R.; Zaffino, P.; Lasso, A.; Estépar, R.S.J.; Pieper, S.; Wasserthal, J.; Spadea, M.F.; Latshang, T.; Kawel-Böhm, N.; Wäckerlin, A.; et al. From Voxels to Prognosis: AI-Driven Quantitative Chest CT Analysis Forecasts ICU Requirements in 78 COVID-19 Cases. Res. Sq. 2023, rs.3.rs-3027617. [CrossRef]
- Reimegård, E.; Lee, H.T.N.; Westgren, F. Prevalence of Lung Atelectasis in Sedated Dogs Examined with Computed Tomography. Acta Vet. Scand. 2022, 64, 25. [CrossRef]
- Roels, E.; Couvreur, T.; Farnir, F.; Clercx, C.; Verschakelen, J.; Bolen, G. Comparison between sedation and general anesthesia for high resolution computed tomographic characterization of canine idiopathic pulmonary fibrosis in west highland white terriers. Vet. Radiol. Ultrasound Off. J. Am. Coll. Vet. Radiol. Int. Vet. Radiol. Assoc. 2017, 58, 284–294. [CrossRef]
- Lam, W.W.M.; Chen, P.P.; So, N.M.C.; Metreweli, C. Sedation versus General Anaesthesia in Paediatric Patients Undergoing Chest Ct. Acta Radiol. 1998, 39, 298–300. [CrossRef]
- Negroni, D.; Zagaria, D.; Paladini, A.; Falaschi, Z.; Arcoraci, A.; Barini, M.; Carriero, A. COVID-19 CT Scan Lung Segmentation: How We Do It. J. Digit. Imaging 2022, 35, 424–431. [CrossRef]
- Lee, J.; Koh, D.; Ong, C.N. Statistical Evaluation of Agreement between Two Methods for Measuring a Quantitative Variable. Comput. Biol. Med. 1989, 19, 61–70. [CrossRef]
- Boatman - 1977 - A Morphometric and Morphological Study of the Lung.Pdf.
- Veraa, S.; Schoemaker, N. CT and MRI Scanning and Interpretation; BSAVA Library, 2013; pp. 107–114; ISBN 978-1-910443-16-3.
- Duggan, M.; Kavanagh, B.P.; Warltier, D.C. Pulmonary Atelectasis: A Pathogenic Perioperative Entity. Anesthesiology 2005, 102, 838–854. [CrossRef]
- Hedenstierna, G. 1 Effects of Anaesthesia on Respiratory Function. Baillières Clin. Anaesthesiol. 1996, 10, 1–16. [CrossRef]
- Sacks, M.; Raidal, S.; Catanchin, C.S.M.; Hosgood, G.; Mosing, M. Impact of Sedation, Body Position Change and Continuous Positive Airway Pressure on Distribution of Ventilation in Healthy Foals. Front. Vet. Sci. 2023, 9. [CrossRef]
- Brismar, B.; Hedenstierna, G.; Lundquist, H.; Strandberg, Å.; Svensson, L.; Tokics, L. Pulmonary Densities during Anesthesia with Muscular Relaxation—A Proposal of Atelectasis. Anesthesiology 1985, 62, 422–428. [CrossRef]
- Foo, T.S.; Pilton, J.L.; Hall, E.J.; Martinez-Taboada, F.; Makara, M. Effect of Body Position and Time on Quantitative Computed Tomographic Measurements of Lung Volume and Attenuation in Healthy Anesthetized Cats. 2018. [CrossRef]
- Guarracino, A.; Lacitignola, L.; Auriemma, E.; De Monte, V.; Grasso, S.; Crovace, A.; Staffieri, F. Which Airway Pressure Should Be Applied During Breath-Hold in Dogs Undergoing Thoracic Computed Tomography? Vet. Radiol. Ultrasound 2016, 57, 475–481. [CrossRef]
- Martins, A.R.C.; Ambrósio, A.M.; Fantoni, D.T.; Pinto, A.C.B.C.F.; Villamizar-Martinez, L.A.; Soares, J.H.N.; Otsuki, D.A.; Malbouisson, L.M.S. Computed Tomography Assessment of Tidal Lung Overinflation in Domestic Cats Undergoing Pressure-Controlled Mechanical Ventilation During General Anesthesia. Front. Vet. Sci. 2022, 9. [CrossRef]
- Sanchez, A.F.; Ambrósio, A.M.; Pinto, A.C.B.C.F.; Pereira, M.A.A.; Andrade, F.S.R.M.; Rodrigues, R.R.; de Carvalho Martins, A.R.; Baroni, C.O.; Ferrante, B.; Fantoni, D.T. Effects of a Stepwise Alveolar Recruitment Maneuver on Lung Volume Distribution in Dogs Assessed by Computed Tomography. Front. Vet. Sci. 2024, 10. [CrossRef]
- Henao-Guerrero, N.; Ricco, C.; Jones, J.C.; Buechner-Maxwell, V.; Daniel, G.B. Comparison of Four Ventilatory Protocols for Computed Tomography of the Thorax in Healthy Cats. 2012. [CrossRef]
Figure 1.
3dSlicer extension LungCTanalyser treshhold segmentation of the left lung of a sedated rabbit, selecting inflated aerated tissue (-899 to -500 HU) (transverse, dorsal and sagittal lung planes; upper left and bottom images, respectively). 3D reconstruction of lung and trachea, obtained from the masked segments in Lung Segmentator extension (upper right corner).
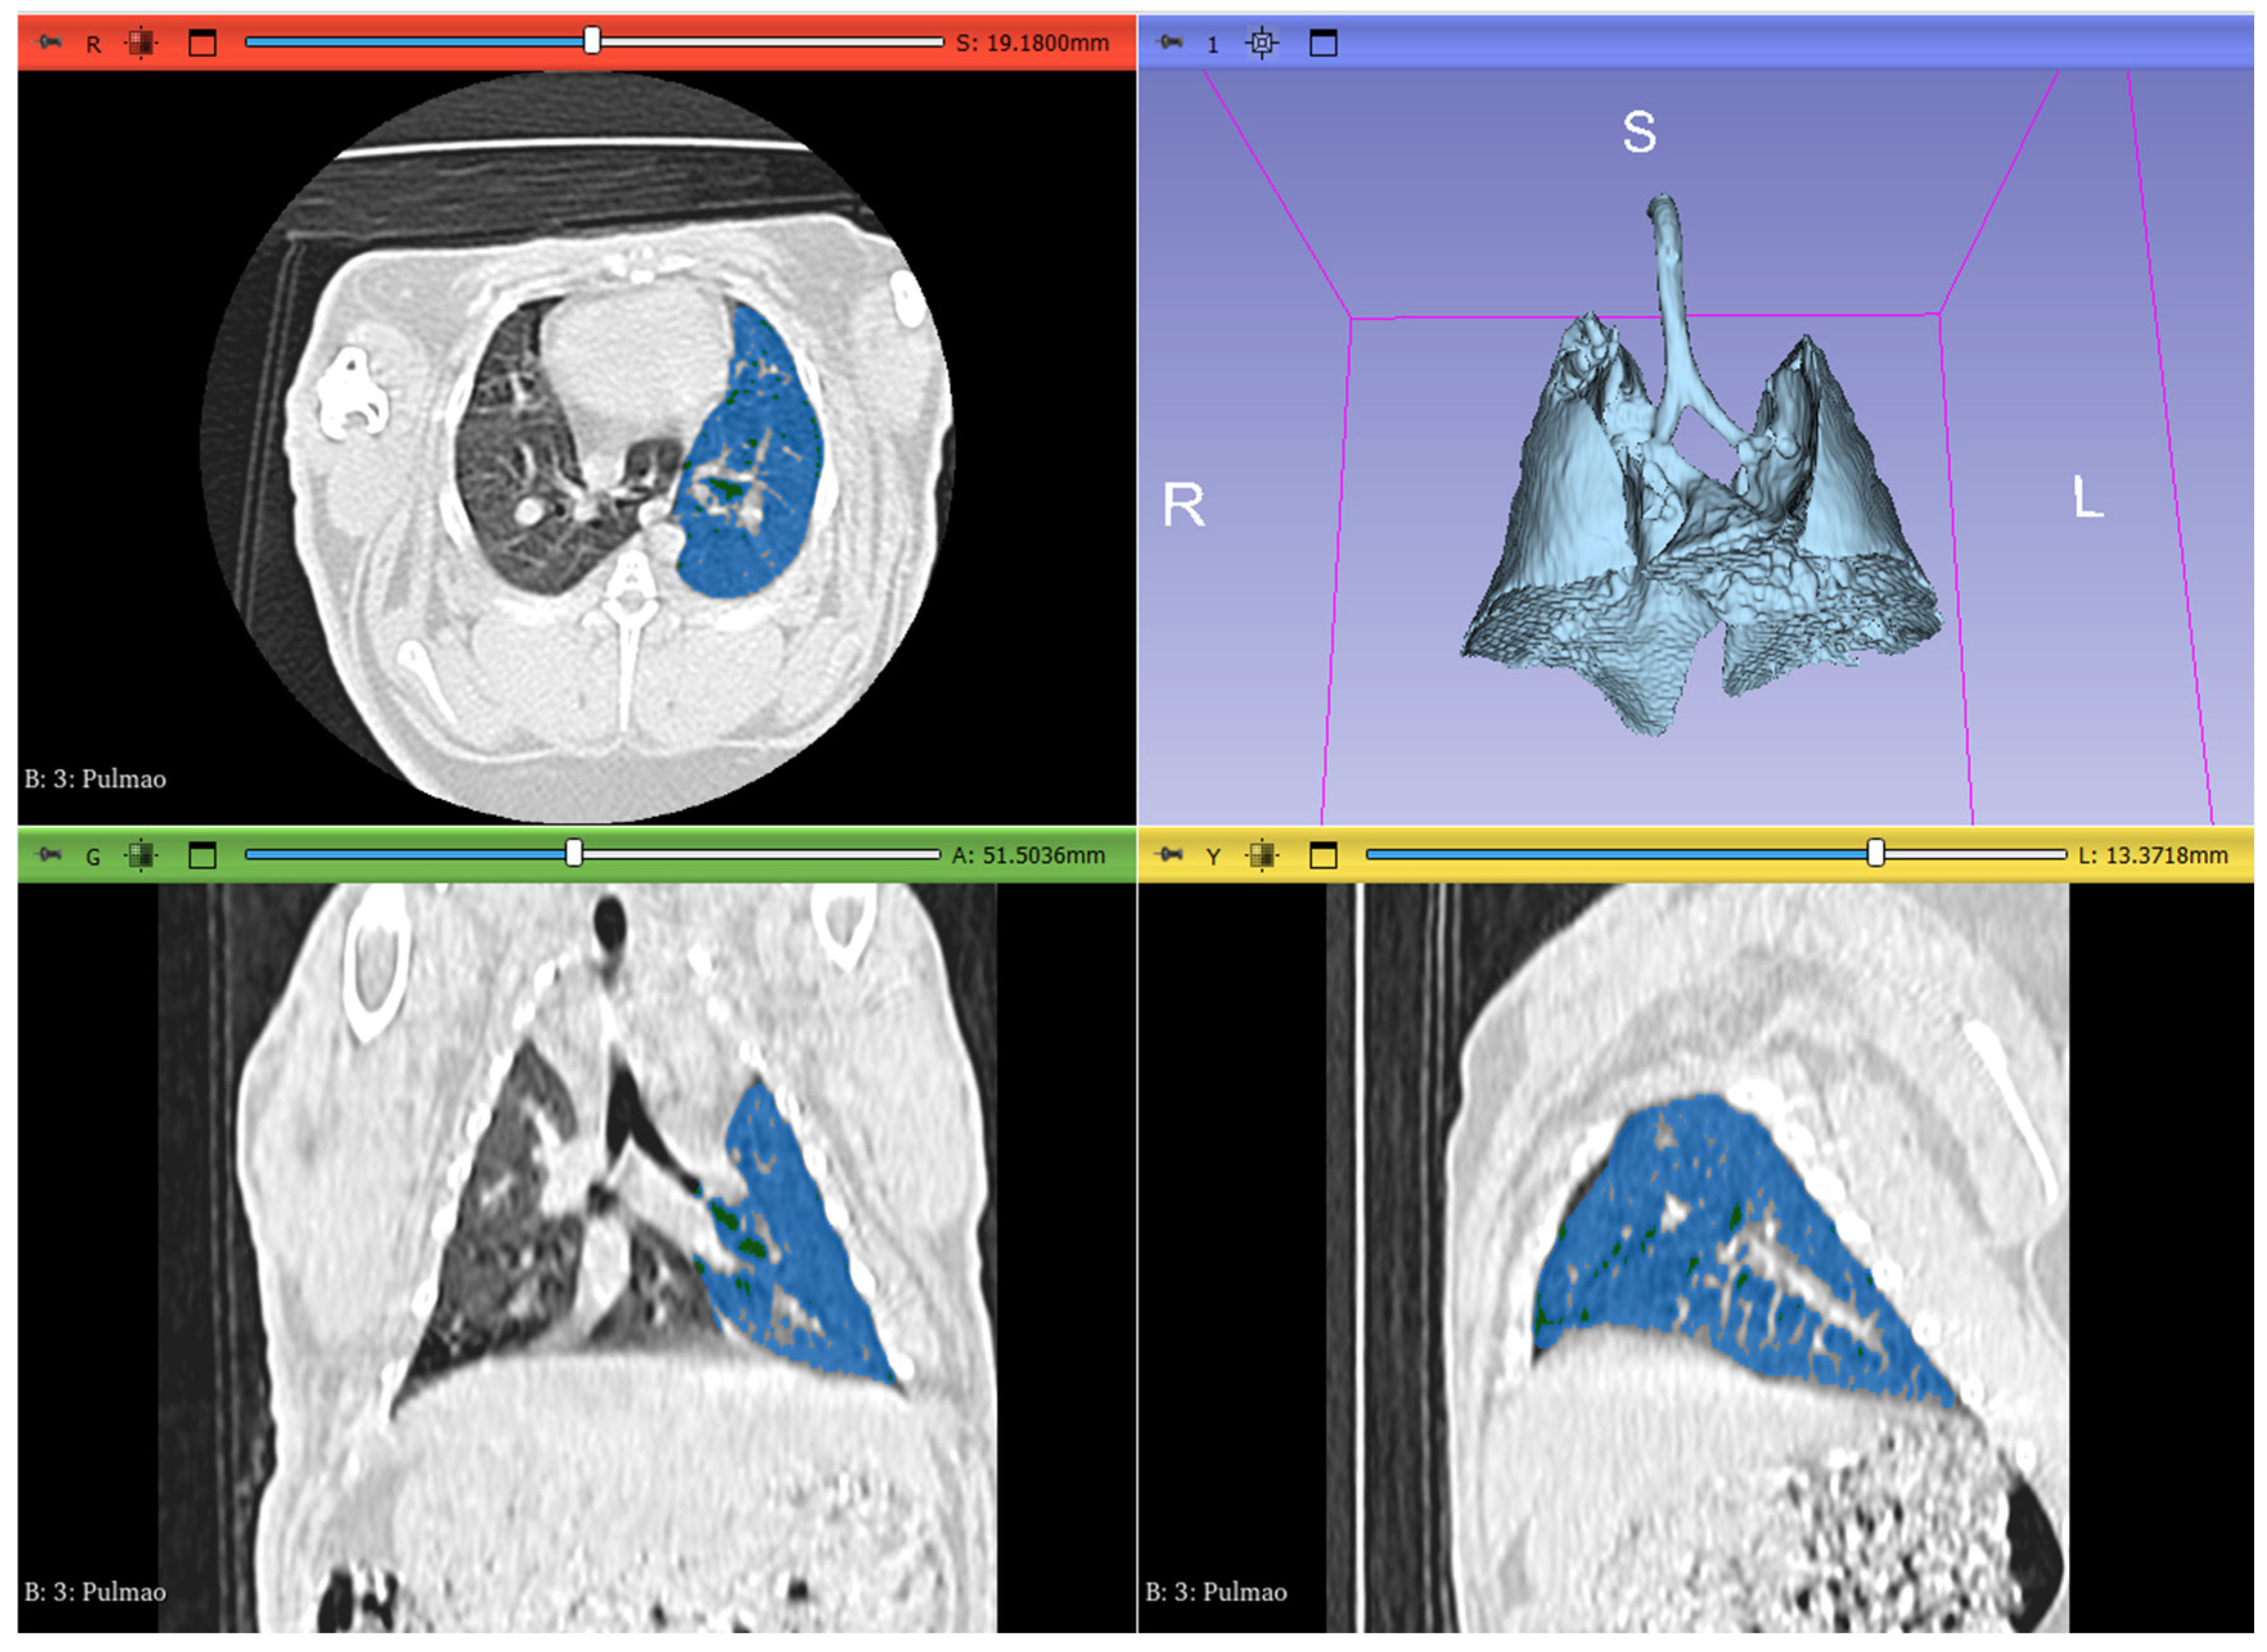

Table 1.
– Repeatability of lung volume (cm3) and attenuation (Hounsfield Units) in sedation.
| Variable | Session | Minimum | Maximum | Mean±SD | Paired t-test | ICC (95%CI) |
| Right lung volume | I | 28.739 | 46.423 | 38.82±5.11 | 0.994 | 0.96 (0.905-0.987) |
| II | 28.450 | 46.973 | 38.82±4.95 | |||
| Left lung volume | I | 22.456 | 39.974 | 30.57±5.54 | 0.208 | 0.976 (0.936-0.991) |
| II | 21.289 | 40.085 | 30.97±5.82 | |||
| Total lung volume | I | 52.513 | 85.769 | 69.39±10.04 | 0.060 | 0.998 (0.995-0.998) |
| II | 53.016 | 86.05 | 69.68±9.89 | |||
| Aerated right lung attenuation | I | -698.944 | -634.225 | -675.08±18.23 | 0.747 | 0.996 (0.99-0.999) |
| II | -699.133 | -636.572 | -675.21±18.37 | |||
| Aerated left lung attenuation | I | -708.961 | -666.244 | -690.03±14.19 | 0.862 | 0.992 (0.978-0.997) |
| II | -708.822 | -664.883 | -689.96±13.96 |
*CI, confidence interval; ICC-Intraclass Correlation Coefficient; SD, standard deviation.
Table 2.
– Repeatability of lung volume (cm3) and attenuation (Hounsfield Units) in anesthesia.
| Variable | Session | Minimum | Maximum | Mean±SD | Paired t-test | ICC (95%CI) |
| Total lung volume | I | 18.952 | 35.261 | 27.82±5.40 | 0.707 | 0.976 (0.934-0.991) |
| II | 19.164 | 35.276 | 27.70±5.62 | |||
| Left lung volume | I | 12.632 | 29.688 | 19.28±4.41 | 0.200 | 0.979 (0.943-0.992) |
| II | 12.970 | 30.215 | 19.58±4.56 | |||
| Total lung volume | I | 32.861 | 64.832 | 47.10±9.28 | 0.470 | 0.994 (0.983-0.998) |
| II | 33.441 | 65.491 | 47.29±9.60 | |||
| Aerated right lung attenuation | I | -685.725 | -578.192 | -633.48±36.15 | 0.069 | 0.999 (0.997-1.000) |
| II | -685.825 | -579.140 | -632.73±35.61 | |||
| Aerated left lung attenuation | I | -692.192 | -574.591 | -632.24±38.75 | 0.124 | 0.998 (0.994-0.999) |
| II | -691.120 | -574.792 | -631.20±39.63 |
*CI, confidence interval; ICC-Intraclass Correlation Coefficient; SD, standard deviation.
Table 3.
– Repeatability of lung volume (cm3) and attenuation (Hounsfield Units) in apnea.
| Variable | Session | Minimum | Maximum | Mean±SD | Paired t-test | ICC (95%CI) |
| Total lung volume | I | 19.678 | 35.231 | 28.26±3.88 | 0.916 | 0.923 (0.801-0.971) |
| II | 18.982 | 35.619 | 28.22±4.56 | |||
| Left lung volume | I | 13.258 | 30.957 | 20.34±4.36 | 0.618 | 0.917 (0.787-0.969) |
| II | 14.754 | 31.021 | 20.13±4.11 | |||
| Total lung volume | I | 36.141 | 66.188 | 48.60±7.40 | 0.614 | 0.964 (0.903-0.987) |
| II | 35.057 | 66.640 | 48.35±7.81 | |||
| Aerated right lung attenuation | I | -676.742 | -544.738 | -627.23±35.02 | 0.349 | 1.000 (0.999-1.000) |
| II | -675.811 | -544.447 | -627.05±35.02 | |||
| Aerated left lung attenuation | I | -696.140 | -555.915 | -632.77±38.28 | 0.092 | 0.999 (0.999-1.000) |
| II | -695.299 | -552.714 | -632.27±38.59 |
*CI, confidence interval; ICC-Intraclass Correlation Coefficient; SD, standard deviation.
Table 4.
– Evaluation of inflated lung volumes (cm3) and attenuation (HU) using the segmentation (-899 to -500 HU).
Table 4.
– Evaluation of inflated lung volumes (cm3) and attenuation (HU) using the segmentation (-899 to -500 HU).
| Lung region | Sedated | Anesthesia | Apnea | ||||
| Volume | Attenuation | Volume | Attenuation | Volume | Attenuation | ||
| Dorsal | Right Lung | 16.10±2.53 | -684.16±19.62 | 10.37±3.54 | -644.60±36.64 | 13.09±3.14 | -648.95±34.56 |
| Left Lung | 12,46±2.38 | -692.65±16.67 | 7,41±2.93 | -657.67±36 | 9,50±2.66 | -659.53±34.86 | |
| Ventral | Right Lung | 11.52±2.57 | -667.33±18.35 | 5.50±2.89 | -624.74±32.94 | 6.73±2.54 | -621.54±34.56 |
| Left Lung | 10,30±2.26 | -686.80±18.39 | 4,80±3.07 | -632.61±33.31 | 5,96±2.50 | -624.52±28.93 | |
Disclaimer/Publisher’s Note: The statements, opinions and data contained in all publications are solely those of the individual author(s) and contributor(s) and not of MDPI and/or the editor(s). MDPI and/or the editor(s) disclaim responsibility for any injury to people or property resulting from any ideas, methods, instructions or products referred to in the content. |
© 2024 by the authors. Licensee MDPI, Basel, Switzerland. This article is an open access article distributed under the terms and conditions of the Creative Commons Attribution (CC BY) license (http://creativecommons.org/licenses/by/4.0/).
Copyright: This open access article is published under a Creative Commons CC BY 4.0 license, which permit the free download, distribution, and reuse, provided that the author and preprint are cited in any reuse.


