Submitted:
19 October 2024
Posted:
22 October 2024
You are already at the latest version
Abstract
With increasing global attention on carbon emission control, the carbon market has become an important tool for carbon emission regulation. As an important part of energy trading, the electricity market is closely related to the carbon market. Given the relative maturity of the EU carbon market and electricity market, this paper identifies key points of market volatility through the Coupling coordination model analysis, and uses the GPT large model analysis to analyze policy factors that have a greater impact on carbon market and electricity market transactions. The research results show that market-regulating policies and expectation management policies have the greatest impact on the degree of coupling between the carbon and electricity markets. The impact of secondary policies such as international cooperation policies and structural adjustment policies is relatively insignificant. Although the development of China's carbon market faces many challenges, reasonable policy interventions are expected to achieve significant results in the domestic carbon market. Finally, this paper also draws on analogy analysis to draw corresponding implications for China from the EU's carbon-electricity coupling policy promulgation.
Keywords:
electricity market
; carbon market
; coupling analysis
; GPT large model
1. Introduction
The current Chinese government is committed to the “3060” plan and has been very effective in building a carbon rights market. On April 24, 2024, the closing price of China's carbon emission trading market exceeded 100 yuan per tonne for the first time, and the green financial attributes of carbon emission rights are being recognized by more and more financial institutions. Meanwhile, China's power generation, distribution and sales account for a large amount of carbon emissions. By the end of 2022, the cumulative trading volume of carbon emission allowances in the power generation industry in China's carbon emission rights trading market reached 230 million tons, with a cumulative turnover of 10.475 billion yuan. The relationship between China's carbon rights market and power market is becoming increasingly close [1].
However, the differences between the electricity market and the carbon market in terms of market elements and trading mechanisms have not yet been well coordinated [2]. The electricity market is a demand-driven market, the trading subject of which is electric energy, and continuous trading is required according to time periods such as years, months, and days. The carbon rights market, on the other hand, is a policy-driven market, the trading subject of which is carbon quotas and their derivatives, which do not have to be continuously traded like the electricity market.
Due to the different characteristics of the markets mentioned above, there are corresponding deficiencies in the connection between the carbon market and the electricity market. For example, the relative independence of the market policy systems has prevented the two markets from establishing close links, and differences in trading methods have prevented the effective transmission of carbon and electricity prices within a short period of time [3, 4]. At the same time, China's electricity market is currently in the process of transitioning from planning to the market, which also has a negative impact on the transmission of electricity and carbon prices [6-8]. These problems have greatly constrained the transformation of China's energy system. Therefore, an analysis of the coupling of China's carbon and electricity markets has become an important research task.
Compared with China's relatively underdeveloped carbon electricity market, the EU's carbon electricity market construction has entered a more mature stage [9, 10]. Under its highly market-oriented electricity conditions, power companies can directly incorporate the carbon price into the cost of power generation and partially or fully transfer it to consumers, combining the carbon rights market and the electricity market with in-depth price linkage [11]. At the same time, the EU has adopted the approach of no longer allocating free carbon allowances to power companies, forcing power companies to compete in carbon market transactions, which enables the electricity market and the carbon market to develop simultaneously. For China's current carbon electricity market, this approach is advanced and worth learning from.
Published articles have also analyzed the coupling of China's carbon electricity market. Paper [12] analyzed the cause-and-effect relationship between the operation of the electricity market and the carbon market in the Beijing-Tianjin-Hebei region, and obtained a dynamic model of the carbon electricity market for simulation. Paper [13] focused on Guangdong Province and studied the impact of the carbon electricity market on the marginal clearing price of Guangdong's electricity trading and the cost of electricity supply. Unlike previous related articles, this article, based on research on China's carbon electricity market, also analyzes the EU carbon electricity market. The carbon electricity markets in the two different regions can be compared, which leads to more targeted opinions. At the same time, this paper combines the GPT large model to analyze relevant policies. The use of AI large semantic models to analyze the impact of relevant policies on the carbon electricity market is rare before now, which is also an innovative aspect of this paper.
Within the overall framework of introducing the EU carbon electricity market for comparative analysis, this article will adopt the following structure: First, an overview of the EU's electricity market and carbon market will be given, introducing the general characteristics of its electricity market and carbon market. Second, the main analysis part of the article will explain in detail the types of EU policies, and based on the GPT model, the corresponding effects of various models will be given. Based on the policy analysis, factors such as the trading volume, unit price, and trading volume of the carbon electricity market will be used as the main variables to establish positive and negative correlation models and give the corresponding functional forms of the coupling degree. On this basis, the validity and rationality of the selected data will be further elaborated, and the results of the carbon electricity market coupling degree based on the established model will be used to visually illustrate the impact of various indicators on the carbon electricity market. Based on the results of the analysis of the factors and coupling degree of the EU market, the article will analyze the corresponding factors of the Chinese carbon electricity market and the actual coupling of the carbon electricity market, so as to more specifically obtain the main deficiencies in the current development of the Chinese carbon electricity market and the types and priority levels of various indicators that need to be improved. After using the analysis results of the EU carbon electricity market to analyze the Chinese carbon electricity market horizontally, the article will summarize all the previous content and draw the final research conclusions.
2. An Overview of Electricity and Carbon Markets in European Union
Section 2 describes the overview of the EU carbon electricity market separately. The EU market is chosen because of its large carbon electricity market and extremely mature trading mechanism, which facilitates comparison with the Chinese market in Section 4.
2.1. Electricity Market in European Union
In 2023, the EU's total power generation reached 2,402 TWh. Of this, renewable power accounted for 44%, with wind power in particular, accounting for 18% of total power generation, surpassing natural gas for the first time. At the same time, the EU's fossil fuel power generation fell significantly, accounting for less than one-third of EU power. And coal power generation was only 333 TWh, equivalent to 12% of total power generation. This significant change in the energy mix is largely due to the EU's strong market policies for new energy sources, and the proportion of new energy sources in electricity generation is expected to rise further [14].
In addition to the EU's improving electricity energy mix, its relatively complete market trading system and non-uniform pricing system have also brought sufficient vitality to the EU's electricity market [15].
Long-term and short-term electricity trading coexist in the EU. Among them, once a potential spot market is formed, long-term trading will naturally develop without political or regulatory intervention. However, the short-term spot market for electricity is different. Even though the vast majority of participants are private companies, the development of both the day-ahead hourly auction market and the intraday spot market has required political intervention or regulatory support. At the same time, due to the different sizes of the territories of different countries, the sizes of bidding areas in the spot market vary. This complexity has increased market tension, and changes to price areas are difficult to implement due to their political sensitivity. Nevertheless, the policy of combining long-term and short-term electricity trading still ensures the flexibility of the EU electricity market.
In terms of electricity prices, there is no unified transmission and distribution price system in Europe, and European electricity prices also differ greatly in terms of structure and absolute value [16]. Some are based on electricity volume, some on capacity, and some on a combination of the two. At the same time, electricity prices in different regions of the same country may not be the same. Such a system brings more uncertainty to the market, but at the same time, cross-border transactions and competition are also promoted to a certain extent.
The EU electricity market has come a long way since the reforms that began with the gradual liberalization of the monopoly. Before the introduction of competitive markets in the EU, national or regional monopolies covered all public utilities, including electricity production, the power grid and retail. The EU responded with structural reform measures to promote competition, the cornerstone of which was the separation of competitive and natural monopoly operations: transmission and distribution are natural monopoly operations, but power generation, trading and the sale of electricity to customers are classified as competitive operations. Since 1999, competition in the market has gradually developed, and the openness of the market has also deepened [17]. The implementation framework of the EU's market opening plan has gradually narrowed from being quite broad at the beginning to the current EU electricity market.
The current EU electricity market is relatively mature and is even able to actively carry out foreign trade while meeting the needs of member states [18]. With the further promotion of carbon peak and carbon neutrality, the EU's power structure is expected to be further improved, and the trading system of the power market is also expected to further innovate and develop, becoming more perfect.
2.2. Carbon Market in European Union
The EU electricity market includes 27 member states and 30 countries in total, including Iceland, Norway and Liechtenstein. More than 12,000 companies and industrial plants with an energy consumption of more than 20 MW are included in the EU carbon market. At the same time, the EU carbon market has a wide range of business coverage, including steel, cement, glass, ceramics, electricity, shipping, etc [19]. Among them, high-emission industries account for about 40% of EU carbon emissions.
Such a large scale of carbon emissions requires well-regulated carbon trading rules to ensure compliance. The EU government has adopted a cap-and-trade rule, but it is relatively free. Within the scope of administrative licensing, companies can sell their carbon allowances or purchase additional allowances to ensure that their overall carbon emissions are qualified. Under the government's sampling and supervision, companies commission agencies to conduct annual carbon emission verifications. If a company's carbon emissions exceed the quota, it will be fined at least 100 euros per unit of allowance [20]. This relatively standardized trading rule has largely ensured the stable operation of the EU carbon market.
In practice, however, the initial penalty specifications were not as high as they are now, and were accompanied by a large number of emission allowances. EU carbon trading has been developing since 2005, and has gone through roughly three stages before reaching its current state [21].
In the first phase, from 2005 to 2007, trading only covered the carbon emissions of power generators and energy-intensive industries, and there were substantial subsidies and a relatively low penalty price of 40 euros per tonne. The second phase ran from 2008 to 2012, when three countries outside the EU joined, subsidies were cut, and the penalty price was raised to its current level. This was followed by the third phase, which ran until 2020, when the different national cap systems were replaced by a standard EU emissions cap and auctioning was introduced as the default method for allocating allowances, with more companies and greenhouse gases included. The period from 2021 to the present is the fourth phase, which has been very successful, with regulated emissions from companies falling by 62% compared to 2005. The new EU Emissions Trading System 2 (ETS 2) was also introduced [22, 23].
The EU carbon rights market today uses the EU Allowance (EUA) as the unit of trade, with one unit of EUA equivalent to one metric ton of carbon dioxide equivalent. It is stored electronically in software. It can be traded on the European Climate Exchange (ECX) or the European Energy Exchange (EEX), both within individual countries and the EU, which greatly improves the flexibility of carbon market transactions [24]. In the future, the free carbon allowances of today may disappear completely, and companies will only be able to obtain carbon allowances through market transactions. At the same time, in order to further accelerate the “carbon reduction” process, the EU may impose additional levies on carbon market transactions as an incentive for companies to make greater contributions to carbon emission reductions and environmental improvements.
3. Coupling Analysis of Carbon and Electricity Markets
Section 3 systematically elaborates on the research content from the following four aspects. First, Section 3.1 introduces the coupled analysis model. This model can calculate and analyze the time-series coupling degree of the carbon electricity market, thus providing the coupling degree fluctuation point for the GPT macro model in Section 3.2. Second, Section 3.2 provides an in-depth analysis of the policy factors that cause this fluctuation point based on the GPT macro model. Then, Section 3.3 uses the EU carbon electricity market as an example to conduct a coupling analysis and verify the practical application effect of the proposed algorithm. Finally, Section 3.4 discusses the results of the analysis, summarizes the research findings and puts forward relevant recommendations.
3.1. Coupling Coordination Model
The coupling coordination model is used to measure the level of interaction and coordinated development between multiple systems. According to the relevant literature [25], the model can quantitatively calculate the degree of coupling coordination between multiple systems.
For a system …, each system has evaluation indicators. Therefore, the data set of the -th system is = {… }, The weight vector of each system indicator obtained by the entropy method is .
The data for each system is then standardized to eliminate dimensional effects. Calculate the standard value of the -th indicator for the -th system:
After that, the comprehensive evaluation index of each system is calculated. The comprehensive evaluation index is an indicator that measures the overall performance of each system. By multiplying the standardized data with the corresponding weight and summing it, a single value reflecting the comprehensive performance of the system can be obtained. This index can help compare the comprehensive performance of different systems.
Coupling measures the strength of interactions and synergies between multiple systems. It reflects the level of interdependence and synergistic development between systems. Coupling is calculated by taking the ratio of the geometric mean of the synthetic evaluation indices of all the systems to their arithmetic mean. The formula for calculating Coupling is as follows.
is the value for each subsystem, and the standardized result is distributed in the interval . The coupling degree is also in the interval . The greater the coupling degree , the less discrete the subsystems are from each other. Conversely, the greater the degree of discrete between subsystems.
The coupling coordination index is calculated to reflect the strength of the interaction between systems or the degree of interdependence between systems. It is an empirical parameter that is usually determined based on expert opinion, historical data analysis, or model simulation.
where is the weight of the -th subsystem, which is generally set to the same weight.
Coordination degree is based on coupling degree and takes into account the regulating factor of interaction between systems. By introducing the regulating factor , the coordinated development level between systems is further refined and adjusted. Therefore, that the interaction between systems and the state of coordinated development can be more accurately evaluated. The evaluation criteria for coupling coordination are shown in Table 1.
3.2. Coupling Analysis Algorithm Based on the GPT Large Model
3.2.1. Policy Classification
To more accurately reflect the role of various policies in market coupling, the policies promulgated by the Energy Administration for the carbon electricity market have been reclassified. Based on the time frame and implementation purpose of the policies, they are divided into two categories: strategic policies and operational policies. Strategic policies mainly focus on the management of long-term goals and market expectations, and usually involve long-term planning and structural changes. Operational policies mainly focus on short-term market stability and responding to emergencies, and usually involve specific market operations and emergency measures. Under these two broad categories, strategic policies are further subdivided into four categories based on the different expected directions of long-term planning and structural change. Operational policies are further subdivided into two categories based on the different approaches to resolving unexpected events that the market faces in the short term. The policy categories and their brief descriptions are shown in Table 2 [26-29].
The specific definitions of each policy and their examples are described in detail below.
1. Market-regulating policy. Adjust the market operating mechanism by directly intervening in the supply and demand relationship and price signals in the market to ensure market stability and effectiveness. China: Launch of the national carbon emissions trading market (2021) In July 2021, China officially launched its national carbon emissions trading market. The power generation industry will be included first. Through the quota allocation and trading mechanism, the supply and demand relationship in the carbon market will be directly regulated to achieve a stable carbon price and effective market operation. European Union: Fourth phase of the EU ETS reform (2021). In 2021, the EU will implement the fourth phase of the reform of its Emissions Trading System (EU ETS). The reform measures include tightening the total number of allowances, increasing the emission reduction target, and introducing a stricter market stability reserve mechanism (MSR) to strengthen the carbon price signal and promote emission reductions by enterprises. Canada: Federal Carbon Pricing Backstop Plan (2019) In 2019, Canada implemented the Federal Carbon Pricing Backstop Plan, which imposes a federal carbon tax on provinces that do not set their own carbon pricing mechanisms. This policy directly affects the cost of carbon emissions, adjusts market supply and demand, and encourages a low-carbon transition.
2. Anticipatory management policy. By formulating long-term strategies and goals, clarifying future policy directions, influencing the expectations and investment decisions of market entities, and guiding the market towards a low-carbon transition, Japan: 2050 carbon neutrality target (2020) In 2020, the Japanese government officially announced the goal of achieving carbon neutrality by 2050, and formulated the “Green Growth Strategy” to guide long-term emission reduction planning for enterprises and society. This goal provides a clear policy signal for market entities and influences their long-term investment decisions. United States: Clean Power Plan 2035 (2021) In 2021, the Biden administration proposed the goal of achieving 100% clean electricity by 2035. This goal has set a direction for long-term investment and development in the energy industry, influenced the expectations and behaviors of market players, and promoted investment in renewable energy.
3. Structural adjustment policy. Promote the transformation and upgrading of the energy structure and economic structure through in-depth reforms of market structures and mechanisms, which involves profound changes in market and industrial structures. Germany: Renewable Energy Sources Act (EEG) amendment (2021) In 2021, Germany amended the Renewable Energy Sources Act (EEG) to further increase the target for the proportion of renewable energy in electricity. Accelerate the transformation of the energy structure, promote the withdrawal from fossil fuels, adjust the industrial structure, and achieve low-carbon growth. South Korea: “New Deal for Korea 2.0” (2021) South Korea released “New Deal for Korea 2.0” in 2021, which includes a green transformation plan that invests in renewable energy, hydrogen energy and other fields. This policy adjusts the industrial structure and aims to achieve low-carbon growth and promote the sustainable development of the economy. UK: Early ban on petrol cars (2020) In 2020, the UK government brought forward the ban on new petrol and diesel cars from 2040 to 2030. This accelerates the structural change in the transport sector and promotes the development of electric vehicles and related infrastructure.
4. Innovative incentive policy. Provide policy incentives and financial support to promote the development of clean technologies and the widespread use of renewable energy. Promote technological innovation and industrial upgrading through incentive mechanisms to drive the green transformation of the economy. Australia: Technology Investment Roadmap (2020) In 2020, the Australian government formulated the Technology Investment Roadmap, which identifies key low-emission technology areas and provides funding and policy support to stimulate the development of clean technologies. This policy aims to reduce the cost of clean technologies and improve their market competitiveness. United States: Inflation Reduction Act (2022) In 2022, the United States passed the Inflation Reduction Act, which provides large-scale tax credits and subsidies for clean energy technologies. This policy encourages the research, development and application of new energy technologies and accelerates the innovation and industrialization of green technologies.
5. International cooperation policy. Address the global challenge of climate change and promote international carbon emission reduction actions through participation in international agreements and cross-border cooperation. New Zealand and Switzerland: Carbon trading cooperation agreement (2020) In 2020, New Zealand and Switzerland signed a carbon trading cooperation agreement. The two countries cooperate through the international carbon market mechanism to achieve their respective emission reduction targets, promote cross-border carbon trading, prevent carbon leakage, and improve the flexibility and cost-effectiveness of emission reduction measures. Global: Adoption of the rules for the implementation of Article 6 of the Paris Agreement (2021) At the United Nations Climate Change Conference (COP26) in 2021, countries agreed on the rules for the implementation of Article 6 of the Paris Agreement. The adoption of these rules promotes cooperation and integration of the global carbon market and international cooperation on carbon emission reductions.
6. Contingency adjustment policy. Short-term measures taken in emergencies to deal with sudden problems. They are temporary and targeted to ensure market stability and energy supply. India: Emergency electricity supply measures (2021) In the face of power shortages in 2021, the Indian government urgently adjusted coal supply and power dispatch to ensure power supply during critical periods. By increasing coal production and optimizing power distribution, the pressure on energy supply has been eased. European Union: Measures to address the energy crisis (2022) In 2022, the European Union formulated an emergency response plan in the face of a shortage of natural gas supplies and soaring energy prices. Measures include setting an energy price cap, implementing demand-side management and accelerating the deployment of renewable energy to stabilize energy markets and ensure the energy security of member states. China: Coal supply and price stabilization policy (2021) In response to the tight power supply and rising coal prices in 2021, the Chinese government took measures to expand coal production capacity, stabilize coal prices, and ensure power supply. Through policy intervention, market stability was maintained and the energy needs of economic development were met.
The effectiveness of the six-category policy classification method was verified by categorizing the policies promulgated by multiple governments in the past five years that have had a macro impact on the carbon electricity market. These examples not only enrich the specific content of each category, but also demonstrate the clarity and applicability of the classification criteria. This classification method can help policy analysts and researchers in China and around the world better understand the dynamic changes in global carbon electricity market policies and provide reference suggestions for future policy formulation and adjustment.
3.2.2. Coupling analysis algorithm process
In order to reveal the coupling relationship between carbon electricity markets, a coupling analysis algorithm was established, and the process is shown in Figure 1.
1. Calculate the coupling coordination degree D value. Substitute the pre-processed index data of the two systems into the coupling coordination degree model. Use statistical analysis software such as SPSS to obtain the coupling coordination degree D value of the long time series and plot a trend chart of its change over time.
2. Identify coupled mutation points. Take D=0.4 as the baseline for judgment, analyze the D value trend chart, identify significant isolated peak points and clusters of peak points, and mark the time series numbers and corresponding dates of these peak points.
3. Policy factor analysis and classification. Using the GPT model, supervised learning and search are performed on policy factors that may affect the coupling degree of the carbon electricity market within one week before the date of each wave peak, and policy factors that lead to sudden increases in coupling degree are mined and classified according to the policy classification method proposed earlier.
4. Statistics and summary. Conduct a statistical analysis of the policy factors identified, summarize the key policy categories that promote increased coupling of the carbon and electricity markets, and summarize their common characteristics and impact mechanisms.
3.3. Data Pre-Processing
This section describes the data sources related to this article and the specific methods of data pre-processing.
First, for the coupled objects studied in this paper, there are a total of two market participants, namely the carbon rights trading market and the spot electricity trading market. Therefore, the value of n in the algorithm is set to 2. In addition, each system in this paper has 4 evaluation indicators, namely, daily transaction price, daily transaction volume, daily transaction price volatility and daily transaction volume volatility. Therefore, the value of m in the algorithm is set to 4. In this paper, the daily transaction price of the EU electricity market is obtained from Energy-Charts. The data on this website is based on the official auction results of electricity markets in various countries and is updated regularly, ensuring the accuracy and timeliness of the data, so it is used in academic research and market analysis.
3.3.1. Electricity Market Data
The electricity market data in this paper focuses on the day-ahead market, using the average daily transaction price as the market transaction price. Due to the lack of an authoritative and uniform formula for calculating the size of the electricity transaction and the transaction price, this paper takes the load (LOAD) of each time period as the transaction size. In addition, given that the EU electricity market is conducted on a regional basis, it is more difficult to obtain a uniform price that can represent the entire EU carbon electricity market. Therefore, the transaction data were processed to calculate the weighted average price and transaction size across the EU.
First, calculate the turnover size of the electricity market. The load () of the electricity market consists of four components Cross border electricity trading, Nuclear, Non-Renewable and Renewable.
The average price of electricity is calculated:
For -th day, the average price for all regions can be calculated by the following formula:
where is the price of electricity in region on day and is the number of regions involved in the calculation.
In order to more accurately reflect the overall EU electricity market price level, a weighted average price is used, calculated as follows:
Volatility of day transaction price :
Transaction price volatility and transaction size volatility are calculated based on the daily weighted average price and total load:
Here, denotes the weighted average price difference between day and day .
Volatility of day transaction size :
Through the above data preprocessing, the daily weighted average transaction price, the daily total load, and their respective volatilities of the electricity spot trading market are obtained. These four evaluation indicators will be used as inputs to the first system for coupling analysis. The processed data for the four evaluation indicators are shown in Figure 2.
3.3.2. Carbon Market Data
The data for the carbon emissions trading market comes from the official website of the Intercontinental Exchange (ICE). As a world-renowned provider of financial market infrastructure and trading platforms, ICE's data is real-time and accurate, with historical prices and trading data covering a rich time span, supporting time series data analysis. In addition, its market data and trading rules are transparent and suitable for this study. From ICE, you can obtain the daily closing price and trading volume of the carbon emissions trading market. The closing price is used as the clearing price, and the trading volume is used as the transaction size to calculate the price volatility and trading size volatility.
Volatility of carbon rights trading price on day :
where is the closing price of carbon emission rights on the kth day.
Day Carbon right trading size Volatility :
where is the trading volume of carbon emission rights on the -th day.
After data preprocessing, the daily closing price, daily trading volume, and their respective volatilities of the carbon emission trading market were obtained. These four evaluation indicators will be used as the input of the second system for coupling analysis. The time series chart of the four indicators of the carbon market is shown in Figure 3.
3.4. Results
The two systems obtained from data preprocessing and their respective four indicators were substituted into the previously mentioned coupling analysis algorithm. First, SPSS software was used to process and analyze the data, and the change curve of the coupling coordination degree D value of the long time series was obtained, as shown in Figure 4.
Subsequently, the D value curve was analyzed using D=0.6 as the baseline for judgment, and it was found that there were multiple isolated peaks and a cluster of peaks. The time series positions of these peaks were marked, and the specific dates corresponding to the peaks were determined.
Then, using the GPT large language model, supervised learning and search were performed on policy information within one week before and after the date of each wave peak point, and the relevant policies were classified. The dates of the wave peak points and the corresponding policy factor analysis are shown in Table 3.
Furthermore, through in-depth analysis, policy factors that lead to the occurrence of serial wave peaks were identified and these factors were classified and organized. Finally, a statistical analysis of the identified policy factors was performed to draw more in-depth conclusions, as shown in Figure 5.
Given that the spike at the peak represents a sudden increase in the coupling degree of the carbon electricity market, i.e., the degree of coupling of the carbon electricity market has been significantly improved. Event analysis, case studies and statistical data were used to identify the policy factors that caused the spike. The key policy factors that can promote the increase in the coupling degree of the carbon electricity market were summarized. These successful policy experiences are of great significance for the Chinese government. China can formulate more effective policy measures based on these policy factors and combined with the characteristics of its own market, to further promote the coupling development of the carbon electricity market and promote the sustainable development of a low-carbon economy.
4. Analogical Analysis of the Chinese Market
Among the relevant electricity market policies, market-regulating policies are the most numerous, issued by the European Council, the European Parliament, the European Commission, and national governments and parliaments. Moreover, these policies were issued earlier and have a longer span. Market-regulating policies have been issued since 2015, and there will be follow-up supplements until July 2024. Next are expectation management policies, which are issued by energy analysis organizations such as the Institute for Energy Economics Research. At the same time, these policies have a time span comparable to market-regulating policies. The other four types of policies are significantly different from the first two in terms of quantity and time span. It can be analyzed that market-regulating policies and market-planning policies play a major role in maintaining the coupling of the carbon and electricity markets. To continue to maintain a good coupling of the carbon and electricity markets, it is essential to continue to promote the release of these two types of policies.
Although China has actively participated in international cooperation activities on green energy, played an important role in important conferences such as COP26, and participated in many international cooperation policies, the starting time for China to issue market regulation policies and market planning policies was much later than that of the EU. In January 2024, the State Council promulgated the “Interim Regulations on the Administration of Carbon Emissions Trading”, which came into effect on May 1. This is the first special law in the field of climate change in China. It can be seen that before this, China's market-regulating and market-planning policies for the carbon market were basically lacking, and these are the most important policies for coupling the carbon and electricity markets.
Therefore, improving market-regulating and market-planning policies is currently the most important task in China in terms of policies to promote the construction of carbon and electricity coupling. With sufficient and effective policy adjustments, China's construction of carbon and electricity market coupling is expected to develop further.
5. Conclusions
This paper introduces a coupling coordination model and analyzes various data indicators obtained from the electricity and carbon markets to obtain relative results of the degree of coupling between the carbon and electricity markets. Furthermore, the GPT macro model is used innovatively to analyze the role of policies in the carbon and electricity markets by introducing the type relationship between the mutation points of the analysis results and the corresponding policies on the basis of a preliminary classification of policies. The analysis found that market regulation policies and expectation management policies have the greatest impact on the coupling degree of the carbon and electricity markets, and the introduction of favorable policies of this kind is more likely to promote the coupling construction of the carbon and electricity markets. The impact of secondary policies such as international cooperation policies and structural adjustment policies is relatively insignificant.
However, at the same time, this paper does not further analyze the underlying reasons for the impact of carbon market price fluctuations on its trading volume and the impact on the electricity market price. This could be a new direction for follow-up research. But overall, this paper's analysis of the factors influencing the degree of coupling of the carbon and electricity markets is relatively complete.
Author Contributions
Conceptualization, S.X.; methodology, S.X. and X.T.; software, Y.L. and X.T.; validation, S.X. and Y.L.; formal analysis, S.X. and Y.L.; investigation, Y.L.; resources, Y.L.; data curation, Y.L. and S.X.; writing—original draft preparation, S.N., Y.L. and X.T.; writing—review and editing, S.X. and P.W.; visualization, S.X. and Y.L.; supervision, P.W.; project administration, S.X. and P.W.; funding acquisition, Y.L., S.X. and P.W. All authors have read and agreed to the published version of the manuscript.
Funding
This work was partially supported by the Innovation and Entrepreneurship Training Program for College Students of North China Electric Power University (202301019).
Data Availability Statement
We encourage all authors of articles published in MDPI journals to share their research data. In this section, please provide details regarding where data supporting reported results can be found, including links to publicly archived datasets analyzed or generated during the study. Where no new data were created, or where data is unavailable due to privacy or ethical restrictions, a statement is still required. Suggested Data Availability Statements are available in section “MDPI Research Data Policies” at https://www.mdpi.com/ethics.
Conflicts of Interest
All authors declare that the research was conducted in the absence of any commercial or financial relationships that could be construed as a potential conflict of interest.
References
- Cui, J.; Song, F.; Jiang, Z. Efficiency vs. equity as China's national carbon market meets provincial electricity markets. China Economic Review 2023, 78, 101915.
- Liu, X.; Jin, Z. An analysis of the interactions between electricity, fossil fuel, and carbon market prices in Guangdong, China. Energy for Sustainable Development 2020, 55, 82–94. [Google Scholar] [CrossRef]
- Cheng, Y.; Chung, M.; Tsang, K. Electricity Market Reforms for Energy Transition: Lessons from China. Energies 2023, 16, 905. [Google Scholar] [CrossRef]
- Chi, Y.; Guan, Z.; Zhao, Y. The impact of allocation methods on carbon emission trading under electricity marketization reform in China: A system dynamics analysis. Energy 2022, 259, 125034. [Google Scholar] [CrossRef]
- Guo, H.; Cheng, A.; Zhang, X. Power market reform in China: Motivations, progress, and recommendations. Energy Policy 2020, 145, 111717. [Google Scholar] [CrossRef]
- Cao, J.; Zhang, L.; Xu, Y. When carbon emission trading meets a regulated industry: Evidence from the electricity sector of China. Journal of Public Economics 2021, 200, 104470. [Google Scholar] [CrossRef]
- Li, J.; Wang, Y.; Xu, S. China's flexibility challenge in achieving carbon neutrality by 2060. Renewable and Sustainable Energy Reviews 2022, 158, 112112. [Google Scholar] [CrossRef]
- Lyu, J.; Sun, Y.; Liu, Y. Price volatility in the carbon market in China. Journal of Cleaner Production 2020, 255, 120171. [Google Scholar] [CrossRef]
- Zachmann, G.; Grubb, M.; Newbery, D. Unity in power, power in unity: Why the EU needs more integrated electricity markets. Bruegel Policy Brief 2024, No. 03/2024.
- Fleschutz, M.; Fröhlingsdorf, A.; Mattig, B. The effect of price-based demand response on carbon emissions in European electricity markets: The importance of adequate carbon prices. Applied Energy 2021, 295, 117040. [Google Scholar] [CrossRef]
- Wang, Y.; Chen, M.; Wang, L. Carbon-oriented operational planning in coupled electricity and emission trading markets. IEEE Transactions on Power Systems 2020, 35, 3145–3157. [Google Scholar] [CrossRef]
- Lu, Y.; Liu, W.; Chai, L. Coupling mechanism and synergic development of carbon market and electricity market in the region of Beijing–Tianjin–Hebei. Energies 2023, 16, 1726. [Google Scholar] [CrossRef]
- Yuan, J.; Zhang, H.; Li, R. The impact of electricity-carbon market coupling on system marginal clearing price and power supply cost. Environmental Science and Pollution Research 2023, 30, 84725–84741. [Google Scholar] [CrossRef] [PubMed]
- Potrč, S.; Savić, M.; Mihajlović, B. Sustainable renewable energy supply networks optimization: The gradual transition to a renewable energy system within the European Union by 2050. Renewable and Sustainable Energy Reviews 2021, 146, 111186. [Google Scholar] [CrossRef]
- Jamasb, T.; Pollitt, M. Electricity market reform in the European Union: Review of progress toward liberalization and integration. The Energy Journal 2005, 26, 11–41. [Google Scholar] [CrossRef]
- Ciferri, D.; D’Errico, M.C.; Polinori, P. Integration and convergence in European electricity markets. Economia Politica 2020, 37, 463–492. [Google Scholar] [CrossRef]
- Newbery, D.; Griffin, J.; Keats, P. Market design for a high-renewables European electricity system. Renewable and Sustainable Energy Reviews 2018, 91, 695–707. [Google Scholar] [CrossRef]
- Li, Y.; Liu, X.; Zhang, B. How do the electricity market and carbon market interact and achieve integrated development? A bibliometric-based review. Energy 2023, 265, 126308. [Google Scholar]
- Boutabba, M.A.; Lardic, S. EU emissions trading scheme, competitiveness, and carbon leakage: New evidence from cement and steel industries. Annals of Operations Research 2017, 255, 47–61. [Google Scholar] [CrossRef]
- Richstein, J.C.; Chappin, É.J.L.; de Vries, L.J. The market (in-) stability reserve for EU carbon emission trading: Why it might fail and how to improve it. Utilities Policy 2015, 35, 1–18. [Google Scholar] [CrossRef]
- Gong, X.; Wang, Y.; Zhang, T. Analyzing spillover effects between carbon and fossil energy markets from a time-varying perspective. Applied Energy 2021, 285, 116384. [Google Scholar] [CrossRef]
- Bayer, P.; Aklin, M. The European Union emissions trading system reduced CO2 emissions despite low prices. Proceedings of the National Academy of Sciences 2020, 117, 8804–8812. [Google Scholar] [CrossRef]
- Braungardt, S.; Bei der Wieden, M.; Kranzl, L. EU emissions trading in the buildings sector: An ex-ante assessment. Climate Policy 2024, 1–15. [Google Scholar] [CrossRef]
- Li, Z.P.; Liu, J.; Zhang, L. Scenario simulation of the EU carbon price and its enlightenment to China. Science of the Total Environment 2020, 723, 137982. [Google Scholar] [CrossRef] [PubMed]
- Cong, X. Expression and Mathematical Property of Coupling Model, and Its Misuse in Geographical Science. Economic Geography 2019, 39, 18–25. [Google Scholar]
- Wang, M.; Zhang, Q.; Wang, X. Impact of market regulation on economic and environmental performance: A game model of endogenous green technological innovation. Journal of Cleaner Production 2020, 277, 123969. [Google Scholar] [CrossRef]
- Hartley, K.; van Santen, R.; Kirchherr, J. Policies for transitioning towards a circular economy: Expectations from the European Union (EU). Resources, Conservation and Recycling 2020, 155, 104634.
- Wigger, A. The new EU industrial policy: Authoritarian neoliberal structural adjustment and the case for alternatives. In Authoritarian Neoliberalism; Routledge: London, 2020; pp. 121-137.
- Milner, H.V. Interests, Institutions, and Information: Domestic Politics and International Relations; Princeton University Press: Princeton, NJ, USA, 2020. [Google Scholar]
- Tang, J.; Wang, K.; Zhang, X. Multidimensional risk spillover among power, coal, and carbon markets: Empirical evidence from China. Environmental Science and Pollution Research 2024, 31, 1244–1259. [Google Scholar] [CrossRef]
- Bai, C.; Li, C.; Liu, J. Blessing or curse? Market-driven environmental regulation and enterprises' total factor productivity: Evidence from China's carbon market pilots. Energy Economics 2023, 117, 106432. [Google Scholar] [CrossRef]
Figure 1.
Coupling analysis algorithm process.
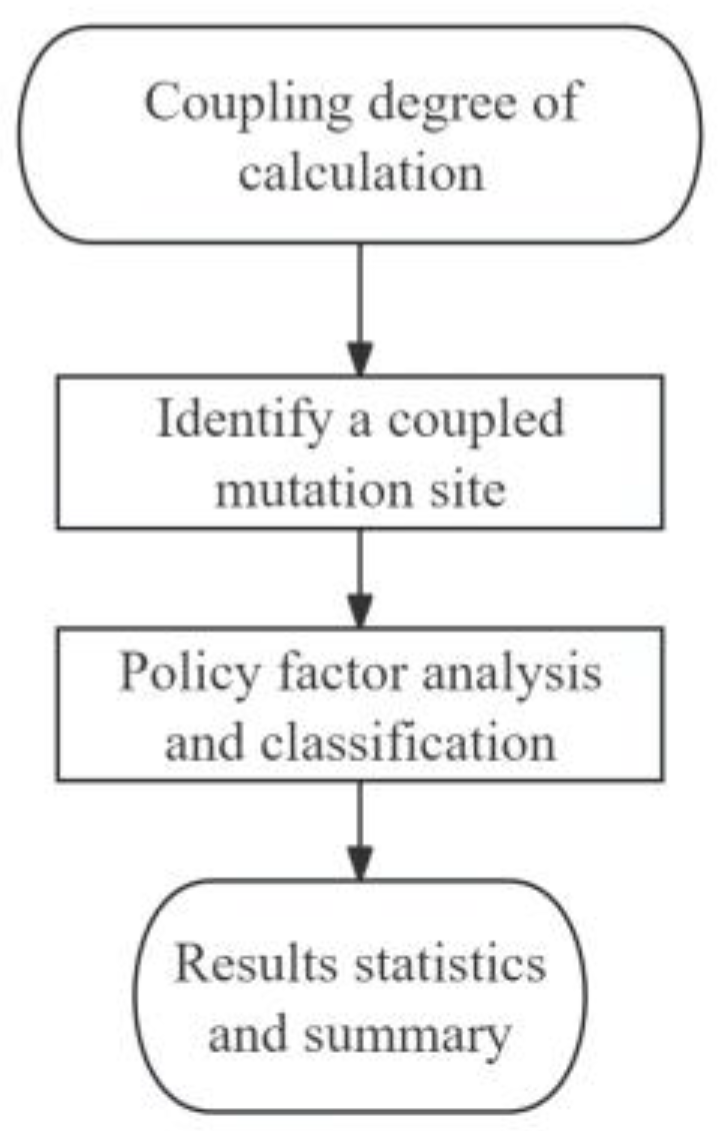
Figure 2.
Electricity market timing data.
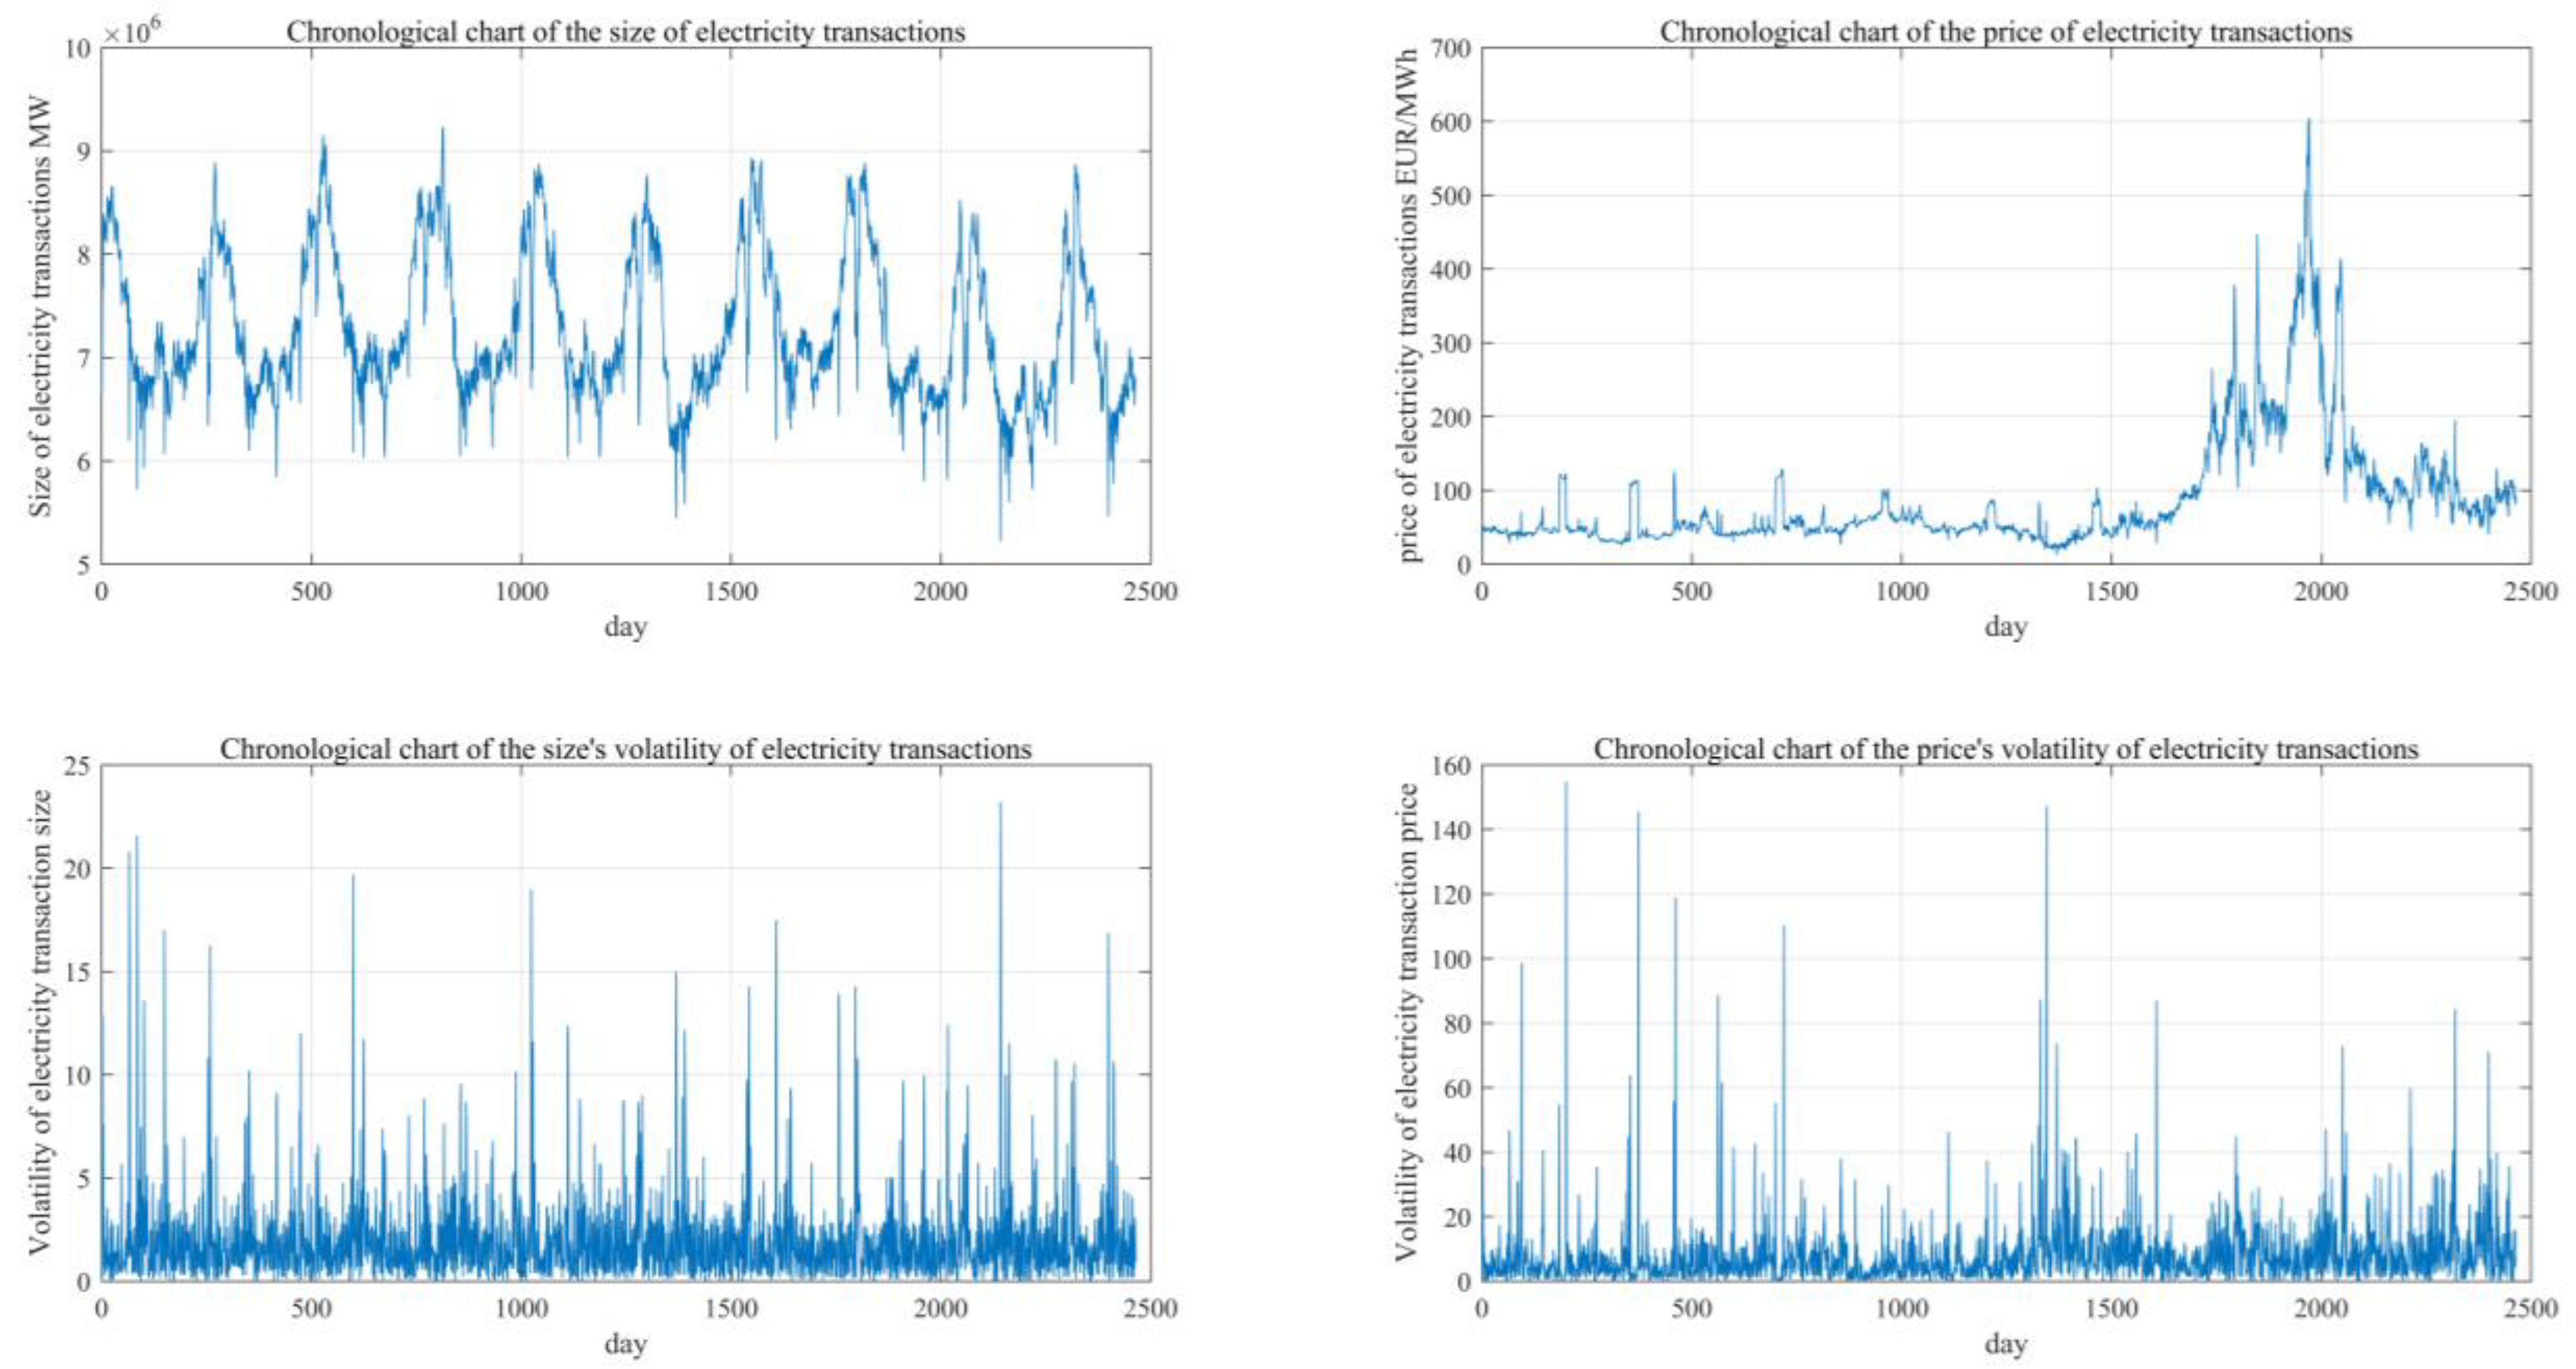
Figure 3.
Carbon market timing data.
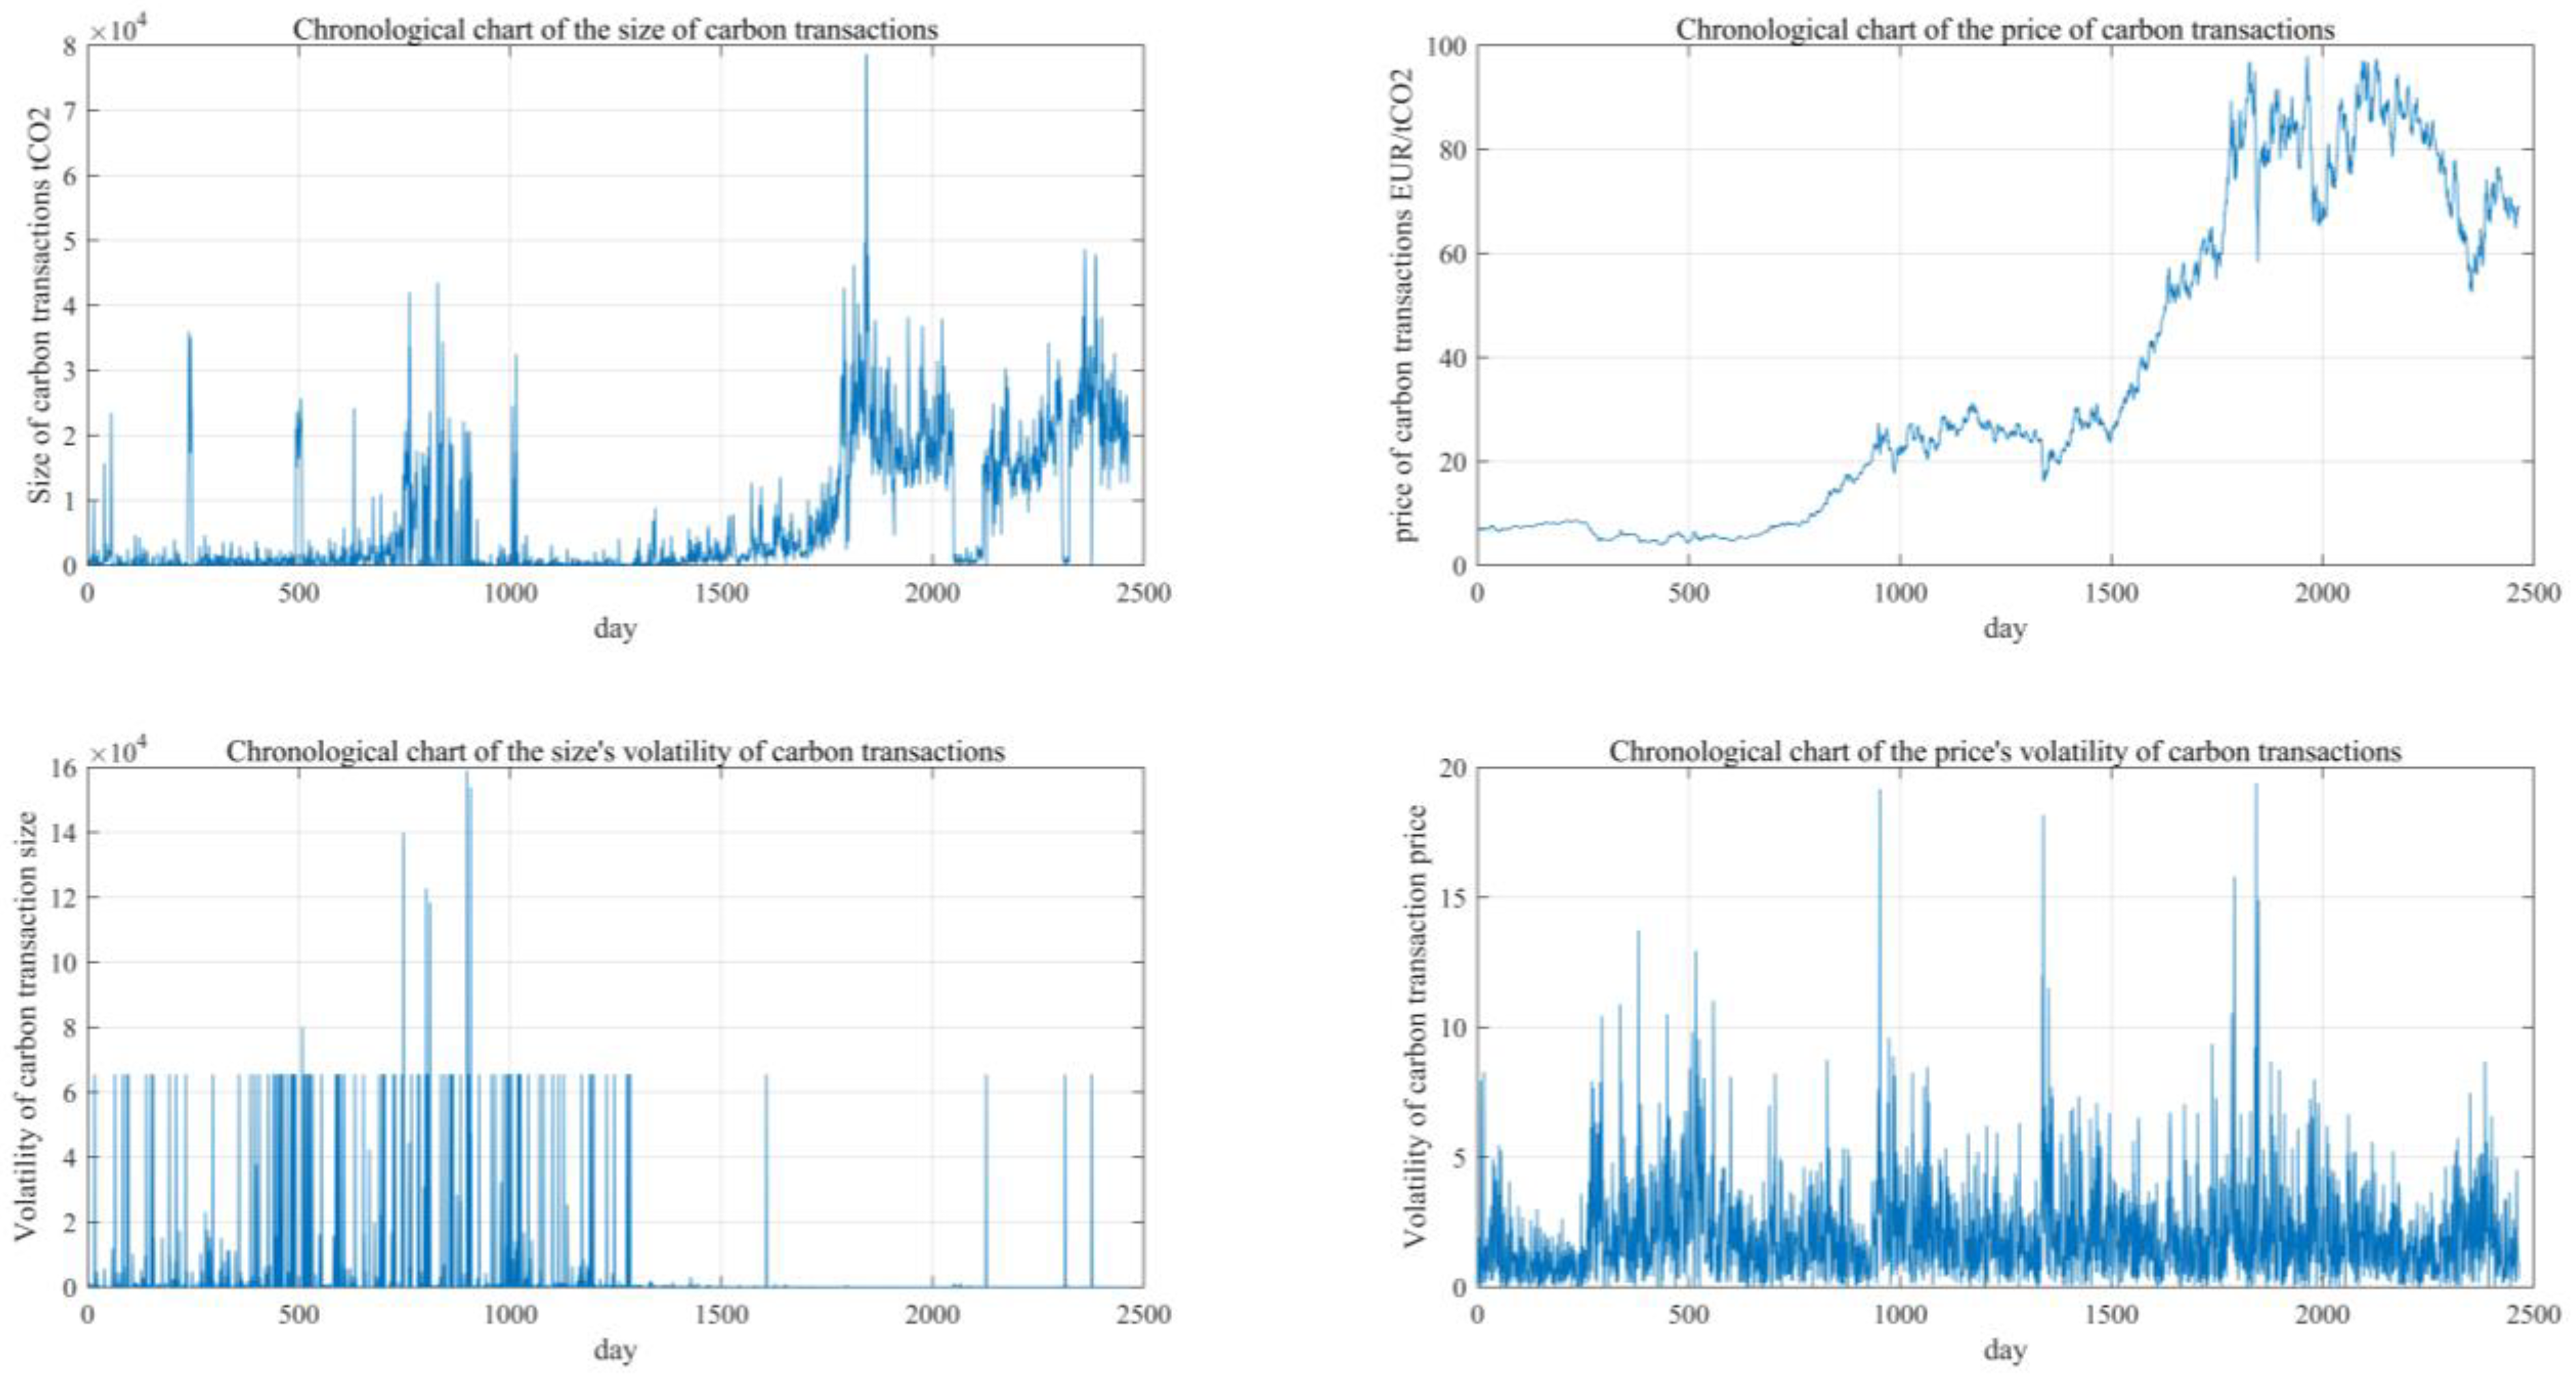
Figure 4.
Coupling coordination degree D timing diagram.
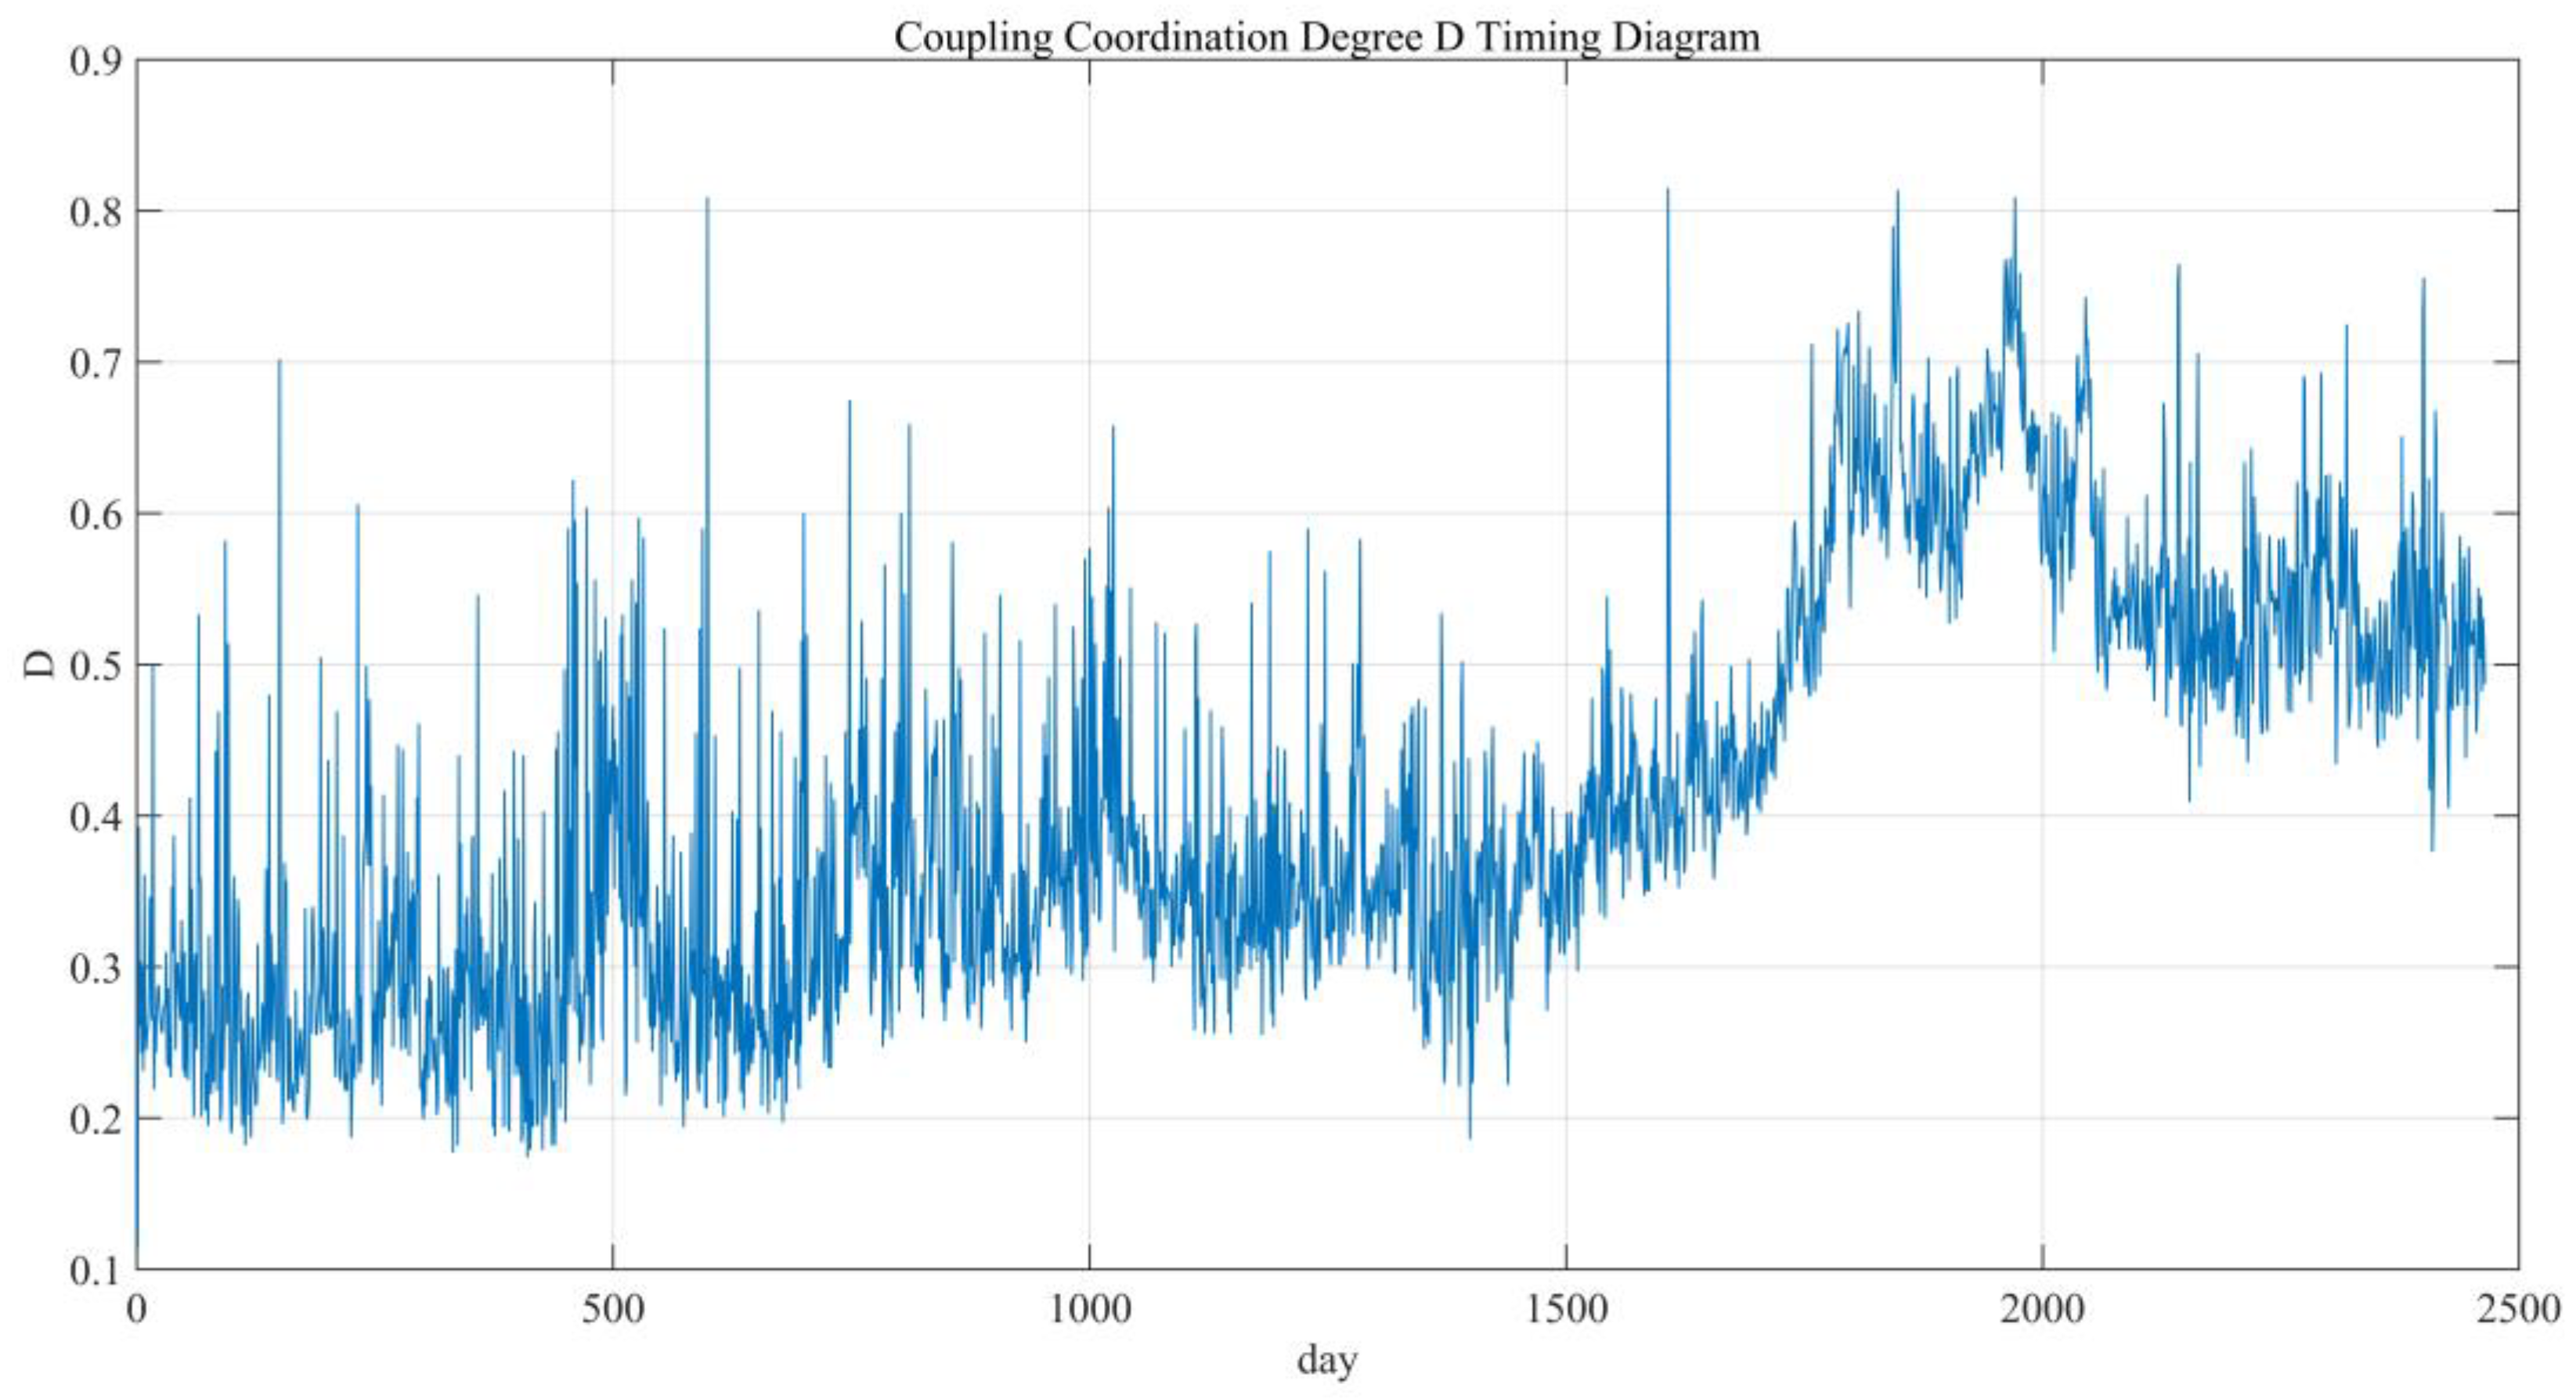
Figure 5.
A statistical analysis of the identified policy factors.
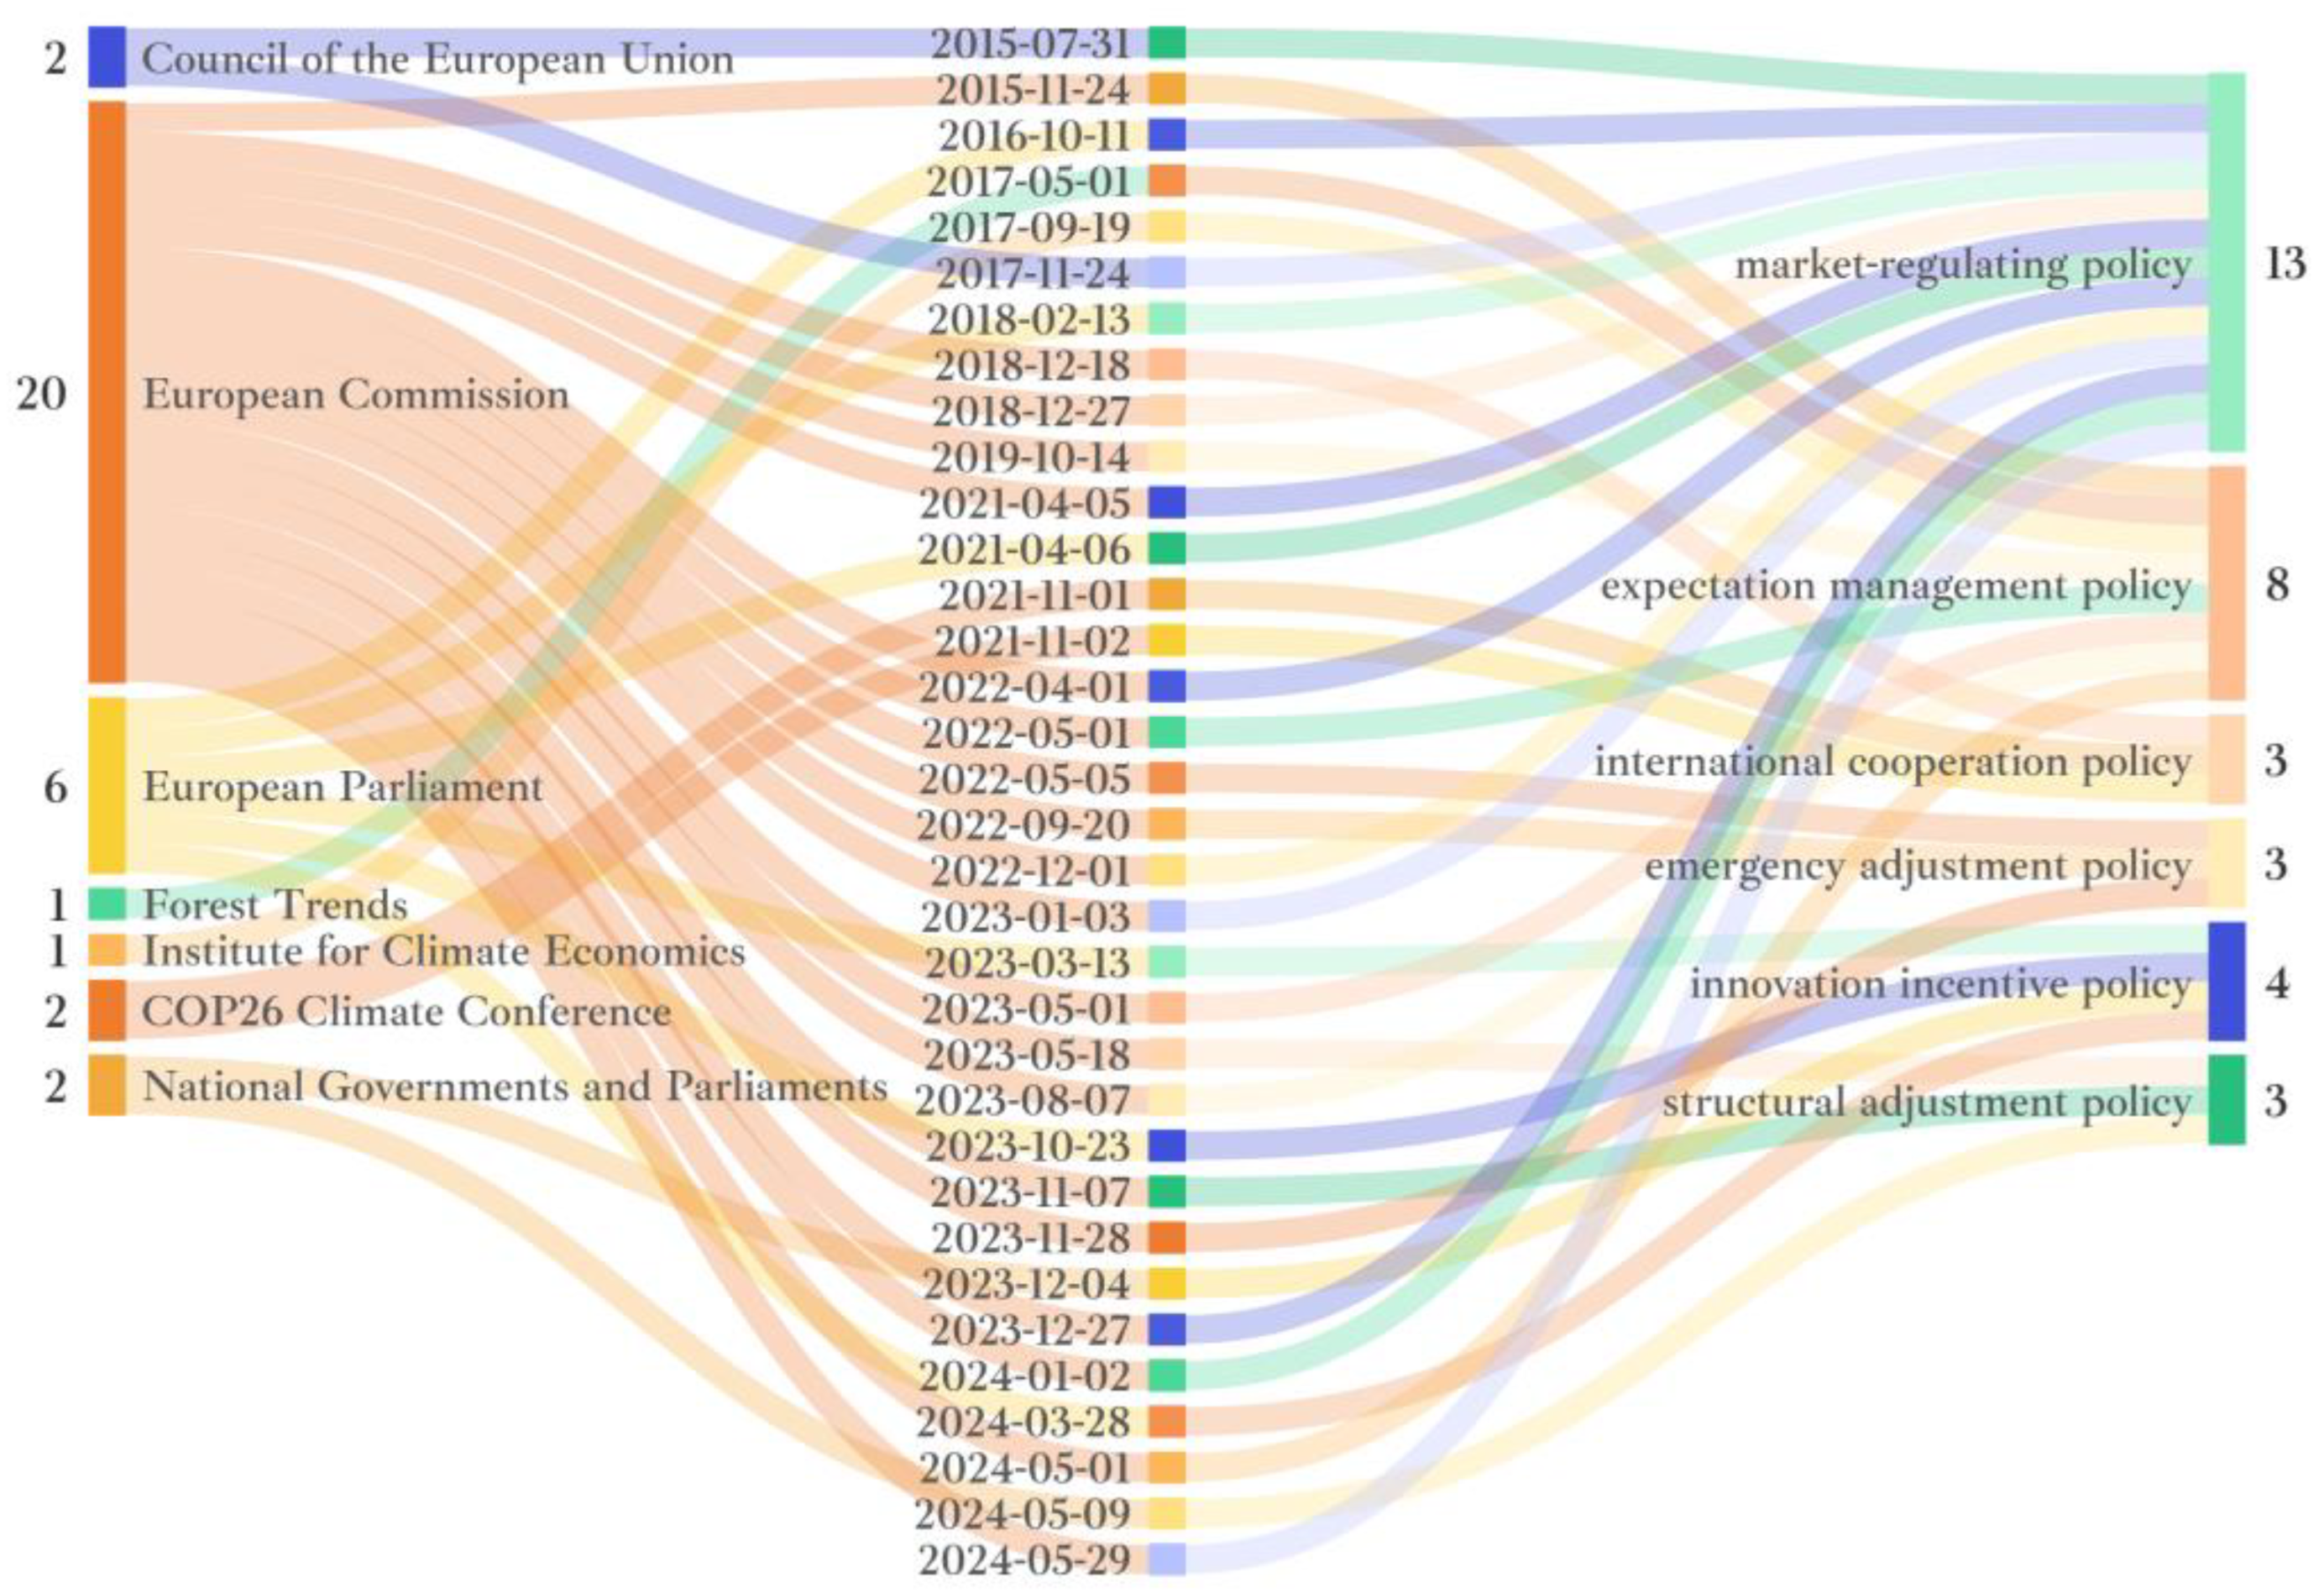

Table 2.
Policy categories and their brief descriptions.
| Policy factor | First-level classification | Second-level classification | Definition |
| strategic policy | market-regulating policy | Intervene directly in the market's supply-demand relationship and price signals, adjust the market's operating mechanism, and ensure the market's stability and effectiveness. | |
| expectation management policy | Formulate long-term strategies and goals, clarify policy directions, influence market players' expectations and investment decisions, and guide the market towards transformation. | ||
| structural adjustment policy | Deep-level reform of market structures and mechanisms to promote the transformation and upgrading of the energy and economic structures and achieve profound changes in the market and industry. | ||
| innovation incentive policy | Policy incentives and financial support promote the development of clean technologies and the use of renewable energy, stimulate technological innovation and industrial upgrading, and promote a green transformation of the economy. | ||
| operational policy | international cooperation policy | Address the global challenge of climate change and promote international action to reduce carbon emissions through international agreements and transnational cooperation. | |
| emergency adjustment policy | In case of emergency, temporary and targeted short-term measures should be taken to deal with sudden problems and ensure market stability and energy supply. |
Table 3.
The dates of the wave peak points and the corresponding policy factor analysis.
| Serial number | Date | D | Brief content of the policy | ||||
|---|---|---|---|---|---|---|---|
| 1 | 2015-07-31 | ↑ | ↓ | ↑ | ↑ | 0.7 | The Market Stabilization Reserve (MSR) was adopted to remove some carbon allowances and regulate the balance between market supply and demand. |
| 2 | 2015-11-24 | ↓ | ↓ | ↑ | ↓ | 0.65 | Prepare for the Paris Agreement, propose reforms to strengthen the carbon market, and anticipate and manage market changes. |
| 3 | 2016-10-11 | ↓ | ↓ | ↑ | ↑ | 0.64 | The proposed reform of the EU ETS aims to address the problems of market oversupply and low carbon prices. |
| 4 | 2017-05-01 | ↑ | ↑ | ↑ | ↑ | 0.82 | Published the report “Carbon Pricing Status and Trends 2017” to analyze the implementation of carbon pricing mechanisms around the world. |
| 5 | 2017-09-19 | ↑ | ↓ | ↑ | ↓ | 0.67 | Published the 2017 Global Carbon Pricing Overview report, which pointed out newly implemented carbon pricing mechanisms. |
| 6 | 2017-11-24 | ↑ | ↓ | ↑ | ↓ | 0.68 | An agreement was reached on reforming the EU ETS, with important adjustments to the market mechanism. |
| 7 | 2018-02-13 | ↑ | ↑ | ↑ | ↓ | 0.64 | Approve the EU ETS reform plan to enhance market flexibility and adaptability. |
| 8 | 2018-12-18 | ↓ | ↓ | ↓ | ↓ | 0.65 | A long-term strategy for EU climate and energy policy was published, emphasizing the synergies of the carbon market and the need for international cooperation. |
| 9 | 2018-12-27 | ↑ | ↓ | ↑ | ↓ | 0.69 | Release a draft climate law that sets a target of reducing emissions by at least 55% by 2030 and improves the coverage of the emissions trading system. |
| 10 | 2019-10-14 | ↑ | ↑ | ↑ | ↑ | 0.67 | Initial discussions on the European Green Deal to promote the transition to a green economy and climate goals. |
| 11 | 2021-04-05 | ↑ | ↑ | ↑ | ↑ | 0.82 | Propose follow-up reforms to the EU ETS to expand the scope of emissions trading. |
| 12 | 2021-04-06 | ↑ | ↑ | ↓ | ↓ | 0.76 | The EU Climate Law was approved, establishing a legal framework for achieving climate neutrality by 2050. |
| 13 | 2021-11-01 | ↑ | ↑ | ↑ | ↑ | 0.66 | Signing of the Global Carbon Market Cooperation Statement to discuss the need for carbon market cooperation. |
| 14 | 2021-11-02 | ↑ | ↓ | ↓ | ↑ | 0.73 | Initiate capacity-building projects in the carbon market, provide technical assistance and financial support, and help developing countries participate in the international carbon market. |
| 15 | 2022-04-01 | ↓ | ↑ | ↓ | ↑ | 0.66 | Proposals for reform of the carbon market were released, emphasizing market stability and transparency. |
| 16 | 2022-05-01 | ↑ | ↑ | ↑ | ↑ | 0.65 | Publish annual environmental reports to assess the operation and future prospects of the carbon market. |
| 17 | 2022-05-05 | ↓ | ↓ | ↓ | ↑ | 0.60 | The REPowerEU initiative was launched to reduce dependence on Russian energy and develop renewable energy sources. |
| 18 | 2022-09-20 | ↓ | ↑ | ↑ | ↓ | 0.60 | Propose urgent energy measures to deal with the energy crisis. |
| 19 | 2022-12-01 | ↑ | ↓ | ↓ | ↑ | 0.62 | The latest EU ETS report was released, highlighting future carbon emission targets and their market impact. |
| 20 | 2023-01-03 | ↑ | ↓ | ↓ | ↓ | 0.61 | Publish a climate policy work plan for 2023 and commit to future emission reduction measures. |
| 21 | 2023-03-13 | ↑ | ↓ | ↓ | ↓ | 0.63 | Discuss the link between green bonds and the carbon market to encourage the development of low-carbon technologies. |
| 22 | 2023-05-01 | ↑ | ↑ | ↑ | ↑ | 0.78 | A report on the future development strategy of the carbon market was released, emphasizing the goal of achieving emission neutrality before 2030. |
| 23 | 2023-05-18 | ↑ | ↓ | ↑ | ↑ | 0.65 | Discuss enhancing the interoperability of cross-border carbon transactions and promoting market integration. |
| 24 | 2023-08-07 | ↑ | ↓ | ↑ | ↑ | 0.62 | Publish a carbon market integration report and make recommendations for optimizing the carbon pricing mechanism. |
| 25 | 2023-10-23 | ↓ | ↓ | ↓ | ↑ | 0.63 | Encourage the development of low-carbon technologies through programs that support renewable energy technologies. |
| 26 | 2023-11-07 | ↑ | ↓ | ↓ | ↓ | 0.62 | A draft policy for the standardization of cross-border carbon trading has been launched to promote market integration. |
| 27 | 2023-11-28 | ↑ | ↑ | ↑ | ↓ | 0.61 | Extend emergency energy measures to deal with the impact of the Russia-Ukraine conflict. |
| 28 | 2023-12-04 | ↑ | ↑ | ↓ | ↓ | 0.60 | Discuss a carbon neutral policy framework and increase investment in green infrastructure. |
| 29 | 2023-12-27 | ↑ | ↓ | ↓ | ↑ | 0.65 | Publish annual environmental and climate change reports, assessing the performance of the carbon market and recommendations for reform. |
| 30 | 2024-01-02 | ↑ | ↓ | ↓ | ↑ | 0.61 | Release the 2024 Climate Policy Framework, which sets out the priorities for carbon market reform. |
| 31 | 2024-03-28 | ↓ | ↓ | ↑ | ↓ | 0.65 | Discuss future emission reduction targets and make recommendations to enhance the integration of international carbon markets. |
| 32 | 2024-05-01 | ↓ | ↑ | ↓ | ↑ | 0.78 | A report on the future development strategy of the carbon market was released, emphasizing the goal of achieving emission neutrality before 2030. |
| 33 | 2024-05-09 | ↑ | ↑ | ↑ | ↓ | 0.62 | Discuss a green bond policy framework to support renewable energy projects. |
| 34 | 2024-05-29 | ↓ | ↑ | ↓ | ↑ | 0.64 | Publish annual environmental and climate change reports, and assess the operation of the carbon market and reform proposals. |
Table 1.
Coupling coordination evaluation criteria.
| Coupling coordination value range |
Coordination level | Degree of coupling and coordination |
|---|---|---|
| 1 | extreme imbalance | |
| 2 | severe imbalance | |
| 3 | moderate disorder | |
| 4 | mild disorder | |
| 5 | on the verge of collapse | |
| 6 | barely dysfunctional | |
| 7 | primary coordination | |
| 8 | intermediate coordination | |
| 9 | well-coordinated | |
| 10 | high-quality coordination |
Disclaimer/Publisher’s Note: The statements, opinions and data contained in all publications are solely those of the individual author(s) and contributor(s) and not of MDPI and/or the editor(s). MDPI and/or the editor(s) disclaim responsibility for any injury to people or property resulting from any ideas, methods, instructions or products referred to in the content. |
© 2024 by the authors. Licensee MDPI, Basel, Switzerland. This article is an open access article distributed under the terms and conditions of the Creative Commons Attribution (CC BY) license (http://creativecommons.org/licenses/by/4.0/).
Copyright: This open access article is published under a Creative Commons CC BY 4.0 license, which permit the free download, distribution, and reuse, provided that the author and preprint are cited in any reuse.


