Submitted:
20 March 2025
Posted:
21 March 2025
You are already at the latest version
Abstract
This paper studies the emission reduction effects of carbon trading policies based on synergistic mechanisms from market-oriented incentives, cost pressure, technological innovation motivation, and energy consumption structure optimization. Using provincial panel data from 2002 to 2021 in China, it specifies a multi-period Difference-in-Differences (DID) model to evaluate the effects of carbon trading policies on carbon reduction. In addition, it develops a mediation effect model to check the specific impact mechanism of the carbon trading policies. The results indicate that carbon trading policy has a significant effect on carbon emission reduction within pilot regions, especially contrasted without such policies. Moreover, regarding the operational mechanism, the carbon trading policy achieves carbon emission reduction mainly through market-oriented incentives and optimization of the energy consumption structure. However, the effects of promoting carbon emission reduction through cost pressure and technological innovation are insignificant. In the synergistic mechanism, the greater the role of the market-oriented incentives and cost pressure, the stronger the effect of carbon trading through the optimization of energy consumption structures in promoting emission reduction. Third, the results of regional heterogeneity tests indicate that regional differences focus more on green development which leads to heterogeneous effects of the carbon trading policy in carbon emission reduction. The carbon trading policy indicates more pronounced emission reduction effects in regions with higher levels of green development attention and higher levels of green financial development.
Keywords:
carbon trading policy
; carbon emission reduction
; carbon emission intensity
; multi-period DID
; mediation effect
1. Introduction
With the escalation of global warming and the deterioration of environmental issues, green and low-carbon development has emerged as a pivotal strategy for countries worldwide to address climate change and achieve sustainable development. As the largest developing country and the biggest emitter of carbon dioxide, China has consistently prioritized climate change and implemented various measures to promote energy conservation, reduce emissions, and facilitate low-carbon transitions. Ecological civilization has garnered increasingly growing attention since the 18th National Congress of the Communist Party of China (CPC). The introduction of "carbon peaking and carbon neutrality" in 2020 as a principal objective has marked a significant strategic decision in global governance to combat climate change. The 20th National Congress of CPC has elaborated on the roadmap to achieve the goals of carbon peaking and carbon neutrality. In 2011, China formally proposed the phased establishment of a carbon market in the 12th Five-Year Plan. The Department of Climate Change of the National Development and Reform Commission (NDRC) subsequently issued the "Notice on Carbon Emission Trading Pilot Work", initiating carbon trading pilots in eight provinces and municipalities: Beijing, Tianjin, Shanghai, Chongqing, Guangdong, Hubei, Shenzhen, and Fujian. These pilots marked the beginning of China’s exploration of carbon market construction. Since the launch of the carbon trading pilot program in 2013, the market in the pilot regions has grown in scale, with increasing volumes and turnovers. The establishment of a carbon emissions trading market represents a crucial institutional innovation for controlling greenhouse gas emissions and advancing green and low-carbon development [1]. In 2021, the Ministry of Ecology and Environment issued three successive documents to enhance the operational regulations of the carbon market. In addition, the government’s working report explicitly stated its intention to systematically advance the objectives of carbon peaking and carbon neutrality, and to promote the development of the carbon emissions trading market in an organized manner.
With further refinement of China’s policy framework, carbon trading has transitioned to a stage of comprehensive development, necessitating a continual enhancement of its emissions reduction impact. However, significant disparities exist in economic development, resource availability, and market maturity across regions. The growing contradiction between China’s economic growth and the upgrading of its industrial structure has resulted in increased energy consumption and higher total carbon emissions. This dynamic poses challenges to the establishment of the carbon trading market and the effectiveness of carbon emission reduction policies.
Therefore, this theoretical proposition requires substantial empirical support. Simultaneously, the effectiveness of carbon trading policy in mitigating emissions and the pace of regional carbon reduction rely heavily on the efficiency of the transmission channel for the emission reduction effect. This efficiency is a crucial indicator for assessing the policy’s impact and its ability to achieve the milestones for carbon peaking and neutrality. Against the backdrop of China’s robust promotion of ecological civilization and comprehensive carbon trading development, studying the emission reduction effect and mechanisms of China’s carbon trading policy holds significant theoretical and practical value.
The previous studies have investigated the impacts of carbon trading policy from three various perspectives: the impact of carbon trading policy, research methodologies employed, and evaluations of carbon trading policy system designs. Scholars have primarily focused on studying the impact of carbon trading policy from various perspectives such as governmental support [2], cost-saving effect [2], environmental effect [3], market-guiding effect [4], economic growth effect [5], incentive effect of technological innovation [6], and synergistic development effect [7].
In recent years, several studies have examined the impact of carbon trading policy on carbon emissions, particularly considering China’s substantial potential for carbon emission reduction in its carbon market [4]. These studies highlight that the implementation of carbon trading policy has significant direct and indirect effects on reducing carbon emissions [8]. The construction of the carbon trading market has a spatial dimension, leading to a spillover effect on emission reduction. This effect causes a reduction in carbon emissions of neighboring regions and promotes the development of a collaborative and low-carbon model of inter-regional cooperation [9].
Researchers have employed three main methods for studying carbon trading policies: double-difference method, synthetic control method, and simulation and modeling. The double-difference method requires consistency in the trend of carbon emissions between the experimental and control groups. However, regions often differ significantly in terms of carbon emissions and convergence rates, complicating the usage of the double-difference method to effectively separate policy effects from other influencing factors. To address this issue, Heckman [10] extended the traditional difference-in-difference (DID) method to PSM-DID. Despite its widespread usage, the PSM-DID tends to perform more accurately with large-scale samples. Given that the carbon trading pilot policies involve only eight provinces and cities, which falls short of the criteria for large samples, using PSM-DID to analyze all pilot provinces as a single entity may overlook important factors such as policy timing differences, supporting measures, implementation efficiency, and local implementation effects[5]. In addition, scholars have employed the synthetic control method to analyze the policy effects of carbon trading pilots [11], regional CGE simulation to study the emission reduction effects of carbon trading policies [12], and difference models to quantitatively assess the employment effects of carbon trading policies [13]. However, these simulation and modeling approaches face challenges in their design and limited applicability to real-world scenarios. Therefore, the scientific selection of evaluation methods for carbon trading policies has become a crucial issue in research.
Existing literature on carbon trading policy system design, through a comprehensive analysis of carbon trading pilot policy implementation, sectoral coverage, and system characteristics in various pilot regions, has identified a lack of synergy between carbon trading policies and energy and climate policies [14]. Moreover, it highlights legal and regulatory loopholes in the design of carbon trading systems, resulting in lax penalties for violations, as well as insufficient policy innovation during implementation [15]. Furthermore, regional differences in economic development, ecological environment, resource endowment, industrial structure, technological progress, and energy consumption contribute to varying effects of carbon trading policy implementation across regions [1,5,8]. Due to the evident regional heterogeneity in the implementation effects of carbon trading policies, future policy formulation should focus on improving coordination and synergy with energy conservation policies such as total energy control targets and renewable energy subsidies [16]. This improvement requires steady promotion of the carbon market and market space, based on strengthened legislation and top-level design. Furthermore, policymakers should consider the differences in carbon emissions across regions, paying attention to the linkage mechanisms of carbon emissions trading systems between regions to promote regional green development.
Despite their valuable findings, the previous studies have many shortcomings. First, most mediation effect tests focus on governmental support, R&D inputs, green technological innovations, total energy consumption, and economic growth as influencing mechanisms, lacking integration and analysis of interactions and synergies among these mechanisms. Second, the traditional DID model, commonly used in research methodology, often fails to fully consider the time differences and stage characteristics of implementing the carbon trading policies in pilot provinces and cities. Third, the heterogeneity analysis on the differences in emission reduction effects of carbon trading policies mainly considers the division of eastern, central, and western regions, overlooking the heterogeneity in the level of regional green financial development. To fill in this gap, studies should consider the role of green finance in promoting carbon trading policies and realizing emission reduction effects by guiding resource allocation processes.
This research has major contributions. First, in terms of the impact mechanism, this paper integrates existing research to construct a theoretical mechanism framework of carbon trading policy for carbon emission reduction based on four dimensions: market-oriented incentive effect, cost pressure effect, technological innovation power effect, and optimization of the energy consumption structure. Moreover, it tests the synergies between 1) market-oriented incentive effect and energy consumption structure optimization, 2) technological innovation momentum and energy consumption structure, and 3) cost pressure and energy consumption structure optimization.
Second, it employs the multi-period DID model to empirically demonstrate the carbon emission reduction effect of carbon trading policies. It uses the PSM-DID model to reflect the temporal inconsistency of implementing the carbon trading pilots. These methods analyze the successive implementation of carbon trading policies in eight provinces and cities in China as a quasi-natural experiment, using the panel data of 30 provinces in China (excluding Tibet and Hong Kong, Macao, and Taiwan) from 2002 to 2021.
Third, in the analysis of heterogeneity, this paper considers two dimensions: the level of green finance and green development. It considers the differences in the level of green financial development, revealing the heterogeneous effects of carbon trading policy on carbon emission reduction. It reflects the synergistic effect of carbon emissions trading and green financial development. The research on carbon trading policy has implications for expanding green financial support for low-carbon development.
2. Material and Method
2.1. Impact of Carbon Trading Policies on Carbon Emissions
Carbon trading policy serves as a top-down signal, thereby incentivizing the widespread adoption of the low-carbon development concept. Consequently, this has led to green enterprises and industries experiencing positive expectations, garnering increased market attention and support, and intensifying their focus on technology research and development. China has been conducting carbon trading pilots in a number of provinces and cities since 2011, and carbon emissions in the pilot areas have significantly declined. With the expansion of the scope of the pilots and the gradual inclusion of industries, the carbon trading policy is set to play a more significant role in controlling carbon emissions nationwide. The carbon trading policy gives carbon dioxide a commodity attribute through market means to incentivize enterprises to reduce greenhouse gas emissions. Enterprises can make decisions whether to reduce emissions or purchase emission rights based on their own emission reduction costs and the market price of carbon, thus optimizing the allocation of resources. This mechanism helps to minimize the total cost of emission reduction on a society-wide basis and achieve the overall emission reduction target. In addition, the carbon trading policy internalizes the cost of carbon emissions, elevating the production costs of high-emission enterprises, thus incentivizing these enterprises to adopt more environmentally friendly production methods and technological improvements to reduce carbon emissions. In recent years, the Chinese Government has continued to improve the policy support system for the carbon trading market, including regulations for quota allocation, monitoring and verification, and trading rules. These measures have helped to improve the transparency and fairness of the carbon market and safeguard the healthy operation of the market, thereby promoting emission reduction more efficiently. Based on the above analysis, hypothesis 1 is proposed:
Hypothesis 1: Carbon trading policy can reduce carbon emissions.
2.2. Mechanistic Analysis of the Impact of Carbon Trading Policies on Carbon Emissions
In the realm of green finance, carbon trading policy endows carbon dioxide emission rights with a commodity attribute, addressing carbon emissions through market mechanisms. The policy is implemented based on the initial allocation of carbon emission rights, allowing these rights to be traded in the carbon trading market. This process promotes effective coordination and rational allocation of carbon emission rights among enterprises [17]. Fig Figure 1 illustrates the carbon emission reduction mechanism of carbon emissions trading. Based on Fig Figure 1, this paper analyzes the influence mechanism of carbon trading policy on carbon emission reduction through four aspects: market-oriented incentive effect, cost pressure effect, technological innovation power effect, and optimization of energy consumption structure. It also discusses the synergistic structural effects of the market-oriented incentive, optimization of energy consumption structure, technological innovation power, energy consumption, and cost pressure.
Firstly, the market-oriented incentive effect of carbon trading policy is highlighted. This policy establishes a market mechanism centered on carbon emissions trading, leveraging the market’s decisive role to facilitate carbon emissions allocation. Yang et al (2020) [18] demonstrated that from a market-oriented perspective, carbon emissions trading policies can effectively reduce carbon emissions in China’s pilot areas. The market-oriented nature of carbon trading policy injects new energy and vitality into enterprises, thereby leads to a significant reduction in their carbon emission intensity [19,20]. Polluting enterprises can purchase excess carbon emissions sold through the carbon market when they emit carbon dioxide exceeding their allocated quotas. This mechanism enables market-oriented control of carbon emission levels for polluting enterprises [21]. Based on the above analysis, hypothesis 2.a is proposed:
Hypothesis 2.a: Carbon trading policy promotes carbon emission reduction through market-oriented incentive effects.
Secondly, the cost pressure effect is significant. The carbon market internalizes environmental externalities, imposing compliance costs on enterprises. High-carbon enterprises seeking to expand their production should purchase additional emission rights from the carbon trading market if their CO2 emissions exceed the required quota [2]. Confronted with these costly emissions, high-carbon enterprises should carefully weigh their options in light of increased costs and take effective measures to reduce carbon emissions [22]. Based on the above analysis, hypothesis 2.b is proposed:
Hypothesis 2.b: Carbon trading policy promotes carbon emission reduction through cost pressure effect.
Thirdly, the technological innovation power effect is notable. Carbon trading policy significantly enhances the level of technological innovation and green technology innovation in pilot cities [23]. The profit-inducing effect incentivizes low-carbon-emitting enterprises to adopt advanced production technologies and cleaner processes, further reducing carbon emissions [2]. Enterprises can earn additional revenue by selling carbon emission rights, encouraging them to prioritize resource allocation for developing low-carbon technologies [24]. This mechanism promotes green development through the adoption of emission reduction technologies [25]. Based on the above analysis, hypothesis 2.c is proposed:
Hypothesis 2.c: Carbon trading policy promotes carbon emission reduction through technological innovation power effect.
Fourthly, optimizing the energy consumption structure is crucial for effectively reducing carbon emissions [26]. On the consumption side, the implementation of carbon trading policy guides the adoption of green consumption concepts. Enterprises tend to use non-fossil and low-carbon energy sources [26], thereby promoting a clean and low-carbon energy consumption structure and reducing carbon emissions. On the production side, the carbon trading market has a crowding-out effect on high-carbon industries, incentivizing enterprises to expedite the upgrading of carbon-emitting equipment and technology. This leads to an improvement in the energy consumption structure and a reduction in carbon emissions [27]. Moreover, the carbon trading market pilot policy serves as a financial guide, directing funds toward green and low-carbon industries. This increases clean energy production, optimizes the energy consumption structure, and achieves carbon emission reduction [28]. Based on the above analysis, Hypothesis 2.d is proposed:
Hypothesis 2.d: Carbon trading policy promotes carbon emission reduction by optimizing the energy consumption structure.
Fifthly, the synergistic mechanisms are observed between the market-oriented incentive effect, technological innovation motivation effect, cost pressure effect, and optimization of energy consumption structure. Optimizing the energy consumption structure can effectively reduce carbon emissions, and synergistically influence the other three aspects [29]. Regarding the synergies between the market-oriented incentive effect and the optimization of energy consumption structure, under the market-oriented effect of carbon trading, high-carbon enterprises are incentivized to optimize their energy consumption structure to control carbon emissions [27]. This optimization can result from the motivation to save money by purchasing fewer carbon allowances or to profit by selling excess carbon allowances. Regarding the synergy between the cost pressure effect and optimization of energy consumption structure, the high-cost pressure generated by carbon trading drives high-carbon enterprises to optimize their energy consumption structure, achieving carbon emission reduction [30]. This optimization helps reduce expenditures on purchasing carbon quotas and environmental protection taxes. Regarding the synergy between technological innovation motivation and energy consumption structure, the intrinsic motivation generated by carbon trading drives enterprises to innovate technologically [31]. This innovation, in turn, motivates enterprises to optimize their energy consumption structure, leading to reduced carbon emissions. Based on the above analysis, hypothesis 3.a, 3.b, and 3.c is proposed:
Hypothesis 3.a: Carbon trading policy promotes carbon emission reduction by the synergistic mechanism optimizing of the energy consumption structure and market-oriented incentives.
Hypothesis 3.b: Carbon trading policy promotes carbon emission reduction by the synergistic mechanism of optimizing the energy consumption structure and technological innovation incentives.
Hypothesis 3.c: Carbon trading policy promotes carbon emission reduction by the synergistic mechanism of optimizing the energy consumption structure and cost pressures.
Carbon trading policy promotes low-carbon development through technological innovation and market-oriented incentives. It restricts the development of high-carbon industries through cost pressure and optimization of energy consumption structures. This policy promotes green transformation to achieve the dual goals of economic growth and environmental protection.
2.3. Heterogeneity Analysis of Carbon Emission Reduction Effects of Carbon Trading Policies
The local government decision-makers can play a crucial role in promoting green development. Under the assumption of limited rationality, the government’s attention is a limited and scarce resource, and the degree of focus affects its decision-making behavior. The government’s attention to green development refers to its concentration on areas related to green development, such as green production, green ecology, and green institutions, as reflected in government work reports. The measurement of attention to green development is based on the method of Niuqin et al [32], which uses textual analysis to extract keywords related to "green development" from government work reports of each province. The total statistical keyword word frequency indicators are as follows: development concept: low-carbon economy, circular economy, green economy, ecological civilization demonstration zone, eco-city; green production: high energy consumption, energy conservation and emission reduction, water-saving irrigation, industrial water conservation, green manufacturing, consumption reduction, agricultural surface pollution; green life: domestic waste, green consumption, green travel, toilet revolution; green ecology: mountain and forest restoration, tree planting and afforestation, water conservation, green water and green mountains; system construction: joint prevention and control, local legislation, public participation, environmental regulatory mechanism, green governance. The level of attention is measured by the ratio of keyword frequency to the total number of keyword frequencies, indicating the allocation of local government’s attention to green development. Currently, Chinese local governments have different levels of attention to green development, which directly affects policy design and decision-making. A higher level of attention to green development contributes to the effective implementation of carbon trading policy and promotes carbon emission reduction. However, in provinces with a higher level of attention, the government’s focus may lead to a crowding-out effect, weakening the marketization effect and substituting for the effect of carbon trading policy. This variation in attention affects the implementation strength and effects of carbon trading policy, leading to differing levels of carbon emission reduction across regions. Based on the above analysis, hypothesis 4.a is proposed:
Hypothesis 4.a: The impact of carbon trading policies on carbon emission reduction is heterogeneous due to the differences in the attention to green development of each local government.
Green finance, characterized by financial innovation and environmental regulation, optimizes the allocation of financial resources by directing funds to green and low-carbon areas. This regulation promotes resource efficiency, supports green development, and facilitates low-carbon industrial transformation, thus balancing economic growth with environmental protection. The level of green financial development is measured using the method of Jing & Liu [33], which employs the entropy value method to calculate the green financial index. Green finance utilizes tools like green credit and green bonds to guide funds within the financial system toward green and low-carbon industries. This approach attracts social capital to green sectors, ensuring their continuous development and growth. Additionally, green finance supervises fund usage and the production processes of enterprises and industries. This supervision strengthens oversight of fund users to ensure that environmental responsibilities are met. It also enhances the environmental responsibility of financial institutions, further improving emission reduction efforts [34]. Currently, the level of green finance development varies across regions in China, leading to heterogeneity in the effectiveness of carbon trading policy in reducing emissions. Based on the above analysis, hypothesis 4.b is proposed:
Hypothesis 4.b: Due to the differences in the level of green finance development in each region, the impact of carbon trading policies on carbon emission reduction is heterogeneous.
2.4. Sample Selection and Data Sources
This paper empirically examines the carbon emission reduction effect of the implementation of carbon trading policy using panel data of 30 provinces in China (excluding Hong Kong, Macao, Taiwan and Tibet Autonomous Region) as samples. Since the data of carbon dioxide emissions are limited to be obtained after 2021, the panel data from 2002 to 2021 are selected to ensure the data completeness. It employs different sources to derive the data. The database of CSMAR is the source of carbon dioxide emissions, gross regional product (GDP), secondary industry, tertiary industry, total imports, total exports, total foreign investment, carbon trading volume, and completed investment in industrial pollution control. The China Statistical Yearbook is the source of GDP, total population at the end of the year, area of the province, and per capita education expenditure. The Wind and China Tax Yearbook is the source of the data on sewage charges among the mediating variables. This paper uses linear interpolation to match the data with individual missing data, obtaining 600 annual observations.
2.5. Model and Indicator Construction
This paper adopts a multi-period DID methodology to assess the carbon emission reduction effect in the pilot regions of the carbon emissions trading policy. According to the NDRC Notice on Carbon Emission Trading Pilot Work, China started to implement carbon emission trading pilot policy in five cities, including Shanghai, Shenzhen, Beijing, Tianjin, and Guangdong, in 2013. Then, Hubei and Chongqing began implementing the policy in 2014, and Fujian did it in 2017. This paper constructs a quasi-natural experiment with seven pilot provinces (including Shenzhen within Guangdong Province) as the experimental group and the other 23 provinces as the control group.
The traditional double-difference method uses a dummy variable to indicate the experimental group, which is determined by whether it is affected by the policy or not. If a city is a pilot city, it belongs to the experimental group. In this case, the dummy variable is equal to 1; otherwise, it is 0, and belongs to the control group. Another dummy variable T is considered based on the chronological order of policy implementation to indicate the experimental staging period. It is 0 for the time before the implementation of the policy; otherwise, it is 1. However, since the regional pilots of China’s carbon trading policy are not uniformly planned and implemented in the same year, this paper draws on the research method of Yuan Hang et al [35]. to set the control group and the experimental group prior to the implementation of the carbon trading policy as 0, and the experimental group in the year of the implementation of the carbon trading policy and after as 1. Through this method, the dummy variable is directly generated. In this method, the dummy variable was directly generated to represent the carbon trading policy. Using the dummy variable , a two-way fixed-effect model is then constructed and estimated using the double-difference estimation method. This approach allows for the examination of the net effect of the carbon trading policy on carbon emission reduction, according to Equation 1.
Where is the explanatory variable, representing the carbon dioxide emissions per capita of region i in year t in logarithmic form. is a dummy variable for carbon emissions trading pilot policy, whose coefficient reflects policy effect of carbon emissions trading pilot, signifies a set of control variables, denotes individual fixed-effect of each province, indicates time fixed-effects, and shows the random error term.
The explained variable is , the carbon dioxide emissions per capita. Following Chen & Gui [36], this research by using carbon dioxide emissions per capita to measure carbon emissions. It is equal to the ratio of carbon dioxide emissions to the population of the area.
The key explanatory variable is the dummy variable of carbon trading pilot policy, . According to the previous theoretical analysis, before is expected to be negative, that is, the carbon trading pilot policy can inhibit carbon emissions. If is significantly less than 0, the carbon trading pilot policy significantly inhibits carbon emissions.
To control other indicators of economic characteristics affecting carbon emissions, this paper introduces a series of control variables .
1) Economic development level () is the per capita GDP data of each province.
2) Industrial structure () is the ratio of the secondary industry to the regional GDP.
3) Population density () is measured by the ratio of the total population to the area of the province at the end of the year.
4) The infrastructure level () is measured by the per capita road area of each province.
5) Human capital level (), referring to Gu Xuesong et al [37], is obtained by synthesizing five indicators, namely, per capita education expenditure, number of students enrolled in higher education/total population, average years of education, R&D expenditure/GDP, and full-time equivalents of R&D personnel, by using principal component analysis.
6) Openness to the outside world (open), according to Gu Xuesong et al [37], is obtained by synthesizing three indicators, including total exports/GDP, total imports/GDP, and the amount of actual utilized foreign capital/GDP, using principal component analysis. To check the robustness of the results, this research adopts the double-cluster regression method of controlling individual and time fixed-effects.
To check the robustness of the results, this research adopts the double-cluster regression method of controlling individual and time fixed-effects. The mediating variables are as follows.
1) Market-oriented incentive effect () is measured by the amount of carbon trading in each region, reflecting the scale of the carbon trading market and the overall market situation of carbon trading in each province.
2) Cost pressure effect () is the regional environmental protection tax and industrial pollution control completed investment ratio to GDP. These two indicators measure the intensity of environmental regulation, reflecting the cost pressure borne by high-carbon enterprises under environmental regulation.
3) Technological innovation power effect () is the amount of RD input.
4) Energy consumption structure () shows the share of different energy consumption types. Among the various kinds of energies, the proportion of coal consumption in the total energy consumption has great importance since it is the main source of carbon emissions.
3. Results
3.1. Descriptive Statistics
Table 1 presents the descriptive statistics of the main variables. According to Table 1, the mean value of the of each province is 1.8, with a standard deviation of 0.729, indicating significant differences among provinces. There are notable differences between pilot provinces (experimental group) and non-pilot provinces (control group) in most indicators. The of experimental group are significantly lower than the control group, with higher levels of economic development, population density, infrastructure, human capital, and openness to the outside world.
Table 2 shows the results of the multiple covariance test and smoothness test. VIF (Variance Inflation Factor) is utilized to detect multicollinearity between independent variables in regression model. If VIF value is larger than 10, it means serious multicollinearity occurs. AD (Augmented Dickey-Fuller) test is introduced to test the smoothness of the time-series data. HT (Hausman-Taylor) test and Breitung (Breitung Test) are used to test whether the panel data are overall smooth. The test of multicollinearity for each variable in the regression model indicates that is 5.85, the only variance inflation factor greater than 5, which is much smaller than the critical value of 10. The VIF values of the remaining variables are all smaller than 5, suggesting that the model has no serious multicollinearity. Additionally, to prevent the occurrence of pseudo-regression, this paper comprehensively used the ADF, Breitung, and HT tests to assess the smoothness of each variable. Table 2 provides the results of the stationary tests and multiple covariance examinations. According to the table, the variables are stationary at level, paving the way to estimate the model without the concern of spurious regression.
3.2. Empirical Analysis and Robustness Test
This paper first estimates the direct effect of carbon trading policies on regional carbon emissions. The multi-period DID method estimates the net effect of carbon trading policies on regional carbon emissions, adopting a step-by-step approach to adding control variables. Table 3 represents the baseline regression results. All regression models control both individual fixed-effects and time fixed-effects to eliminate factors that may interfere with the impact coefficients of the core explanatory variable, i.e., carbon trading policy . This paper focuses on the core explanatory variable of carbon trading policy . The coefficient of is significant and negative in all models. Column (6) in Table 3 reflects the regression results with all control variables added, and the is -0.185, indicating that the implementation of carbon trading policy has a significant and negative impact on regional carbon emission The implementation of the policy causes the reduction of the carbon emission by 18.5%, which indicates the effective reducing effect of carbon trading policy on . Hypothesis 1 is verified.
To ensure the consistency of the multi-period double-difference estimation, it is necessary to satisfy the parallel trend assumption. This assumption states that the trend of changes in the experimental group and the control group should be the same before the implementation of the policy. Rejection of this assumption indicates that the results are biased. The parallel trend assumption implies that the of the experimental group and the control group provinces had the same trend of change before piloting the carbon trading policy. Equation 2 examined the parallel trend.
Where denotes the effect of period on regional carbon emissions before the implementation of carbon trading policy, is the effect of period on regional carbon emissions after the implementation of carbon trading policy, and signifies the effect of the current period of the implementation of carbon trading policy on regional carbon emissions. The remaining symbols are as defined previously. Figure 2 displays the parallel trend graph, according to Equation 2.
Regarding Figure 2, the regression coefficients are significant and negative trend before the implementation of the carbon trading policy, and the closer to the time of policy implementation, the more obvious the performance is, which may be influenced by the policy signal. After the implementation of the policy (point 0 on the horizontal axis), the confidence interval is consistently below the zero line and does not contain 0, satisfying the parallel trend assumption. The regression coefficient is significant and negative after the implementation of the policy, indicating that the carbon trading policy has a consistently negative impact on carbon emission.
To further ensure the robustness of the estimation results, this paper employs a placebo test. This test involves randomly selecting seven provinces from all provinces to form a new carbon trading policy pilot region as a virtual sample and simulating it 500 times. Figure 3 demonstrates the kernel density curves of the estimated values of the coefficients of the variables after repeating the simulation 500 times based on Equation 1. Based on the figure, the kernel densities of the coefficient estimates generated during the randomization process almost overlap with a positive tertiary distribution with a mean of 0. The p-values are mostly located above 0.1, and the probability of the baseline regression coefficients appearing as -0.185 is very small given the random sampling. This indicates that for the randomly generated experimental group, the suppressive effect of the carbon trading policy on is statistically insignificant. Thus, the estimation results are robust.
To further check the robustness of the results, the explanatory variables are replaced by the logarithm of total emissions by province (). Table 4 shows the results of the robustness test. Column (1) provides the results of the regression without control variables, while column (2) offers the results of the regression with all control variables included. The coefficients of the core explanatory variable are all negative and significant using the total value of emissions, indicating that the carbon trading policy consistently has a significant and inhibitory effect on carbon emissions when replacing the explanatory variables.
Considering significant differences in environmental governance and other aspects among provinces, this paper adds three new control variables including the level of development of the service industry (), environmental regulation (), and attention to green development (). The level of development of the service industry is measured by the ratio of the tertiary industry to the gross domestic product, and the environmental regulation is measured by the amount of investment in industrial pollution control. The measurement of attention to green development refers to the method of Wen Hong et al [38], which extracts 25 keywords related to "green development" from the "Work Report of the Government" of each province. It takes the ratio of the keyword frequency to the total word frequency as the ratio of the keyword frequency to the total word frequency. The attention to green development in each province is measured by the ratio of the keyword frequency to the total word frequency. Table 4 represents the results of estimating the regression with the alternative control variables. Based on Table 4 column (3)-(6), the coefficient of DID for the carbon trading policy remains negative at statistically significant. This estimation confirms the results of the regressions.
3.3. PSM-DID
As the double-difference (DID) model itself may suffer from selectivity bias, the propensity score matching – double-difference (PSM-DID) model can help overcome or reduce the "selectivity bias" introduced by this policy pilot to some extent. Therefore, this paper conducts a PSM-DID test. Through the propensity score matching method, the experimental and control groups are matched. Then, based on this matching, the difference method is applied again for regression analysis. The results shown in Table 5 demonstrate that the carbon trading policy can significantly inhibit carbon emissions.
4. Discussion
4.1. Mechanism Analysis of the Impact of Carbon Trading Policy on Carbon Emissions
This study reveals that the implementation of the carbon trading policy has a significant and inhibitory effect on carbon emissions. The mechanism analysis shows that the carbon trading policy achieves carbon emission reduction through market-oriented incentives, cost pressure effects, technological innovation power effects, and optimization of energy consumption structure. Additionally, three synergistic mechanisms contribute to more effective emission reduction: market-oriented incentives and energy consumption structure optimization synergy, technological innovation and energy consumption structure synergy, as well as cost pressures and energy consumption structure optimization synergy. This research uses the following mediating effect model to identify and verify the specific channels through which the carbon trading policy affects carbon emissions.
Where M is the mediating variable, and indicates the direct effect of carbon trading policy on the mediating variables. The mediating variables includes market-oriented incentives (), cost-pressure effect (), technological innovation motivation (), optimization of the energy consumption structure (), and the synergistic interaction between and (), and (), and (). In addition, indicates the effect of intermediary variables on after controlling carbon trading policy, and denotes the effect of carbon trading policy on after controlling intermediary variables. The remaining symbols are defined previously.
The is measured by the amount of carbon trading in each region. To address the issue of varying orders of magnitude among different variables, all variables are standardized before estimating the regression. Table 6 presents the results. Column (1) provides the baseline regression results. Column (2) offers the coefficients associated with the variable, which are positive and significant at 1% level, confirming that the carbon trading policy promotes the regional carbon trading quota. According to column (3), the carbon trading policy has significant coefficients. The absolute value of the carbon trading policy’s coefficient is larger compared to the baseline regression, suggesting that implementing the carbon trading policy can lead to carbon emission reductions. This is achieved by increasing the carbon trading quota and encouraging enterprises to convert carbon costs into benefits. Therefore, the results confirm market-oriented incentives as a mediating mechanism. Hypothesis 2.a is verified.
The is measured by two indicators: the amount of environmental protection tax () and the ratio of completed investment in industrial pollution control to the region’s GDP (). To mitigate the impact of large differences in the magnitude of various variables, logarithmic transformations and standardization are applied. According to Table 7, column (1) is the results of the benchmark regression, columns (2)-(3) are the results of testing the amount of environmental protection tax, and columns (4)-(5) are the results of measuring the ratio of the amount of completed investment in industrial pollution control to GDP. According to column (2), the coefficient is 0.028, which is statistically insignificant. Following MacKinnon et al [39], this paper used the Bootstrap method for 500 samples and obtained a 95% confidence interval of (-0.017, 0.005), which contains 0, indicating that the mediating effect of corporate cost pressure under carbon trading does not exist. Based on column (3), the effect of environmental protection tax on is not significant. Regarding columns (4) and (5), the effect of carbon trading policy on the ratio of completed investment in industrial pollution control to GDP is insignificant, but the ratio of completed investment in industrial pollution control to GDP significantly reduces , and the Bootstrap method test yields a 95% confidence interval of (-0.02, 0.02), rejecting this mediating effect. The reason for this could be that China’s environmental regulations mainly focus on emission limits and pollution control. These regulations often compel enterprises to increase spending on pollution treatment and ecological protection. However, China’s economy is predominantly driven by heavy and manufacturing industries, which face higher levels of environmental regulations and compliance costs. In the short term, these industries may struggle to offset the costs of environmental regulations through green innovation technology.
The is measured using the amount of R&D input in each region. According to Table 8, column (1) shows the results of the baseline regression. Column (2) shows that carbon trading policy has an insignificant effect on technological innovation incentives, and the result of the Bootstrap test shows a 5% significance level (-0.0074, 0.07), which contains 0. The results reject this effect. In column (3), the effect of technological innovation on is not significant. The reason may be twofold: one aspect is analyzed from the source of technological innovation input, which is insufficient power; the other reason is that in large-scale enterprises, R&D innovation plays an insignificant mediating effect. A reason is that these enterprises have a strict hierarchical decision-making structure, resulting in relatively poor communication between R&D personnel and decision-makers. Additionally, there is an insufficient innovation function and coordination ability, which reduces the efficiency of technological innovation in large-scale enterprises. Therefore, the current carbon trading policy cannot realize the carbon emission reduction of large-scale enterprises by stimulating the motivational effect of R&D innovation.
The is measured by the ratio of coal consumption to total energy consumption in each region. Column (1) of Table 9 shows the results of the baseline regression. In column (2), the coefficient before the implementation of the DID is negative and significant at 5% level, indicating that the carbon trading policy can effectively optimize the regional energy consumption structure. In column (3), the coefficients on the carbon trading policy and energy consumption structure are both significant. The absolute value of the coefficient on the carbon trading policy increases compared to the baseline regression results, which further indicates the role of the carbon trading policy in achieving carbon emission reduction by optimizing the energy consumption structure. Therefore, these results prove the mediating mechanism of optimizing the energy consumption structure. Hypothesis 2.d is verified.
4.2. Synergies of Mechanisms
The synergy between the market-oriented incentive effect and optimization of energy consumption structure is measured by the product of the carbon trading quota of each region and the ratio of coal consumption to total energy consumption of each region (). The synergy between technological innovation motivation and optimization of energy consumption structure is measured by the product of the amount of RD inputs and the ratio of coal consumption to total energy consumption of each region (). The cost pressure effect and energy consumption structure synergy are measured by the logarithm of the amount of environmental protection tax in each region and the ratio of the amount of coal consumption in each region to the total energy consumption (). To eliminate the effect of excessive order of magnitude differences in different variables, all variables were standardized before estimating the regressions.
Table 10 represents the results. Column (1) lists the results of the baseline regression, columns (2)-(3) report the results of the test, columns (4)-(5) show the estimation of the test, and columns (6)-(7) report the results of the test. According to columns (2) and (3), the coefficients are significant. Compared with the baseline regression results, the absolute value of the coefficients increases because of the synergistic effect of the market-oriented incentive effect and the optimization of the energy consumption structure. This result suggests that the greater the market-oriented effect generated by carbon trading, the higher the effect of carbon trading on carbon emission reduction through the optimization of the energy consumption structure. Hypothesis 3.a is verified. Similarly, columns (6)-(7) show that if the effect of cost pressure generated by carbon trading is greater, then the effect of carbon trading in promoting carbon emission reduction through optimizing the energy consumption structure is higher. Hypothesis 3.c is verified. According to columns (4)-(5), the effect of the carbon trading policy on the indicator is insignificant. The Bootstrap test shows that the 95% confidence interval is (-0.0138, 0.013). These results reject the mediating effect of the test, possibly because China is dominated by heavy industry and manufacturing, insufficient incentive exists for technological innovation generated by the carbon trading market, and the technological innovation generated by the carbon trading market is insufficient to optimize the energy structure. Thus, it cannot promote carbon emission reduction in the short term through the usage of green innovation technology to optimize the energy structure. Based on column (5), the synergistic effect of technological innovation and energy consumption structure optimization has a direct effect on promoting carbon emission reduction. The absolute value of the coefficient is higher than that of the benchmark regression. Therefore, enterprises can promote carbon emission reduction by advancing technological innovation and optimizing energy consumption structure simultaneously.
4.3. Heterogeneity Analysis of Carbon Emission Reduction Effects of Carbon Trading Policies
Columns (1) and (2) in Table 11 reflect the regression results of the impact of carbon trading policies on carbon emissions based on the heterogeneity of green development attention across the country. The absolute values of the pre-DID coefficients for the group of provinces with higher levels of green development attention are larger than those for the provinces with lower levels of green development attention, yet the disparity is relatively small. Columns (3) and (4) reflect the regression results of the impact of carbon trading policies on carbon emissions based on the heterogeneity of green development attention in the pilot provinces. For the pilot provinces with a higher level of attention to green development, the impact of carbon trading policies on carbon emissions is negative and statistically significant. In contrast, for the pilot provinces with a lower level of attention to green development, the impact of carbon trading policies on carbon emissions is positive and statistically significant. Hypothesis 4.a is verified.
The regression results indicate that the emission reduction effect of carbon trading policies is significantly greater in provinces with higher levels of green development attention than in those with lower levels. Regarding the pilot areas, the carbon trading policy significantly suppressed in provinces with a higher level of attention to green development. In contrast, was enhanced in provinces with a lower level of attention to green development. This indicates that improving the local government’s attention to green development contributes to the effective implementation of the carbon emission reduction effect of the carbon trading policy. Therefore, in the future, it is important to enhance the transformation of green development attention into action. Additionally, promoting the sustainable optimal allocation of green development attention in pilot provinces can further enhance regional green development.
Green finance serves as a financial tool that directs investment into green products and low-carbon projects, thereby facilitating regional reduction of carbon emissions. In Table 11, columns (5) and (6) show the regression results of the pilot regions grouped by the level of green finance development. Column (5) represents the pilot provinces with a green finance index higher than the median, and column (6) shows the pilot provinces with a green finance index lower than the median. The results show that for the pilot provinces with higher green financial index, the coefficient of DID is negative and statistically significant, indicating that the carbon trading policy significantly reduces the . However, for the pilot provinces with lower green financial index, it plays an insignificant role, indicating that a higher level of green financial development can enhance the implementation of the carbon trading policy and thus achieve greater emission reductions. Hypothesis 4.b is verified. In addition, it shows that each region should strengthen and promote the development of green finance. Green finance broadens the financing channels of energy-saving and emission reduction green projects through innovative financial products such as green credit, green bonds, green investment, green securities, and energy-efficiency credit. It leads to the realization of the incentive and constraint effects of alleviating the financing constraints of the green industry, increasing the debt financing costs of heavily polluting enterprises. In addition, it realizes the optimal allocation of resources, and promotes the innovation of green and low-carbon technology, thus improving the total factor productivity and driving the carbon trading policy to play a stronger role in emission reduction.
5. Conclusions
5.1. Research Findings
Based on China’s inter-provincial panel data from 2002 to 2021, this paper assesses the carbon emission reduction effects of carbon trading policy pilots using the multi-period DID method and a mediation effect model. The model is based on four types of channels: market-oriented incentives, cost pressure effect, technological innovation power effect, and energy consumption structure optimization. It also considers the synergistic effects between market-oriented incentives and energy consumption structure optimization, between technological innovation and energy consumption structure, and between cost pressure and energy consumption structure optimization. These synergistic mechanisms are used to test the transmission pathways of the carbon emission reduction effects of the carbon trading policy and analyze the impact pathways through which the carbon trading policy influences carbon dioxide emissions per capita. The study has the following findings.
1. Overall, carbon trading policy has an obvious effect on reducing carbon emissions. Compared with non-pilot regions, the carbon trading policy in pilot regions facilitates a reduction in carbon dioxide emissions per capita, resulting in a significant decrease in overall emissions.
2. In terms of the mechanism of action, the carbon trading policy achieves carbon emission reduction through market-oriented incentives and optimization of energy consumption structure. However, the mechanisms of cost pressure and technological innovation motivation are found to be insignificant. under the synergistic mechanism. If carbon trading generates larger market-oriented effects and cost pressures, then its role in promoting carbon emission reduction through the optimization of energy consumption structures is more pronounced.
3. At the level of green development heterogeneity, regional differences in green development attention and green financial development level also make the carbon emission reduction effects of carbon trading policy heterogeneous. Furthermore, the carbon trading policy exhibits stronger emission reduction effects in regions characterized by high levels of green development and green financial development.
5.2. Policy Recommendations
Based on the conclusions, this paper puts forward the following policy recommendations:
1. The government should actively apply the lessons learned from the pilot programs, accelerate the development of the carbon market, and expand its coverage. Drawing on the experiences from existing pilot programs, they should establish a carbon trading platform that covers a broader range of industries and participants to promote global green development as a whole.
2. The government should leverage the incentive role of the market mechanism and accelerate the optimization of the energy structure. Carbon trading policies can achieve desired outcomes in carbon emission reduction through the optimization of energy structures and market-oriented incentives. In terms of energy structure optimization, countries, especially developing economies, should accelerate the construction of clean energy sources, such as hydropower, nuclear power, and wind power, to establish a clean and low-carbon energy consumption system. In terms of incentives, market-based means should be fully utilized to enhance the role of the market in resource allocation and promote innovation. In addition, the market incentives and cost pressures of carbon trading policies should receive more attention to benefit from a synergistic interaction with the energy structure optimization effect of carbon trading, jointly promoting carbon emission reduction.
3. Maximizing the cost pressure exerted by the carbon trading policy can compel enterprises to innovate technologically. While the cost pressure of carbon trading alone may insignificantly drive carbon emission reduction, it can be effectively utilized to stimulate technological innovation. Specifically, cost pressure should encourage high-carbon enterprises to increase their research and development investments. This investment can then serve as an internal driver for carbon emission reduction, facilitating the transition to a green and low-carbon economy.
4. The government should consider the heterogeneous impact of varying levels of attention to green development and green financial development across different regions on the emission reduction effects of carbon trading policies. This requires considering the heterogeneity in the design of carbon market elements in various countries and regions. It is essential to rationally determine the coverage of the carbon market, the total amount and allocation of quotas, and to carefully plan the intensity of policy incentives for green development.
Supplementary Materials
The following supporting information can be downloaded at the website of this paper posted on Preprints.org.
Author Contributions
The Contributions of all authors are as follows: Ping Li: Conceptualization, Data curation, Formal analysis, Investigation, Methodology, Software Visualization, Writing – original draft. Lijing Xu: Investigation, Software, Validation, Visualization. Xuesong Gu: Funding acquisition, Project administration, Resources, Supervision, Validation, Writing – review & editing Yiduo Chen: Investigation, Software, Validation, Writing – review & editing
Funding
The authors are grateful for the financial support from the National Social Science Foundation Project of China (No.23BJY079), the Research Project of the Humanity and Social Science Fund of the Ministry of Education of China (No.22YJA790015 & No.23YJA790014), National Forestry and Grassland Administration Business Entrustment Project of China (20231002), and the Fundamental Research Funds for the Central Universities in Beijing Forestry University (2023SKQ04). The financial support of all four funders listed above in this article have roles in study design, data collection and analysis, decision to publish and preparation of the manuscript. Therefore, they are listed in this manuscript.
Institutional Review Board Statement
Not applicable
Informed Consent Statement
Not applicable
Data Availability Statement
The datasets for this study can be found in the Supplementary Material named as “Panel data”.
Conflicts of Interest
The authors declare no conflicts of interest.
References
- Zhang H, Zhang Z, Sun K, Zou Y. Emission Reduction Effect, Influencing Factors and Economic Impact of China’s Carbon Market: An Empirical Test Based on a Multi-Period DID Model. Sage Open.2023,13(4), 21582440231206626.
- Wang L, Liu C, Yang X. Research on Carbon Emission Reduction Effect of China’s Carbon Trading Pilot. Advances in Social Sciences Research Journal. 2020,7(5),240-250.
- Peng H, Qi S, Cui J. The environmental and economic effects of the carbon emissions trading scheme in China: The role of alternative allowance allocation. Sustainable Production and Consumption. 2021, 28, 105–115.
- Wang D, Sun Y, Wang Y. Comparing the EU and Chinese carbon trading market operations and their spillover effects. Journal of Environmental Management. 2024, 351, 119795.
- Xu, W. The impact and influencing path of the pilot carbon emission trading market—Evidence from China. Frontiers in Environmental Science. 2021, 9, 787655. [Google Scholar] [CrossRef]
- Liu J, Liu X. Effects of carbon emission trading schemes on green technological innovation by industrial enterprises: Evidence from a quasi-natural experiment in China. Journal of Innovation & Knowledge. 2023,8(3), 100410. [CrossRef]
- Allan G, Lecca P, McGregor P, Swales K. The economic and environmental impact of a carbon tax for Scotland: A computable general equilibrium analysis. Ecological Economics 2014, 100, 40–50. [CrossRef]
- Zhang H, Duan M, Deng Z. Have China’s pilot emissions trading schemes promoted carbon emission reductions?– the evidence from industrial sub-sectors at the provincial level. Journal of Cleaner Production 2019, 234, 912–924.
- Li Z, Wang J. Spatial emission reduction effects of China’s carbon emissions trading: quasi-natural experiments and policy spillovers. Chinese Journal of Population, Resources and Environment. 2021,19(3),246-255. [CrossRef]
- Heckman J, Ichimura H, Todd P. Matching as an Econometric Evaluation Estimator: Evidence from Evaluating a Job Training Programme. The Review of Economic Studies. 1997,64(4),605-654.
- Chen X, Lin B. Towards carbon neutrality by implementing carbon emissions trading scheme: Policy evaluation in China. Policy evaluation in China. Energy Policy 2021, 157, 112510.
- Nong D, Nguyen T, Wang C, Van Khuc Q. The environmental and economic impact of the emissions trading scheme (ETS) in Vietnam. Energy Policy 2020, 140, 111362.
- Cong J, Xu T, Zhang W, Dong L, Zhao Y. Creation or crowding out? A “two-eight split” phenomenon in the employment effects of the carbon trading policy in China. Journal of Cleaner Production. 2023, 415, 137722.
- Bergh J, Castro J, Drews S, Exadaktylos F, Foramitti J, Klein F, et al. Designing an effective climate-policy mix: accounting for instrument synergy. Climate Policy. 2021,21(6),745–764. [CrossRef]
- Cao, M. A case study on China’s carbon emission trading system: experiences and recommendations. Asia Pacific Journal of Environmental Law. 2020, 23(2), 106–135. [Google Scholar]
- Duan H, Mo J, Fan Y, Wang S. Achieving China’s energy and climate policy targets in 2030 under multiple uncertainties. Energy Economics 2018, 70, 45–60. [CrossRef]
- Tang L, Wu J, Yu L, Bao Q. Carbon emissions trading scheme exploration in China: A multi-agent-based model. Energy Policy 2015, 81, 152–169.
- Yang X, Jiang P, Pan Y. Does China’s carbon emission trading policy have an employment double dividend and a Porter effect? Energy Policy 2020, 142, 111492.
- Zhang X, Zheng X. Does carbon emission trading policy induce financialization of non-financial firms? Energy Economics 2024, 131, 107316.
- Dong F, Long R, Yu B, Wang Y, Li J, Wang Y, et al. How can China allocate CO2 reduction targets at the provincial level considering both equity and efficiency? Evidence from its Copenhagen Accord pledge. Resources Conservation and Recycling 2018, 130, 31–43. [CrossRef]
- Fernández-Amador O, Francois J, Oberdabernig D, Tomberger P. Carbon dioxide emissions and economic growth: An assessment based on production and consumption emission inventories. Ecological Economics 2017, 135, 269–279.
- Wang C, Wang L, Wang W, Xiong Y, Du C. Does carbon emission trading policy promote the corporate technological innovation? Empirical evidence from China’s high-carbon industries. Journal of Cleaner Production 2023, 411, 137286.
- Feng X, Zhao Y, Yan R. Does carbon emission trading policy has emission reduction effect? —An empirical study based on quasi-natural experiment method. Journal of Environmental Management 2024, 351, 119791.
- Yu Y, Zhang N. Environmental regulation and innovation: Evidence from China. Global Environmental Change 2022, 76, 102587.
- Jing Z, Liu Z, Wang T, Zhang X. The Impact of Environmental Regulation on Green TFP: A Quasi-Natural Experiment Based on China’s Carbon Emissions Trading Pilot Policy. Energy. 2024,132357.
- Wu Q, Tambunlertchai K, Pornchaiwiseskul P. Examining the Impact and Influencing Channels of Carbon Emission Trading Pilot Markets in China. Sustainability 2021, 13(10), 5664.
- Li Z, Wang J. Spatial spillover effect of carbon emission trading on carbon emission reduction: Empirical data from pilot regions in China. Energy 2022, 251, 123906.
- Zhang W, Li J, Li G. Guo S. Emission reduction effect and carbon market efficiency of carbon emissions trading policy in China. Energy 2020, 196, 117117.
- Zha D, Jiang P, Zhang C, Xia D, Cao Y. Positive synergy or negative synergy: An assessment of the carbon emission reduction effect of renewable energy policy mixes on China’s power sector. Energy Policy 2023, 183, 113782. [CrossRef]
- Jia S, Zhu X, Gao X, Yang X. The influence of carbon emission trading on the optimization of regional energy structure. Heliyon 2024, 10(11), e31706.
- Du Z, Wang Y. Does energy-saving and emission reduction policy affects carbon reduction performance? A quasi-experimental evidence in China. Applied Energy 2022, 324, 119758.
- Niu Q, Liu C. Research on the allocation of local government attention in regional green development-Based on the text analysis of the government work report of Beijing, Tianjin and Hebei (2010-2019). Journal of China Executive Leadership Academy Yan’an.2020;13(6):98-106+136. Chinese.
- Jing R, Liu R. The impact of green finance on persistence of green innovation at firm-level: A moderating perspective based on environmental regulation intensity. Finance Research Letters 2024, 62, 105274. [CrossRef]
- Xu J, Chen F, Zhang W, Liu Y, Li T. Analysis of the Carbon Emission Reduction Effect of Fintech and the Transmission Channel of Green Finance. Finance Research Letters 2023, 56, 104127.
- Yuan H, Zhu C. Has the National High-tech Zone promoted the transformation and upgrading of China ’s industrial structure. China ’s industrial economy. 2018,(8),60-77. Chinese.
- Chen Z, Chen Z, Gui L. The impact of green finance development on carbon emissions in 253 prefecture level cities in China: a spatial econometric model test. Science and Technology Management Research. 2024,44(11),218-226. Chinese.
- Gu X, Han L. Marketization process and technology spillover effect of foreign direct investment. Research management.2018,39(6),150-158. Chinese.
- Wen H, Zhao X. The allocation of government public service attention and the choice of investment direction of public financial resources -Based on the text analysis of the government work report of six provinces in central China (2007-2012). Soft Science.2015,29(6),5-9. Chinese.
- MacKinnon D, Warsi G, Dwyer J. A simulation study of mediated effect measures. Multivariate Behavioral Research 1995, 30(1), 41–62. [CrossRef]
Figure 1.
Carbon emission reduction mechanism of carbon emission trading.
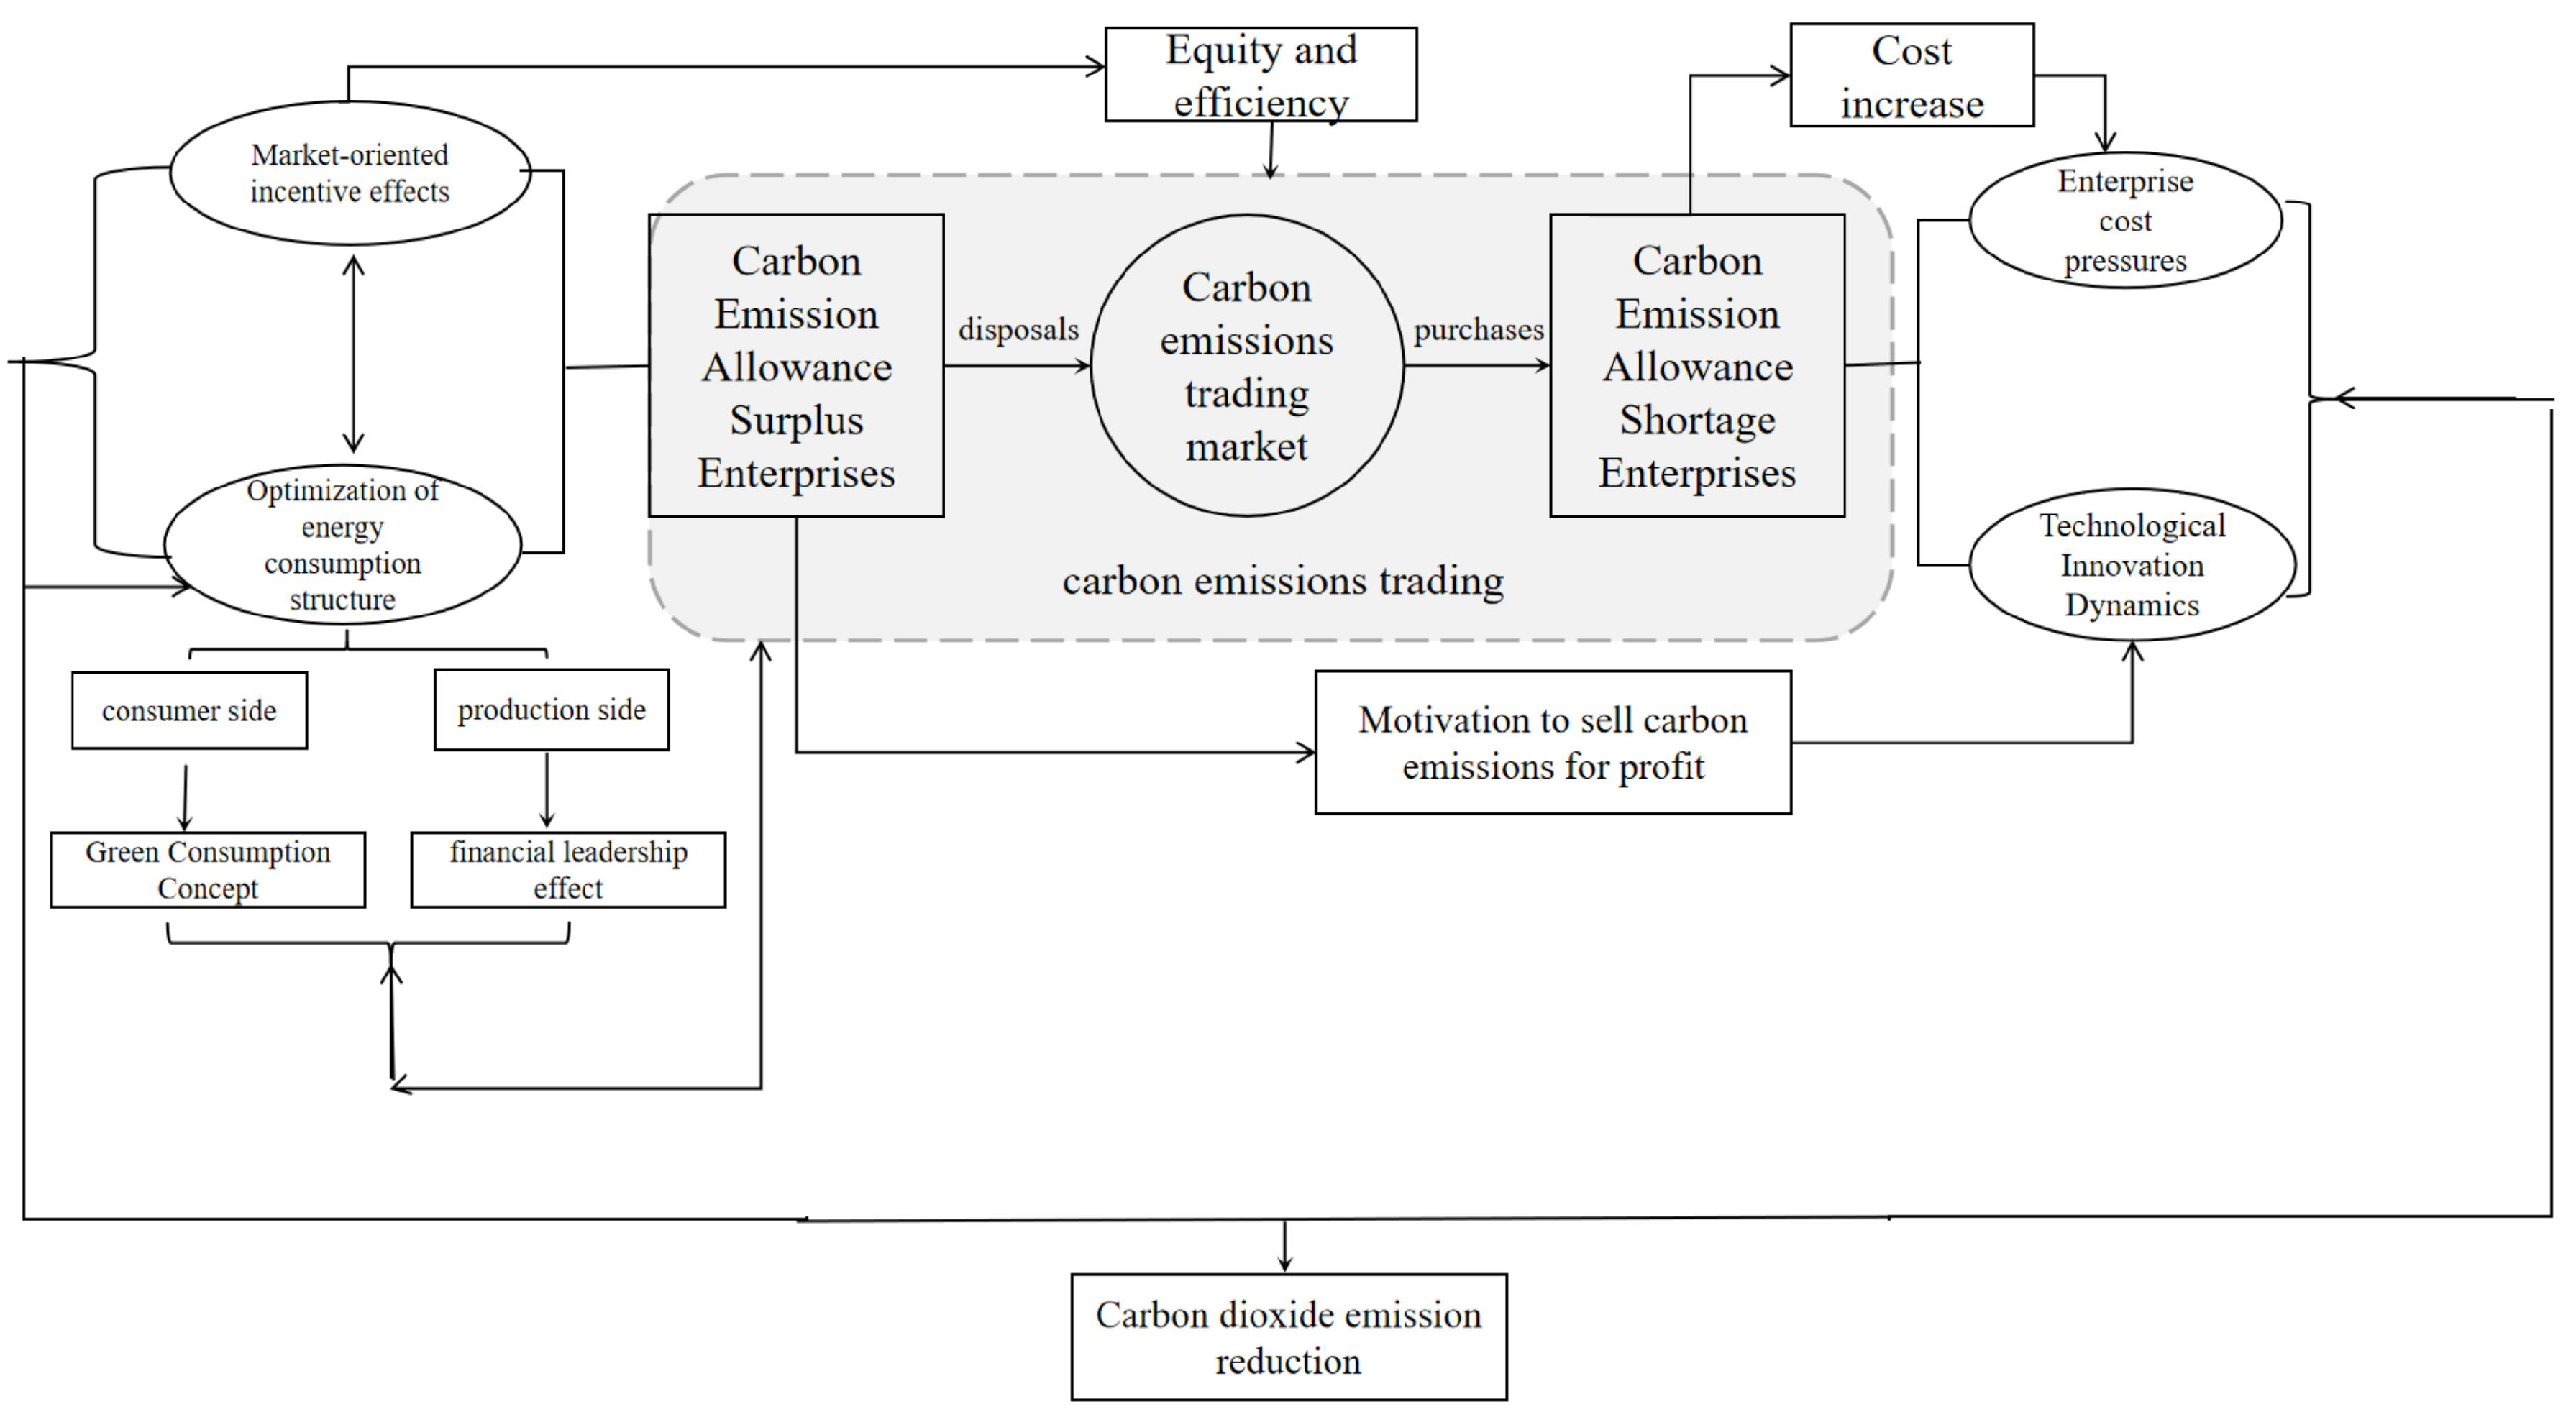
Figure 2.
Plot of parallel trend test.
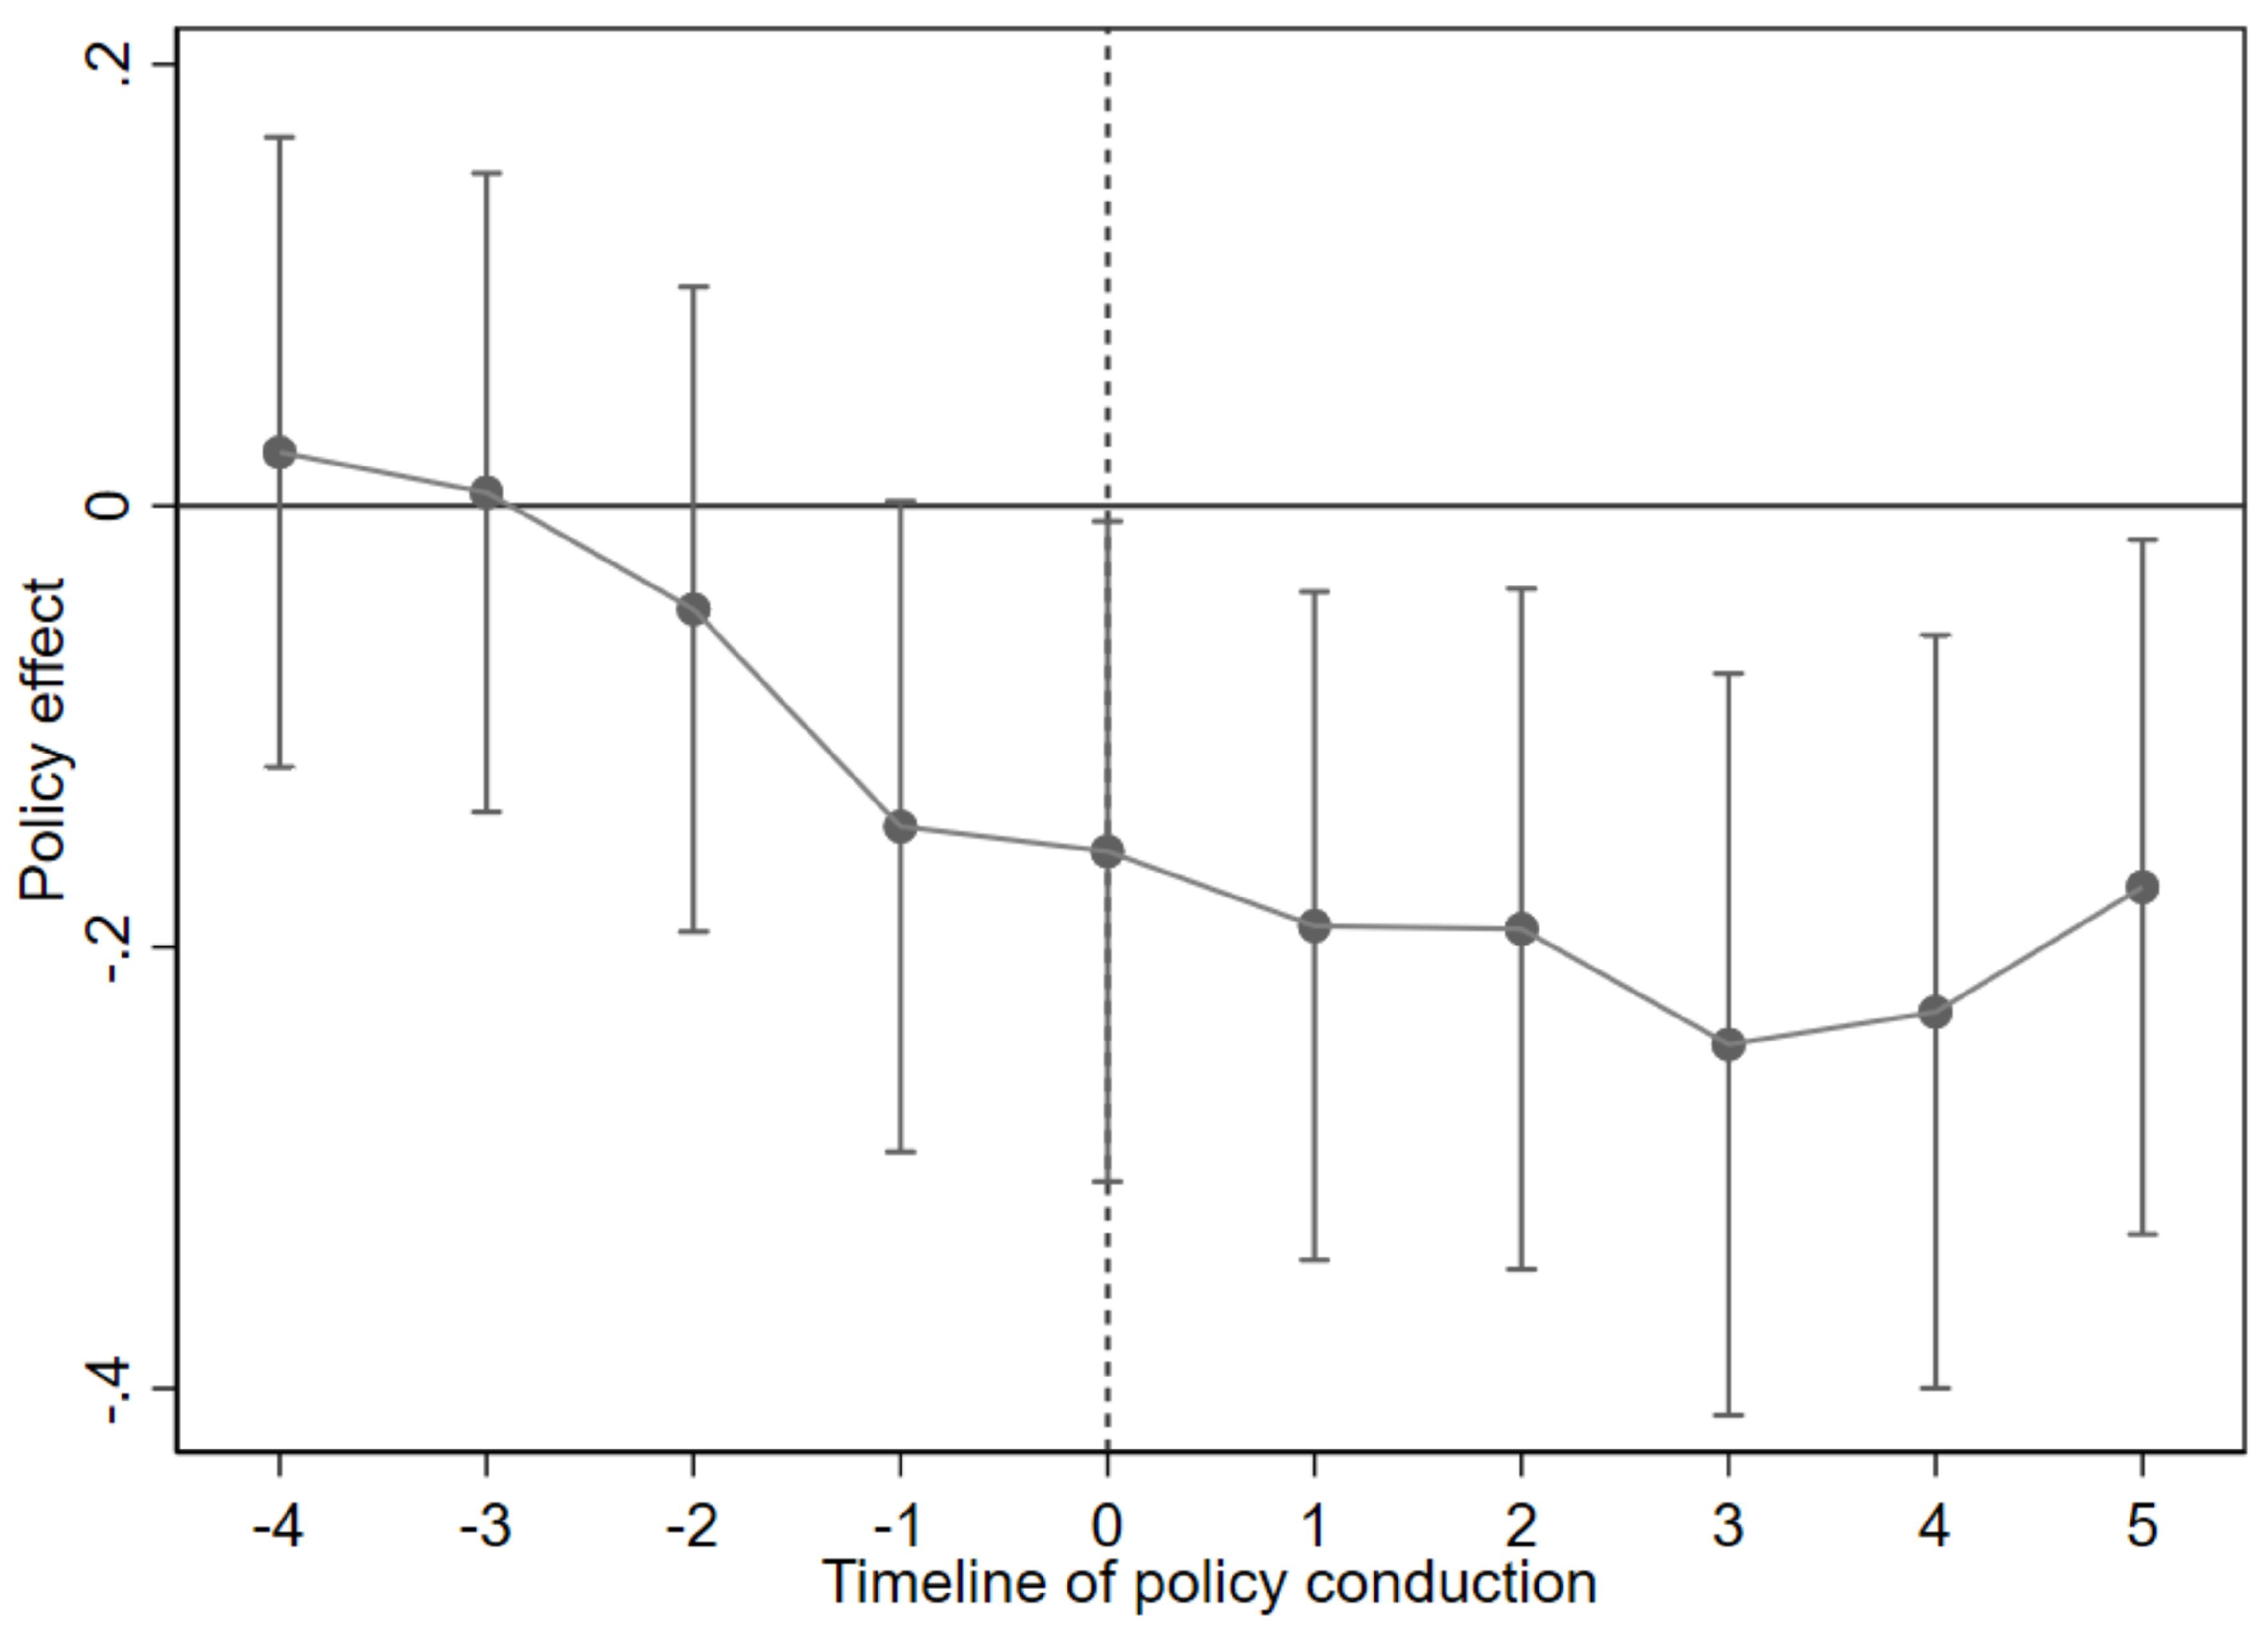
Figure 3.
Placebo test.
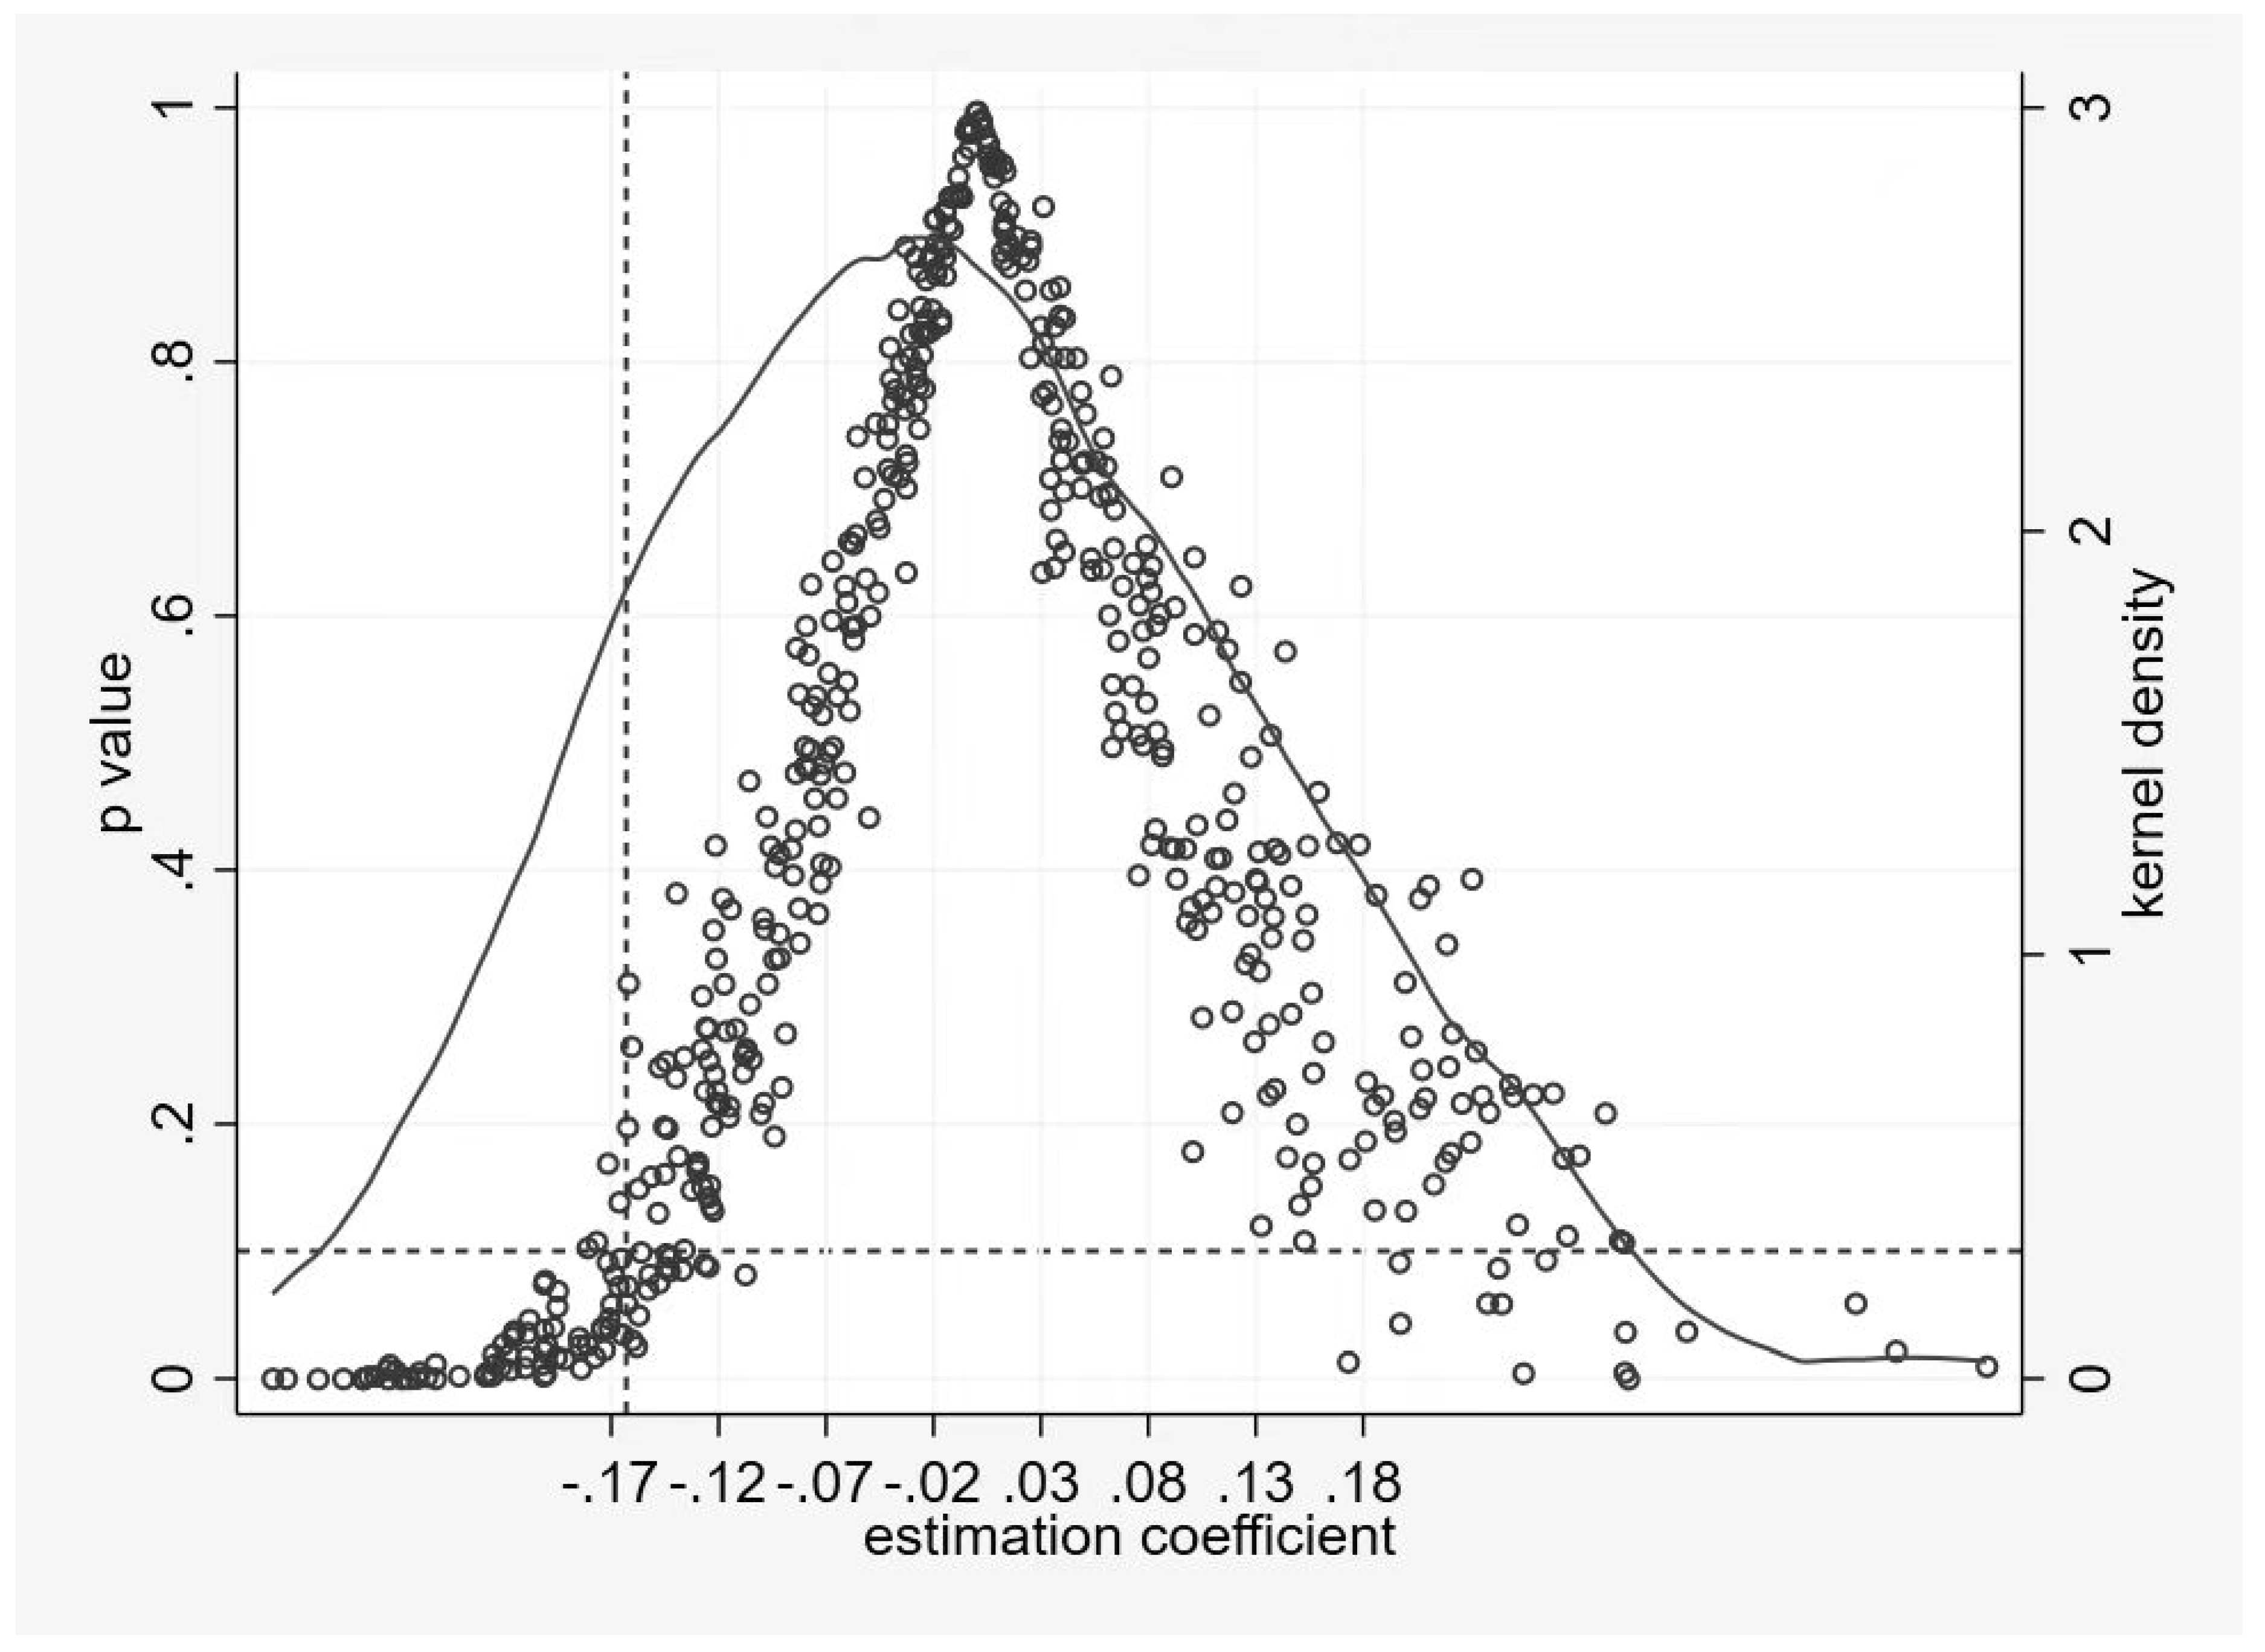

Table 1.
Descriptive statistics of variables.
| Variables | Sample | Experimental group | control subjects | ||||||
|---|---|---|---|---|---|---|---|---|---|
| Obs. | Mean | SD | Obs. | Mean | SD | Obs. | Mean | SD | |
| 600 | 1.800 | 0.729 | 140 | 1.588 | 0.400 | 460 | 1.864 | 0.792 | |
| 600 | 0.095 | 0.293 | 140 | 0.407 | 0.493 | 460 | 0.000 | 0.000 | |
| 600 | 4.130 | 3.020 | 140 | 6.372 | 3.946 | 460 | 3.448 | 2.278 | |
| 600 | 44.82 | 8.546 | 140 | 42.69 | 10.03 | 460 | 45.47 | 7.939 | |
| 600 | 443.1 | 635.2 | 140 | 1,043 | 1,063 | 460 | 260.5 | 203.8 | |
| 600 | 4.55 | 2.373 | 140 | 5.608 | 2.273 | 460 | 4.230 | 2.311 | |
| 600 | 1.44e-09 | 0.956 | 140 | 0.613 | 1.006 | 460 | -0.187 | 0.858 | |
| 600 | -3.73e-09 | 1.071 | 140 | 1.157 | 1.336 | 460 | -0.352 | 0.651 | |
Obs. and SD denote observation and standard deviation, respectively.
Table 2.
Multiple covariance test and stationary test results.
| Variables) | VIF | ADF | HT | Breitung | Obs. |
|---|---|---|---|---|---|
| - | 307.31*** | -30.75*** | -3.33*** | 600 | |
| 25934 | 192.17*** | -33.34*** | -13.25*** | 600 | |
| 31168 | 107.92*** | -31.09*** | -13.29*** | 600 | |
| 46023 | 172.92*** | -24.94*** | -9.49*** | 600 | |
| 45689 | 91.51*** | -30.48*** | -14.39*** | 600 | |
| 22678 | 20136*** | -34.82*** | -10.92*** | 600 | |
| 41730 | 330.14*** | -56.88*** | -13.39*** | 600 | |
| 36161 | 316.36*** | -48.38*** | -9.73*** | 600 |
Note: *, ** and *** indicate 10%, 5% and 1% significance levels, respectively.
Table 3.
Benchmark regression results.
| (1) | (2) | (3) | (4) | (5) | (6) | |
| -0.433*** | -0.273*** | -0.234*** | -0.173** | -0.180** | -0.185** | |
| (0.129) | (0.091) | (0.082) | (0.083) | (0.081) | (0.080) | |
| -0.070** | -0.073*** | -0.054** | -0.067*** | -0.070** | ||
| (0.027) | (0.023) | (0.025) | (0.023) | (0.026) | ||
| 0.020*** | 0.015** | 0.015** | 0.015** | |||
| (0.006) | (0.006) | (0.006) | (0.007) | |||
| -0.001*** | 0.000 | 0.000 | ||||
| (0.000) | (0.000) | (0.000) | ||||
| 0.079* | 0.079* | |||||
| (0.043) | (0.044) | |||||
| -0.003 | ||||||
| (0.038) | ||||||
| -0.016 | ||||||
| (0.039) | ||||||
| 0.857*** | 0.930*** | 0.034 | 0.434 | 0.049 | 0.032 | |
| (0.161) | (0.156) | (0.361) | (0.391) | (0.470) | (0.468) | |
| Time fixed- effects |
Yes | Yes | Yes | Yes | Yes | Yes |
| Individual fixed-effects |
Yes | Yes | Yes | Yes | Yes | Yes |
| R-squared | 0.634 | 0.648 | 0.672 | 0.679 | 0.694 | 0.694 |
| Observations | 600 | 600 | 600 | 600 | 600 | 600 |
Note: *, **, and *** denote statistical significance at 10%, 5%, and 1% levels, respectively. The parentheses show standard errors.
Table 4.
Replacement of explanatory variables and regression results with alternative control variables.
Table 4.
Replacement of explanatory variables and regression results with alternative control variables.
| (1) | (2) | (3) | (4) | (5) | (6) | |
| -0.314** | -0.165* | -0.185** | -0.176** | -0.184** | -0.181** | |
| (0.117) | (0.089) | (0.080) | (0.082) | (0.085) | (0.078) | |
| -0.060** | -0.070** | -0.069*** | -0.068*** | -0.061** | ||
| (0.027) | (0.026) | (0.025) | (0.023) | (0.024) | ||
| 0.015** | 0.015** | 0.031 | 0.031 | 0.028 | ||
| (0.007) | (0.007) | (0.021) | (0.021) | (0.022) | ||
| 0.000 | 0.000 | 0.000 | 0.000 | -0.000 | ||
| (0.000) | (0.000) | (0.000) | (0.000) | (0.000) | ||
| 0.088* | 0.079* | 0.079* | 0.079* | 0.052** | ||
| (0.045) | (0.044) | (0.044) | (0.045) | (0.024) | ||
| 0.010 | -0.003 | 0.001 | 0.002 | 0.003 | ||
| (0.042) | (0.038) | (0.038) | (0.038) | (0.037) | ||
| -0.022 | -0.016 | -0.022 | -0.022 | -0.031 | ||
| (0.044) | (0.039) | (0.043) | (0.044) | (0.041) | ||
| 0.024 | 0.024 | 0.018 | ||||
| (0.025) | (0.025) | (0.026) | ||||
| -0.001 | -0.000 | |||||
| (0.002) | (0.002) | |||||
| -8.141 | ||||||
| (27.701) | ||||||
| 8.966*** | 8.001*** | 0.032 | -1.595 | -1.598 | -1.012 | |
| (0.162) | (0.494) | (0.468) | (2.013) | (2.010) | (2.106) | |
| Time fixed-effects |
Yes | Yes | Yes | Yes | Yes | Yes |
| Individual fixed-effects |
Yes | Yes | Yes | Yes | Yes | Yes |
| R-squared | 0.674 | 0.712 | 0.668 | 0.669 | 0.669 | 0.733 |
| Observations | 600 | 600 | 600 | 600 | 600 | 14475 |
Note: *, **, and *** denote statistical significance at 10%, 5%, and 1% levels, respectively. The parentheses show standard errors.
Table 5.
PSM-DID test results.
| (1) | (2) | (3) | (4) | (5) | (6) | |
| -0.366** | -0.262** | -0.245** | -0.183** | -0.191* | -0.193* | |
| (0.147) | (0.116) | (0.100) | (0.075) | (0.105) | (0.103) | |
| -0.051* | -0.058** | -0.036** | -0.057* | -0.058* | ||
| (0.027) | (0.024) | (0.017) | (0.029) | (0.032) | ||
| 0.017** | 0.013*** | 0.014* | 0.014* | |||
| (0.007) | (0.004) | (0.007) | (0.007) | |||
| -0.001*** | -0.000 | -0.000 | ||||
| (0.000) | (0.001) | (0.001) | ||||
| 0.120** | 0.122** | |||||
| (0.047) | (0.048) | |||||
| -0.016 | ||||||
| (0.042) | ||||||
| -0.008 | ||||||
| (0.043) | ||||||
| 0.755*** | 0.812*** | 0.085 | 0.592** | 0.032 | -0.002 | |
| (0.177) | (0.173) | (0.371) | (0.250) | (0.581) | (0.574) | |
| Time fixed-effects |
Yes | Yes | Yes | Yes | Yes | Yes |
| Individual fixed-effects |
Yes | Yes | Yes | Yes | Yes | Yes |
| R-squared | 0.661 | 0.668 | 0.682 | 0.687 | 0.710 | 0.711 |
| Observations | 569 | 569 | 569 | 569 | 569 | 569 |
Note: *, **, and *** denote statistical significance at 10%, 5%, and 1% levels, respectively. The parentheses show standard errors.
Table 6.
Results of intermediary effect test: market-oriented incentive effect.
| (1) | (2) | (3) | |
| -0.074*** | 0.494*** | -0.084*** | |
| (0.024) | (0.051) | (0.028) | |
| 0.020 | |||
| (0.022) | |||
| -1.381*** | -0.475** | -1.371*** | |
| (0.103) | (0.205) | (0.104) | |
| Control variable | Yes | Yes | Yes |
| Time fixed-effects | Yes | Yes | Yes |
| Individual fixed-effects | Yes | Yes | Yes |
| R-squared | 0.694 | 0.353 | 0.694 |
Note: *, **, and *** denote statistical significance at 10%, 5%, and 1% levels, respectively. The parentheses show standard errors.
Table 7.
Intermediary effect test: cost pressure effect.
| (1) | (2) | (3) | (4) | (5) | |
| -0.074*** | 0.028 | -0.076*** | 0.010 | -0.073*** | |
| (0.026) | (0.032) | (0.026) | (0.052) | (0.024) | |
| 0.071*** | -0.171*** | ||||
| (0.034) | (0.020) | ||||
| -1.381*** | -0.534*** | -1.343** | 0.256 | -1.337*** | |
| (0.103) | (0.130) | (0.104) | (0.210) | (0.097) | |
| Control variable |
Yes | Yes | Yes | Yes | Yes |
| Time fixed-effects |
Yes | Yes | Yes | Yes | Yes |
| Individual fixed-effects |
Yes | Yes | Yes | Yes | Yes |
| R-squared | 0.694 | 0.415 | 0.696 | 0.198 | 0.731 |
| Observations | 600 | 600 | 600 | 600 | 600 |
Note: *, **, and *** denote statistical significance at 10%, 5%, and 1% levels, respectively. The parentheses show standard errors.
Table 8.
Mediated effects test results: technological innovation dynamics effect.
| (1) | (2) | (3) | |
| -0.185** | 0.040 | -0.186** | |
| (0.080) | (0.109) | (0.080) | |
| 0.021 | |||
| (0.021) | |||
| 0.032 | 2.793*** | -0.028 | |
| (0.468) | (0.494) | (0.468) | |
| Control variable | Yes | Yes | Yes |
| Time fixed-effects | Yes | Yes | Yes |
| Individual fixed-effects | Yes | Yes | Yes |
| R-squared | 0.694 | 0.783 | 0.694 |
| Observations | 600 | 600 | 600 |
Note: *, **, and *** denote statistical significance at 10%, 5%, and 1% levels, respectively. The parentheses show standard errors.
Table 9.
Mediation effect test results: energy consumption structure.
| (1) | (2) | (3) | |
| -0.185** | 1.443** | -0.200** | |
| (0.080) | (0.635) | (0.074) | |
| 0.011** | |||
| (0.004) | |||
| 0.032 | 0.845 | 0.023 | |
| (0.468) | (2.039) | (0.467) | |
| Control variable | Yes | Yes | Yes |
| Time fixed-effects | Yes | Yes | Yes |
| Individual fixed-effects | Yes | Yes | Yes |
| R-squared | 0.694 | 0.061 | 0.697 |
| Observations | 540 | 538 | 538 |
Note: *, **, and *** denote statistical significance at 10%, 5%, and 1% levels, respectively. The parentheses show standard errors.
Table 10.
Mediation effect test results: synergistic effect.
| (1) | (2) | (3) | (4) | (5) | (6) | (7) | |
| -0.074*** | 0.462** | -0.078*** | 0.024 | -0.077*** | -0.059*** | -0.081*** | |
| (0.026) | (0.225) | (0.026) | (0.023) | (0.026) | (0.022) | (0.026) | |
| 0.008* | 0.118** | -0.104** | |||||
| (0.005) | (0.047) | (0.050) | |||||
| -1.381*** | 0.579 | -1.386*** | 0.078 | -1.390*** | 0.023 | -1.379*** | |
| (0.103) | (0.906) | (0.103) | (0.093) | (0.103) | (0.089) | (0.103) | |
| Control variable | Yes | Yes | Yes | Yes | Yes | Yes | Yes |
| Time fixed effects | Yes | Yes | Yes | Yes | Yes | Yes | Yes |
| Individual fixed effects | Yes | Yes | Yes | Yes | Yes | Yes | Yes |
| R-squared | 0.694 | 0.056 | 0.695 | 0.075 | 0.697 | 0.081 | 0.696 |
| Observations | 600 | 600 | 600 | 600 | 600 | 600 | 600 |
Note: *, **, and *** denote statistical significance at 10%, 5%, and 1% levels, respectively. The parentheses show standard errors.
Table 11.
Emission reduction effect of carbon trading policy and the difference between green development attention and green financial development level.
Table 11.
Emission reduction effect of carbon trading policy and the difference between green development attention and green financial development level.
| (1) | (2) | (3) | (4) | (5) | (6) | |
| -0.219*** | -0.206*** | -0.097*** | 0.204*** | -1.214*** | -0.077 | |
| (0.013) | (0.010) | (0.015) | (0.016) | (0.309) | (0.079) | |
| 0.535** | 1.450*** | 0.097*** | 0.204*** | 2.396*** | 8.479*** | |
| (0.215) | (0.092) | (0.015) | (0.016) | (0.592) | (1.748) | |
| Control variable | Yes | Yes | Yes | Yes | Yes | Yes |
| Time fixed effects | Yes | Yes | Yes | Yes | Yes | Yes |
| Individual fixed effects | Yes | Yes | Yes | Yes | Yes | Yes |
| R-squared | 0.913 | 0.949 | 0.948 | 0.963 | 0.963 | 0.971 |
| Observations | 7493 | 7075 | 1953 | 1475 | 72 | 68 |
Note: *, **, and *** denote statistical significance at 10%, 5%, and 1% levels, respectively. The parentheses show standard errors.
Disclaimer/Publisher’s Note: The statements, opinions and data contained in all publications are solely those of the individual author(s) and contributor(s) and not of MDPI and/or the editor(s). MDPI and/or the editor(s) disclaim responsibility for any injury to people or property resulting from any ideas, methods, instructions or products referred to in the content. |
© 2025 by the authors. Licensee MDPI, Basel, Switzerland. This article is an open access article distributed under the terms and conditions of the Creative Commons Attribution (CC BY) license (http://creativecommons.org/licenses/by/4.0/).
Copyright: This open access article is published under a Creative Commons CC BY 4.0 license, which permit the free download, distribution, and reuse, provided that the author and preprint are cited in any reuse.


