
Submitted:
21 October 2024
Posted:
21 October 2024
You are already at the latest version
Abstract
Fecal contamination is a common cause of impairment of surface waters. In monitoring studies, it usually is assessed by measuring concentrations of fecal indicator bacteria such as Escherichia coli (E. coli), a common monitoring target in freshwater systems. In this study, we assess the advantages and disadvantages of two common methods for monitoring E. coli concentrations at freshwater beaches: Colilert-18®, with a turnaround time of ca. 18 h, and real-time quantitative PCR (qPCR), with a turnaround time of ca. 3–4 h. Based on data comprising 3081 pairs of Colilert-18 and qPCR estimates of E. coli concentrations in split samples from Michigan’s annual beach monitoring program in 2019 and 2020, we found that qPCR monitoring detected a high percentage of exceedances of the state’s water quality standard for E. coli contamination that went undetected on the day of sampling with Colilert-18 monitoring, because qPCR concentration estimates were available on the day of sampling but Colilert-18 estimates were not. However, Colilert-18 data were more useful than qPCR data for statistical comparison of contamination levels at different beaches, probably in part because Colilert-18 data showed a much lower percentage of censored concentration estimates (estimates outside the range of quantification).
Keywords:
Beach monitoring
; Recreational water quality
; Fecal indicator bacteria (FIB)
; Escherichia coli (E. coli)
; Real-time quantitative polymerase chain reaction (qPCR)
; Colilert-18
; EPA draft method C
; censored data
1. Introduction
Fecal pollution is one of the most common causes of impairment of surface waters in countries throughout the world. Bain et al. (2014) [2], for example, estimate that 1.8 billion people worldwide drink water from sources that are contaminated with feces. And the U.S. Environmental Protection Agency (USEPA) found that 30% of the cumulative million kilometers of river and stream segments assessed across the United States by the National Rivers and Streams Assessment 2013–2014 were impaired by levels of fecal contamination that made them unsafe for total-body contact recreation [20].
Fecal contamination typically is assessed by measuring concentrations of fecal indicator bacteria (FIB) such as Escherichia coli (E. coli) and Enterococcus spp. FIB are bacteria that are abundant in the intestines of endothermic (“warm-blooded”) vertebrates such as humans, farm animals, and waterfowl but typically scarce in the external environment, and whose presence at elevated levels in surface water therefore provides evidence of fecal contamination. Monitoring studies usually employ a single FIB species or genus that is easy to quantify in the lab and is either not pathogenic or only mildly so and therefore is safer to work with than the primary pathogens of interest, especially when culture-based methods of quantification are used. Elevated levels of FIB in surface water indicate that fecal pathogens (viruses, bacteria, protozoa) are likely to be present, as well. These pathogens, not the FIB, are the main concern.
Epidemiological studies have shown that total-body contact with recreational waters exhibiting elevated FIB concentrations is associated with elevated incidence of gastrointestinal illnesses [4,5,15,19,21]. USEPA (2012) [19] has therefore established recreational water quality criteria that include suggested limits for E. coli contamination that are believed to protect human health for total-body contact recreation, based on available epidemiological evidence. Each state is required to develop and enforce recreational water quality standards (RWQS) that are based on, but not necessarily identical to, USEPA’s recommended criteria. These RWQS are then the basis for each state’s monitoring program for recreational waters and are used in deciding whether a beach should be temporarily closed for total-body contact recreation or a warning should be posted (we will refer to such decisions as beach notification decisions).
In addition to supporting state RQWS, USEPA (2012) [19] also supports the use of two types of what it calls “supplemental elements for enhanced protection of recreational water”: Beach Action Values and rapid monitoring methods. Beach Action Values are numerical thresholds intended for use in making precautionary beach notification decisions and therefore are set at concentrations somewhat lower than the corresponding RWQS. Rapid monitoring methods, such as qPCR (real-time quantitative polymerase chain reaction), are methods of quantifying FIB that have much shorter turnaround times than do the culture-based methods typically required by state RWQS.
Michigan has proposed what is essentially a combination of these two supplemental elements: a qPCR-based Beach Action Value for E. coli contamination, which we will call the qPCR threshold value (qTV). The proposed numerical value of Michigan’s qTV is 1.863 gene copies per reaction (GC/reaction). A detailed assessment of this qTV by McNair et al. (2022) [9], based on state-wide split-sample Colilert-18®and qPCR beach monitoring data for Michigan beaches in 2016–2020, supports its validity.
The main reason for employing qPCR-based beach monitoring is that it produces results in only 3–4 h, compared to 18–24 h for culture-based methods such as Colilert-18 and colony-count methods that require significant incubation periods before producing results. With qPCR monitoring, it is both possible and feasible to make beach notification decisions early enough on the same day samples are collected so that warnings can be issued or beaches closed before most recreators have entered the water. Making and posting these decisions on the same day samples are collected is crucial, because E. coli concentrations in samples collected from a given beach on consecutive days typically show little or no correlation [12,13,22,23] (Figure 1); in other words, today’s E. coli concentration is not a reliable indicator of what tomorrow’s concentration will be.
In monitoring studies where the main goal is to reliably detect relatively high levels of E. coli contamination (specifically, levels that exceed a water quality standard for protecting human health), current methods of qPCR analysis for surface waters usually result in a high proportion of censored data (concentration estimates below the lower limit of quantification or above the upper limit of quantification) — often well over 25%, in our experience. By contrast, Colilert-18 data typically exhibit a much lower proportion of censored data — usually well below 10%. Rigorous analysis of censored data requires specialized statistical methods from the discipline variously known as survival analysis, reliability analysis, failure-time analysis, or time-to-event analysis. These methods make it possible to estimate and compare E. coli concentration distributions for different beaches, counties, or dates, estimate percentiles and confidence intervals, assess spatial or temporal trends, assess potential relationships with explanatory variables, and so on, but their ability to detect differences, trends, or relationships diminishes as the proportion of censored data increases. Thus, while estimates of E. coli concentration can be obtained in much less time when qPCR is used instead of Colilert-18, the resulting data may be less useful for detecting differences between levels of E. coli contamination at different beaches or sampling times and for exploring hypotheses regarding their potential causes.
In this paper, we assess the advantages and disadvantages of Colilert-18 and qPCR data for two types of applications: making sound and timely beach notification decisions, and comparing levels of E. coli contamination between groups of beaches. More specifically, we use quantitative performance measures to assess the degree to which beach notification decisions based on qPCR estimates of E. coli concentration and Michigan’s proposed qTV correspond to beach notification decisions based on Colilert-18 estimates and Michigan’s culture-based RWQS, we compare these performance measures for Michigan’s inland-lake and coastal beaches, and we compare the abilities of Colilert-18 and qPCR data to detect differences between levels of E. coil contamination at these two types of beaches. All assessments utilize Michigan’s state-wide beach monitoring data for 2019 and 2020, which comprise paired Colilert-18 and qPCR estimates of E. coli concentration in split samples.
2. Materials and Methods
The data employed in the present assessments were produced in 2019 and 2020 by multiple laboratories across the state of Michigan as part of Michigan’s annual beach monitoring program. The sampling locations, participating laboratories, methods of sample collection and preparation, and methods of E. coli quantification with Colilert-18 and qPCR are described in detail by McNair et al. (2022) [9] and therefore will be only briefly outlined here. Methods of data analysis will be described in more detail since they have not been employed previously.
2.1. Sampling Locations
The data comprise 3081 pairs of Colilert-18 and qPCR estimates of E. coli concentration from split samples that were collected from freshwater beaches in Michigan during 2019 and 2020. Of the total of 102 beaches with paired data, 69 were located on inland lakes and 33 were coastal beaches, by which we mean beaches on Lake Superior, Lake Michigan, Lake Huron, or Lake St. Clair (Figure 2).
2.2. Participating Laboratories
Seven Michigan laboratories contributed paired Colilert-18 and qPCR beach monitoring data in 2019 and 2020 (Appendix Table A1).
2.3. Sample Collection and Preparation
McNair et al. (2022) [9] describe the methods of sample collection and preparation employed. Briefly, beaches were sampled every 2 to 7 days from May through October. Sampling frequency was set by county health departments and varied between counties. Water samples were collected in sterile water bottles from 3–6 representative locations at each beach. They were stored at 4°C during transport to the lab and were analyzed within 4–8 h (typically 6 h) of collection. In most cases, each sample was split before analysis, and one half was analyzed with Colilert-18 and the other with qPCR. To reduce analytical costs, some counties with large numbers of beaches or unusually long beaches composited samples from an individual beach and sampling date, then split and analyzed the composites.
2.4. Methods of E. coli Quantification
E. coli concentrations were estimated with both Colilert-18 and qPCR. Colilert-18 analysis employed the Colilert-18 Quanti-Tray/2000®system (IDEXX Laboratories, Westbrook, ME) and followed manufacturer instructions. With this method, estimates of E. coli concentration are obtained in 18 h and are in units of the most probable number of colony-forming units per 100 mL (MPN/100 mL). The lower and upper limits of quantification (LLOQ and ULOQ) are fixed at 1.0 and 2419.6 MPN/100 mL (unless samples are concentrated or diluted, neither of which was done).
qPCR analysis followed EPA Draft Method C [1,7,9,14]. With this method, estimates of E. coli concentration are obtained in 3–4 h and are in units of gene copies per reaction ( GC/reaction). qPCR quantification of field samples requires an instrument-specific and analyst-specific standard curve that is created once each beach-monitoring season for each combination of analytical instrument and analyst in a given lab. Each standard curve yields its own LLOQ [8], so this procedure produces one instrument/analyst-specific LLOQ for each combination of analytical instrument and analyst in each lab during each beach-monitoring season. LLOQs for 2019 and 2020 ranged from about 0.36 to 0.91 GC/100 mL. ULOQs were not formally estimated, because the maximum standard concentration was chosen well above the range of gene copy concentrations encountered in beach monitoring and also yielded the lowest variability in observed values of the threshold cycle () in calibration data.
2.5. Michigan’s Recreational Water Quality Standards
The relevant part of Michigan’s recreational water quality standards (RWQS) for the present study requires that estimated E. coli concentrations must not exceed 300 E. coli/100 mL at any sampling event (Michigan Recreational Water Quality Sandards (RWQS) – Part 4 rules, Water Quality Standards, promulgated under Part 31, Water Resources Protection, of the Natural Resources and Environmental Protection Act, 1994 PA 451, as amended). This standard requires culture-based quantification of E. coli concentration using either classical colony counts that yield estimates of colony-forming units per 100 mL (CFU/100 ml) or a simpler enzyme-substrate test such as Colilert-18 that yields estimates of the most probable number of colony-forming units per 100 mL (MPN/100 mL). Following USEPA guidance [19], Michigan also permits rapid monitoring of E. coli concentrations using qPCR as a supplemental method, with beach notification decisions based on a proposed qTV of 1.863 GC/100 mL that was developed in collaboration with USEPA.
2.6. Assessing the Performance of Michigan’s Proposed qTV
In the ideal case, the relationship between estimates of E. coli concentrations based on qPCR and Colilert-18 would be one-to-one, so that a Colilert estimate would exceed Michigan’s RWQS of 300 E. coli/100 mL if and only if the corresponding qPCR estimate exceeded the proposed qTV of 1.836 GC/reaction. In reality, the relationship between these two types of concentration estimates is far from one-to-one, and any given qPCR estimate is associated with a wide range of Colilert-18 estimates rather than a single value (Figure 3). As a result, the fact that a given qPCR estimate exceeds the qTV does not guarantee that the corresponding Colilert-18 estimate exceeds the RWQS, nor does the fact that a given qPCR estimate does not exceed the qTV guarantee that the corresponding Colilert-18 estimates does not exceed the RWQS.
We will call qPCR estimates that exceed the qTV q-positives and qPCR values that do not exceed the qTV q-negatives. Similarly, we will call Colilert-18 estimates that exceed the RWQS c-positives and Colilert-18 estimates that do not exceed the RWQS c-negatives. The percent of c-positives that qPCR classifies as q-positives is called the true-positive rate (TPR), while the complementary percent of c-positives that qPCR classifies as q-negatives is called the false-negative rate (FNR). The percent of c-negatives that qPCR classifies as q-negatives is called the true-negative rate (TNR), and the complementary percent of c-negatives that qPCR classifies as q-positives is called the false-positive rate (FPR). Note that by definition, TPR + FNR = 100 and TNR + FPR = 100.
Performance assessment of qPCR-based monitoring and Michigan’s proposed qTV was based on TPR, FPR, TNR, and FNR. For example, uniformly excellent performance would be indicated by values of TPR and TNR close to 100% and by values of FPR and FNR close to 0%. False-negative error rates FNR for coastal and inland-lake beaches, expressed as proportions (FNR/100), were compared using an exact two-sample test for proportions, as implemented by R function exact.test() from the Exact package [3,11], and similarly for false-positive error rates FPR expressed as proportions (FPR/100). In both cases, the null hypothesis of no difference was tested against the two-sided alternative hypothesis that a difference exists.
2.7. Statistical Comparison of Concentration Distributions
As is typical of environmental concentration data, Colilert-18 and qPCR data usually have non-negligible proportions of censored data (i.e., concentrations outside the range of quantification). An observed concentration is left-censored if it is less than the LLOQ for the analytical method and is right-censored if it is greater than the ULOQ for the analytical method. Data that include a mix of left-, right-, and uncensored observations are called doubly-censored data.
Percentages of left- and right-censored data in the 2019 and 2020 beach monitoring data were as follows. At the statewide level (all counties), about 2.8% of the Colilert-18 data and about 52.2% of the qPCR data were left-censored. Among the four counties for which paired Colilert-18 and qPCR data were available for both inland-lake and coastal beaches, the percentage of left-censored data ranged from about 1.9 to 9.0% for Colilert-18 and from about 44.1 to 71.4% for qPCR. At the statewide level, about 0.3% of the Colilert-18 data and none of the qPCR data were right-censored. Among the four counties with Colilert-18 and qPCR data for both inland-lake and coastal beaches, none of the Colilert-18 or qPCR data were right-censored.
Methods traditionally used by environmental scientists and engineers for analyzing censored data (usually, replacing them with fabricated values; e.g., replacing LLOQ values with the LLOQ or some arbitrary fraction of it) are not statistically rigorous and were not used in the present study. Instead, we employed rigorous, specialized methods from the statistical discipline known as “survival analysis” (also “reliability analysis”, “failure-time analysis”, or “time-to-event analysis”) that are specifically designed for doubly-censored data. Distribution functions for Colilert-18 and qPCR data were characterized with the nonparametric Turnbull estimator for left- or doubly-censored data [17,18] using R function survfit() from the survival package [16]. The null hypothesis that two Turbull distribution functions are identical was tested against the two-sided alternative hypothesis that they are not identical by using R function FHtesticp() from the the FHtest package [10].
Proportions of Colilert-18 data that exceeded Michigan’s RWQS at inland-lake and coastal beaches were compared using an exact two-sample test for proportions, as implemented by R function exact.test() from the Exact package [3]. Because prior comparisons of Turnbull distribution functions for Colilert-18 provided strong evidence that contamination levels were consistently lower at inland-lake beaches than at coastal beaches, the null hypothesis of no difference in exceedance percentage was tested against the one-sided alternative hypothesis that the exceedance percentage was lower at inland-lake beaches.
3. Results
3.1. Beach Notification Decisions Based on qPCR Versus Colilert-18
The much shorter turnaround time for obtaining estimates of E. coli concentration with qPCR than with Colilert-18 is a meaningful advantage if the resulting beach notification decisions based on Michigan’s proposed qTV agree satisfactorily with decisions based on the state’s RWQS that would have been made if Colilert-18 estimates had been available on the day of sampling. The paired qPCR and Colilert-18 data from split samples in 2019 and 2020 allowed us to judge retrospectively how well qPCR and the qTV performed in predicting decisions based on Colilert-18 and the RWQS. The necessary information is provided by the values of TPR, FNR, TNR, and FPR. Good performance is indicated by high values of “true” rates TPR and TNR and by low values of “false” rates FPR and FNR. However, it is important to compare the values of these performance measures for qPCR and the qTV with those for Colilert-18 and the RWQS rather than with values for perfect information, since monitoring based on Colilert-18 (not perfect information) is the alternative to qPCR-based monitoring. All values of the performance measures apply to the day of sampling; those for Colilert-18 reflect the fact that same-day estimates of E. coli concentration cannot be obtained with this method and therefore cannot be used to justify closing a beach or posting a warning on the sampling day.
Table 1 shows the values of performance measures TPR, FPR, TNR, and FNR for both Colilert-18 and qPCR. Minimizing the FNR is particularly important in protecting human health. Separate values for qPCR data are shown for inland-lake and coastal beaches; the Colilert-18 values are necessarily the same for both types of beaches, because they simply reflect the inability to obtain Colilert-18 concentration estimates on the sampling day. Note that qPCR and the qTV provide much lower (better) values of the false-negative error rate FNR and only slightly higher (worse) values of the false-positive error rate FPR than do Colilert-18 and the RWQS.
The values of performance measures shown in Table 1 are the observed values for the full set of monitoring data from 2019 and 2020. If we view the monitoring data as a random sample from a larger population of beaches and sampling dates, then it is appropriate to estimate 95% confidence intervals for the difference between FNR at inland-lake and coastal beaches, and similarly for FPR (values for TPR and TNR are implied by those for FNR and FPR). Using function exact.test() in R package Exact with the no-difference null hypothesis and two-sided alternative hypothesis, we find for FNR that % with 95% confidence interval . For FPR, we find that with 95% confidence interval . Note that neither confidence interval includes zero.
3.2. Detecting Differences in E. coli Contamination Between Inland-Lake and Coastal Beaches
When Colilert-18 data for all beaches in 2019 and 2020 are combined, Turnbull estimates of the distribution functions for E. coli concentrations at inland-lake and coastal beaches show a clear separation between the two classes of lakes (Figure 4). The distribution function for coastal beaches lies to the right of that for inland-lake beaches. More precisely, the distribution function for coastal beaches is related to that for inland-lake beaches approximately as a stretching transformation (rather than a shift or translocation). A Fleming-Harrington unweighted log-rank test of the null hypothesis of no difference between the two distribution functions against the alternative hypothesis that they differ at one or more concentrations provides strong evidence () that the two distribution functions differ (note: the test actually applies to the complementary distribution functions but is equivalent to a test on the distribution functions ).
A rather different result is obtained with the corresponding split-sample qPCR data. The forms of the Turnbull distribution functions for qPCR data deteriorate at concentrations at or below the range of LLOQs (Figure 4). By contrast, the distribution functions for Colilert-18 data remain reasonably smooth all the way down to the LLOQ of 1.0 MPN/100mL. The qPCR data provide no evidence () that the distributions for the two classes of lakes differ, even though the qPCR data come from the same field samples as the Colilert-18 data. This failure to detect the pattern that is so evident in the Colilert-18 data is likely due in part to the deterioration of the distribution function at low concentrations, but other factors that can reduce the accuracy of qPCR concentration estimates may be involved, as well (e.g., variability in the DNA content of E. coli cells, inhibition of PCR amplification, poor fit of standard curves to calibration data).
The clear difference between levels of E. coli contamination at coastal and inland-lake beaches that is revealed by the Colilert-18 data for all beaches could be produced by unknown geographic patterns other than inland-lake versus coastal, since most counties in Michigan with monitored beaches have only coastal or only inland-lake beaches. Four counties, however, have sufficient data for both beach classes to permit separate county-level assessments: Muskegon County, Macomb County, Iosco County, and Chippewa County. These county-level assessments partially control for geographic differences other than coastal versus inland-lake, since other geographic properties are likely to be more similar within each county than across the entire state.
Separate analysis of the Colilert-18 data for Muskegon, Macomb, Iosco, and Chippewa counties provide strong support for the same pattern revealed by the combined data for all monitored beaches (Figure 5). In each county, the Turnbull distribution function for coastal beaches lies to the right of that for inland-lake beaches, and the differences are statistically significant ( in all four cases, with Holm adjustment for multiple comparisons). Thus, as with the combined data for all beaches, the Colilert-18 data for separate counties provide strong evidence that E. coli concentrations tend to be higher at coastal beaches than at inland-lake beaches.
The qPCR data for the individual counties also provides strong evidence for the same pattern in three of the four counties, despite the fact that the Turnbull distribution functions deteriorate at concentrations at or below the range of LLOQs. This result contrasts with that for the combined data, suggesting the possibility that geographic differences other than coastal versus inland may have contributed “noise” to the combined data that partially obscured the difference between E. coli concentrations at inland-lake and coastal beaches.
The percentages of Colilert-18 data that exceed Michigan’s RWQS provide further evidence that the risk of total-body recreation to human health is higher at coastal beaches (Table 2). The percentage of Colilert-18 data that exceed the RWQS is consistently higher at coastal beaches, whether we look at all counties combined or at the four individual counties with sufficient data for both classes of beaches.
As in the case of the performance measures displayed in Table 1, the exceedance percentages in Table 2 are the observed values for the full set of monitoring data from 2019 and 2020. If we again view the monitoring data as a random sample from a larger population of beaches and sampling dates, then it is appropriate to estimate 95% confidence intervals for the differences in exceedence percentages between inland-lake and coastal beaches. Using function exact.test() in R package Exact with the no-difference null hypothesis and one-sided alternative hypothesis that the values for inland-lake beaches are less than those for coastal beaches (the expected relationship based on comparisons of the Turnbull distribution functions), we find that the estimated differences and (in parentheses) one-sided 95% confidence intervals for all 12 counties and for Muskegon, Macomb, Iosco, and Chippewa counties are, respectively: % (%, %), % (%, %), % (%, %), % (%, %), and % (%, %). Note, however, that for Muskegon and Iosco counties, the 95% confidence intervals include zero. This means that the 2019 and 2020 data do not provide strong evidence that Coliert-18 concentrations for a randomly chosen pair of inland-lake and coastal beaches and a randomly chosen pair of sampling dates from a larger population of beaches and dates in these counties would show a lower exceedance percentage at the inland beach than at the coastal beach. But the pattern does hold for the observed 2019 and 2020 Colilert-18 concentrations.
The pattern is less clear for qPCR data and the proposed qTV: the percentage of qPCR data that exceed qTV is higher for coastal beaches in Macomb, Iosco, and Chippewa counties but is lower for coastal beaches in Muskegon County and in the combined data for all counties. The cases that are not consistent with the clear pattern in the Colilert-18 data are the same ones for which the qPCR data fail to show a clear separation between the Turnbull distribution functions for coastal and inland-lake beaches (Figure 4 and Figure 5).
4. Discussion
Results of this study address three main issues: (1) the relative levels of fecal contamination at Michigan’s inland-lake and coastal beaches, (2) the relative merits of Colilert-18 and qPCR estimates of E. coli concentration for detecting unsafe levels of fecal contamination on the day of sampling at individual beaches, and (3) the relative merits of Colilert-18 and qPCR estimates of E. coli concentration for assessing differences in levels of fecal contamination in different groups of beaches. The first issue deals specifically with beach monitoring data for Michigan’s beaches and may or may not be relevant to other geographic regions. The other two issues deal with basic properties of Colilert-18 and qPCR methods of quantification and are likely to be of more general significance.
With regard to the first issue, the Colilert-18 results indicate a clear pattern of lower levels of fecal contamination at Michigan’s inland-lake beaches than at its coastal beaches. The pattern holds for the combined data from all twelve counties for which both Colilert-18 and qPCR data are available, and also holds individually for the subset of four counties that have such data from both inland-lake and coastal beaches. The reasons for this difference are as yet unknown, but potential explanations are currently being investigated. Examples include differences in the level of inhibition, the DNA content of E. coli cells, and the frequency or severity of resuspension of E. coli cells from wave activity.
With regard to the second issue, the key advantage of qPCR quantification over Colilert-18 is that qPCR results can be available in only 3–4 h (compared to 18 h for Colilert-18), so it is possible to make beach notification decisions in time to prevent total-body contact recreation at unsafe beaches on the same day that samples were collected. The ability to make same-day decisions is very important because, as we noted in the Introduction, several studies have shown that levels of E. coli contamination at the same sampling locations on the same beach show little or no correlation on consecutive days. It follows that the measured level of contamination in samples collected on day t cannot validly be applied to day .
One of the limitations of qPCR quantificaton is that the relationship between qPCR and Colilert-18 estimates of E. coli concentration, though clearly an increasing one (Figure 3), shows substantial scatter that makes it impossible to find a qPCR threshold level for beach notification decisions that exhibits near-perfect agreement with decisions that would be made with Colilert-18 estimates and Michigan’s RWQS if the Colilert-18 estimates were available on the sampling day. However, the false-negative error rate for qPCR-based beach notification decisions made on the sampling day is far lower than the false-negative error rate for sampling-day decisions based on Colilert-18 (which is 100%, because warnings or beach closings are not issued without data indicating an exceedance), so qPCR quantification has a clear advantage. Moreover, the lack of meaningful correlation between E. coli levels on consecutive days and the resulting unreliability of Colilert-18 estimates as predictors of E. coli levels on the day after sampling (when results become available) implies that Colilert-18 estimates also are not a reliable basis for beach notification decisions made on the day after sampling (see McNair et al. (2022) [9] for additional discussion of this point).
Four disadvantages of qPCR quantification in beach monitoring are the far greater percentage of censored data it produces (compared to Colilert-18 quantification), its sensitivity to sample constituents that inhibit PCR amplification, its greater level of difficulty and hence susceptibility to lab error, and its sensitivity to the choice and implementation of the statistical method used to fit the standard curves that underlie all sample concentration estimates. If monitoring data are used exclusively for making beach notification decisions, these disadvantages are outweighed (in our opinion) by the key advantage of qPCR quantification: its results can be available early enough on the sampling day to prevent most recreators from entering unsafe water, whereas Colilert-18 results are not available until the next day, by which time the level of E. coli contamination is likely to have changed markedly. However, if monitoring data are also to be used to identify patterns in contamination levels at different beaches or sampling times and to assess potential explanations for such patterns (e.g., as a basis for adjusting the qTV for particular beaches or groups of beaches to improve the balance between their qPCR false-negative and false-positive error rates), then the high censoring rate, greater susceptibility to lab error, and sensitivity to interference by sample constituents and to the details of statistical methodology for fitting standard curves are important disadvantages of qPCR quantification. This is the third issue our results address.
The shortcomings of qPCR-based monitoring data as a basis for comparing concentration distributions for different groups of beaches are evident in plots of the Turnbull distribution functions for the combined data from all counties (Figure 4) and for data from individual counties (Figure 5). In each case, the distribution function for qPCR data deteriorates at concentrations within and below the range of LLOQs, and in a few cases (data for all counties combined, single-county data for Muskegon and Iosco counties), the separation between distribution functions for inland-lake and coastal beaches is less pronounced or entirely absent.
The relative degrees to which the high censoring rate, interference by sample consitutuents, and poor fits of standard curves contribute to the reduced separation between qPCR concentration distributions are unknown. The high censoring rate only affects the form of these distributions at concentrations well below the qTV and therefore does not affect the ability of qPCR data to correctly predict Colilert-18 beach notification decisions. It does, however, affect the ability to detect statistically significant differences between entire distributions. Interference by sample constituents that inhibit amplification lowers qPCR amplification curves and therefore increases estimates of , which in turn lowers estimates of sample concentrations. It can affect the full range of concentration estimates and is likely to vary among beaches from different waterbodies. The EPA Draft Method C workbook automatically adjusts concentration estimates (based on a sample processing control subject to inhibition and an external positive control with no inhibition: [6,8]) in an effort to reduce the effect of interference on sample concentration estimates, but there is no guarantee that the effect will be eliminated.
The EPA Draft Method C workbook fits standard curves to calibration data using weighted least-squares regression (because the calibration data typically are heteroskedastic), with weights automatically chosen as the standard concentrations. The squared errors (errors being the differences between observed and predicted values) for higher concentrations are therefore weighted more heavily than those for lower concentrations, with the result that standard curves fitted by weighted least-squares typically fit the trend in values versus standard concentrations better at high concentrations that at low ones. Consequently, when a fitted standard curve is inverted to predict unknown sample concentrations from measured values, the high concentration estimates are likely to be more accurate than the lower concentration estimates. This source of error, then, is somewhat similar to censoring in that it mainly affects low concentrations. As a result, it is not likely to meaningfully affect the ability of qPCR data to correctly predict Colilert-18 beach notification decisions but may well affect the ability to detect differences between entire distributions.
The differences between inland-lake and coastal beaches that were detected by comparing their E. coli concentration distributions and by comparing the percentage of concentrations that exceed Michigan’s culture-based RWQS for total-body contact recreation indicate that the two classes of beaches tend to differ in one or more unknown ways that affect their levels of fecal contamination. We are currently exploring various explanatory variables (e.g., bird counts, wind speed, water turbidity, proximity of coastal beaches to river mouths, frequency and severity of resuspension events, level of PCR inhibition) to gain insight into potential causes of the observed differences in contamination levels.
We also found that inland-lake and coastal beaches tend to differ in the false-negative and false-positive error rates for beach notification decisions based on qPCR data. This is one of several lines of evidence suggesting that it might be advisable to propose different qTV values for different beaches or classes of beaches in order to achieve a better balance between the false-negative and false-positive error rates. These two types of errors result in different kinds of costs: the main costs of false-negative errors are an increased incidence of gastrointestinal illnesses among beach recreators and the associated financial cost of treatment, while the main costs of false-positive errors are the financial loss suffered by local businesses that serve beach recreators and the dissatisfaction of recreators who are turned away from the beaches. Any decrease in the qTV will reduce the false-negative error rate as well as increase the false-positive error rate, as can be seen by examining Figure 3. A practical way to choose an appropriate qTV value for a beach for which multiple years of paired Colilert-18 and qPCR data are available is to choose a value that, when applied to prior data for the beach, makes the percentage of qTV exceedances by the qPCR data the same as the percentage of RWQS exceedances by the Colilert-18 data. We are currently working on developing and comparing this and other approaches to the problem of choosing qTVs that are specific to particular beaches or classes of beaches.
Author Contributions
Conceptualization, J.N.M., R.R.R., J.J.H., and S.B.; methodology, J.N.M.; formal analysis, J.N.M.; resources, R.R.R. and S.B.; data curation, R.R.R. and S.B.; writing—original draft preparation, J.N.M.; writing—review and editing, J.N.M., R.R.R., J.J.H., and S.B.; visualization, J.N.M.; funding acquisition, J.N.M. and R.R.R. All authors have read and agreed to the published version of the manuscript.
Funding
This project was partially funded by the State of Michigan Department of Environment, Great Lakes, and Energy (EGLE) with Real-Time Beach Monitoring funds.
Data Availability Statement
Requests for data should be directed to Dr. Shannon Briggs, Michigan Department of Environment, Great Lakes and Energy, 525W. Allegan St., Lansing, MI 48909 (briggss4@michigan.gov).
Acknowledgments
We thank Rich Haugland of USEPA’s Office of Research and Development (Cincinnati, Ohio) for many insightful discussions, the Michigan Network for Environmental Health and Technology (MiNet) for its focus on state-of-the-art environmental technology and methods, and the Michigan Department of Environment, Great Lakes, and Energy (EGLE) for its foresight in designing and conducting the annual beach monitoring program and maintaining the database of results.
Conflicts of Interest
The authors declare no conflicts of interest. The funders had no role in the design of the study; in the collection, analyses, or interpretation of data; in the writing of the manuscript; or in the decision to publish the results.
Abbreviations
The following abbreviations are used in this manuscript:
| E. coli | Escherichia coli |
| FIB | Fecal indicator bacteria |
| LLOQ | Lower limit of quantification |
| MPN | Most probable number |
| qPCR | Real-time quantitative polymerase chain reaction |
| qTV | qPCR threshold value |
| RWQS | Recreational water quality standard(s) |
| ULOQ | Upper limit of quantification |
| USEPA | United States Environmental Protection Agency |
Appendix A

Table A1.
Michigan laboratories that contributed Colilert-18 and qPCR estimates of E. coli concentrations to the 2019 and 2020 beach monitoring data used in the present study.
Table A1.
Michigan laboratories that contributed Colilert-18 and qPCR estimates of E. coli concentrations to the 2019 and 2020 beach monitoring data used in the present study.
| Laboratory |
|---|
| Assurance Water Laboratory, Central Michigan District Health Department |
| Shimadzu Core Laboratory, Ferris State University |
| Annis Water Resources Institute, Grand Valley State University |
| Environmental Analysis Laboratory, Lake Superior State University |
| Oakland County Health Division Laboratory |
| HEART Freshwater Field Station Laboratory, Oakland University |
| Department of Chemistry, Saginaw Valley State University |
References
- Aw, T.G.; Sivaganesan, M.; Briggs, S.; Dreelin, E.; Aslan, A.; Dorevitch, S.; Shrestha, A.; Isaacs, N.; Kinzelman, J.; Kleinheinz, G.; Noble, R.; Rediske, R.; Scull, B.; Rosenberg, S.; Weberman, B.; Sivy, T.; Southwell, B.; Siefring, S.; Oshima, K.; Haugland, R. Evaluation of multiple laboratory performance and variability in analysis of recreational freshwaters by a rapid Escherichia coli qPCR method (Draft Method C). Water Res. 2019, 156, 465–474. [Google Scholar] [CrossRef] [PubMed]
- Bain, R.; Cronk, R.; Hossain, R.; Bonjour, S.; Onda, K.; Wright, J. ..; Bartram, J. Global assessment of exposure to faecal contamination through drinking water based on a systematic review. Tropical Medicine and International Health, 2014, 19, 917–927. [Google Scholar] [CrossRef] [PubMed]
- Calhoun, P. Exact: Unconditional Exact Test. R package version 3.2, 2022. https://CRAN.R-project.org/package=Exact.
- Colford, J.M.; Schiff, K.C.; Griffith, J.F.; Yau, V.; Arnold, B.F.; Wright, C.C.; Gruber, J.S.; Wade, T.J.; Burns, S.; Hayes, J.; McGee, C.; Gold, M.; Cao, Y.; Noble, R.T.; Haugland, R.; Weisberg, S.B. Using rapid indicators for Enterococcus to assess the risk of illness after exposure to urban runoff contaminated marine water. Water Res. 2012, 46, 2176–2186. [Google Scholar] [CrossRef] [PubMed]
- Dufour, A.P. Health effects criteria for fresh recreational waters; USEPA Off. Res. Dev., 1984, EPA-600/1-84-004.
- Haugland, R.; Oshima, K.; Sivaganesan, M.; Dufour, A.; Varma, M.; Siefring, S. ..; Briggs, S. Large-scale comparison of E. coli levels determined by culture and a qPCR method (EPA Draft Method C) in Michigan towards the implementation of rapid, multi-site beach testing. Journal of microbiological methods, 2021, 184, 106186. [Google Scholar] [CrossRef] [PubMed]
- Lane, M.J.; Rediske, R.R.; McNair, J.N.; Briggs, S.; Rhodes, G.; Dreelin, E. ..; Pike, S. A comparison of E. coli concentration estimates quantified by the EPA and a Michigan laboratory network using EPA Draft Method C. Journal of Microbiological Methods 2020, 179, 106086. [Google Scholar]
- Lane, M.J.; McNair, J.N.; Rediske, R.R.; Briggs, S.; Sivaganesan, M.; Haugland, R. Simplified analysis of measurement data from a rapid E. coli qPCR Method (EPA Draft Method C) using a standardized Excel workbook. Water, 2020; 12, 775. [Google Scholar]
- McNair, J.N.; Lane, M.J.; Hart, J.J.; Porter, A.M.; Briggs, S.; Southwell, B. ; ...; Rediske, R.R. Validity assessment of Michigan’s proposed qPCR threshold value for rapid water-quality monitoring of E. coli contamination. Water Research, 2022; 226, 119235. [Google Scholar]
- Oller, R.; Langohr, K. FHtest: An R package for the comparison of survival curves with censored data. Journal of Statistical Software 2017, 81, 1–25. [Google Scholar] [CrossRef]
- R Core Team. R: A Language and Environment for Statistical Computing, R Foundation for Statistical Computing: Vienna, Austria, 2024.
- Saleem, F.; Schellhorn, H.E.; Simhon, A.; Edge, T.A. Same-day Enterococcus qPCR results of recreational water quality at two Toronto beaches provide added public health protection and reduced beach days lost. Canadian Journal of Public Health 2023, 114, 676–687. [Google Scholar] [CrossRef] [PubMed]
- Shrestha, A.; Dorevitch, S. Evaluation of rapid qPCR method for quantification of E. coli at non-point source impacted Lake Michigan beaches. Water Res. 2019, 156, 395–403. [Google Scholar] [CrossRef] [PubMed]
- Sivaganesan, M.; Aw, T.G.; Briggs, S.; Dreelin, E.; Aslan, A.; Dorevitch, S.; Shrestha, A.; Isaacs, N.; Kinzelman, J.; Kleinheinz, G.; Noble, R.; Rediske, R.; Scull, B.; Rosenberg, S.; Weberman, B.; Sivy, T.; Southwell, B.; Siefring, S.; Oshima, K.; Haugland, R. Standardized data quality acceptance criteria for a rapid Escherichia coli qPCR method (Draft Method C) for water quality monitoring at recreational beaches. Water Res. 2019, 156, 456–464. [Google Scholar] [CrossRef] [PubMed]
- Stevenson, A.H. Studies of bathing water quality and health. Am. J. Public Health 1953, 43, 529–538. [Google Scholar] [CrossRef] [PubMed]
- Therneau, T. A Package for Survival Analysis in R. R package version 3.7-0, 2024. https://CRAN.R-project.org/package=survival.
- Turnbull, B.W. Nonparametric estimation of a survivorship function with doubly censored data. Journal of the American Statistical Association 1974, 69, 169–173. [Google Scholar] [CrossRef]
- Turnbull, B.W. The empirical distribution function with arbitrarily grouped, censored and truncated data. Journal of the Royal Statistical Society: Series B (Methodological) 1976, 38, 290–295. [Google Scholar] [CrossRef]
- USEPA. Recreational Water Quality Criteria, Office ofWater, EPA 820-F-12-058. 2012.
- USEPA. National Rivers and Streams Assessment 2013–2014: A Collaborative Survey, Office of Water, EPA 841-R-19-001. 2020.
- Wade, T.J.; Calderon, R.L.; Brenner, K.P.; Sams, E.; Beach, M.; Haugland, R.; Wymer, L.; Dufour, A.P. High sensitivity of children to swimming-associated gastrointestinal illness: results using a rapid assay of recreational water quality. Epidemiology 2008, 19, 375–383. [Google Scholar] [CrossRef] [PubMed]
- Whitman, R.L.; Nevers, M.B. Escherichia coli sampling reliability at a frequently closed Chicago beach: monitoring and management implications. Environ. Sci. Technol. 2004, 38, 4241–4246. [Google Scholar] [CrossRef] [PubMed]
- Whitman, R.L.; Nevers, M.B.; Gerovac, P.J. Interaction of ambient conditions and fecal coliform bacteria in southern Lake Michigan beach waters: monitoring program implications. Nat. Areas J. 1999, 19, 166–171. [Google Scholar]
Figure 1.
E. coli concentrations as colony-forming units (CFU) per 100 mL for day (vertical axis) versus day t (horizontal axis) at three locations (Sunnyside Beach 17W, 18W, and 19W) on a Lake Ontario beach in Toronto, Canada. Data digitized from Figure 2 of Saleem et al. (2023) [12].
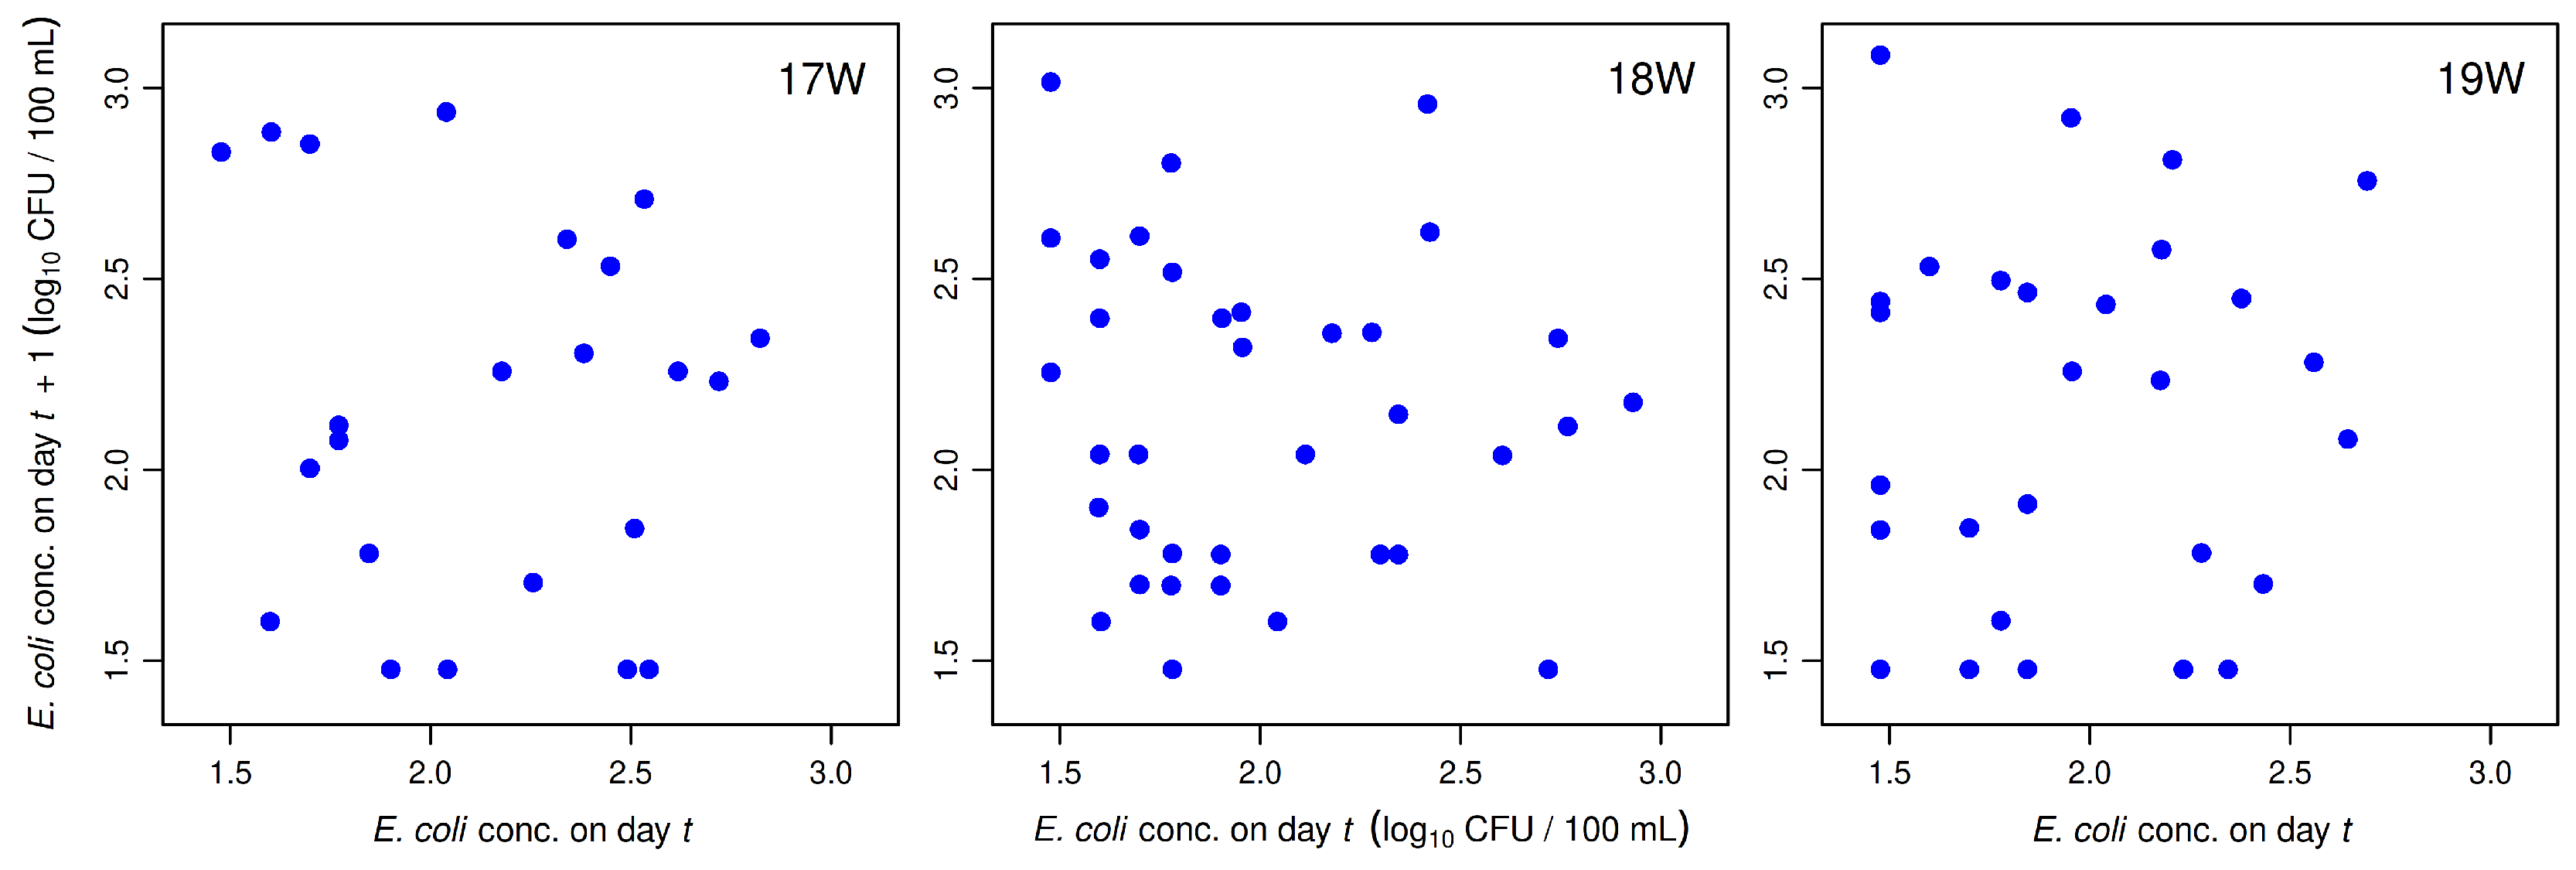
Figure 2.
Locations of Michigan recreational beaches for which paired Colilert-18 and qPCR beach monitoring data were available. Red dots: inland-lake beaches. Blue dots: coastal beaches. Base map: Michigan Geographic Framework.
Figure 2.
Locations of Michigan recreational beaches for which paired Colilert-18 and qPCR beach monitoring data were available. Red dots: inland-lake beaches. Blue dots: coastal beaches. Base map: Michigan Geographic Framework.

Figure 3.
Relationship between Colilert-18 (vertical axis) and qPCR (horizontal axis) E. coli concentrations in split samples from Michigan beaches in 2019 and 2020. Blue dots are true positives (upper right quadrant) and true negatives (lower left quadrant). Orange upright triangles are false negatives (upper left quadrant) and yellow inverted triangles are false positives (lower right quadrant).
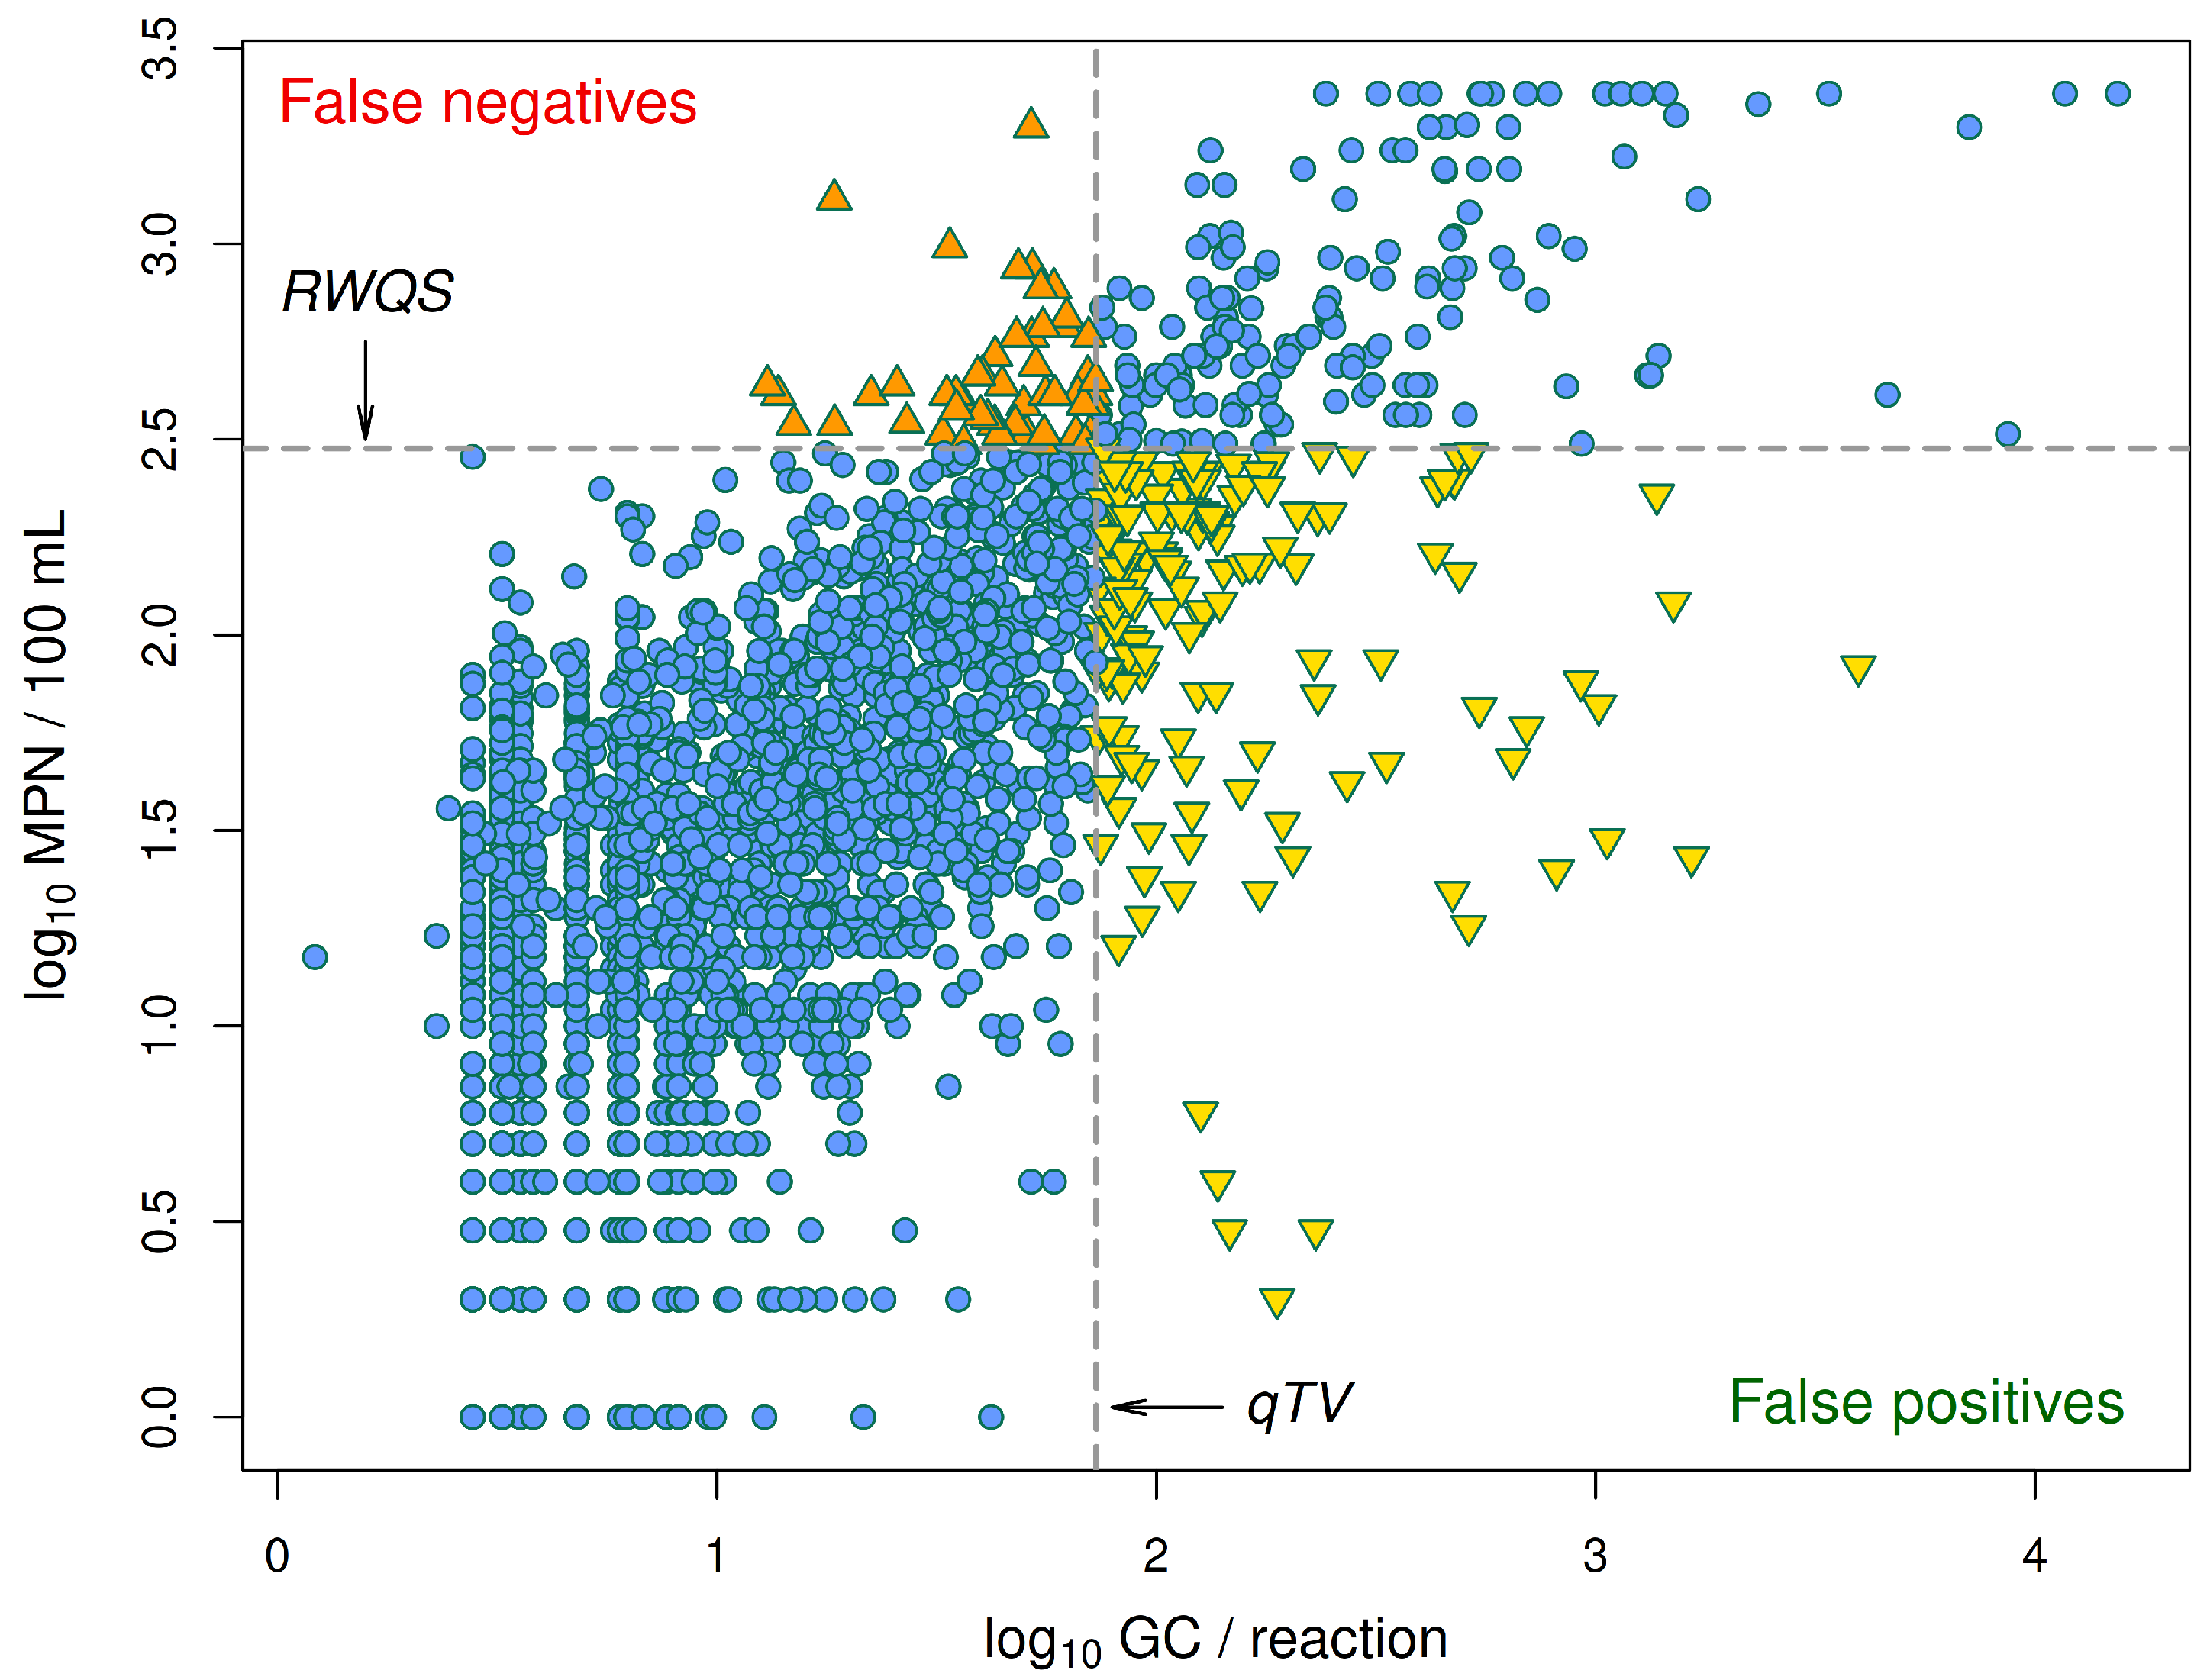
Figure 4.
Turnbull distribution functions for coastal and inland-lake beaches based on Colilert-18 data (left) and qPCR data (right). Results of log-rank tests are shown for the null hypothesis of no difference between distributions against the alternative hypothesis of a difference for at least one concentration. LLOQ: lower limit of quantification, RWQS: Michigan’s recreational water quality standard for total-body contact recreation, qTV: Michigan’s proposed qPCR threshold value.
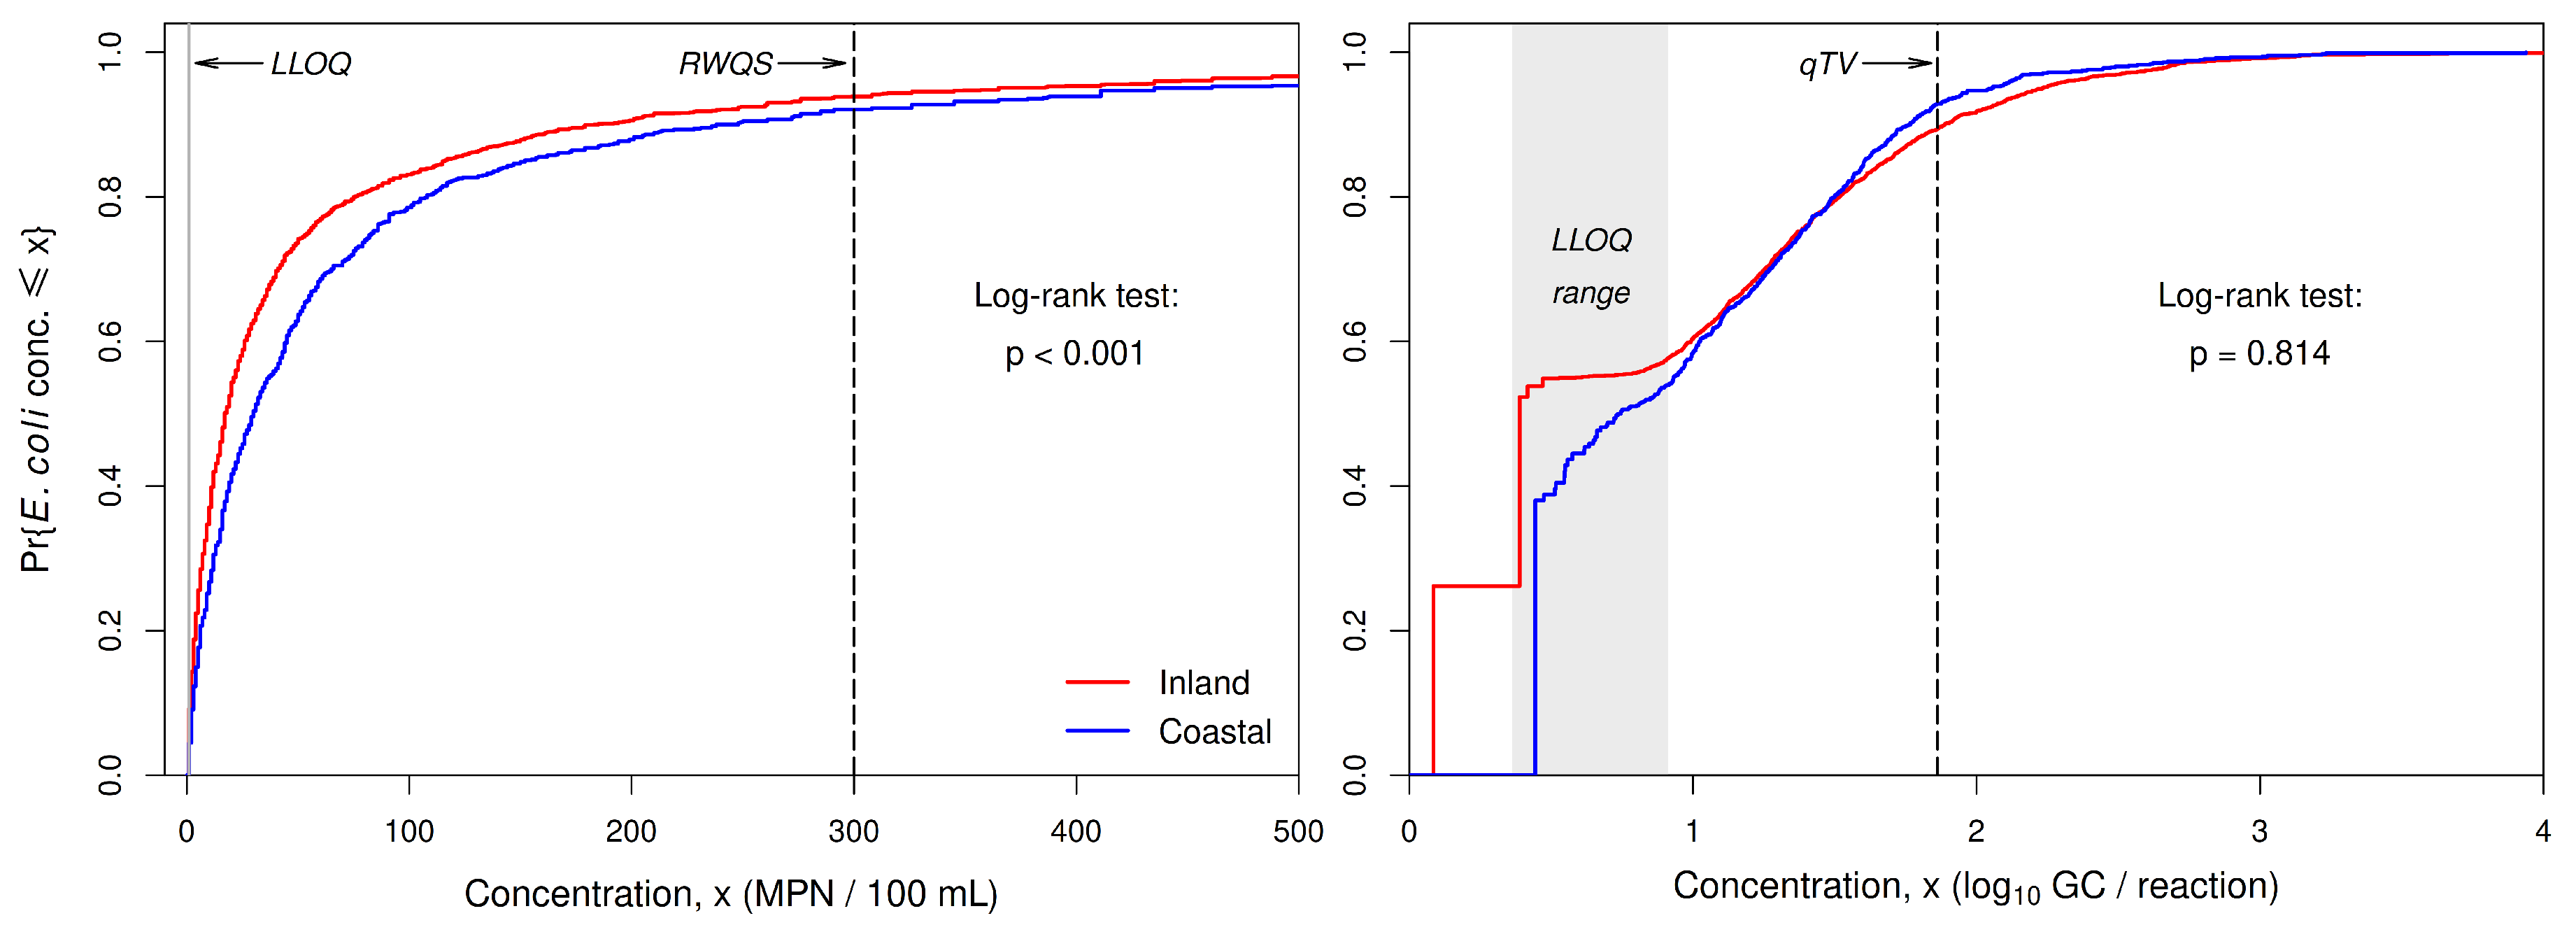
Figure 5.
Turnbull distribution functions for coastal and inland-lake beaches, plotted separately for the four Michigan counties with sufficient data for both classes of beaches. Each row of panels corresponds to one county and shows distribution functions based on Colilert-18 data (left) and on qPCR data (right), plotted and annotated as in Figure 4.
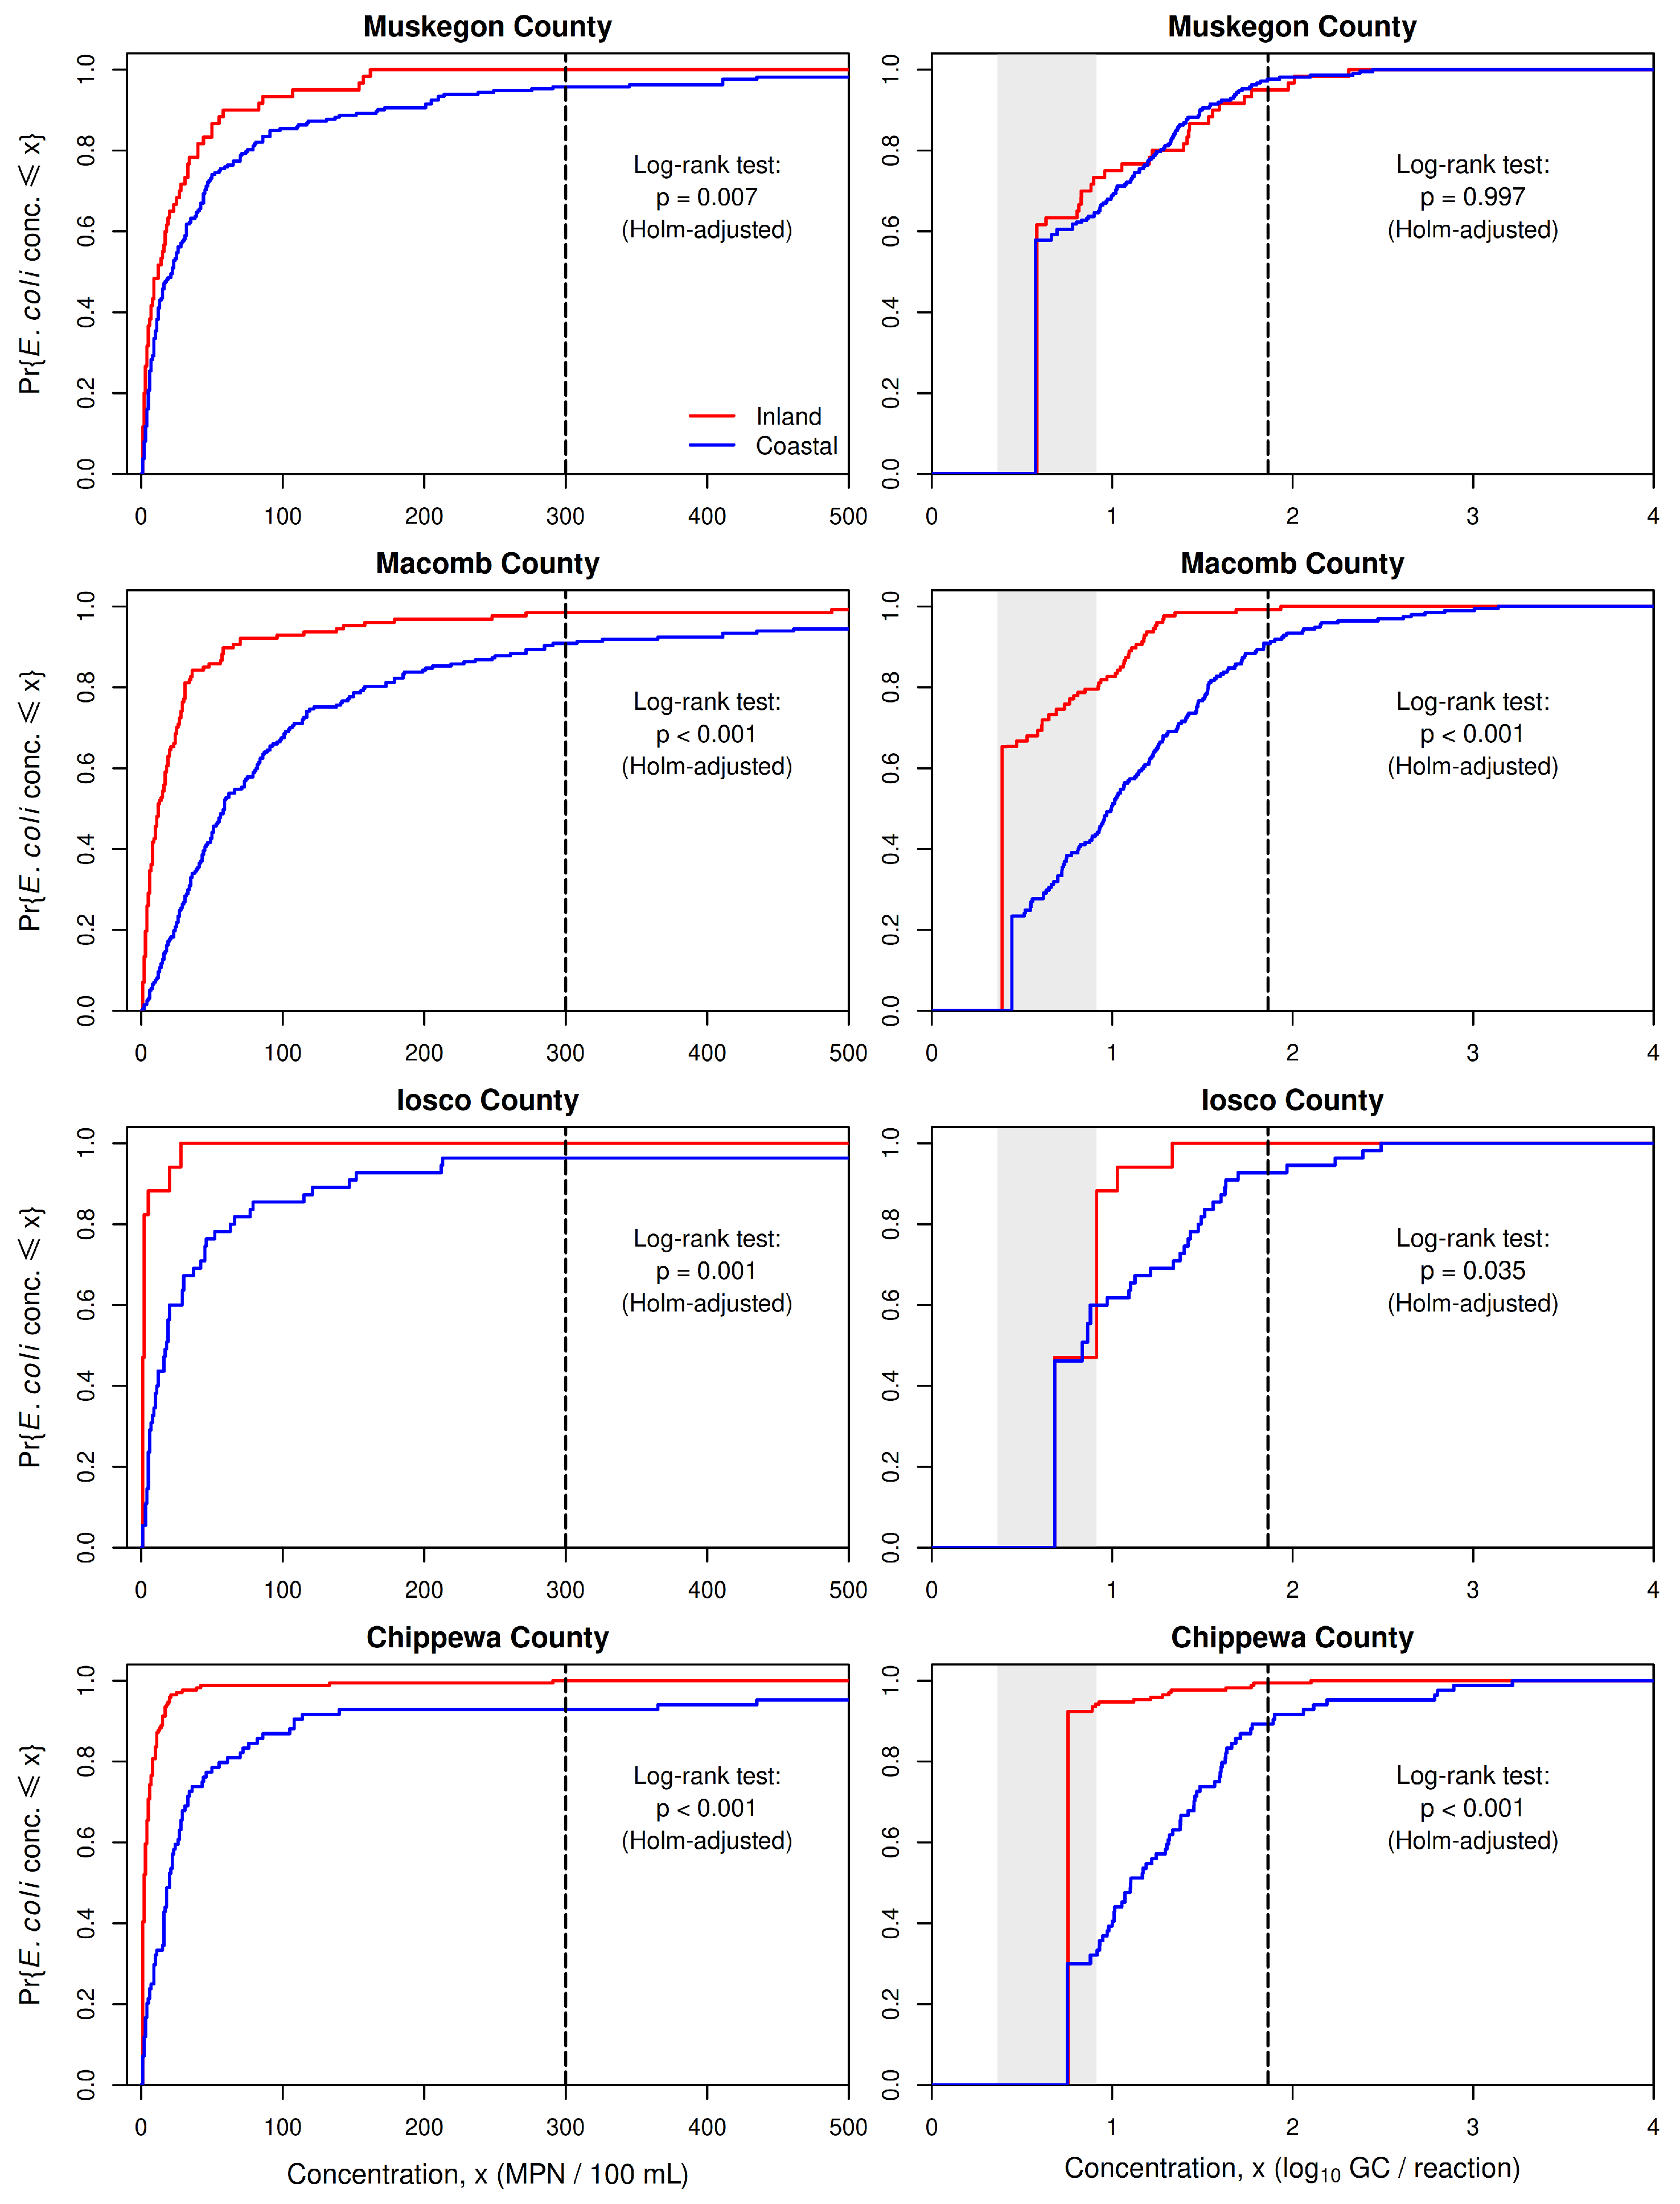
Table 1.
Performance measures for qPCR-based monitoring of E. coli contamination at Michigan’s inland-lake and coastal beaches during 2019 and 2020. TNR, FNR: True- and False-Negative Rates; TPR, FPR: True- and False-Positive Rates. Values of these performance measures for Colilert-18 are necessarily the same for inland-lake and coastal beaches.
| qPCR | |||
|---|---|---|---|
| Property | Colilert-18 | Inland-lake | Coastal |
| Can beach decisions be made on the same day samples are collected? | No | Yes | Yes |
| % Sampling days on which recreation is prohibited when it is unsafe (TPR) | 0 | 85.2 | 59.4 |
| % Sampling days on which recreation is permitted when it is unsafe (FNR) | 100 | 14.8 | 40.6 |
| % Sampling days on which recreation is permitted when it is safe (TNR) | 100 | 94.3 | 97.4 |
| % Sampling days on which recreation is prohibited when it is safe (FPR) | 0 | 5.7 | 2.6 |
Table 2.
Percentages of Colilert-18 and qPCR estimates of E. coli concentrations that exceed Michigan’s RWQS for total-body contact recreation and the proposed qTV, respectively. Results for each method of quantification are shown for all counties combined and separately for each of the four counties for which both Colilert-18 and qPCR data were available.
| Colilert-18 | qPCR | |||
|---|---|---|---|---|
| County | Inland-Lake | Coastal | Inland-Lake | Coastal |
| All | 6.1 | 7.9 | 10.5 | 7.1 |
| Muskegon | 0.0 | 4.2 | 5.0 | 2.4 |
| Macomb | 1.6 | 9.1 | 0.8 | 9.1 |
| Iosco | 0.0 | 3.6 | 0.0 | 7.3 |
| Chippewa | 0.0 | 7.1 | 0.6 | 10.7 |
Disclaimer/Publisher’s Note: The statements, opinions and data contained in all publications are solely those of the individual author(s) and contributor(s) and not of MDPI and/or the editor(s). MDPI and/or the editor(s) disclaim responsibility for any injury to people or property resulting from any ideas, methods, instructions or products referred to in the content. |
© 2024 by the authors. Licensee MDPI, Basel, Switzerland. This article is an open access article distributed under the terms and conditions of the Creative Commons Attribution (CC BY) license (https://creativecommons.org/licenses/by/4.0/).
Copyright: This open access article is published under a Creative Commons CC BY 4.0 license, which permit the free download, distribution, and reuse, provided that the author and preprint are cited in any reuse.


