
Submitted:
25 September 2025
Posted:
26 September 2025
You are already at the latest version
Abstract
Given the lack of publications establishing the comparability of dPCR measurements for water quality assessment, we performed a robust comparison of Qiacuity and Absolute Q dPCR platforms for detecting and quantifying HF183/BacR287, Entero1a, and EC23S857 using a certified reference material (SRM 2917) and water-sample derived DNA (n = 10). For experiments with SRM 2917, both platforms demonstrated very strong qualitative and quantitative agreement (intraclass correlation coefficients, ICC > 0.96) with comparable precision down to 1.5 – 1.8 log10 GC/reaction (coefficient of variation < 30%) and comparable 95% LODs for each assay (range 4.5 – 10 GC/reaction). During experiments with water samples, both platforms demonstrated strong repeatability among dPCR replicates both within and between platforms (Pearson correlation coefficient > 0.95) and strong quantitative agreement (ICC > 0.84). However, Qiacuity detected HF183/BacR287 more frequently than Absolute Q when results were considered at the dPCR technical replicate (p = 0.0005) or filter replicate level (p = 0.0020) and target abundance was less than 100 GC/100 mL. Nonetheless, in the context of the large uncertainties inherent to interpreting and applying molecular data for water quality management, we conclude that for the assays considered, Qiacuity and Absolute Q would not lead to meaningfully different water quality measurements.
Keywords:
dPCR
; QIAcuity
; Absolute Q
; HF183/BacR287
; Entero1a
; EC23S857
Introduction
Although culture-based measurements, particularly fecal indicator bacteria counts, continue to be the primary workhorses, molecular methods are increasingly deployed for water quality assessment.[1,2] While many challenges remain for reconciling culture-based and molecular measurements to manage public health risks, the use of quantitative polymerase chain reaction (qPCR) for water quality assessment continues to increase in the research literature.[3] The relevance of qPCR for routine water quality assessment has been bolstered by the establishment of standard methods for its use. For example, the US Environmental Protection Agency (EPA) has developed two protocols (Method 1609.1[4] and Method 1611[5]) for the same-day enumeration of Enterococcus spp., a traditional fecal indicator bacteria, in water using qPCR. The agency has also developed Draft Method C for rapid qPCR-based E. coli measurements in water.[6] In addition to testing for traditional fecal indicator bacteria, qPCR methods are also proliferating for microbial source tracking (MST). MST uses PCR-based methods to identify genetic sequences from host-specific commensal bacteria to identify sources of fecal contamination within water samples.[7] A range of qPCR assays have been developed to test water samples for feces from humans, ruminants, cows, dogs, seagulls, pigs, horses, chickens, deer, and others.[8] Here also, the US EPA has developed standard protocols (Method 1696.1[9] and Method 1697.2[10]) that use qPCR assays to assess water for human sewage contamination. Most likely over the next few decades, molecular data, particularly qPCR measurements, will comprise a growing proportion of microbial water quality information.
So far, standard molecular methods for microbial water quality assessment have made exclusive use of qPCR, which has a long history and is widely available in testing labs. However, digital PCR (dPCR), which also makes use of TaqMan assays, is gaining traction as a reliable analytical method for water testing.[11] Digital PCR quantifies genetic targets using most probable number (MPN) techniques premised on a Poisson process during the partitioning of a traditional qPCR reaction into thousands to tens of thousands of independent PCR reactions that are read as positive or negative for the target following thermal cyclic amplification. As reviewed elsewhere, many publications have reported superior sensitivity, precision, and resilience to inhibition for dPCR compared to qPCR during water microbiology applications.[11] Although these could be important advantages for microbial water quality assessment, dPCR availability and experience in testing laboratories remains limited and the method remains significantly more expensive than qPCR on a consumables per sample basis. Even so, droplet digital PCR (ddPCR) has been evaluated against qPCR (Method 1609.1) for monitoring beach water quality [12] , and US EPA Region 9 has approved the use of ddPCR in San Diego County, California, USA for beach water quality monitoring as a pilot program under the Beaches Environmental Assessment and Coastal Health (BEACH) Act.[13,14]
One distinct advantage of dPCR is the ability to estimate template quantities without a calibration curve. By utilizing a Poisson model, dPCR circumvents the relative quantification paradigm of qPCR and the need for platform-specific calibration to translate Cq values into target concentrations. This implies that, all things being equal, different dPCR platforms should yield similar estimates of the template copy number, since the Poisson assumptions are functionally equivalent. Simultaneously, there are operational differences between platforms that could lead to meaningfully different results. One such difference between platforms is the dead volume -- the volume of dPCR reaction solution prepared but not actually included in the partitioning and analyzed in the dPCR reaction. Theoretically, a lower dead volume could lead to increase analytical sensitivity since more of the loaded template is being analyzed. However, there are few if any published comparisons between dPCR platforms to substantiate claims for or against equivalent quantitative performance, particularly for water quality assessment. Here, we used two different dPCR platforms (Qiacuity and Absolute Q) for a head-to-head comparison of their quantitative and qualitative performance with three standardized TaqMan probe assays while testing a certified control plasmid and DNA derived from surface water samples. Our intent during these experiments was to compare the measurements produced from two unique dPCR instruments to examine whether water quality data produced via dPCR might be readily compared between platforms.
Methods
DNA Standard Reference Material
A linearized plasmid DNA standard reference material (SRM 2917, NIST, Gaithersburg, MD, USA) for fecal indicator detection and identification was used as a control material for dPCR experiments.[15] SRM 2917 consists of 6 tubes, each with approximately 200 µL of linearized plasmid DNA, with each tube at a certified copy number ranging from roughly 5.73 to 0.73 log10 copies/µL. The 4,421 bp plasmid contains 13 targets, including markers for human (HF183/BacR287, CPQ_056, CPQ_064), ruminant (Rum2Bac), pig (Pig2Bac), cow (CowM2, CowM3), dog (DG3, DG37), avian (GFD), Enterococcus spp. (Entero1a), and E. coli (EC23S857).[16] For the dPCR experiments described here, working solutions were prepared from Level 3 of the SRM 2917, and then serial dilutions were made using TE (Tris-EDTA) buffer at pH 8.0 as a diluent to examine the limit of detection, and quantification precision for each dPCR platform as a function of analyte concentration and to assess the correlation between paired measurements made on the two dPCR platforms. When not in use the SRM 2917 material and all associated dilutions were stored at 4 °C per the manufacturer’s instructions.
Surface Water Sample Collection, Filtration, and DNA Extraction
Surface water grab samples (n =10, ~1 L each) were collected in sterile bottles from 8 different water bodies in and around Baton Rouge, LA, USA, on October 21, 2022, and November 4, 2022. At the time of sample collection, dissolved oxygen, conductivity, and pH were measured in triplicate using a Hach HQ4100 multi-meter (Loveland, CO, USA) and probes (LDO101, CDC401, PHC101). Sample collection locations, times, dates, and physicochemical data are tabulated in Table S1. Samples were kept on ice in a cooler until returned to the lab, where they were stored at 4 °C for 24 hours or less prior to further processing. Each sample was filtered in triplicate (50 mL or 100 mL) using polycarbonate membranes 47 mm in diameter with a 0.4 µm pore size (HTTP04700, MilliporeSigma, Rockville, MD, USA). After filtration, each membrane was aseptically rolled into a 7 mL SK-38 Soil Grinding Lysis Tube (P000936-LYSK0-A, Bertin Technologies, Montigny-le-Bretonneux, France) and stored at -80 °C for a maximum of approximately three months until homogenization and DNA extraction. After thawing the lysis tubes at room temperature, the membranes were homogenized using a Precellys 24 Homogenizer (Bertin Technologies, Montigny-le-Bretonneux, France) with 3 cycles at 10,000 rpm at 15 s with a 10 s pause between. After homogenization, the bead tubes were centrifuged using a refrigerated benchtop centrifuge (Eppendorf 5810R, Hamburg, Germany) at 4,000 rpm for 4 minutes, and the resulting supernatant was transferred into a clean 2 mL microcentrifuge tube. DNA was then extracted from the supernatant using a DNeasy PowerWater Kit (Qiagen, Hilden, Germany) following the manufacturer’s instructions with a final elution volume of 100 µL. After extraction, purified DNA was stored at -80 °C for roughly three months until assayed by dPCR. The original 10 grab samples filtered and extracted in triplicate yielded a total sample size of 30 surface water sample extracts. Each extract was tested by duplicate dPCR reactions to produce a total experimental dataset of 60 measurements per assay.
Fecal Indicator Assays
The performance of the two dPCR platforms was compared for measurements made with three previously published qPCR assays adapted to the dPCR format. The first, HF183/BacR287, targets a genetic sequence specific to human-associated Bacteroides[17] and has been adopted for qPCR-based discrimination of human fecal contamination in US EPA Method 1696.1.[9] The second assay, Entero1a[18], targets a specific region of ribonucleic RNA associated with the large subunit (23S rRNA) in Enterococcus spp. The Entero1a assay has been standardized for use in qPCR testing of water for enterococci in US EPA Method 1609.1.[4] The third assay, EC23S857, targets a multi-copy sequence in the 23S rRNA of Escherichia coli[19] and has been proposed for qPCR water testing for E. coli in US EPA Draft Method C.[6] Primer and probe sequences for each assay are summarized in Table S2. The primers and probes used in the experiments were purchased from Integrated DNA Technologies (Coralville, IA, USA), including PrimeTime qPCR Zen Probes with Iowa Black FQs (Entero1a - HEX, yellow channel; EC23S857 – HEX, yellow channel) and an MGB Eclipse Probe (HF183/BacR287 – FAM, Green channel). The functionality of each assay for dPCR was first confirmed by testing against a known concentration of SRM 2917 (level 2) on each dPCR platform.
QIAcuity Digital PCR
The QIAcuity Digital PCR System partitions each dPCR reaction onboard the instrument using a Nanoplate and roller system. For the experiments described here, dPCR runs were performed on a QIAcuity One, 5-plex system (Qiagen, Hilden, Germany), referred to as simply Qiacuity throughout, using 26k 24-well Nanoplates. The 26k Nanoplate features 26,000 partitions with a volume of approximately 0.91 nL each, resulting in an effective reaction volume of approximately 23.66 µL and a dead volume loss of 41%. For the experiments reported here, Qiacuity dPCR reactions were prepared according to the manufacturer’s recommended specifications. Reaction mixes were prepared to a total volume of 40 µL, containing forward and reverse primers at a final concentration of 800 nM, 400 nM of probe, and 10 µL of 4x QIAcuity Probe PCR Mastermix (Qiagen). A total of 5 µL of purified nucleic acid was added per reaction mixture, and then the reaction was amended with molecular-grade water to achieve a total volume of 40 µL. All dPCR assay reactions were thermal cycled per the manufacturer’s recommended conditions: PCR initial heat activation at 95 °C for 2 minutes, followed by 40 2-step cycles of denaturation at 95 °C for 15 s and annealing/extension at 60 °C for 30 s (Table S2). Each dPCR experiment included two no-template controls (NTC). During all dPCR experiments, thresholds were manually set based on the separation between the positive and negative partitions in positive and negative control reactions such that all partitions in NTCs were classified as negative for the target using the QIAcuity Software Suite v. 2.1.7.182.
Absolute Q Digital PCR
The QuantStudio Absolute Q Digital PCR System (Applied Biosystems, Waltham, MA, USA) used in the experiments also partitions dPCR reactions onboard the instrument using a Microfluidic Array Plate (MAP, Applied Biosystems) and air pressure. The MAP has 16 reaction wells of 20,480 partitions each with a partition volume of 0.45 nL, resulting in a total effective reaction volume of approximately 9.22 µL with an estimated dead volume loss of 7.8%. The Absolute Q reactions were prepared per the manufacturer’s recommended specifications. Reaction mixes were prepared to a total volume of 10 µL, containing forward and reverse primers at a final concentration of 900 nM, 250 nM of probe, and 2 µL of 5x Absolute Q™ DNA Digital PCR Mastermix (Applied Biosystems). A total of 5 µL of purified nucleic acid was added per reaction mixture, and then the reaction was amended with molecular-grade water to achieve a total volume of 10 µL. All dPCR assay reactions were thermal cycled per the manufacturer’s recommendations: PCR initial heat activation at 96 °C for 10 minutes, followed by 40 2-step cycles of denaturation at 96 °C for 5 s and annealing/extension at 60 °C for 15 s (Table S2). Each dPCR experiment included two no-template controls (NTC). During all dPCR experiments, thresholds were manually set based on the separation between the positive and negative partitions in positive and negative control reactions such that all partitions in the NTCs were classified as negative using the QuantStudio Absolute Q Software v 6.1.
Statistical & Visual Analysis
All figures and statistical analyses were prepared using Prism 10 for macOS (Version 10.5.0 (673) May 27, 2025, GraphPad Software, Boston, MA, USA). All dPCR experimental details are reported per the digital MIQE Guidelines (Table S3).[20] For experiments performed using control materials, when all the technical replicates had at least one positive partition for the dilution level, quantitative precision was assessed using the coefficient of variation (CoV) among all the replicates. When all replicates did not yield at least one positive partition, analytical sensitivity was assessed using the proportion of technical replicates that were positive (PP). In both cases, the mean target concentration was estimated by “hyper-welling”, that is aggregating all replicates into a single “well” to estimate the template most probable number (ƛ) using the total number of partitions and negative partitions aggregated across all the replicates. The limit of detection (LOD) for each assay on each dPCR platform was estimated by fitting a cumulative Gaussian distribution to the fraction of replicates positive (PP) at the log10-transformed mean concentration at each dilution level. The resulting estimators for the mean and standard deviation were then used to calculate the level yielding a 95% probability of detection among the replicates, referred to as the 95% LOD. When multiple dilution levels yielded the same PP among replicates, the highest (i.e., most conservative) mean concentration was used to fit the Gaussian distribution. In the case of water samples, based on the estimated template copy number in the dPCR reaction (GC/µL), gene copies per 100 mL of surface water were calculated per the equation in Table S4. Correlations between mean target concentrations for technical replicates, filter replicates (in the case of water samples), and/or individual water samples within and between platforms were assessed using the Pearson correlation coefficient (r). Qualitative agreement between dPCR platforms during analysis of water samples and control materials was assessed by calculating the percentage of samples yielding concordant (i.e., positive-positive or negative-negative) results. Quantitative agreement between estimated target concentrations was assessed using the intra-class correlation coefficient (ICC) for absolute agreement between single raters calculated using a two-way mixed effects model using IBM SPSS Statistics for Windows (Version 26.0, IBM, SPSS Inc., Chicago, IL, USA).[21]
Results and Discussion
Across all dPCR experiments on both platforms, the NTCs were negative for the targets of interest. Per the dMIQE guidelines[20], examples of positive reactions (from water samples), negative reactions (NTCs), and positive control reactions (SRM 2917) for Qiacuity and Absolute Q are provided in Tables S5 and S6, respectively. Partitioning statistics for all dPCR reactions performed on both platforms during the study are provided in Table S7. In all cases, the dPCR experiments included in the final dataset achieved at least 20,000 partitions per reaction.
Precision, Analytical Sensitivity, Quantitative Agreement with Control Material
We first assessed the quantitative precision (CoV), analytical sensitivity (95% LOD), and quantitative agreement between platforms during experiments performed with the SRM 2917 control material along a 6-level dilution series. Enough of each SRM 2917 dilution was prepared to perform experiments with all three assays on both platforms using the same solution. For all three assays, on both platforms the observed CoVs (calculated on an arithmetic basis) ranged from 10.8% to 29.6% at the level 6 dilution, which was quantified at roughly 75 to 70.2 GC/rxn by HF183/BacR287 and Entero1a (Table 1). Interestingly, despite using the same control material solution, the EC23S857 assay consistently quantified the SRM 2917 target at roughly half the HF183/BacR287 and Entero1a estimated concentration on both platforms, although the CoVs were still low (20.2% to 16.1%). Although there is not a consensus on what CoV is acceptable for defining an LOQ, if we use 35%, the LOQ for the HF183/BacR287 and Entero1a assays are between 1.9 to 1.1 log10 GC/reaction. Applying the same standard, the LOQ for EC23S857 is estimated to be between 1.5 to 0.7 log10 GC/reaction, although one technical replicate was negative on the Absolute Q at the level 5 dilution. Importantly, neither dPCR platform consistently delivered greater analytical precision.
From dilution level 4 down to level 3, the proportion of technical replicates positive for the SRM 2917 control material decreased below 100% and demonstrated decreasing proportions positive (PP), as would be expected for a decreasing concentration gradient. At the extremely low dilution levels (2 and 1), the estimated mean concentrations by hyperwelling across all replicates sometimes increased by small increments (0.1 to 0.2 GC/reaction) and the PP sometimes remained constant despite decreasing dilution levels. This increasing variability is consistent with increased subsampling variation (by pipetting) at the lowest concentration levels, which would be expected. The variability between replicates with decreasing dilution level is displayed visually in Figure S1. The trends observed largely follow what is expected along a dilution series prepared by random subsampling theoretically described by a Poisson process.
The analytical sensitivity of each dPCR platform was assessed by estimating the 95% LOD achieved using the SRM 2917 control, which should be interpreted as the ideal case. Where multiple dilution levels yielded the same PP, the greatest concentration was used and the others removed to produce the most conservative estimate. The cumulative Gaussian models fit to the probability of detection in a single replicate (i.e., the PP) versus the log10 GC/reaction concentration gradient for each assay and platform are displayed in Figure S2. The coefficient of determination (r2 value) in all cases was greater than 0.98. As shown in Table 2, neither platform produced consistently lower 95% LODs across all three assays. The Qiacuity platform achieved 95% LODs of 6.54, 6.83, and 6.51 GC/reaction for the HF183/BacR287, Entero1a, and EC 23S857 assays, respectively. For the same assays, Absolute Q 95% LODs were 6.67, 4.53, and 10.2 GC/reaction, respectively. Although there are some small differences in the estimated mean 95% LODs between platforms, the overlapping confidence intervals suggest the differences are not statistically significant at the sample sizes used in the current study.
We also assessed the qualitative and quantitative agreement between the two dPCR platforms for each assay using SRM 2917. Concordance between dPCR platform replicates (e.g., positive/positive or negative/negative results on both) was 75% for HF183/BacR287 (n = 48), 72.72% for Entero1a (n = 120), and 62.5% for EC23S587 (n = 48) (Table S10). Although this qualitative agreement might seem low, it is important to note that all the SRM 2917 experiments were performed using stringent dilution levels with all experiments performed below 100 GC/reaction and two thirds falling below 10 GC/reaction. Even under these conditions the two platforms yielded concordant results for well more than half the measurements. As shown in Figure S3, Pearson correlations between the two platforms among technical replicates yielding positive partitions, were strong and statistically significant, with coefficients of 0.93 for HF183/BacR287, 0.97 for Entero1a, and 0.98 for EC23S587. This correlation is further substantiated by ICC values (Table S9) of 0.963, 0.983, and 0.983 for SRM 2917 quantified by HF183/BacR287, Entero1a, and EC23S857 assays, respectively, suggesting excellent quantitative agreement between the two dPCR platforms when quantifying the SRM 2917 control material.
Despite the strong potential of dPCR for water quality assessment[11], to our knowledge, there are no peer-reviewed studies examining the comparability of dPCR platforms for measuring molecular targets relevant to water microbiology. Most environmental microbiology publications have instead benchmarked the performance of droplet digital (dd) or dPCR relative to qPCR.[22,23,24,25] A comparison of four dPCR platforms for measuring a certified reference plasmid found they provided estimates close to the certified value and with expected precision, although whether or not the material was linearized and accounting for the partition size was crucial for performance.[26] Similarly, another study found when dPCR partition volume was accounted for two digital PCR platforms and qPCR achieved nearly equal analytical sensitivity and precision for quantifying plasmid and genomic DNA from human cytomegalovirus.[27] In clinical applications, relevant observations include: moderate agreement between ddPCR and dPCR for detecting mutations in cell-free DNA[28]; strong correlation between methylation levels measured by ddPCR and dPCR[29]; “full concordance” in DNA copy numbers measured by qPCR, ddPCR, and dPCR[30]; and, correlation between transcript copy numbers measured by RT-qPCR and on three different RT-dPCR platforms.[31]
Our experience using two microfluidic dPCR platforms to measure a standard reference material containing various fecal indicator targets is consistent with the clinical experience. We found both the Qiacuity and Absolute Q dPCR platforms achieved high precision (CoV < 30%) at target concentrations from 1.5 to 1.8 log10 GC/reaction. Our assessment of precision was performed using the arithmetic target concentrations and should be interpreted as quite stringent. The platforms also achieved statistically comparable 95% LODs for each assay, despite the large difference in dead volumes between Qiacuity (~40%) and Absolute Q (~5%). We hypothesize this is because the rate limiting step is the subsampling from the tube containing the template, theoretically a Poisson process, rather than the probability of the template being included in the effective dPCR reaction volume. Importantly, our findings concerning the 95% LOD should be interpreted as an operational similarity rather than a strictly statistical one. Our limited number of replicates (8 – 20) may not lead to adequate power to detect a “real” difference. However, we assert our findings would be valid for studies using 8 or fewer dPCR replicates, which is most. Our findings suggest that for the three assays tested, Qiacuity and Absolute Q achieved similar precision and analytical sensitivity and estimated similar quantities across a template gradient to levels well below 10 GC/reaction. It is not clear if this equivalence would extend to other digital partitioning methods, such as ddPCR, but microfluidic dPCR may afford a compelling opportunity to harmonize qPCR measurements via reference material quantification, which is a significant source of variation in qPCR measurements.[32] More directly, our results suggest, that for Qiacuity and Absolute Q, estimated target concentrations might be readily comparable across study settings. Further studies to examine the generalizability of our findings across different laboratories, operators, and for additional assays would greatly bolster the generalizability of our results, which are limited by the scope of our interest and the resources we had available for methods development. Importantly, the observations produced using SRM 2917 should be interpreted as an ideal case, which motivated us to experiment with water sample-derived material as well.
Qualitative and Quantitative Agreement with Water Samples
Recognizing that experiments with an SRM control plasmid would not include variability associated with environmental matrices, we also conducted dPCR experiments using surface water samples. Each water sample was filtered in triplicate (filter A, B, C) and then each filter was tested in duplicate for each assay on each dPCR platform. We evaluated the performance of each dPCR platform for quantifying target abundance at both replication levels: technical replicates (i.e., repeat dPCR measurements of the same DNA extract) and filter replicates (dPCR measurements of DNA extracts from three different filtrations of the same surface water sample). Qualitative results across all filter and dPCR replicates on both Qiacuity and Absolute Q (Table S8) indicate among the 10 waterbodies sampled, Entero1a was most prevalent (59/60 replicates on Qiacuity, 58/60 on Absolute Q, p > 0.9999), followed by EC23S857 (51/60 and 49/60, p > 0.5000) and lastly HF183/BacR287 (22/60 and 10/60, p = 0.0005). The greatest difference in the proportion of filter replicates positive (i.e., at least one positive partition among two dPCR replicates) between the two platforms was for HF183/BacR287, where 17/30 filters were positive by Qiacuity while only 7/30 were positive by Absolute Q (p = 0.0020). For Entero1a only a single additional filter was positive by Qiacuity compared to Absolute Q and for EC23S857 the same number tested positive by both platforms. As shown in Table S10, the overall concordance among qualitative filter results from each platform was 66.7% for HF183/BacR287, 86.7% for EC23S857, and 95% for Entero1a. Statistically significant differences in target prevalence among dPCR replicates and filter replicates were only observed for HF183/BacR287, which is notable since the analytical sensitivities established with the plasmid control were equivalent (6.54 vs. 6.67). This suggests there is a difference in sensitivity when working with water sample-derived material that is not sufficiently explained by random variation or the assay 95% LOD and could be an effect of the sample matrix. Further considering the differences in concordance requires including target abundance, since as target concentration decreases in the water column, we would expect that the variability would increase for both quantitative and qualitative measurements due to increasing subsampling variation.
We also evaluated the performance of each dPCR platform for quantifying target abundance at both replication levels. Among technical replicates yielding a positive partition, Pearson correlation coefficients between dPCR replicates for each assay on each platform ranged from 0.95 to 0.99 and were statistically significant (⍺ < 0.05, Figure S4), indicating strong linear agreement between dPCR replicates on each platform. Quantitative agreement between dPCR technical replicates was excellent for all three assays on both Qiacuity and Absolute Q, with ICCs of 0.993 and 0.965, respectively for HF183/BacR287, 0.969 and 0.981, respectively, for EC23S857 and 1.000 on both platforms for Entero1a (Table S9). When comparing dPCR technical replicates between dPCR platforms (Figure S5), estimated target abundance was very strongly (r > 0.95, HF183/BacR287, Entero1a) to strongly (r = 0.80, EC23S857) correlated. Similarly, across all technical replicates, ICCs suggested excellent quantitative agreement between Qiacuity and Absolute Q for HF183/BacR287 (0.960) and Entero1a (0.992) and good agreement for EC23S857 (0.839) (Table S9).
At the level of filter replicates, the Pearson correlation remained strong for Entero1a on both Qiacuity (r > 0.97, Figure S6(A1,A2)) and Absolute Q (r > 0.98, Figure S6(B1,B2)). Although the Entero1a quantitative agreement between filter replicates on both platforms remained good (ICC = 0.882 and 0.924, respectively, Table S9), it was not as strong as among dPCR technical replicates. Conversely, for EC23S857, correlation between filter replicates was notably lower on both platforms, ranging from 0.71 to 0.93 on Qiacuity and 0.45 to 70 on Absolute Q (Figure S7), although the quantitative agreement could still be considered good (Table S9). In the case of HF183, there were an insufficient number of individual filter replicates yielding positive partitions by dPCR on either platform to assess the correlation or ICC. As shown in Figure S8, mean target concentrations estimated by Qiacuity and Absolute Q for each water sample (i.e., for all six dPCR replicates from all three filter replicates), were very strongly correlated for Entero1a (r = 1.00) and strongly correlated for EC23S857 (r = 0.87). Only two water samples produced paired HF183/BacR287 quantities so the correlation between platforms could not be assessed.
While our statistical results demonstrate high precision (i.e., repeatability) for each individual dPCR platform and strong linear correlation and quantitative agreement between them, at the most fundamental level the primary consideration is that the platforms return similar results during microbial water quality assessments. As shown in Figure 1, from a water quality assessment perspective, the log10-scale agreement between filter replicate pairs on each dPCR platform is reasonably strong for most sites, especially when the target abundance is greater than 2 log10 GC/100 mL. Enterococci marker Entero1a was consistently detected at all sites, with estimated abundance ranging from approximately 6 log10 GC/100 mL in the Corporation Canal (CC) to less than 3 log10 GC/100 mL in some filter replicates for Bayou Fountain (F) and Sandy Creek (SC). The rank order from highest Entero1a abundance to lowest (averaging all six measurements) was the same for both dPCR platforms, except for one positional switch between site F (Δlog10 = 0.22 between platforms) and Comite River 1 (Com1, Δlog10 = 0.02 between platforms). EC23S857, genetic marker for E. coli, was also detected at all sites, although less consistently across filter replicates. EC23S857 abundance ranged from roughly 3.5 log10 GC/100 mL at CC to just under 2 log10 GC/100 mL in Bayou Manchac (M). In the case of EC23S857, the ordinal agreement from highest abundance to lowest between dPCR platforms was much less than Entero1a, with 7 sites having a positional switch; however, the change in log10 values between platforms only ranged from 0.55 (Com2) to 0.04 (F), suggesting that the re-ordering is largely due to a much smaller gradient among the EC23S857 values observed across all sites. When assessed by Entero1a or EC23S857 abundance on either platform, the division of sites into upper-half (CC, Com2, Com3, F, Com1) and lower-half (CP, GP, M, SC, A) is consistent for both. In the case of human sewage marker HF183/BacR287, no site yielded detections across all filter replicates on both platforms, and only two sites yielded detection by both platforms – Bayou Fountain (F, 5 of 6 filter replicates, 2 to 3 log10 GC/100 mL) and Amite River (A, 2 of 6 filter replicates, <2 log10 GC/100 mL). There were sporadic low-level detections by Qiacuity in individual filter replicates for Comite River 3 (Com3), City Park Lake (CP), and Corporation Canal (CC). Interpreted together, the dPCR results suggest the presence of fecal indicator bacteria DNA across all 10 sites with particularly high levels in Corporation Canal, the Comite River, and Bayou Fountain. In the case of Bayou Fountain, consistent detection of HF183/BacR287 suggests human fecal contamination of the waterbody, most likely from sewage, and warrants further investigation.
While our comparison of these two dPCR platforms for the three assays is robust, alone it cannot answer the most pertinent question for assessing our results – what level of agreement between dPCR systems is required for the purpose of water quality assessment? When targets are expected to be present at higher abundance, such as fecal indicator and MST markers in highly impacted waterbodies, either dPCR platform performs well for detection and quantification. Even so, in isolation different markers can yield conflicting results during water quality assessment, especially in waterways subjected to multiple fecal input sources, as has been previously noted.[33,34] This challenge is likely to persist with the proliferation of many assays for source tracking.[35] When considered on a strictly quantitative basis, our results produced a different ranking of sites for different fecal indicator assays on the same platform and the same assay on different platforms. However, when our results are considered on a more qualitative basis, the results for all assays on all platforms consistently indicated an upper half of more impacted sites and a lower half of less impacted sites. This is consistent with the holistic and semi-quantitative nature of water quality assessment and the need for frameworks and models to incorporate a variety of data streams for decision making[36,37], especially in scenarios where targets are present at low abundance and data are highly censored.[38]
Ultimately, the risk posed to human health by fecal pollution varies depending on the source of fecal pollution and the potential microbial hazards, emphasizing the importance of a context specific approach that links fecal indicators to human health risks.[39,40,41] For example, risk assessment models have suggested a threshold of approximately 2.7 log10 GC/100 mL of HF183 to maintain risks below acceptable levels due to recreation in water primarily impacted by human sewage[42], although this value likely depends on the source of the sewage within the collection system[43], not to mention the difficulty of linking molecular signals to infectivity.[3] In this case, if the improved sensitivity of Qiacuity for detecting HF183/BacR287 in water samples were to extend to detecting human pathogens, it could confer an advantage over Absolute Q. Nonetheless, we assert that in the context of the complexity and uncertainty of interpreting molecular data for water quality assessment, the impact of measurement differences between Qiacuity and Absolute Q dPCR for the three assays considered in our study would de minimis, especially when experiments are performed to standards such as dMIQE[44] or EMMI guidelines.[45]
Study Limitations
Several important limitations constrain the generalizability of our findings. The experiments were all performed by a single dPCR operator working in a single lab. Additional experiments adding layers of variation, such as multiple operators and comparing across multiple labs would be useful to establish the reproducibility of our findings. We only performed our experiments using three assays, although we selected assays that are in use or proposed for use is widely applied standard methods for water quality assessment. It would be useful to examine whether our findings extend to other assays. We also only worked with only 10 surface water grab samples from a limited geographic area, so our ability to assess matrix effects may not be comprehensive. Finally, we only considered two dPCR platforms, both of which are microfluidic, among the many platforms commercially available. Such platforms are expensive, and we could only afford two, but whether the comparability extends to ddPCR is an open and pertinent question.
Conclusions
Overall, we find that the Qiacuity and Absolute Q dPCR platforms performed comparatively for measuring a linearized plasmid control material by three different assays (HF183/BacR287, Entero1a, EC23S857) with strong qualitative and quantitative agreement (ICC > 0.96) for target levels down to 1.5 log10 GC/reaction. Below this threshold, the two platforms also produced statistically similar 95% LODs for each of the three assays considered, ranging from 4.5 to 10 GC/reaction. For water samples, Qiacuity detected HF183/BacR287 more frequently than Absolute Q (p < 0.05), although the estimated abundance was typically less than 100 GC/100 mL. For more prevalent and abundant targets such as Entero1a and EC23S857, both platforms achieved very strong correlation among dPCR replicates (r > 0.95) and demonstrated strong quantitative agreement (ICC > 0.84). Given the large uncertainties when interpreting molecular marker data for water quality management, we conclude Qiacuity and Absolute Q are functionally equivalent for the three fecal indicator assays considered in our study.
Supplementary Materials
The following supporting information can be downloaded at: Preprints.org.
References
- Holcomb, D. A.; Stewart, J. R. Microbial Indicators of Fecal Pollution: Recent Progress and Challenges in Assessing Water Quality. Curr. Environ. Health Rep. 2020, 7 (3), 311–324. [CrossRef]
- Brown, J.; Grammer, P. Indicators of Microbial Quality *. In Routledge Handbook of Water and Health; Routledge, 2015.
- Haas, C. N. Quantitative Microbial Risk Assessment and Molecular Biology: Paths to Integration. Environ. Sci. Technol. 2020, 54 (14), 8539–8546. [CrossRef]
- US EPA. Method 1609.1: Enterococci in Water by TaqMan Quantitative Polymerase Chain Reaction (qPCR) with Internal Amplification Control (IAC) Assay; EPA-820-R-15-099; Office of Water: Washington, DC, 2015. https://www.epa.gov/sites/default/files/2015-08/documents/method_1609-1-enterococcus-iac_2015_3.pdf.
- US EPA. Method 1611: Enterococci in Water by TaqMan Quantitative Polymerase Chain Reaction (qPCR) Assay; EPA-821-R-12-008; 2012.
- Lane, M. J.; McNair, J. N.; Rediske, R. R.; Briggs, S.; Sivaganesan, M.; Haugland, R. Simplified Analysis of Measurement Data from A Rapid E. Coli qPCR Method (EPA Draft Method C) Using A Standardized Excel Workbook. Water 2020, 12 (3), 775. [CrossRef]
- Microbial Source Tracking: Methods, Applications, and Case Studies; Hagedorn, C., Blanch, A. R., Harwood, V. J., Eds.; Springer: New York, NY, 2011. [CrossRef]
- Boehm, A. B.; Van De Werfhorst, L. C.; Griffith, J. F.; Holden, P. A.; Jay, J. A.; Shanks, O. C.; Wang, D.; Weisberg, S. B. Performance of Forty-One Microbial Source Tracking Methods: A Twenty-Seven Lab Evaluation Study. Water Res. 2013, 47 (18), 6812–6828. [CrossRef]
- US EPA. Method 1696.1: Characterization of Human Fecal Pollution in Water by HF183/BacR287 TaqMan® Quantitative Polymerase Chain Reaction (qPCR) Assay; EPA 821-R-22-001; Office of Water, 2022; p 56. https://www.epa.gov/system/files/documents/2022-01/draft_method-1696.1-hf183_01052022_508.pdf.
- US EPA. Method 1697.2: Characterization of Human Fecal Pollution in Water by HumM2 TaqMan Quantitative Polymerase Chain Reaction (qPCR) Assay; EPA-821-R-23-010; 2023.
- Tiwari, A.; Ahmed, W.; Oikarinen, S.; Sherchan, S. P.; Heikinheimo, A.; Jiang, G.; Simpson, S. L.; Greaves, J.; Bivins, A. Application of Digital PCR for Public Health-Related Water Quality Monitoring. Sci. Total Environ. 2022, 837, 155663. [CrossRef]
- Crain, C.; Kezer, K.; Steele, S.; Owiti, J.; Rao, S.; Victorio, M.; Austin, B.; Volner, A.; Draper, W.; Griffith, J.; Steele, J.; Seifert, M. Application of ddPCR for Detection of Enterococcus Spp. in Coastal Water Quality Monitoring. J. Microbiol. Methods 2021, 184, 106206. [CrossRef]
- US EPA Region 9. Re: REQUEST FOR CONCURRENCE TO IMPLEMENT ddPCR FOR BEACH WATER QUALITY RAPID DETECTION METHOD FOR RECREATIONAL BEACHES IN SAN DIEGO COUNTY, 2020. https://www.epa.gov/sites/default/files/2021-04/documents/epa_approval_of_ddpcr_beach_pilot-san-diego-c-10-06-2020.pdf.
- US EPA, O. EPA approves rapid test to assess beach water quality in San Diego County. https://www.epa.gov/newsreleases/epa-approves-rapid-test-assess-beach-water-quality-san-diego-county (accessed 2025-08-06).
- Willis, J. R.; Sivaganesan, M.; Haugland, R. A.; Kralj, J.; Servetas, S.; Hunter, M. E.; Jackson, S. A.; Shanks, O. C. Performance of NIST SRM® 2917 with 13 Recreational Water Quality Monitoring qPCR Assays. Water Res. 2022, 212, 118114. [CrossRef]
- Kralj, J.; Servetas, S.; Hunter, M.; Toman, B.; Jackson, S. NIST Special Publication 260-221: Certification of Standard Reference Material® 2917 Plasmid DNA for Fecal Indicator Detection and Identification; National Institute of Standards and Technology, 2021; p 46. https://nvlpubs.nist.gov/nistpubs/SpecialPublications/NIST.SP.260-221.pdf.
- Green, H. C.; Haugland, R. A.; Varma, M.; Millen, H. T.; Borchardt, M. A.; Field, K. G.; Walters, W. A.; Knight, R.; Sivaganesan, M.; Kelty, C. A.; Shanks, O. C. Improved HF183 Quantitative Real-Time PCR Assay for Characterization of Human Fecal Pollution in Ambient Surface Water Samples. Appl. Environ. Microbiol. 2014, 80 (10), 3086–3094. [CrossRef]
- Haugland, R. A.; Siefring, S.; Lavender, J.; Varma, M. Influences of Sample Interference and Interference Controls on Quantification of Enterococci Fecal Indicator Bacteria in Surface Water Samples by the qPCR Method. Water Res. 2012, 46 (18), 5989–6001. [CrossRef]
- Chern, E. C.; Siefring, S.; Paar, J.; Doolittle, M.; Haugland, R. A. Comparison of Quantitative PCR Assays for Escherichia Coli Targeting Ribosomal RNA and Single Copy Genes. Lett. Appl. Microbiol. 2011, 52 (3), 298–306. [CrossRef]
- Huggett, J. F.; Foy, C. A.; Benes, V.; Emslie, K.; Garson, J. A.; Haynes, R.; Hellemans, J.; Kubista, M.; Mueller, R. D.; Nolan, T.; Pfaffl, M. W.; Shipley, G. L.; Vandesompele, J.; Wittwer, C. T.; Bustin, S. A. The Digital MIQE Guidelines: Minimum Information for Publication of Quantitative Digital PCR Experiments. Clin. Chem. 2013, 59 (6), 892–902. [CrossRef]
- Koo, T. K.; Li, M. Y. A Guideline of Selecting and Reporting Intraclass Correlation Coefficients for Reliability Research. J. Chiropr. Med. 2016, 15 (2), 155–163. [CrossRef]
- Crain, C.; Kezer, K.; Steele, S.; Owiti, J.; Rao, S.; Victorio, M.; Austin, B.; Volner, A.; Draper, W.; Griffith, J.; Steele, J.; Seifert, M. Application of ddPCR for Detection of Enterococcus Spp. in Coastal Water Quality Monitoring. J. Microbiol. Methods 2021, 184, 106206. [CrossRef]
- Singh, G.; Sithebe, A.; Enitan, A. M.; Kumari, S.; Bux, F.; Stenström, T. A. Comparison of Droplet Digital PCR and Quantitative PCR for the Detection of Salmonella and Its Application for River Sediments. J. Water Health 2017, 15 (4), 505–508. [CrossRef]
- Ahmed, W.; Smith, W. J. M.; Metcalfe, S.; Jackson, G.; Choi, P. M.; Morrison, M.; Field, D.; Gyawali, P.; Bivins, A.; Bibby, K.; Simpson, S. L. Comparison of RT-qPCR and RT-dPCR Platforms for the Trace Detection of SARS-CoV-2 RNA in Wastewater. ACS EST Water 2022, 2 (11), 1871–1880. [CrossRef]
- Nshimyimana, J. P.; Cruz, M. C.; Wuertz, S.; Thompson, J. R. Variably Improved Microbial Source Tracking with Digital Droplet PCR. Water Res. 2019, 159, 192–202. [CrossRef]
- Dong, L.; Meng, Y.; Sui, Z.; Wang, J.; Wu, L.; Fu, B. Comparison of Four Digital PCR Platforms for Accurate Quantification of DNA Copy Number of a Certified Plasmid DNA Reference Material. Sci. Rep. 2015, 5 (1), 13174. [CrossRef]
- Pavšič, J.; Žel, J.; Milavec, M. Assessment of the Real-Time PCR and Different Digital PCR Platforms for DNA Quantification. Anal. Bioanal. Chem. 2016, 408 (1), 107–121. [CrossRef]
- Crucitta, S.; Ruglioni, M.; Novi, C.; Manganiello, M.; Arici, R.; Petrini, I.; Pardini, E.; Cucchiara, F.; Marmorino, F.; Cremolini, C.; Fogli, S.; Danesi, R.; Del Re, M. Comparison of Digital PCR Systems for the Analysis of Liquid Biopsy Samples of Patients Affected by Lung and Colorectal Cancer. Clin. Chim. Acta 2023, 541, 117239. [CrossRef]
- Samec, M.; Baranova, I.; Dvorska, D.; Biringer, K.; Kalman, M.; Pec, M.; Dankova, Z. Comparative Analysis of Two Digital PCR Platforms for Detecting DNA Methylation in Patient Samples. Cell Biochem. Funct. 2025, 43 (8), e70112. [CrossRef]
- Kløve-Mogensen, K.; Terp, S. K.; Steffensen, R. Comparison of Real-Time Quantitative PCR and Two Digital PCR Platforms to Detect Copy Number Variation in FCGR3B. J. Immunol. Methods 2024, 526, 113628. [CrossRef]
- Alikian, M.; Whale, A. S.; Akiki, S.; Piechocki, K.; Torrado, C.; Myint, T.; Cowen, S.; Griffiths, M.; Reid, A. G.; Apperley, J.; White, H.; Huggett, J. F.; Foroni, L. RT-qPCR and RT-Digital PCR: A Comparison of Different Platforms for the Evaluation of Residual Disease in Chronic Myeloid Leukemia. Clin. Chem. 2017, 63 (2), 525–531. [CrossRef]
- Bivins, A.; Kaya, D.; Bibby, K.; Simpson, S. L.; Bustin, S. A.; Shanks, O. C.; Ahmed, W. Variability in RT-qPCR Assay Parameters Indicates Unreliable SARS-CoV-2 RNA Quantification for Wastewater Surveillance. Water Res. 2021, 203, 117516.
- Brooks, Y. M.; Spirito, C. M.; Bae, J. S.; Hong, A.; Mosier, E. M.; Sausele, D. J.; Fernandez-Baca, C. P.; Epstein, J. L.; Shapley, D. J.; Goodman, L. B.; Anderson, R. R.; Glaser, A. L.; Richardson, R. E. Fecal Indicator Bacteria, Fecal Source Tracking Markers, and Pathogens Detected in Two Hudson River Tributaries. Water Res. 2020, 171, 115342. [CrossRef]
- McMinn, B. R.; Korajkic, A.; Kelleher, J.; Diedrich, A.; Pemberton, A.; Willis, J. R.; Sivaganesan, M.; Shireman, B.; Doyle, A.; Shanks, O. C. Quantitative Fecal Pollution Assessment with Bacterial, Viral, and Molecular Methods in Small Stream Tributaries. Sci. Total Environ. 2024, 951, 175740. [CrossRef]
- Zlender, T.; Rupnik, M. An Overview of Molecular Markers for Identification of Non-Human Fecal Pollution Sources. Front. Microbiol. 2023, 14. [CrossRef]
- Hart, J. J.; Jamison, M. N.; Porter, A. M.; McNair, J. N.; Szlag, D. C.; Rediske, R. R. Fecal Impairment Framework, A New Conceptual Framework for Assessing Fecal Contamination in Recreational Waters. Environ. Manage. 2024, 73 (2), 443–456. [CrossRef]
- Demeter, K.; Linke, R.; Ballesté, E.; Reischer, G.; Mayer, R. E.; Vierheilig, J.; Kolm, C.; Stevenson, M. E.; Derx, J.; Kirschner, A. K. T.; Sommer, R.; Shanks, O. C.; Blanch, A. R.; Rose, J. B.; Ahmed, W.; Farnleitner, A. H. Have Genetic Targets for Faecal Pollution Diagnostics and Source Tracking Revolutionized Water Quality Analysis Yet? FEMS Microbiol. Rev. 2023, 47 (4), fuad028. [CrossRef]
- Sivaganesan, M.; Willis, J. R.; Diedrich, A.; Shanks, O. C. A Fecal Score Approximation Model for Analysis of Real-Time Quantitative PCR Fecal Source Identification Measurements. Water Res. 2024, 255, 121482. [CrossRef]
- Fernández-Baca, C. P.; Spirito, C. M.; Bae, J. S.; Szegletes, Z. M.; Barott, N.; Sausele, D. J.; Brooks, Y. M.; Weller, D. L.; Richardson, R. E. Rapid qPCR-Based Water Quality Monitoring in New York State Recreational Waters. Front. Water 2021, 3. [CrossRef]
- Yamahara, K. M.; Keymer, D. P.; Layton, B. A.; Walters, S. P.; Thompson, R. S.; Rosener, M.; Boehm, A. B. Application of Molecular Source Tracking and Mass Balance Approach to Identify Potential Sources of Fecal Indicator Bacteria in a Tropical River. PLOS ONE 2020, 15 (4), e0232054. [CrossRef]
- Holcomb, D. A.; Stewart, J. R. Microbial Indicators of Fecal Pollution: Recent Progress and Challenges in Assessing Water Quality. Curr. Environ. Health Rep. 2020, 7 (3), 311–324. [CrossRef]
- Boehm, A. B.; Soller, J. A. Refined Ambient Water Quality Thresholds for Human-Associated Fecal Indicator HF183 for Recreational Waters with and without Co-Occurring Gull Fecal Contamination. Microb. Risk Anal. 2020, 16, 100139. [CrossRef]
- Curtis, K.; Jahne, M.; Keeling, D.; Gonzalez, R. The Effect of Sewage Source on HF183 Risk-Based Threshold Estimation for Recreational Water Quality Management. Microb. Risk Anal. 2024, 27–28, 100315. [CrossRef]
- The dMIQE Group; Huggett, J. F. The Digital MIQE Guidelines Update: Minimum Information for Publication of Quantitative Digital PCR Experiments for 2020. Clin. Chem. 2020, 66 (8), 1012–1029. [CrossRef]
- Borchardt, M. A.; Boehm, A. B.; Salit, M.; Spencer, S. K.; Wigginton, K. R.; Noble, R. T. The Environmental Microbiology Minimum Information (EMMI) Guidelines: qPCR and dPCR Quality and Reporting for Environmental Microbiology. Environ. Sci. Technol. 2021, 55 (15), 10210–10223. [CrossRef]
Figure 1.
Fecal indicator concentrations at 10 sampling sites as measured in triplicate filters (A, B, C) and dPCR duplicates on Qiacuity (blue symbols) and Absolute Q (green symbols) dPCR systems.
Figure 1.
Fecal indicator concentrations at 10 sampling sites as measured in triplicate filters (A, B, C) and dPCR duplicates on Qiacuity (blue symbols) and Absolute Q (green symbols) dPCR systems.
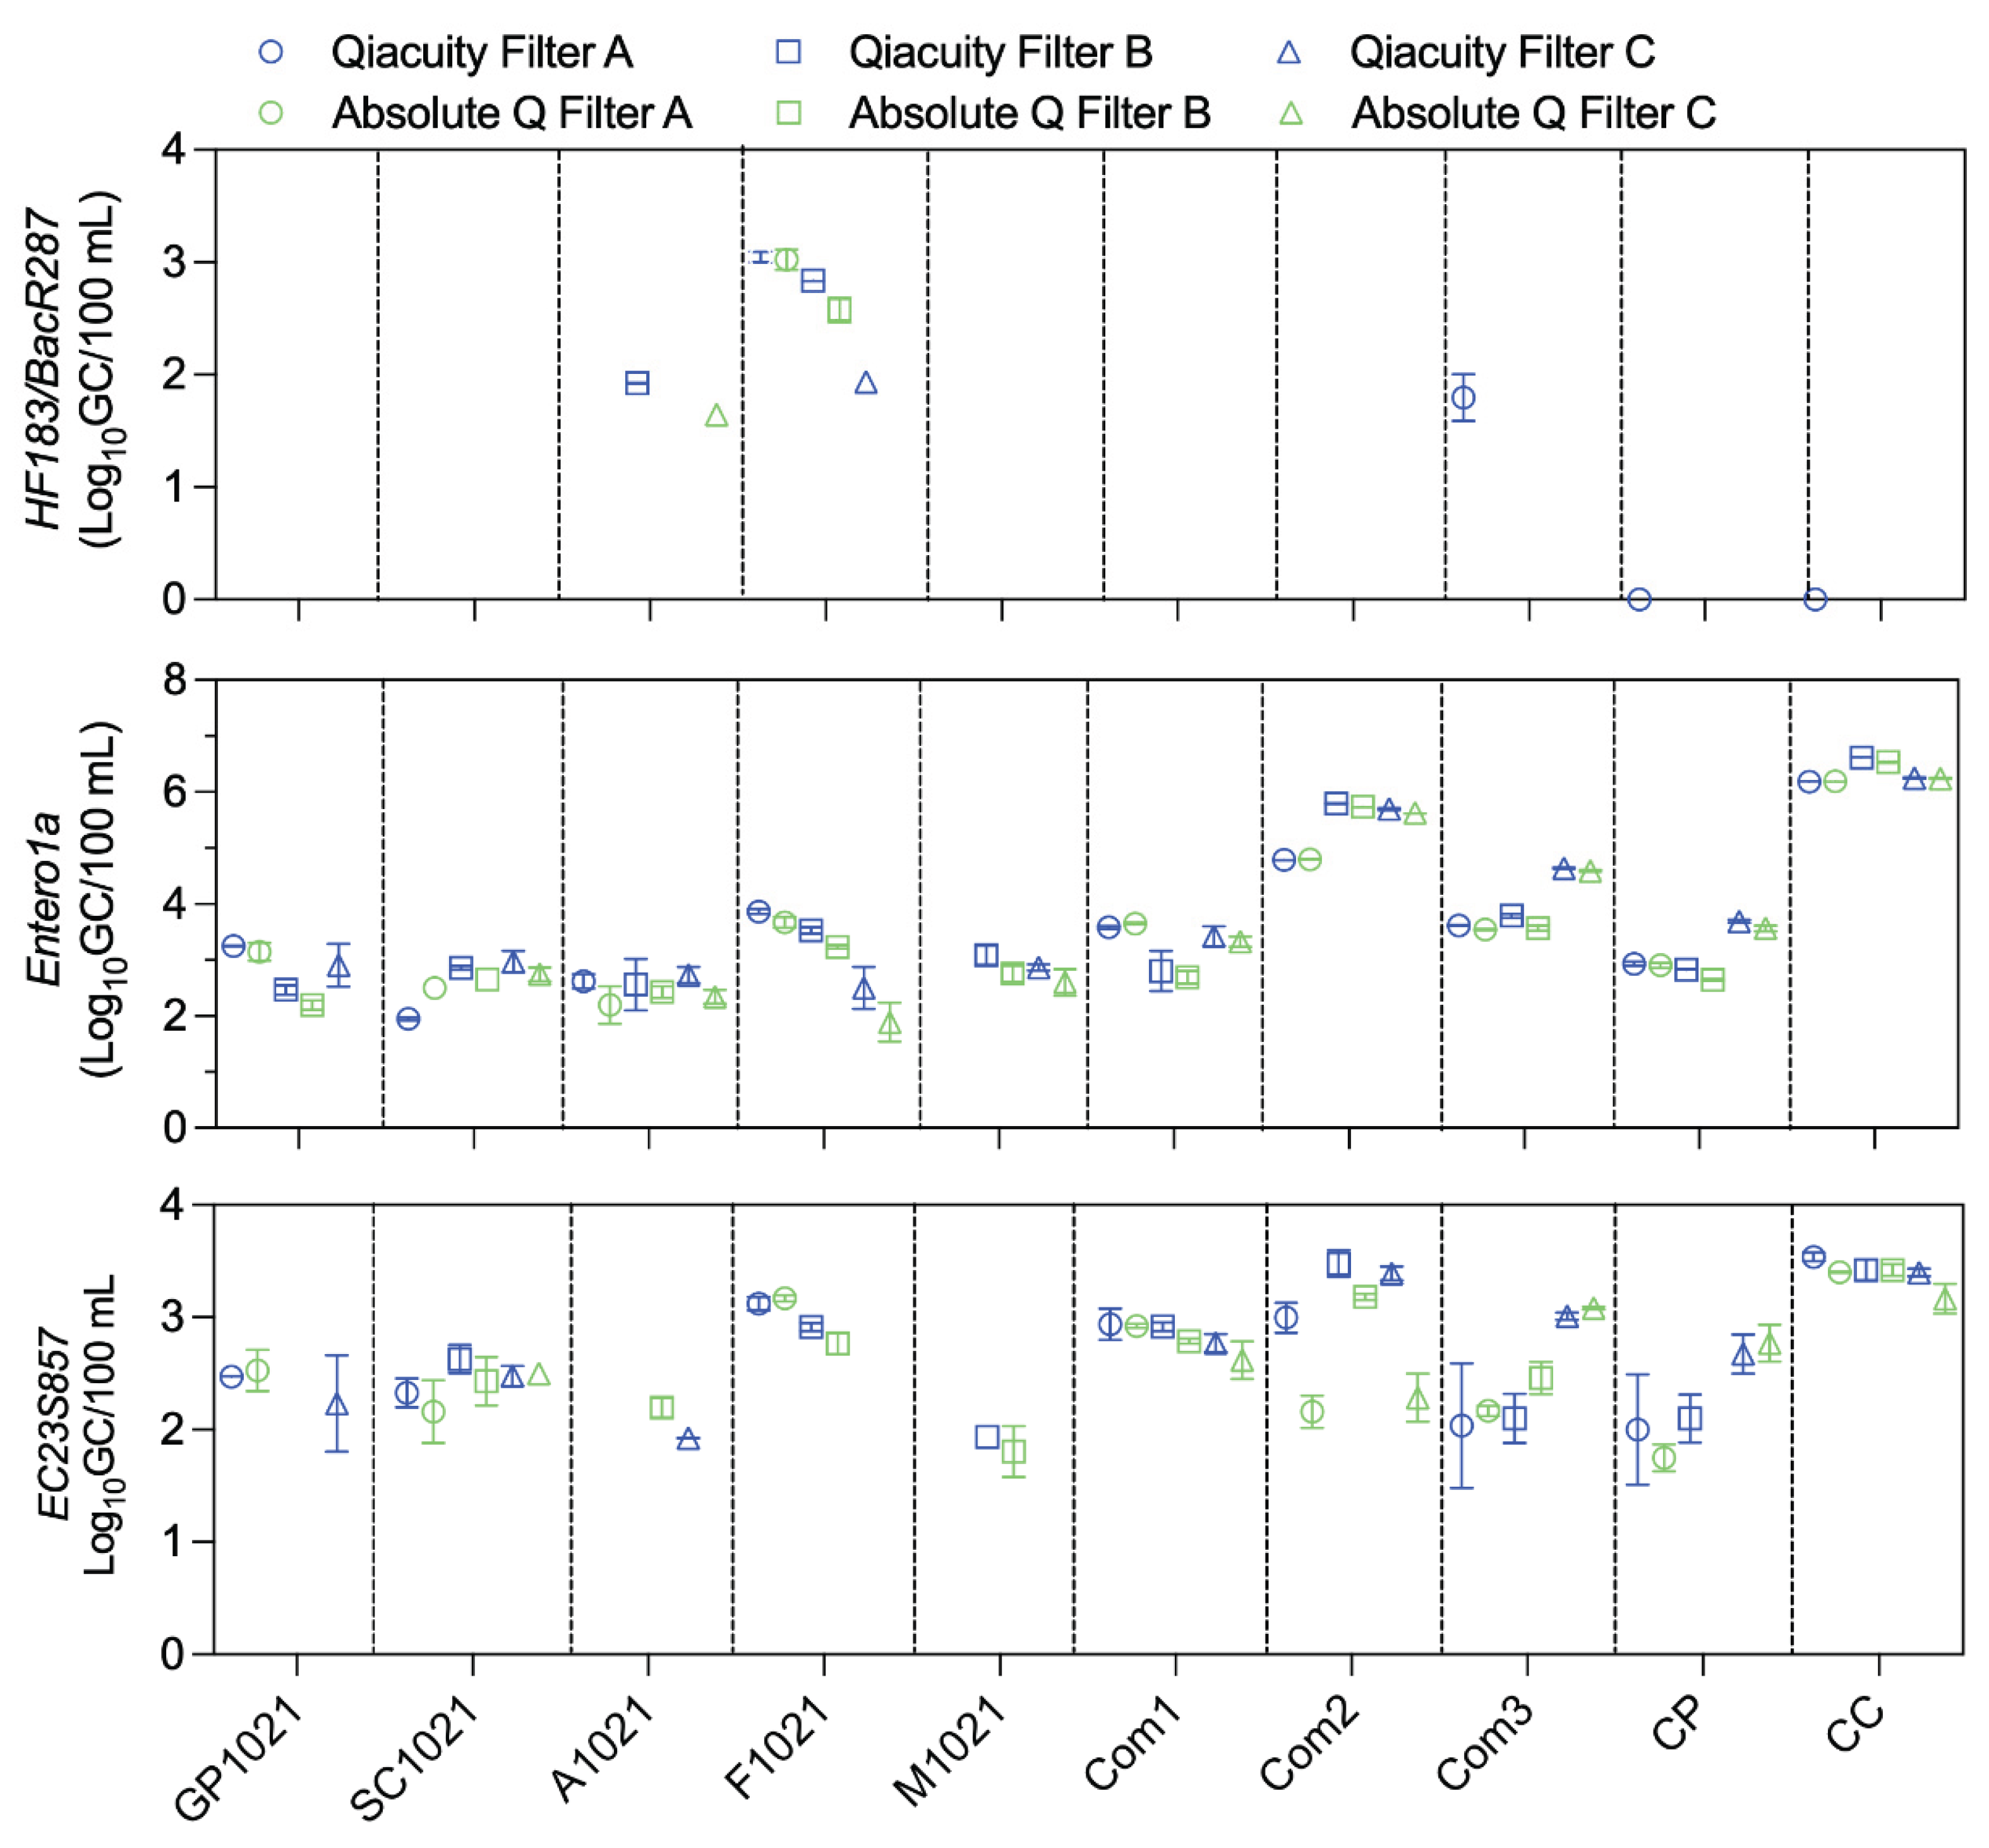

Table 1.
Mean concentrations of SRM2917 among dPCR technical replicates at 6 levels.
| SRM2917 (Dilution Levels) | HF183/BacR287 GC/rxn (CoV or PP)* |
Entero1a GC/rxn (CoV or PP)* |
EC23S857 GC/rxn (CoV or PP)* |
|||
| Qiacuity | Absolute Q | Qiacuity | Absolute Q | Qiacuity | Absolute Q | |
| Level 6 | 76.7 (10.8) | 73.4 (19.1) | 71.4 (29.6) | 69.0 (25.7) | 30.7 (20.2) | 33.6 (16.1) |
| Level 5 | 14.1 (38.0) | 11.2 (38.0) | 11.9 (57.5) | 12.2 (26.3) | 6.2 (38.5) | 4.0 (7/8) |
| Level 4 | 3.8 (7/8) | 0.9 (3/8) | 3.5 (16/20) | 2.4 (16/20) | 1.4 (4/8) | 0.6 (3/8) |
| Level 3 | 0.5 (2/8) | 0.1 (1/8) | 2.4 (13/20) | 1.5 (13/20) | 0.5 (2/8) | 0.3 (2/8) |
| Level 2 | 0.3 (1/8) | 0.3 (1/8) | 1.9 (11/20) | 1.4 (11/20) | 0.6 (2/8) | 0.3 (2/8) |
| Level 1 | 0 (0/8) | 0.1 (1/8) | 1.7 (11/20) | 1.2 (11/20) | 0.6 (2/8) | 0.1 (1/8) |
*CoV= Coefficient of Variation (%) among technical replicates (when all replicates positive); PP= Proportion of replicates positive.
Table 2.
95% limit of detection for three fecal indicator assays on the Qiacuity and Absolute Q platforms.
Table 2.
95% limit of detection for three fecal indicator assays on the Qiacuity and Absolute Q platforms.
| dPCR Assays | 95% LOD (GC/rxn) (95% CI) |
|
|---|---|---|
| Qiacuity | Absolute Q | |
| HF183/BacR287 | 6.54 (5.15 – 8.35) |
6.67 (3.24 – 14.0) |
| Entero1a | 6.83 (5.57 – 8.53) |
4.53 (1.86 – 17.4) |
| EC23S857 | 6.51 (2.72 – 22.5) |
10.2 (3.59 – 34.9) |
Disclaimer/Publisher’s Note: The statements, opinions and data contained in all publications are solely those of the individual author(s) and contributor(s) and not of MDPI and/or the editor(s). MDPI and/or the editor(s) disclaim responsibility for any injury to people or property resulting from any ideas, methods, instructions or products referred to in the content. |
© 2025 by the authors. Licensee MDPI, Basel, Switzerland. This article is an open access article distributed under the terms and conditions of the Creative Commons Attribution (CC BY) license (http://creativecommons.org/licenses/by/4.0/).
Copyright: This open access article is published under a Creative Commons CC BY 4.0 license, which permit the free download, distribution, and reuse, provided that the author and preprint are cited in any reuse.


