
Submitted:
21 October 2024
Posted:
22 October 2024
You are already at the latest version
Abstract
Background: In recent years, undernutrition has remained a significant public health issue in Tu-nisia, increasing the risk of illness and mortality in young children. Therefore, this study aims to analyse the prevalence and factors contributing to undernutrition among Tunisian children aged 0-23 months; Methods: The study included 3265 children aged 0-23 months from the 2011-2023 Tunisia Multiple Indicator Cluster Surveys (MICS). Trends and logistic regression analyses were used to determine the prevalence and predictors of undernutrition; Results: The prevalence of stunting, wasting, and underweight in infants and children aged 0-23 months has increased by 3.3%, 0.5%, and 2.1%, respectively. Stunting and underweight were more common among infants aged 0-5 months (11.8% for stunting, 8.9% for underweight, p < 0.01), and first-time mothers (8.3% for stunting, 4.1% for underweight, p < 0.01). In 2023, compared to 2011, the odds of stunt-ing, wasting, and being underweight have increased by 22%, 16%, and 70% respectively. Infants aged 0-5 months had higher odds of undernutrition in all three indices. Children of obese or overweight mothers, and those who started breastfeeding late, were more likely to be stunted. Boys had significantly higher odds of wasting and underweight. Small birth weight, and dura-tion of breastfeeding > 12months had significantly higher odds of being underweight; Conclu-sions: This study shows that infants aged 0-5 months, first-time mothers, boys, and children from poor households in Tunisia are at a higher odd of undernutrition. To address the growing issue of undernutrition in Tunisian children, enhancing maternal and child health and nutrition ser-vices, improve parental education, and implement community-based programs that provide breastfeeding and nutritional education to infants born to new mothers and mothers with high/low BMI is recommended.
Keywords:
stunting
; wasting
; underweight
; under 2 years
; undernourished
1. Introduction
The most rapid growth faltering occurs during the first 2 years of life (reference needed). During this critical period, adequate nutrition is essential to prevent stunting and undernutrition, which can have long-term effects on cognitive development, educational achievement, and future economic productivity [1]. Adequate nutrition during this crucial period strengthens an infant’s immune system and reduces the risk of chronic diseases, such as obesity and diabetes, later in life [2]. Undernutrition in children is a significant public health issue in many low- to middle-income countries (LMIC). Undernutrition is the underlying cause of 35% of child deaths and contributes to 11% of the global disease burden [3]. Undernutrition is a key predictor of poor growth and morbidity in infants and young children (reference). Along with this, undernutrition can lead to delayed cognitive development, poor school performance in middle childhood and adolescence, ultimately reducing the potential earning capacity of children in the future, perpetuating poverty [1]. In addition, undernutrition has a broader impact by reducing the physical and cognitive abilities of the workforce, leading to hindered national development and economic productivity [2]. Tackling undernutrition is not just about public health; it also plays a crucial role in promoting long-term economic growth and social stability (reference needed).
In 2022, it was estimated that about one in five African children were affected by undernutrition, with 31% presenting with stunting [4]. This accounted for approximately 79% of the average number of under-five deaths in the region [5]. Northern Africa reported the lowest average number of deaths [5]. However, the situation in North Africa has worsened due to factors such as recent political instability, poverty, climate change-induced natural disasters, and the recent pandemic. Challenges such as these can worsen mother and child health issues, placing additional pressure on vulnerable communities by limiting the availability of maternal and child healthcare services, food, and other essential resources, such as clean water and sanitation, places additional burden on vulnerable communities, making the issues of malnutrition and disease even worse [6,7,8]. The negative impact of undernutrition extends to national economies by reducing productivity and increasing healthcare costs, thereby straining education and health systems and potentially triggering a high rate of malnutrition in the region [6].
Investing in research and interventions aimed at improving maternal and child nutrition, particularly in low- and middle-income countries like Tunisia has the potential to break the cycle of poverty [1,9]. Targeted investment for research programs not only enhances the well-being of mothers and children can also promote economic and social development, ultimately contributing to a more equitable and prosperous society. Focusing on nutrition during the first 1,000 days (0-2 years) establishes a strong foundation for sustained development and economic stability. [1,2,10].
Previous studies on undernutrition in Tunisia are limited. For example, study which assessed poverty and child health from a population-based cross-sectional perspective revealed that household wealth, education, and location were the main factors influencing a child’s health, including undernutrition [11]. The study focused solely on factors associated with inequality, such as residence, mother’s education, and household wealth index; it did not examine other factors such as dietary practices, and child health, which are directly related to child health. Additionally, the study used a single data source, which limited the scope for comprehensive conclusions. Previous studies on undernutrition in North Africa, which included Tunisia, may not adequately capture the country’s unique context [12,13,14]. As a result, their findings could either overestimate or underestimate Tunisia’s nutritional status, leading to ineffective interventions. This is particularly significant when comparing Tunisia to neighboring countries with varying rates of undernutrition. Therefore, there is an urgent need for comprehensive research that includes all malnourished children and considers a wide range of factors to develop effective policies.
Therefore, this study aimed to investigate the prevalence, trends, and determinants of undernutrition among Tunisian children aged 0-23 months. The study utilised data from the three most recent nationally representative MICS surveys conducted in Tunisia in 2012, 2018, and 2023.
2. Materials and Methods
2.1. Study Design and Setting
Data for the current study was utilized from the Tunisia Multiple Indicator Cluster Surveys (MICS) that were conducted in 2011-12, 2017-18, and 2022-23. They are nationally representative surveys, employ standard methods, and are publicly available on the MICS website [15]. Every 5 years, the MICS system in Tunisia is collected on a regular basis [16]. MICS is a global data collection system designed to gather periodic cross-sectional data. Its purpose is to provide internationally comparable information on fundamental health indicators, such as child mortality, maternal health, immunization, nutrition, sanitation, access to clean drinking water, education, and child development.
MICS is an international, periodic cross-sectional data collection system, was schemed in such a way to provide internationally comparable information on basic health indicators, especially the indicators that associated with maternal and child health. The survey can target specific regions, although typically the survey is administered across the entire country. To guarantee consistency, the MICS surveys utilise multistage stratified cluster sampling, with defined selection probabilities for each primary unit.
Both the Tunisian MICS 2012 and 2018 were implemented nationwide? by the Ministry of Development, Investment, and International Cooperation and the National Institute of Statistics (Statistics Tunisia). Financially, MICS 2012 was supported by the United Nations Children’s Fund (UNICEF), the United Nations Population Fund, and the Swiss Cooperation Office in Tunisia, while MICS 2018 was supported by UNICEF and the National Institute of Statistics. The Tunisian MICS 2023 was published by the National Institute of Statistics (INS) and supported by the Ministry of Economy and Planning, the National Institute of Statistics, and UNICEF.
2.2. Study Population and Data Collection
All women aged 15–49 years, who were either permanent residents or visitors present in the households on the night before the survey were deemed eligible for data collection. Information on child health was obtained from the mothers, particularly concerning the youngest child aged less than five years. Only children between 0-23 months were considered in this study. Detailed information about the sampling design and questionnaire may be obtained from the country-specific MICS reports. The questionnaire specifically for women attracted a 91–99% response rate. Our analysis covered a total of 3265 children aged between zero and 23 months, over the three MICS surveys included in the study: 1271 children from the 2012 MICS, 1337 children from the 2018 MICS, and 657 children from the 2023 MICS. The questionnaires used for this study obtained information on various aspects including education level, marital and work status, place of residence, exposure to the media, history of pregnancy, child mortality, breastfeeding and infant feeding practices, such as the complementary feeding, childhood immunisations and illnesses, sexual activity, background characteristics of the husband, and awareness and behaviour associated with HIV/AIDS and other sexually transmitted diseases, as well as maternal mortality.
2.3. Outcome Variables
The outcome variables utilised for the study included the three indicators of undernutrition, namely, stunting, wasting and underweight. The prevalence of each indicator was calculated with the 2006 WHO growth reference as basis [17]. The WHO growth standards reference compares the growth of a child to the median of a healthy child within the same age bracket; or reference population [17]. This reference is often expressed in terms of the number of standard deviations (SDs) above or below the median. Stunting was assessed based on the height-for-age (HAZ) Z-score ≤−2 SD; wasting was estimated using the weight-for-height (WHZ) Z-score ≤−2 SD of the median, and underweight was evaluated using the weight-for-age (WAZ) Z-score <−2 SD of the median. To evaluate the degree of stunting, wasting and underweight, the dependent variables was divided into two categories: category 0 for those who were not stunted, wasted or underweight (−2SD) and category 1 for those who were stunted wasted or underweight (−2SD) [17].
2.4. Potential Covariates
A past study carried out on 35 low–and middle-income countries [18], as well as other previous studies [19,20,21,22] were used as the basis for the selection of covariate variables. These covariates were categorized into three main factors: enabling factors, including place of residence (urban/rural); underlying factors, including the pooled household wealth index, child age and gender, parents’ age, maternal education and nutritional health, household members, birth order, health care services use, water and sanitation, and access to media; and immediate factors, which included early initiation of breastfeeding, duration of breastfeeding, perceived size of baby, and child illness (diarrhoea, fever, cough and any infection in the last two weeks).
The „Household Wealth index” is a quantitative indication of a household’s financial situation in relation to its expenses and incomes. The Principal Components Analysis (PCA) approach has been used to establish a quantitative representation of family assets. Following the computation of this measure, each lawful household member was awarded a score to establish their ranking in the population. This study classified wealth into five categories: the poorest, poorer, middle, fourth, and highest at the national level. The poorest and poorer households made up the lowest 40% of households, the next 20% were middle-class homes, and the fourth and richest households made up the top 40%.
2.5. Data Analysis
Data analysis was performed using the ‘SVY’ commands of Stata version 17.0 (Stata Corp) to adjust for the cluster sampling design and apply appropriate sampling weights to determine counts and percentages for all sociodemographic characteristics for children aged 0-23 months in the 2011-2012, 2017-2018, and 2018-2023 MICS datasets. survey (svy:tab) tabulation was used to determine the proportion and their 95% confidence Intervals of undernutrition (stunting wasting and underweight) by three time periods (2011-2012, 2017-2018, and 2018-2023). To determine the trends and their 95%CI, the three time periods were classified into three categories. The 2011-2012 period is arbitrarily referred to as Category 1, the 2017-2018 period was referred to as Category 2, and the 2018–2023 period was called Category 3. Furthermore, to determine the changes between categories ‘1’, ‘2’ and ‘3’, category 1 was coded as ‘1’, Category 2 as ‘2’ and Category 3 was coded as ‘0’. A similar procedure was conducted to determine the changes among categories ‘1’ and 3’, categories ‘1’ and ‘2’ and categories ‘2 and 3’. In our analysis, survey mean command in STATA was used to compare each period and potential covariates, as reported in Table 2 (detailed results provided in Tables S1–S3). To determine the comparisons among the periods and report the significant differences, the linear combinations of parameters (lincom) command in STATA was used to determine the significance of differences at p < 0.05 for each of the potential covariates as reported in Table 1.
We performed bivariate analyses to assess the independent association between the outcome and exploratory variables. Furthermore, multiple logistic regression models were used to examine the factors associated with the three indicators of undernutrition among children under two years old in Tunisia. In the univariate analysis, all exploratory variables with a p-value < 0.20 were retained and used to build multiple logistic regression models. We used a manual elimination process for multiple logistic regression to eliminate non-significant variables (p > 0.05). Only those variables with p < 0.05 were considered factors associated with undernutrition among children under two years. The odds ratio (OR) and 95% confidence intervals were obtained from the adjusted logistic regression models and were used to determine factors associated with undernutrition among children under two years in Tunisia.
3. Results
3.1. Characteristics of the Participants
The current study had 1271, 1337 and 657 participants in the periods 2011-12, 2017-18 and 2022-2023 respectively, making a total of 3265 children aged 0-23 months. Across all three timeframes, urban dwellers outnumbered their rural counterparts. In all three time periods, the proportion of boys was approximately equal to the proportion of girls. The percentage of older mothers (35-49 years) was lower than that of younger mothers (15-34 years) in all the three periods. Similarly older fathers (45+ years) constituted the minority, compared with their younger counterparts, in all three timeframes. Across the three timeframes, married mothers completely outnumbered unmarried ones (90.7% versus 9.3% in 2011-12, 92.7% versus 7.3% in 2017-18 and 95.5% versus 4.5% in 2022-23). Most parents (mothers and fathers) had received a school education, with only a small portion receiving none across the three time periods. Almost all households had access to clean cooking fuel in all the three timeframes. Almost all households had access to the television across the three timeframes. Only a small proportion of children had contracted diarrhoea in all three time periods (12.2% versus 87.8% in 2011-12, 12.2% versus 87.8% in 2017-18 and 8.0% versus 92.0% in 2022-23). Children were more likely to be delivered by skilled delivery assistants than by unskilled attendants during all three times. More than two-thirds of mothers attended no postnatal clinics in all the three timeframes. Across all three timeframes, less than 50% of mothers breastfed their babies within the first hour of delivery. More than 50% of babies were breastfed for more than 12 months in all the three timeframes (see Table 1).
3.2. Prevalence and 95% CI of Undernutrition, 2011–12 to 2022–23
the overall prevalence of undernutrition (stunting, wasting, and underweight), as well as the 95% confidence intervals (CI) and the prevalence observed in each year was examined (see Figure 1). The data reveals that the pooled prevalence of stunting over the past 10 years was 11.6%. Between 2011-12 and 2022-23, there was a noticeable rise in the prevalence of stunting, with an increase of approximately 3.3% over the course of the past decade. The observed increase did not reach statistical significance due to the overlapping 95% confidence intervals. The pooled prevalence of wasting was 4.3%, and over the course of the past ten years, there has been a 0.5% increase in the prevalence of wasting, with rates rising from 3.8% in 2011-12 to 4.3% in 2022-23. The overlap of the 95% confidence intervals indicates that the observed increase was not statistically significant. From 2012 to 2023, the overall prevalence of being underweight was 3.8%. Over the past decade, there has been a 2.1% increase in the prevalence of underweight, with the percentage rising from 3.4% in 2011-12 to 5.5% in 2022-23. Even there was an increase, it was not considered statistically significant due to the overlapping 95% confidence intervals.
3.3. Trends in the Prevalence of Undernutrition from 2011–12 to 2022–23
the trends in the prevalence of stunting, wasting, and underweight from 2011-12 to 2018 according to the investigated potential covariates factors (see Table 2). More details, including 95% confidence intervals, comparing the periods 2017-18 and 2022-23, can be found in Tables S1-S3.
In comparison to 2011-12, the prevalence of stunting among urban children and middle wealth index households have increased by 7.0% and 8.1%, respectively, when compared to children born in 2022-23. During the same time frame, there were notable increases in stunted children across multiple factors. This includes children aged 0 to 5 months (11.8 %), father with primary education (6.2 %), children with mothers with no prior births (8.3%), children born to literate mothers (6.7 %), no access to newspapers (6.0 %), delivery at government health facilities (7.4 %) and breastfed newborns within one hour after delivery (7.7%).
However, in comparison to the same time frame, there was a significant decrease in stunting among Tunisian children under 2 years old among children with older mothers (aged 35-49 years) (-7.0%), and children with two or more siblings (-8.2%).
Although the prevalence of wasting remained relatively consistent across different factors, significant increases in underweight children were documented across multiple parameters from 2011-12 to 2022-23. This encompasses infants within the age range of 0 to 5 months (8.9%), fathers aged between 35 and 44 years (3.2%), fathers with only primary education (3.2%), mothers with no prior childbirths (4.1%), households lacking improved toilet facilities (4.3%), households without radio access (3.0%), households without newspaper access (4.4%), children born to literate mother (5.5 %) and duration of breastfeeding up to 12 months (7.4 %).
3.4. Factors Associated with Undernutrition
The data in Table 3 indicates that in the univariate analysis, rural children were significantly more prone to stunting compared with their urban counterparts [Unadjusted odds ratio (UOR) = 1.35; 95% confidence interval (CI): (1.06, 1.74)].
Compared with children from the richest households, the odds of being stunted were significantly lower among children from middle-class households [Adjusted odds ratio (OR) = 0.52; 95% CI: (0.33, 0.82)]. The likelihood of a child being stunted was significantly lower among those who were aged between 6 and 11 months, compared with infants who were aged 0-5 months [OR = 0.26; 95% CI: (0.18, 0.39)]. In our univariate analysis, children were significantly more likely to be stunted when they had between 4 and 8 members in their household, compared with children whose household consisted of between 1 and 3 members [UOR) = 1.38; 95% CI: (1.04, 1.83)]. The odds of being stunted were significantly higher among children whose mothers had no education compared with mothers who had secondary education or higher [OR = 2.06; 95% CI: (1.4, 2.92)]. Children who had a mother with a BMI of more than 25 kgm-2 were significantly more prone to being stunted, compared with those whose mothers had a BMI of 18.5 kgm-2 or less [OR = 10.67; 95% CI: (5.97, 19.08)]. The odds of being stunted were significantly more likely among children whose mothers put them to the breast within one after delivery compared with those who were put to the breast after one hour [UOR) = 1.64; 95% CI: (1.28, 2.11)].
The study results demonstrated that the odds of being wasted were significantly lower among females than their male counterparts [OR = 0.60; 95% CI: (0.37, 0.97)]. Children who were aged 12-17 months had a significantly less likelihood of being wasted, compared with those aged 0-5 months [OR = 0.15; 95% CI: (0.07, 0.33)] (Table 2). The odds of being wasted were significantly higher among children who had a mother that was older than 18 years at the time of marriage, compared with mothers 18 years old or younger at the time of marriage [OR = 10.12; 95% CI: (1.39, 73.51)]. In the univariate analysis, the likelihood of wasting was significantly lower among children when their mother attended a post-natal care (PNC) clinic 2 days after delivery, compared with mothers who attended PNC 0-2 days after delivery [OR = 0.35; 95% CI: (0.17, 0.74)].
Females were significantly less likely to be underweight than their male counterparts [OR = 0.45; 95% CI: (0.27, 0.74)]. The odds of being underweight were significantly less among children aged 12-17 months, compared with their counterparts who were aged 0-5 months [OR = 0.08; 95% CI: (0.03, 0.22)] (Table 2). The odds of underweight were significantly higher among children who were perceived to be small at birth, compared with infants who were of average size [OR = 1.90; 95% CI: (1.04, 3.47)]. Children who had a mother with a BMI of between 19 and 25 kgm-2 were significantly less likely to be underweight, compared with mothers who had a BMI of 18.5 kgm-2 or less [OR = 0.23; 95% CI: (0.10, 0.54)]. In the univariate analysis, the likelihood of underweight was significantly less among children who were breastfed for more than 12 months, compared with those who were breastfed for up to 12 months [OR = 0.42; 95% CI: (0.27, 0.65)].
4. Discussion
The current study utilised data from the Tunisian Multiple Indicator Cluster Surveys (MICS) from 2012 to 2023 to investigate the prevalence, trends, and associated factors contributing to undernutrition among Tunisian children aged 0-23 months. The study found an increase in the prevalence of the three indices of undernutrition stunting, wasting, and underweight among children under two years old in Tunisia over the last ten years. Specifically, stunting increased from 11.5% to 14.8 %, wasting from 3.8% to 4.3%, and underweight from 3.4% to 5.5%. The multivariate analysis revealed that stunting, wasting, and being underweight were all associated with the year of the survey and the child’s age. The odds of stunting increased with high maternal BMI, decreased with families with middle wealth index, and the odds of being underweight increased with a mother with low BMI and a child with low birth size. Stunting trends increased among children aged 0-5 months, those with low-educated mothers, mothers aged 35-49 years, households with a middle wealth index, mothers with no previous births, mothers with high BMI, and those with late initiation of breastfeeding. While no significant trends were observed for factors associated with wasting, underweight trends were higher among children aged 0-5 months, those with fathers aged 33-45 years, mothers with no previous births, and those with a breastfeeding duration of up to 12 months.
In comparison to the UNICEF et el. 2023, levels and trends of child malnutrition report, our previous stated results show stunting among children in Tunisia was higher than the 2022 values for Algeria (8.6%), and Morocco (12.8%); but lower than those of the North Africa region (21.7%), Libya (52.2%) and Egypt (20.4%) [23]. The prevalence of wasting in Tunisia in 2023 was lower than the global value of 6.8% for the period 2015-2022; and that of the 2015-2022 value for North Africa (6.3%) [23], but higher than those of Algeria (2.7%) and Morocco (2.3%), for the same period. The prevalence of underweight in 2023 was higher than the 2019 values for Algeria (2.7%) and Morocco (2.8%), and lower than the 2014 values for Libya (11.7%) and Egypt (7.0%). The North African region struggles with undernutrition due to factors like disadvantage, inequality, and food insecurity, which are exacerbated by conflict, displacement, and climate change [13,14]. A recent UNICEF study found that at least 29 million children in the Middle East and North Africa live in poverty, with one in four children affected [24]. Countries like Algeria, Tunisia, and Libya experience significant disparities in poverty and unemployment rates based on age, gender, and location [25]. Economic inequality is a major obstacle to achieving the global goal of eradicating poverty by 2030 [26]. Africa ranks third in terms of significant disparities, after Latin America and the Middle East, due to economic, governmental, and social structures that limit access to healthcare, food, and other essential factors that impact children’s well-being [27].
The univariate and multivariate analyses highlight the strong connection between stunting and underweight in older children, demonstrating a continuation across the childhood development trajectory with an increase as children age. This is supported by prior research from low- and middle-income countries which has demonstrated an increase in stunting as children grow [3,28,29]. There is a critical window of growth when children are transitioning from exclusive breastfeeding to family foods, and their nutritional needs increase. Insufficient dietary intake, poor feeding practices, and limited access to nutrient-rich foods all contribute to an underweight nutritional status among children [10,30]. Although Tunisia experiences relatively low levels of hunger, economic hardships, especially reduced purchasing power, make it difficult for many families to afford nutritious food. The pandemic has further worsened the economic strain by severely impacting livelihoods. Combined with Tunisia’s vulnerability to climate change, which disrupts food availability and agriculture, these factors have significantly heightened the risks of food insecurity and persistent undernutrition [31]. In addition, the argument put forward by such studies is that after weaning a child from breastfeeding, normally at the second birthday the child may be considered old enough to be left under the care of their siblings or other caregivers, while their mother would be back to work, whether informal or formal, depending on her occupation [32]. Furthermore, from the available evidence, it is recognised that as children increase in age, there is an increased physiological requirement for optimal nutrient intake to support growth and development [33]. The data also suggests an increased diet quality, both in quantity and quality, which may not be possible depending on the financial status of the household [31]. In addition, a lack of access to sufficient nutrient rich complementary foods to provide the child in the complementary feeding period, in addition to breastmilk can increase the risk of children acquiring early childhood infections [34,35,36]. This period is critical because children’s immune systems are still developing, and without proper nutrition, they become more susceptible to infections. Similar findings were reported in other studies, such as those conducted in Lalibela, Northern Ethiopia [37], and Indonesia [38], which also found a higher likelihood of stunting among children aged > 11 months.
On the other hand, the analysis discovered that children between the ages of 0 and 5 months were more prone to experiencing stunted growth when compared to their older counterparts [2]. The discovery could be attributed to younger children being more prone to infection and illness, along with other factors that can impact the health and nutrition of women of reproductive age or pregnant women. These factors include birth length, maternal weight, birth order, maternal education levels, and wealth indicators [28]. According to the Tunisian Global Nutrition Report, the target of reducing anaemia among women aged 15 to 49 years has not been achieved, as 32.1% of them are still affected. Additionally, there has been no progress in reaching the low-birth-weight goal, as 7.5% of infants are still born with a low weight [39]. The UNICEF Data report highlighted the importance of delivering nutrition interventions during pregnancy and the first two years (first 1000 days) of a child’s life in Tunisia, in order to improve children’s chances of survival, development, and prevent stunting [40]. Scaling up nutrition intervention strategies, such as maternal nutrition and prenatal care education, promoting breastfeeding in community and facility settings, conditional cash transfers and related safety nets and innovative delivery strategies have the ability to prevent the occurrences of undernutrition in early ages [41].
The current study revealed that the increased odds of stunting was significantly associated with middle household wealth index, compared to the richest households, which corroborates a finding from a past study that showed that household wealth was a significant predictor of health status, with relatively poorer households (middle index versus richest index) being reported to have poor nutritional, economic, environmental and health status [42]. It is therefore not surprising that relative lower household index was a significant risk factor for stunting, as has been reported by other past studies [43,44,45]. The association between low household income and child stunting may be attributed to the fact that children from low-income households may have disadvantages of the likelihood to face food shortages, for instance, resulting in food insecurity, and inadequate feeding practices, which, in the end, may result in malnutrition and consequently leading to stunting [9,46]. In order to address child undernutrition in low-income households, the World Health Organization recommends that infants begin complementary feeding alongside breast milk at six months of age (reference needed). Infants should be complementary fed 2-3 times per day between 6-8 months, and 3-4 times per day from 9-11 months through to 24 months, to meet their growing nutritional needs [47]. This gradual increase in feeding helps reduce the risk of malnutrition and stunting, particularly in poorer households. Additionally, low-income families often face challenges related to poor maternal nutrition, which has been identified as a critical risk factor for child health outcomes [9,46,48]. Many women in low-income households consume diets deficient in essential minerals such as iodine, iron, folate, calcium, and zinc [49] . During pregnancy, these deficiencies can lead to adverse child outcomes, such as low birth weight and developmental delays, as observed by UNICEF, which reports that over 20 million newborns are affected by low birth weight each year [49]. Poor maternal nutrition during breastfeeding further diminishes a mother’s ability to meet her nutritional needs, often constrained by limited access to and affordability of nutritious food. This restriction significantly affects women’s capacity to make healthy nutritional choices, contributing to the cycle of malnutrition and poor health outcomes for both mother and child [49].
The study analysis showed that the increased risk of stunting was associated with maternal obesity, meaning that children whose mothers were overweight were more prone to being stunted. It has been established, in past research, that, worldwide, the coexistence of maternal obesity and child stunting (Mother-Child-Double-Burden) is connected to undernutrition during early life and exacerbated by the nutrition transition [50,51,52]. A lack of essential nutrients in calorie-dense diets can result in both obesity and stunting. Several low- and middle-income countries rely heavily on ultra processed, low-nutritional meals heavy in fats and sugars, causing adults to gain weight, while children, particularly during critical growth phases, suffer from nutrient deficits that result in stunted growth [53]. Furthermore, women who have excess weight have lower rates of breastfeeding than those who are not overweight. a two-cohort longitudinal study at conducted at Oregon Health & Science University, USA found that women with a pre-pregnancy BMI ≥30 kg/m2 have a lower intention to exclusively breastfeed than those of normal weight and overweight (78.8% vs. 95.5% and 96.2%, respectively) [54]. Similar findings were found in both a systematic investigation focusing on the North African region [13] and a cross-sectional study conducted in Nepal [55]. The study discovered a significant association between a child’s stunting and having an overweight mother. However, findings demonstrated that infants born to mothers with low BMI are more likely to be underweight. A research study conducted in Tanzania [56] examined children aged 0-23 months and discovered similar outcomes in terms of the probability of a child being underweight when the mother’s BMI was below 18.5 kgm-2 [56]. Furthermore, the previous studies conducted in Rwanda [57] and Ethiopia [58] have confirmed the significant correlation identified between underweight and a mother’s normal or low BMI. The finding could be related to the fact that the physiological impacts of a mother’s malnutrition during lactation may have an impact on milk secretion and the child’s weight gain. To address the double burden of malnutrition in the family, interventions should include increased nutrition, education, and healthcare, to enhance both maternal and child health [59,60].
Low birth weight is a critical indicator of a baby’s immediate and future health. LBW babies face higher risks of infant mortality and illness, poor cognitive development, and chronic diseases like diabetes and cardiovascular disease later in life [61]. Additionally, they are at higher risk of developmental difficulties and poor motor skills [62], with increased mortality rates for those with very low birth weight [63]. The study multivariate analysis indicated that children born with a small size are more likely to be underweight compared to those with normal or larger birth sizes. This is consistent with findings from a recent systematic review and meta-analysis focused on North Africa [13] and a study based on the Malawi Demographic and Health Survey [64]. The link between low birth weight (LBW) and childhood undernutrition is often mediated by increased infection rates in LBW children. Malnutrition impacts the immune system, making children more susceptible to infections, which further exacerbates malnutrition [65,66].
Although the multivariate analysis only found that child age, wealth index, child baby birth size, and maternal BMI were the only significant factors associated with undernutrition in Tunisian children under the age of two, the study trends analysis revealed significant variation over the last ten years that requires attention and care because they have the potential to exacerbate the undernutrition problem among Tunisian children. The percentage of stunted urban children increased dramatically between 2011-12 and 2022-23, showing an improvement in rural patterns in undernutrition over that time period. Previous research conducted in Maharashtra, India [67] and Sub-Saharan nations [68] revealed similar findings. The trend in urban-rural differentials is primarily due to stagnant trends in urban undernutrition combined with improvements in rural housing. A variety of variables may have contributed to trend improvements in rural areas. One such effect could be Tunisia’s large growth in food production over that time span [69]. Since the majority of the food consumed in Tunisia is produced in the rural areas, it is conceivable that there was increased availability of food supplies in rural households during that period; and the availability of food in the household would imply that the children would be adequately fed. Another possible reason for the urban-rural disparities is that poverty is predominantly seen as a rural area in Tunisia [69]. Consequently, the majority of interventions aimed at alleviating poverty are targeted towards rural populations [70]. These interventions include programs like cash transfers, nutritional supplementation, initiatives to improve food security and social protection, as well as programs to enhance health services coverage [28,71]. These interventions have the potential to enhance child health in rural and disadvantaged areas.
The study results showed that children whose fathers had only primary education experienced a notable rise in the rates of stunting and underweight. Although these factors may not be primary drivers of the growing undernutrition issue in Tunisia, they warrant attention due to their notable increase among undernourished children in the country in recent times, and therefore should be taken into consideration. Previous studies found that lower maternal and paternal education levels were associated with lower childhood undernutrition [13,72,73]. A study in Libya, which shares cultural and societal similarities with Tunisia, found a significant link between a father’s educational level and the prevalence of stunting in children, as revealed by The Libyan Maternal and Child Health Survey. This finding has implications for understanding the factors contributing to stunting in Tunisia as well [74]. In Arabic patrilineal cultures, fathers play a vital role in preventing child undernourishment, and their involvement from pregnancy to early childhood is crucial for healthy growth and development. As primary providers, fathers are essential in ensuring family nutrition and preventing undernutrition. Their participation in household management also contributes to improved child nutrition. While maternal education is often emphasized, in Arabic societies, fathers are primarily responsible for family well-being. The interconnectedness of parental education and marital decisions among educated women makes it challenging to distinguish the separate effects of maternal and paternal education on child health. However, educated families tend to have better living conditions, healthcare access, and hygiene practices, ultimately benefiting their children’s health [75,76].
The study analysis revealed that increased odds of stunting was associated with children whose mothers put them to the breast within one hour after delivery, consistent with a finding in a past study which revealed that children who are not provided with an early initiation of breastfeeding are 1.3 times more likely to be stunted compared with those who are breastfed early [77]. The study highlights the fact that early initiation of breastfeeding is a form of maternal care, and the best way of providing nutrients early in life, which can minimise the risk of stunting. Early initiation of breastfeeding has been found to be one of the avenues to successful breastfeeding at a later time and ensures that children obtain appropriate nutritional intake [3,10]. Furthermore, higher trend of underweight among children who had duration of breast feeding up to 12 months. The potential rationale for breastfeeding for a maximum of 12 months may be linked to non-compliance with the WHO’s recommended duration of 2 years for breastfeeding; and this may be attributed to the mother’s occupational commitments and insufficient time to take of her child [78]. Alternatively, it could as a result of insufficient complementary feeding and cessation of breastfeeding [34,36,78]. The aforementioned factors demonstrated a notable rise among children below 2 years of age in Tunisia, despite the absence of any correlation in the study multivariate analysis. Nevertheless, it is crucial for Tunisian government policymakers and public health researchers to consider these factors, as they have become more pronounced alongside the rise in stunting and underweight cases in 2023. The current study identified additional factors contributing to undernutrition among children under two in Tunisia, including maternal age (35-49 years), first-time mothers, paternal age (33-45 years), and breastfeeding duration of up to 12 months.
To effectively address undernutrition in Tunisian children, it is essential to concentrate on three critical areas: (i) Maternal health and education: Enhancing maternal health, parental education, and access to prenatal care for the early detection and prevention of undernutrition. (ii) Promoting breastfeeding: Emphasis should be placed on promoting early initiation of breastfeeding and extended breastfeeding, alongside adequate complementary nutrition, especially for underprivileged families. (iii) The Tunisian government is responsible for improving infant nutrition by creating an appropriate environment, which includes implementing policies that enhance food security, ensuring access to healthcare services, providing nutrition education, and providing resources for families to maintain healthy diets [28,71]. (iv) Public Health Initiatives: Effective public health strategies are essential for combating undernutrition. Essential programs must include community-based initiatives focused on combating child undernutrition, promoting breastfeeding, and nutritional assistance initiatives, such as nutrition education programs. (v) Cross-Sectoral Collaboration: Addressing undernutrition requires collaboration across multiple sectors, including health, agriculture, education, environment, community groups, and the nutrition industry [28,71].
The current study had several strengths. First, it is nationally representative and population-based, with a large sample size which yielded high response rates for children and mothers/caregivers. Secondly, the study utilised the Tunisia 2012, 2018 and 2023 MICS dataset, which were the most recent nationally recognised data available in Tunisia; and therefore, making the study relevant. Third, suitable statistical adjustments were applied to the three MICS datasets, and the most vulnerable subpopulation affected by stunting, wasting and underweight was identified. Nonetheless, the study had some limitations. First, due to the cross-sectional nature of the study design, the causal relationship among the observed risk factors and the dependent variables could not be established. Second, the effect of residual confounding as a result of unmeasured co-variates could not be ruled out, in spite of using comprehensive set of variables in the analysis; this took into consideration direct measures of children’s diet and feeding patterns, as well as energy expenditure, through physical activity, in the identification of possible casual paths.
5. Conclusions
Over the past decade, Tunisia has seen a rise in key indicators of undernutrition stunting, wasting, and underweight among children under two. The growing prevalence of factors contributing to child undernutrition is a significant concern, demanding an immediate and coordinated response. Community-based interventions are essential for improving child health and nutrition, particularly through nutrition interventions during pregnancy and the first two years of life, which are crucial for children’s survival and development. Efforts should include financial support for nutritional supplementation, initiatives to improve food security and social protection, and expanded healthcare coverage. Parental education programs, especially for first-time mothers, are vital in promoting proper feeding practices. These programs should emphasize maternal nutrition during pregnancy, increase access to nutrient-dense foods for mothers and children, and provide breastfeeding counseling particularly for mothers with overweight in the postnatal period. To achieve sustained improvements in child health outcomes, policies addressing food security, healthcare access, and nutrition education must be prioritized by public health authorities, the government, and stakeholders.
Supplementary Materials
The following supporting information can be downloaded at the website of this paper posted on Preprints.org. Table S1. Trends in the prevalence of factors associated with stunting among children (0-23 months) in Tunisia; Table S2. Trends in the prevalence of factors associated with wasting among children (0-23 months) in Tunisia; Table S3. Trends in the prevalence of factors associated with underweight among children (0-23 months) in Tunisia.
Author Contributions
The study’s conceptualization was carried out by N.F.E. and K.E.A., who also designed and conducted the methodologies. K.E.A. managed the software, while C.A.K.F. reviewed the study’s validation. K.E.A. and N.F.E. performed the formal analysis, and C.A.K.F. conducted the investigation. The original draft was written and prepared by N.F.E., with C.A.K.F. and K.E.A. contributing to the review and editing. C.A.K.F. and K.E.A. provided supervision, and N.F.E. administered the project.
Data Availability Statement
Data for this research are available online at [https://mics.unicef.org/surveys] (accessed on 16 May 2024).
Acknowledgments
This paper forms part of the first author’s doctoral dissertation at the School of Health Sciences, Western Sydney University.
Conflicts of Interest
The authors declare no conflicts of interest.
References
- United Nations Children’s Fund (UNICEF), World Health Organization (WHO), International Bank for Reconstruction and Development/The World Bank. Levels and trends in child malnutrition: UNICEF / WHO / World Bank Group Joint Child Malnutrition Estimates: Key findings of the 2023 edition. New York: UNICEF and WHO; 2023. CC BY-NC-SA 3.0 IGO.
- UNICEF Units for Children. From the First Hour of Life: Making the case for improved infant and young child feeding everywhere. 3 United Nations Plaza, New York, NY 10017, USA.
- Black RE, Allen LH, Bhutta ZA, Caulfield LE, De Onis M, Ezzati M, et al. Maternal and child undernutrition: global and regional exposures and health consequences. The lancet. 2008;371(9608):243-60. [CrossRef]
- Global Nutrition Report. Country Nutrition Profiles: Africa. 2024 Bristol UD.
- Djoumessi, YF. The impact of malnutrition on infant mortality and life expectancy in Africa. Nutrition. 2022; 103:111760.
- Atinmo T, Mirmiran P, Oyewole OE, Belahsen R, Serra-Majem L. Breaking the poverty/malnutrition cycle in Africa and the Middle East. Nutrition reviews. 2009;67(suppl_1):S40-S6. [CrossRef]
- Cho, R. How Climate Change Impacts the Economy. State of the Planet. Columbia Climate School. 2019. [Google Scholar]
- UNICEF for Every Child. Childhood diseases. [accessed 14 Aug 2024]. Available from: https://www.unicef.org/health/childhood-diseases.
- TARGET, S. An Investment Framework for Meeting the Global Nutrition Target for Stunting.
- Moore Tg, Arefadib N, Deery A, Keyes M, West S. The First Thousand Days: An Evidence Paper – Summary. Parkville, Victoria: Centre for Community, Child Health, Murdoch Children’s Research Institute.: 2017.
- Ochi A, Saidi Y. Socio-economic inequalities and their impact on children’s health and nutrition in Tunisia using generalized entropy measures. Regional Science Policy & Practice. 2024:100034. [CrossRef]
- Elmighrabi NF, Fleming CA, Agho KE. Wasting and Underweight in Northern African Children: Findings from Multiple-Indicator Cluster Surveys, 2014–2018. Nutrients. 2023;15(14):3207. [CrossRef]
- Elmighrabi NF, Fleming CA, Dhami MV, Agho KE. Childhood undernutrition in North Africa: systematic review and meta-analysis of observational studies. Global Health Action. 2023;16(1):2240158. [CrossRef]
- Elmighrabi NF, Fleming CA, Dhami MV, Elmabsout AA, Agho KE. A systematic review and meta-analysis of the prevalence of childhood undernutrition in North Africa. Plos one. 2023;18(4):e0283685. [CrossRef]
- MICS Surveys. [accessed 0n 14 Aug 2024]. Available from: http://mics.unicef.org/] (http://mics.unicef.org/.
- Tunisia Datasets and reports. MICS UNICEF. 2024.
- World Health Organization. WHO child growth standards: length/height-for-age, weight-for-age, weight-for-length, weight-for-height and body mass index-for-age: methods and development. World Health Organization; 2006.
- Li Z, Kim R, Vollmer S, Subramanian SV. Factors associated with child stunting, wasting, and underweight in 35 low-and middle-income countries. JAMA network open. 2020;3(4):e203386-e. [CrossRef]
- Whye Lian C, Wan Muda WA, Mohd Hussin ZA, Ching Thon C. Factors associated with undernutrition among children in a rural district of Kelantan, Malaysia. Asia Pacific Journal of Public Health. 2012;24(2):330-42. [CrossRef]
- Tariq J, Sajjad A, Zakar R, Zakar MZ, Fischer F. Factors associated with undernutrition in children under the age of two years: secondary data analysis based on the Pakistan demographic and health survey 2012–2013. Nutrients. 2018;10(6):676. [CrossRef]
- Amaral TF, Matos LC, Teixeira MA, Tavares MM, Álvares L, Antunes A. Undernutrition and associated factors among hospitalized patients. Clinical nutrition. 2010;29(5):580-5. [CrossRef]
- Alemayehu M, Tinsae F, Haileslassie K, Seid O, Gebregziabher G, Yebyo H. Undernutrition status and associated factors in under-5 children, in Tigray, Northern Ethiopia. Nutrition. 2015;31(7-8):964-70. [CrossRef]
- UNICEF, World Health Organization, World Bank. UNICEF-WHO-World Bank: Joint child malnutrition estimates - Levels and trends (2023 edition). 2023.
- UNICEF. At least one in four children live in poverty in the Middle East and North Africa. [accessed on 14 Aug. 2024]. Available from: https://www.unicef.org/press-releases/least-one-four-children-live-poverty-middle-east-and-north-africa#:~:text=Press%20release.
- World Bank Group. Poverty has fallen in the Maghreb, but inequality persists. [accessed on 14 Aug 2014]. Available from: https://www.worldbank.org/en/news/feature/2016/10/17/poverty-has-fallen-in-the-maghreb-but-inequality-persists.
- WID World. Global inequality data 2020 update. World inequality database. [accessed on 14 Aug 2024]. Available from: https://wid.world/news-article/2020-regional-updates/#:~:text=The%20World%20Inequality%20Lab%20releases,over%20time%2C%20countries%20and%20regions.
- Perez-Escamilla R, Bermudez O, Buccini GS, Kumanyika S, Lutter CK, Monsivais P, et al. Nutrition disparities and the global burden of malnutrition. Bmj. 2018;361. [CrossRef]
- Bhutta ZA, Das JK, Rizvi A, Gaffey MF, Walker N, Horton S, et al. Evidence-based interventions for improvement of maternal and child nutrition: what can be done and at what cost? The lancet. 2013;382(9890):452-77. [CrossRef]
- Marriott BP, White A, Hadden L, Davies JC, Wallingford JC. World Health Organization (WHO) infant and young child feeding indicators: associations with growth measures in 14 low-income countries. Maternal & child nutrition. 2012;8(3):354-70. [CrossRef]
- Zhao A, Gao H, Li B, Zhang J, Win NN, Wang P, et al. Inappropriate feeding behavior: one of the important causes of malnutrition in 6-to 36-month-old children in Myanmar. The American Journal of Tropical Medicine and Hygiene. 2016;95(3):702. [CrossRef]
- World Food Program. Tunisia Country Strategic Plan (2022–2025). 2022.
- Datar A, Nicosia N, Shier V. Maternal work and children’s diet, activity, and obesity. Soc Sci Med. 2014; 107:196-204. [CrossRef]
- Faizan U, Rouster AS. Nutrition and hydration requirements in children and adults. 2020.
- Gatica-Domínguez G, Neves PA, Barros AJ, Victora CG. Complementary Feeding Practices in 80 Low- and Middle-Income Countries: Prevalence of and Socioeconomic Inequalities in Dietary Diversity, Meal Frequency, and Dietary Adequacy.. J nutr disorders ther. 2021;151(7):1956-64. [CrossRef]
- Lailatul M, Yuly S, Chrysoprase TA. Family support is the strongest predictor that influences mother’s self-efficacy level on complementary feedings practices among toddlers in Tengger tribe. Nutrition & Food Science. 2024;54(3):535-46. [CrossRef]
- Mekonen EG, Zegeye AF, Workneh BS. Complementary feeding practices and associated factors among mothers of children aged 6 to 23 months in Sub-saharan African countries: a multilevel analysis of the recent demographic and health survey. BMC Public Health. 2024;24(115). [CrossRef]
- Yalew BM, Amsalu F, Bikes D. Prevalence and factors associated with stunting, underweight and wasting: a community based cross sectional study among children age 6-59 months at Lalibela Town, Northern Ethiopia. J Nutr Disorders Ther. 2014;4(147):2161-0509.1000147. [CrossRef]
- Supadmi S, Laksono AD, Kusumawardani HD, Ashar H, Nursafingi A, Kusrini I, et al. Factor related to stunting of children under two years with working mothers in Indonesia. Clinical Epidemiology and Global Health. 2024; 26:101538. [CrossRef]
- Global Nutrition Report. Country Nutrition Profile: Tunisia. Bristol, UK: Development: 2024.
- UNICEF. Nutrition Porofile: Tunisia. 2010.
- Mertens A, Benjamin-Chung J, Colford Jr JM, Hubbard AE, van der Laan MJ, Coyle J, et al. Child wasting and concurrent stunting in low-and middle-income countries. Nature 2023;621(7979):558-67. [CrossRef]
- Siddiqui F, Salam RA, Lassi ZS, Das JK. The intertwined relationship between malnutrition and poverty. Frontiers in Public Health. 2020; 8:453. [CrossRef]
- Obasohan PE, Walters SJ, Jacques R, Khatab K. Risk factors associated with malnutrition among children under-five years in sub-Saharan African countries: a scoping review. International journal of environmental research and public health. 2020;17(23):8782. [CrossRef]
- Christian AK, Dake FA. Profiling household double and triple burden of malnutrition in sub-Saharan Africa: prevalence and influencing household factors. Public Health Nutrition. 2022;25(6):1563-76. [CrossRef]
- Sewor C, Jayalakshmi R. Trends of risk factors associated with childhood stunting and anaemia in Ghana: evidence from the Demographic Health Survey and Multiple Indicator Cluster Survey (2003–2017). Public Health Nutrition. 2024;27(1):e29. [CrossRef]
- Stewart CP, Iannotti L, Dewey KG, Michaelsen Kf, Onyango AW. Contextualising complementary feeding in a broader framework for stunting prevention. Maternal & child nutrition. 2013; 9:27-45. [CrossRef]
- World Health Organisation. Infant and young child feeding.. 2023.
- Özaltin E, Hill K, Subramanian SV. Association of maternal stature with offspring mortality, underweight, and stunting in low-to middle-income countries. Jama. 2010;303(15):1507-16. [CrossRef]
- UNICEF. Maternal nutrition. [Accessed on 14 Aug 2024]: UNICEF for everychild. Available from: https://www.unicef.org/nutrition/maternal#:~:text=During%20pregnancy%2C%20poor%20diets%20lacking,and%20developmental%20delays%20for%20children.
- Delisle, HF. Poverty: the double burden of malnutrition in mothers and the intergenerational impact. Annals of the New York Academy of Sciences. 2008;1136(1):172-84. [CrossRef]
- Popkin, BM. The shift in stages of the nutrition transition in the developing world differs from past experiences! Public health nutrition. 2002;5(1A):205-14. [CrossRef]
- Gillespie, S. Attacking the double burden of malnutrition in Asia and the Pacific: Asian Development Bank; 2001.
- Rachmah Q, Mahmudiono T, Loh SP. Predictor of Obese Mothers and Stunted Children in the Same Roof: A Population-Based Study in the Urban Poor Setting Indonesia. Front Nutr. 2021;6(8):710588. [CrossRef]
- Marshall NE, Lau B, Purnell JQ, Thornburg KL. Impact of maternal obesity and breastfeeding intention on lactation intensity and duration. Matern Child Nutr. 2019;15: e12732. [CrossRef]
- Adhikari D, Khatri RB, Paudel YR, Poudyal AK. Factors associated with underweight among under-Five children in Eastern Nepal: community-based cross-sectional study. Front Public Health. 2017; 5:350. [CrossRef]
- Moshi CC, Sebastian PJ, Mushumbusi DG, Azizi KA, Meghji WP, Kitunda ME, et al. Determinants of underweight among children aged 0–23 months in Tanzania. Food Science & Nutrition. 2022;10(4):1167-74. [CrossRef]
- Mukabutera A, Thomson DR, Hedt-Gauthier BL, Basinga P, Nyirazinyoye L, Murray M. Risk factors associated with underweight status in children under five: an analysis of the 2010 Rwanda Demographic Health Survey (RDHS). BMC Nutrition. 2016; 2:1-12. [CrossRef]
- Yisak H, Gobena T, F.t M. Prevalence and risk factors for under nutrition among children under five at Haramaya district, Eastern Ethiopia. BMC pediatrics. 2015; 15:1-7. [CrossRef]
- UNICEF. UNICEF’s approach to scaling up nutrition: For mothers and their children. United Nations Children’s Fund (UNICEF) 2020.
- Black RE, Victora CG, Walker SP, Bhutta ZA, Christian P, De Onis M, et al. Maternal and child undernutrition and overweight in low-income and middle-income countries. The Lancet. 2013;382(9890):427-51. [CrossRef]
- WHO. Global nutrition targets 2025: low birth weight policy brief- external site opens in new window. Geneva: WHO, 2014.
- Scharf RJ, Stroustrup A, Conaway Mr, DeBoer Md. Growth and development in children born very low birthweight. Archives of Disease in Childhood-Fetal and Neonatal Edition. 2016;101(5): F433-F8. [CrossRef]
- Mayor, S. Low birth weight is associated with increased deaths in infancy and adolescence, shows study. British Medical Journal Publishing Group; 2016. [CrossRef]
- Ntenda, PA. Factors associated with non-and under-vaccination among children aged 12–23 months in Malawi. A multinomial analysis of the population-based sample. Pediatrics & Neonatology. 2019;60(6):623-33. [CrossRef]
- Ashworth, A. Low birthweight infants, infection, and immunity. 2001.
- Hviid A, Melbye M. The impact of birth weight on infectious disease hospitalization in childhood. American journal of epidemiology. 2007;165(7):756-61. [CrossRef]
- Amugsi DA, Mittelmark MB, Lartey A. An analysis of socio-demographic patterns in child malnutrition trends using Ghana demographic and health survey data in the period 1993–2008. BMC public health. 2013; 13:1-16. [CrossRef]
- Fotso, JC. Urban–rural differentials in child malnutrition: trends and socioeconomic correlates in sub-Saharan Africa. Health & place. 2007;13(1):205-23. [CrossRef]
- Statistiques Tunisie. Measuring Poverty, Inequalities and Polarization in Tunisia 2000-2010. Tunisia: National Institute of Statistics, 2012.
- Nasri, K. Poverty-alleviation programs in Tunisia: selection processes and targeting performance indicators at the regional level. International Journal of Social Economics. 2022;49(4):629-50. [CrossRef]
- Ministry of Health and Population, National Nutrition Institute, UNICEF. Nutrition Agends for action a policy paper on scaling up nutrition interventions in Egypt; 2017.
- Vollmer S, Bommer C, Krishna A, Harttgen K, Subramanian SV. The association of parental education with childhood undernutrition in low-and middle-income countries: comparing the role of paternal and maternal education. International journal of epidemiology. 2017;46(1):312-23. [CrossRef]
- Karlsson O, De Neve J, Subramanian SV. Weakening association of parental education: analysis of child health outcomes in 43 low-and middle-income countries. International Journal of Epidemiology. 2019;48(1):83-97. [CrossRef]
- El Taguri A, Betilmal I, Mahmud SM, Ahmed AM, Goulet O, Galan P, et al. Risk factors for stunting among under-fives in Libya. Public health nutrition. 2009;12(8):1141-9. [CrossRef]
- El-Mouzan MI, Al-Salloum AA, Al-Herbish AS, Qurachi MM, Al-Omar AA. Effects of education of the head of the household on the prevalence of malnutrition in children. Saudi Med J. 2010;31(3):304-7.
- Bukit DS, Keloko AB, Ashar T. Father’s support and mother’s behavior in stunting prevention efforts. Journal of Health Science and Prevention. 2021;5(2):100-5. [CrossRef]
- Laksminingsih, E. Can early initiation to breastfeeding prevent stunting in 6–59 months old children? Journal of Health Research. 2018;32(5):334-41.
- Amer S, Kateeb E. Mothers’ Employment and Exclusive Breastfeeding Practices: A Brief Report from Jerusalem Governorate. Int J Environ Res Public Health. 2023;20(3):2066. [CrossRef]
Figure 1.
Prevalence of stunting, wasting and underweight by year of survey among children 0-23 months in Tunisia.
Figure 1.
Prevalence of stunting, wasting and underweight by year of survey among children 0-23 months in Tunisia.
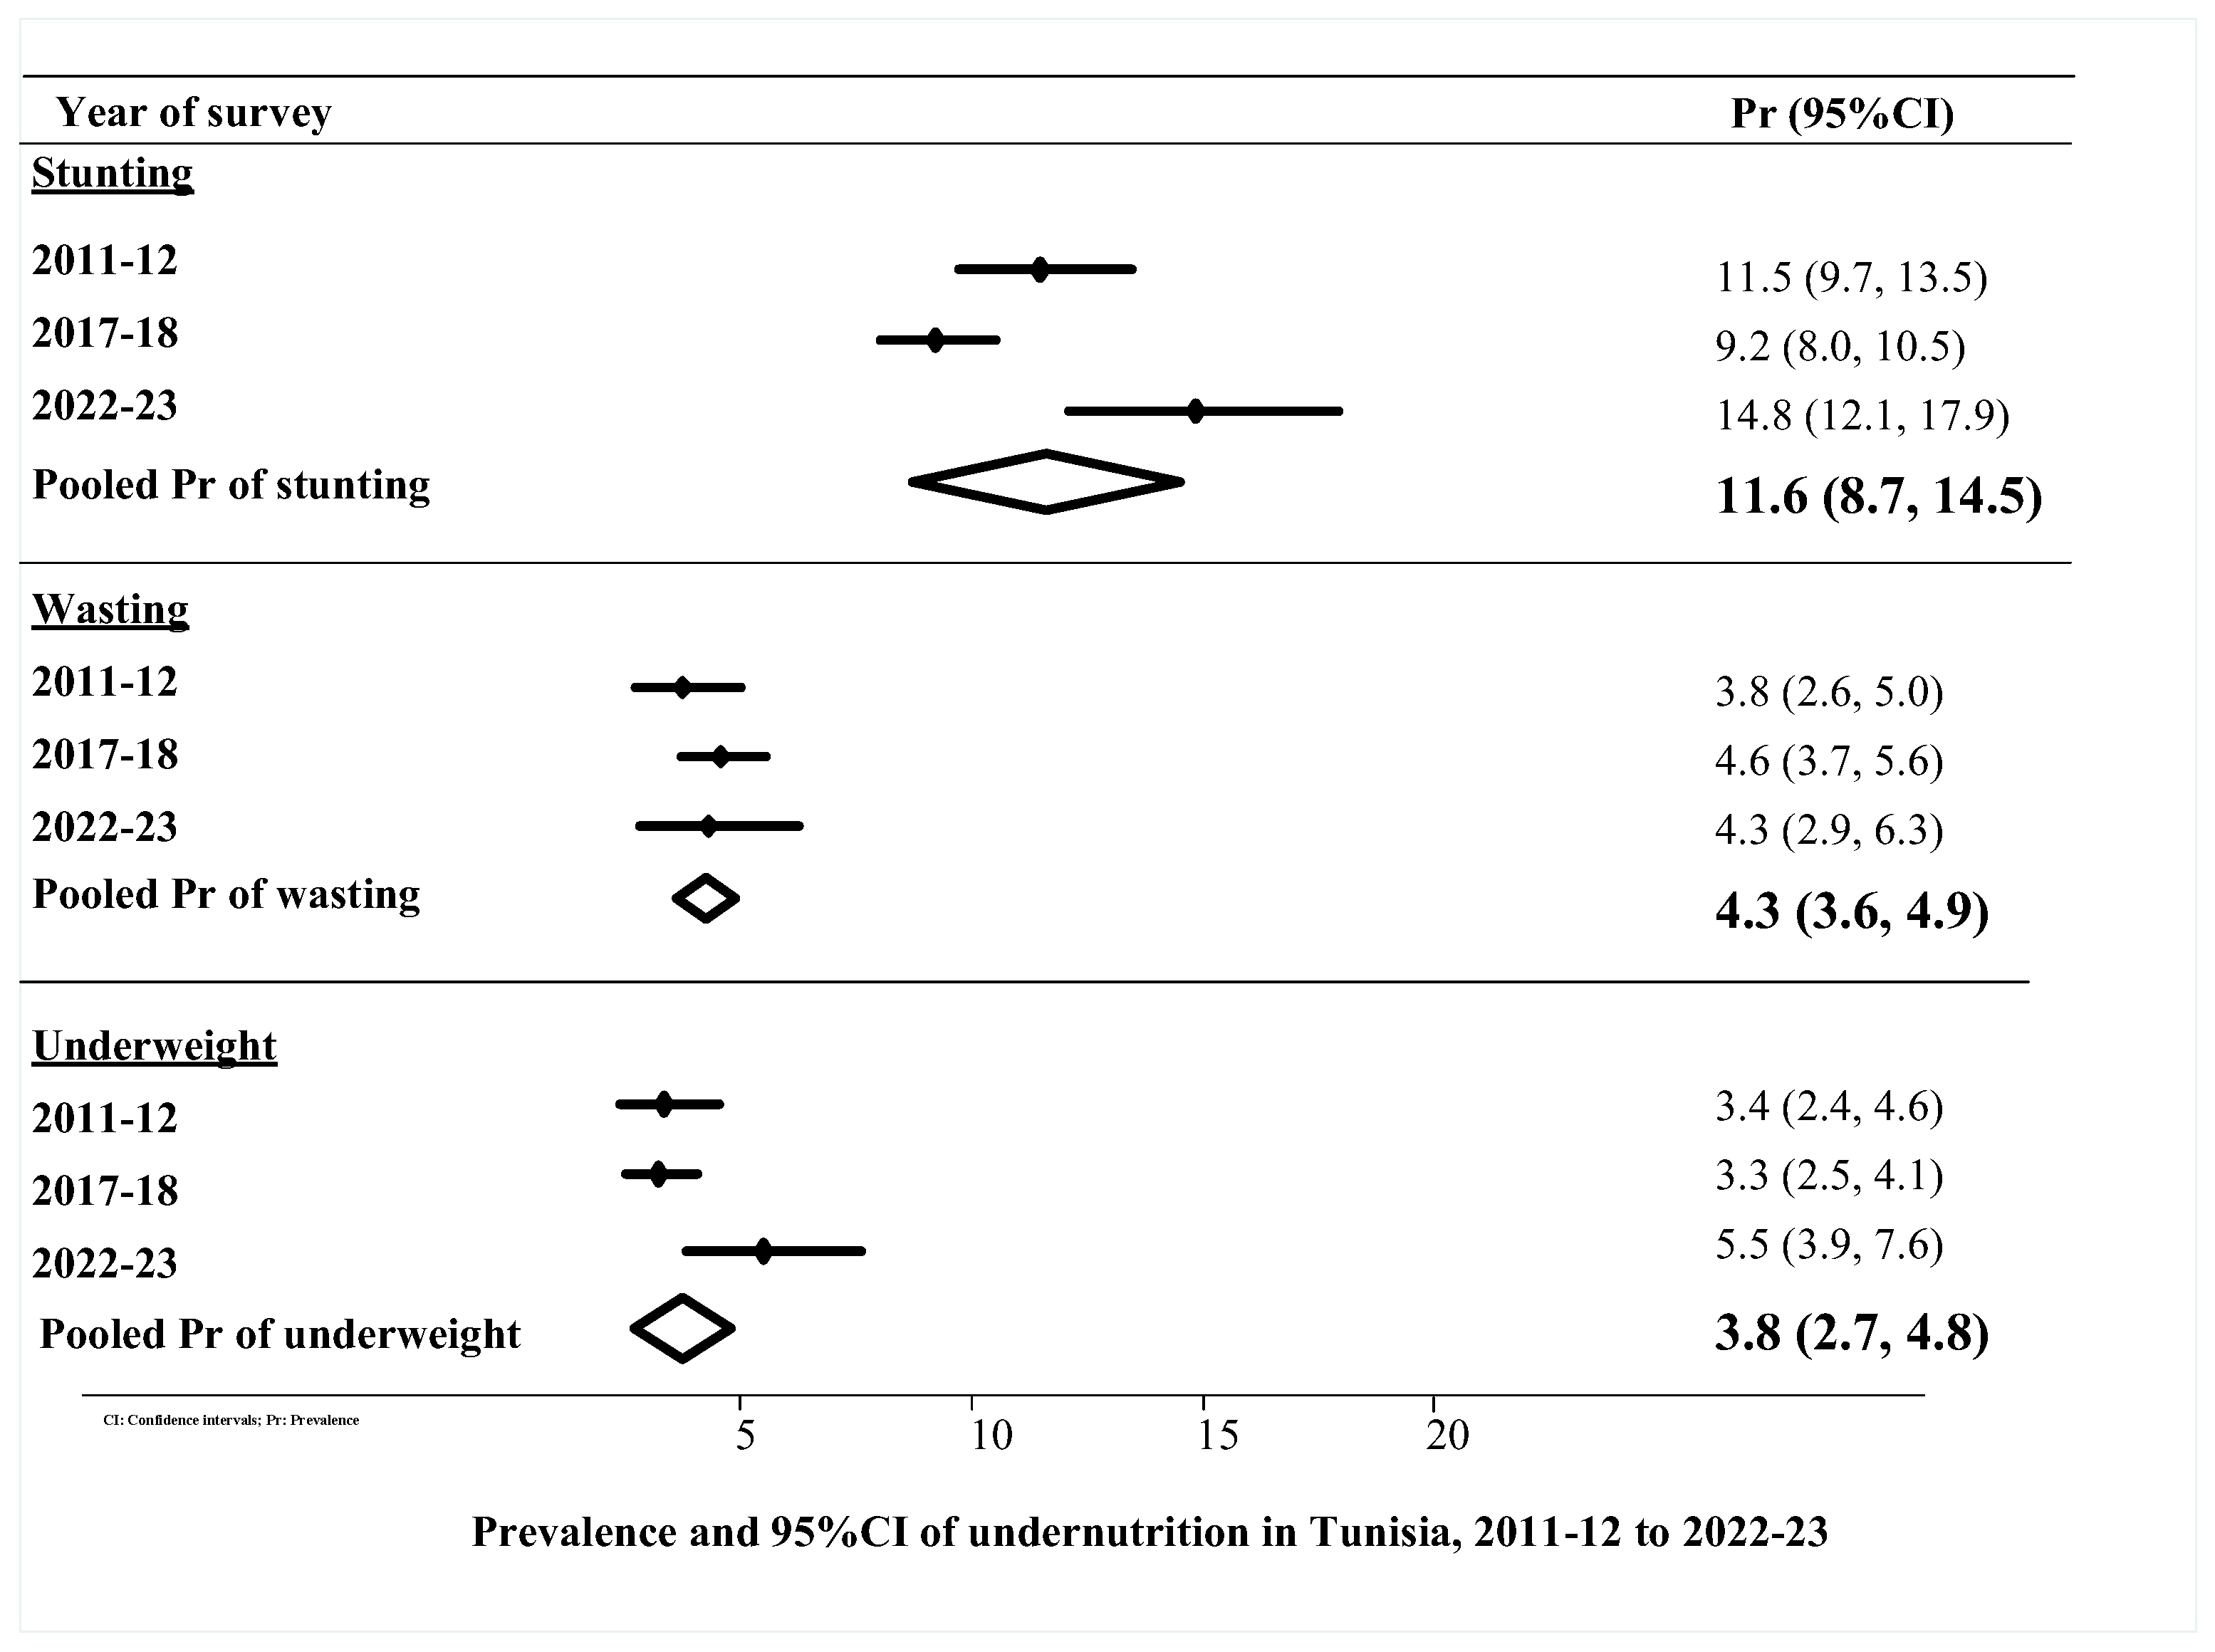

Table 1.
Distribution of determinants of child nutritional health: Tunisia Multiple Indicator Cluster Surveys for the years 2011-12, 2017-18, and 2022-23.
Table 1.
Distribution of determinants of child nutritional health: Tunisia Multiple Indicator Cluster Surveys for the years 2011-12, 2017-18, and 2022-23.
| Years 2011-12 (n=1271) | Years 2017-18 (n=1337) | Years 2022-23 (n=657) | |
|---|---|---|---|
| Area of residence | Total n (%) | Total n (%) | Total n (%) |
| Urban | 808 (63.56) | 831 (62.15) | 366 (55.77) |
| Rural | 463 (36.44) | 506 (37.85) | 291(44.23) |
| Wealth Index | |||
| Poorest | 344 (27.06) | 278 (20.79) | 116 (17.6) |
| Poorer | 295 (23.2) | 175 (13.12) | 191 (29.13) |
| Middle | 245 (19.26) | 257 (19.24) | 143 (21.73) |
| Fourth | 160 (12.6) | 391(29.23) | 88 (13.4) |
| Richest | 227 (17.88) | 235 (17.61) | 119 (18.13) |
| Sex of baby | |||
| Boy | 678 (53.37) | 726 (54.33) | 352 (53.64) |
| Girl | 592 (46.63) | 610 (45.67) | 305 (46.36) |
| Child age (months) | |||
| 0-5 | 337 (26.49) | 316 (23.65) | 150 (22.77) |
| 6-11 | 330 (25.99) | 321 (24.02) | 147 (22.36) |
| 12-17 | 302 (23.76) | 338 (25.26) | 166 (25.29) |
| 18-23 | 302 (23.76) | 362 (27.08) | 194 (29.58) |
| Mother’s age (years) | |||
| 15-34 | 938 (74.05) | 901 (67.88) | 391 (60.99) |
| 35-49 | 329 (25.95) | 426 (32.12) | 250 (39.01) |
| Father’s age (years) | |||
| 18-34 | 380 (33.11) | 374 (30.4) | 172 (28.04) |
| 35-44 | 598 (52.1) | 656 (53.3) | 320 (52.28) |
| 45+ | 170 (14.79) | 201 (16.3) | 121 (19.68) |
| Mother’s age at marriage (years) | |||
| ≤ 18 years | 44 (3.79) | 32 (2.55) | 27 (4.33) |
| >18 years | 1118 (96.21) | 1207 (97.45) | 590 (95.67) |
| Marital status | |||
| Married | 1148 (90.69) | 1231 (92.73) | 613 (95.45) |
| Not married | 118 (9.31) | 96 (7.27) | 29 (4.55) |
| Maternal education | |||
| Secondary and above | 771(60.91) | 973 (73.29) | 188 (30.51) |
| Primary | 354 (27.93) | 275 (20.73) | 339 (55.18) |
| No education | 141(11.16) | 79 (5.98) | 88 (14.31) |
| Father education | |||
| Secondary and above | 751(59.12) | 950 (71.1) | 193 (31.09) |
| Primary | 370 (29.9) | 288 (21.58) | 334 (53.82) |
| No education | 150 (11.8) | 98 (7.33) | 94 (15.09) |
| Maternal BMI (kgm-2) | |||
| ≤18.5 | 750 (64.12) | 878 (66.71) | 390 (65.1) |
| 19-25 | 380 (32.52) | 419 (31.84) | 182 (30.34) |
| 25+ | 39 (3.37) | 19 (1.45) | 27 (4.56) |
| Household members | |||
| 1-3 | 311(24.45) | 650 (48.65) | 116 (17.67) |
| 4-8 | 855 (67.31) | 677 (50.67) | 506 (76.97) |
| >8 | 105 (8.24) | 9 (0.68) | 35 (5.36) |
| Birth order | |||
| Non previous | 474 (37.28) | 770 (57.6) | 352 (53.51) |
| 1 | 601(47.3) | 354 (26.52) | 205 (31.19) |
| 2 or more | 196 (15.43) | 212 (15.88) | 101 (15.31) |
| Cooking fuel | |||
| Clean | 1270 (99.91) | 1333 (99.84) | 656 (99.83) |
| Un clean | 1(0.09) | 2 (0.16) | 1 (0.17) |
| Source of drinking water | |||
| Protected | 497 (62.74) | 725 (54.23) | 354 (53.9) |
| Unprotected | 474 (37.26) | 612 (45.77) | 303 (46.1) |
| Toilet facility | |||
| Improved | 784 (61.72) | 555 (41.53) | 298 (45.32) |
| Unimproved | 486 (38.28) | 781 (58.47) | 359 (54.68) |
| Listening to the radio | |||
| Not at all | 569 (44.9) | 722 (54.38) | 319 (49.78) |
| Yes | 698 (55.1) | 606 (45.62) | 321 (50.22) |
| Watching TV | |||
| Not at all | 22 (1.72) | 3 (2.33) | 31 (4.91) |
| Yes | 1245 (98.28) | 1296 (97.67) | 609 (95.09) |
| Reading newspaper | |||
| Not at all | 464 (42.9) | 105 (79.2) | 523 (81.57) |
| Yes | 617 (57.1) | 276 (20.8) | 118 (18.43) |
| Size of baby | |||
| Average | 824 (72.69) | 852 (69.85) | 418 (68.63) |
| Small | 161(14.23) | 154 (12.65) | 94 (15.4) |
| Large | 148 (13.08) | 213 (17.5) | 97 (15.97) |
| Diarrhoea last two weeks | |||
| No | 1115 (87.85) | 1173 (87.8) | 600 (92.03) |
| Yes | 154 (12.15) | 163 (12.2) | 52 (7.97) |
| Fever | |||
| No | 265 (20.83) | 1025 (76.82) | 542 (82.75) |
| Yes | 1006 (79.17) | 309 (23.18) | 113 (17.25) |
| Cough | |||
| No | 682 (53.74) | 934 (69.91) | 492 (75.18) |
| Yes | 587 (46.26) | 402 (30.09) | 163 (24.82) |
| Any infection | |||
| No | 137 (10.8) | 762 (57.03) | 444 (67.63) |
| Yes | 1134 (89.2) | 574 (42.97) | 213 (32.37) |
| Place of delivery | |||
| Government | 345 (27.14) | 1217 (99.73) | 604 (98.85) |
| Non-government | 926 (72.86) | 3 (0.27) | 7 (1.15) |
| Antenatal clinic visits | |||
| 8+ | 391(30.78) | 304 (22.72) | 165 (25.26) |
| 4-7 | 571(44.92) | 723 (54.06) | 315 (48.15) |
| 1-3 | 142 (11.18) | 139 (10.43) | 79 (12.06) |
| None | 167 (13.12) | 171(12.79) | 95 (14.53) |
| Delivery assistance | |||
| Skilled | 831 (65.4) | 1215 (90.92) | 601 (91.48) |
| Unskilled | 440 (34.6) | 121 (9.08) | 56 (8.52) |
| Mode of delivery | |||
| Non-caesarean | 16 (1.41) | 683 (56.12) | 325 (54.05) |
| Caesarean | 1113 (98.59) | 534 (43.88) | 276 (45.95) |
| Postnatal checkup (days) | |||
| 0-2 | 38 (3.02) | 180 (13.45) | 125 (18.98) |
| After 2 | 360 (28.32) | 206 (15.38) | 83 (12.65) |
| No | 872 (68.66) | 951(71.17) | 449 (68.36) |
| Early initiation of breast feeding | |||
| After 1 hr | 753 (59.26) | 858 (64.23) | 411 (62.49) |
| Withing 1 hr | 518 (40.74) | 478 (35.77) | 246 (37.51) |
| Ever breast feed | |||
| Yes | 555 (43.66) | 1135 (84.9) | 561 (85.39) |
| No | 716 (56.34) | 202 (15.1) | 96 (14.61) |
| Duration of breast feeding (months) | |||
| Up to 12 | 317 (24.95) | 564 (42.21) | 280 (42.56) |
| >12 | 954 (75.05) | 772 (57.79) | 377 (57.44) |
| Literacy | |||
| Yes | 309 (62.6) | 223 (17.85) | 346 (56.47) |
| No | 184 (37.4) | 1026 (82.15) | 266 (43.53) |
Table 2.
Trends in prevalence of stunting, wasting and underweight among children aged 0-23 months in Tunisia, 2011-12 to 2022-23.
Table 2.
Trends in prevalence of stunting, wasting and underweight among children aged 0-23 months in Tunisia, 2011-12 to 2022-23.
| Characteristics | Stunting | Wasting | Underweight | ||||||
| 2011-12 | 2022-23 | 2011-12 - 2022-23 | 2011-12 | 2022-23 | 2011-12 - 2022-23 | 2011-12 | 2022-23 | 2011-12 - 2022-23 | |
| % | % | % | % | % | % | % | % | % | |
| Place of residence | |||||||||
| Urban | 9.3 | 16.4 | 7.0** | 2.9 | 4.8 | 1.8 | 2.9 | 6.2 | 3.3 |
| Rural | 15.1 | 12.8 | -2.4 | 5.2 | 3.6 | -1.7 | 4.2 | 4.7 | 0.5 |
| Wealth Index | |||||||||
| Poorest | 8.9 | 21.3 | 12.3 | 4.0 | 9.2 | 5.2 | 3.8 | 12.1 | 8.3 |
| Poorer | 14.3 | 15.5 | 1.3 | 4.6 | 3.4 | -1.2 | 3.2 | 4.3 | 1.1 |
| Middle | 4.6 | 12.7 | 8.1** | 2.3 | 4.9 | 2.6 | 2.2 | 7.2 | 5.1 |
| Fourth | 14.1 | 9.2 | -4.9 | 5.2 | 1.7 | - 3.6 | 2.6 | 1.6 | -0.9 |
| Richest | 17.1 | 14.4 | -2.7 | 3.2 | 2.3 | -0.8 | 4.8 | 2.3 | -2.5 |
| Sex of baby | |||||||||
| Boy | 12.9 | 16.5 | 3.7 | 4.8 | 6.3 | 1.5 | 4.7 | 7.5 | 2.8 |
| Girl | 9.9 | 12.8 | 2.9 | 2.7 | 2.0 | -0.7 | 1.8 | 3.2 | 1.4 |
| Child age (months) | |||||||||
| 0-5 | 16.0 | 27.8 | 11.8** | 6.6 | 8.2 | 1.6 | 6.9 | 15.7 | 8.9** |
| 6-11 | 5.1 | 7.8 | 2.7 | 4.4 | 1.5 | -2.9 | 2.6 | 4.6 | 2.0 |
| 12-17 | 15.5 | 13.6 | -1.9 | 1.4 | 1.5 | 0.2 | 0.7 | 2.3 | 1.7 |
| 18-23 | 9.3 | 10.9 | 1.6 | 2.3 | 5.5 | 3.21 | 3.0 | 1.2 | -1.8 |
| Mother’s age (years) | |||||||||
| 15-34 years | 11.1 | 17.2 | -0.4 | 3.9 | 4.2 | 0.3 | 3.7 | 6.6 | 2.9 |
| 35-49 years | 12.5 | 11.5 | -7.0 ** | 3.4 | 4.2 | 0.8 | 2.5 | 3.7 | 1.2 |
| Father’s age (years) | |||||||||
| 18-34 | 10.5 | 10.5 | 4.9 | 4 | 5.4 | 1.4 | 6.4 | 5.7 | -0.7 |
| 35-44 | 11.5 | 11.5 | 2.8 | 3.4 | 3.7 | 0.3 | 2.0 | 5.2 | 3.2** |
| 45+ | 12.0 | 12.0 | 5.3 | 3.9 | 4.3 | 0.4 | 3.1 | 6.5 | 3.4 |
| Mother’s age at marriage (years) | |||||||||
| ≤ 18 | 12.6 | 12.5 | -0.1 | 0.9 | 0.0 | -0.9 | - | - | 9.2 |
| >18 | 11.4 | 15.4 | 4.0 | 4 | 4.4 | 0.4 | 3.7 | 5.4 | 1.7 |
| Marital status | |||||||||
| Married | 11.3 | 15.2 | 3.9 | 3.7 | 4.3 | 0.6 | 3.6 | 5.6 | 2.0 |
| Not married | 13.8 | 10.8 | -3.0 | 4.7 | 2.7 | -2.1 | 1.0 | 2.5 | 1.5 |
| Maternal education | |||||||||
| Secondary and above | 10.1 | 13.1 | 3.05 | 3.8 | 0.6 | 2.2 | 3.9 | 5.8 | 1.9 |
| Primary | 11.0 | 16.3 | 5.2 | 3.3 | 3.4 | 0.2 | 1.6 | 4.0 | 2.4 |
| No education | 20.0 | 16.7 | -3.3 | 5.2 | 2.1 | -3.1 | 4.9 | 11.4 | 6.5 |
| Father education | |||||||||
| Secondary and above | 10.1 | 13.1 | 3.05 | 4.1 | 6.3 | 2.3 | 3.9 | 5.4 | 1.5 |
| Primary | 10.0 | 16.2 | 6.2 ** | 2.8 | 3.7 | 0.9 | 1.5 | 4.7 | 3.2** |
| No education | 21.6 | 15.4 | -6.3 | 4.9 | 1.2 | -3.6 | 5.4 | 10.0 | 4.6 |
| Maternal BMI (kgm-2) | |||||||||
| ≤18.5 | 6.3 | 8.5 | 2.2 | 5.9 | 6.5 | 0.6 | 4.6 | 6.6 | 2.0 |
| 19-25 | 19.7 | 23.6 | 3.9 | - | - | - | 1.0 | 3.9 | 2.9 |
| 25+ | 32.0 | 50.2 | 18.2 | - | - | - | 2.4 | - | -2.4 |
| Household members | |||||||||
| 1-3 | 9.8 | 11.3 | 1.51 | 6.3 | 10.2 | 3.9 | 4.5 | 3.5 | -1.0 |
| 4-8 | 12.3 | 15.9 | 3.62 | 2.7 | 3.0 | 0.3 | 3.3 | 6.0 | 2.7 |
| >8 | 10.2 | 9.7 | -0.49 | 4.9 | 3.0 | -1.9 | 1.0 | 5.5 | 4.5 |
| Birth order | |||||||||
| Non previous | 10.4 | 18.6 | 8.3 ** | 5.4 | 5.3 | -0.1 | 3.3 | 7.4 | 4.1** |
| 1 | 11.3 | 12.0 | 0.8 | 3.1 | 2.3 | -0.7 | 3.3 | 2.0 | -1.3 |
| 2 or more | 14.8 | 6.6 | -8.2 ** | 2.1 | 4.1 | 1.9 | 3.9 | 5.6 | 1.7 |
| Source of drinking water | |||||||||
| Protected | 11.6 | 13.9 | 2.3 | 3.7 | 4.2 | 2.0 | 4.0 | 5.3 | 1.3 |
| Unprotected | 11.3 | 15.8 | 4.5 | 4.0 | 4.3 | -0.01 | 2.4 | 5.7 | 3.3 |
| Toilet facility | |||||||||
| Improved | 11.6 | 12.7 | 1.1 | 3.7 | 4.7 | 2.0 | 4.0 | 4.0 | -0.1 |
| Unimproved | 11.3 | 16.5 | 5.2 | 3.9 | 3.9 | - 0.01 | 2.4 | 6.8 | 4.3 ** |
| Listening to the radio | |||||||||
| Not at all | 10.6 | 15.2 | 4.6 | 3.1 | 4.1 | 1.0 | 2.4 | 5.4 | 3.0 ** |
| Yes | 12.2 | 14.9 | 2.7 | 4.4 | 4.4 | 0.2 | 4.2 | 5.6 | 1.3 |
| Watching TV | |||||||||
| Not at all | 20.1 | 25.8 | 5.7 | - | 3.8 | -1.0 | 2.9 | 8.4 | 5.6 |
| Yes | 11.3 | 14.4 | 3.1 | 3.9 | 4.2 | 0.1 | 3.4 | 5.3 | 1.9 |
| Read newspaper | |||||||||
| Not all | 9.0 | 15.0 | 6.0 ** | 2.0 | 4.5 | 2.5 | 1.7 | 6.1 | 4.4 ** |
| Yes | 10.9 | 15.3 | 4.4 | 4.9 | 2.9 | -2.0 | 4.2 | 2.6 | -1.7 |
| Size of baby | |||||||||
| Average | 11.6 | 16.2 | 4.6 | 3.7 | 5.1 | 1.4 | 3.6 | 5.1 | 1.6 |
| Small | 13.7 | 14.3 | 0.6 | 6.3 | 3.6 | -2.7 | 7.0 | 5.6 | -1.5 |
| Large | 8.7 | 12.5 | 3.8 | 1.4 | 1.3 | - 0.1 | 0.5 | 7.8 | 7.3 ** |
| Diarrhoea last two weeks | |||||||||
| No | 11.6 | 14.6 | 3.0 | 3.8 | 4.5 | 0.7 | 3.5 | 5.6 | 2.2 |
| Yes | 11.0 | 17.4 | 6.4 | 3.7 | 1.9 | -1.9 | 2.9 | 4.8 | 1.9 |
| Fever | |||||||||
| No | 15.5 | 15.8 | 0.28 | 4.5 | 4.4 | -0.1 | 3.3 | 6.1 | 2.8 |
| Yes | 10.4 | 10.3 | -0.13 | 3.6 | 3.5 | -0.1 | 3.4 | 2.5 | -0.9 |
| Cough | |||||||||
| No | 10.4 | 16.1 | 5.7 ** | 4.8 | 4.3 | -0.5 | 4.5 | 5.9 | 1.4 |
| Yes | 12.7 | 11 | -1.8 | 2.6 | 4.0 | 1.4 | 2.0 | 4.4 | 2.4 |
| Any infection | |||||||||
| No | 13.4 | 15.3 | 1.9 | 6.6 | 4.4 | -2.3 | 5.3 | 6.0 | 0.7 |
| Yes | 11.2 | 13.6 | 2.4 | 3.4 | 4.0 | 0.5 | 3.1 | 4.4 | 1.3 |
| Place of delivery | |||||||||
| Government | 7.9 | 15.3 | 7.4** | 3.9 | 3.2 | -0.6 | 3.0 | 4.4 | 1.3 |
| Non-government | 7.3 | 15.3 | 8.0 | 3.7 | 7.5 | 3.8 | 4.1 | 9.5 | 5.4 |
| Antenatal clinic visits | |||||||||
| 8+ | 14.3 | 19.9 | 5.6 | 3.2 | 7.1 | 3.9 | 4.0 | 3.9 | -0.2 |
| 4-7’ | 9.6 | 13.7 | 4.12 | 5.2 | 3.2 | -2.0 | 4.0 | 6.8 | 2.8 |
| 1-3’ | 11.3 | 14.3 | 2.1 | 0.3 | 2.3 | 2.0 | 1.4 | 3.9 | 2.5 |
| None | 11.2 | 10.1 | -1.1 | 3.3 | 4.7 | 1.4 | 1.1 | 5.3 | 4.2 |
| Delivery assistance | |||||||||
| Skilled | 11.0 | 15.3 | 4.3** | 3.8 | 4.4 | 0.6 | 3.8 | 5.7 | 1.9 |
| Unskilled | 12.4 | 8.5 | -3.9 | 3.8 | 2.9 | -0.9 | 2.6 | 2.9 | 0.3 |
| Mode of delivery | |||||||||
| Non-caesarean | 11.2 | 17.2 | 6.0** | 3.6 | 4.0 | 0.4 | 3.7 | 5.7 | 2.0 |
| Caesarean | 11.5 | 13.6 | 2.0 | 3.9 | 4.8 | 0.9 | 3.4 | 5.8 | 2.4 |
| Postnatal checkup | |||||||||
| 0-2 days | 14.0 | 16.5 | 2.6 | 13 | 7.7 | -5 .3 | 9.5 | 0.9 | -8.6 |
| After 2 days | 13.2 | 21.6 | 8.4 | 2.2 | 4.3 | 2.1 | 3.4 | 8.1 | 4.8 |
| No | 10.6 | 13.1 | 2.5 | 4.1 | 3.3 | -0.8 | 3.1 | 6.3 | 3.1 |
| Early initiation of breast feeding | |||||||||
| After 1 hr | 9.4 | 10.3 | 0.97 | 4.0 | 4.3 | 0.3 | 2.9 | 5.8 | 2.9 |
| Withing 1 hr | 14.5 | 22.2 | 7.7** | 3.4 | 4.1 | 0.7 | 4.0 | 5.0 | 1.0 |
| Ever breast feed | |||||||||
| Yes | 13.9 | 16 | -2.3 | 3.1 | 3.5 | 0.4 | 3.8 | 6.0 | 2.2 |
| No | 9.5 | 7.2 | 2.1 | 4.4 | 8.7 | 4.3 | 3.1 | 2.7 | -0.4 |
| Duration of breast feeding (months) | |||||||||
| Up to 12 | 13.5 | 17.9 | 5.4 | 4.1 | 3.6 | -0.5 | 4.7 | 9.7 | 7.4 ** |
| >12 | 10.8 | 12.5 | 2.7 | 3.7 | 4.7 | 1.0 | 2.9 | 2.3 | 1.7 |
| Literacy | |||||||||
| Yes | 10.2 | 16.9 | 6.7 ** | 3.1 | 3.8 | 0.7 | 1.2 | 6.6 | 5.5 ** |
| No | 19.3 | 13.6 | -5.7 | 4.7 | 4.4 | -0.30 | 4.9 | 4.4 | -0.5 |
- Omitted values; *P< 0.05; **p<0.01; ***p<0.001.
Table 3.
Unadjusted and adjusted odds ratios for determinants of indicators of stunting, wasting and underweight) among children aged 0-23 months in Tunisia.
Table 3.
Unadjusted and adjusted odds ratios for determinants of indicators of stunting, wasting and underweight) among children aged 0-23 months in Tunisia.
| Characteristics | Stunting | Wasting | Underweight | ||||||||||
| Unadjusted | P | Adjusted | P | Unadjusted | P | Adjusted | P | Unadjusted | P | Adjusted | P | ||
| Years of survey | |||||||||||||
| 2012 | 1 | 1 | 1 | 1 | 1 | ||||||||
| 2018 | 0.72[0.54, 0.96] | 0.023 | 0.73 [0.52, 1.01] | 0.054 | 0.78 [0.45, 1.25] | 0.279 | 0.79 [0.47, 1.34] | 0.388 | 0.74 [0.44, 1.24] | 0.253 | 0.70[0.41, 1.20] | 0.191 | |
| 2023 | 1.34 [0.96, 1.87] | 0.088 | 1.22 [0.85, 1.74] | 0.284 | 1.12 [0.63, 1.10] | 0.689 | 1.16 [0.64, 2.12] | 0.620 | 1.66 [0.95, 2.91] | 0.074 | 1.70[0.94, 3.10] | 0.082 | |
| Area of residence | |||||||||||||
| Urban | 1 | 1 | 1 | ||||||||||
| Rural | 1.35 [1.06, 1.74] | 0.017 | 1.08 [0.69, 1.67] | 0.745 | 1.09 [0.70, 1.69] | 0.717 | |||||||
| Wealth Index | |||||||||||||
| Poorest | 1 | 1 | 1 | 1 | |||||||||
| Poorer | 1.36 [0.92, 2.02] | 0.128 | 1.27 [0.84, 1.91] | 0.257 | 0.98 [0.50, 1.93] | 0.958 | 0.78 [0.42, 1.44] | 0.424 | |||||
| Middle | 0.56 [0.37, 0.86] | 0.008 | 0.52[0.33, 0.82] | 0.004 | 0.89 [0.45, 1.74] | 0.726 | 0.65 [0.32, 1.35] | 0.248 | |||||
| Fourth | 0.79 [0.53, 1.18] | 0.250 | .83 [0.54, 1.28] | 0.395 | 0.73 [0.35, 1.50] | 0.391 | 0.43 [0.21, 0.88] | 0.022 | |||||
| Richest | 1.20 [0.82, 1.76] | 0.349 | 1.29 [0.87, 1.92] | 0.210 | 0.82 [0.41, 1.64] | 0.580 | 0.66 [0.35, 1.24] | 0.199 | |||||
| Sex of baby | |||||||||||||
| Boy | 1 | 1 | 1 | 1 | 1 | ||||||||
| Girl | 0.85 [0.66, 1.10] | 0.212 | 0.61 [0.39, 0.96] | 0.034 | 0.60 [0.37, 0.97] | 0.036 | 0.47 [0.29, 0.76] | 0.002 | 0.45[0.27, 0.74] | 0.002 | |||
| Child age | |||||||||||||
| 0 to 5 | 1 | 1 | 1 | 1 | 1 | 1 | |||||||
| 6 to 11 | 0.35[0.24, 0.52] | <0.001 | .26 [0.18, 0.39] | <0.001 | 0.52 [0.24, 1.76] | 0.004 | 0.42 [0.23, 0.77] | 0.006 | 0.45 [0.14, 0.44] | <0.001 | 0.20[0.10, 0.38] | <0.001 | |
| 12 to17 | 0.62 [0.45, 0.87] | 0,006 | .44 [0.31, 0.63] | <0.001 | 0.14 [0.07, 0.31] | <0.001 | 0.15 [0.07, 0.33] | <0.001 | 0.08 [0.03, 0.23] | <0.001 | 0.08[0.03, 0.22] | <0.001 | |
| 18-23 | 0.58 [0.42, 0.81] | <0.001 | 0.47 [0.33, 0.66] | <0.001 | 0.32 [0.18, 0.58] | <0.001 | 0.32 [0.17, 0.59] | <0.001 | 0.22 [0.12, 0.40] | <0.001 | 0.22[0.12, 0.42] | <0.001 | |
| Father’s age (years) | |||||||||||||
| 18-34 | 1 | 1 | 1 | ||||||||||
| 35-44 | 1.24 [0.91, 1.69] | 0.174 | 0.71 [0.43,1.19] | 0.196 | 0.54 [0.33, 0.88] | 0.014 | |||||||
| 45+ | 1.25 [0.85, 1.85] | 0.259 | 0.78 [0.39, 1.58] | 0.497 | 0.76 [0.39, 1.50] | 0.434 | |||||||
| Mother’s age at marriage (years) | |||||||||||||
| ≤ 18 | 1 | 1 | 1 | 1 | |||||||||
| >18 | 1.40 [0.50, 2.14] | 0.916 | 10.68[1.46, 78.0] | 0.020 | 10.12 [1.39,73.51] | 0.022 | 1.57 [0.22, 11.48] | 0.656 | |||||
| Birth order | |||||||||||||
| Non previous | 1 | 1 | 1 | ||||||||||
| 1 | 0.87 [0.66, 1.16] | 0.347 | 0.76 [0.47, 1.23] | 0.263 | 0.62 [0.36, 1.07] | 0.085 | |||||||
| 2 or more | 1.08 [0.77, 1.52] | 0.663 | 0.56 [0.26, 1.19] | 0.132 | 1.19 [0.69, 2.09] | 0.532 | |||||||
| Household members | |||||||||||||
| 1-3 | 1 | 1 | 1 | ||||||||||
| 4-8 | 1.38 [1.04, 1.83] | 0.024 | 0.53 [0.34, 0.84] | 0.006 | 1.27 [0.78, 2.07] | 0.344 | |||||||
| >8 | 1.12 [0.62, 2.02] | 0.704 | 0.95 [0.38, 2.35] | 0.910 | 0.82 [0.32, 2.07] | 0.672 | |||||||
| Size of baby | |||||||||||||
| Average | 1 | 1 | 1 | 1 | |||||||||
| Small | 1.34 [0.95, 1.88] | 0.092 | 1.48 [0.82, 2.68] | 0.197 | 1.86 [1.04, 3.31] | 0.035 | 1.90[1.04, 3.47] | 0.037 | |||||
| Large | 0.58 [0.36, 0.94] | 0.026 | 0.53 [0.25, 1.11] | 0.093 | 0.73 [0.36, 1.47] | 0.377 | 0.65[0.31, 1.34] | 0.241 | |||||
| Source of drinking water | |||||||||||||
| Protected | 1 | 1 | 1 | ||||||||||
| Unprotected | 0.95 [0.74, 1.23] | 0.706 | 1.45 [0.93, 2.25] | 0.098 | 1.07 [0.68, 1.67] | 0.773 | |||||||
| Toilet facility | |||||||||||||
| Improved | 1 | 1 | 1 | ||||||||||
| Unimproved | 1.03 [0.80, 1.32] | 0.812 | 1.26 [0.81, 1.96] | 0.306 | 1.26 [0.81, 1.96] | 0.306 | |||||||
| Listening to the radio | |||||||||||||
| Not at all | 1 | 1 | |||||||||||
| Yes | 0.07 [0.83, 1.37] | 0.618 | 1.13 [0.73, 1.75] | 0.598 | 1.34 [0.87, 2.08] | 0.189 | |||||||
| Watching TV | |||||||||||||
| Not at all | 1 | 1 | 1 | ||||||||||
| Yes | 0.49 [0.29, 0.84] | 0.009 | 2.59[0.35, 18.86] | 0.349 | 0.43 [0.17, 1.08] | 0.072 | |||||||
| Read newspaper | |||||||||||||
| Not all | 1 | 1 | 1 | ||||||||||
| Yes | 1.0 [0.75, 1.35] | 0.969 | 1.22 [0.75, 1.99] | 0.418 | 0.98 [0.59, 1.61] | 0.925 | |||||||
| Maternal education | |||||||||||||
| Secondary and above | 1 | 1 | 1 | ||||||||||
| Primary | 1.37 [1.03, 1.82] | 0.033 | 0.93 [0.56, 1.56] | 0.780 | 0.84 [0.50, 1.40] | 0.504 | |||||||
| No education | 2.06 [1.4, 2.92] | <0.001 | 1.15 [0.59, 1.26] | 0.678 | 1.96 [1.04, 3.69] | 0.036 | |||||||
| Maternal BMI | |||||||||||||
| ≤18.5 | 1 | - | 1 | 1 | |||||||||
| 19-25 | 3.02 [2.32, 3.93] | <0.001 | 3.51 [2.69, 4.58] | <0.001 | - | 0.28 [0.15, 0.52] | <0.001 | 0.23[0.10, 0.54] | 0.001 | ||||
| 25+ | 9.27[5.35, 16.04] | <0.001 | 10.67 [5.97,19.08] |
<0.001 | - | 0.24 [0.03, 1.73] | 0.156 | 0.20[0.03, 1.61] | 0.13 | ||||
| Place of delivery | |||||||||||||
| Government | 1 | 1 | 1 | ||||||||||
| Non government | 1.07 [0.66, 1.73] | 0.780 | 1.73 [0.83, 3.58] | 0.143 | 2.23 [1.14, 4.37] | 0.020 | |||||||
| Delivery assistance | |||||||||||||
| Skilled | 1 | 1 | 1 | ||||||||||
| Unskilled | 1.06 [0.78, 1.43] | 0.708 | 0.90 [0.51, 1.60] | 0.727 | 0.71 [0.40, 1.26] | 0.241 | |||||||
| Antenatal clinic visits | |||||||||||||
| 8+ | 1 | 1 | 1 | ||||||||||
| 4-7’ | 0.70 [0.52, 0.95] | 0.020 | 0.73 [0.44, 1.22] | 0.232 | 1.23 [0.72, 2.11] | 0.456 | |||||||
| 1-3’ | 0.73 [0.47, 1.11] | 0.143 | 0.57 [0.26, 1.25] | 0.158 | 1.01 [0.48, 2.11] | 0.987 | |||||||
| None | 0.78 [0.53, 1.17] | 0.231 | 0.62 [0.30, 1.30] | 0.204 | 0.97 [0.47, 1.10] | 0.925 | |||||||
| Postnatal checkup | |||||||||||||
| 0-2 days | 1 | 1 | 1 | ||||||||||
| After 2 days | 0.91 [0.57, 1.45] | 0.697 | 0.35 [0.17,0.74] | 0.006 | 1.03 [0.46, 2.29] | 0.943 | |||||||
| No | 0.75 [0.51, 1.12] | 0.146 | 0.45 [0.25, 0.81] | 0.008 | 0.98 [0.49, 1.98] | 0.960 | |||||||
| Mode of delivery | |||||||||||||
| Non-caesarean | 1 | 1 | 1 | ||||||||||
| Caesarean | 0.87 [0.66, 1.15] | 0.325 | 1.22 [0.76, 1.95] | 0.409 | 0.89 [0.54, 1.46] | 0.638 | |||||||
| Diarrhea last two weeks | |||||||||||||
| No | 1 | 1 | 1 | ||||||||||
| Yes | 1.11 [0.76, 1.61] | 0.598 | 1.02 [0.54, 1.93] | 0.945 | 0.92 [0.48, 1.79] | 0.809 | |||||||
| Fever | |||||||||||||
| No | 1 | 1 | 1 | ||||||||||
| Yes | 0.85 [0.66, 1.09] | 0.202 | 0.75 [0.48, 1.20] | 0.231 | 0.69 [0.44, 1.10] | 0.119 | |||||||
| Cough | |||||||||||||
| No | 1 | 1 | 1 | ||||||||||
| Yes | 1.02 [0.78, 1.32] | 0.907 | 0.68 [0.42, 1.09] | 0.107 | 0.58 [0.35, 0.96] | 0.035 | |||||||
| Any infection | |||||||||||||
| No | 1 | 1 | 1 | ||||||||||
| Yes | 0.92 [0.72, 1.19] | 0.544 | 0.78 [0.50, 1.21] | 0.262 | 0.75 [0.48, 1.16] | 0.193 | |||||||
| Early initiation of breast feeding | |||||||||||||
| After 1 hr | 1 | 1 | 1 | ||||||||||
| Withing 1 hr | 1.64 [1.28, 2.11] | <0.001 | 1.02 [0.66, 1.60] | 0.918 | 1.16 [0.74, 1.80] | 0.521 | |||||||
| Ever breast feed | |||||||||||||
| Yes | 1 | 1 | 1 | ||||||||||
| No | 0.77 [0.58, 1.02] | 0.073 | 1.41 [0.88, 2.27] | 0.149 | 0.85 [0.52, 1.39] | 0.510 | |||||||
| Duration of breast feeding | |||||||||||||
| Up to 12 months | 1 | 1 | 1 | ||||||||||
| >12 months | 0.79 [0.55, 1.14] | 0.207 | 0.67 [0.43, 1.04] | 0.076 | 0.42 [0.27, 0.65] | <0.001 | |||||||
Disclaimer/Publisher’s Note: The statements, opinions and data contained in all publications are solely those of the individual author(s) and contributor(s) and not of MDPI and/or the editor(s). MDPI and/or the editor(s) disclaim responsibility for any injury to people or property resulting from any ideas, methods, instructions or products referred to in the content. |
© 2024 by the authors. Licensee MDPI, Basel, Switzerland. This article is an open access article distributed under the terms and conditions of the Creative Commons Attribution (CC BY) license (http://creativecommons.org/licenses/by/4.0/).
Copyright: This open access article is published under a Creative Commons CC BY 4.0 license, which permit the free download, distribution, and reuse, provided that the author and preprint are cited in any reuse.


