Submitted:
17 October 2024
Posted:
18 October 2024
You are already at the latest version
Abstract
The ODS demonstrated the optimal structural response, showcasing equal storey drift compared to the EFS, while emitting 38% less pollution. Furthermore, it only induced approximately 5% more pollution than the system with the lowest contamination levels (OFS). This study concludes that earthquake-resistant design has a direct impact on CO2 emissions in the environment. An effective earthquake-resistant response could have lower levels of pollution; therefore, a balance could be achieved between a good structural response with a reduced environmental impact.
Keywords:
Earthquake-resistant design
; Environmental impact
; Life Cycle Assessment
; Sustainable Buildings
; Storey Drift
Introduction
The emission of greenhouse gases is annually increasing due to the non-controlled and unsustainable economic growth and industrialisation, leading to a global crisis and directly influencing climate change [1]. Greenhouse gases are produced in all the sectors including energy (73.2%), agriculture, forestry, and land use (18.4%), waste (3.2%) and industry (5.2%); being energy consumption in buildings, the second most pollutant factor in the whole energy sector [2,3]. Globally, the construction industry contributes approximately 40% of the annual carbon emissions [4]. Moreover, in terms of energy consumption and environmental impact, the construction sector annually consumes more than 35% of energy resources and requires approximately 50% of natural resources [4,5]. Therefore, the sustainability of the construction field may be considered poor.
Considering the severe environmental issues entailed in the construction sector, particularly in multiple stores buildings, studies [1,6,7,8] were conducted to identify the incidence of buildings in the generation of greenhouse pollutants. Although these investigations provided valuable data on the building's carbon footprint, most of these studies primarily focused on the selection of the materials but not on the consumption rates of either CO2 emissions or energy. For instance, the CO2 emissions of reinforced concrete were lower than the emissions in structural steel buildings [1]. Contrasting results were found in a study that evaluated both energy consumption and CO2 emissions in concrete, steel, and wood buildings [8]. In this case, lower emissions were registered in the steel-based structure which could be explained by the analysed stages in the life-cycle assessment.
There are limited data concerning the incidence of construction components, such as the lateral loading system and the number of floors, in the carbon footprint of an edification building [1,8,9] . Measurement of the CO2 emissions produced in the construction process of a roof structure highlighted that voided slabs were less pollutant than ordinary slabs [10]. Another investigation [9] demonstrated that steel had the highest environmental impact in the construction and demolition of a multi-store building (life cycle assessment). This study considered other construction variables besides the main building materials including the number of floors and structural system. In a study conducted in Mexico, it was found that buildings which used solid concrete for ceilings and walls, and aluminium frame windows left a larger carbon footprint than structures that use ceramic-based walls, vault ceilings and PVC-based windows [11]. Another interesting observation in Peru [12] although not surprising, showed that most of the CO2 emissions were produced during the construction stage rather than in the transportation stage.
In Ecuador, and in general in developing countries, there is limited information concerning the carbon footprint of buildings and how sustainable they are. A first investigation in Ecuador, into the energy consumption and CO2 emissions in the fabrication of ready-mix concrete was proposed by Vázquez [13]. Another evaluation of a building in Ecuador was accomplished by Narvaez and Maldonado [14] who found out that the architectural design influences levels of CO2 emissions in an edification.
Designing buildings in Ecuador and in other seismic countries is challenging [15]. The design of buildings considers seismic design theory to evaluate lateral loads, materials, and structure altitude (number of floors). In addition to the structural characteristics of the building, other factors such as building performance, and direct and indirect costs are normally considered, but, the environmental impact is usually disregarded. Therefore, there is limited data available, particularly in developing countries located in seismic areas, that quantifies the relation between seismic resistance and sustainability. With this in mind, the aim of this study is to analyse the impact of the lateral structural design in the environment by conducting a life-cycle assessment (LCA) in the manufacturing, transportation and construction phases.
Materials and Methods
2.1. Case Study Building
The case study building was stablished in the district with the most mid-altitude buildings in Quito (Table 1) [16]. The dimensions of the building were chosen after conducting a statistical analysis with an 80% confidence level of the types of buildings in the area (Table 1). Additionally, it is important to note that the building's foundation is on a type D soil [17,18].
2.2 Structural Design Alternatives
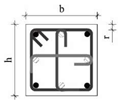
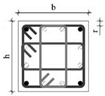
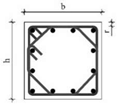
The case study building consisted of three structural systems, i.e. Optimised Frame System (OFS) (Figure 1a), Optimised Dual System (ODS) (Figure 1b) and Equivalent Frame System (EFS) (Figure 1c). An optimised system considers the Ecuadorean National Standards [19] to define the minimum cross-sectional area of the structural elements to provide an adequate mechanical response to specific structural demands. However, the OFS presents a drift of 1.75%, which is at the limit of what is permissible according to the Ecuadorian construction norm, set at 2%. This is important because high drifts near this limit contribute to the failures of non-structural elements such as masonry. These detrimental outcomes in a building were observed in a recent earthquake in Pedernales – Ecuador in 2016 where masonry debris involved deaths [20].
The OFS constitutes a more flexible structure; therefore, it has a greater floor drift compared to the ODS; in other words, these systems do not exhibit the same level of structural behavior against seismic actions, since the maximum floor drift of the OFS was 1.75%; while for the ODS, it was 0.83%. Given that the ODS is characterized by its structural rigidity, it is possible that it requires less material to achieve the same resistance and stability as the OFS, which relies on flexibility to absorb and dissipate seismic energy. This means that constructing the ODS could imply less extraction of natural resources and a lower generation of CO2. Additionally, the reduction in the amount of material used could also have a positive impact in terms of energy associated with the production and distribution of those materials.
Therefore, from an environmental perspective, it is argued that the ODS is more sustainable than the OFS due to its potential to minimize the use of construction materials and thus reduce its overall environmental footprint. Since these systems are different, they cannot be directly comparable to each other. For this reason, the research was extended to a third structural system known as the Equivalent Frame System (EFS). In this system, the same level of performance was achieved in terms of floor drift as the ODS (0.83%). Therefore, a structurally equivalent system to the OFS was attained to enable a comparison between them and observe the differences between CO2 emissions and energy consumption.
The three systems considered continuum sections, symmetric columns and beams for the framed systems (OFS and EFS) and proportionality in the length of the structural walls of the dual system. The Ecuadorean National Standards [19] were considered in this study to compute the optimum dimensions of the structural components per each structural system. The dead load of the whole structural system was 0.45 tonnes/m2 while the superimposed dead load of 0.22 tonnes/m2, which corresponded to permanent load (e.g. mezzanines and subfloors) and 0.08 tonnes/m2 for the roofs. Moreover, we considered the postulates of the NEC-15 [21] to include a live load of 0.20 tonnes/m2. Finally, the Yield stress (fy) of the steel, compressive resistance (f’c) of the concrete and allowable compressive strength of soil were assumed as 240 MPa, 28 MPa, and 18.34 tonnes/m2 respectively (Table 2).
Structural components such as stairs, vehicular ramp, retaining walls and roof slabs were the same in the three structural systems. The staircase consisted of roof slabs of thickness of 15 cm, tread of 25 cm and risers of 19 cm. The vehicular ramp had a slope of 12.5% constructed in a deck system with a thickness of 15 cm. The retaining walls varied in thickness across the three subsoils with 35 cm, 40 cm and 45 cm.
Roof slabs consisted of a two-way slab with a compressive layer of 5 cm, reinforced with structural joists of 10x20 cm and voided slabs made of merged concrete blocks of 40x40x20cm.
In general, a structure can be calculated using procedures for obtaining lateral forces, either static or dynamic. The dynamic response analysis, using the SRSS method for combining different dynamic responses, were based on the structural configuration, allowing the incorporation of torsional effects and vibration modes other than the fundamental. The seismic load was defined considering the seismic hazard of the structure's site based on the Ecuadorian standard [21]. The dynamic effects of seismic activity were modelled using a design response spectrum that considers a fraction of the structure's critical damping [21]. The seismic-resistant design of the three structural systems aims to prevent structural collapse during earthquakes, with the objective of safeguarding the lives of occupants. To achieve this design philosophy, all three systems were designed to have the capacity to resist seismic forces, maintain storey drifts below the allowable limit specified in Ecuadorean standards (2%) [21], and dissipate inelastic deformation energy (Table 3).
1.3. Structural design
Reinforce concrete elements sections and Steel-reinforcement were quantified using the [22] and [19] and the Load and Resistance Factor Design (LRFD) approach as it correlates the mechanical resistance of each component with the necessary resistance according to load combinations (Equation 1). The equation shows that Rn is the nominal resistance, is the resistance factor, is the resistance design and is the most unfavourable stress (Table 4).
It is worth clarifying that the three structural systems share a similar design in the foundation beams due to the presence of multiple basement levels, as these contribute to reducing seismic moments on the foundation due to the lateral confinement provided by the soil.
2.4 Life Cycle Assessment of the Structural Systems
The life cycle assessment entails the evaluation of all the carbon emissions during the different phases to construct a building. In this study, we conduct a life cycle assessment in the three structural systems described above, which are the OFS, ODS and EFS, to identify the system with the lowest carbon emission and energy consumption.
The most important environmental variable to evaluate the impact of human activities in nature is the emission of greenhouse gases (i,e. CO2 emissions) into the atmosphere. CO2 emissions in the construction industry are not only limited to the construction phase of the building but also to the manufacturing, production, transportation, and distribution processes of the construction materials. These stages were followed to agree with the PAS 2050:2011 [23] standard. A detailed view of the processes behind constructing a building is described in the process workflow (Figure 2).
2.4.1. Materials Quantification
Each of the three structural systems, comprising beams, columns, stairs, and other elements, has a direct impact on the total carbon emissions during the building's design, material provision and construction. In this study, the components of each structural system, such as walls, stairs, and slabs, were fabricated with materials such as concrete, rebar steel, and wood (Table 5). In addition to the concrete elements, other sources of carbon emissions include excavation, soil disposal, and activities related to backfill material in foundations (Table 6).
2.4.2. Emission and energy consumption factors per material
The CO2 emission factors (in tonnes of CO2 per material unit) and energy consumption factors (in MJ per material unit) quantify the pollutants released during the fabrication of building materials, such as ready-mixed concrete or wooden formwork, and their impact on the environment. The assessment of these factors considered all stages involved in the fabrication of a building material, including the extraction of raw materials from the quarry and their transportation [24]. The EF and CF data for the calculation of gas emission and consumption factors were obtained from various sources (Table 7) [25,26,27].
2.4.3 Emission and consumption Factors in Machinery and Equipment
The construction industry relies heavily on machinery and instruments for various processes involved in building construction, such as materials transportation, soil compaction, and excavation. Most of the machinery used in construction runs on fossil fuels and electricity, which makes them significant sources of CO2 emissions. The fuel efficiency of machinery was measured in litres of fuel per hour (Table 8) [9,28].
Sources of CO2 emissions were classified based on their use in building construction, such as transportation of equipment (e.g., trucks), construction machinery (e.g., concrete mixer machine), and electric instruments (e.g., electric circular saw) [10,29] (Table 8 and Table 9).
It is noteworthy that the contribution of CO2 emissions from electric instruments is much lower than those produced by fossil fuels (approximately eight times lower than fossil fuels) [10]. The gas emission factor of diesel machinery () was calculated by multiplying the fuel efficiency of machinery () (Table 8 and Table 9) with the gas emission factor of diesel () (Table 10) (Equation 2). The machinery consumption factor () was calculated by multiplying the fuel efficiency of machinery (Table 8 and Table 9) with the diesel consumption factor (, refer to Table 10) (Equation 3). The resulting factors are presented in Table 11.
2.4.4 Materials transportation
Material transportation (Table 12) involves the movement of construction materials from the distribution depot to the building site [9]. In this study, the transportation analysis was conducted for ready-mixed concrete, steel reinforcement bars, and wooden formwork. Additionally, the transportation of waste from the building site to the construction material ºwaste disposal site was also considered. The total distance travelled by the materials was computed by multiplying the number of trips (Equation 4) by the distance travelled.
2.4.5 Assessment of CO2 Emissions and Energy Consumption per Activity
CO2 emissions and energy consumption were evaluated from the fabrication of materials stage to the construction of the building (Figure 2). To evaluate the emission factor (EF) and consumption factor (CF) of each activity, we propose a new methodology that considers the inputs of the sources of pollution, such as machinery, materials, and transport to convert the units of the different polluting sources into a single activity work unit (Equations 5 and 6).
The calculation of total emissions and energy consumption is based on the multiplication of the FE and CF per activity by the total number of activities performed, respectively (Equations 7 and 8, Table 13).
3. Results
3.1. Overall Results
The evaluation of CO2 emissions showed that the EFS system produced the highest emissions compared to the OFS and ODS systems. The emissions in the EFS system were approximately 39% higher (around 480 tonnes) than the emissions in the OFS and ODS systems (Figure 3). Between the OFS and ODS systems, the emissions of CO2 in the ODS system were approximately 5% higher (around 43 tonnes) than in the OFS system (Figure 3). Energy consumption (Figure 3) showed a similar trend in comparison with the EFS, OFS, and ODS systems, with the highest consumption in the EFS system at around 58% (around 6 million MJ) higher than in the OFS and ODS systems. Similar to CO2 emissions, the ODS system consumed slightly more energy (around 6%) than the OFS system.
3.2. A detailed Description of Results Per Building Stage
The life cycle assessment showed that the EFS system had the highest CO2 emissions and energy consumption compared with the OFS and ODS systems (Section 3.1). The assessment considered the stages of material fabrication, transportation, and building construction, with the fabrication stage accounting for the largest CO2 emissions and energy consumption (Figure 4). The differences in CO2 emissions and energy consumption between the OFS and ODS systems were insignificant across stages, except for the fabrication stage where the ODS system had 5% higher emissions and consumption than the OFS system (Figure 4). When comparing the OFS and ODS systems with the EFS system, the fabrication stage accounted for over 40% of the total CO2 emissions and energy consumption.
3.3 Influence of the Material on the Emission of CO2 and Energy Consumption
The influence of materials on the emission of CO2 and energy consumption considers the impact of ready-mixed concrete, steel rebar reinforcement, wooden formwork, and soil-related activities in the three structural systems (OFS, ODS, and EFS). Results showed that ready-mixed concrete and steel rebar reinforcement are the main contributors to CO2 emissions and energy consumption, accounting for more than 50% and 40% of overall emissions, respectively (Figure 5). Wooden formwork and soil removal activities have a relatively small impact, contributing to less than 1% and 5% of emissions, respectively. Notably, in the EFS system, steel rebar reinforcement and ready-mixed concrete have similar CO2 emissions, with steel rebar reinforcement emissions being slightly higher (around 0.5%) than ready-mixed concrete emissions (Figure 5). In contrast, in the OFS and ODS systems, ready-mixed concrete was the main source of CO2 emissions, accounting for more than 27% more emissions than steel rebar reinforcement. Based on the overall contribution of materials to CO2 emissions and energy consumption, the structural systems can be ranked from highest to lowest environmental impact as EFS, ODS, and OFS.
3.4 Environmental Impact of the Structural Elements Used in Each Structural System
The structural elements that contribute the most to CO2 emissions and energy consumption in the OFS and ODS systems are the foundation, beams and slabs (Figure 6). In the OFS system, foundation beams account for around 22% of the total CO2 emissions and 22.7% of the total energy consumption. In the ODS system, these figures increase to approximately 26.4% and 26.3%, respectively. In the EFS system, foundation beams contribute to around 16% of the total CO2 emissions and 17% of the total energy consumption (Figure 6 and Figure 7). Notably, in the EFS system, columns and beams, rather than foundation beams, are the main sources of CO2 emissions and energy consumption, which are roughly two times higher than those produced by foundation beams. This difference in results is due to the modifications made to the columns and beams in the EFS system to reduce drift and achieve a similar structural response to the ODS system, allowing for a better assessment of the impact of materials and energy on the EFS system's environmental impact.
Further analysis of the components of the structural elements in terms of the materials used showed that steel reinforcement in columns (maximum reinforcement ratio elements) accounts for approximately 64% and 54% of CO2 emissions and energy consumption, respectively, in all three structural systems. In contrast, ready-mixed concrete is the main source of emissions in minimum reinforcement ratio elements, such as slabs, contributing to around 58% and 68% of CO2 emissions and energy consumption, respectively (Figure 6 and Figure 7). Therefore, steel is the primary source of emissions in maximum reinforcement ratio elements, while ready-mixed concrete is the main source in minimum reinforcement ratio elements.
4 Discussion
The design and construction of buildings is a complex process that requires consideration of various technical factors, including mechanical resistance, environmental impact, and sustainability [9,10,32,33]. While traditional building design in developing countries has focused primarily on structural design, it has largely neglected environmental factors such as emissions of CO2 and energy consumption[34,35]. This led to buildings that are likely to be environmentally inefficient. The study discussed in this article is the first of its kind in Ecuador, comparing the carbon footprint of different structural systems (OFS and ODS) with an equivalent structure (EFS). The results of this study provide evidence of how structural decision made into the design of building structures, could incurred in higher or lower levels of pollution; focusing on the context of developing country with a high seismic risk.
There is a notable impact of the materials utilized on CO2 emissions and energy consumption within the construction industry. The use of different materials such as concrete, steel, and wood can have different environmental impacts. For instance, concrete has a high carbon footprint due to the production of cement, which is one of the major contributors to CO2 emissions. In contrast, wood has a lower carbon footprint due to its renewable nature and the ability to store carbon. In addition to the type of material, the origin of the material also plays a role in the emission of CO2 and energy consumption. Materials that are sourced locally have a lower carbon footprint compared to materials that are transported from distant locations. This is because the transportation of materials consumes energy and emits CO2, adding to the overall environmental impact of the building. Furthermore, the durability and maintenance requirements of the materials used can also impact the emission of CO2 and energy consumption. Materials that require frequent maintenance and replacement can have a higher environmental impact compared to materials that are durable and require less maintenance. Research by Resch et al. (2020) [36] found that transportation of materials significantly contributes to CO2 emissions in building construction, averaging around 6%. Overall, the choice of materials used in construction can have a significant impact on the emission of CO2 and energy consumption. Sustainable and eco-friendly materials, sourced locally and with low maintenance requirements, can reduce the environmental impact of the building.
The life cycle assessment conducted for each structural system (Figure 3) indicated that the OFS system had the lowest CO2 emissions and energy consumption among the three alternatives. However, the earthquake-resistant performance of the OFS system is unsatisfactory, as it shows a story drift of 1.75%, which may be deemed excessively high. This drift has recently been associated with non-structural damage, resulting in numerous deaths in recent earthquakes [20]. The ODS system demonstrated the best balance between environmental impact and structural behaviour. While CO2 emissions and energy consumption were slightly higher than those of the OFS system by 5% and 6%, respectively, the ODS system's short drift (0.82%), which less than half the storey drift generated in the OFS, it substantially reduced the impact of earthquakes on the building's non-structural components, preventing deaths from these causes. Therefore, the ODS system is the most suitable alternative that offers both environmental efficiency and earthquake-resistant performance.
There is a direct relationship between the need to create more rigid structures to mitigate the effects of seismic forces and pollution levels. In this sense, the EFS is a clear example of an ill-advised way to generate a rigid structure, as it incurs in high levels of pollution. A similar finding was reported in a life cycle assessment of buildings in Atlanta, USA, where energy consumption and CO2 emissions increased in more complex, heavier and rigid structures compared to lighter structures [9]. Therefore, it is necessary to seek a balanced approach to forming a rigid structure with low pollution levels, as achieved with the ODS. Regardless of the chosen structural system (EFS, OFS, and ODS), the maximum CO2 emissions and energy consumption (about 90%) were recorded during the materials fabrication stage. This can be attributed to industrial processes involved in material fabrication, such as steel melting and heat treatment, or cement clinker production. Previous studies examining the environmental impact of steel and concrete used in residential [33] and commercial buildings in Singapore [37] reported similar findings. It is worth noting that the location of the building has a significant impact on the materials fabrication stage. For instance, countries in the Circum-Pacific belt, known for their high seismic activity, require more robust structural systems, which requires more concrete, and steel, leading to higher CO2 emissions and energy consumption during fabrication compared to areas with lower seismic activity such as the East Coast of the United States.
The production of concrete and steel, which are the primary materials used in each structural component that provides mechanical resistance, contributes significantly to carbon emissions and energy consumption. In the OFS and ODS systems, the major contributor to CO2 emissions and energy consumption was the ready-mixed concrete. However, in the EFS system, despite the abundance of ready-mixed concrete, most of the emissions and consumption were caused by steel. This outcome can be attributed to the fabrication process of steel, which involves several heating processes, including melting and heat treatments, resulting in significant pollutant emissions [38]. In contrast, fabrication of ready-mixed concrete requires only one heating process [39]. Moreover, the EFS system has large, robust structural elements that require substantial amounts of steel, altering the weight ratio between steel and ready-mixed concrete. The ratio is higher in the EFS than in the OFS and ODS systems, making steel reinforcement the primary contributor to CO2 emissions.
Another notable difference between the optimised systems (OFS and ODS) and the EFS was the environmental impact of the structural elements. In the OFS and ODS systems, foundation beams and slabs accounted for the majority of emissions and energy consumption, while in the EFS, beams and columns were the main contributors of pollutants into the environment. This discrepancy could be explained by the balanced number of structural elements in the optimised systems, which resulted in no significant differences in emissions between them. However, in the EFS system, CO2 emissions and energy consumption of beams and columns were at least ten times higher than those of other structural elements (eg. slabs). This highlights the fact that the EFS system requires more columns and beam elements (approximately 419% more columns and 190% more beams) to achieve a similar storey drift compared to the ODS system, which has a similar structural response with fewer columns and beams.
This study examined the structural behaviour of three different systems and their impact on the environment. In developing countries, there is limited information available on how the structural system of buildings affects the environment, with most studies focusing on architectural design or the type of material used [11,12,14]. By incorporating environmental considerations into the design of structures, we offer a new methodology for creating sustainable buildings that significantly reduce the carbon footprint compared to traditional design approaches. Furthermore, we also assessed the structural behaviour of these systems, with a focus on storey drift as the primary structural variable. The ODS system, which combines the benefits of lower CO2 emissions and lower storey drift, underscores the significance of storey drift in the structural response of the system and its environmental impact. This system offers the advantage of combining the low CO2 emissions and energy consumption of the OFS system with the mechanical strength of the EFS system.
As the field of environmental impact assessment for buildings in Ecuador is still in its infancy and our study is the first to integrate earthquake-resistant design and environmental impact analysis, there is limited information available on the factors that contribute to CO2 emissions and energy consumption during the construction process. To overcome this limitation, we relied on published databases to quantify the environmental impact of structural elements and materials in each of the three structural systems [25,26,27]. Furthermore, a more comprehensive life cycle assessment that takes into account the role of building occupants will provide additional insights into the environmental impact of new constructions.

Table 14.
compares the results obtained in the different stages of the life cycle, as can be seen in each of the different studies in scope, some cover more stages, others less. However, in most studies [8,9,40] the results (maximum and minimum) are within the same order of magnitude, except for Suzuki's study et al., 1995 [33] conducted in Japan.
| Author | Location | Embodied carbon of concrete structures [tonnes of CO2 eq.] |
||
|---|---|---|---|---|
| Manufacture phase |
Transportation phase |
Construction phase |
||
| Moussavi & Akbarnezhad, 2015 | USA | 548-847 | 37-58 | 50-66 |
| Suzuki et al., 1995 | Japan | 2232-3034 | - | - |
| Cole, 1998 | Canada | - | 33 | 29 |
| Kua & Wong, 2012 | Singapore | 871 | - | - |
| This study | Ecuador | 796-1313 | 7-11 | 40-43 |
5 Conclusion
This study compared three structural systems—EFS, OFS, and ODS—and evaluated their environmental impact in terms of CO2 emissions and energy consumption. Results showed that concrete and reinforcing steel fabrication contributed to a greater proportion of carbon emissions and required substantial energy. Ready-mixed concrete was the primary contributor to the OFS and ODS systems, while steel dominated in the EFS system.
In terms of emissions and energy consumption distribution within each system, foundation beams and slabs were significant in the OFS and ODS systems, while beams and columns played a major role in the EFS system. This disparity can be attributed to the balanced number of structural elements in the optimized systems, where emissions and energy consumption of beams and columns in the EFS system exceeded the others by at least ten times.
The study also found that the ODS system that CO2 emissions were related to a lower storey drift, highlighting the importance of storey drift in the structural response and environmental impact. It emphasized the need for a new methodology to design sustainable structures that consider the carbon footprint and reduce environmental impact.
Overall, the study emphasizes the importance of considering environmental impact in the design and construction of building structures to minimize negative effects. As the first study in Ecuador to quantify and consider environmental impact when designing new buildings, it highlights that approximately 90% of overall CO2 emissions and energy consumption occur during materials fabrication. To reduce the environmental impact of construction materials, new guidelines for more efficient production should be implemented. The study suggests the ODS system as the best option in designing new buildings in Quito, Ecuador, considering mechanical performance during earthquakes and identified CO2 emissions and energy consumption. The ODS system highlights the potential to achieve buildings with highly efficient structural performance and reduced environmental impacts.
Author Contributions
Bohórquez, A: Conceptualisation, Writing draft, Data collection, Analysis of Results, Definition of methodology. Viteri, E: Conceptualisation, Writing draft, Data collection, Analysis of Results, Definition of methodology. Rivera, E. D: Conceptualisation, Writing review and editing, Supervision. Ávila, C: Conceptualisation, Writing review and editing, Supervision, Analysis of Results, Definition of methodology. All authors have read and agreed to the published version of the manuscript.
Funding
This research received no external funding
Data Availability Statement
The data that support the findings of this study are available from the corresponding author CA, upon reasonable request.
Conflicts of Interest
The authors declare no conflicts of interest.
References
- Kim S, Moon JH, Shin Y, Kim GH, Seo DS. Life comparative analysis of energy consumption and CO2 emissions of different building structural frame types. The Scientific World Journal 2013;2013:1–5. [CrossRef]
- Ritchie H, Roser M, Rosado P. CO₂ and Greenhouse Gas Emissions. Our World in Data 2020.
- Architecture 2030. Why The Building Sector? n.d. https://architecture2030.org/why-the-building-sector/ (accessed September 23, 2022).
- Google, Ellen MacArthur Foundation. Accelerating The Circular Economy Through Commercial Deconstruction And Reuse 2019;1st:1–23.
- Anink D, Boonstra C, Mak J, Morris A. Handbook of Sustainable Building: An Environmental Preference Method for Selection of Materials for Use in Construction and Refurbishment. Undefined 1996.
- Harmouche N, Ammouri A, Srour I, Chehab G, Hamade R. Developing a carbon footprint calculator for construction buildings. Construction Research Congress 2012: Construction Challenges in a Flat World, Proceedings of the 2012 Construction Research Congress 2012:1689–99. [CrossRef]
- Galatowitsch SM. Carbon Offsets as Ecological Restorations. Restor Ecol 2009;17:563–70. [CrossRef]
- Cole RJ. Energy and greenhouse gas emissions associated with the construction of alternative structural systems. Build Environ 1998;34:335–48. [CrossRef]
- Moussavi Nadoushani ZS, Akbarnezhad A. Effects of structural system on the life cycle carbon footprint of buildings. Energy Build 2015;102:337–46. [CrossRef]
- Paik I, Na S. Comparison of Carbon Dioxide Emissions of the Ordinary Reinforced Concrete Slab and the Voided Slab System During the Construction Phase: A Case Study of a Residential Building in South Korea. Sustainability 2019, Vol 11, Page 3571 2019;11:3587. [CrossRef]
- Güereca LP. Evaluación de la Huella de Carbono con enfoque de Análisis de Ciclo de Vida para 12 Sistemas Constructivos REPORTE FINAL (versión 2.0 que incluye correcciones de block cerámico) 2016.
- Casaverde R. Cuantificación De Co2 Generado Por El Consumo Energético En La Construcción De Viviendas Unifamiliares – SATIPO. Universidad Nacional Del Centro Del Perú, 2016.
- Vázquez Calle KG. Análisis del inventario del ciclo de vida en la determinación de la energía contenida y las emisiones de CO2 en el proceso de fabricación del hormigón premezclado; caso de estudio: planta premezcladora de la ciudad Cuenca. Universidad de Cuenca, 2016.
- Narváez ENR, Maldonado L. Propuesta de disminución de huella de carbono para construcción de edificaciones. Caso de estudio: Edificio de Ciencias Básicas de la Universidad Técnica de Ambato, Ecuador. Universidad Técnica de Ambato 2022:1–14.
- Segovia M, Alvarado A. Geologia y geofisica marina y terrestre del Ecuador : desde la costa continental hasta las Islas Galapagos. Geología y Geofísica Marina y Terrestre Del Ecuador Desde Las Costa Continental Hasta Las Islas Galápagos 2009;1:131–49.
- Chicaiza M. Modelo de exposición y mapa de vulnerabilidad del Distrito Metropolitano de Quito. Escuela Politécnica Nacional, 2017.
- Valverde J, Fernández J, Jiménez E, Vaca T, Alarcón F. Microzonificación sísmica de los suelos del Distrito Metropolitano de la Ciudad de Quito. Escuela Politécnica Nacional, 2002.
- ASCE. Minimum Design Loads for Buildings and Other Structures. ASCE/SEI 7-16; 2017.
- MIDUVI. Norma Ecuatoriana de la Construcción: Estructuras de Hormigón Armado. Quito: 2015.
- Páez D. Influencia de muros de mampostería en el comportamiento de edificios de Manta durante el terremoto de 16 de abril del 2016 , Pedernales- Ecuador. Proceedings of the “Third Annual State-of-the-Art in Civil Engineering Structures and Materials” 26th – 28th July 2017, Universidad Central Del Ecuador and Universidad de Las Fuerzas Armadas – ESPE, Quito, Ecuador 2017:0–15.
- MIDUVI. Norma Ecuatoriana de la Construcción: Peligro Sísmico, Diseño Sismo Resistente. 2015.
- ACI Committee 318. Building Requirements for Structural Concrete and Commentary. Vol. 1 (20. Farmington Hills: American Concrete Institute; 2019.
- PAS 2050. Specification for the assessment of the life cycle greenhouse gas emissions of goods and services. British Standards Institution; 2011.
- Moussavi Nadoushani ZS, Akbarnezhad A. Effects of structural system on the life cycle carbon footprint of buildings. Energy Build 2015;2:337–46. [CrossRef]
- Cal Mouriño A. El ciclo de vida de la madera en la construcción: análisis de un caso práctico. Universidad de la Coruña, 2017.
- Hammond G, Jones C. Inventory of Carbon amd Energy (ICE). Bath: University of Bath - Sustainable Energy Research Team; 2019.
- Lawson B. Building materials energy and enviroment: Towards ecologically sustainable development. Manukau: The Royal Australian Institute of Architects; 1996.
- Cámara Colombiana de la Infraestructura. Informes de Maquinaria. 2010.
- Electricaplicada. Potencia de equipos eléctricos más comunes n.d.
- EP PETROECUADOR. Memoria de Sostenibilidad. Quito: 2019.
- Comisión Técnica de determinación de Factores de Emisión de Gases de efecto ivernadero - CTFE. Factor De Emisión De Co2 Del Sistema Nacional Interconectado De Ecuador. Quito: Informe 2019; 2019.
- Seo MS, Kim T, Hong G, Kim H. On-Site Measurements of CO2 Emissions during the Construction Phase of a Building Complex. Energies 2016, Vol 9, Page 599 2016;9:599. [CrossRef]
- Suzuki M, Oka T, Okada K. The estimation of energy consumption and CO2 emission due to housing construction in Japan. Energy Build 1995;22:165–9. [CrossRef]
- Berrón Ferrer G. Importancia de incorporar conceptos ambientales en el diseño y construcción de obras civiles. Artículo de Divulgación Berrón G / Ingeniería 2003;7:52.
- Domínguez R, León M, Samaniego J, Sunkel O, Sánchez J. Desarrollo Sostenible Recursos naturales, medio ambiente y sostenibilidad 70 años de pensamiento de la CEPAL. 1948.
- Resch E, Lausselet C, Brattebø H, Andresen I. An analytical method for evaluating and visualizing embodied carbon emissions of buildings. Build Environ 2020;168:106476. [CrossRef]
- Kua HW, Wong CL. Analysing the life cycle greenhouse gas emission and energy consumption of a multi-storied commercial building in Singapore from an extended system boundary perspective. Energy Build 2012;51:6–14. [CrossRef]
- Pavlović A, Donchev T, Petkova D, Staletović N. Sustainability of alternative reinforcement for concrete structures: Life cycle assessment of basalt FRP bars. Constr Build Mater 2022;334:127424. [CrossRef]
- Medina Romero L. Análisis de la viabilidad económica y ambiental del uso de armaduras corrugadas de acero inoxidable en elementos de hormigón armado sometidos a clases de exposición agresivas. Aplicación a elementos en contacto con aguas residuales agresivas. Universidad Politécnica de Cataluña, 2006.
- Kua HW, Wong CL. Analysing the life cycle greenhouse gas emission and energy consumption of a multi-storied commercial building in Singapore from an extended system boundary perspective. Energy Build 2012;51:6–14. [CrossRef]
Figure 1.
Structural configuration of the three systems (a) OFS, (b) ODS and (c) EFS.
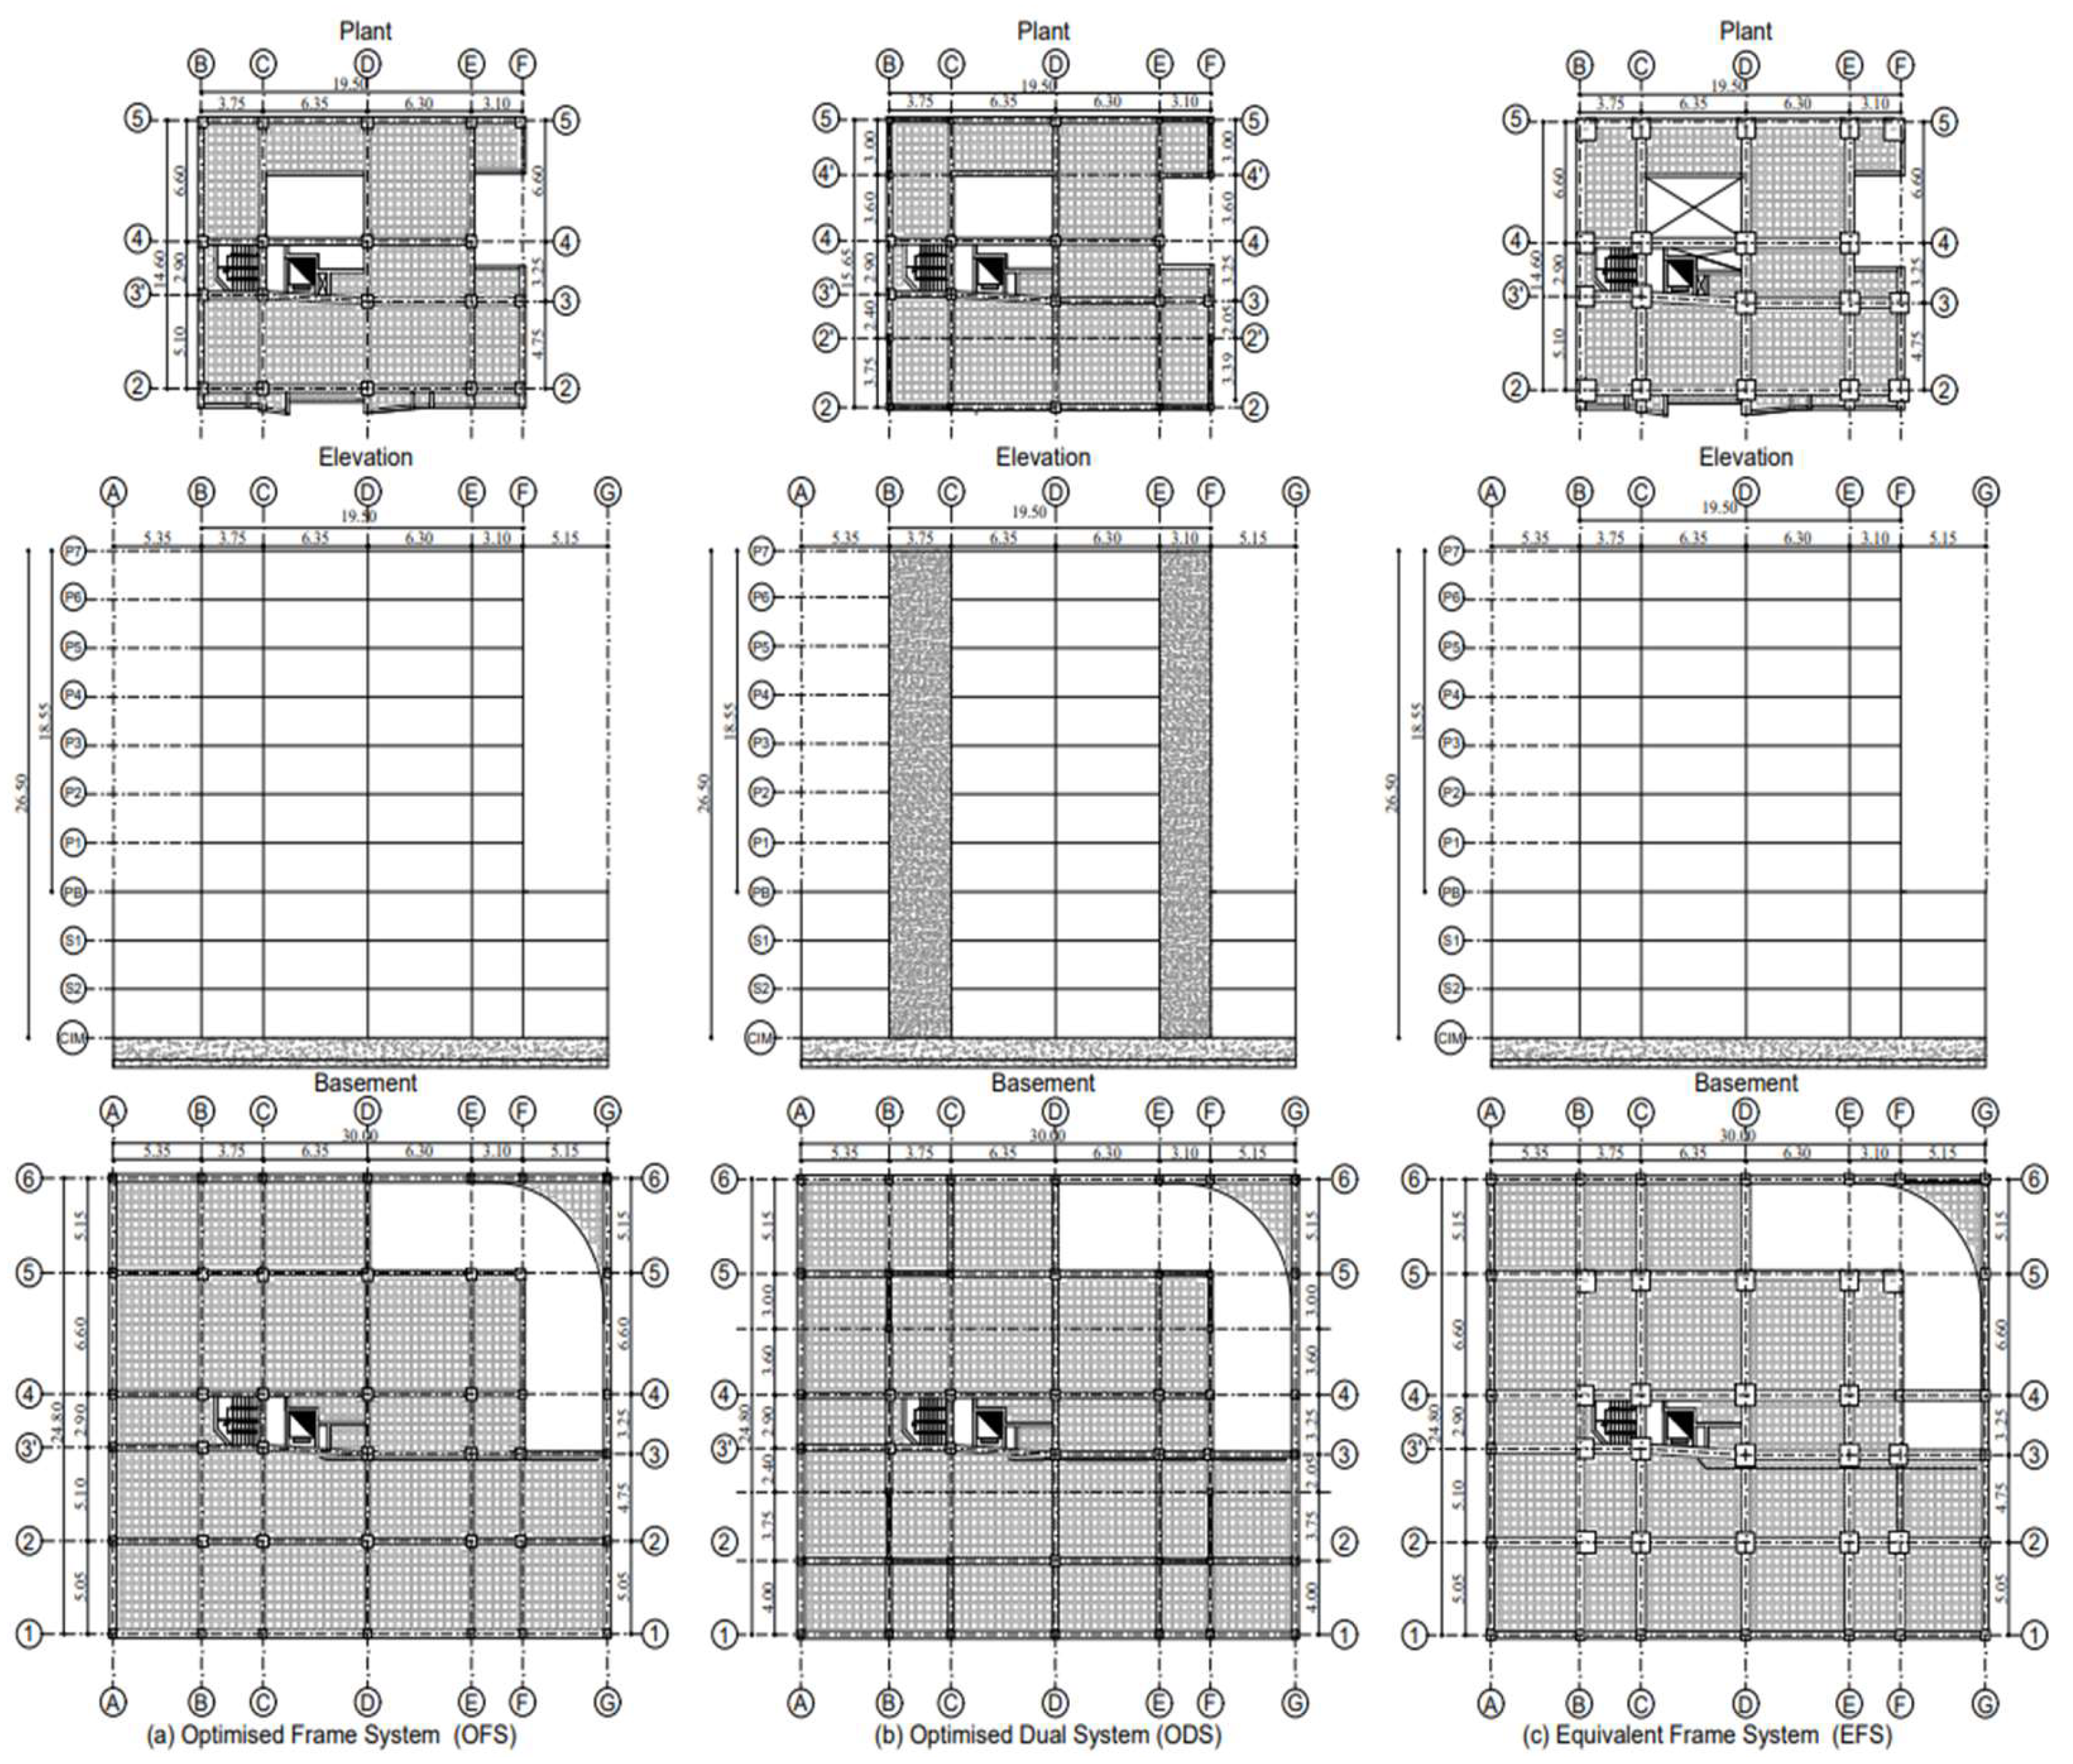
Figure 2.
Work Breakdown Structure of the Optimised Frame System.
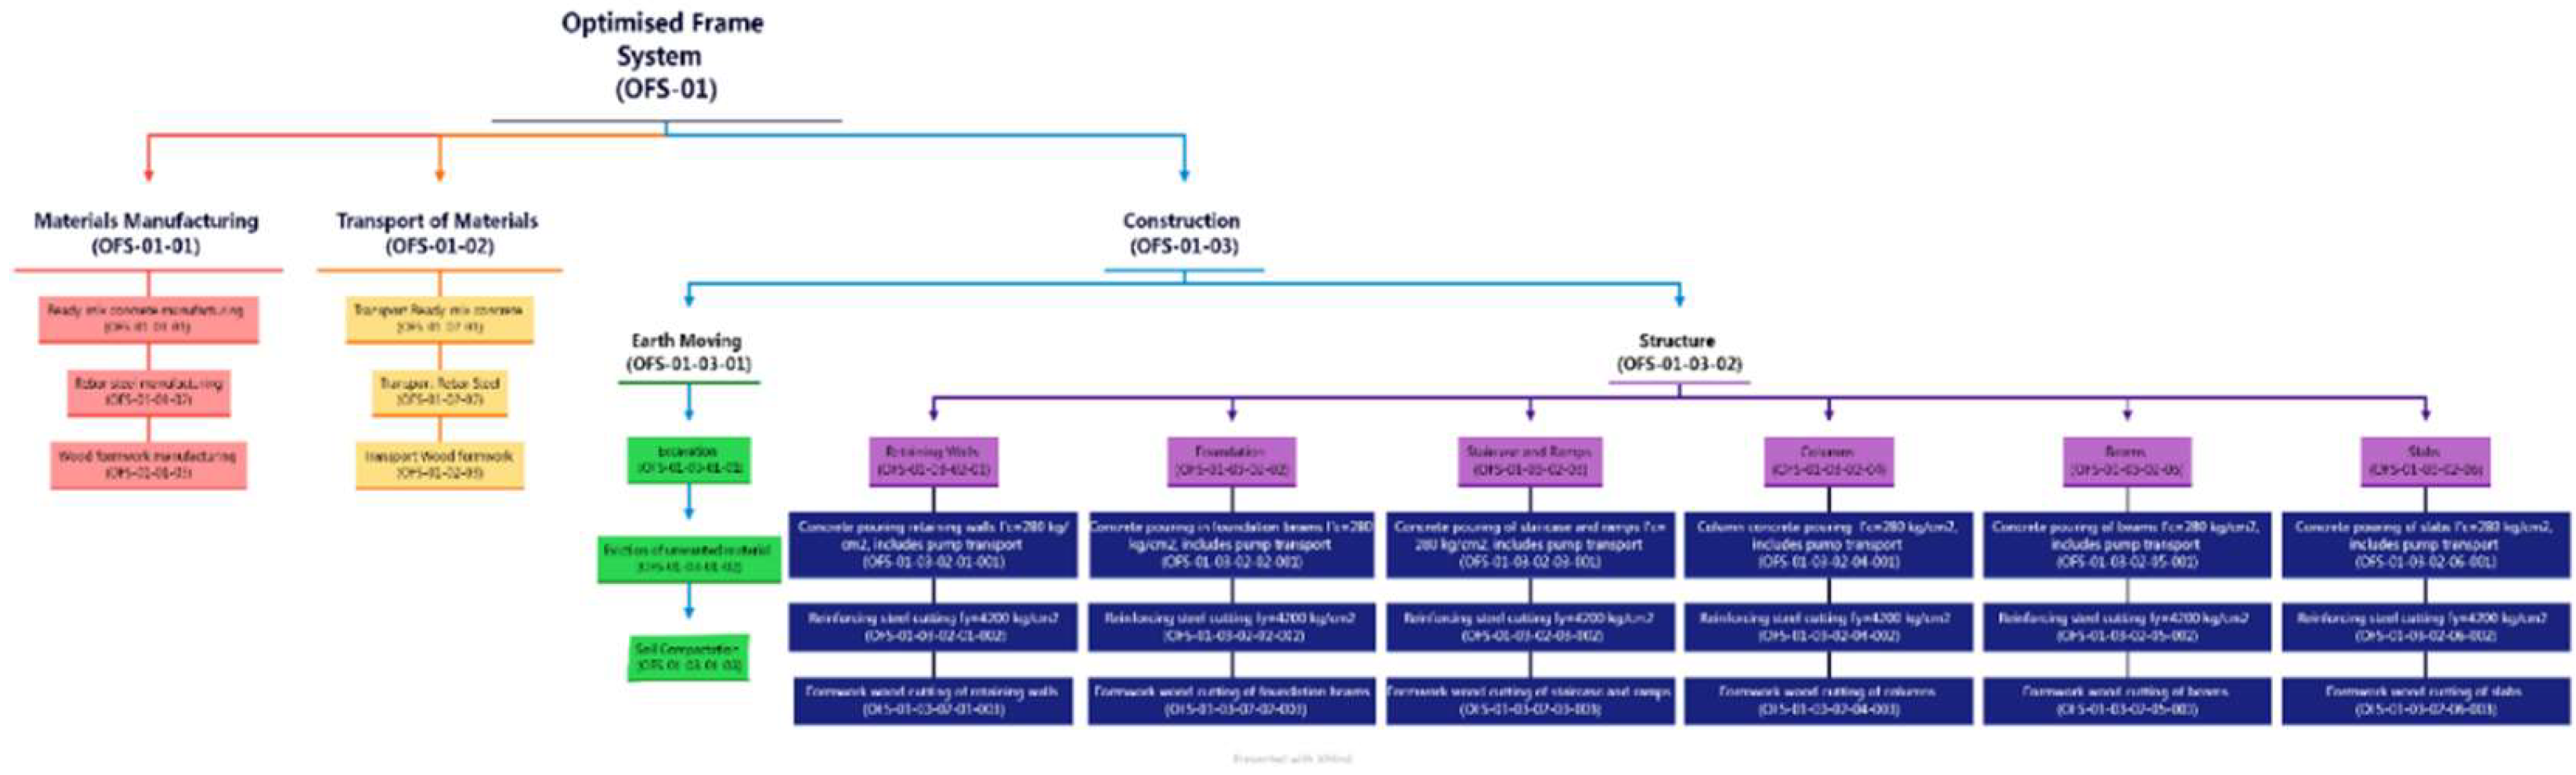
Figure 3.
CO2 emission and energy consumption per structural system.
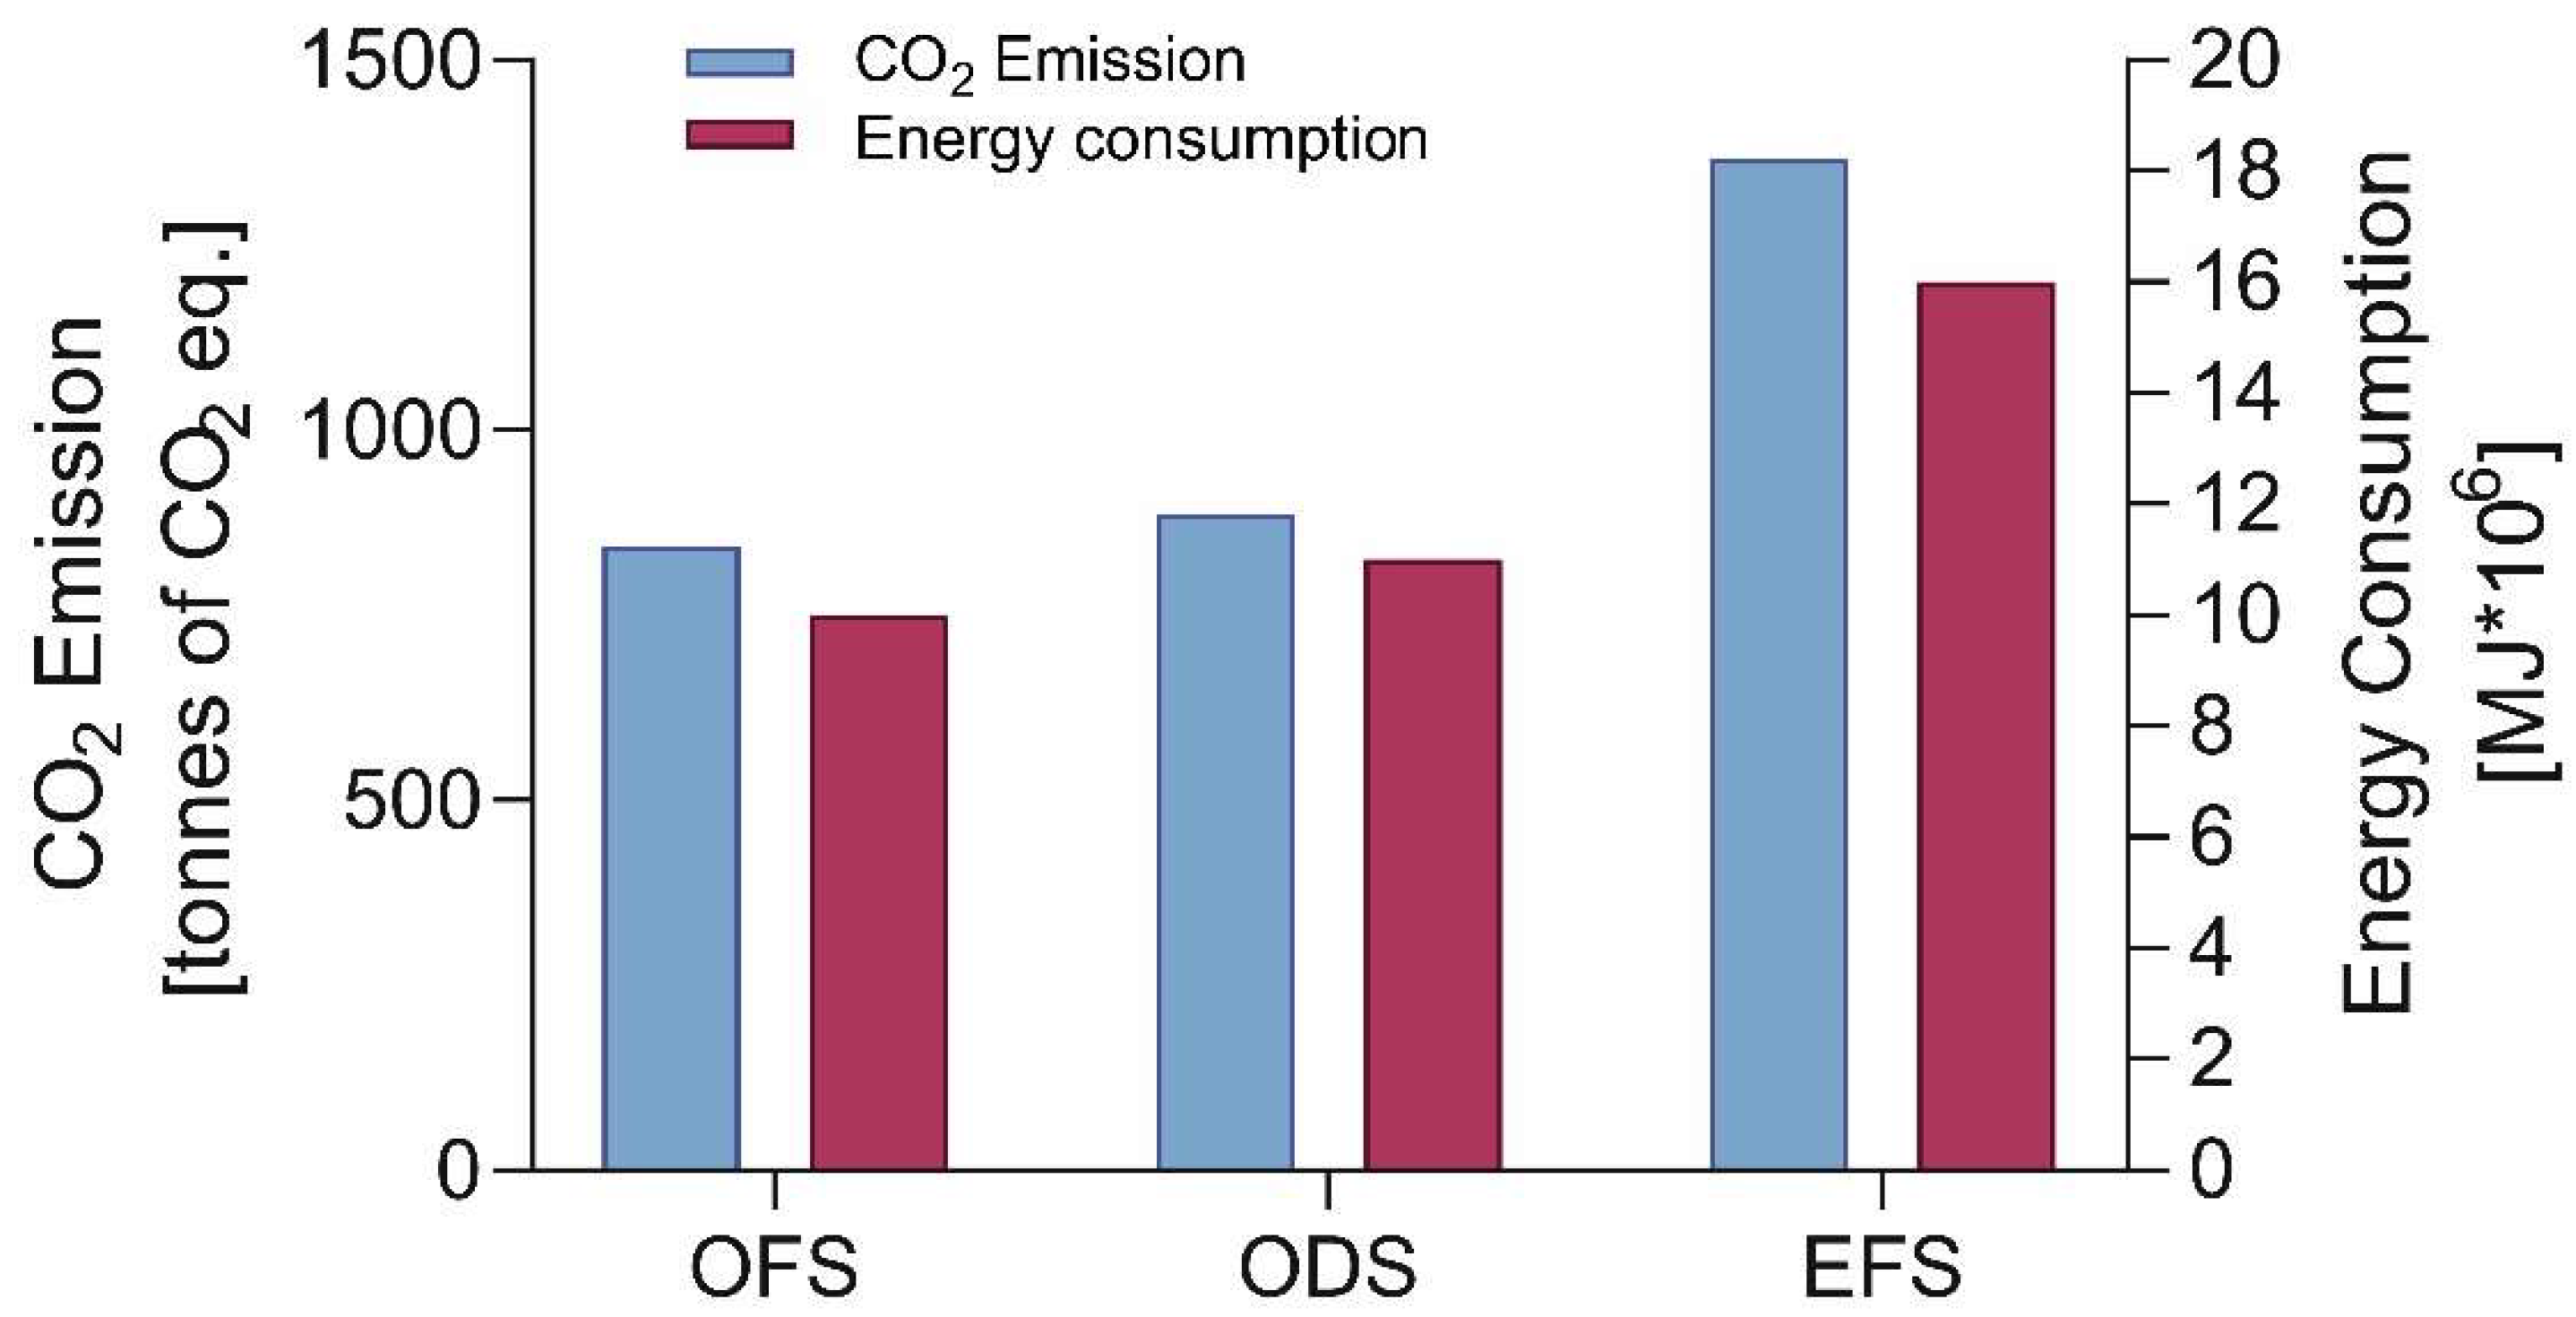
Figure 4.
(a) CO2 emission per activity in each structural system and (b) Total energy consumption per activity in each structural system.
Figure 4.
(a) CO2 emission per activity in each structural system and (b) Total energy consumption per activity in each structural system.
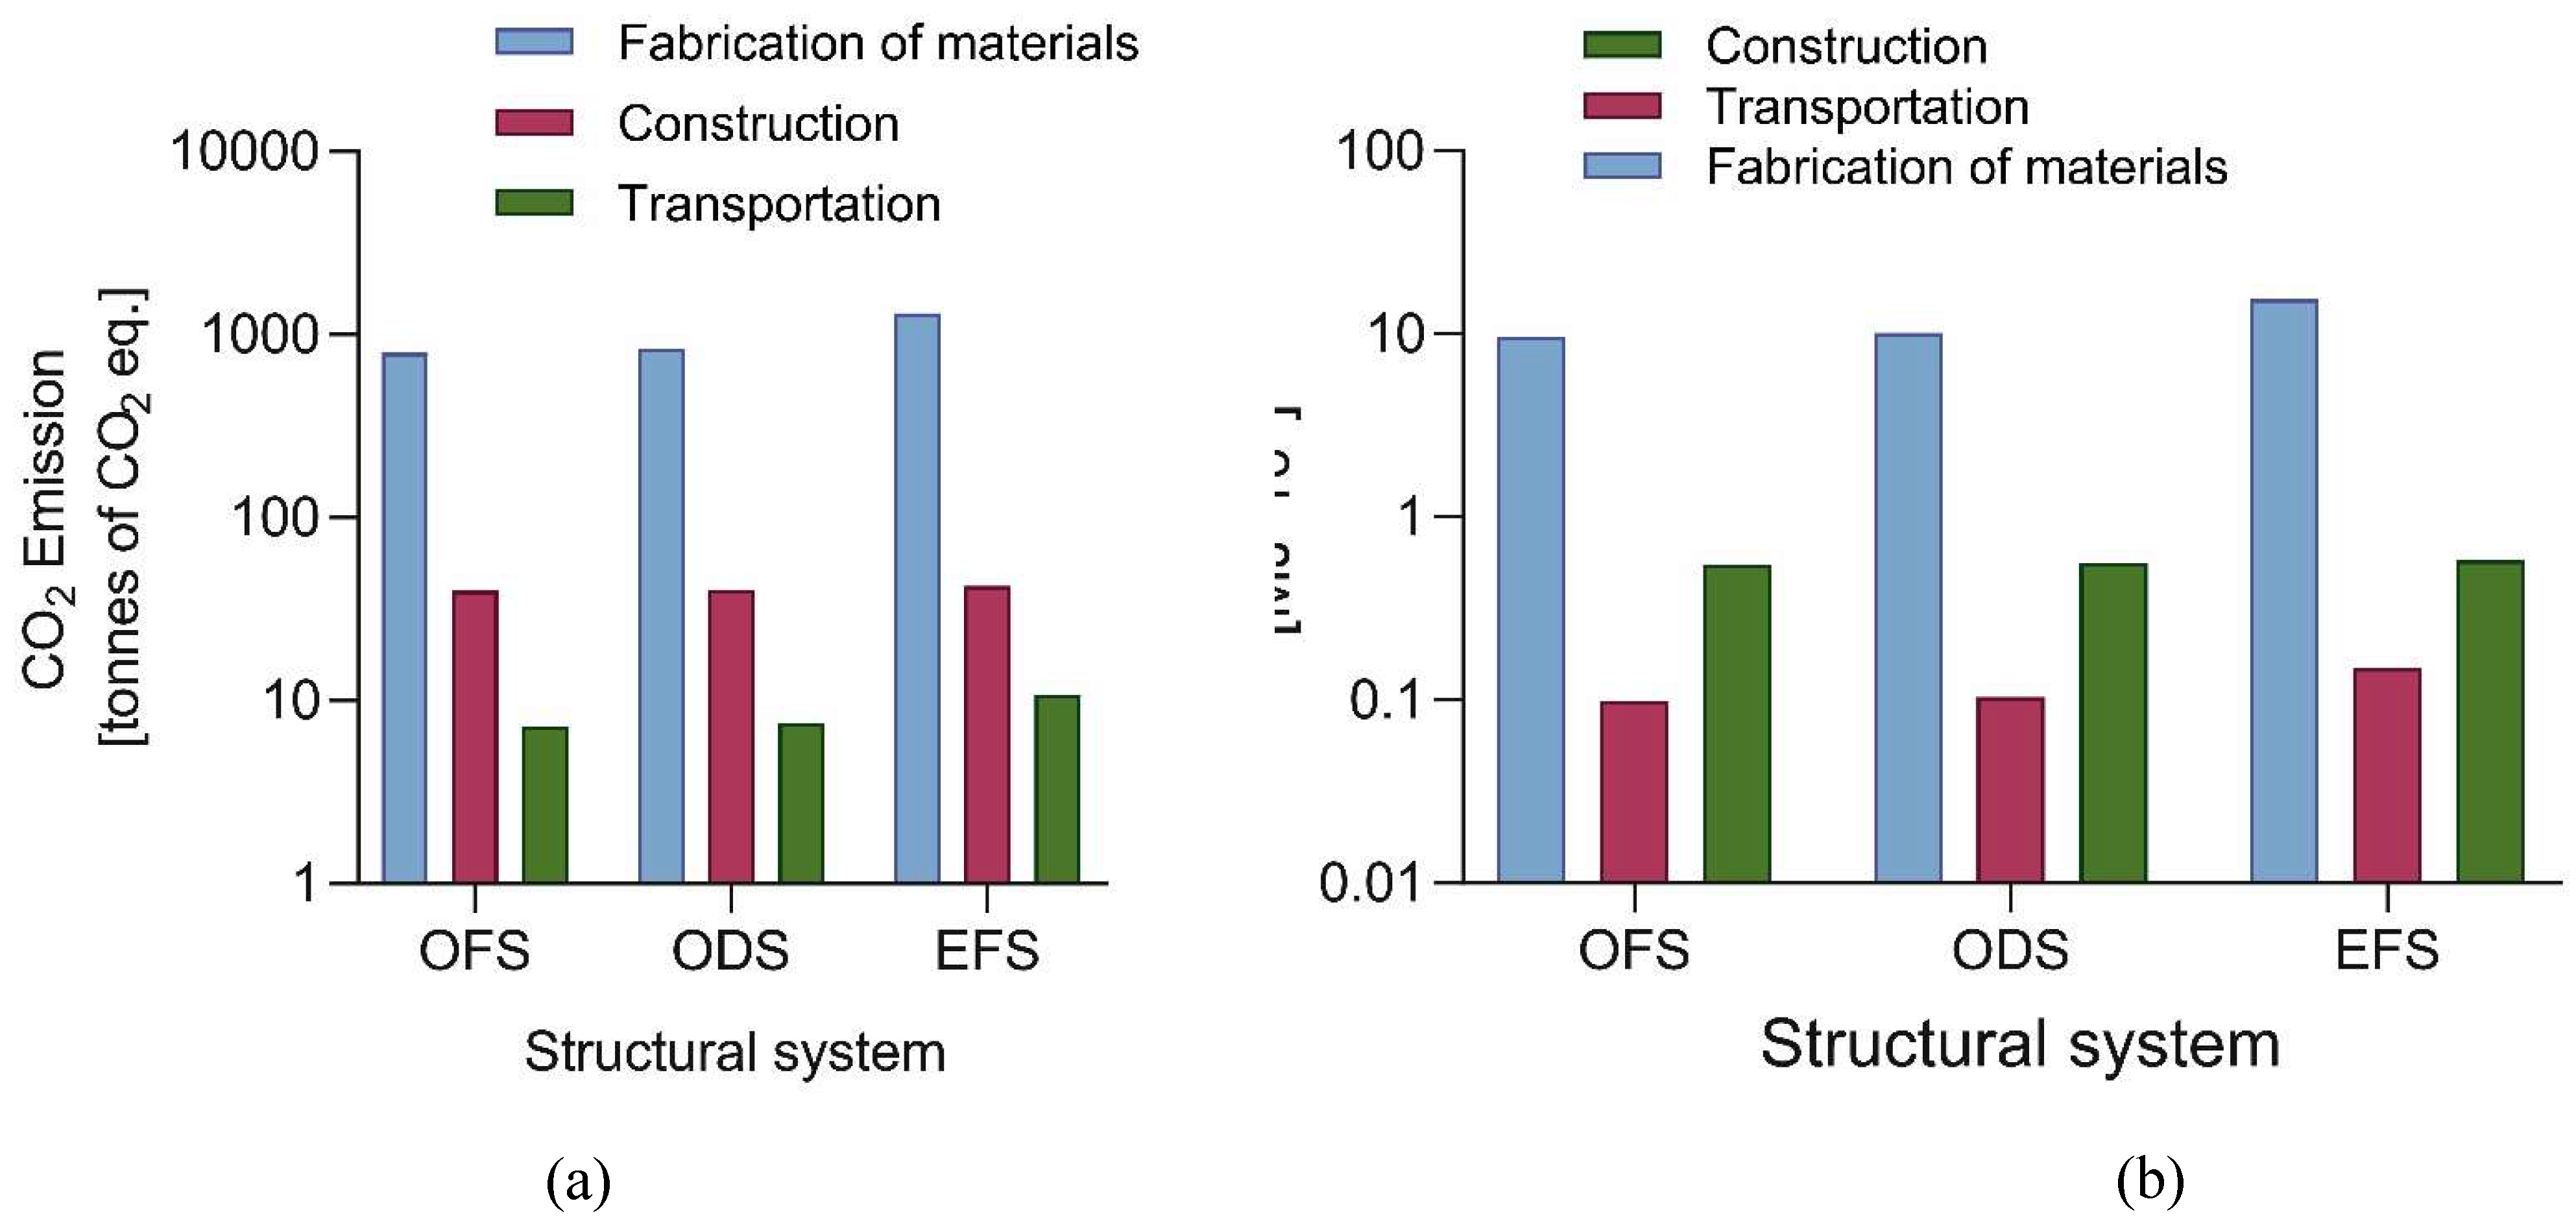
Figure 5.
(a) CO2 emission per material and (b) total energy consumption per material.
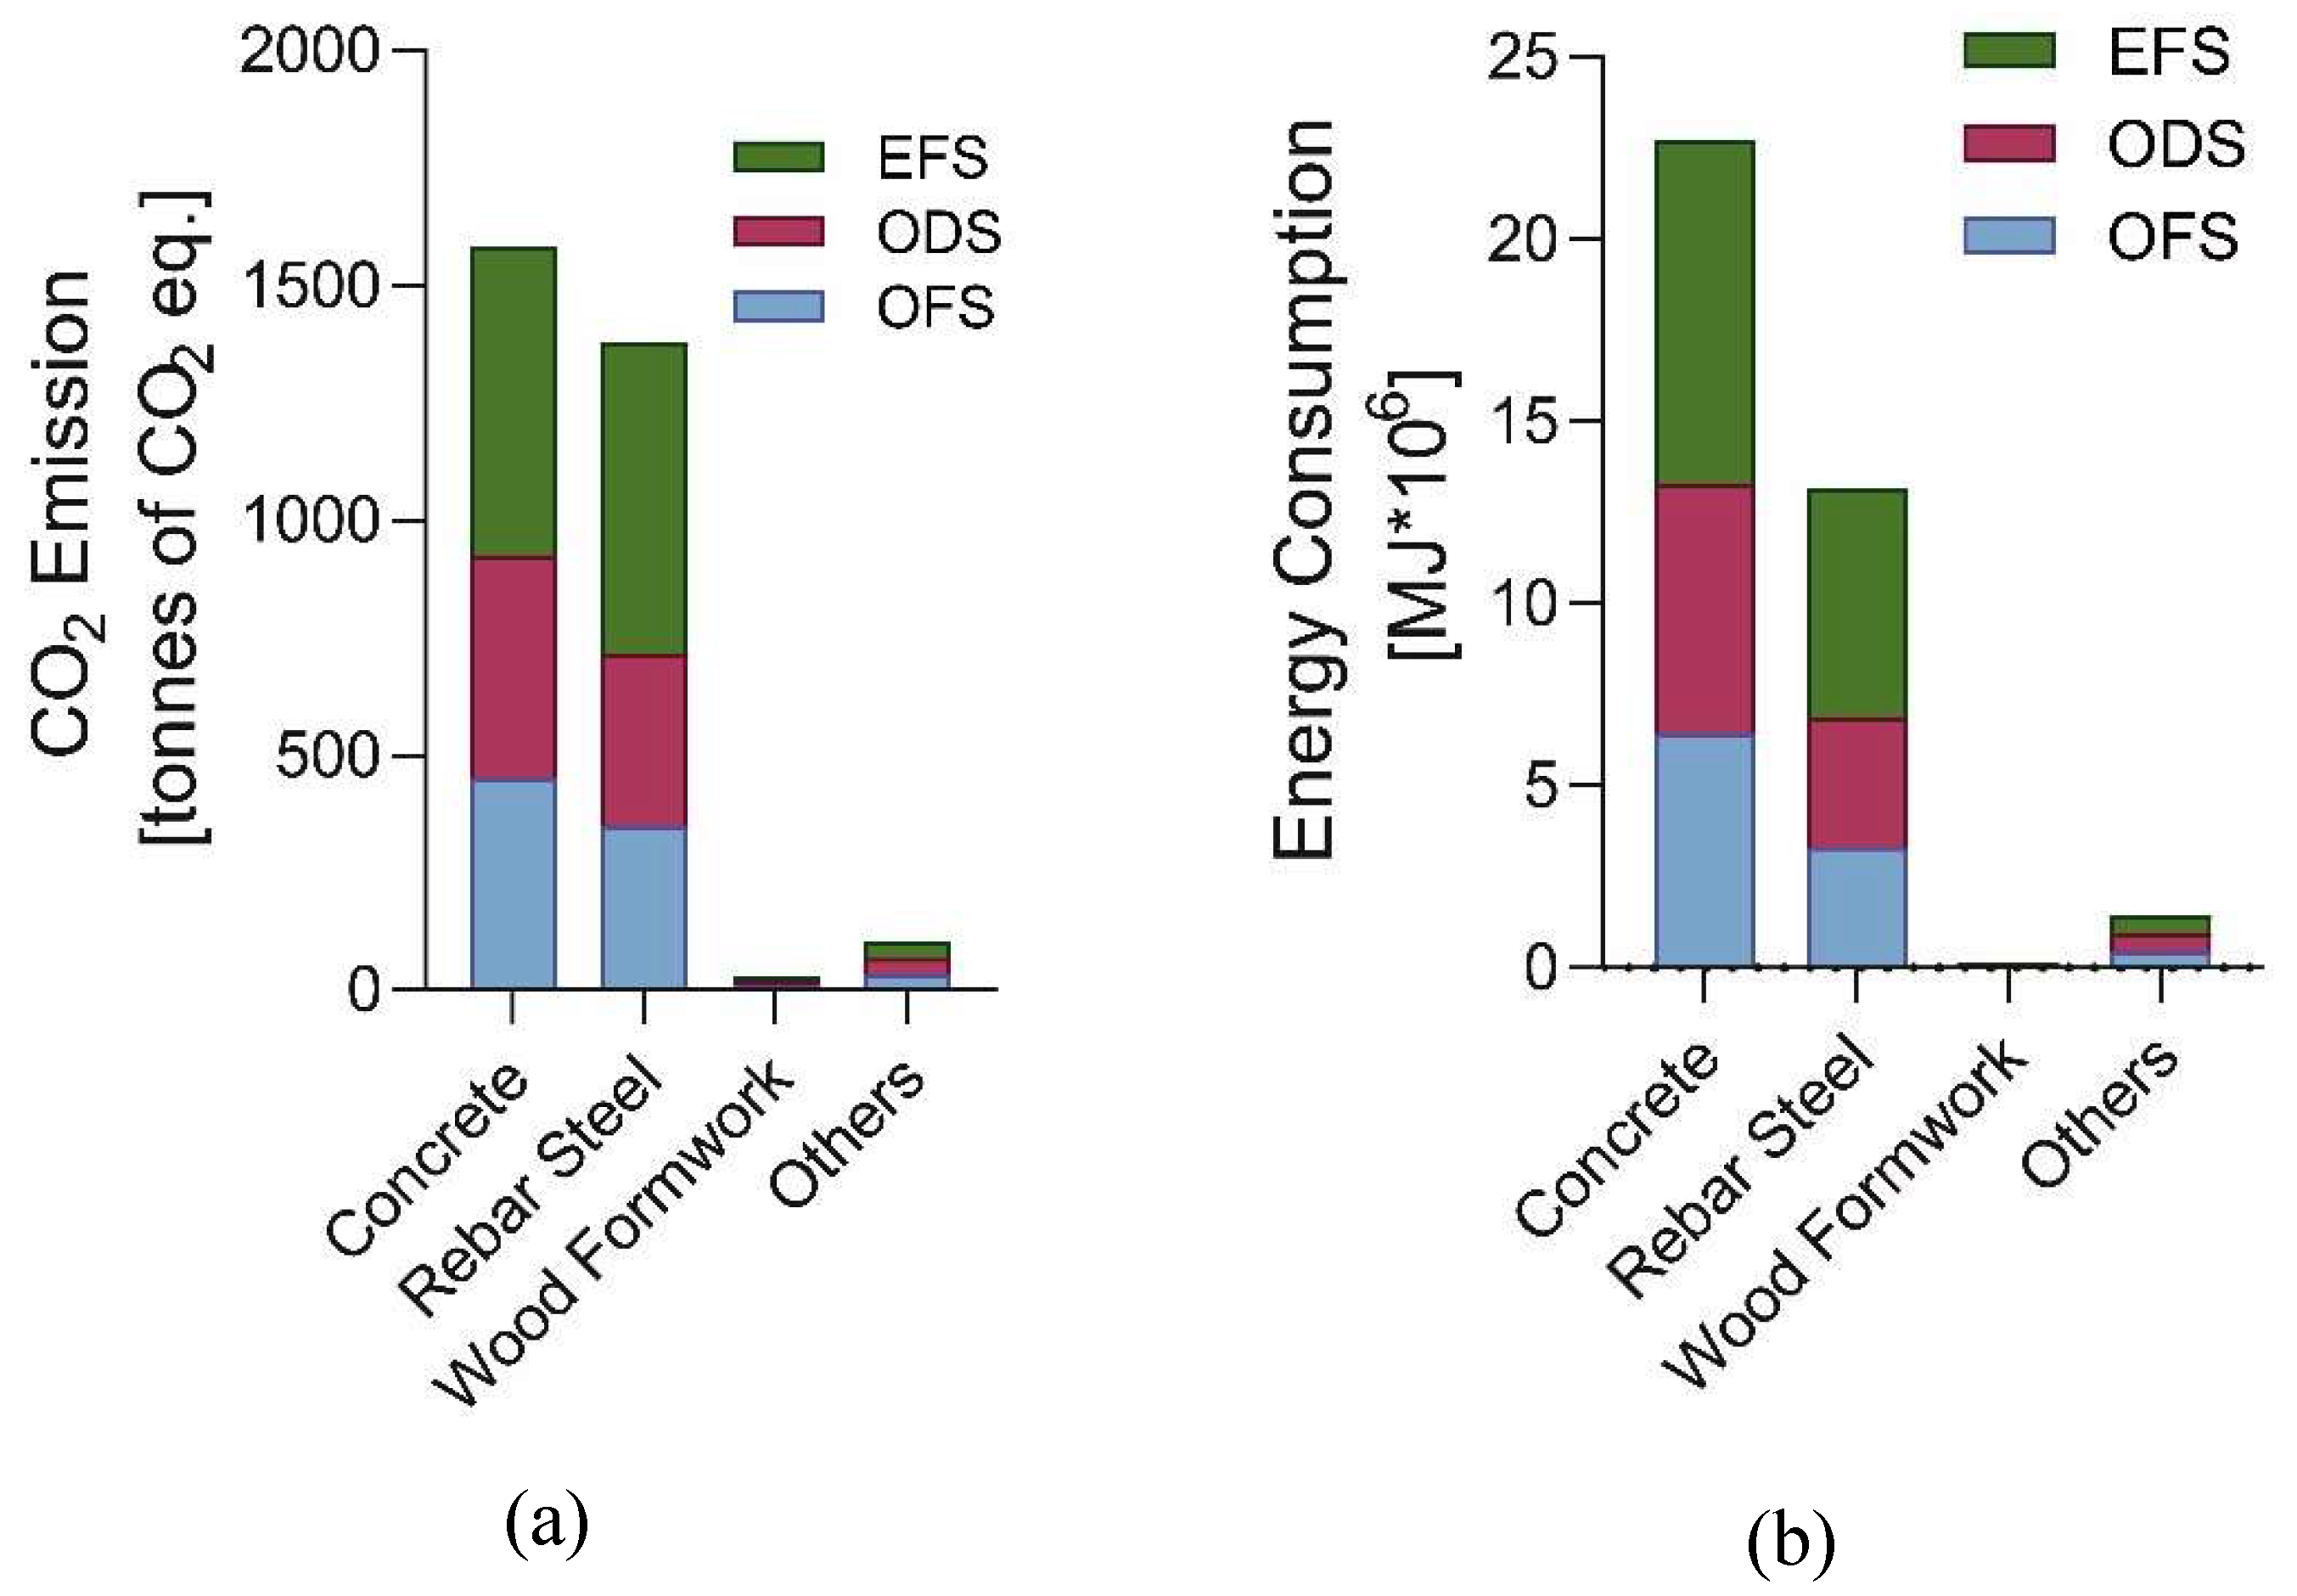
Figure 6.
(a) CO2 emission per structural element and (b) Total energy consumption per structural element.
Figure 6.
(a) CO2 emission per structural element and (b) Total energy consumption per structural element.
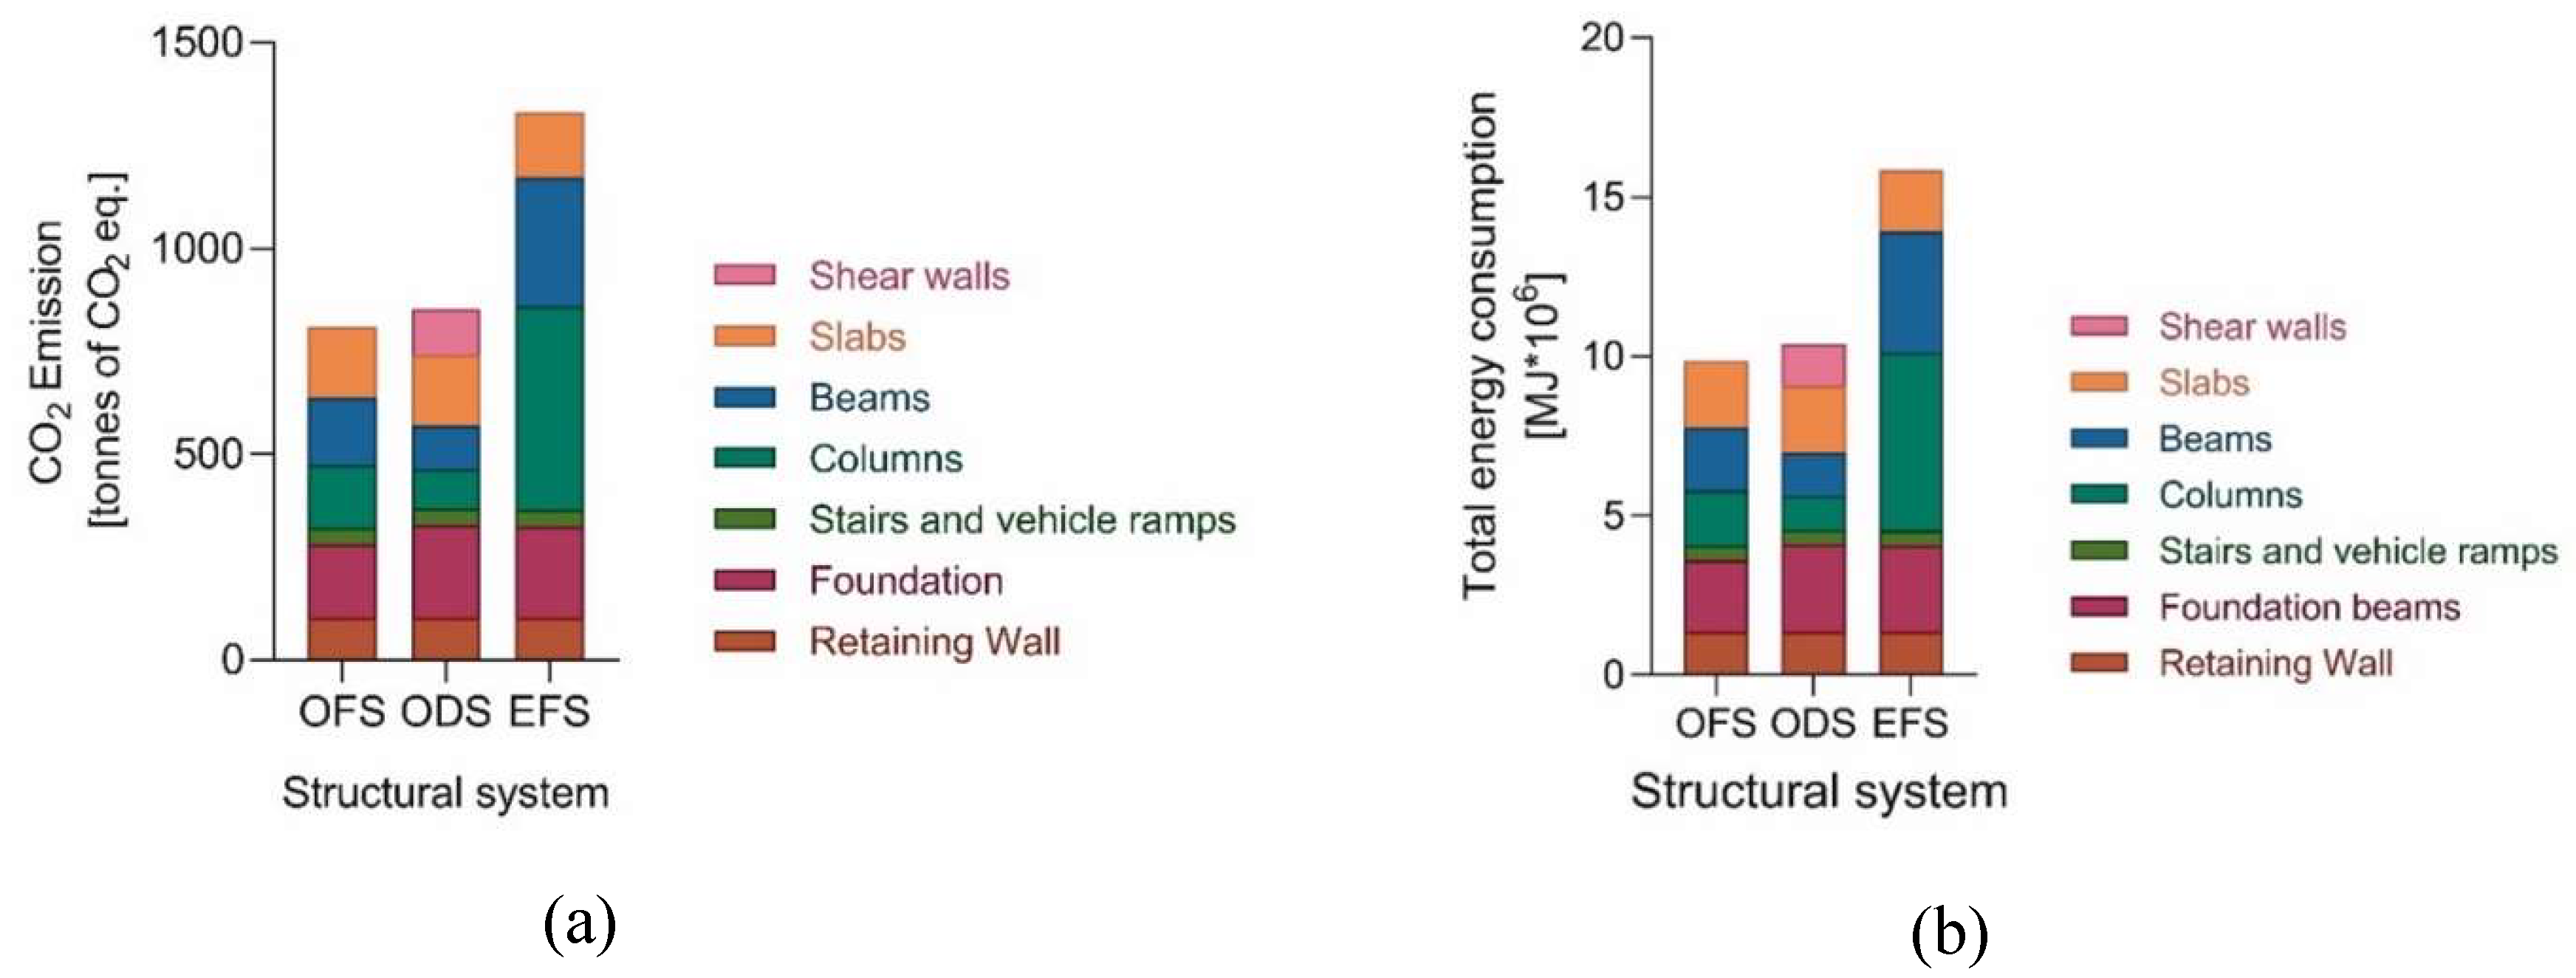
Figure 7.
(a) CO2 emission in structural system and material by columns and (b) Total energy consumption in structural system and material by columns.
Figure 7.
(a) CO2 emission in structural system and material by columns and (b) Total energy consumption in structural system and material by columns.
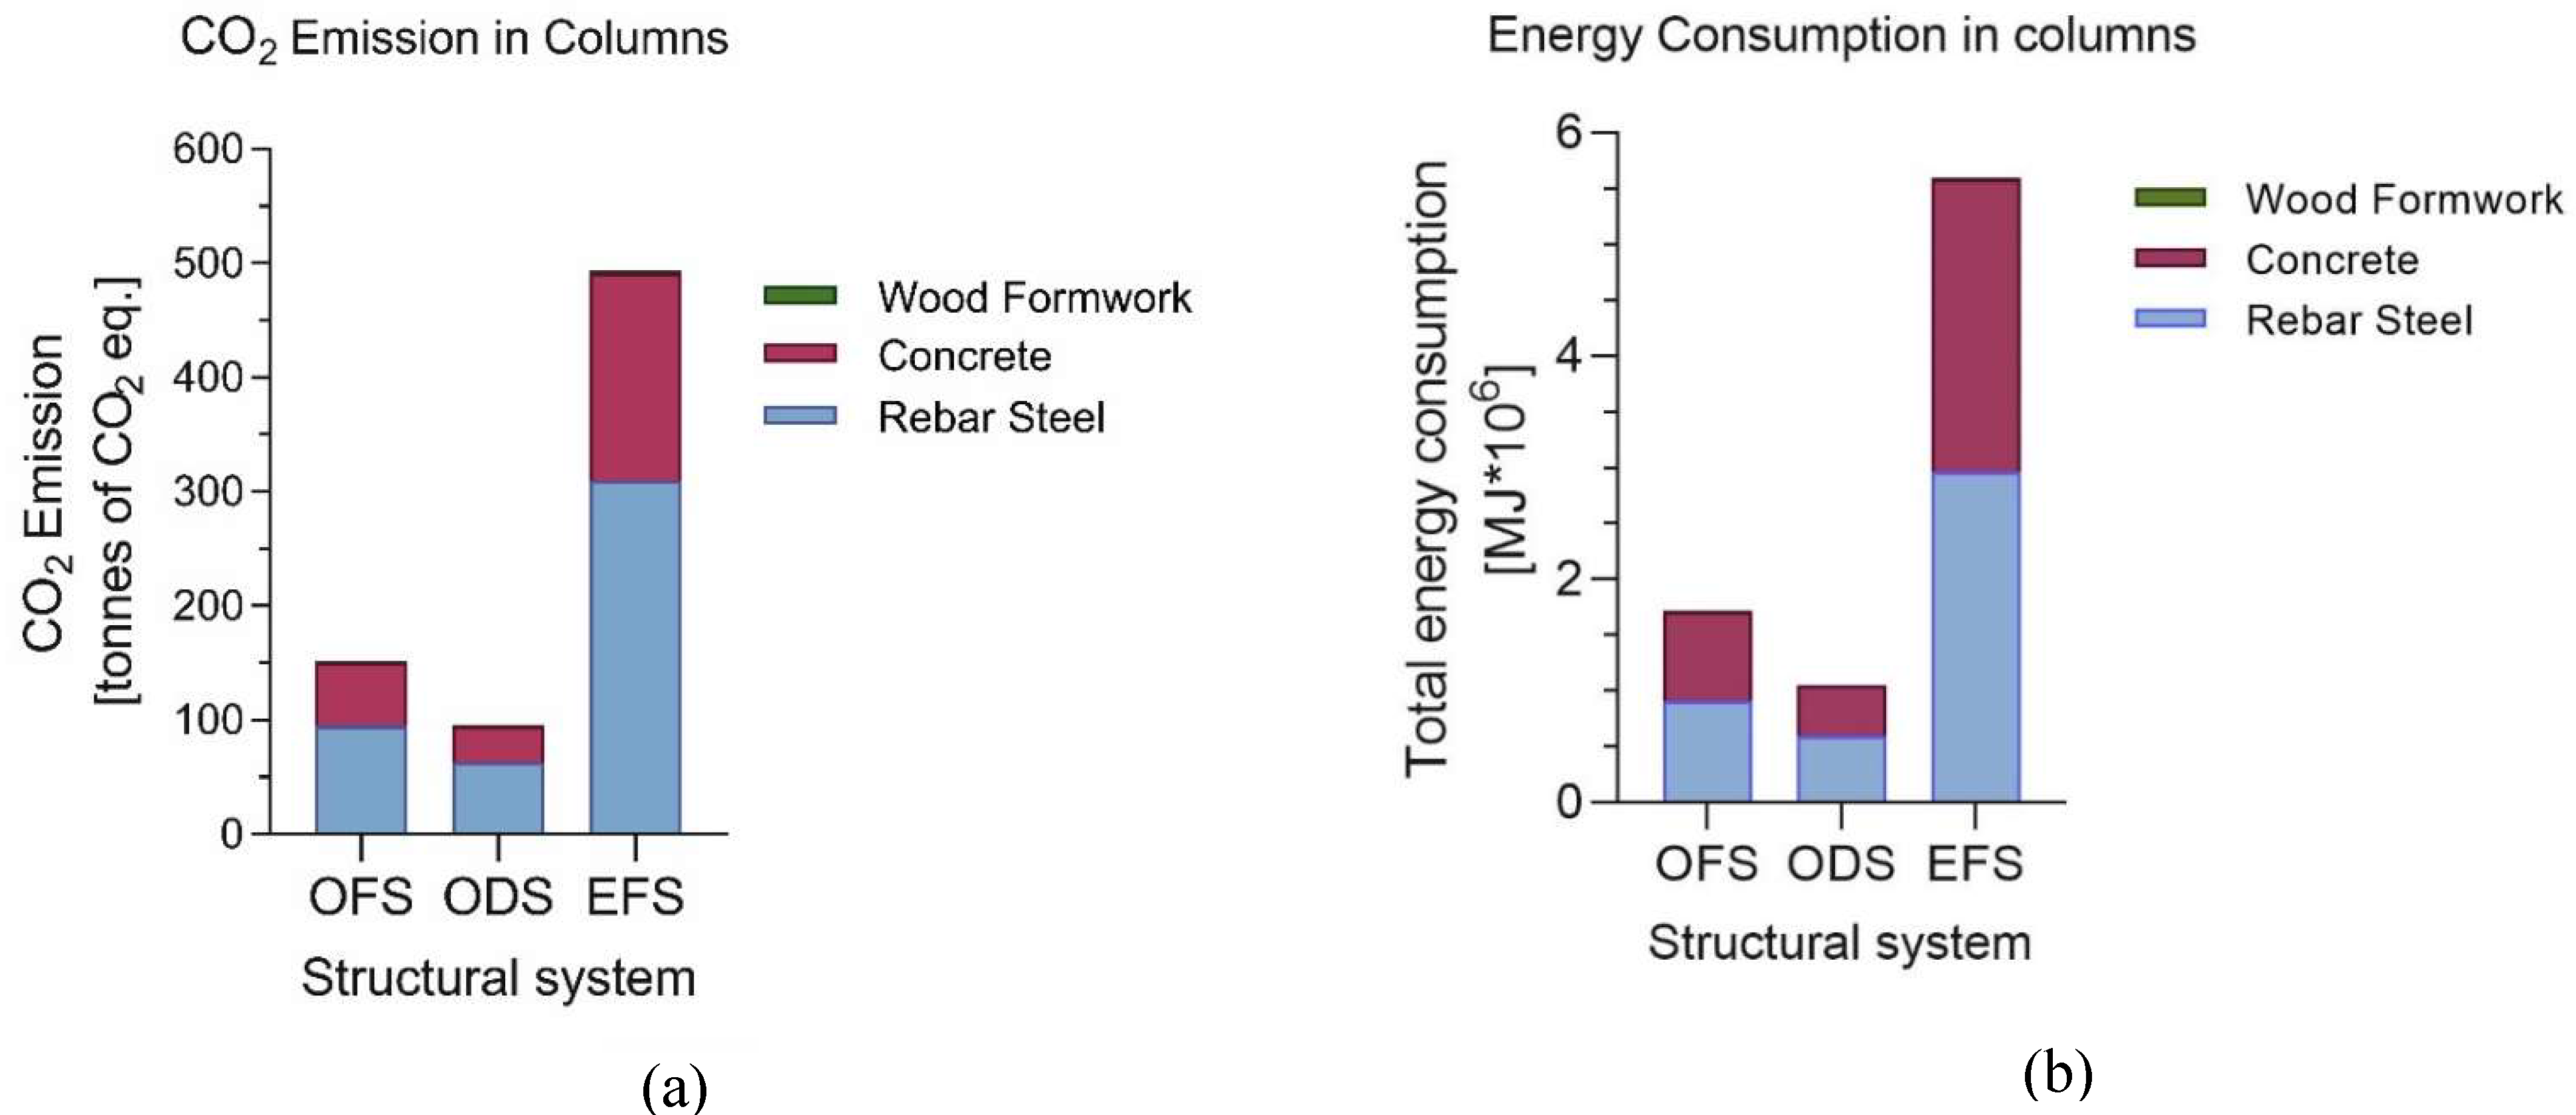
Table 1.
Dimensions and location of the case building study
| Parameter | Unit | Magnitude |
|---|---|---|
| Latitude | ° | -0.178332 |
| Longitude | ° | -78.436299 |
| Number of floors | u | 7 |
| Number of basements | u | 3 |
| Height without basements | m | 18.55 |
| Total height (including basements) | m | 26.50 |
| Floor area | m2 | 255.43 |
| Total floor area | m2 | 4150.1 |
| Bearing capacity | tonnes/m2 | 18.34 |
Table 2.
Detail of service loads and mechanical properties of materials.
| Description | Magnitude | Units | |
|---|---|---|---|
| Self-weight of slab | 0.45 | tonnes/m² | |
| Permanent mezzanine loads | 0.22 | tonnes/m² | |
| Permanent roof load | 0.08 | tonnes/m² | |
| Total dead load of mezzanine | 0.67 | tonnes/m² | |
| Total dead load of roof | 0.53 | tonnes/m² | |
| Live load | 0.2 | tonnes/m² | |
| Yield stress of reinforcing steel (fy) | 420 | MPa | |
| Compressive strength of concrete (f'c) | 28 | MPa | |
| Allowable compressive strength of soil | 18.34 | tonnes/m² | |
Table 3.
structural variables per system.
| System | Material | Period | Vibration modes | Reactive weight [tonnes] | Base shear [tonnes] | Max storey drift in X [%] | ||||
|---|---|---|---|---|---|---|---|---|---|---|
| ETABS [s] | NEC-15 [s] | 1st in X | 2nd in Y | 3rd in RZ | ||||||
| OFS | RC | 0.834 | 0.762 | 73% | 77% | 73% | 2011 | 277 | 1.75 | |
| ODS | RC | 0.538 | 0.492 | 66% | 67% | 67% | 1902 | 314 | 0.83 | |
| EFS | RC | 0.541 | 0.762 | 69% | 73% | 71% | 3295 | 545 | 0.82 | |
| OFS – EFS (% Difference) | - | 35% | 35% | 10% | 13% | 8% | 3% | - |
53% | |
| ODS – EFS (% Difference) | - | 1% | 35% | 4% | 8% | 7% | 42% | - | 1% | |
Note: X is displacement across the X-axis; Y is displacement across the Y-axis; RZ is rotation around the Z axis; Reactive weight is the total weight of the superstructure; Max drift in X is the largest drift corresponding to the X-axis; RC is reinforced concrete
Table 4.
Final cross sections of structural systems.
 |
OFS | ||||
| Type of beam | b [cm] | h [cm] | r [cm] | ||
| V1 (P1-P7) | 40 | 60 | 4 | ||
| V2 (S2-PB) | 30 | 50 | 4 | ||
| V3 (S2-P7) | 25 | 25 | 4 | ||
| ODS | |||||
| V1 (P5-P7) | 30 | 50 | 4 | ||
| V2 (S2-P4) | 35 | 55 | 4 | ||
| V3 (S2-P7) | 25 | 25 | 4 | ||
| EFS | |||||
| V1 (S2-P7) | 55 | 85 | 4 | ||
| V2 (S2-P7) | 25 | 40 | 4 | ||
 |
OFS | ||||
| Type of column | b [cm] | h [cm] | r [cm] | ||
| C1 (P5-P7) | 50 | 50 | 4 | ||
| C2 (P5-P7) | 55 | 55 | 4 | ||
| C3 (P5-P7) | 50 | 55 | 4 | ||
| C4 (P5-P7) | 55 | 60 | 4 | ||
| ODS | |||||
| C1 (P5-P7) | 50 | 50 | 4 | ||
 |
OFS | ||||
| C1 (PB-P5) | 60 | 60 | 4 | ||
| C2 (PB-P5) | 65 | 65 | 4 | ||
| C3 (PB-P5) | 60 | 65 | 4 | ||
| C4 (PB-P5) | 65 | 70 | 4 | ||
| ODS | |||||
| C1 (PB-P5) | 55 | 55 | 4 | ||
 |
OFS | ||||
| C1 (S3-PB) | 60 | 60 | 4 | ||
| C2 (S3-PB) | 65 | 65 | 4 | ||
| C3 (S3-PB) | 60 | 65 | 4 | ||
| C4 (S3-PB) | 65 | 70 | 4 | ||
| C5 (S3-PB) | 45 | 45 | 3 | ||
| ODS | |||||
| C1 (SB3-PB) | 55 | 55 | 4 | ||
 |
EFS | ||||
| Type of column | b [cm] | h [cm] | r [cm] | ||
| C1 (P5-P7) | 110 | 110 | 4 | ||
| C2 (P5-P7) | 100 | 100 | 4 | ||
| C1 (S3-P5) | 120 | 120 | 4 | ||
| C2 (P5-P7) | 100 | 100 | 4 | ||
| OFS | |||||
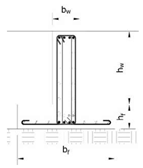
| Type of foundation beam | bf [cm] | hf [cm] | bw [cm] | hw [cm] | |
| Inverted T Edge Beam | 300 | 40 | 45 | 120 | |
| Inside Inverted T Beam | 160 | 40 | 45 | 120 | |
| ODS | |||||
| Type of foundation beam | bf [cm] | hf [cm] | bw [cm] | hw [cm] | |
| Inverted T Edge Beam | 300 | 40 | 45 | 140 | |
| Inside Inverted T Beam | 160 | 40 | 45 | 140 | |
| EFS | |||||
| Type of foundation beam | bf [cm] | hf [cm] | bw [cm] | hw [cm] | |
| Inverted T Edge Beam | 300 | 40 | 45 | 140 | |
| Inside Inverted T Beam | 170 | 40 | 45 | 140 | |
 | |||||
| ODS | |||||
| Type of wall | bc [cm] | hc [cm] | L [cm] | e [cm] | |
| M1- Lower | 35 | 35 | 340 | 25 | |
| M1- Upper | 30 | 30 | 345 | 20 | |
| M2- Lower | 35 | 35 | 265 | 25 | |
| M2- Upper | 30 | 30 | 270 | 20 | |
| M3- Lower | 35 | 35 | 275 | 25 | |
| M3- Upper | 30 | 30 | 280 | 20 | |
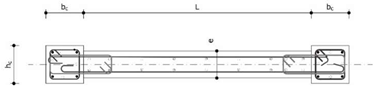 | |||||
Table 5.
Material Quantities for Key Structural Elements.
| Structural Element | OFS | ODS | EFS | ||||||
| Concrete [m3] |
Rebar Steel [tonnes] |
Wood Formwork [tonnes] |
Concrete [m3] |
Rebar Steel [tonnes] |
Wood Formwork [tonnes] |
Concrete [m3] |
Rebar Steel [tonnes] |
Wood Formwork [tonnes] |
|
| Retaining Walls | 317.11 | 9.72 | 2.38 | 317.11 | 9.77 | 2.38 | 317.11 | 9.72 | 2.38 |
| Foundation Beam | 441.36 | 31.11 | 1.54 | 473.47 | 50.92 | 1.68 | 482.09 | 47.78 | 1.66 |
| Staircase and Ramps | 62.86 | 12.07 | 0.57 | 62.86 | 12.07 | 0.57 | 62.86 | 12.07 | 0.57 |
| Beams | 319.97 | 40.57 | 2.67 | 257.24 | 19.42 | 2.33 | 639.17 | 73.67 | 3.68 |
| Columns | 214.22 | 47.74 | 2.28 | 120.61 | 31.68 | 1.43 | 704.54 | 155.28 | 4.08 |
| Shear Wall | - | - | - | 205.24 | 27.48 | 2.56 | - | - | - |
| Slab | 387.82 | 33.44 | 5.38 | 392.29 | 33.53 | 5.44 | 342.45 | 33.24 | 4.75 |
| Total | 1743.34 | 174.65 | 14.83 | 1828.83 | 184.86 | 16.39 | 2548.21 | 331.77 | 17.13 |
Table 6.
Quantification of soil involved during the construction phase. Soil Activity.
| Soil activity | OFS | ODS | EFS |
|---|---|---|---|
| Excavation Volume [m3] | 7228.97 | 7228.97 | 7228.97 |
| Unwanted material [m3] | 6017.83 | 6017.83 | 6017.83 |
| Filling material [m3] | 769.78 | 737.67 | 729.05 |
Table 7.
Emission and energy consumption factors in materials.
| Material | EF [tonnes of CO2 eq./u] |
Source | Commentary | ECF [MJ/u] | Source |
|---|---|---|---|---|---|
| Concrete [m3] |
0.252 | [26] | University of Bath Carbon and Energy Inventory. f’c= 28 MPa |
3623.190 | [26] |
| Rebar Steel [tonnes] |
1.99 | [26] | University of Bath Carbon and Energy Inventory | 19000.000 | [27] |
| Wood Formwork [tonnes] |
0.613 | [25] | Study carried out at the University of La Coruña in MDP boards | 3297.160 | [25] |
Table 8.
Fuel efficiency in machinery and equipment.
| Equipment and machinery | Efficiency [L/u] | Source |
|---|---|---|
| Dump Truck 6x4, 10m3; 280hp, [km] | 0.765 | [28] |
| Cargo Truck 5 tonnes [km] | 0.60 | [28] |
| Concrete Mixer Truck; 3 axis; 8 m3; 300 hp [km] |
0.77 | [28] |
| Concrete Mixer Truck; 3 axis; 300 hp [h] |
5.21 | [24] |
| Vibratory plate compactor 7 hp [h] |
1.10 | [24] |
| Concrete vibrator (1.5"); 4 hp [h] |
1.03 | [24] |
| Backhoe 0.2 m3; 62 hp [h] |
5.21 | [24] |
| Front Loader 1.5-1.7 and D3; 80 hp [h] |
13.93 | [24] |
| Concrete Pump BSA 1000 1005 D3B C 75 hp [h] |
15.00 | [24] |
Table 9.
Electrical equipment power.
| Equipment | Potency | Source |
|---|---|---|
| Chainsaw [W] | 1200.000 | [29] |
Table 10.
Emission and energy consumption factors due to the consumption of fuel (diesel) and electrical energy.
Table 10.
Emission and energy consumption factors due to the consumption of fuel (diesel) and electrical energy.
| Energy Source | EF [tonnes of CO2 eq./u] |
ECF [MJ/u] |
Source |
|---|---|---|---|
| Fuel (Diesel) [L] | 0.0025 | 34.68 | [30] |
| Electric Power [MWh] | 0.451 | 3600 | [31] |
Table 11.
Emission and energy consumption factors in equipment and machinery.
| Equipment and machinery | EF[tonnes of CO2 eq/u] | CF [MJ/u] |
|---|---|---|
| Dump Truck; 6x4 10m3; 280hp; [km] | 0.0019 | 26.54 |
| Cargo Truck; 5 tonnes; [km] | 0.0015 | 20.70 |
| Concrete Mixer Truck; 3 axis; 8 m3; 300 hp; [km] | 0.0019 | 26.54 |
| Concrete Mixer Truck; 3 axis; 300 hp; [h] | 0.0131 | 180.68 |
| Vibratory plate compactor 7 hp; [h] | 0.0028 | 38.15 |
| Concrete vibrator (1.5"); 4 hp; [h] | 0.0026 | 35.72 |
| Backhoe; 0.2 m3; 62 hp; [h] | 0.0131 | 180.68 |
| Front Loader; 1.5-1.7 m3; 80 hp; [h] | 0.0351 | 483.09 |
| Concrete Pump BSA 1000 1005 D3B C 75 hp; [h] | 0.0378 | 520.20 |
| Chainsaw; [h] | 0.0005 | 4.32 |
Table 12.
Results of analysis of transport of materials in OFS.
| Transportation | Type of Transport | u | Loading capacity | Required quantity | No. Trips [u] |
Distance [km] | Total distance [km] |
|---|---|---|---|---|---|---|---|
| Concrete | Concrete Mixer Truck; 3 axis; 8 m3; 300 hp [km] |
m3 | 8 | 1743.34 | 436 | 7.8 | 3400.8 |
| Rebar Steel | Cargo Truck 5 tonnes [km] |
tonnes | 5 | 174.65 | 70 | 6.2 | 434 |
| Wood formwork | Cargo Truck 5 tonnes [km] |
tonnes | 5 | 14.83 | 6 | 2.3 | 13.8 |
| Unwanted material | Dump Truck 6x4m, 10m3; 280hp [km] |
m3 | 10 | 6017.83 | 1204 | 12.5 | 15050 |
Table 13.
Results of environmental evaluation in the OFS.
| No. | Code | Activity | u | Quantity | EF | ECF | Total Emission | Total Energy Consumption |
|---|---|---|---|---|---|---|---|---|
| [tonne of CO2 eq./u] | [MJ/u] | [tonnes of CO2 eq] | [MJ] | |||||
| 1 | OFS-01-01 | Materials Manufacturing | ||||||
| 2 | OFS-01-01-01 | Ready-mix concrete manufacturing | m3 | 1743.34 | 0.25 | 3623.19 | 439.322 | 6316455.86 |
| 3 | OFS-01-01-02 | Rebar steel manufacturing | tonnes | 174.65 | 1.99 | 19000 | 347.557 | 3318383.44 |
| 4 | OFS-01-01-03 | Wood formwork manufacturing | tonnes | 14.83 | 0.61 | 3297.16 | 9.091 | 48899.32 |
| 5 | OFS-01-02 | Transport of Materials | ||||||
| 6 | OFS-01-02-01 | Transport Ready-mix concrete | km | 3400.8 | 0.0019 | 26.54 | 6.554 | 90272.39 |
| 7 | OFS-01-02-02 | Transport Rebar Steel | km | 434 | 0.0015 | 20.7 | 0.652 | 8985.83 |
| 8 | OFS-01-02-03 | Transport Wood formwork | km | 13.8 | 0.0015 | 20.7 | 0.021 | 285.72 |
| 9 | OFS-01-03 | Construction | ||||||
| 10 | OFS-01-03-01 | Earth Moving | ||||||
| 11 | OFS-01-03-01-01 | Excavation | m3 | 7228.97 | 0.0007 | 9.03 | 4.741 | 65307.51 |
| 12 | OFS-01-03-01-02 | Eviction of unwanted material | m3 | 6017.83 | 0.0048 | 66.39 | 29.003 | 399494.08 |
| 13 | OFS-01-03-01-03 | Soil Compactation | m3 | 769.78 | 0.0015 | 20.22 | 1.13 | 15563.67 |
| 14 | OFS-01-03-02 | Structure | ||||||
| 15 | OFS-01-03-02-01 | Retaining Walls | ||||||
| 16 | OFS-01-03-02-01-001 | Pouring concrete in Reataining walls f'c=280 kg/cm2, includes pump transport | m3 | 317.11 | 0.0026 | 36.27 | 0.835 | 11500.82 |
| 17 | OFS-01-03-02-01-002 | Reinforcing steel cutting fy=4200 kg/cm2 | tonnes | 9.72 | 0.0011 | 8.64 | 0.011 | 84.02 |
| 18 | OFS-01-03-02-01-003 | Formwork Wood cutting of retaining walls | tonnes | 2.38 | 0.0022 | 17.28 | 0.005 | 41.1 |
| 19 | OFS-01-03-02-02 | Foundation | ||||||
| 20 | OFS-01-03-02-02-001 | Pouring concrete in foundation beams f'c=280 kg/cm2, includes pump transport | m3 | 441.36 | 0.0025 | 33.94 | 1.088 | 14981.44 |
| 21 | OFS-01-03-02-02-002 | Reinforcing steel cutting fy=4200 kg/cm2 | tonne | 31.11 | 0.0016 | 12.96 | 0.05 | 403.14 |
| 22 | OFS-01-03-02-02-003 | Formwork wood cutting of foundation beams | tonne | 1.54 | 0.0027 | 21.6 | 0.004 | 33.36 |
| 23 | OFS-01-03-02-03 | Staircase and Ramps | ||||||
| 24 | OFS-01-03-02-03-001 | Pouring concrete in staircase and ramps f'c=280 kg/cm2, includes pump transport | m3 | 62.86 | 0.0061 | 84.59 | 0.386 | 5317.65 |
| 25 | OFS-01-03-02-03-002 | Reinforcing steel cutting fy=4200 kg/cm2 | tonnes | 12.07 | 0.0011 | 8.64 | 0.013 | 104.28 |
| 26 | OFS-01-03-02-03-003 | Formwork wood cutting of staircase and ramps | tonnes | 0.57 | 0.0022 | 17.28 | 0.001 | 9.93 |
| 27 | OFS-01-03-02-04 | Columns | ||||||
| 28 | OFS-01-03-02-04-001 | Column Pouring concrete f'c=280 kg/cm2, includes pump transport | m3 | 214.22 | 0.0035 | 48.29 | 0.751 | 10344.58 |
| 29 | OFS-01-03-02-04-002 | Reinforcing steel cutting fy=4200 kg/cm2 | tonnes | 47.74 | 0.0016 | 12.96 | 0.077 | 618.75 |
| 30 | OFS-01-03-02-04-003 | Formwork wood cutting of columns | tonnes | 2.28 | 0.0027 | 21.6 | 0.006 | 49.23 |
| 31 | OFS-01-03-02-05 | Beams | ||||||
| 32 | OFS-01-03-02-05-001 | Pouring concrete in beams f'c=280 kg/cm2, includes pump transport | m3 | 319.97 | 0.0031 | 43.31 | 1.006 | 13856.79 |
| 33 | OFS-01-03-02-05-002 | Reinforcing steel cutting fy=4200 kg/cm2 | tonnes | 40.57 | 0.0016 | 12.96 | 0.066 | 525.82 |
| 34 | OFS-01-03-02-05-003 | Formwork wood cutting of beams | tonnes | 2.67 | 0.0027 | 21.6 | 0.007 | 57.73 |
| 35 | OFS-01-03-02-06 | Slabs | ||||||
| 36 | OFS-01-03-02-06-001 | Pouring concrete in slabs f'c=280 kg/cm2, includes pump transport | m3 | 387.82 | 0.003 | 41.54 | 1.17 | 16110.24 |
| 37 | OFS-01-03-02-06-002 | Reinforcing steel cutting fy=4200 kg/cm2 | tonnes | 33.44 | 0.0011 | 8.64 | 0.036 | 288.88 |
| 38 | OFS-01-03-02-06-003 | Formwork wood cutting of slabs | tonnes | 5.38 | 0.0022 | 17.28 | 0.012 | 92.99 |
| Total: | 843.6 | 10338068.58 | ||||||
Disclaimer/Publisher’s Note: The statements, opinions and data contained in all publications are solely those of the individual author(s) and contributor(s) and not of MDPI and/or the editor(s). MDPI and/or the editor(s) disclaim responsibility for any injury to people or property resulting from any ideas, methods, instructions or products referred to in the content. |
© 2024 by the authors. Licensee MDPI, Basel, Switzerland. This article is an open access article distributed under the terms and conditions of the Creative Commons Attribution (CC BY) license (http://creativecommons.org/licenses/by/4.0/).
Copyright: This open access article is published under a Creative Commons CC BY 4.0 license, which permit the free download, distribution, and reuse, provided that the author and preprint are cited in any reuse.


