
Submitted:
17 October 2024
Posted:
18 October 2024
You are already at the latest version
Abstract
Ammonia volatilization, which is a main way for nitrogen gaseous loss of farmland, restricts the promotion of the utilization rate of nitrogen fertilizer, and contains some potential environmental risks. To investigate the general pattern of ammonia volatilization under actual paddy field conditions, researchers designed an indoor simulated system to measure the amount of ammonia volatilized within a single time period by controlling the pH and concentration of NH4+ (c(NH4+)) in the solution, the gas-liquid interfacial gas velocity, and the ambient temperature. In this paper, the influence of these factors, the synergistic effect on ammonia volatilization and their quantitative relationship were discussed. Researchers use the resolution of ammonium bicarbonate (SAB) and diammonium phosphate (SDP) for simulation experiments, and the results show that, there are significant linear relationship between amount of ammonia volatilization and c(NH4+). The correlation coefficient is between 0.9214 to 0.9897 and 0.8932 to 0.9904 for SAB and SDP, respectively. The quantitative relationship between temperature, pH and the influence factor (CIF), the initial ammonia volatilization fluxes (IAVF) was analyzed by least-squares method, and the degrees of polynomial were one and two respectively. The regression equations of the SAB and SDP among the amount of ammonia volatilization with the concentration of ammonium nitrogen, the temperature and the pH were gotten by using MATLAB. Considering the effects of temperature and pH on CIF and IAVF under individual conditions, we use binary cubic model to fit the relationship between temperature, pH to CIF and IAVF, the simulation results show that the correlation coefficients between CIF and IAVF for SAB are 0.9980 and 0.9680, however the correlation coefficients are 0.9946 and 0.9708 for SDP, respectively. The quantitative equation takes into account coefficient of determination and degrees of polynomial, and the ammonia volatilization fluxes can be calculated by using these equations.
Keywords:
Ammonia volatilization
; Influence factors
; Synergistic effect
1. Introduction
The application of nitrogen fertilizer has effectively promoted agricultural production, but it also brought many environmental and ecological problems with the increasing fertilizer use [1,2,3]. Currently, the nitrogen fertilizer consumption of China accounted for about 30% of the world's total consumption [4]. For a long time, the academic community has been committed to research the way of nitrogen loss in farmland [5,6,7], to improve the utilization rate of nitrogen fertilizer, and control fertilizer dosing amount to achieve the balance between environmental benefits and economic yield.
Early investigation demonstrated that, ammonia volatilization is a main way for nitrogen gaseous loss of farmland, and it is difficult to improve the utilization rate of nitrogen fertilizer. As the ammonia volatilization amount is difficult to measure accurately, the ratio of gaseous nitrogen losses in early research is accounted for 9 to 60 percent of nitrogen dosage [8,9] and accounted for a considerable proportion in total nitrogen loss [10,11,12]. Excessively chemical nitrogenous fertilizer was applying in the field to heighten field production, which caused a great waste of fertilizer and energy, and also brought the environmental and ecological risk. To reduce the nitrogen gaseous loss, some new fertilizers and chemical additive [13,14,15] are applied to the field, Meanwhile, the fertilization modes [16,17], water management [18,19] and crop management [20] are attracting extensive attention.
The ventilation method is a common method of ammonia volatilization determination [21]. It can well simulate the actual conditions of the field, and can also well describe the dynamic effect of ammonia volatilization under different conditions. A vacuum pump is used as a power source, which can bring the NH3 of the closed vessel to absorption bottle equipped with absorption liquid of boric acid (2% w/w). And then titration measurement is used to calculate ammonia volatilization [22]. This approach just takes samples for fixation time to estimate the ammonia volatilization amount of certain period. In early research, we took samples in 9:00~11:00AM and 14:00~16:00PM to calculate the ammonia volatilization amount in 24 hours. But such simulation is flawed in the ammonia nitrogen concentration, temperature and pH in surface water of paddy field which changing continuously during the whole day, and these three factors have important influence on the ammonia volatilization rate of paddy fields [23].
In the earlier researches, the effect of ammonia nitrogen concentration, temperature, and pH on the ammonia volatilization rate was discussed separately [24,25]. Some researchers have done some research on the coupling factors of ammonia volatilization of solid waste [26], but the quantitative relationship between these factors on agricultural production has not been found.
In this paper, we determined the ammonia volatilization fluxes of different fertilizer solutions in laboratory conditions to evaluate interaction affection between ammonia nitrogen concentrations, temperature, and pH on ammonia volatilization and obtained the quantitative relationship between these three factors. We use ultrapure water for simulating the surface water environment to obtain the chemical quantitative relationship between these three influence factors and ammonia volatilization amount. This method ignores the effects of microorganism on ammonia volatilization, and it just characterization the synergy of the three factors accurately.
Finally, we obtained the coupling equation between these factors of ammonia volatilization. According to the establishment of quantitative relationship between the three factors, we can calculate the amount of ammonia volatilization accurately through online ammonium nitrogen concentration, temperature, pH by using this equation. Therefore, this research has very important significance to predict and control the ammonia volatilization fluxes.
2. Materials and Methods
2.1. Experimental Materials
Ammonium bicarbonate, diammonium phosphate are used for fertilizer solution preparation were analytical reagent (AR) grade; boric acid (AR) is used as absorption solution for ammonia; 0.01mol·L-1 hydrochloric acid (Guaranteed Reagent, GR) is used as titration standard solution; hydrochloric acid (AR) and sodium hydroxide(AR) are used to adjust the pH of solution. All the reagents above are provided by Sinopharm chemical reagent Co., Ltd (Shanghai). All solutions are prepared in ultrapure water (18.2 MΩ) obtained from a Barnstead Nanopure UF water system (Thermo Scientific, USA).
The experimental apparatus showed in Scheme 1. A cuboid (20cm*10cm*10cm,) is made of organic glass material and used as ammonia volatilization chamber. There are two circular holes (diameter 4 cm and 1 cm respectively) on the top of the chamber which were desired for the path of gas inflow and outflow. The flowed gas is supplied by 2XE-0.5 vane vacuum pump, and the flow rate is controlled by the adjustable gas-flowmeter. The experiment is conducted in the room of 15 m2, and indoor temperature is adjusted by air-conditioning, room and solution temperature is confirmed with a mercury thermometer. The pH of the fertilizer solution is determined by FE20 (METTLER-TOLEDO International Inc.).
2.2. Experimental of Ammonia Volatilization
Ammonium bicarbonate (SAB) and diammonium phosphate solution (SDP) in different concentrations are compounded with ultra-pure water respectively, which is used to simulate paddy field water in different concentrations. In order to ensure the consistency of test temperature, the ultrapure water used for the experiment is constant for 4h beforehand. According to the study on ammonium nitrogen content in field surface water, we find it could be higher than 100 mg·L-1 after fertilization, and temperature in flooded rice growth cycle is usually between 15-30oC. So this experiment is designed by six ammonium (NH4+) concentration levels (10 mg·L-1, 20 mg·L-1, 40 mg·L-1, 60 mg·L-1, 80 mg·L-1, 100 mg·L-1 respectively), 4 temperature levels (15oC, 20oC, 25oC, 30oC respectively) and 4 pH levels (pH=7.0, 7.5, 8.0 and 8.5 respectively).
The effluent gas is imported to two gas absorption bottles, which are filled with boric acid solution with concentration of 2% (w/w). In the experimental process, we use vacuum pump for 1h, and then mix the two-absorption bottle with boric acid solution after vacuum pump is power off. Boric acid solution is titration by 0.01mol·L-1 hydrochloric acid, to calculate the ammonia volatilization amount in 1h, and each concentration, temperature and pH conditions of experiment are processed three times, and the average value was taken as the final results.
The ammonia volatilization amount under each experiment condition should be tested three times, and get the average and mean variation.
2.3. Experimental of Gas Flow Rate
To determine the ammonia volatilization under different gas flow rate, we inject fertilizer solutions with pH=8.5 and c(NH4+) =100 mg·L-1 into the ammonia volatilization chamber, and the space height of the gas chamber above the solution level is 0.5 cm. Using adjustable gas-flowmeter to set different pumping rates (0.4, 0.8, 1.2, 1.6, 2.0, 2.4 L·s-1 respectively), the ammonia gas volatilized from the solution were also absorbed by boric acid solution. The experiments of each pumping rate were repeated for three times, and the average value and average deviation are calculated by these results. All these experiments were carried out at room temperature of 30oC.
2.4. pH Value of Fertilizer Solution
At room temperature (22±2oC), different fertilizer samples are accurately weighted and dissolved in ultrapure water, using FE20 to determine the pH value. And then pH of the solution is adjusted to match the setter value by hydrochloric acid (c(HCl)=0.1mol·L-1) and sodium hydroxide solution (c(NaOH)=0.5 mol·L-1) respectively.
2.5. Data Analysis and Processing
All experiment data were collated and summarized by Microsoft Excel 2013. Data analysis and equations fitting were performed by using OriginPro 8.5.1 and Matalab R2016a.
3. Results
3.1. Calculation of Gas Velocity in Gas-Liquid Interface
The determination of gas flow rate in gas-liquid interface is the key point of this experiment. The closed air chamber is a rectangle chamber, with the certain length (L), width (W), and height (H) from liquid level to gas chamber end, the sectional area(S) and volume (V) of this gas chamber can be determined by these constants.
Therefore, the average velocity of the gas flow in the gas chamber for
u- Gas flow rate in volatilization chamber (cm·s-1)
F- Gas flow meter in pipeline reading from gas-flowmeter(cm3·s-1)
From the formula (2-2) we can see, u was the average gas flow rate in volatilization chamber, and obviously, the gas flow rate above the water surface was uneven in the volatilization chamber. If u is used to describe the gas flow rate in liquid surface, the height from water surface to the top of volatilization chamber must be small enough, and only in this way we can approximate the average gas flow rate in volatilization chamber as gas flow rate in "gas-liquid" interface.
In this research, we conducted experiments with 6 different pumping rates, corresponding to 6 different pumping rates respectively. The results are shown in Figure 1. When the pumping rate above 2.4L·min-1 (equivalent to 40cm3·s-1), continuing increase the pumping rate, the amount of ammonia volatilization has not significantly increased. This implies that when the gas velocity reaches a certain value, all the ammonia volatized from the system can be absorbed completely and quickly, and the gas flow rate is not the limiting step of ammonia volatilization.
In this experiment, the space height of the volatilization chamber above the solution level is unified to 0.5cm; the width of volatilization chamber is 5 cm; volatile of gas-flowmeter is adjusted to 40cm3·s-1 (H=0.5 cm, W=10 cm, F=40 cm3·s-1), all data are in constant, gas flow rate in "gas-liquid" interface can be calculated by formula (2-2):
Because the ammonia volatilization process is positively correlated to the pH, NH4+ concentration and temperature, and the experimental factors we set in this pumping rate experiment are the maximal value, so setting the pumping rate to 2.4L·min-1, corresponding gas flow rate to 0.08 m·s-1 in our subsequent experiments is appropriated.
3.2. Kinetics Study on Ammonia Volatilization
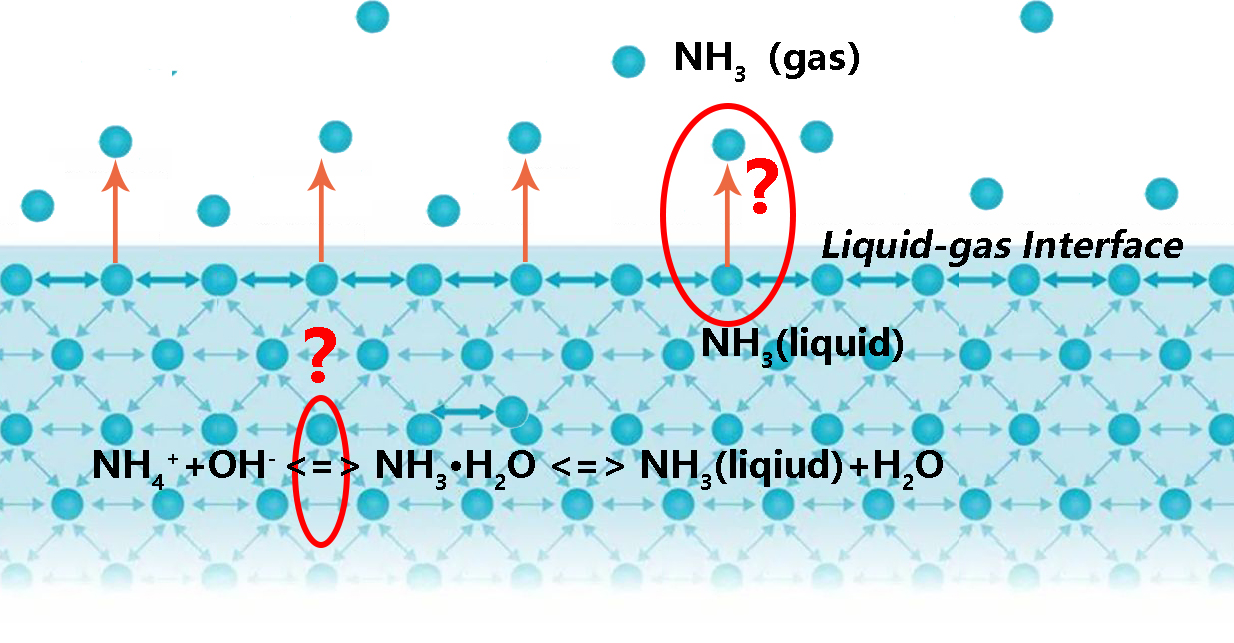
NH4+-NH3 system reaction in liquid inside and "gas-liquid" interface is a complex kinetics process including a variety of factors [27], and generally, chemical balance in solution directly related to ammonia volatilization is:
NH4+ (liquid) <=> NH3 (liquid) <=> NH3 (gas)
The factors which can change the reaction chemical equilibrium can affect the ammonia volatilization amount directly.
The relationship between ammonia volatilization fluxes (fluxes in 1 h) and ammonia concentration in solution is shown in Figure 2 and Figure 3. From these figures we can see that, the ammonia volatilization fluxes and ammonia nitrogen concentration in solution show positive correlation. Under this experimental condition, two kinds of fertilizers show good linear relationship relatively; but in the condition of the same temperature and pH, ammonia volatilization of SDP was significantly lower than that of SAB. This result illustrates that, ammonia volatilization characteristics of different nitrogen sources also show provincial difference even with the same NH4+-N concentration.
The reaction of ammonium ion transformed into NH3 hydrate (NH3·H2O) can occur all the time in fertilizer solution. This process is influenced by the temperature and pH condition in the water. But the ammonia volatilization, that is the transformation of ammonia from liquid phase into gas phase, can only occurs at the "gas-liquid" interface. When at low pH and low NH3 hydrate concentration, the concentrations of NH3 hydrate and ammonia nitrogen show positive relation. And in this condition, NH3 molecules desolating in the liquid did not reach over saturated condition in the "gas-liquid" interface, and the ammonia volatilization amount increased with the ammonia nitrogen concentration increasing. In a relatively short time (1 h), ammonia of volatizing from "gas-liquid interface" completely comes from the volatile of NH3 hydrate, without the diffusion of NH3 molecules between "gas-liquid interface" and liquid inside. In this experiment, ammonia volatilization amount in liquid surface is studied in specified pH, temperature, ammonia nitrogen concentration. From the result we can see, the dates conform to the linear rule when ammonia nitrogen concentration is less than 100mg·L-1, reaction time is 1h.
3.3. Equation Fitting of Ammonia Volatilization Fluxes
The ammonia volatilization fluxes (Y, mg) and ammonia nitrogen concentration (C, mg·L-1) in solution are simulated with an equation of Y=aC+b, namely the relationship between ammonia volatilization fluxes and ammonia nitrogen concentration, and the coefficients of a, b and correlation coefficient r are listed in Table 1.
In the simulated rate equation, a represents the slope of the rate equation, namely concentration coefficient of ammonia volatilization fluxes in given of pH, temperature and concentration, which is called concentration influence factor (CIF); b represents the intercept of the rate equation, namely ammonia volatilization quantity when the ammonia nitrogen concentration is 0 mg·L-1, that is called the initial ammonia volatilization fluxes (IAVF).
From the data in Table 1 we can see, in the same pH and temperature conditions, the value of CIF of ammonium bicarbonate as nitrogen source is higher than SDP as nitrogen source; a greater slope value shows SAB volatile ammonia more easily. The double hydrolytic reaction plays an important role on the dissolution process of SAB and SDP, because ammonium group, bicarbonate radical and hydrogen phosphate are weak base or weak acid. The aqueous solution of these two fertilizers is alkaline, but carbonic acid is weaker than phosphoric, who all produced by the hydrolytic reaction. The basic of the SAB is always stronger than SDP, which is more conducive to the volatilization process. This implies that different fertilizers show different characteristics of ammonia volatilization.
Theoretically, there should be no ammonia being volatilized when the ammonia nitrogen concentration is 0 mg·L-1, because ammonia nitrogen is the nitrogen source of the ammonia volatilization process. But, in our simulations, a special phenomenon was found, that is, the value of IAVF (b) is grossly increased with the increasing of temperature and pH. This phenomenon can be considered that, the value of b represents the trend of ammonia volatilization under the specified temperature and pH, in other words, the concentration of ammonia nitrogen increases the same infinitesimal amount, the higher temperature and the higher pH, the more ammonia being volatilized.
In addition, the experiment takes different nitrogen fertilizers as ammonia nitrogen source, the correlations coefficient of ammonia volatilization fluxes and ammonia nitrogen concentration are higher than 0.9 except SDP with pH 7.0 and temperature 15oC. Therefore, ammonia volatilization fluxes and ammonia nitrogen concentration show positively relation, which belonging to the zero order reaction in kinetics.
There are differences between the coefficient of determination (R2) values of the two, which shows a little variability between volatilization fluxes and concentration.
3.4. Effect of Temperature on Ammonia Volatilization
As can be seen from Table 1, in the same pH condition, the value of CIF and value of IAVF increase as the temperature increases. To investigate the quantify correlation of temperature and a, b, we use the binary, binary quadratic equation models to quantify the correlation between temperature and the concentration influence factor & initial ammonia volatilization fluxes, the results show that the binary equation model can welly quantify the relationship between them. The fitting curves were shown in Figure 4 and Figure 5.
As can be seen from Table 2, coefficient α is the influencing extent of temperature on CIF, which can be considered to be the effect of temperature on ammonia volatilization concentration influence factor, referred as temperature coefficient of concentration influence factor. Coefficient γ is the influencing extent of temperature on IAVF, which can be considered to be the effect of temperature on the initial ammonia volatilization, namely temperature coefficient of initial ammonia volatilization quantity. The higher of α and γ, the greater contribution of temperature are given on CIF and IAVF.
The results shown that, there is no significant difference in the value of α at the same pH condition. This indicates that the temperature is not the main factor on the ammonia volatilization of different fertilizers. The possible reason of this phenomenon will be discussed in the following chapter.
3.5. Effect of pH on Ammonia Volatilization
Comparing the data in Table 1 we can find that, a and b in linear equation of ammonia volatilization (Y) and ammonium concentration (C) after ammonium bicarbonate and diammonium phosphate treatment both increasing with the increase of pH when on the condition of same temperature. It indicates that a and b are related to pH of the solution. We use binary quadratic equation model to fit the correlation between CIF and pH at the same temperature, while use binary equation model to fit their correlation of IAVF, and the results were shown in Table 3. As shown in Table 3, the coefficient of determination (R2) of CIF, IVAF and pH are all higher than 0.9, except ammonium bicarbonate treated at 15 oC, which indicates that these equations can welly expound the relationship between them.
From Table 3, we find that the apex of fitting equation of CIF value is concentrated between pH 7.1 and 7.3, which means that the value of CIF increases rapidly with the increase of pH when the solution is alkaline. This indicates that the effect of pH was significantly greater than that of temperature on ammonia volatilization. Further analysis shows that the value of ε increases gradually with increasing temperature, which indicates that the changing rate of ΔpH/Δa increases rapidly as the temperature increasing.
From the fitting equation of IVAF value, we find that when the ambient temperature is low (15 oC and 20 oC),the coefficient η of SAB, which is the effect strength of pH on IVAF, is lower than SDP. When the temperature rises to 25 oC and 30 oC, the values of η of these two fertilizer solutions are contrary to low temperature. This result show that the pH plays an important role on ammonia volatilization trend of SDP in low ambient temperature, however, the impact of SAB is even greater at high temperature.
4. Discussion
4.1. Effect of Temperature and pH on Volatilization Process
The process of ammonia volatilization from ammonium ion in solution can be divided to
NH4+(liquid) <=> NH3(liquid) <=> NH3(gas)
There is a dynamic chemical equilibrium process in de solution:
NH4++OH- <=> NH3·H2O <=> NH3(liquid)+H2O
The chemical equilibrium constant (Kc) of this process is a constant for the equilibrium concentration of various ions in the solution system. In this solution, the Kc is related to ammonium nitrogen, hydroxyl concentration and temperature. Obviously, different fertilizers, ammonium bicarbonate or diammonium phosphate, will not affect the concentration of all ions in this chemical equilibrium, so it will not change the chemical equilibrium. This can explain the phenomenon that the values of α between different fertilizers at same temperature are almost the same.
Form the other side, the temperature will affect the process that ammonia molecule from liquid to gas. Ammonia molecules closing to the liquid-gas interface, break free from the shackles of the liquid molecules by molecule motion, and finally escape into the air. As the temperature rises, the movement of ammonia molecules in the solution become more intense, meanwhile, the chemical equilibrium moves toward to generate ammonia molecules, which leads to the phenomenon that the CIF value increasing as the temperature increases.
In contrast, the pH value plays an important role in this chemical equilibrium. The increasing of hydroxyl concentration leads the chemical equilibrium shift toward to generate ammonia molecules, which is the source of ammonia volatilization. Theoretically know that when the pH value increase one unit, the concentration of hydroxyl is actually increased by an order of magnitude. Form the chemical equilibrium constant expression, the concentration of ammonia molecules is increased by the hydroxyl because the Kc is constant in the same temperature. However, in our study, we found that the amount of ammonia volatilized was increased rapidly when the pH value increases one unit, but, it did not reach as much as 10 times, which may due to the restraints of other ions on ammonia molecule in the solution.
4.2. Synergistic Effect of Temperature and pH on Concentration Influence Factor and Initial Ammonia Volatilization Fluxes
From the above analysis we can see that, CIF and IAVF, who are the coefficient in linear equation of ammonia volatilization rate and concentration, all shown a certain quantitative relationship with temperature and pH. The effects of Temperature and pH on CIF and IAVF have superposition effect, so it is not comprehensive to consider the effects of temperature or pH on ammonia volatilization amount.
In order to fully consider the effects of temperature and pH on a and b, the binary, binary quadratic and binary cubic equation models were used to quantify the CIF (a) and IAVF (b) of SAB and SDP by using MATLAB R2016a. These equations were shown in Table 4 and Table 5.
According previous research we find that temperature and pH show superposition effect on the CIF and IAVF. Meanwhile, the effect of temperature and pH on the CIF should be expressed as binary cubic correlation, and their effect on IAVF should be binary quadratic correlated. Considering the results of coefficient determination on Table 4 and Table 5, binary cubic model is suitable to express the quantitative relationship between temperature, pH and CIF, however, binary quadratic model is suitable to express the quantitative relationship of temperature and pH on IAVF.
Simultaneously, according 3D plot drawing by MATLAB R2016a we find that, CIF of SAB (Figure 6) and SDP (Figure 7) show fast and non-linear tendency as pH increasing. And the change of ΔpH/Δa increases fast as pH increasing, which show consistence with the previous projections. Otherwise, the effect of temperature on CIF exhibits a rapid increase with pH increasing, and the influence of temperature on CIF is less than that of pH.
From fitting results of temperature, pH and IAVF by binary quadratic model, we find that the fitting curve is more linear (Figures 6(b) and 7(b)). This result indicates that the effect of pH and temperature on IAVF is simply superposition, and there isn’t significant mutual promotion effect.
4.3. Synergistic Effect of Ammonia Volatilization Rate Among Concentration, Temperature and pH
From the specific fitting equation model selected in Table 4 and Table 5, we find that the coefficient of CIF and IAVF with temperature and pH is greater than 0.95, which reached a significant level. This result indicates that the fitting equation is accurate, and also confirmed that the temperature-pH superposition of ammonia volatilization process exists. Coupled with the concentration factor, the quantitative coupling relationship of ammonia volatilization and ammonia concentration, temperature, pH can be written in following:
Ammonium bicarbonate:
Y=(-20.01+7.513pH+0.3245T-0.9496pH2-0.07564p·T-0.002611T2+0.0402pH3+ 0.004628pH2·T+0.000236pH·T2+0.00001387T3)C+(3.80-0.7272pH-0.1661T+0.02993pH2 +0.02249pH·T+0.0002378T2) (3-1)
Diammonium phosphate:
Y=(-35.71+13.35pH+0.3913T-1.676pH2-0.08671pH·T-0.003744T2+0.07017pH3 +0.005198pH2·T+0.0002822pH·T2+0.00002617T3)C+(3.197-0.6862pH-0.1311T+0.03785pH2 +0.01534pH·T+0.000647T2) (3-22)
Using the formulas (3-1) and (3-2), we can obtain the ammonia volatilization amount in one hour with different ammonia concentration, different temperature and different pH condition. In field experiment, we can estimate the ammonia volatilization rate (milligram per hour) only need to measure the water temperature, the ammonia concentration and pH. Now, these parameters can be easily obtained through online monitoring devices. The cumulative ammonia volatilization amount over a period can be calculated by repeated sampling.
5. Conclusions
There are many researches on soil nitrogen transformation process at home and abroad, which mostly focus on individual factors, but often ignore the joint action between multiple impact factors. Actually, a comprehensive system analysis method should be adopted to study the influence factors paddy ammonia volatilization, because of its interconnectedness and working on the whole transformation process. Therefore, the establishment of mathematical model for single factor is far from the research, and the coupling mathematical model for a variety of key influence factors is necessary in quantitative research on ammonia volatilization of actual ecological environment. According to the combination research on affecting factors of ammonia volatilization, some valuable and guiding index of adjusting crop growth and reasonable fertilization can be obtained.
In this paper, we have constructed a mathematical model of temperature, pH, ammonia nitrogen concentration with ammonia volatilization. The result shows that the ammonia volatilization characteristics of different kinds of nitrogen fertilizer have divergence; ammonium bicarbonate is more easily to release ammonia than diammonium phosphate. In this research, ammonia nitrogen concentration, temperature and pH have obvious positive effects on ammonia volatilization; the fitting relation of ammonia volatilization treated by ammonium bicarbonate and diammonium phosphate with concentration, temperature, and pH are obtained.
The authors believe that this exploration can provide a new way to estimate the ammonia volatilization amount, especially for all time in-suit ammonia volatilization surveillance. In field experiment, ammonia nitrogen concentration, temperature, pH can be obtained conveniently through online monitoring instruments. Ammonia volatilization rate (milligram per hour) under those conditions can be easily estimated using this formula and cumulative ammonia volatilization amount in a certain period can be calculated by adjusting sampling frequency per hour.
Author Contributions
For research articles with several authors, a short paragraph specifying their individual contributions must be provided. The following statements should be used “Conceptualization, J. X. and A.D.; methodology, J.X.; software, J.X.; validation, Y.C., T.Y. and J.L.; formal analysis, J.X.; investigation, J.X. and C.X.; resources, A.D.; data curation, Y.C. and T.Y.; writing—original draft preparation, J.X. and Y.C.; writing—review and editing, A.D.; supervision, J.X.; project administration, A.D.; funding acquisition, C.X and A.D. All authors have read and agreed to the published version of the manuscript.
Funding
This research was funded by National Natural Science Foundation of China, grant number 22166019
Institutional Review Board Statement
Not applicable.
Informed Consent Statement
Not applicable.
Data Availability Statement
Data are contained within the article.
Acknowledgments
The authors thank Lvheng Technology Co. Ltd (Nanchang) to provide convenience of reagents purchase and experimental customization.
Conflicts of Interest
The authors declare no conflicts of interest. The funders had no role in the design of the study; in the collection, analyses, or interpretation of data; in the writing of the manuscript; or in the decision to publish the results.
References
- Bhatnagar, A.; Hogland, W.; Marques, M.; Sillanpaa, M. An overview of the modification methods of activated carbon for its water treatment applications. Chem Eng J. 2013, 219, 499–511. [Google Scholar] [CrossRef]
- Cai, Z.; Wang, B.; Xu, M.; Zhang, H.; He, X.; Zhang, L.; Gao, S. Intensified soil acidification from chemical N fertilization and prevention by manure in an 18-year field experiment in the red soil of southern China. J. Soils Sediments. 2015, 15, 260–270. [Google Scholar] [CrossRef]
- Egyir, M.; Luyima, D.; Park, S. J.; Lee, K. S.; Oh, T. K. Volatilisations of ammonia from the soils amended with modified and nitrogen-enriched biochars. Sci. Total Environ. 2022, 835, 155453. [Google Scholar] [CrossRef] [PubMed]
- Shan, L.; He, Y.; Chen, J.; Huang, Q.; Wang, H. Ammonia volatilization from a Chinese cabbage field under different nitrogen treatments in the Taihu Lake Basin, China. J Environ Sci China. 2015, 38, 14–23. [Google Scholar] [CrossRef]
- Tsai, C. C.; Chang, Y. F. Nitrogen availability in biochar-amended soils with excessive compost application. Agronomy. 2020, 10, 444. [Google Scholar] [CrossRef]
- Pan, B.; Lam, SK.; Mosier, A.; Luo, Y.; Chen, D. Ammonia volatilization from synthetic fertilizers and its mitigation strategies: A global synthesis. Agriculture, Ecosystems & Environment. 2016, 232, 283–289. [Google Scholar]
- Panday, D.; Mikha, M.M.; Collins, H.P.; Jin, V.L.; Kaiser, M.; Cooper, J.; Malakar, A.; Maharjan, B. Optimum rates of surface-applied coal char decreased soil ammonia volatilization loss. J. Environ. Qual. 2020, 49, 256–267. [Google Scholar] [CrossRef]
- Elias, E.; Okoth, P. F.; Stoorvogel, J. J.; Berecha, G.; Mellisse, B.T.; Mekuriaw, A.; Gebresamuel, G.; Selassie, Y.G.; Biratu, G.K.; Smaling, E.M.A. Cereal yields in Ethiopia relate to soil properties and N and P fertilizers. Nutr Cycl Agroecosystems. 2023, 126, 279–292. [Google Scholar] [CrossRef]
- Sha, Z.; Li, Q.; Lv, T.; Misselbrook, T.; Liu, X. Response of ammonia volatilization to biochar addition: a meta-analysis. Sci. Total Environ. 2019, 655, 1387–1396. [Google Scholar] [CrossRef]
- Tsai, C. C.; Chang, Y. F. Nitrogen availability in biochar-amended soils with excessive compost application. Agronomy. 2020, 10, 444. [Google Scholar] [CrossRef]
- Qi, S.; Ding, J.; Yang, S.; Jiang, Z.; Xu, Y. Impact of biochar application on ammonia volatilization from paddy fields under controlled irrigation. Sustainability. 2022, 14, 1337. [Google Scholar] [CrossRef]
- Zhang, Y.; Luan, S.; Chen, L.; Shao, M. Estimating the volatilization of ammonia from synthetic nitrogenous fertilizers used in China. Journal of Environmental Management. 2011, 92, 480–493. [Google Scholar] [CrossRef]
- Mandal, S.; Thangarajan, R.; Bolan, N.S.; Sarkar, B.; Khan, N.; Ok, Y.S.; Naidu, R. Biochar-induced concomitant decrease in ammonia volatilization and increase in nitrogen use efficiency by wheat. Chemosphere. 2016, 142, 120–127. [Google Scholar] [CrossRef]
- Ni, K.; Pacholski, A.; Kage, H. Ammonia volatilization after application of urea to winter wheat over 3 years affected by novel urease and nitrification inhibitors. Agriculture, Ecosystems & Environment 2014, 197, 184–194. [Google Scholar]
- Li, Q.; Yang, A.; Wang, Z.; Roelcke, M.; Chen, X.; Zhang, F.; Pasda, G.; Zerulla, W.; Wissemeier, A.H.; Liu, X. Effect of a new urease inhibitor on ammonia volatilization and nitrogen utilization in wheat in north and northwest China. Field Crops Research. 2015, 175, 96–105. [Google Scholar] [CrossRef]
- Sun, X.; Zhong, T.; Zhang, L.; Zhang, K.; Wu, W. Reducing ammonia volatilization from paddy field with rice straw derived biochar. Sci. Total Environ. 2019, 660, 512–518. [Google Scholar] [CrossRef]
- Liu, T. Q.; Fan, D. J.; Zhang, X. X.; Chen, J.; Li, C. F.; Cao, C. G. Deep placement of nitrogen fertilizers reduces ammonia volatilization and increases nitrogen utilization efficiency in no-tillage paddy fields in central China. Field Crops Research. 2015, 184, 80–90. [Google Scholar] [CrossRef]
- Xu, J.; Peng, S.; Yang, S.; Wang, W. Ammonia volatilization losses from a rice paddy with different irrigation and nitrogen managements. Agricultural Water Management. 2012, 104, 184–192. [Google Scholar] [CrossRef]
- Amaral, V.; Ortega, T.; Romera, C. C.; Forja, J. Linkages between greenhouse gases (CO2, CH4, and N2O) and dissolved organic matter composition in a shallow estuary. Sci. Total Environ. 2021, 788, 147863. [Google Scholar] [CrossRef]
- Cao, Y.; Tian, Y.; Yin, B.; Zhu, Z. Assessment of ammonia volatilization from paddy fields under crop management practices aimed to increase grain yield and N efficiency. Field Crops Research. 2013, 147, 23–31. [Google Scholar] [CrossRef]
- Moriyama, Y.; Sato, S. Effect of biochar application on suppression of ammonia volatilization from anaerobic digestion effluent mixed with soil as a nitrogen source. Wood Carbonization Res Soc. 2020, 17, 8–16. [Google Scholar]
- Zhang, Z.; Xu, Z.; Song, X.; Zhang, B.; Li, G.; Hu, N.; Luo, W. Membrane processes for resource recovery from anaerobically digested livestock manure effluent: opportunities and challenges. Curr Pollut Rep. 2020, 6, 123–136. [Google Scholar] [CrossRef]
- Bornø, M.L.; Müller-Stover, D.S.; Liu, F. Biochar modifies the content of primary metabolites in the rhizosphere of well-watered and drought-stressed Zea mays L. (maize). Biol. Fertil. Soils. 2022, 58, 633–647. [Google Scholar] [CrossRef]
- Ding, Z.; Zhou, Z.; Lin, X.; Zhao, F.; Wang, B.; Lin, F.; Ge, Y.; Eissa, M.A. Biochar impacts on NH3-volatilization kinetics and growth of sweet basil (Ocimum basilicum L.) under saline conditions. Ind. Crop. Prod 2020, 157, 112903. [Google Scholar] [CrossRef]
- Liu, K.; Ran, Q.; Li, F.; Shaheen, S.M.; Wang, H.; Rinklebe, J.; Liu, C.; Fang, L. Carbon-based strategy enables sustainable remediation of paddy soils in harmony with carbon neutrality. Carbon Res. 2022, 1, 12. [Google Scholar] [CrossRef]
- Tao, W.; Ukwuani, A. T. Coupling thermal stripping and acid absorption for ammonia recovery from dairy manure: Ammonia volatilization kinetics and effects of temperature, pH and dissolved solids content. Chemical Engineering Journal. 2015, 280, 188–196. [Google Scholar] [CrossRef]
- Maqbool, T.; Ly, Q.V.; Asif, M.B.; Ng, H.Y.; Zhang, Z. Fate and role of fluorescence moieties in extracellular polymeric substances during biological wastewater treatment: A review. Sci. Total Environ. 2020, 718, 137291. [Google Scholar] [CrossRef]
Scheme 1.
Experimental device for ammonia volatilization absorption.
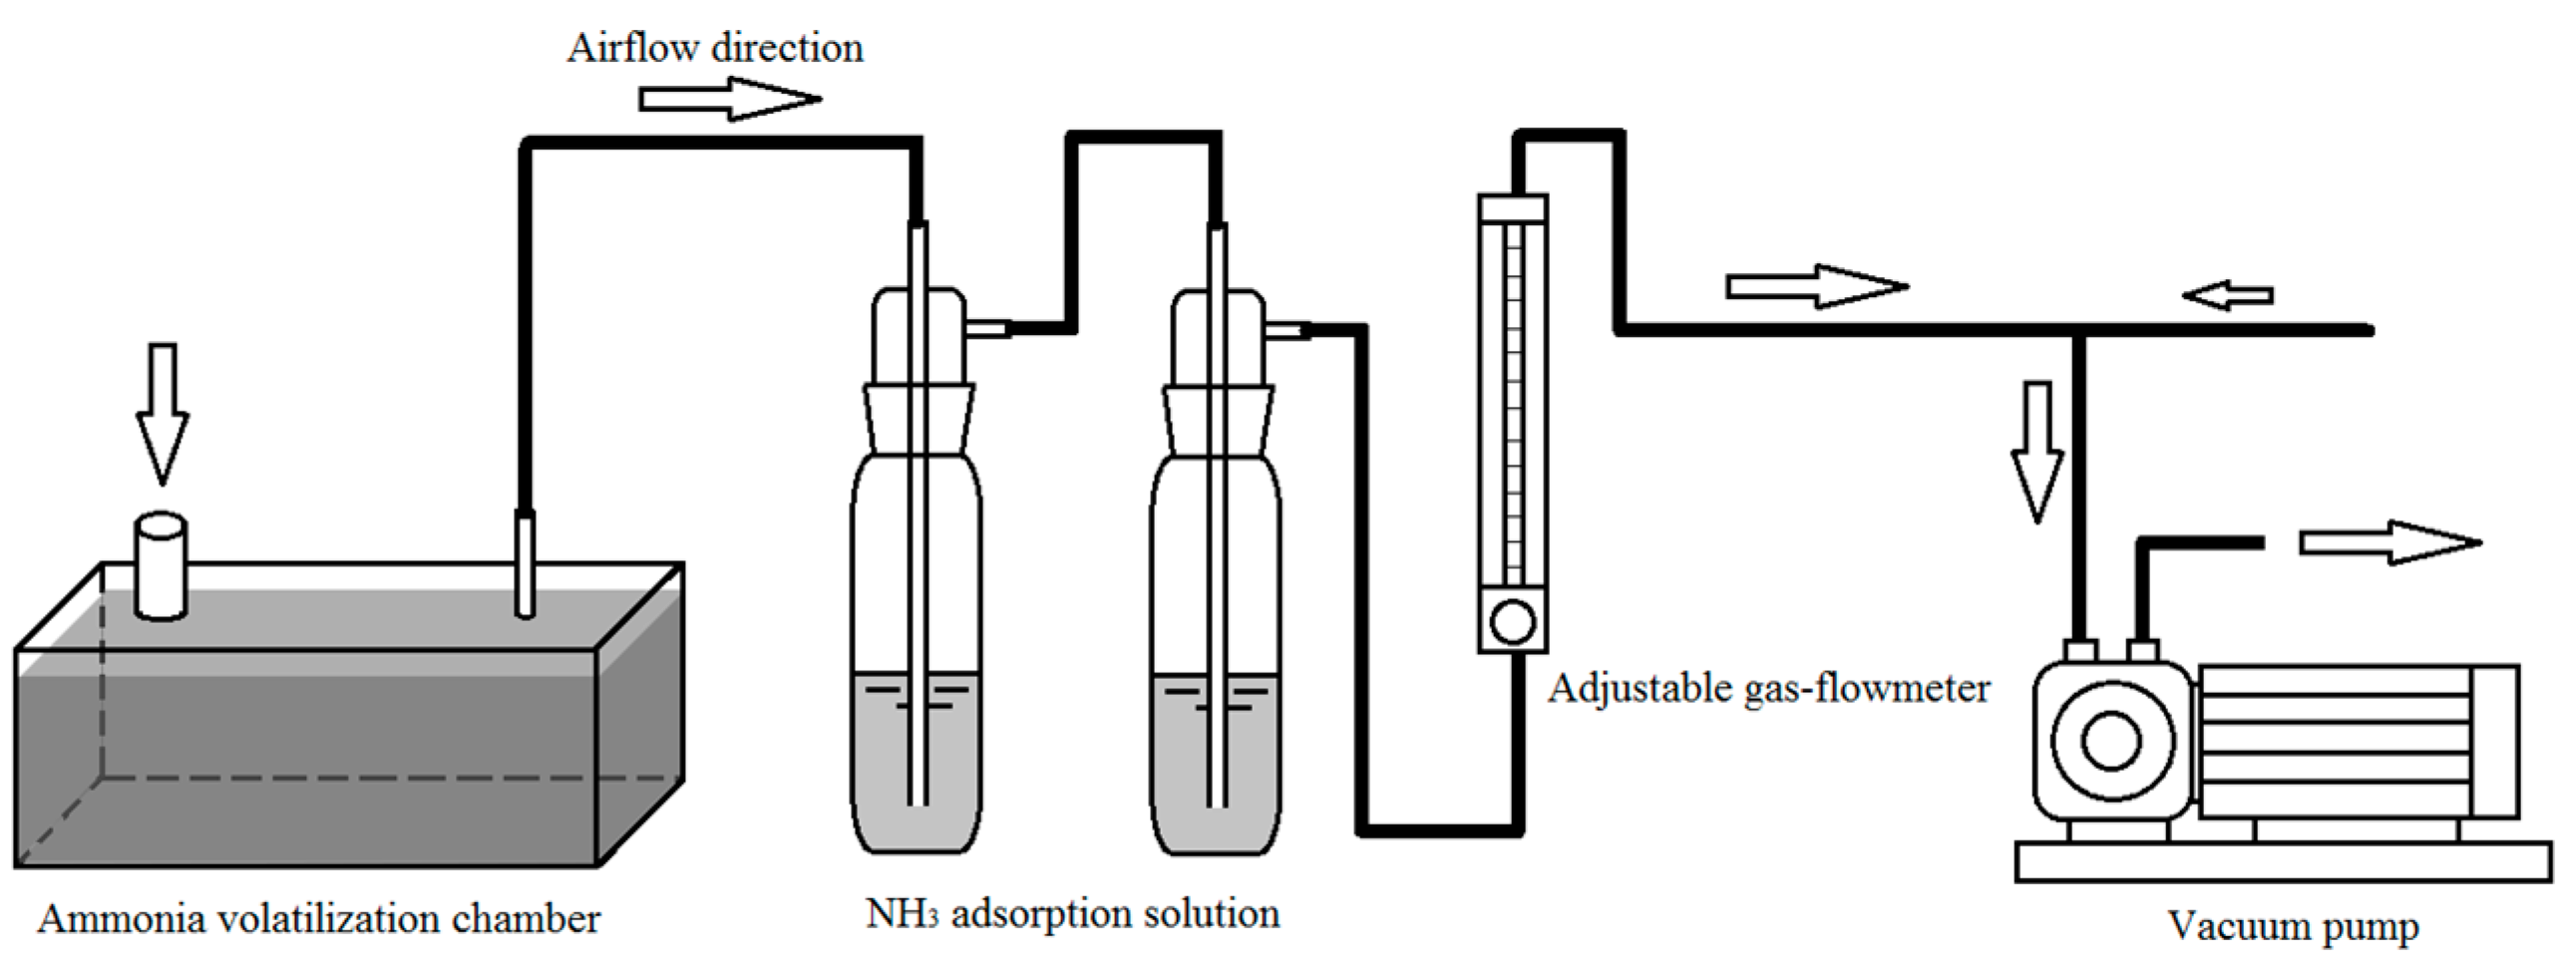
Figure 1.
The amount of ammonia volatilization of SAB and SDP with different pumping rates.
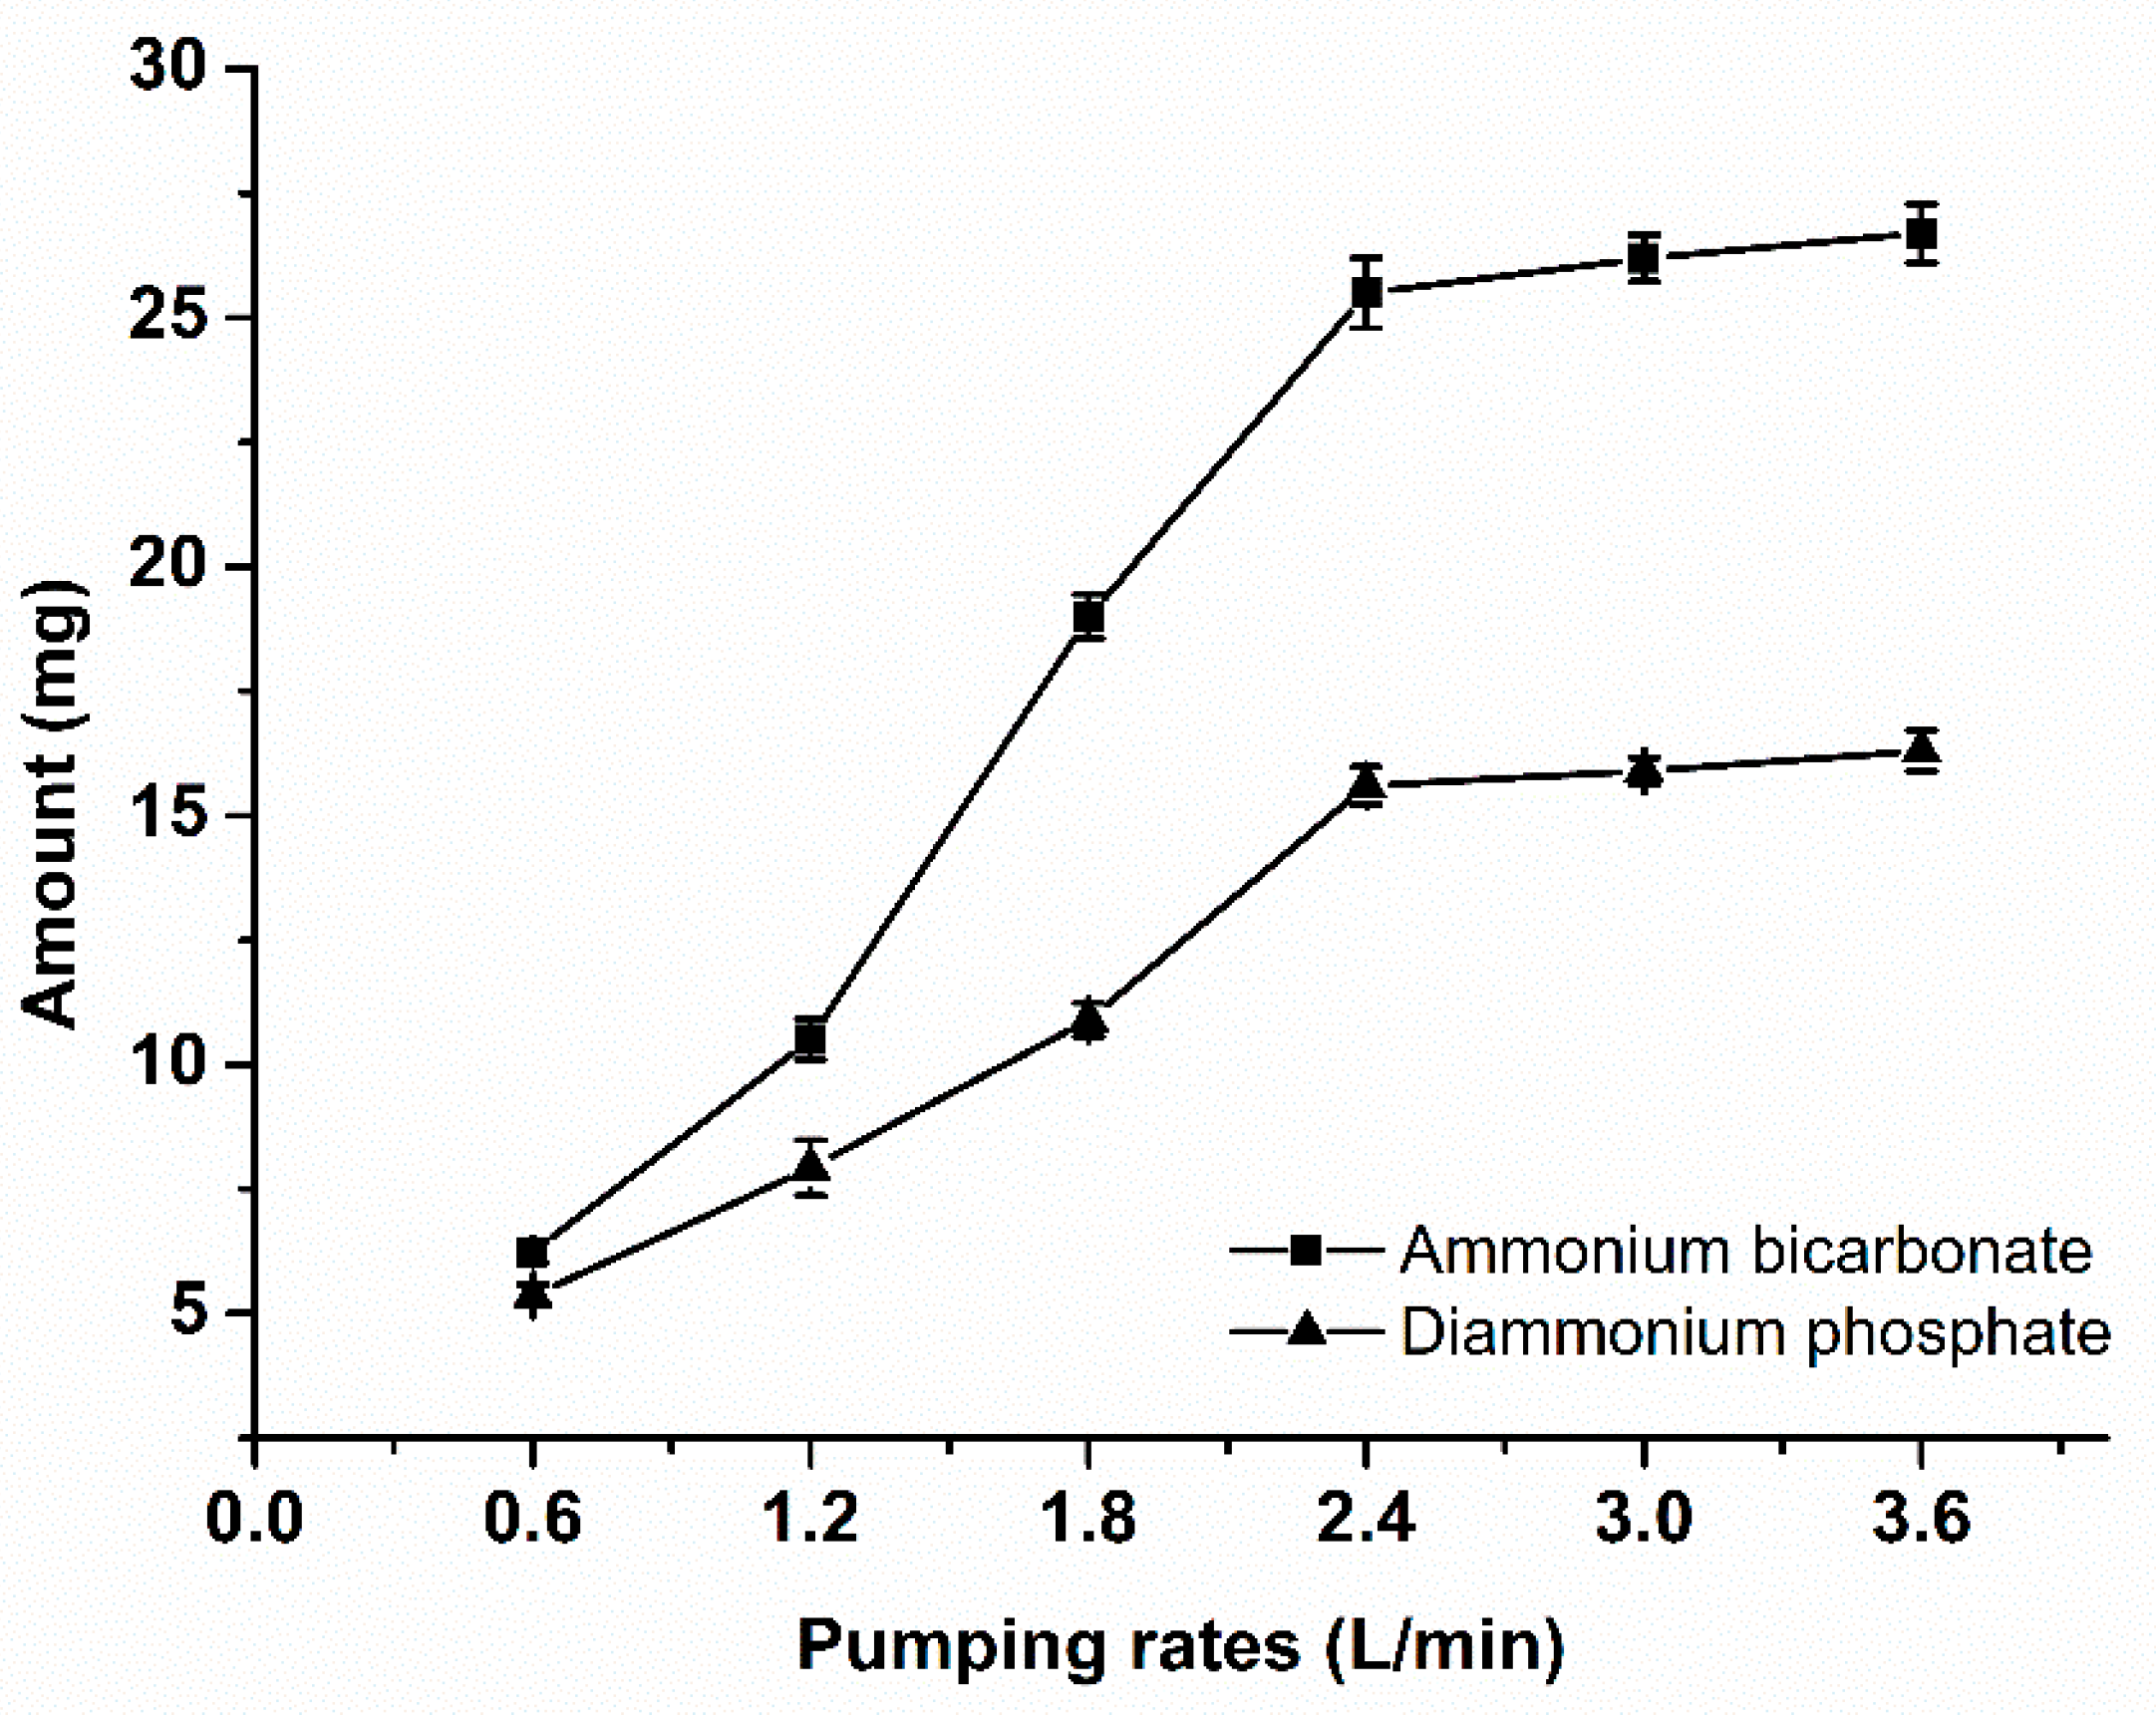
Figure 2.
The fluxes of ammonia volatilization of SAB under different temperature and pH levels.
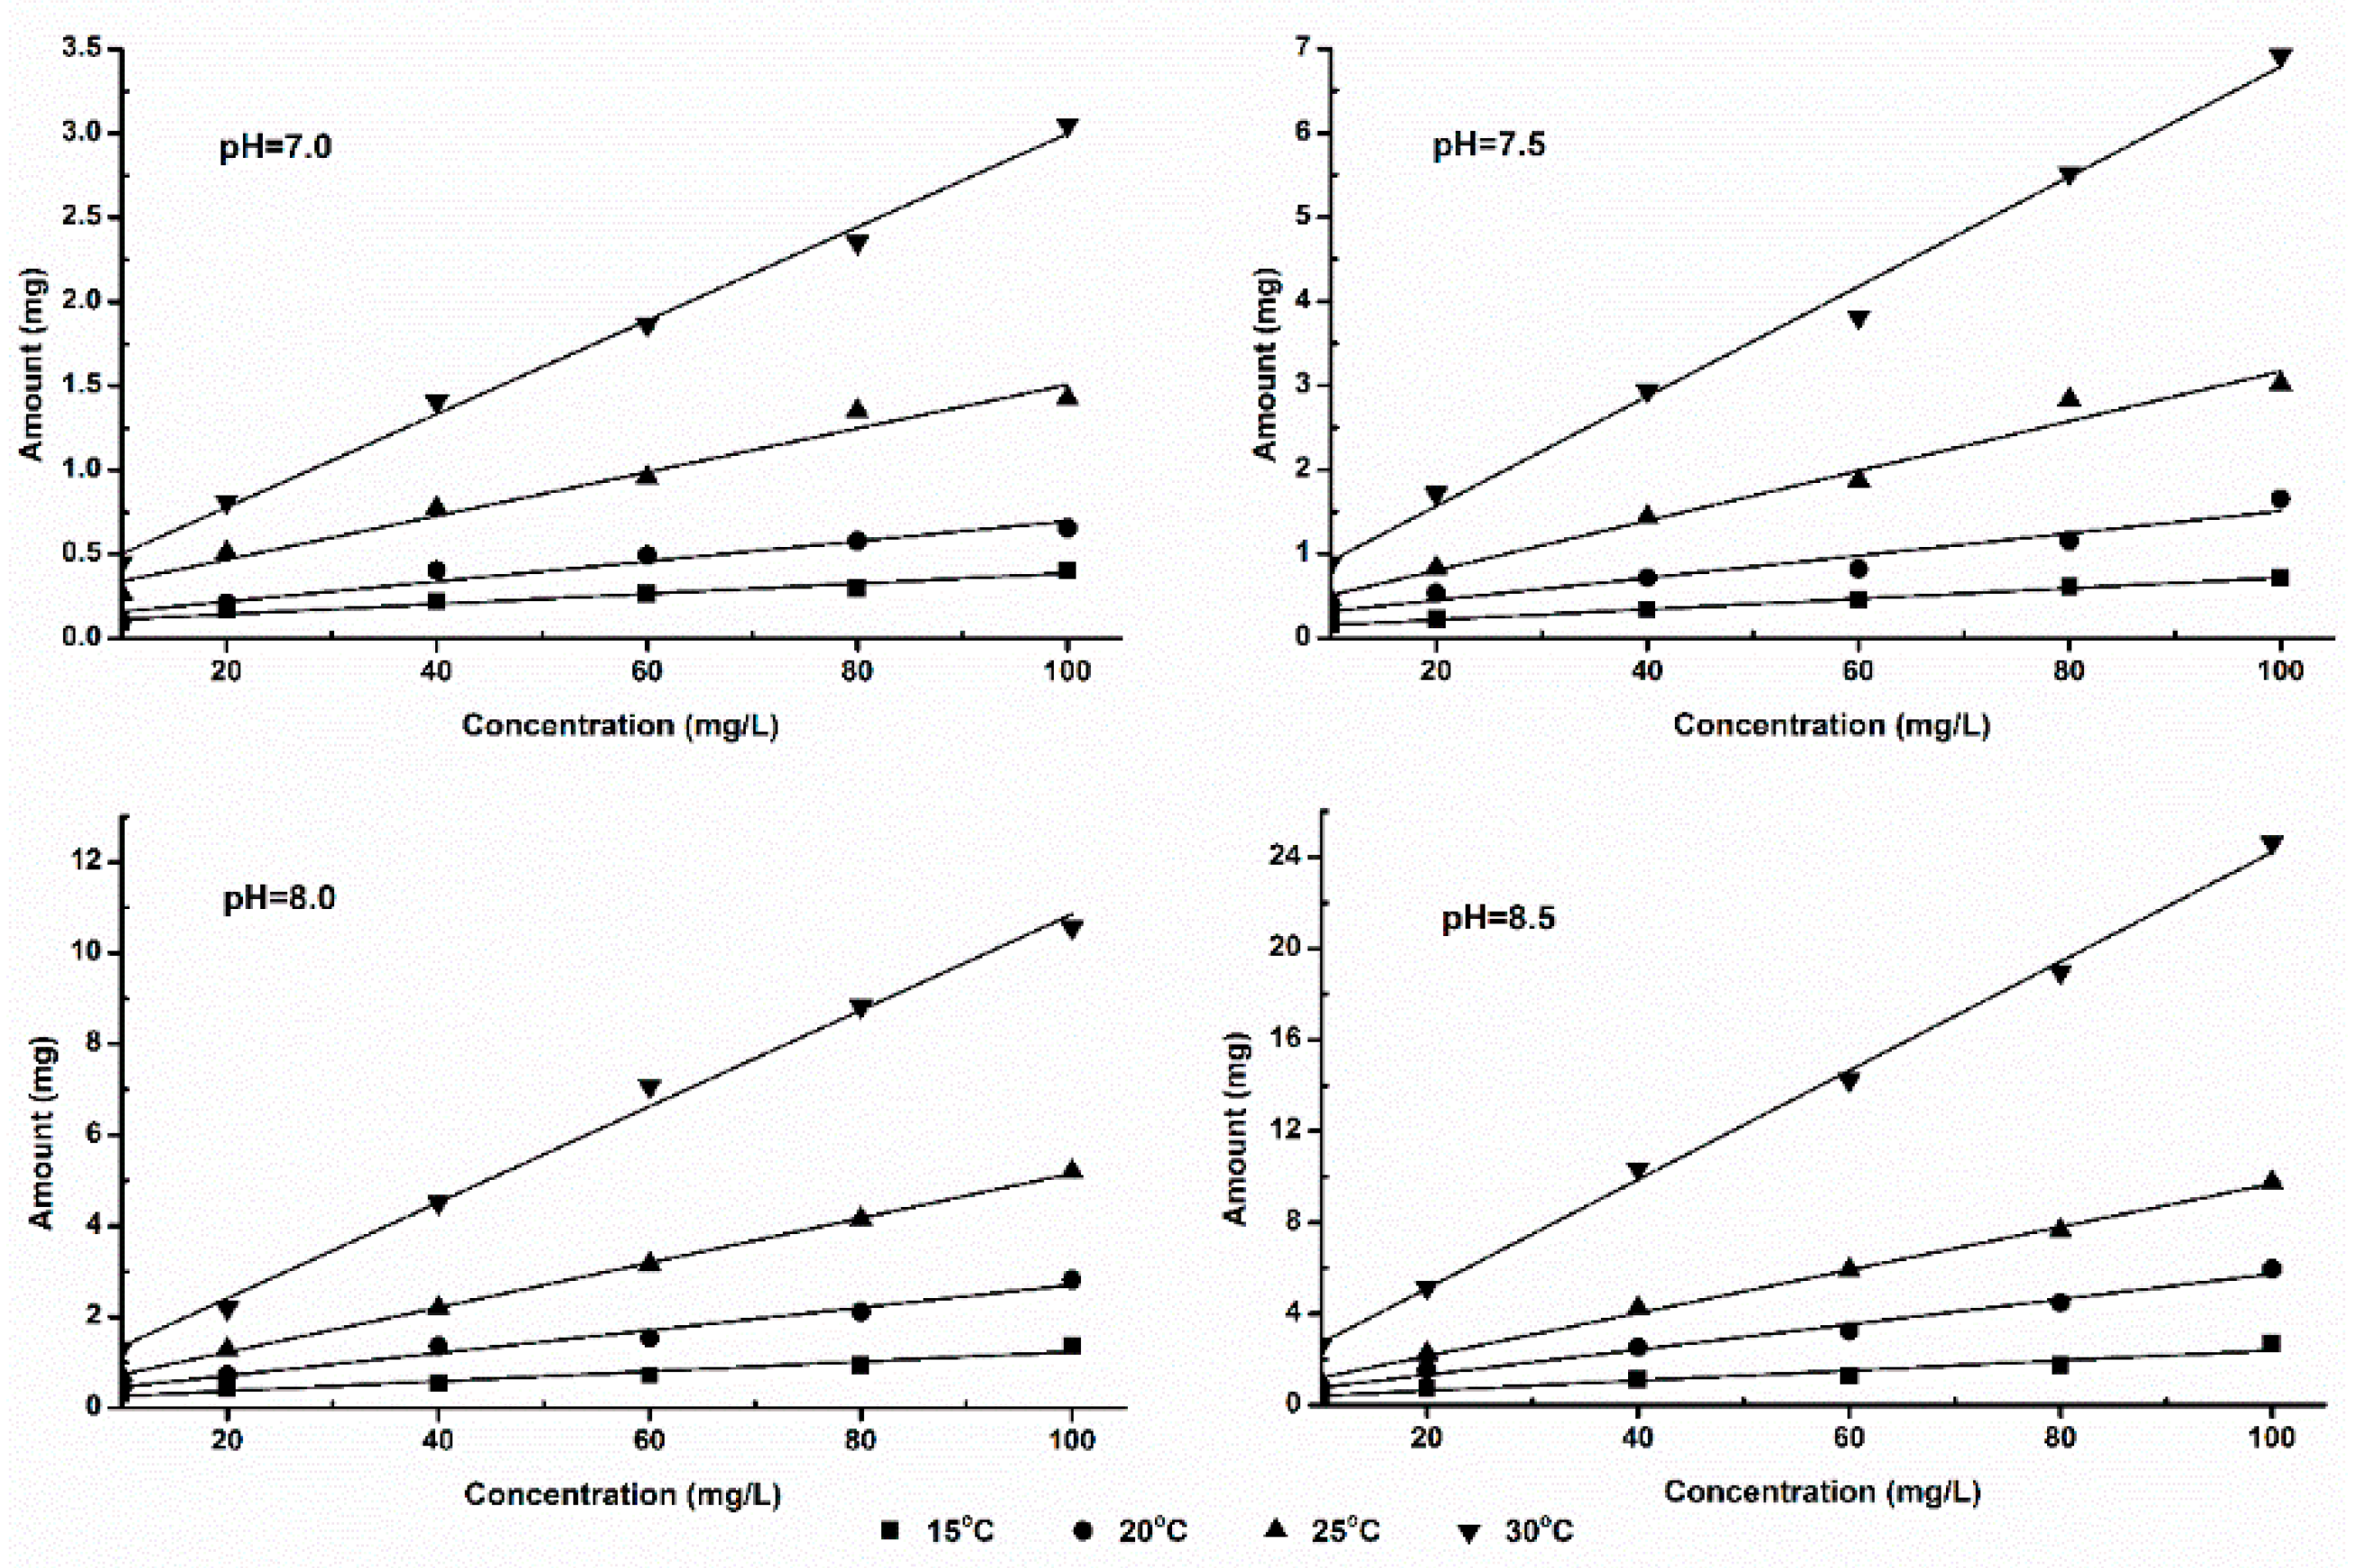
Figure 3.
The fluxes of ammonia volatilization of SDP under different temperature and pH levels.
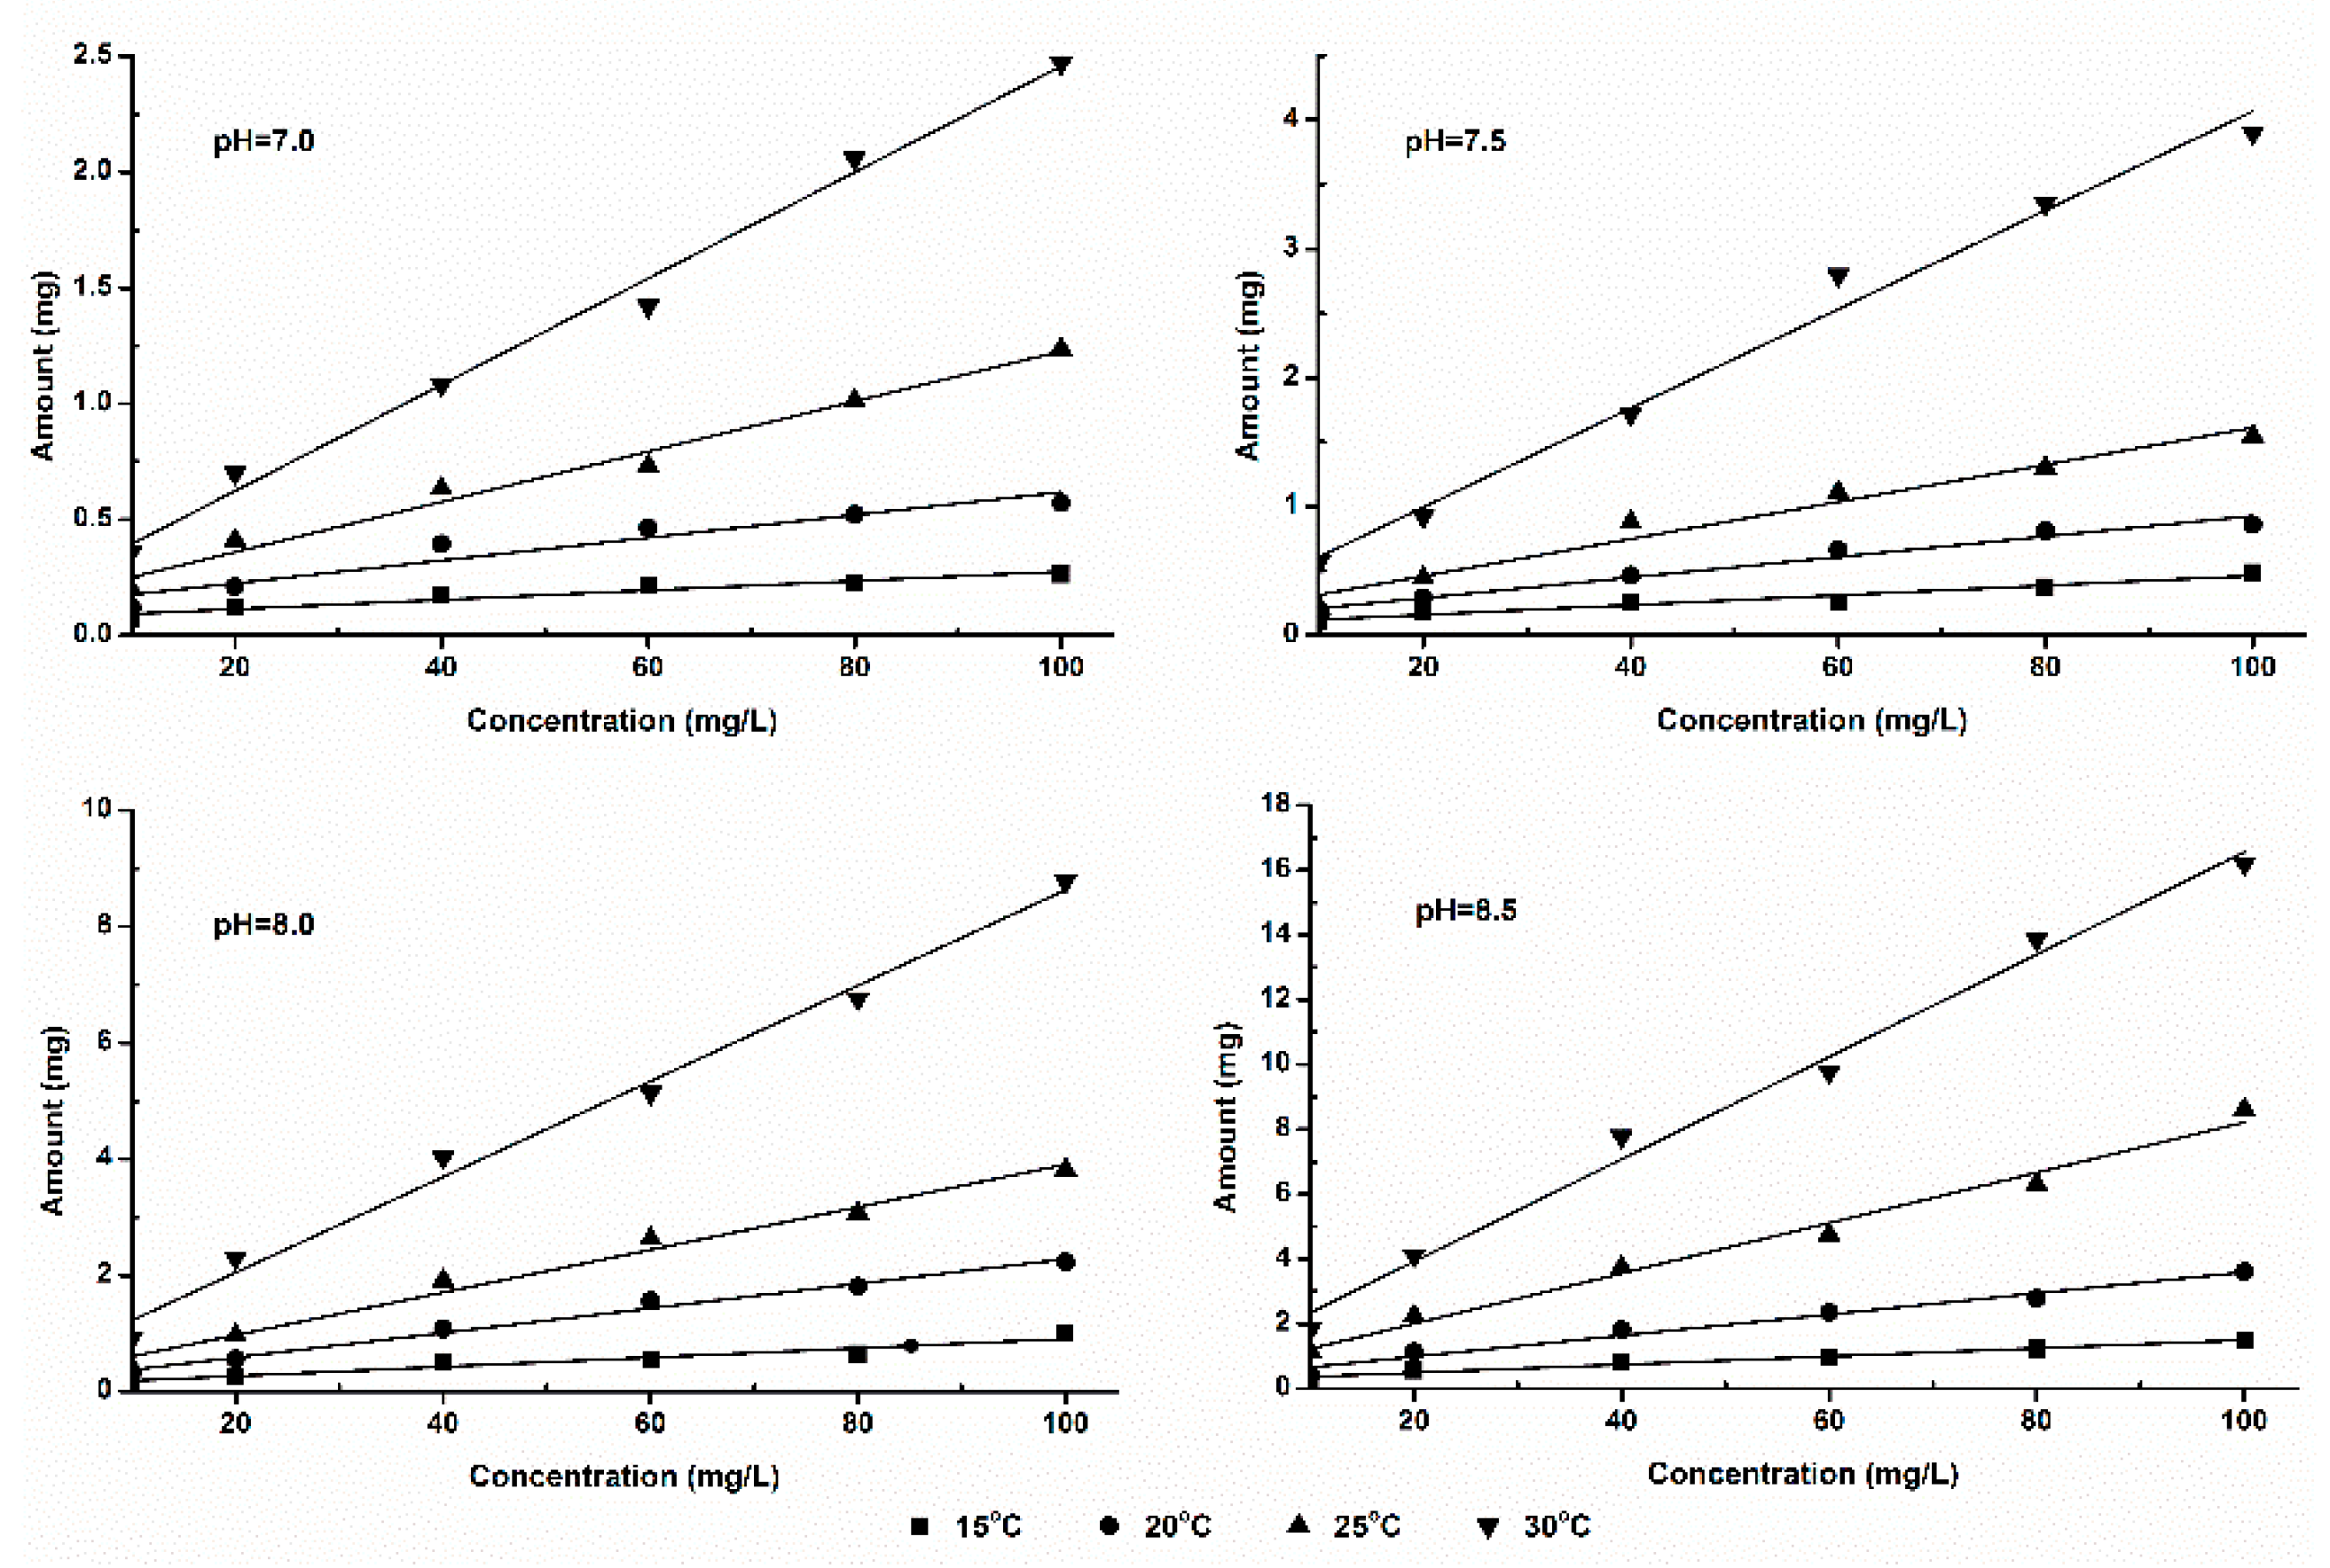
Figure 4.
The fitting curve of CIF and IAVF with temperature (SAB).
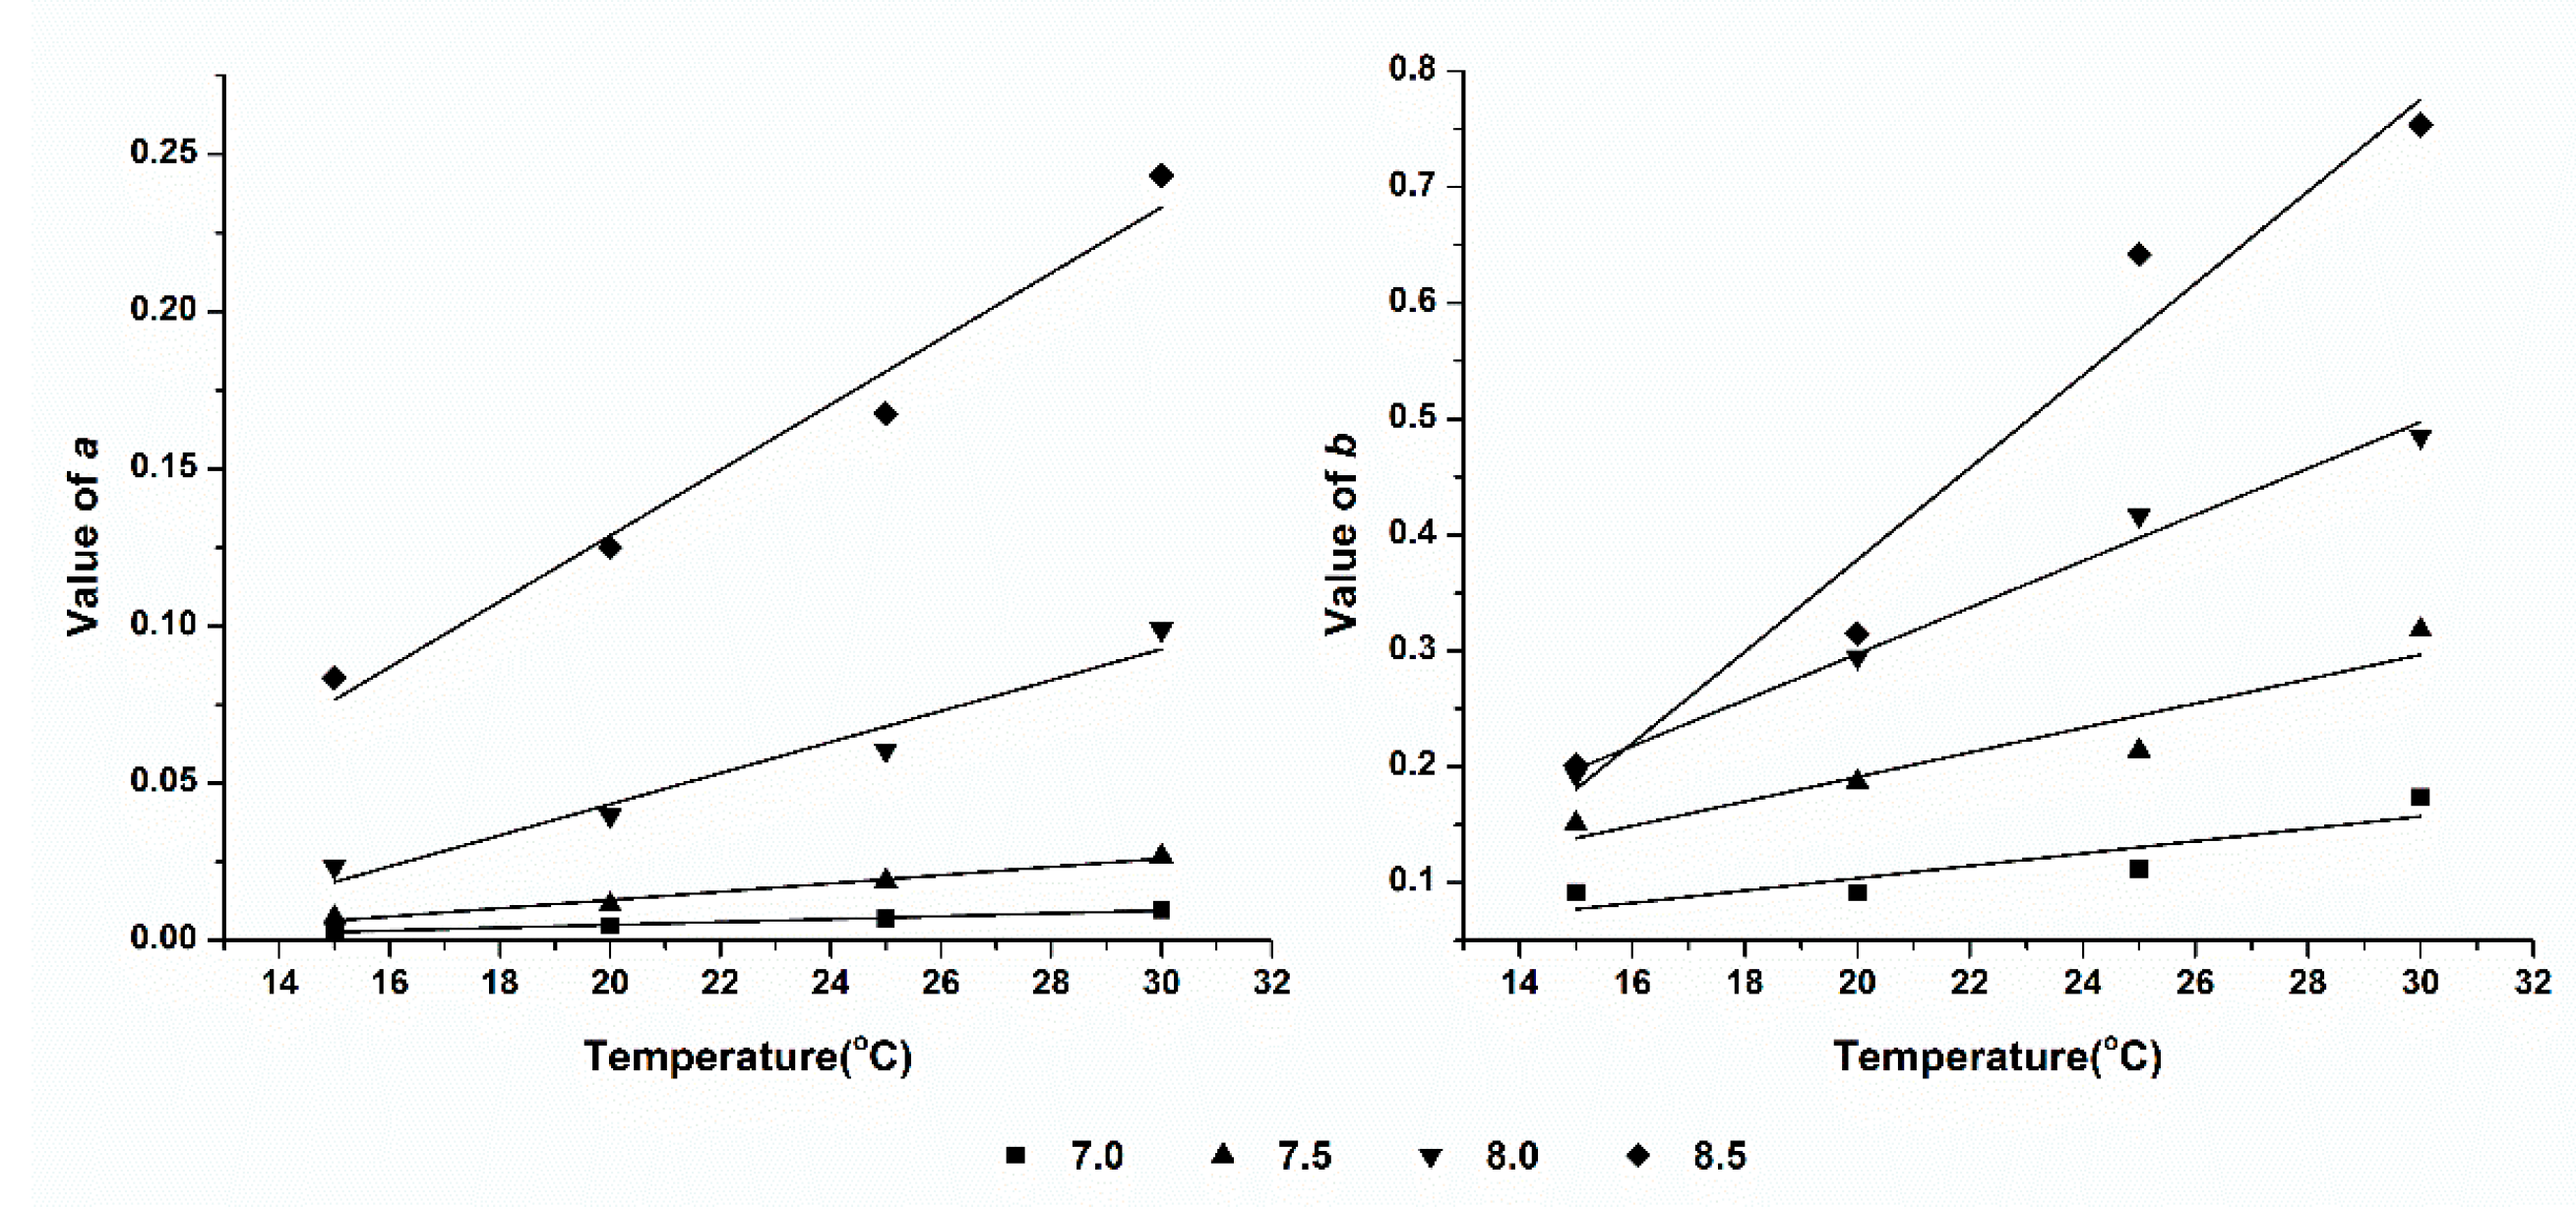
Figure 5.
The fitting curve of CIF and IAVF with temperature (SDP).
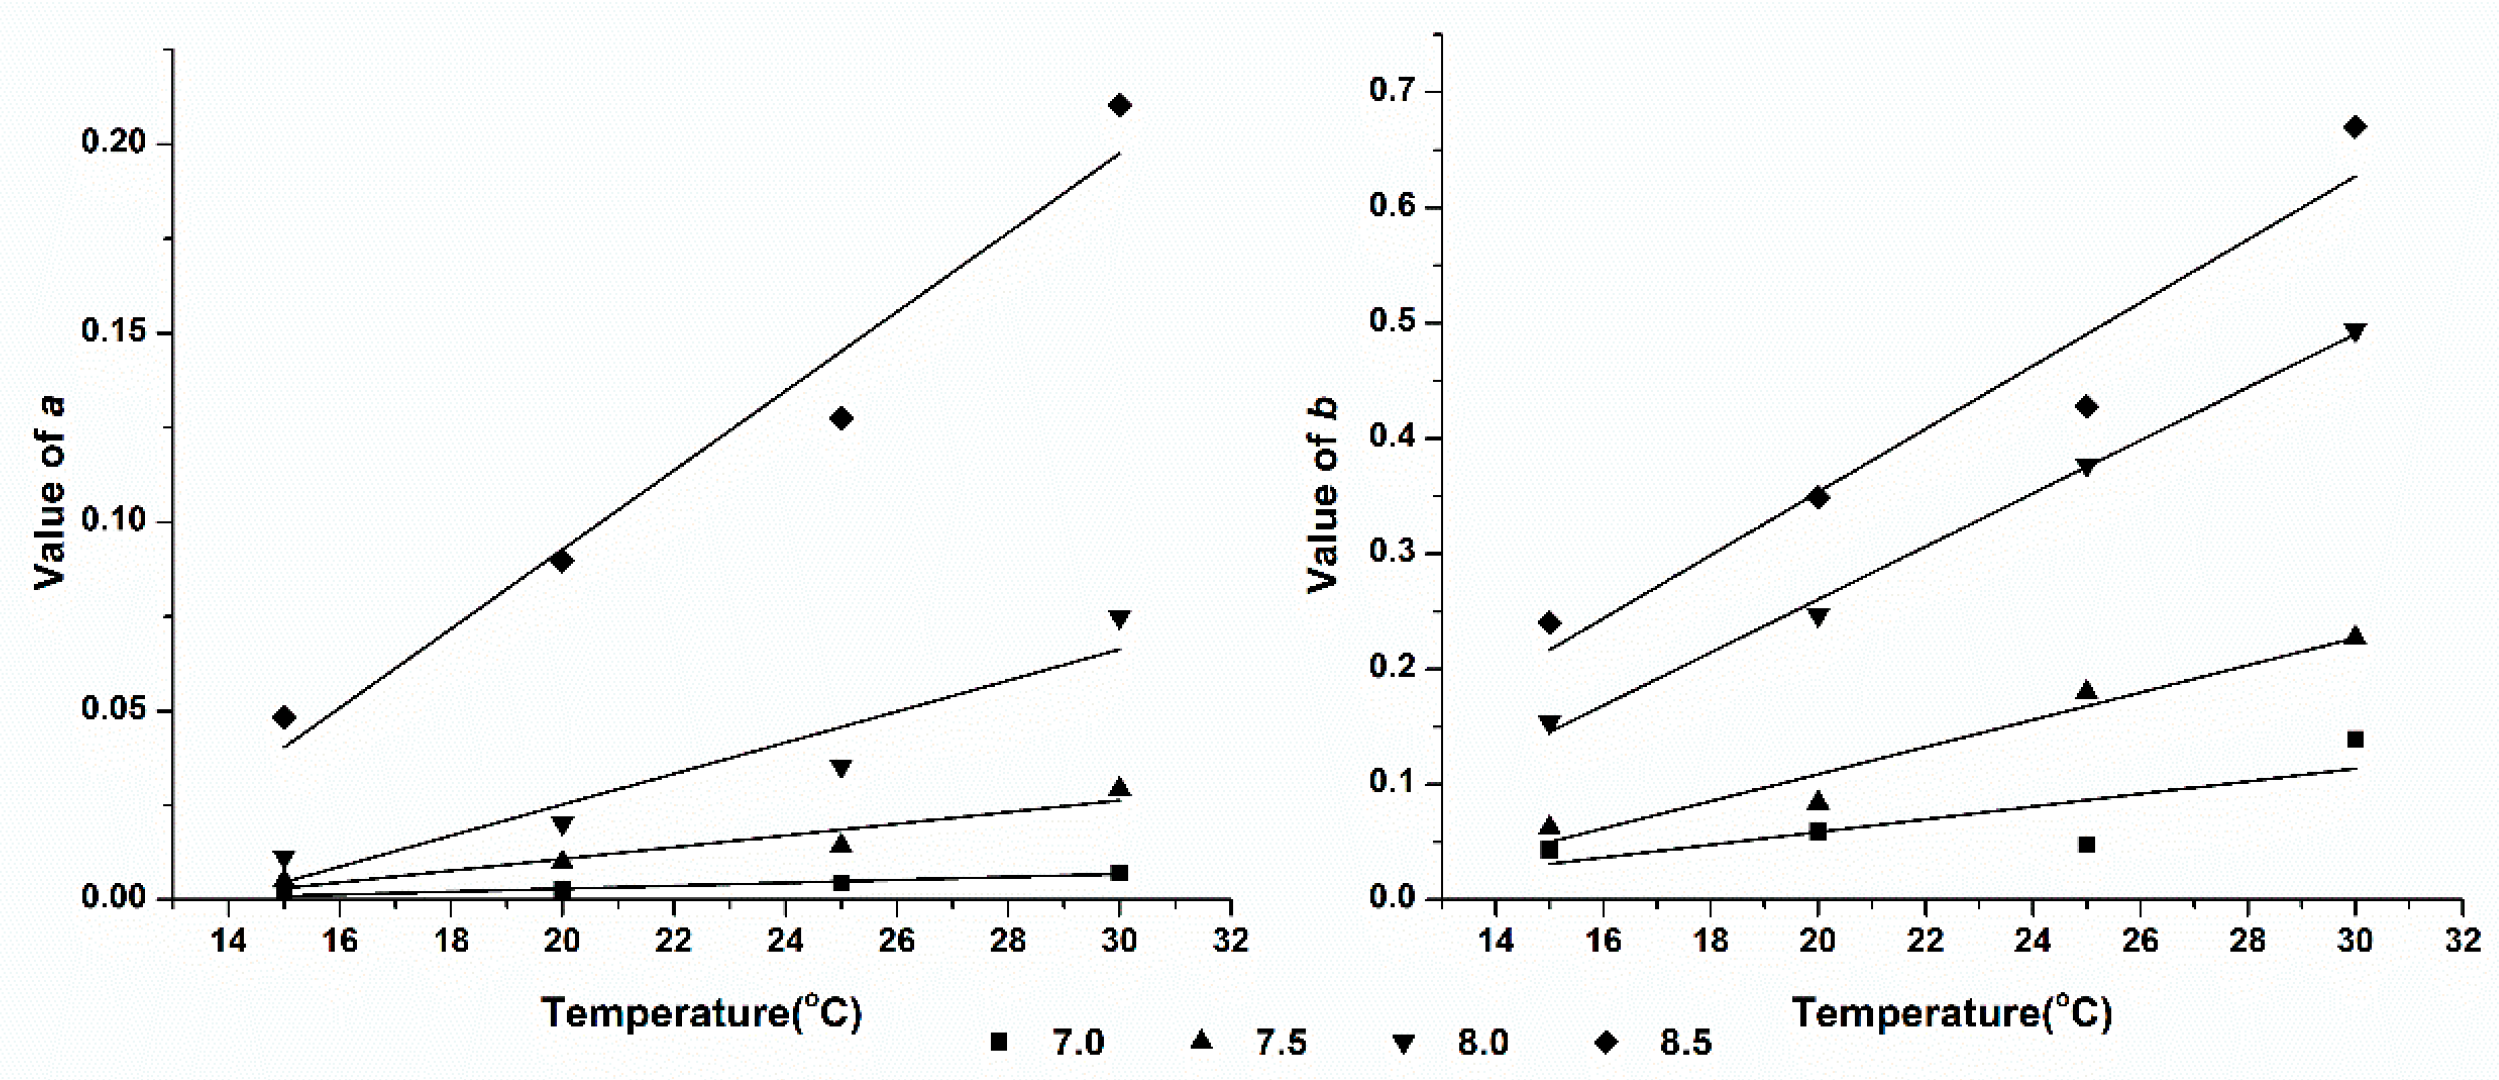
Figure 6.
The 3D fitting curve of temperature, pH on CIF and IAVF (SAB).
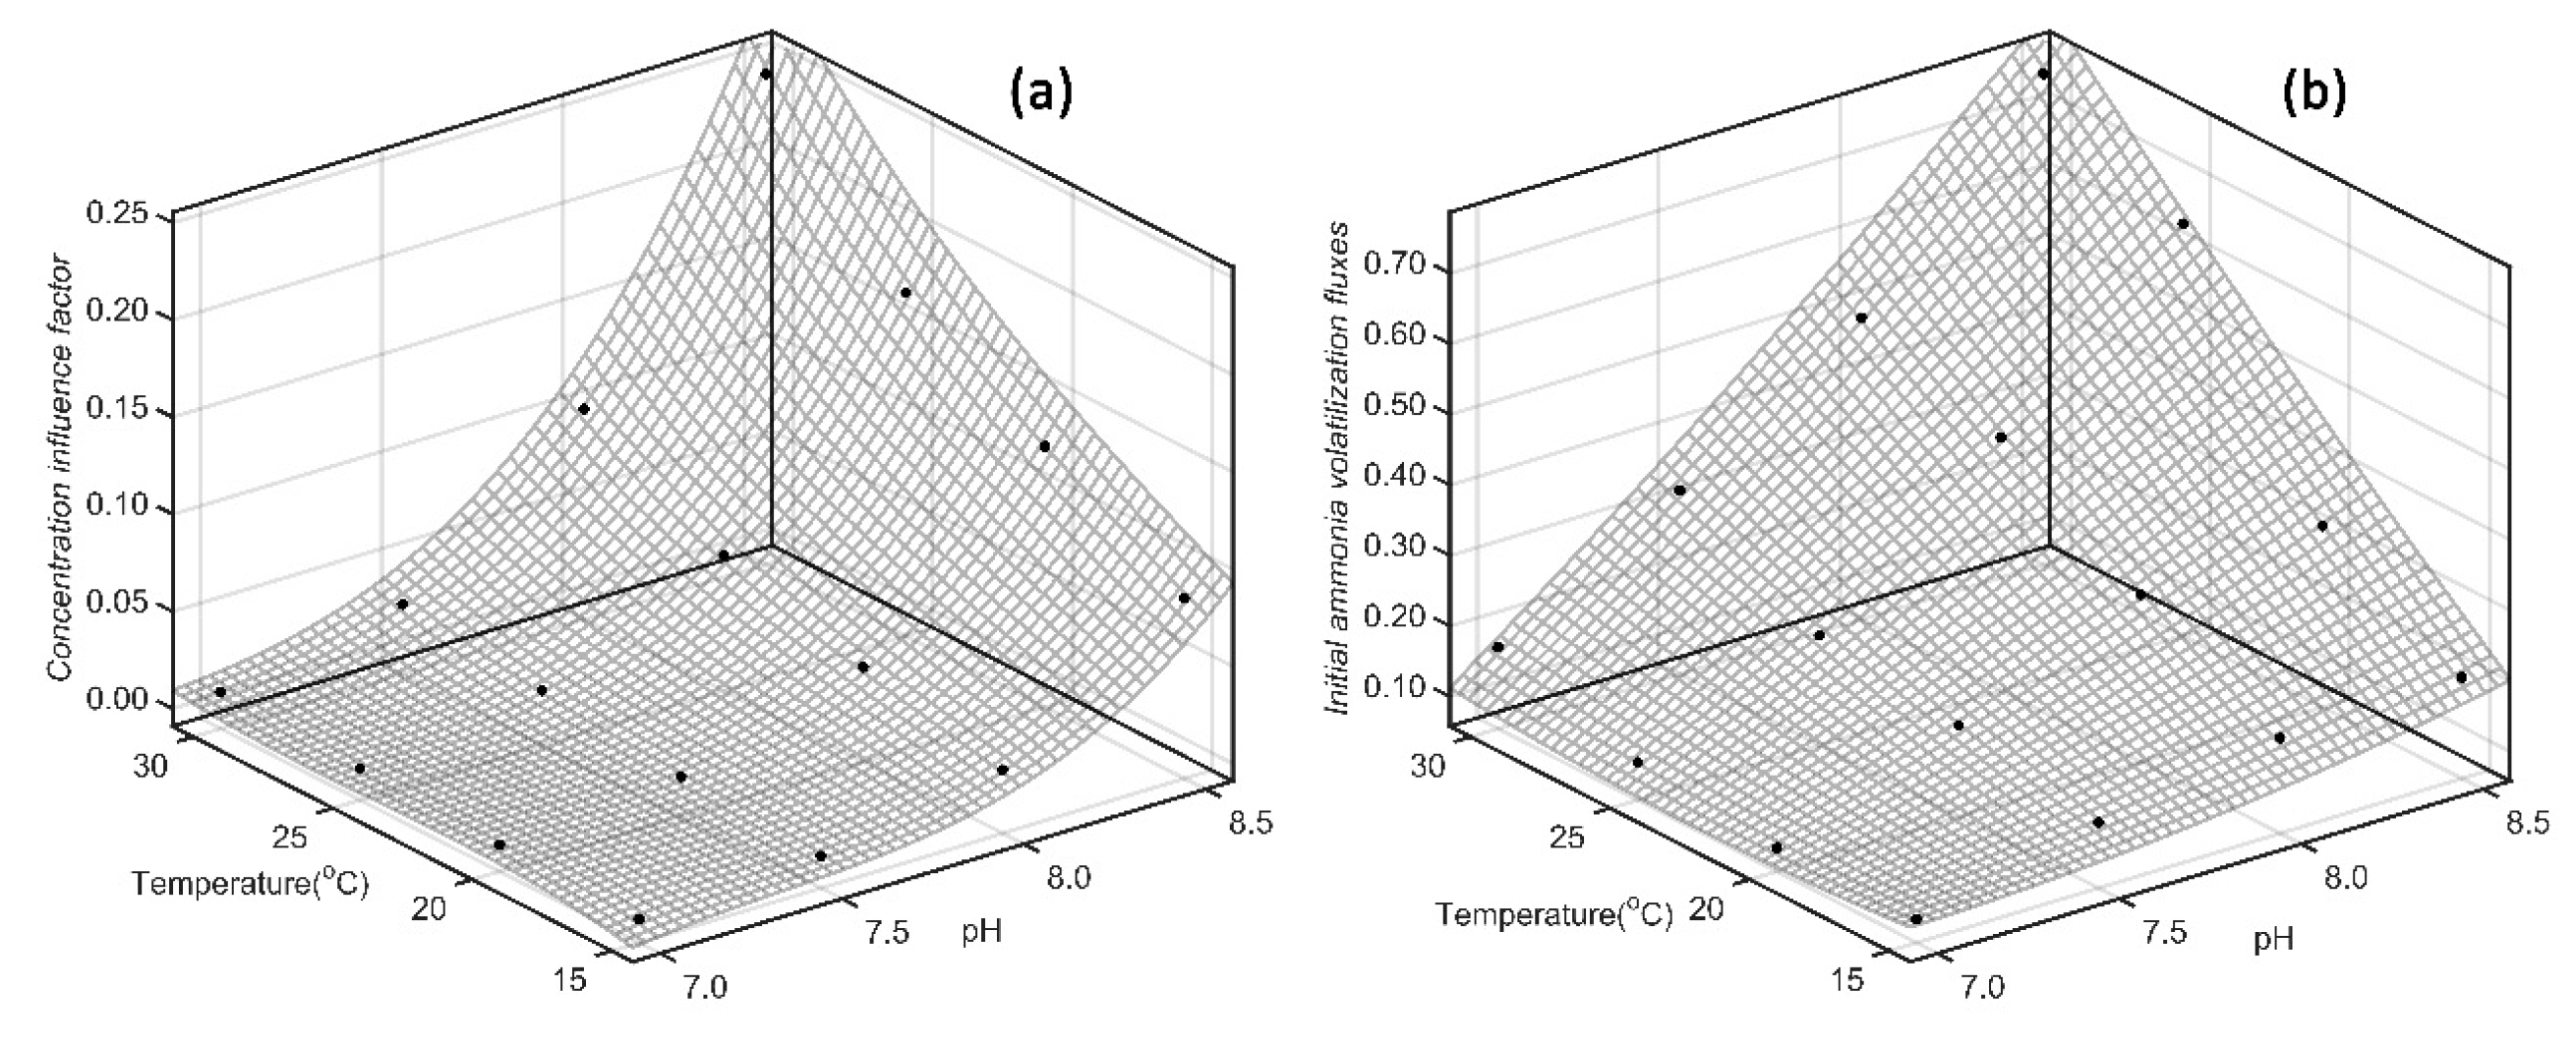
Figure 7.
The 3D fitting curve of temperature, pH on CIF and IAVF (SDP).
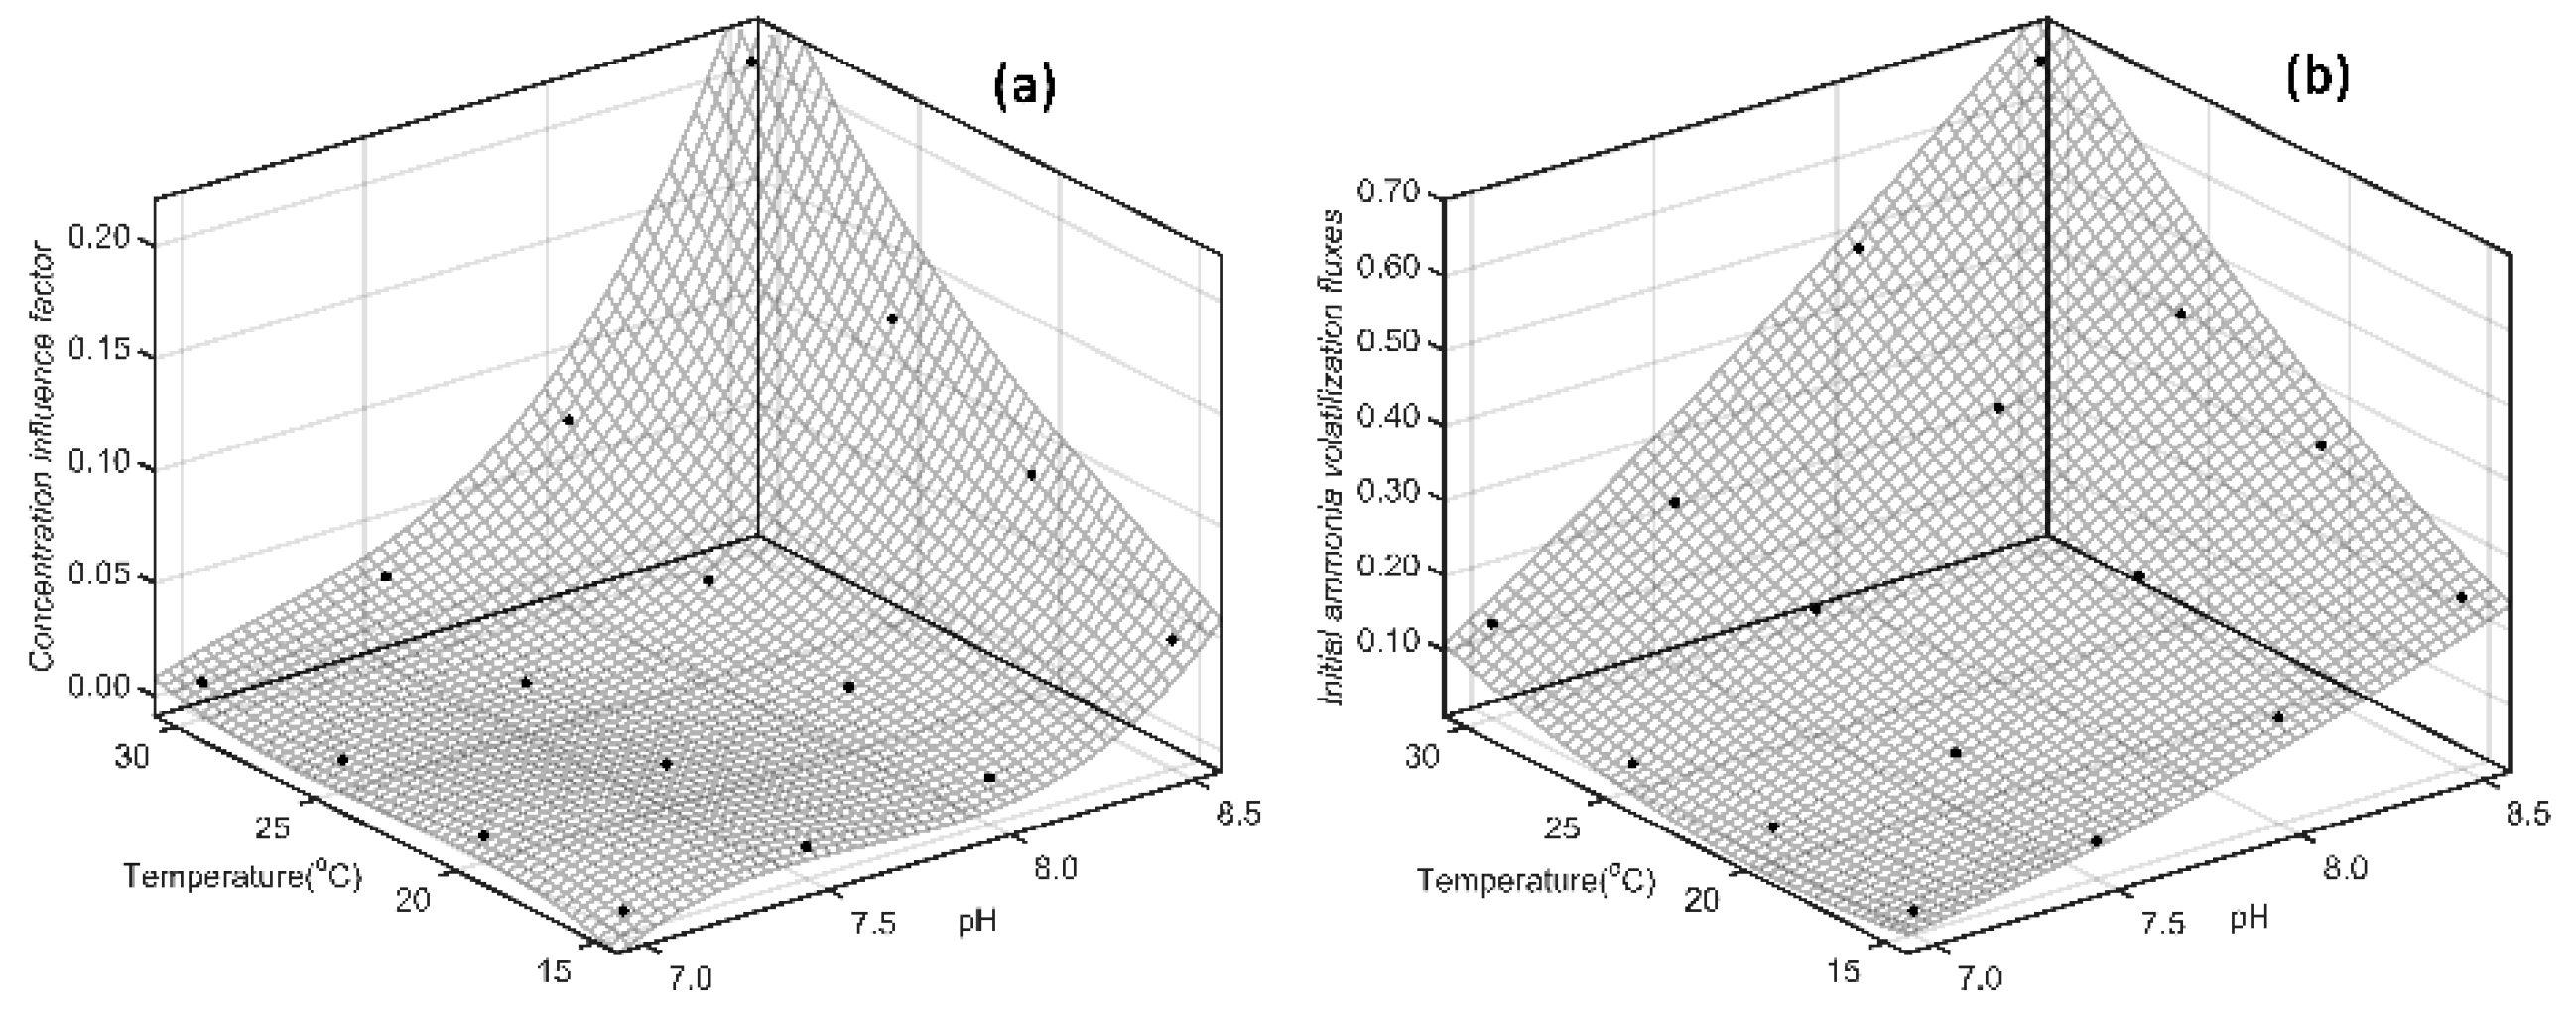

Table 1.
The regression coefficients between ammonia volatilization fluxes and ammonia concentration (SAB and SDP).
Table 1.
The regression coefficients between ammonia volatilization fluxes and ammonia concentration (SAB and SDP).
| pH |
Temperature (oC) |
SAB | pH |
Temperature (oC) |
SDP | ||||
| a | b | R2 | a | b | R2 | ||||
| 7.0 | 15 | 0.0030 | 0.0915 | 0.9214 | 7.0 | 15 | 0.0012 | 0.0433 | 0.8932 |
| 20 | 0.0046 | 0.0913 | 0.9664 | 20 | 0.0026 | 0.0591 | 0.9314 | ||
| 25 | 0.0070 | 0.1118 | 0.9727 | 25 | 0.0044 | 0.0477 | 0.9877 | ||
| 30 | 0.0098 | 0.1735 | 0.9513 | 30 | 0.0071 | 0.1393 | 0.9549 | ||
| 7.5 | 15 | 0.0074 | 0.1510 | 0.9651 | 7.5 | 15 | 0.0050 | 0.0623 | 0.9363 |
| 20 | 0.0114 | 0.1870 | 0.9718 | 20 | 0.0099 | 0.0843 | 0.9759 | ||
| 25 | 0.0190 | 0.2138 | 0.9779 | 25 | 0.0143 | 0.1801 | 0.9668 | ||
| 30 | 0.0268 | 0.3183 | 0.9839 | 30 | 0.0294 | 0.2273 | 0.9659 | ||
| 8.0 | 15 | 0.0235 | 0.1931 | 0.9456 | 8.0 | 15 | 0.0114 | 0.1539 | 0.9527 |
| 20 | 0.0397 | 0.2949 | 0.9650 | 20 | 0.0202 | 0.2471 | 0.9650 | ||
| 25 | 0.0606 | 0.4168 | 0.9789 | 25 | 0.0354 | 0.3770 | 0.9712 | ||
| 30 | 0.0990 | 0.4854 | 0.9869 | 30 | 0.0749 | 0.4938 | 0.9861 | ||
| 8.5 | 15 | 0.0836 | 0.2014 | 0.9537 | 8.5 | 15 | 0.0483 | 0.2405 | 0.9495 |
| 20 | 0.1251 | 0.3148 | 0.9602 | 20 | 0.0897 | 0.3491 | 0.9799 | ||
| 25 | 0.1675 | 0.6422 | 0.9863 | 25 | 0.1274 | 0.4277 | 0.9904 | ||
| 30 | 0.2434 | 0.7535 | 0.9897 | 30 | 0.2103 | 0.6705 | 0.9756 | ||
Table 2.
The regression equations between temperature and the value of a and b (a=αT+β, b=γT+δ).
| Fertilizer | pH | Regression Equation | |||
| Value of a | R2 | Value of b | R2 | ||
| SAB | 7.0 | =0.0005T-0.0042 | 0.9792 | =0.0053T-0.0029 | 0.6763 |
| 7.5 | =0.0013T-0.0134 | 0.9716 | =0.0106T-0.0204 | 0.8502 | |
| 8.0 | =0.0049T-0.0555 | 0.9381 | =0.0200T-0.1020 | 0.9837 | |
| 8.5 | =0.0104T-0.0799 | 0.9625 | =0.0397T-0.4147 | 0.9326 | |
| SDP | 7.0 | =0.0004T-0.00492 | 0.9625 | =0.0055T-0.0521 | 0.4384 |
| 7.5 | =0.0016T-0.02025 | 0.8546 | =0.0118T-0.1273 | 0.9258 | |
| 8.0 | =0.0041T-0.05713 | 0.8409 | =0.0230T-0.1994 | 0.9940 | |
| 8.5 | =0.0105T-0.11673 | 0.9423 | =0.0274T-0.1940 | 0.9042 | |
Table 3.
The regression equations between pH and the value of a and b (a=εpH2+ζpH+η, b=θpH+ι).
| Fertilizer | Temperature(oC) | Regression Equation | |||
| Value of a | R2 | Value of b | R2 | ||
| SAB | 15 | =0.0557pH2-0.8114pH+2.9564 | 0.9624 | =0.0744pH-0.4170 | 0.8679 |
| 20 | =0.0785 pH2-1.1385pH+4.1306 | 0.9794 | =0.1557pH-0.9846 | 0.9099 | |
| 25 | =0.0950 pH2-1.3679pH+4.9289 | 0.9880 | =0.3589pH-2.4349 | 0.9626 | |
| 30 | =0.1274 pH2-1.8207pH+6.5112 | 0.9987 | =0.3814pH-2.5234 | 0.9668 | |
| SDP | 15 | =0.0332 pH2-0.4846pH+1.7695 | 0.9166 | =0.1366pH-0.9338 | 0.9126 |
| 20 | =0.0623 pH2-0.9111pH+3.331 | 0.9019 | =0.2066pH-1.4163 | 0.9091 | |
| 25 | =0.0822 pH2-1.195pH+4.3490 | 0.9437 | =0.2674pH-1.8144 | 0.9375 | |
| 30 | =0.1132 pH2-1.6235pH+5.8283 | 0.9733 | =0.3721pH-2.5007 | 0.9532 | |
Table 4.
Fitting equations of quantitative relationship between temperature, pH and CIF (a).
| Fertilizers | Model types | Fitting equation | R2 |
| SAB | Binary | =-0.7915+ 0.09719pH + 0.004289T | 0.7755 |
| Binary quadratic | =5.779-1.436pH-0.05468T+0.08915pH2+0.006714pH·T+0.000154T2 | 0.9772 | |
| Binary cubic | =-20.01+7.513pH+0.3245T-0.9496pH2-0.07564pH·T-0.002611T2+0.0402pH3 +0.004628pH2·T + 0.000236pH·T2 +0.00001387T3 | 0.9980 | |
| SDP | Binary | =-0.6173+0.07323pH+0.004133T | 0.6681 |
| Binary quadratic | =4.966-1.2pH-0.05615T+0.07263pH2+0.006563pH·T+0.0002093T2 | 0.9447 | |
| Binary cubic | =-35.71+13.35pH+0.3913T-1.676pH2-0.08671pH·T-0.003744T2+ 0.07017pH3+0.005198pH2·T+0.0002822pH·T2+0.00002617T3 | 0.9946 |
Table 5.
Fitting equations of quantitative relationship between temperature, pH and IAVF (b).
| Fertilizers | Model types | Fitting equation | R2 |
| SAB | Binary | =-2.015+0.2426pH+0.01889T | 0.7999 |
| Binary quadratic | =3.80-0.7272pH-0.1661T+0.02993pH2+0.02249pH·T+0.0002378T2 | 0.9510 | |
| Binary cubic | =5.812-2.943pH+0.2989T+0.6076pH2-0.1751pH·T+0.0137T2-0.03883pH3+0.01445pH2·T-0.0005874pH·T2-0.000132T3 | 0.9608 | |
| SDP | Binary | =-2.047+0.2457pH+0.01693T | 0.8708 |
| Binary quadratic | =3.197-0.6862pH-0.1311T+0.03785pH2+0.01534pH·T+0.000647T2 | 0.9588 | |
| Binary cubic | =120.1-46.4pH-0.04929T+5.932pH2+0.02923pH·T-0.005468T2-0.2517pH3-0.001904pH2·T+0.0003472pH·T2 +0.00005073T3 | 0.9708 |
Disclaimer/Publisher’s Note: The statements, opinions and data contained in all publications are solely those of the individual author(s) and contributor(s) and not of MDPI and/or the editor(s). MDPI and/or the editor(s) disclaim responsibility for any injury to people or property resulting from any ideas, methods, instructions or products referred to in the content. |
© 2024 by the authors. Licensee MDPI, Basel, Switzerland. This article is an open access article distributed under the terms and conditions of the Creative Commons Attribution (CC BY) license (http://creativecommons.org/licenses/by/4.0/).
Copyright: This open access article is published under a Creative Commons CC BY 4.0 license, which permit the free download, distribution, and reuse, provided that the author and preprint are cited in any reuse.


