
Submitted:
17 October 2024
Posted:
18 October 2024
You are already at the latest version
Abstract
(1) Background: Mycobacterium avium subsp. paratuberculosis (MAP) is a bacterium that causes paratuberculosis disease. One of its proteins, MAP3773c, is involved in iron metabolism and acts as a transcription factor. Our goal is to investigate the binding of the MAP3773c protein in 2 sites of the chromatin of the ferroportin1 gene of mouse macrophages J774 A.1. (2) Methods: We performed a sequence alignment, then a docking, then EMSA to analyze in vitro the binding of MAP3773c, then we performed the cloning of map3773c in pCDNA3.1 to perform transfection in macrophages, then we performed the expression by Western blotting and PCR in real time then a CHiP of transfected macrophages. (3) Results: Our results showed in silico that MAP3773c binds to two boxes in the FPN1 coding sequence, by EMSA, MAP3773c is glued at 2 sites: EBOX and MBOX, equally with iron, zinc or EDTA. In CHiP, we also determined the binding of MAP3773c in the chromatin of FPN1 by PCR amplifying the chromatin fragment. (4) Conclusions: Our in silico, in vitro and in vivo study showed that MAP3773c binds to FPN1. Overall, our study provides information on the role of MAP3773c and its effect on host iron transport.
Keywords:
MAP3773c
; Ferroportin1
; Transcription factor
; Transcription regulation
1. Introduction
Ferroportin1 (FPN1) is a protein that is so far known as the only one through which iron leaves the cells that contain it [1]. FPN1 [2], called Slc40a1, MTP1, or Ireg1, is found in all tissues where significant iron fluxes are regulated. Several models have been used to study the expression of FPN1. Among the first models used were the J774 mouse macrophages, where metals such as iron, cobalt, copper, zinc, and manganese were used to analyze FPN1 expression. When macrophages were treated with iron, FPN1 expression increased at the level of copper-like mRNA [3]. In the case of cobalt, levels of the FPN1 protein decreased to a significant expression in transcription. In the case of manganese and zinc, the expression of mRNA and proteins did not show significant changes [4]. On the other hand, in mouse models with colitis, whose microbiota influences systemic iron homeostasis and hepcidin expression is altered due to inflammation caused by the intestinal bacterium Bacteroides fragilis (B. fragilis), it was determined that in macrophages derived from bone marrow, it was analyzed that the decrease in the expression of FPN1 was independent of the viability of the bacteria. The decrease in NPF induced by B. fragilis was functionally crucial, as there was a significant increase in intracellular iron concentrations and a significant reduction in hnRNA (heterogeneous nuclear RNA), and decreased expression occurred at the transcription level. These results also reveal that B. fragilis influences the iron management of the inflammatory response of macrophages, modulating the expression of FPN1 [5]. In other models that used bacteria such as Mycobacterium tuberculosis (MTB) and Mycobacterium avium (MA) to infect mouse macrophages from different tissue populations and in macrophage cell lines from different tissues, expression at the messenger RNA level was found to be different in the various macrophage populations. In another model in peritoneal macrophages and macrophage cell lines, RAW264.7 and AMJ2-C8, mycobacterial infection and IFN-γ stimulation synergistically increased FPN1 mRNA, but not in alveolar macrophages and bone marrow-derived macrophages, where expression was negative. In the case of AM infections, the infected macrophages of the cell lines were RAW264.7 and AMJ2-C8, in which expression increased in synergism with INF gamma. Both bacteria increased the expression of FPN1 as an extract of bacteria and live bacteria [6]. On the other hand, other mycobacteria, such as Mycobacterium avium subsp. paratuberculosis (MAP) has been used to analyze the behavior of FPN1 expression in J774 mouse macrophages, where expression was analyzed without induction with IFN gamma, macrophages were treated with MAP extract, with live MAP, with iron and together with MAP with iron in this way it was possible to determine that the expression of FPN mRNA in J774 macrophages, those who were treated with live MAP slightly increased expression, however, when treated with iron alone the concentration increased up to 14 times more URE. When treated with live MAP and iron, the mRNA concentration decreased by up to 70% compared to macrophage treatment with iron [7]. The expression of FPN is thought to be activated at the right time and undoubtedly increases with iron at the transcriptional level. The regulation of expression is found in different stages, from a high level of regulation, i.e., from a unique chromatin structure to post-translational regulation. Post-transcriptional regulation of FPN involves the interaction of iron regulatory proteins (IRP1/2) with iron-sensitive element sequences (IREs) within the 5UTR of FPN mRNA. On the other hand, transcription factors such as Nrf2 also depended on improving FPN transcription in primary macrophages. Prolonged exposure to copper led to a decrease in the abundance of hepcidin and iron-independent FPN proteins. The data suggests that cell-type-specific requirements affect the stability of the FPN1 protein after copper loading [8]. Protein-DNA interactions are important in many essential biological processes, such as DNA replication, transcription, and repair. Identifying the amino acid residues involved in DNA-binding sites is critical to understanding the mechanism of these biological activities. In the last decade, numerous computational approaches have been developed to predict protein DNA-binding sites based on protein sequences and structural information. These play an important role in complementing experimental strategies [9]. Our research team, along with Shomaya et. al, has identified MAP3773c as a 16.53 kDa protein present in MAP, which has the potential to function as a transcription factor [10], is a metal regulatory protein that depends on Fe2+ and Zn2+ [11]. This protein contains zinc [12] and regulates cell envelope genes, lipid metabolism of MAP, including MAP3785-MAP3787, MAP2516, and harmful genes of pyruvate metabolism. It also enhances intracellular survival genes such as MAP2309c, MAP2325, and MAP1122 [13]. Studying the function of iron metabolism in the host has been an intriguing area of research. In this study, we aim to explore how the MAP3773c protein interacts with the mouse FPN1 coding regions. To achieve this, we first aligned the sequences of the potential iron boxes where MAP3773c could interact. After identifying these sequences, we conducted an in silico molecular docking analysis, followed by an Electrophoretic Mobility Shift Assay (EMSA), Western blotting and a Chromatin Immunoprecipitation (CHiP) assay with a Polymerase Chain Reaction (PCR) endpoint.
2. Results
2.1. Alignments
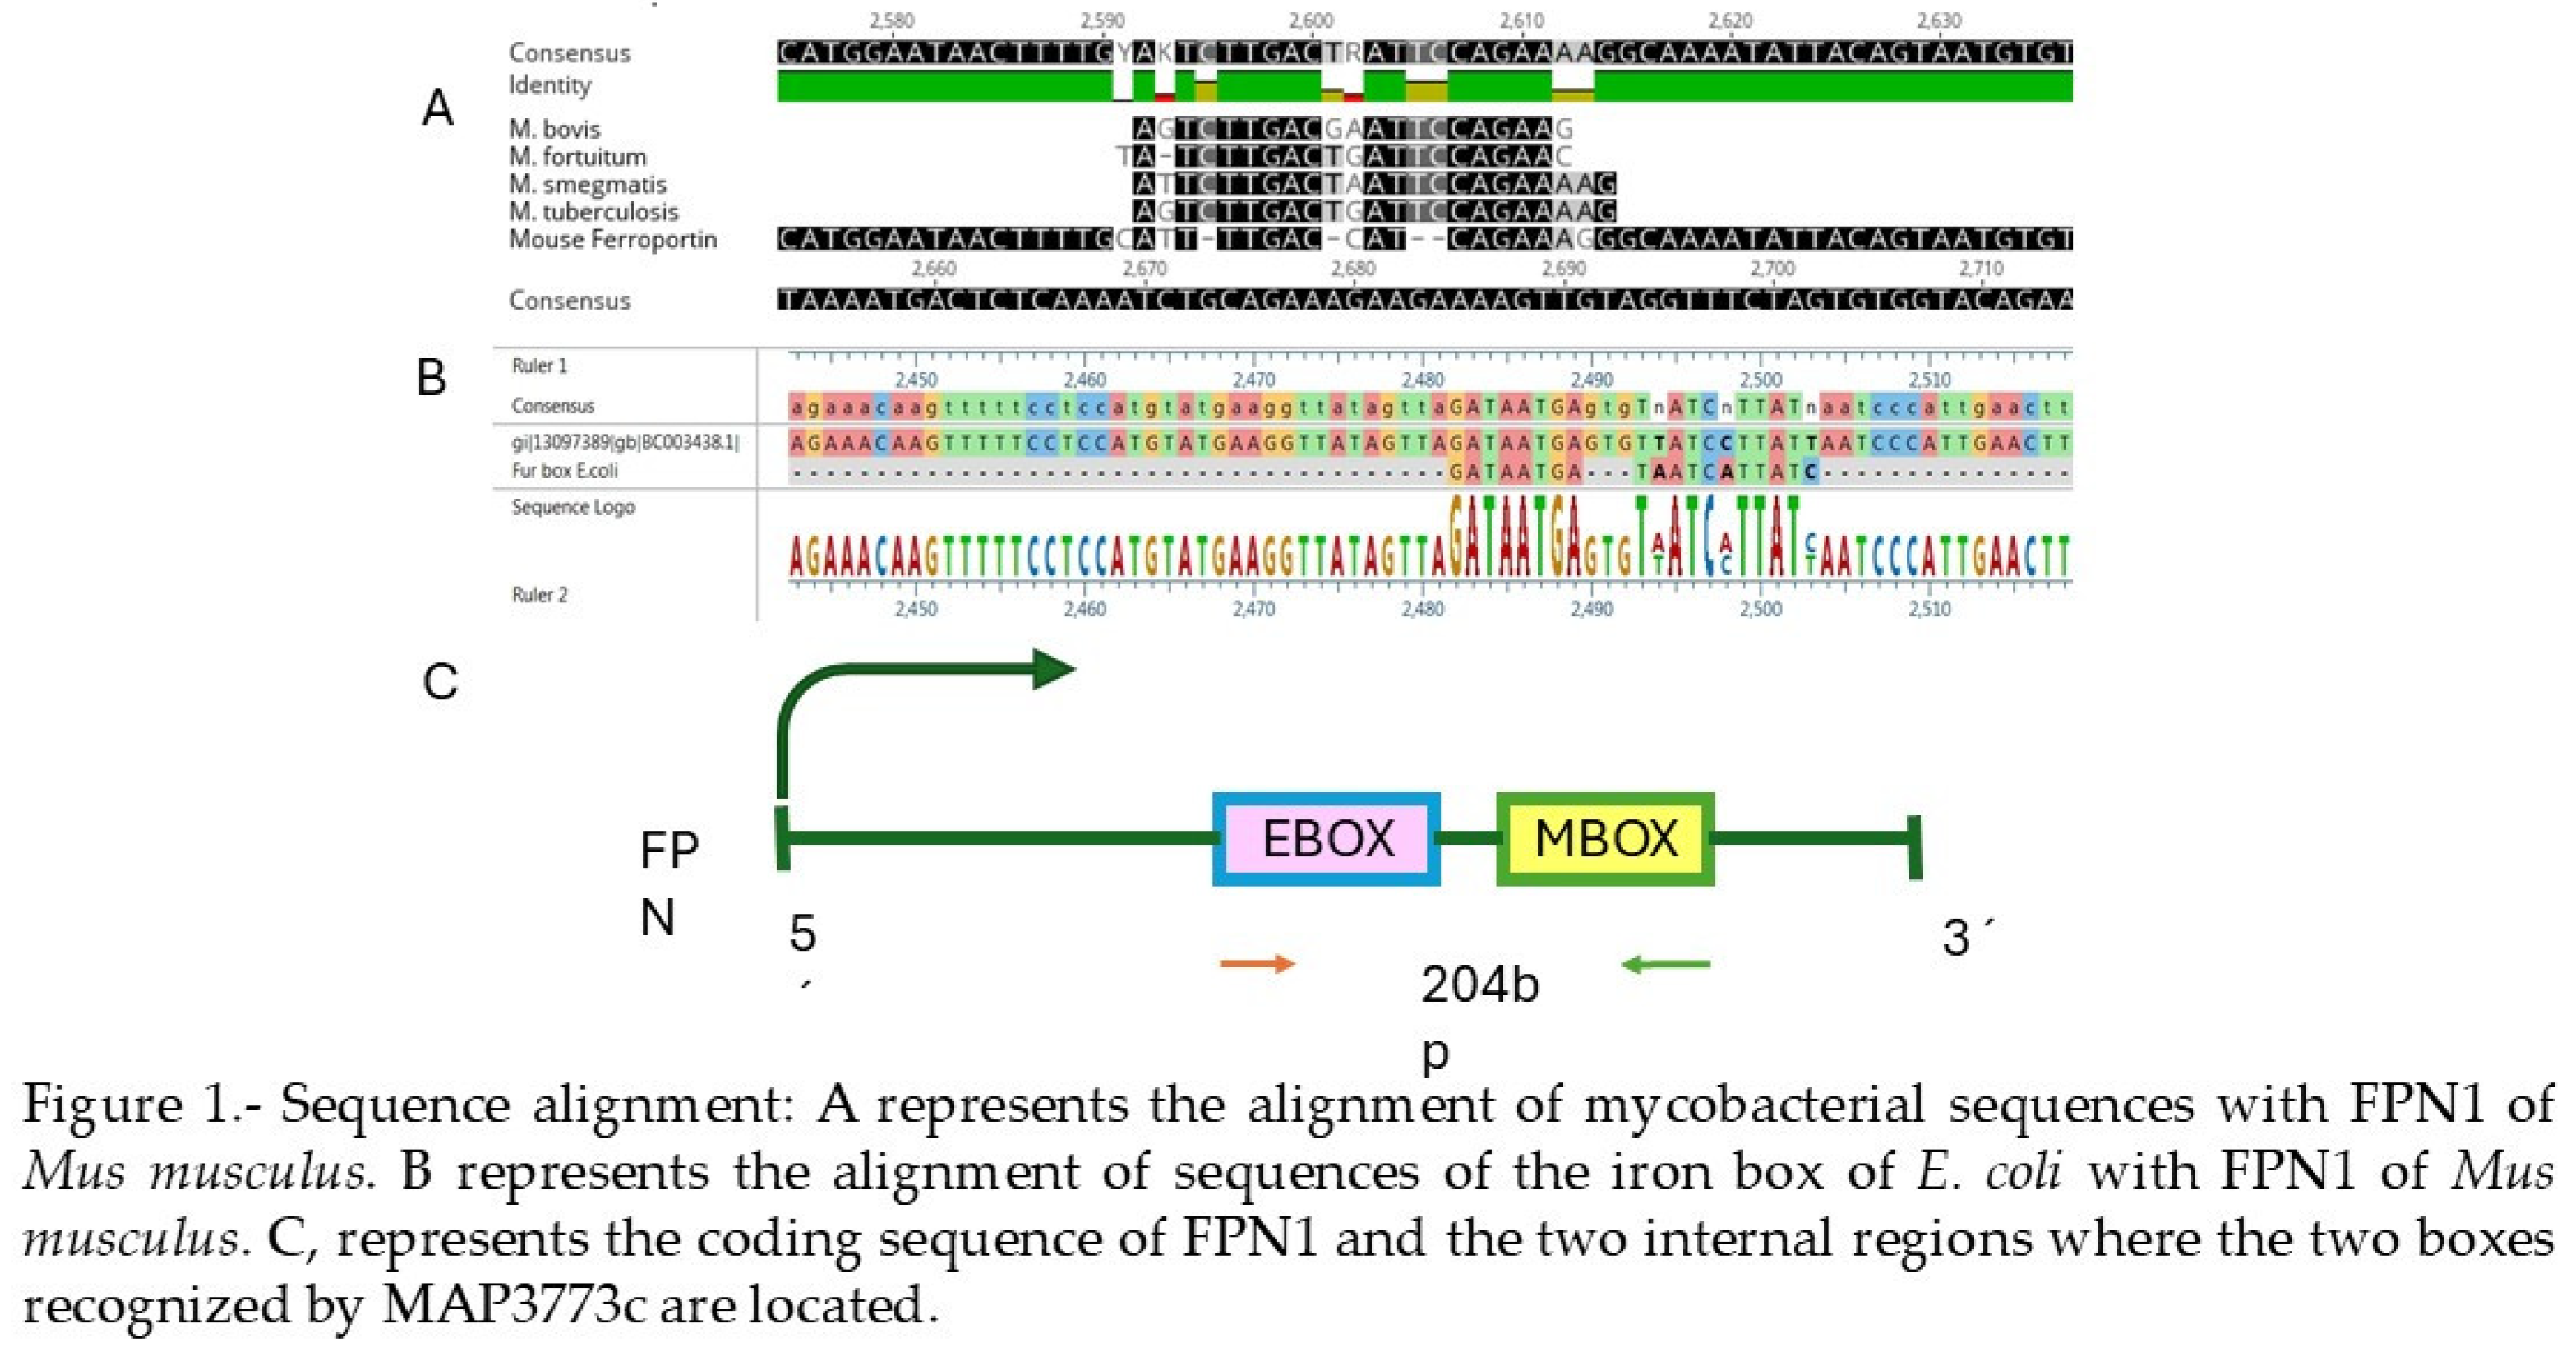
The TAL figure displays two regions (2482-2503 and 2592-2614) in the coding region of FPN1. These regions were identified based on the similarity of the consensus sequences to which the MAP3773c protein bound. We conducted an alignment with the mouse FPN, mRNA, (comments on materials and methods), and found similarity in the 2482-2503 region, which we labeled as EBOX due to its similarity to the iron box recognized by E. coli [14]FUR-like proteins. The other region with similarity was 2592-2614 in mouse FPN1, which we called MBOX because it resembles regions recognized by the FUR-like proteins of mycobacteria reported by Sala et al. [15]. This allowed us to identify two consensus sequences for molecular coupling experiments.
2.2. Docking
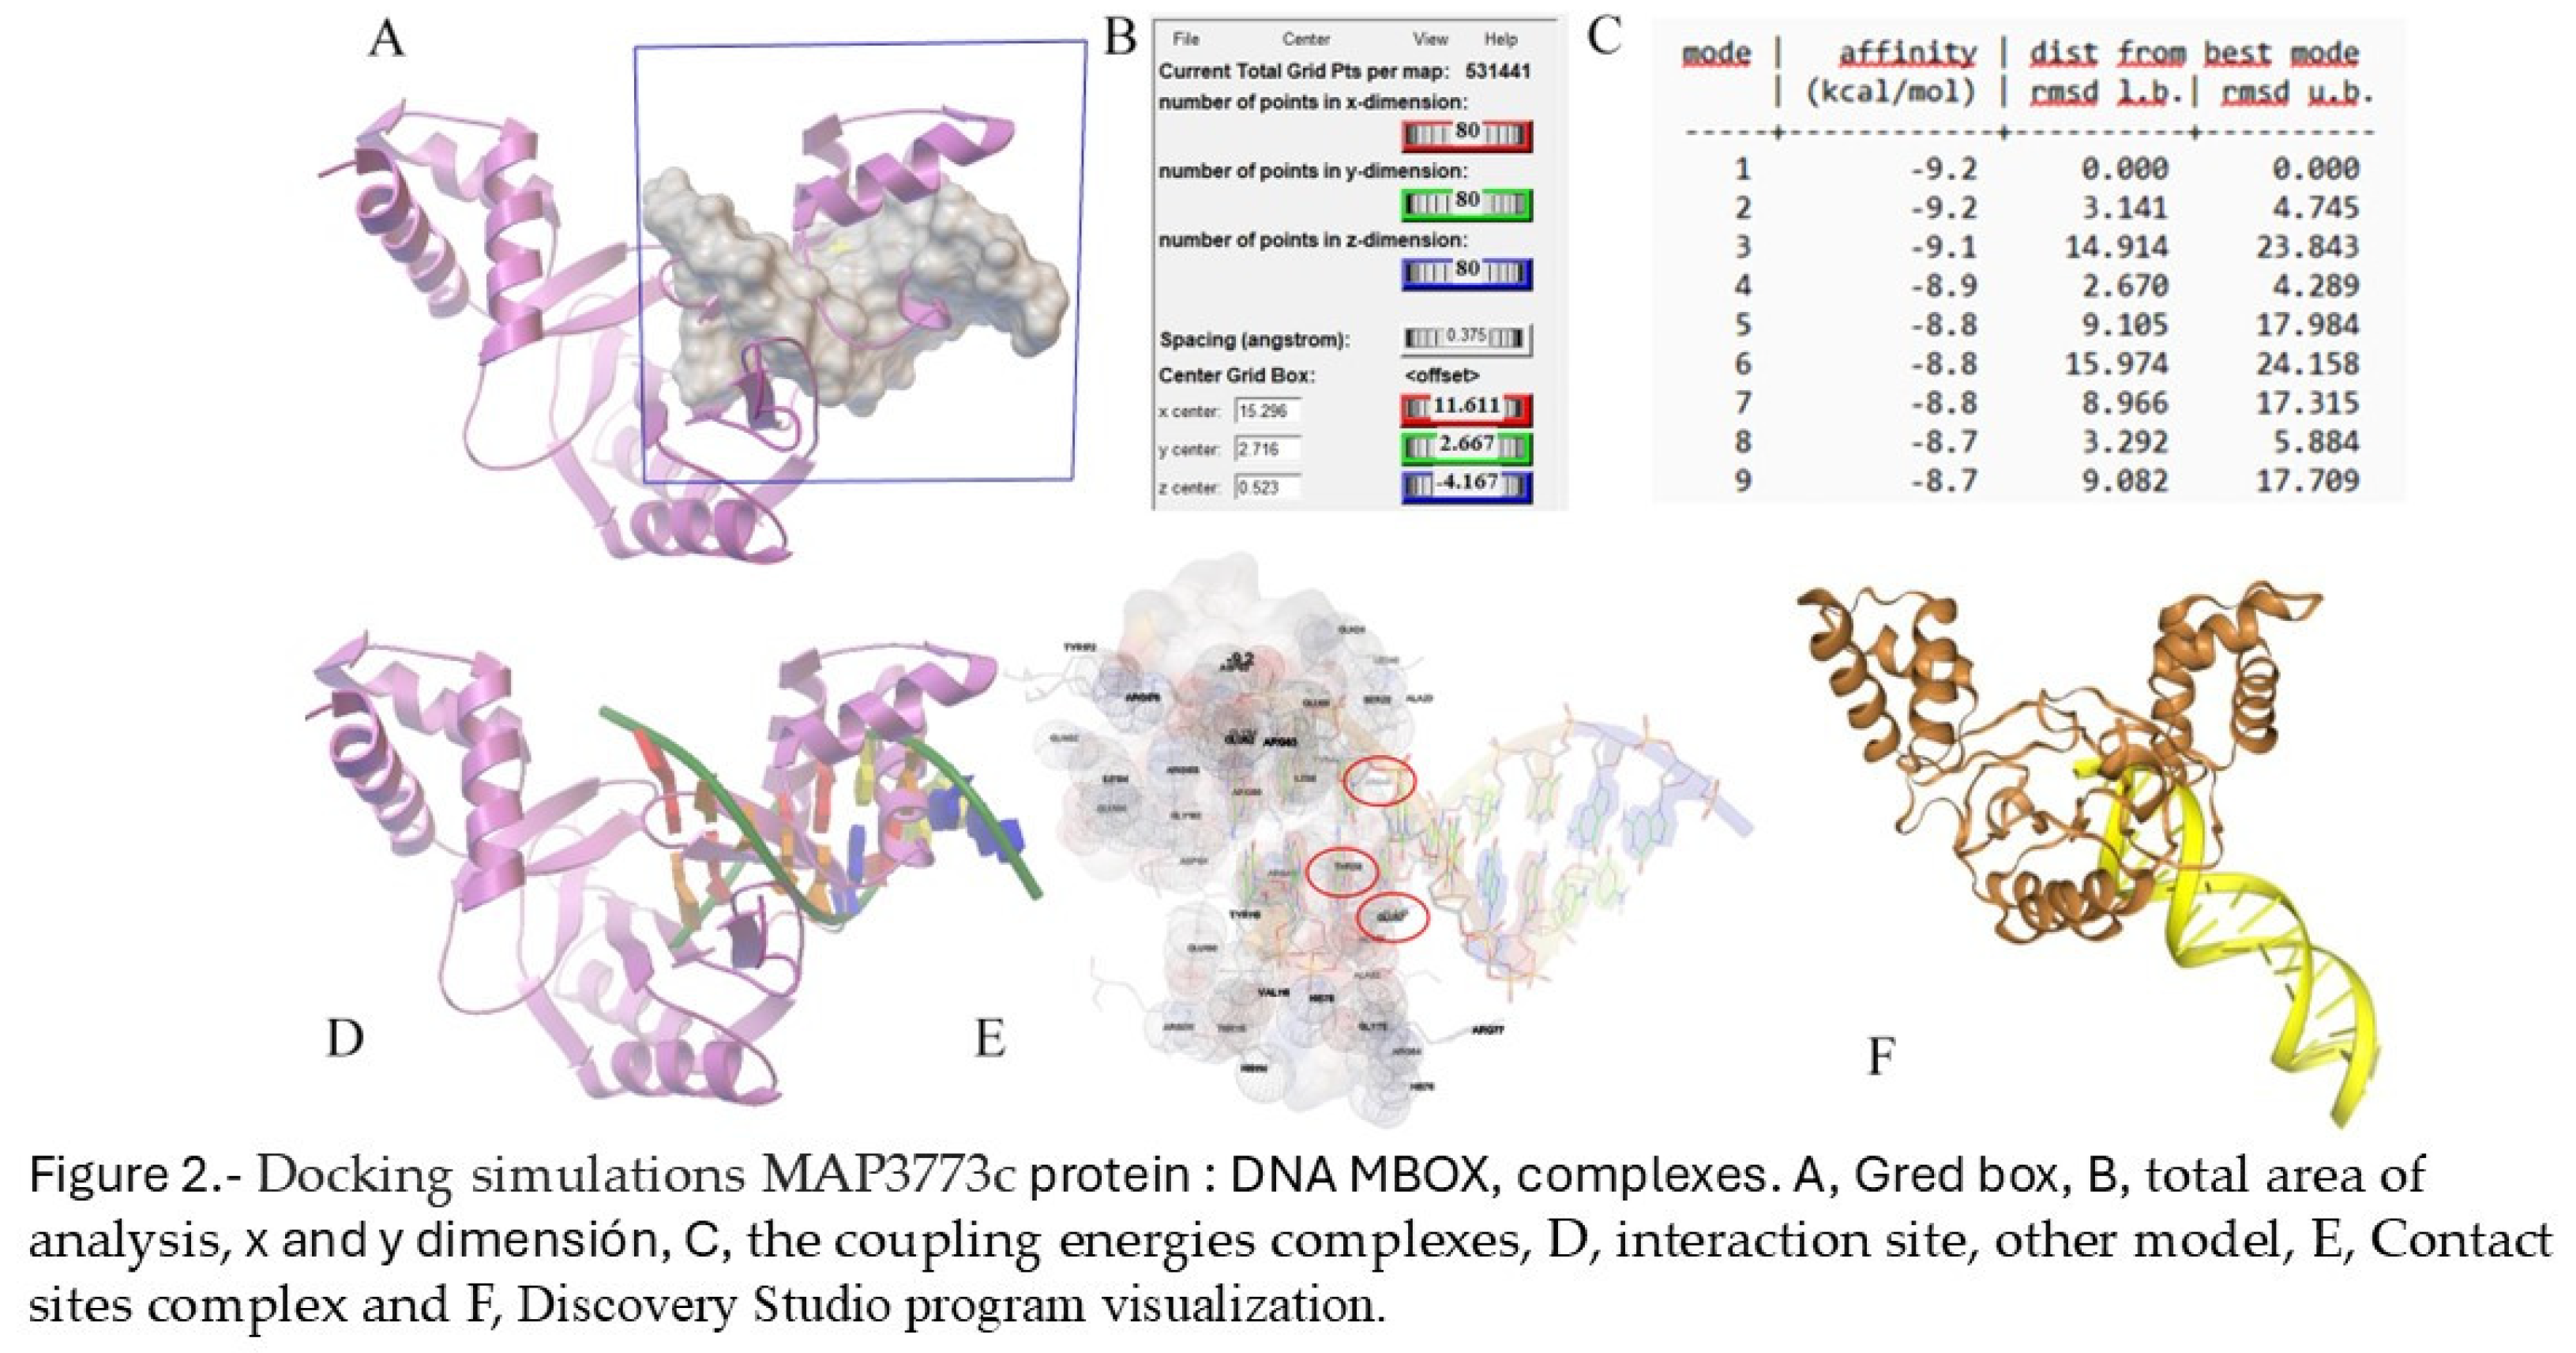
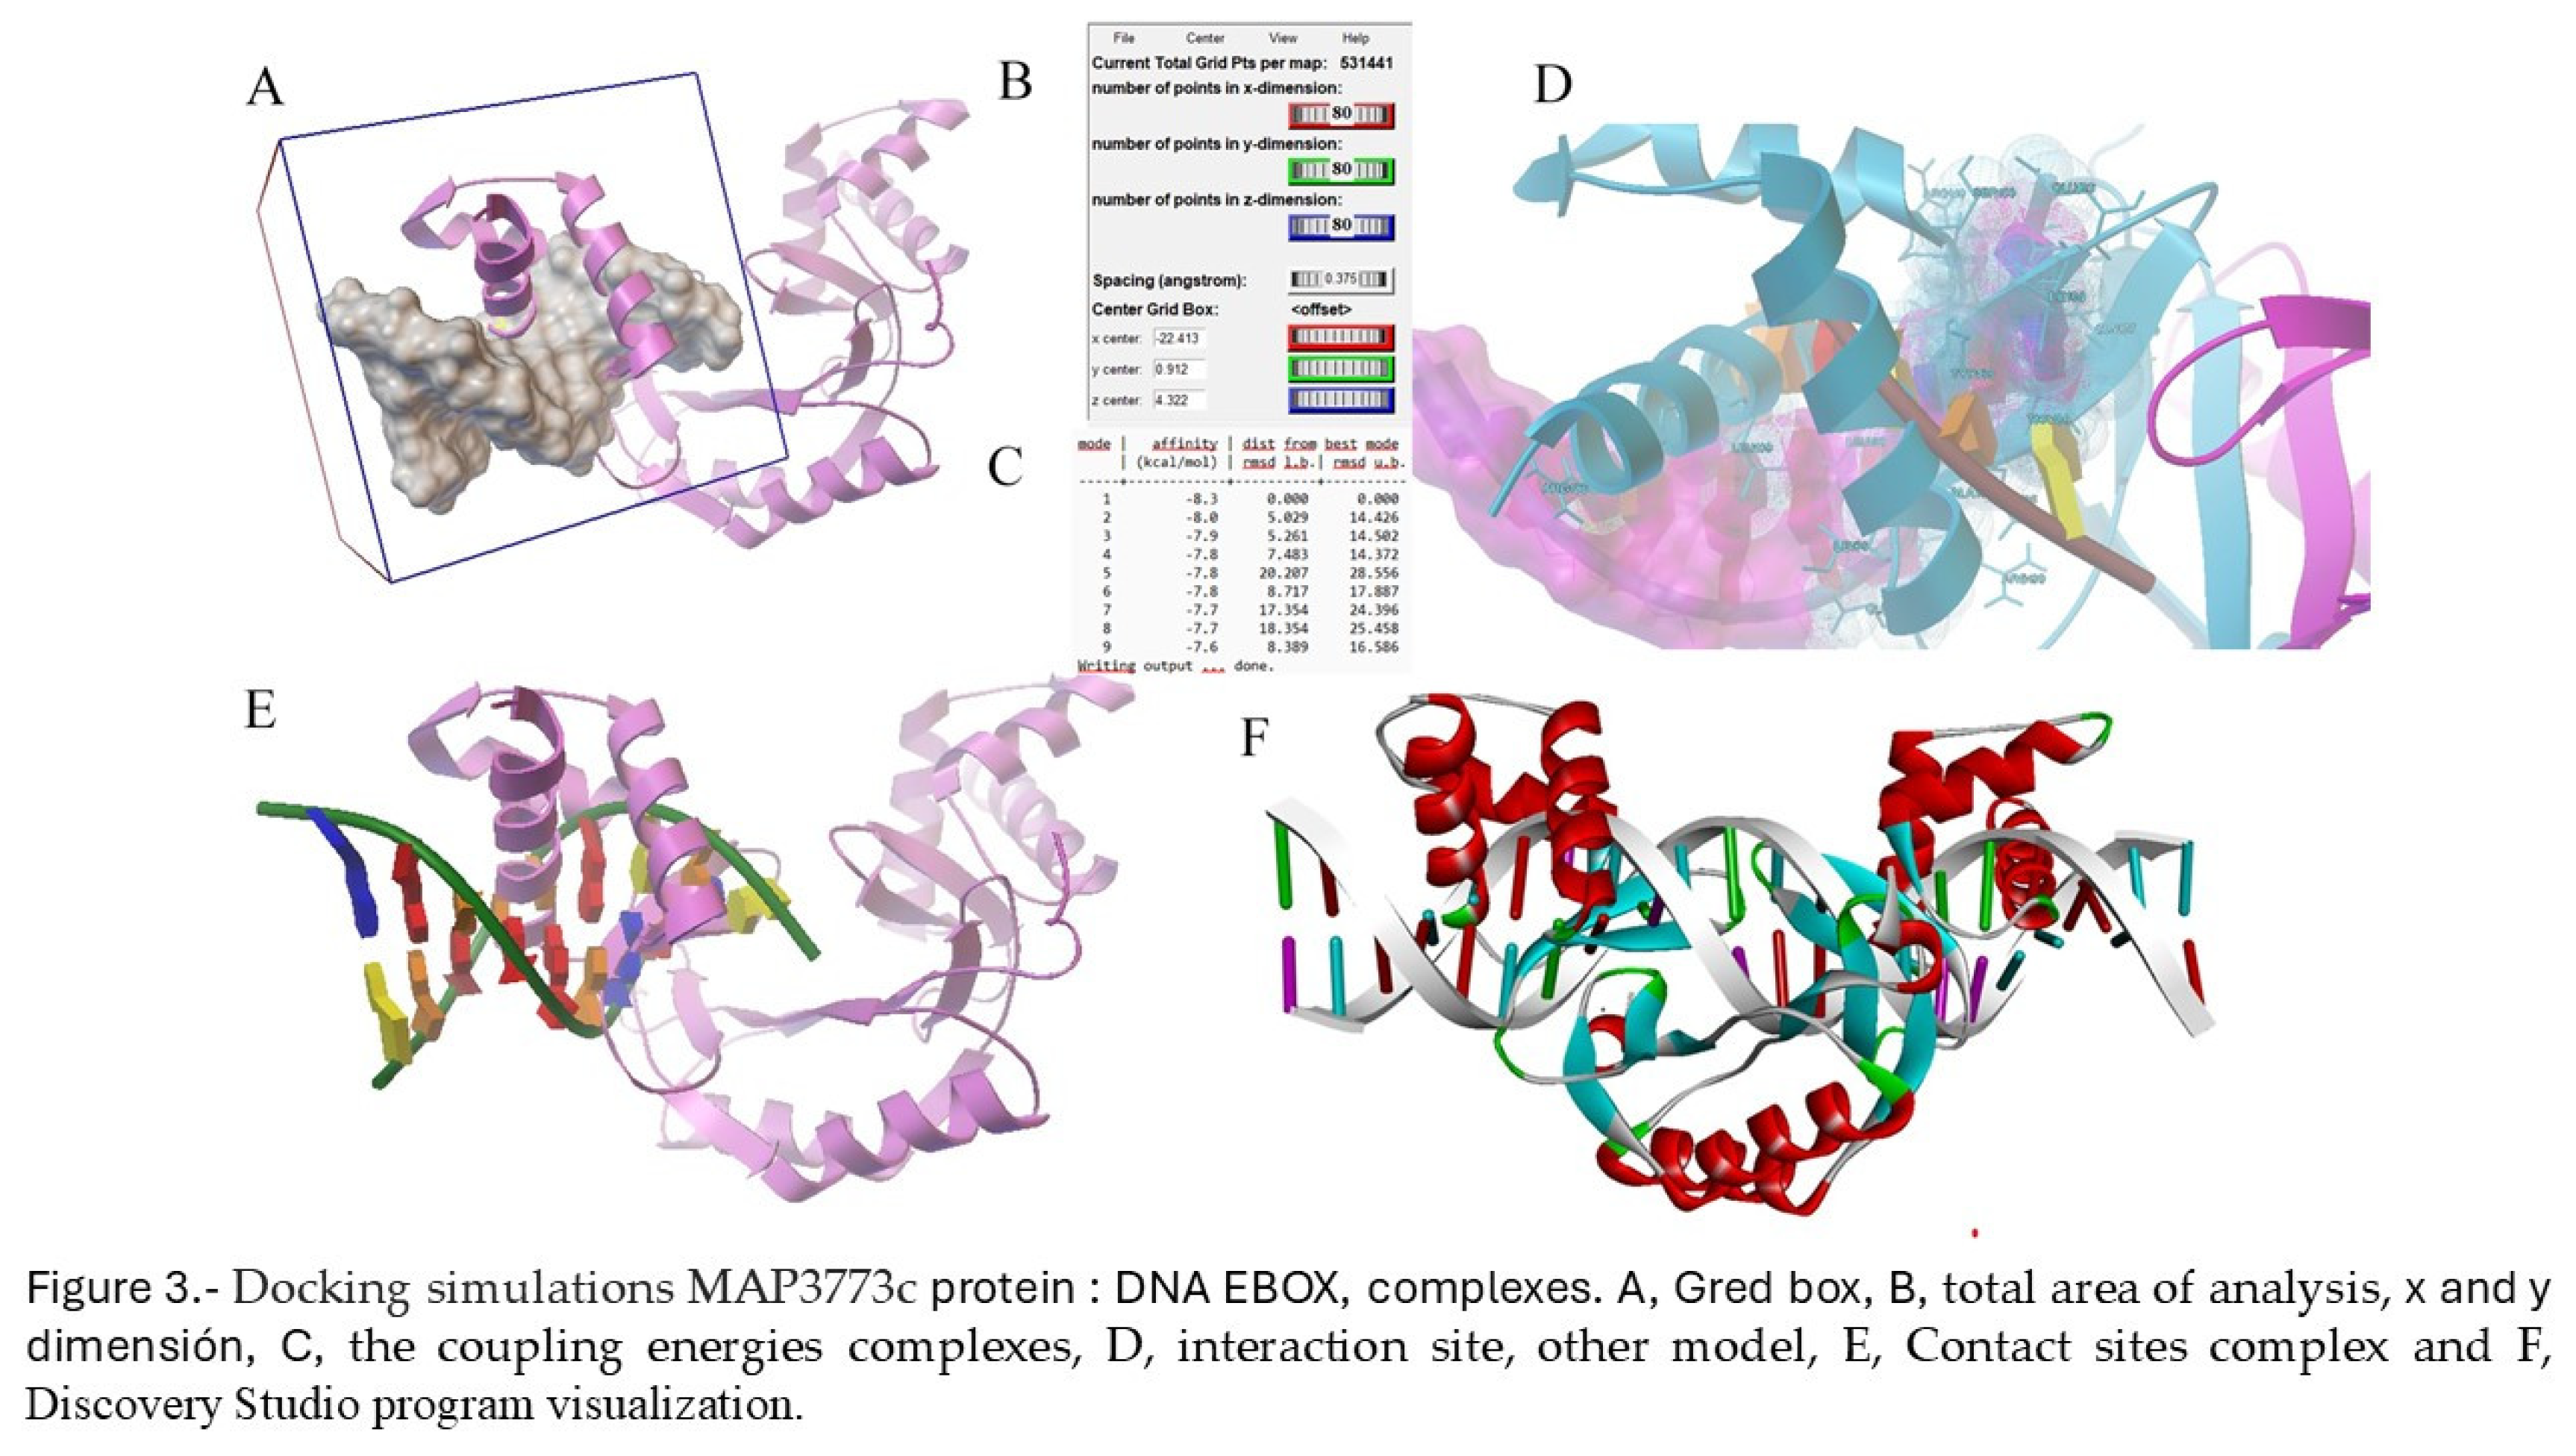
Our study aimed to investigate the potential interactions between specific regions of the mouse FPN1 coding sites and the MAP3773c protein of MAP. We used docking simulations to determine the possible interaction of MAP3773c with these regions in FPN1. MAP3773c was analyzed with the MBOX and EBOX coding region of FPN1, using UCSF - CHIMERA molecular visualization programs [16] y AUTDOCK-TOOLS [17]. Coordinates (x,y,z) were utilized for the binding sites to FPN1, MBOX, and EBOX. The size of the grid/box was 80 Å, ensuring coverage of all regions of MBOX and EBOX (Figure 2, Figure 3). The total area of analysis, based on the provided grid, was 531,441, corresponding to the number of points in dimension X for both MBOX and EBOX, given that there were 80 Å for both cases. It’s important to note that the number of atoms for the sequences exceeded the limit accepted by the programs. Therefore, the decision was made to work with the sequence that bound to FPN1, which consisted of nine nucleotides: 5 ́ ATTTTGACC 3 ́ and its complement 3 ́ TAAAACTGG 5 ́ for MBOX, and 5 ́GATAATGAG 3 ́ and its complement 3 ́CTATTACTC 5 ́ for EBOX. In the AutoDockTools program, we minimized the twists in the ligand to reduce the possible conformations that the MBOX and EBOX regions could take. This was necessary because even though we are using rigid protein flexible ligand docking, the ligand can adopt many conformations. By restricting the movement of the MBOX and EBOX sequences due to the limitations of rotatable bonds, we aimed to include only the most probable conformations in the model. We covered the ligand entirely to ensure we did not lose any potential interactions of MAP3773c with the MBOX and EBOX. The files with the pdbqt extension have been generated. Once the study site was selected, the docking process was initiated and executed using the vina.exe program in command prompt [18]; the estimated shift time was 12 hours. We present the coupling energies obtained for the interaction of MAP37773c with MBOX and EBOX. The n=5 shifts were performed to ensure and verify that the procedure was carried out correctly and then to verify the energies. As can be seen, the coupling energies for MBOX-FTPN1 are around -9.2 kcal/mol and -8.7 kcal/mol and for EBOX, from -8.3 to -7.6 Kcal/mol, (Figure 2C and Figure 3C). Hence, the study suggests that coupling could be favorable, as it is an exothermic reaction (coupling energies <0) and could occur spontaneously in a biological system. Some interactions with specific amino acids (Figure 2E and Figure 3D) are also observed, such as ARG45, THR58, GLU57 (enclosed in red), ARG 60, ALA 61, LEU, 67, ARG 71, THR 72, in the case of MBOX. In the case of EBOX, some of the interactions shown are ILE 166, THR 186, GLN 187, ILE 194, TYR 196, LEU 199, and ARG 198. The coupling verification was performed with the HDOCK server [19,20]. The coupling verification involved using the HDOCK server to visualize the interaction between MAP3773c and the MBOX and EBOX encoding region. We utilized the Discovery Studio program [21], to visualize the interaction, as depicted in Figure 2F and Figure 2F.
2.3. MAP3773c Purification Protein
The MAP3773c protein was purified in our laboratory with utmost adherence to the standardized methodology, as specified in (12). After purification, the protein was dialyzed in a pH 4.5 and 10 mM sodium acetate solution. For EMSA’s experiments, the protein was precisely used at a concentration of 200 nM. Finally, the protein was quantified, yielding a 25 nM/μL concentration.
2.4. The Expression of mRNA and MAP3773c Protein
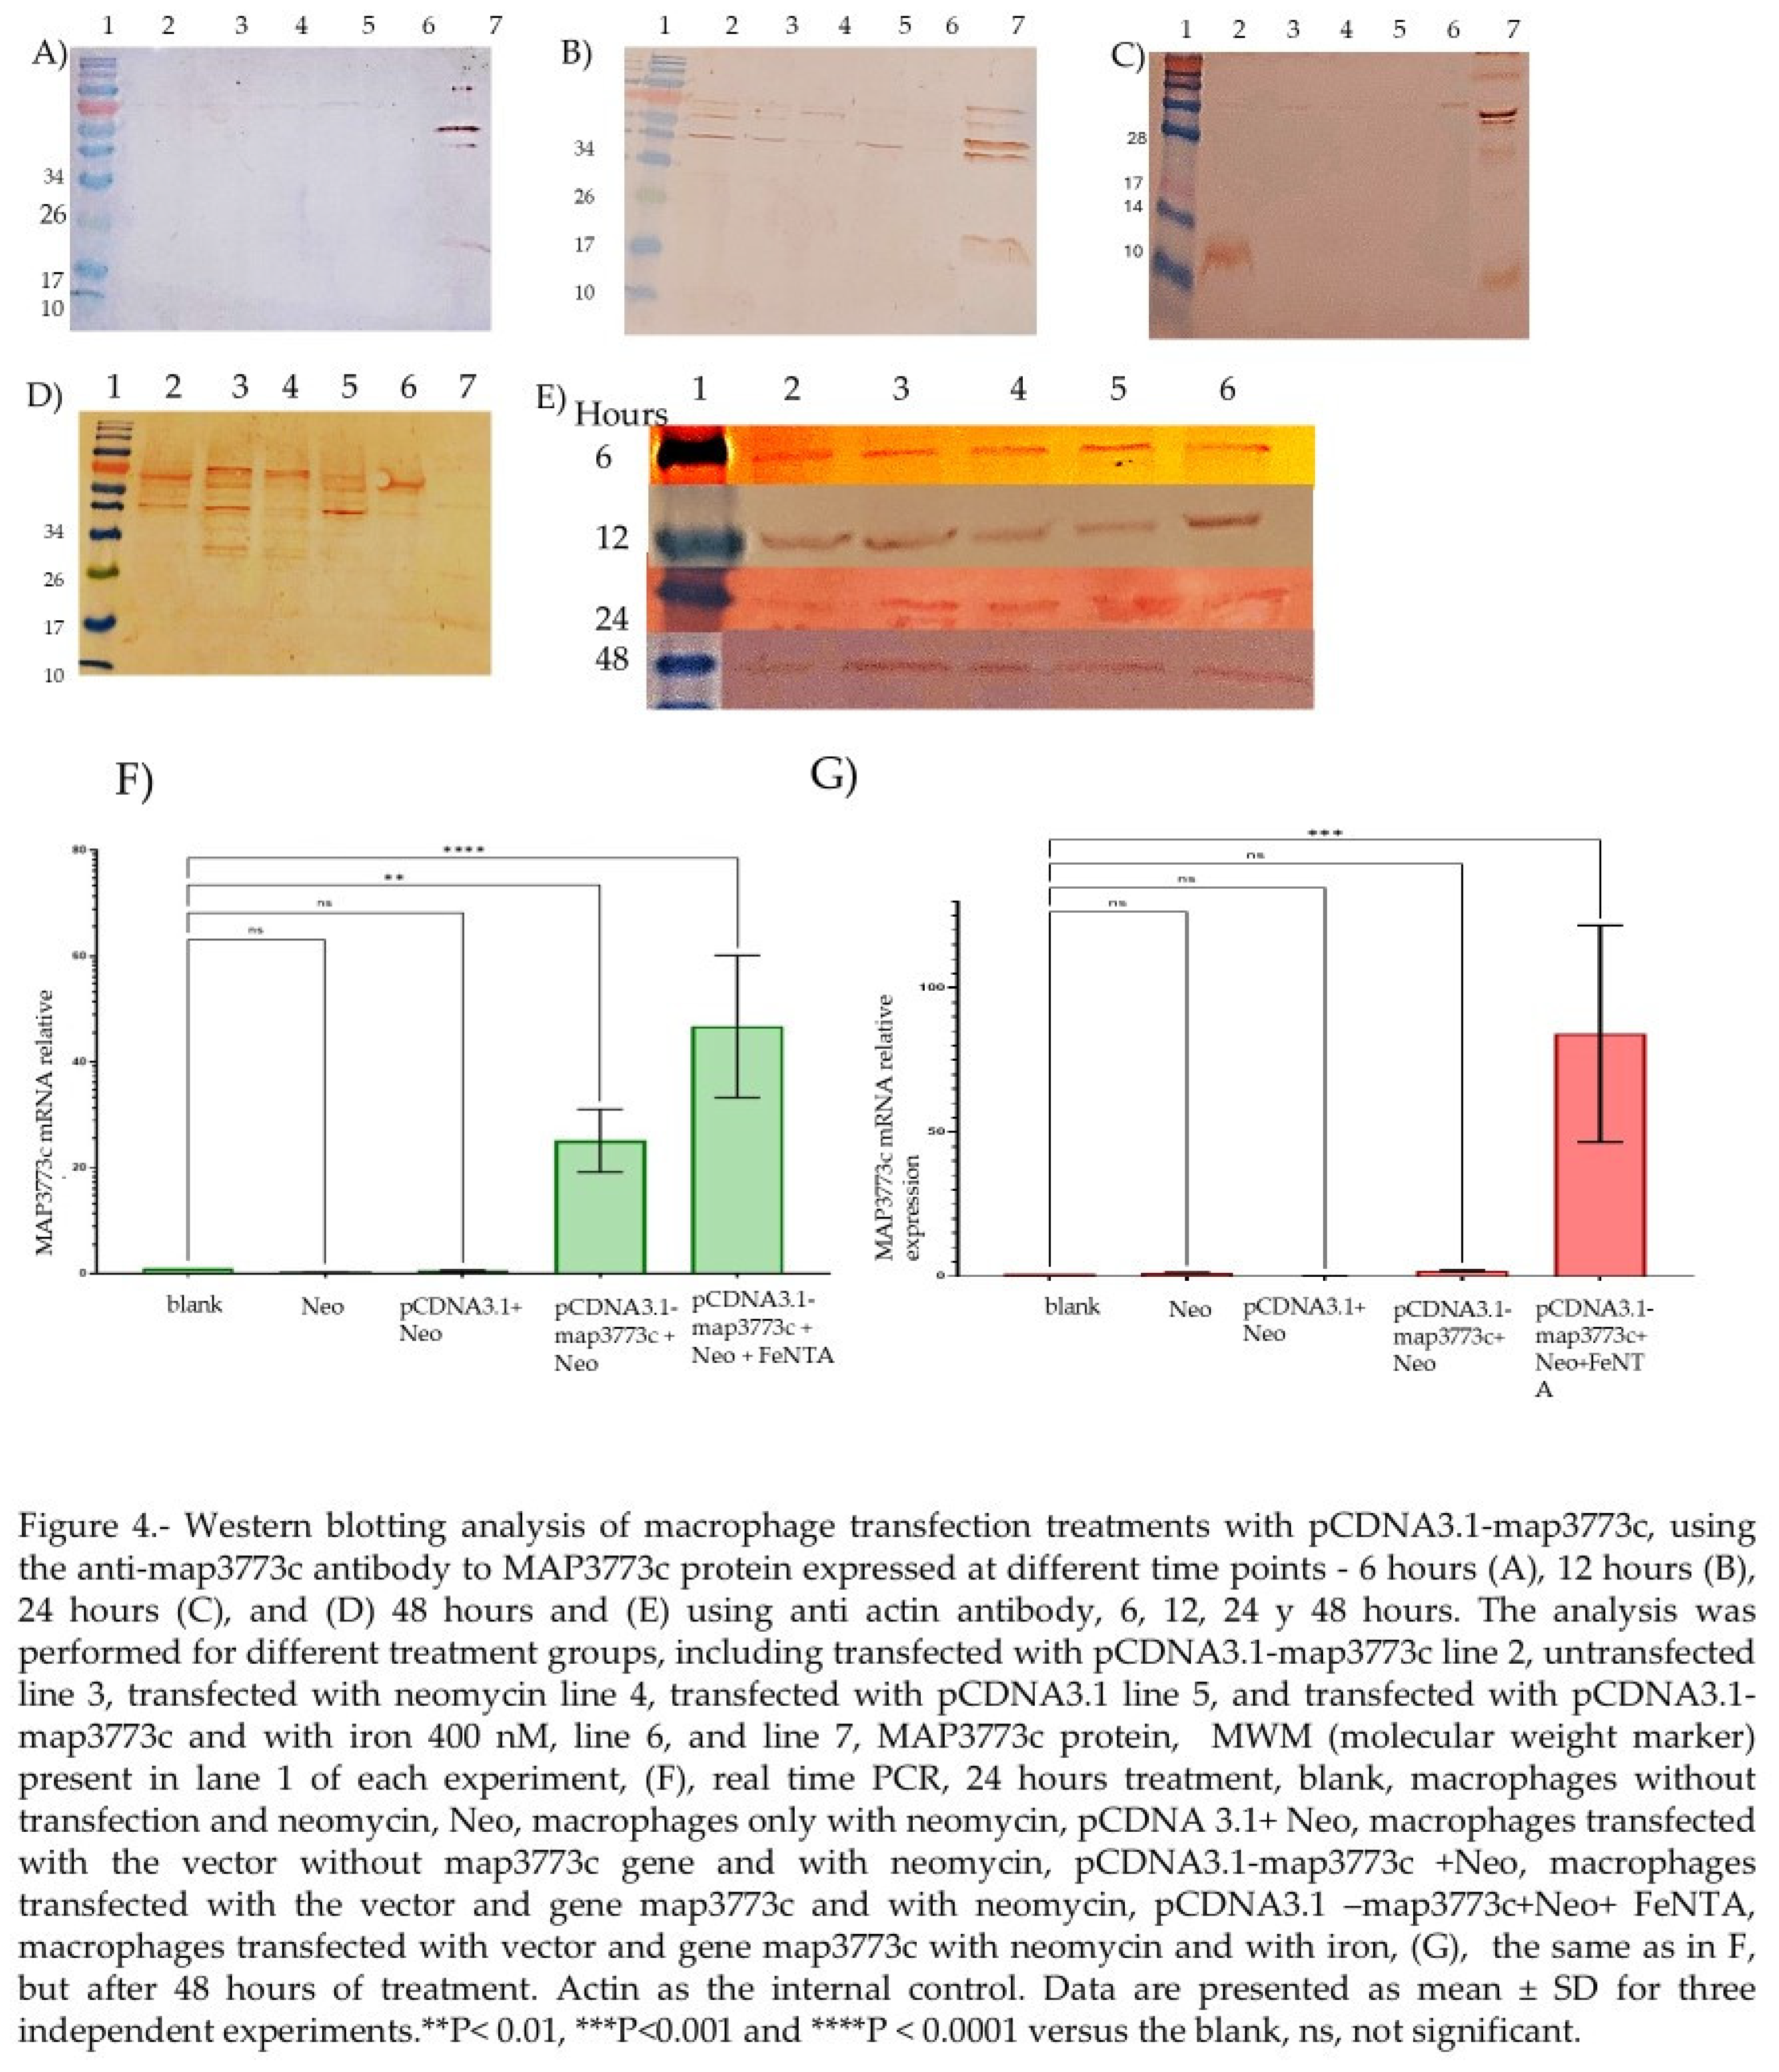
In the case of Western blotting, as shown in (Figure 4A), at 6 hours of treatment, there was no expression of the MAP3773c protein in any of the treatment groups, in the same way for 12 hours Figure (4B), only the control of the MAP3773c protein (Figures A, B, C and D), expressed in pRSET-map3773c, which has a molecular weight of 20.53KDa, as can be seen in the Figure. In the case of the treatments at 24 hours, an expression was obtained in the group of cells transfected with pCDNA-map3773c and pCDNA-map3773c with iron; this shows that the protein was expressed at 24 hours with or without iron, at an approximate size of 12 kDa. (Figure 4C). In the case of treatments at 48 hours, there was no protein expression in any of the treatments. Real-time RT-PCR was used to evaluate MAP3773c expression in J774 A.1 mouse macrophages. As shown in (Figure 4F), mRNA levels of MAP3773c showed increased expression after 24 hours of iron-free treatment and doubled with iron supplementation. However, after 48 hours (Figure 4G) of iron-free treatment, expression decreased significantly. In contrast, in the presence of iron, expression increased approximately 40-fold compared to the 24-hour time point. These findings have the potential to open up new avenues of research and deepen our understanding of MAP3773c protein expression.
2.4. EMSA
Our research focused on investigating the interaction between the MAP3773c protein and the FPN1 coding region in mouse macrophages. We identified two specific regions within the FPN1 encoding sequence, EBOX (2482-2503), GATAATGAGTGTTATCCTTATT and MBOX (2592-2614), ATTTTGACCAT CAGAAAGG (Figure 1) and conducted experiments using EMSA. The results showed that the MAP3773c protein interacts with these regions, (Figure 2 and Figure 3) displays the experiment’s outcome. Our findings indicate that the MAP3773c protein can bind to the FPN1 of J774 A.1 mouse macrophages at two coding region sites, even when iron, zinc, and other metals are present, as demonstrated by the addition of EDTA as a metal chelator. This means that MAP3773c does not require metals to bind to these regions of FPN1 in vitro. Importantly, FPN1 is a crucial protein involved in iron metabolism, and our study sheds light on a previously unknown mechanism of FPN1 transcriptional regulation.
2.5. MAP3773c Binding in the FPN1 Coding Region
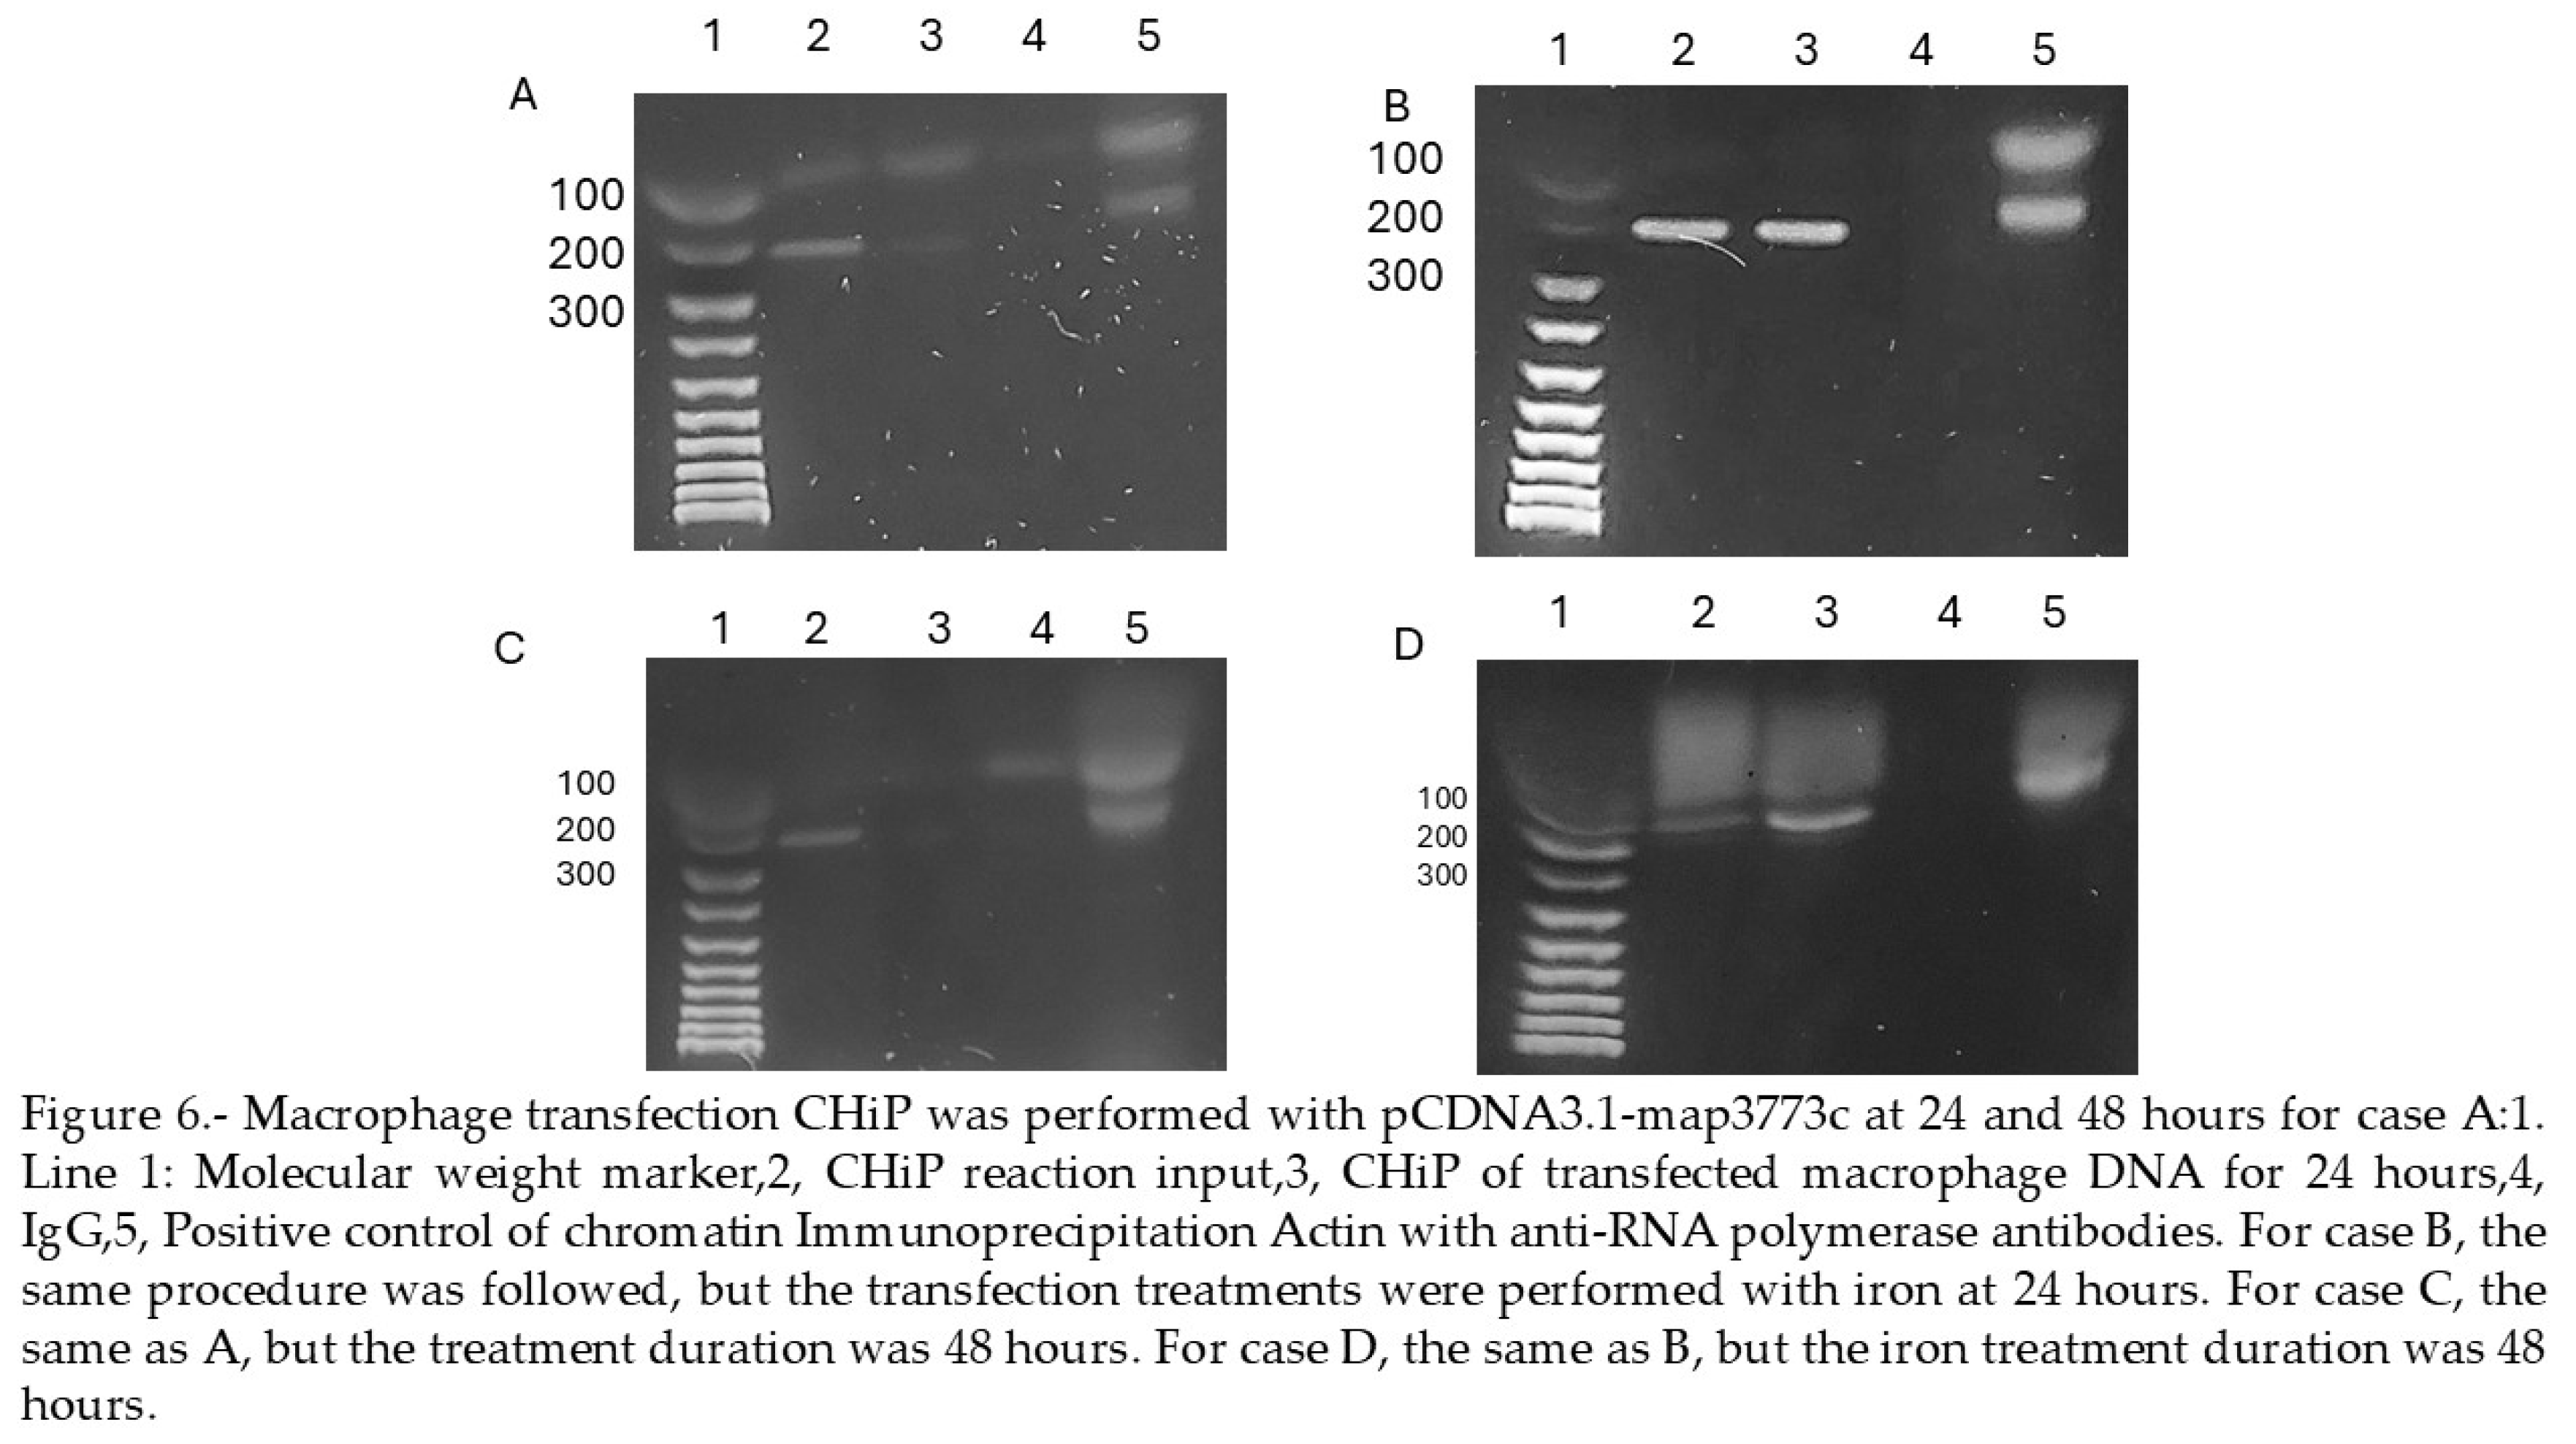
The coding regions in the FPN1 gene were validated using chromatin immunoprecipitation assay (ChIP). The PCR electrophoresis results in Figure TAL indicated that the anti-MAP3773c group and Input shared a similar band spacing at 204bp, suggesting that MAP3773c can bind with the EBOX and MBOX regions of the mouse FPN1 gene. The negative control with anti-IgG antibody showed no specific binding, while the positive control with anti-RNA Pol II antibody demonstrated specific binding to the RNA Pol II in the promoter regions of genes. This binding allowed for the capture and amplification of these regions during chromatin immunoprecipitation, as evidenced by the amplification of the actin gene using oligonucleotides that target a 154bp region. [22].
3. Discusion
The FPN1 protein in mammals is responsible for exporting cellular iron to the circulation, making it a key regulator of iron homeostasis [23,24]. Iron serves multiple functions in bacterial growth and pathogenicity, as well as in modulating innate immune responses in the host [25].
Our molecular studies conducted through computational, in vitro, and in vivo analyses reveal that MAP has an impact on iron metabolism within the host, potentially influencing the expression of FPN1. This phenomenon is similar to the effect of other bacteria, such as Bacteroides fragilis, which leads to a decrease in the expression of FPN1 [5]. Bacteria are able to capture iron from host cells to support their growth and carry out various biological processes, similar to the way MTB acquires iron from the surrounding environment [26].
Our research stands to significantly influence the field of molecular biology. We have confirmed the potential interaction of the MAP3773c protein with DNA regions of FPN1, specifically at two coding region sites. This discovery opens up new pathways for comprehending the role of the MAP3773c protein in iron metabolism and its potential implications for health and disease.
We named these sites EBOX because they resemble the consensus sequence known as the iron box in E.coli [14], and MBOX because of their similarity to the mycobacterial iron box obtained through alignment of mycobacterial sequences [15]. We confirmed these sites by conducting protein-DNA molecular docking studies and further validated them through in vitro analysis using EMSA to assess the interaction of MAP3773c in these regions. Our findings revealed that the protein interacts in these regions with Fe+2, Zn+2, and even without the presence of metals, using a metal chelator (EDTA). Interestingly, we observed that the in vitro binding of MAP3773c to the corresponding EBOX and MBOX regions is independent of the involvement of metals. Moreover, we pursued an in vivo analysis by first examining the expression of the protein in macrophages at 6, 12, 24, and 48 hours post-transfection. To measure the protein expression, we utilized Western blotting with anti-MAP3773c polyclonal antibodies from rabbits and employed the Actin housekeeping gene. The results of the experiment indicate that the MAP3773c protein was observed in transfected macrophages 24 hours after transfection, appearing as a 12 kDa protein. This suggests that the protein underwent cleavage of its disulfide bonds through a reduction pathway at C94 or C96, likely due to its proximity to the 12 kDa size range. Notably, the protein was not expressed in macrophages at the 48-hour mark, regardless of the presence of iron at the translational level. We analyzed mRNA expression at 24 and 48 hours. Protein was expressed at 24 hours with and without iron. At 48 hours, MAP3773c was expressed with iron only. In the chromatin immunoprecipitation (CHiP) experiments, we found that the MAP3773c protein interacted with the ferroportin coding regions at 24 hours in the presence and absence of iron, as well as at 48 hours under the same conditions. However, the MAP3773c protein was not yet expressed at 6 and 12 hours, so we opted not to proceed with the experiments at these time points. Our findings indicate that the MAP3773c protein binds to these regions of Ferroportin1 at 24 and 48 hours. Our analysis of protein expression using Western blotting suggests that the PCR technique is more sensitive. These results demonstrate that the protein remains expressed for up to 48 hours regardless of the presence of iron. These findings align with the EMSA results, which indicate that the protein interacts with these regions irrespective of the presence of metals, as well as the in silico docking results.
Our research has uncovered significant findings, as we have not found documented the participation of FUR-type proteins in the transcription of proteins such as FPN1 in mouse macrophages J774 A.1. Fur and Zur proteins are documented to function as transcription factors in certain organisms, where they form dimers and bind to their consensus DNA sequences. [27]. These findings have been determined only in bacteria, including those of Zymomonas mobilis. In this study, they found that their Fur proteins mediate the expression of stress-resistance genes and chromosomal contacts, which are essential for the strain’s adaptation to environmental stimuli [28]. In contrast, regarding FPN1 and its transcription factor regulation, existing documentation supports the idea that Nrf2, a transcription factor commonly found in PC3 cells, upregulates FPN1 expression [29]. Transcription elongation in eukaryotes is controlled by a wide variety of factors. In the future, we intend to investigate how the expression of FPN1 behaves in J774 A.1 macrophages, with the transfection of the pCDNA3.1-map3773c vector, both protein, and mRNA, as well as possible proteins with which MAP3773c interacts in cell trafficking. The findings of this study could significantly influence future research in molecular and cell biology.
4. Materials and Methods
4.1. Alignments for the Location of Iron Boxes in the Mouse FPN Gene
In our study, we conducted a sequence alignment to identify sequences within the coding region of FPN1 that potentially interact with the MAP3773c protein, which is believed to have a transcribing factor function. The FPN1 protein, obtained from GenBank (NC_000067.7: c45965690-45947230 Mus musculus strain C57BL/6J chromosome 1, GRCm39), was the focus of our investigation. We used the FPN1 mRNA sequence from GenBank (BC003438.1) to assess conservation of sequences in the mRNA and their potential impact on protein translation. Our alignments were based on this sequence to identify consensus regions within the gene and to determine any potential interaction between the MAP3773c protein and FPN1 sequence. Additionally, we sought to identify a consensus sequence of mycobacteria that interacts with FUR proteins. To achieve this, we utilized sequences reported by Sala et al. [15] for M. tuberculosis, M. fortuitum, M. bovis, and M. smegmatis. Using Geneious 7.1.3 software, we aligned these mycobacterial sequences with the FPN1 sequence to identify similar or identical regions that could potentially interact with MAP3773c. Furthermore, we performed an alignment to identify consensus regions corresponding to the iron box of Escherichia coli (E.coli), GATAATGATAATCATTATC, as reported by Escolar et al. [14]. Additionally, considering the findings of Shomaya et al. [13], who reported that MAP3773c interacts in this region, we aimed to align the regions based on this antecedent.
4.2. Bacterial Strain
The strain used for protein expression was E.coli BL21 (DE3). The procedure used to express and purify the MAP3773c protein was the same procedure already standardized in our laboratory and previously published [12].
4.3. Docking of the Fur boxes
In this study, we utilized a protein model of MAP3773c obtained from homology modeling and crystalline models [12] to perform an in-silico coupling analysis. Our aim was to determine the interaction of the protein with the iron boxes or Fur sequences of E.coli and mycobacteria. To achieve this, we aligned the protein model with the directions 5′ and 3′ regions of the sequence deposited in the GenBank of MAP3773c, and used the Hex 8.0 program and the independent P2Rank method [30,31,32] to predict possible linking sites. This software relies on the Fourier transform and graphics cards to perform the coupling. In the next step, we docked these sequences with the MAP3773c protein, which involves using graphics processors for spatial and electrostatic minimizations. We used Chimera [16,17] to visualize the biomolecule’s possible binding sites of electrostatic and hydrogen interaction. By performing this analysis, we were able to identify potential binding sites between the protein and the target sequences, which could help in further understanding the interaction mechanisms.
4.4. EMSA
We conducted an electrophoretic mobility shift assay (EMSA) to investigate the interaction of MAP3773c protein with potential binding sites in the mouse FPN1 coding region. We followed the EMSA protocol described in [33], with some modifications. In brief, we mixed 44 picomolar/μL of synthesized DNA sequences with a binding buffer (containing HEPES 400 mM, DTT 5 mM, and EDTA 2 mM), Ficoll at 20%, MnCl2 or ZnCl2 at 100 mM and 150 nM, of MAP3773c protein, 100 picomolar of an unrelated DNA fragment (NRD), 0.1 μg of poly (dI-dC), and water to a final volume of 20 μL. We also performed protein-free control reactions for both cases. For metal-free reactions, we used 2 mM, micromolar EDTA [34,35]. The mixtures were incubated for 30 minutes at room temperature, then loaded onto a non-denaturing EMSA acrylamide gel at 8%, and run at 100 V in a buffer containing Tris 90 nM, boric acid 90 nM, and EDTA 10 mM. Finally, we visualized the gels with ethidium bromide using a transilluminator (TFP-M/WL, USA).
4.5. Rabbit Immunization
We performed in accordance with the Directive guideline approved by The Animal Care and Use Committee of the Facultad de Medicina Veterinaria y Zootecnia of the Universidad Nacional Autonoma de Mexico, Ciudad de Mexico (project code 158) polyclonal antibodies against the MAP3773c protein were obtained using proteins in a 0.15 M NaCl solution mixed with aluminum hydroxide Al(OH)3 in PBS 1X (1 ml, final volume). A 100 μg protein sample was injected subcutaneously into New Zealand white rabbits. After two weeks, a second immunization was performed, using 100 μg of MAP3773c protein under the same conditions with aluminum hydroxide in PBS 1X. The third immunization was performed intravenously on day 30, using 50 μg of protein in NaCl solution 0.15 M. The fourth immunization was performed the next day, on day 31, under the same conditions as the third, only with protein 75 μg intravenously. The fifth immunization was performed on day 32, under the same conditions as the fourth, only protein 100 μg intravenously. The serum was obtained after one week and stored at -20°C until use.
4.6. Cloning pCDNA 3.1 and Map3773c Gene
The following oligonucleotides were used to amplify the fragment, which contains a recognition sequence for HindIII in the forward primer and for EcoRI in the reverse primer: AAGCTTGTGTCATCGCCCCCTGCGCC (Forward) and GATATCCGGTTGTGTGTTTTGGCAAA (Reverse). The PCR reactions were purified using the PureLink Quick PCR Kit (Invitrogen, Lithuania), and the resulting fragment was subjected to a double digestion with HindIII-HF and EcoRI-HF enzymes (Biolabs). After digestion, the fragment was purified again using the same kit. The plasmid pCDNA3.1 was also digested with HindIII-HF and EcoRI-HF enzymes and separated on a 1% agarose gel in TAE 1X. The agarose fragment was purified using the PureLink Quick Gel Extraction Kit (Invitrogen, Lithuania). The ligation reaction to fuse the two fragments was performed using T4 DNA ligase (Invitrogen) at a molar ratio of 1:3 (1M of pCDNA3.1: 3M of map3773c) in a final volume of 20 μL. The reaction buffer 2X and water free of nucleases were added to complete the 20 μL reaction. The reaction was incubated at room temperature for 18 hours, then heat-inactivated at 65°C for 10 minutes and cooled in ice. A 10 μL reaction aliquot was used to transform 50 μL of competent cells.
4.7. Sequencing
To ensure that the gene was accurately linked in the correct direction and size, we performed sequencing on the cloned map3773c fragment located in pcDNA3.1. External sequencing services were employed at the UNAM’s IBT for these procedures. The sequence can be located in the supplementary material.
4.8. Macrophages Culture J774 A.1
The murine macrophage cell line identified as J774 A.1, was procured from the American Type Culture Collection (ATCC, Manassas, VA) and cultured in Dulbecco-modified Eagle medium (DMEM, CORNING, USA) supplemented with 10% fetal bovine serum [36] and 1% penicillin-streptomycin. The macrophages were maintained in monolayer in 25 cm2 flasks at 37 °C and 5% CO2. The viability of the cell cultures was assessed using the trypan blue exclusion assay. The cells were counted in Newbauer’s chamber and seeded into individual wells for subsequent treatments.
4.9. Transfection of Macrophages J774A.1 with pCDNA-map3773c
The transfection experiments were conducted in 6-well plates with a seeding density of 150,000 cells per well and in T75 bottles. The experiments were performed in triplicate. The transfection mixture consisted of plasmid DNA mixed pCDNA-map3773c with HiperFect Transfection Reagent (QIAGEN) in DMEM supplemented with 10% FBS and neomycin at a ratio of 37.5 ng plasmid per 150,000 cells in 1 ml of media. For the 6-hour trial, after six hours of incubation, macrophages were removed from the transfection mixture, washed with sterile PBS 1X, and the cells were detached using a Cell Scraper, PE Blade (Thermo Fisher). The cells were then collected in sterile 2 mL cryotubes and stored at -70°C until use.
The transfection and collection of cells from each treatment were carried out at the corresponding time points, 6, 12, 24, and 48 hours.
4.10. qRT-PCR
4.10.1. Extraccion de RNA
We utilized the Qiagen, Inc. RNeasy Mini Kit to carry out total RNA extraction according to the manufacturer’s specifications. In brief, we processed a maximum of 1x10 7 of J774 A.1 macrophage by initially adding 350 μL RLT buffer and vortexing in 5 rounds of 5 seconds, followed by centrifugation for 3 minutes at 6000 rpm. The supernatant was then decanted, and 1 volume of 70% cold ethanol was added. After resuspension, 700 μL of the mixture was transferred to the RNeasy Mini spin column, which was centrifuged for 15 seconds at 8000 rpm. The supernatant was decanted, and 700 μL of RW1 buffer was added. After another centrifugation step, 500 μL of RPE buffer was added, followed by a second wash with RPE. The column was then dried by centrifugation for 1 minute at maximum speed before being transferred to a new tube. Finally, 50 μL of nuclease-free water was added to the center of the column, and the sample was centrifuged for 1 minute at 8000 rpm before being stored at -70° C.
4.10.2. Reverse Transcription
We performed reverse transcription using the High-capacity cDNA reverse transcription kit from Applied Biosystems. For every 5 μg of total RNA, we combined 1 μL of 100 pmol oligo dT and 1 μL of 0.5 mM, dNTP Mix 10mM, with nuclease-free water to reach a volume of 14.5 μL. Subsequently, we added 4 μL of 5X RT Buffer, 0.5 μL of RNase inhibitor, and 1 μL of Reverse Transcriptase to achieve a final volume of 20 μL for each reaction. The mixture underwent two precise cycles in a BIORAD Thermocycler programmed with the following conditions: 2 minutes at 25 °C, 10 minutes at 55 °C, 1 minute at 95 °C, and 4 °C for 1 minute. Finally, a 5-minute cycle at 4 °C was completed. The reaction was then kept at a standby temperature of 4 °C.
4.10.3. Real-Time PCR.
For the amplification of MAP3773c we use oligonucleotides forward, GAGCTCGTGTCATCGCCCGCTGGG and reverse AAGCTTTCACGGTTGTGTGTTTTG, respectively and Actin, we use the oligonucleotides published in [22] Forward, GGCTGTATTCCCCTCCATCG, Reverso, CCAGTTGGTAACAATGCCATGT, we performed two reactions separately; in each one, we put one μL oligo forward and reverse prepared at 10 μM, 10 μL of iTaq Universal SYBR® Green Supermix, five μL of each cDNA treatment, and then the volume was completed at 20 μL with nuclease-free water. The run was performed on the spot in the Biorad Real-Time PCR System. The equipment is programmed in 1 cycle of 3 min at 94°C, 40 cycles of 30 seconds at 94°C, 40 seconds at 63°C, 40 seconds at 72°C and finally 10 min at 72°C.
4.11. Western- Blotting
The Western blotting analysis followed the protocol outlined by Hernandez et al. [12]. Each treatment of macrophage culture contributed forty micrograms of total proteins, which were then separated using a 12% SDS-PAGE gel and transferred onto a nitrocellulose membrane. Subsequently, the nitrocellulose membranes were incubated overnight at 4 °C in 5% milk nonfat dry blotting grade and then with antibodies obtained from rabbits immunized with MAP3773c in milk. These antibodies were diluted 1:16 in 5% nonfat dry milk blotting grade (Apex, Genesee Scientific) in PBS 1X. Subsequently, the membranes underwent three washes with PBS1X-Tween 20, 0.05%. A second anti-rabbit antibody coupled to peroxidase (Sigma-Aldrich) was then added and incubated for one hour, followed by another round of washing with PBS 1X-Tween 20, 0.05%. Finally, the membranes were exposed to 3 Amino-9-ethyl carbazole (Sigma-Aldrich) and hydrogen peroxide as substrate in, 10 mM, acetate buffer, pH 5.
4.12. CHiP
The PierceTM Agarose ChIP Kit (Thermo Scientific) was used to carry out Chromatin immunoprecipitation (ChIP), following the manufacturer’s instructions. Two million macrophages were transfected and treated with different conditions for 24 and 48 hours. Macrophages were transfected with pCDNA-map3773c in the presence and absence of iron nitrile triacetic acid (FeNTA) at a 1:4 molar ratio. Immunoprecipitation was carried out using a polyclonal antibody against MAP3773c, with rabbit IgG serving as a negative control and RNA polymerase-like positive control. (Thermo Scientific). Precipitated DNAs were identified by PCR using specific primers that detect the two-box (EBOX and MBOX) binding of FPN1 to the mouse gene.
4.13. PCR Punto Final
We conducted a sequence alignment to detect sequences in the coding region of FPN1, where we suspect the MAP3773c protein interacts. To analyze the chromatin immunoprecipitates from different DNA treatments and controls, we conducted PCR to amplify a 204bp FPN1 band using specific oligonucleotides. Our PCR reactions successfully targeted both the EBOX and MBOX in a single reaction, as shown in Figure TAL. We used 12.5 μL of EmeraldAmp® GT PCR Master Mix, 1.5 μL of each forward and reverse oligonucleotides. The forward primer for EBOX was 5-GAGCTCCATTACAGAAACAAGTTTTT, and the reverse primer was CCCGGG CCTTAAATAACATACACCTC. For MBOX, the forward primer was 5-GACTTGTCCAAAAGGTTCAT, and the reverse primer was 5-ATACACACATTACTGTAATA. We used only the forward EBOX primer and reverse MBOX primer; the size of the fragments amplified was 204 pb proximity. Para actina los oligonucletidos utilizados fueron: Forward, GGC TGT ATT CCC CTC CAT CG, Reverso, CCA GTT GGT AAC AAT GCC ATG T, con un fragmento esperado a amplificar de 154pb, 5 μL of DNA, and 4.5 μL of nuclease-free water for the reaction setup. The BioRad T100 Thermal Cycler was utilized with the following cycling conditions: 95°C for 10 minutes, 54.5°C for 30 seconds, and 72°C for 45 seconds.The same reaction and temperature conditions were applied for the actin control. Following amplification, we separated the DNA using 1.2% agarose gel electrophoresis at 100V for 50 minutes and visualized the DNA bands by staining with ethidium bromide. A 100 bp ladder molecular weight marker was used for reference.
Supplementary Materials
The following supporting information can be downloaded at the website of this paper posted on Preprints.org, Figure S1: title; Table S1: title; Video S1: title.
Author Contributions
“Conceptualization, B.L.S. and J.A.G.P.; methodology, D.L.D.M., K.CH.Q., DM.D.P., J.R.CH., B.L.S. ; software, K.CH.Q., G.S.V., BLS; validation, D.L.D.M., K.CH.Q., D.M.D.P., B.L.S. G.S. P.; formal analysis, D.L.D.M., J.M., Giselle, ; investigation, B.L.S., D.L.D.M. K.CH.Q. D.M.D.P., G.S.P., J.M.A.Z., O.H.; resources, B.L.S., J.A.G.P., M.B.P.; data curation, B.L.S., D.L.D.M., J.M.A.Z.; writing—original draft preparation, B.L.S..; writing—review and editing, B.L.S.; visualization, B-L.S.; supervision, B.L.S., J.A.G.P., D.L.D.M. K.CH.Q. D.M.D.P., G.S.P., J.M.A.Z.,.R.J.CH.,; project administration, B.L.S., M.B.P.; funding acquisition, B.L.S., M.B.P., J.A.G.P.
Funding
This work was supported by the Consejo Nacional de Ciencia y Tecnología (CONACHYT) de México, Ciencia Básica del Fondo Sectorial, CB-2015/280536.
Institutional Review Board Statement
The animal study protocol was approved by the Institutional Review Board (or Ethics Committee) of Universidad Nacional Autonoma de Mexico (project code 158).
Informed Consent Statement
Not applicable.
Acknowledgments
Our gratitude to Nexus Medical Laboratory in Tijuana, Baja California, Mexico, and especially to Director Q.F.B. Ana María López, for providing us with the facility to conduct real-time PCR experiments.
Conflicts of Interest
The authors declare no conflicts of interest.
References
- Ganz, T. Cellular iron: ferroportin is the only way out Cell Metab 2005, 1, 155-157. [CrossRef]
- Donovan, A.; Brownlie, A.; Zhou, Y.; Shepard, J.; Pratt, S.J.; Moynihan, J.; Paw, BH.; Drejer, A.; Barut, B.; Zapata, A.; Law, TC.; Brugnara, C.; Lux SE, Pinkus, GS.; Pinkus, JL.; Kingsley, P.D.; Palis, J.; Fleming, MD.; Andrews, NC.; Zon, LI. Positional cloning of zebrafish ferroportin1 identifies a conserved vertebrate iron exporter. Nature 2000, 17,776-81. [CrossRef]
- Knutson, M.D.; Vafa, M.R.; Haile, D.J.; Wessling-Resnick, M. Iron loading and erythrophagocytosis increase ferroportin 1 (FPN1) expression in J774 macrophages. Blood 2003, 102,4191-7. [CrossRef]
- Park, B. Y., & Chung, J. 2008. Effects of various metal ions on the gene expression of iron exporter ferroportin-1 in J774 macrophages. Nutrition research and practice 2008, 2, 317–321. [CrossRef]
- Verma, S.; Prescott, R.; Cherayil, B. J. The commensal bacterium Bacteroides fragilis down-regulates ferroportin expression and alters iron homeostasis in macrophages. Journal of leukocyte biology 2019, 106, 1079–1088. [CrossRef]
- Van Zandt, K. E.; Sow, F. B.; Florence, W. C.; Zwilling, B. S.; Satoskar, A. R.; Schlesinger, L. S.; & Lafuse, W. P. The iron export protein ferroportin 1 is differentially expressed in mouse macrophage populations and is present in the mycobacterial-containing phagosome. Journal of leukocyte biology 2008, 84, 689–700. [CrossRef]
- Landeros-Sanchez, B.; Gutiérrez-Pabello.J.A.; Medina - Basulto G. E.; Rentería E. T.; Díaz- Aparicio, E.; Oshima, S. Mycobacterium avium subsp. paratuberculosis down-regulates mRNA expression of iron-induced macrophage Ferroportin 1. Veterinaria México OA 2016. 3, 1. [CrossRef]
- Jończy, A.; Mazgaj, R.; Smuda, E.; Żelazowska, B.; Kopeć, Z.; Starzyński, R. R.; & Lipinski, P. The Role of Copper in the Regulation of Ferroportin Expression in Macrophages Cells, 2021, 10(9), 2259. [CrossRef]
- Si, J.; Zhao, R.; Wu, R. An overview of the prediction of protein DNA-binding sites. Int J Mol Sci 2015, 16, 5194-215. [CrossRef]
- Shoyama, F.M.; Janetanakit, T.; Bannantine, J.P.; Barletta, R.G.; Sreevatsan, S. Elucidating the Regulon of a Fur-like Protein in Mycobacterium avium subsp. paratuberculosis (MAP). Front. Microbiol 2020, 11, 598. [CrossRef]
- Eckelt, E.; Jarek, M.; Frömke, C.; Meens, J.; Goethe, R. Identification of a lineage specific zinc responsive genomic island in Mycobacterium avium subsp. paratuberculosis. BMC Genomics 2014, 15,1076. [CrossRef]
- Hernández-Guevara, E.; Gutiérrez-Pabello, J. A.; Quintero-Chávez, K.; Brito-Perea, M. D. C., Hurtado-Ayala, L. A.; Ibarra-Molina, G.; Cortez-Hernández, O., Dueñas-Mena, D. L.; Fernández-Otal, Á.; Fillat, M. F., & Landeros-Sánchez, B. In Silico and In Vitro Analysis of MAP3773c Protein from Mycobacterium avium subsp. paratuberculosis. Biology 2022, 11(8), 1183. [CrossRef]
- Thapa, S.; Rathnaiah, G.; Zinniel, D. K.; Barletta, R. G.; Bannantine, J. P.; Huebner, M. & Sreevatsan, S. The Fur-like regulatory protein MAP3773c modulates key metabolic pathways in Mycobacterium avium subsp. paratuberculosis under in-vitro iron starvation. Scientific reports, 2024 14(1), 8941. [CrossRef]
- Escolar, L.; Pérez, M.J.; de Lorenzo, V. Opening the Iron Box: Transcriptional Metalloregulation by the Fur Protein. J. Bacteriol 1999, 181, 6223–6229. [CrossRef]
- Sala, C.; Forti, F.; Di Florio, E.; Canneva, F.; Milano, A.; Riccardi, G.; Ghisotti, D. Mycobacterium tuberculosis. FurA autoregulates its own expression. Journal of bacteriology. 2003, 185, 5357–5362. [CrossRef]
- Pettersen, E.F.; Goddard, T.D.; Huang, C.C.; Couch, G.S.; Greenblatt, D.M.; Meng, E.C.; Ferrin, T.E. UCSF Chimera--a visualization system for exploratory research and analysis. J Comput Chem 2004, 25(13):1605-12. [CrossRef]
- Michel, F. S. Python: A Programming Language for Software Integration and Development. J. Mol. Graphics Mod 1999, 17, 57-61.
- Eberhardt, J.; Santos-Martins, D.; Tillack A. F. and Forli, S. AutoDock Vina 1.2.0: New Docking Methods, Expanded Force Field, and Python Bindings. Journal of Chemical Information and Modeling 2021, 23, 61(8), 3891-3898. [CrossRef]
- Huang S.Y.; Zou X. A knowledge-based scoring function for protein-RNA interactions derived from a statistical mechanics-based iterative method. Nucleic Acids Res 2014,42-55. [CrossRef]
- Yan, Y.; Zhang, D.; Zhou, P.; Li, B.; Huang S.Y. HDOCK: a web server for protein-protein and protein-DNA/RNA docking based on a hybrid strategy. Nucleic Acids Res. 2017;45(1),365-373. [CrossRef]
- Biovia, D.S. 2019, Discovery Studio Visualizer, San Diego, accesed in december 2023.
- Veres-Székely, A.; Pap, D.; Sziksz, E.; Jávorszky, E.; Rokonay, R.; Lippai, R.; Tory, K.; Fekete, A.; Tulassay, T.; Szabó, A. J.; & Vannay, Á. Selective measurement of α smooth muscle actin: why β-actin can not be used as a housekeeping gene when tissue fibrosis occurs. BMC molecular biology 2017, 18(1), 12. [CrossRef]
- Abboud, S.; Haile,D.J. A Novel Mammalian Iron-regulated Protein Involved in Intracellular Iron Metabolism. Journal of Biological Chemistry 2000, 275 (26), 19906-19912. [CrossRef]
- Donovan, A.; Brownlie, A.; Zhou, Y.; Shepard, J.; Pratt, S.J.; Moynihan, J.; Paw, B.H.; Drejer, A.; Barut, B.; Zapata, A.; Law, T.C.; Brugnara, C.; Lux, S.E.; Pinkus, G.S.; Pinkus, J.L.; Kingsley, P.D.; Palis, J.; Fleming, M.D.; Andrews, N.C.; Zon, L.I. Positional cloning of zebrafish ferroportin1 identifies a conserved vertebrate iron exporter. Nature 2000, 17;403(6771),776-81. [CrossRef]
- Schmidt, I.H.E.; Gildhorn, C.; Böning, M.A.L.; Kulow V.A.; Steinmetz, I.; Bast, A. Burkholderia pseudomallei modulates host iron homeostasis to facilitate iron availability and intracellular survival. PLoS Negl Trop Dis 2018,12(1). [CrossRef]
- Kumar, G,; Adhikrao, P.A. Targeting Mycobacterium tuberculosis iron-scavenging tools: a recent update on siderophores inhibitors. RSC Med Chem. 2023, 14(10),1885-1913. [CrossRef]
- Sevilla, E.; Bes, M.T.; Peleato, M.L.; Fillat, M.F. Fur-like proteins: beyond the ferric uptake regulator (Fur) paralog. Arch. Biochem. Biophys 2021; 701,108770. [CrossRef]
- Mao, Ch.; Bo, W.; Yuhuan, H.; Weiting W.; Yudi, Z.; Samina, S.; Panting, L.; Yonghua, D.; Mengli, X.; Guoquan, H.; Mingxiong, H. Transcription factor shapes chromosomal conformation and regulates gene expression in bacterial adaptation, Nucleic Acids Research, 2024, 52 (10) 5643–5657. [CrossRef]
- Xue, D.; Zhou, C.; Shi, Y.; Lu, H.; Xu, R.; & He, X. Nuclear transcription factor Nrf2 suppresses prostate cancer cells growth and migration through upregulating ferroportin. Oncotarget 2016, 7(48), 78804–78812. [CrossRef]
- Jakubec, D.; Skoda, P.; Krivak, R.; Novotny, M.; & Hoksza, D. PrankWeb 3: accelerated ligand-binding site predictions for experimental and modelled protein structures. Nucleic acids research 2022,50 (1), 593–597. [CrossRef]
- Jendele, L.; Krivak, R.; Skoda, P.; Novotny, M.; & Hoksza, D. (2019). PrankWeb: a web server for ligand binding site prediction and visualization. Nucleic acids research 2019, 47(1), 345–349. [CrossRef]
- Krivák, R., Hoksza, D. P2Rank: machine learning based tool for rapid and accurate prediction of ligand binding sites from protein structure. J Cheminform 2018, 10, 39. [CrossRef]
- Hernandez, J.A.; Lopez-Gomollon, S.; Muro-Pastor, A.; Valladares, A. Bes. MT.; Peleato, M.L.; and Fillat, M.F. Interaction of FurA from Anabaena sp. PCC 7120 with DNA: a reducing environment and the presence of Mn(2+) are positive effectors in the binding to isiB and furA promoters. Biometals 2006,19, 259–268. [CrossRef]
- Metaane, S.; Monteil, V.; Ayrault, S.; Bordier, L.; Levi-Meyreuis, C.; & Norel, F. The stress sigma factor σS/RpoS counteracts Fur repression of genes involved in iron and manganese metabolism and modulates the ionome of Salmonella enterica serovar Typhimurium. PloS one 2022, 17(3). [CrossRef]
- Shin, J.H.; Oh, S.Y.; Kim, S.J.; Roe, J.H. The zinc-responsive regulator Zur controls a zinc uptake system and some ribosomal proteins in Streptomyces coelicolor A3(2). J Bacteriol 2007,189(11):4070-7. [CrossRef]
- Forero, M.E.; Marin M.; Llano, I.; Moreno, H.; Camacho, M. Leishmania amazonensis infection induces changes in the electrophysiological properties of macrophage-like cells. J.Membr Biol. 1999. 170:173-180. [CrossRef]
Disclaimer/Publisher’s Note: The statements, opinions and data contained in all publications are solely those of the individual author(s) and contributor(s) and not of MDPI and/or the editor(s). MDPI and/or the editor(s) disclaim responsibility for any injury to people or property resulting from any ideas, methods, instructions or products referred to in the content. |
© 2024 by the authors. Licensee MDPI, Basel, Switzerland. This article is an open access article distributed under the terms and conditions of the Creative Commons Attribution (CC BY) license (http://creativecommons.org/licenses/by/4.0/).
Copyright: This open access article is published under a Creative Commons CC BY 4.0 license, which permit the free download, distribution, and reuse, provided that the author and preprint are cited in any reuse.


