
Submitted:
17 October 2024
Posted:
17 October 2024
You are already at the latest version
Abstract
The impact of daily variations in habitual maternal intake on human milk (HM) composition has been poorly studied. We aimed to investigate the associations between day-to-day fluctuation in the micronutrient concentration in HM and daily maternal diet. To this end, an observational longitudinal study was carried out. A total of 143 lactating women each compiled a five-day weighed dietary record and concomitantly expressed milk for four successive days. Maternal daily intakes of micronutrients and food groups were analyzed. Free thiamine, free riboflavin, nicotinamide, pantothenic acid, pyridoxal, folic acid, cobalamin, ascorbic and dehydroascorbic acids, retinol, alpha- and gamma-tocopherol, cholecalciferol, and calcidiol in HM were determined for each of the four investigated days. A longitudinal data analysis with generalized estimating equation models was performed. For each daily serving of meat, fish, and eggs, total vitamin D3 levels increased by 243.2 pg/mL (p=0.027) and selenium levels increased by 0.16 ppb (p=0.031) in HM. For every 1 mg/day of riboflavin supplementation, free riboflavin levels in HM increased by 28.6 mcg/L (p=0.019). Pyridoxal levels in HM increased by 6.3 mcg/L per 1 mg/day of vitamin B6 supplementation (p=0.001), and by 2 mcg/L per daily fruit ration (p=0.016). In conclusion, observational longitudinal analysis of HM in a sample of lactating women enables the quantification of the impact of diet and habitual supplement intake on day-to-day HM micronutrient variations.
Keywords:
breast milk
; lactating women
; intake
; vitamins
; minerals
; riboflavin
; pyridoxal
; vitamin D
; generalized estimating equations
; selenium
1. Introduction
Human milk (HM) is a dynamic fluid that changes depending on multiple factors, with maternal diet being one of the most relevant [1,2,3]. However, the effect of maternal diet on the composition of HM is not the same for all nutrients and in all circumstances [3,4].
A recently published systematic review [5] found strong evidence for the influence of maternal intake of docosahexaenoic acid (DHA); eicosapentaenoic acid; vitamins A, E, and K; iodine; and selenium on the concentration of these nutrients in HM. Weaker evidence of the impact of maternal intake of linolenic acid, group B vitamins, and vitamins C and D on their concentration in milk was found in the same systematic review [5]. However, it is notable that the investigation of micronutrients is much more limited when compared to that of fatty acids [5,6]. In addition, most of the studies evaluating micronutrients, as observed by the above-mentioned systematic review, were experimental studies, rather than observational studies, and mostly with doses of supplements higher than the recommended daily intakes [5]. In this regard, it is likely that in healthy women, the levels of some nutrients in HM, such as fat-soluble vitamins and vitamin C, respond only to high doses of supplementation and not to lower doses of supplementation or to variations within the habitual diet [4,5,7].
To our knowledge, the day-to-day changes in milk micronutrient composition attributed to daily fluctuations in usual diet and/or micronutrient intake in lactating women under non-experimental conditions and at a group level rather than individually have not yet been evaluated yet. However, this approach could be useful for better understanding the behavior of HM in response to dietary variations under real-life conditions. Such information could provide valuable support for establishing dietary recommendations for lactating women at the population level or in specific settings such as human milk banks.
Hence, the objective of this study was to evaluate the association between variations in maternal dietary and supplementation intake and variations in HM micronutrient composition over four consecutive days.
2. Materials and Methods
2.1. Study Design and Participants
This observational longitudinal study was carried out at the Aladina MGU Regional Human Milk Bank (RHMB) at the “12 de Octubre” University Hospital in Madrid, Spain. A group of lactating mothers was recruited from August 2017 to February 2020, comprising (1) HM donors from the RHMB, (2) lactating mothers of very preterm infants (i.e., ≤32 weeks of gestational age (GA)-admitted at the time of the study to the Neonatology Service of the "12 de Octubre" University Hospital), and (3) lactating mothers with vegetarian or vegan diet.
The lactation time had to be at least 3 weeks, so that all of the milk samples analyzed corresponded to mature milk.
Exclusion criteria were malabsorptive intestinal disease, the use of drugs that could modify appetite, nutrient absorption or metabolism (antineoplastic drugs, anorectics, anabolic agents, diuretics, etc.), and idiomatic barrier.
The study was conducted in accordance with the Declaration of Helsinki and was approved by the Clinical Research Ethics Committee of the "12 de Octubre" University Hospital (protocol code 15/269). All participants gave written informed consent.
2.2. Study Protocol
At the beginning of the study, socio-demographic, health and anthropometric data were collected from the participants and their breastfed children. Thee recruited lactating women were also weighed and measured, and their body mass indexes (BMIs) were calculated (electronic medical scale with BMI function Model 799 with measuring rod Model 220, CE approved—Class III, brand Seca®, Hamburg, Germany). Subsequently, they had to fill in a weighted dietary record for 5 consecutive days, including a holiday. Food intake and micronutrient supplementation were carefully reported. Detailed information of the recording method is described elsewhere [8]. Simultaneously, they collected milk for four consecutive days (from the second to the fifth day of the dietary record) (Figure 1).
Milk donors and lactating mothers with a vegetarian or vegan diet followed the same milk collection protocol: both groups of women collected at least one milk sample per day, without changing their milk expression routine and, therefore, without following a fixed schedule. The only requirement was to collect a complete milk expression. From each milk expression, after gently shaking, they collected 25 mL of milk with a sterile syringe, placing it in a sterile transparent glass bottle. The identification code as well as the date, time, and volume of the milk expression was labeled in the bottle before the sample was frozen to -20 °C. Mothers of very preterm infants admitted to our neonatal unit performed a 24-hour milk expression. Therefore, they collected a sample from each of the milk extractions carried out during the day to obtain a total volume of approximately 25 mL for each day. Otherwise, the procedure was the same as described above.
The five-day dietary record and milk samples were submitted to the RHMB within 15 days of study completion. The milk samples were transported to the RHMB in a portable cooler with cold accumulators. At RHMB, milk was thawed and, if available, milk samples from the same day were mixed, while milk from different days was not mixed, as the HM micronutrient composition of each day was analyzed individually. Twenty aliquots of 1 mL of the milk from each day were obtained. Each milk aliquot was labeled with the identification code and the day of the study to which it belonged. Subsequently, milk aliquots were kept frozen at -80 °C in the RHMB until they were sent for analysis.
2.3. Dietary Study
The weighed five-day dietary record was analyzed using DIAL-Software® (DIAL.EXE version 3, February 2014, Alce Ingeniería, Madrid, Spain), and the nutrient intake for each day as well as the daily intake of each of the following food groups were obtained: (1) fruit; (2) vegetables and greens; (3) dairy; (4) grains, legumes, and nuts; and (5) eggs, meat, and fish. The daily intake from pharmacological supplements of each of the micronutrients investigated was also determined.
2.4. Micronutrient Analysis in HM
Micronutrient analyses in milk were performed by the NUTREN-Nutrigenomics Group of the Department of Experimental Medicine at the University of Lleida, Spain.
The following vitamins and minerals were analyzed in milk: free thiamine, free riboflavin, nicotinamide, pantothenic acid, pyridoxal, folic acid, cobalamin, ascorbic acid, dehydroascorbic acid, retinol, vitamin D3, 25(OH)D3, α-tocopherol, γ-tocopherol, iodine, calcium, phosphorous, and selenium. Table 1 shows the analytical techniques employed to determine each of the micronutrients studied. A full description of the laboratory studies is available in a previous manuscript [9].
2.5. Statistics
Statistical analysis was performed with the STATA 14 program.
For the descriptive analysis, qualitative variables were shown as absolute and relative frequencies and quantitative variables as medians and interquartile range or as means and the standard deviation depending on their distribution. Normality was determined by applying the Shapiro–Wilk normality test.
Longitudinal analyses were conducted to examine the possible association between daily changes in micronutrient levels in HM over a span of 4 days and the day-to-day intake of the equivalent micronutrients and supplements as well as different food groups. Hence, generalized estimating equations (GEE) models were employed using the vitamin and mineral concentration in HM as a dependent variable and the daily intake levels of different food groups, micronutrients, and supplements as independent variables. In this sense, the obtained results will inform about how the day-to-day fluctuations in the average micronutrient content in the HM of the investigated lactating mothers are related to the day-to-day fluctuations in their average micronutrient, supplement, and food group intake. A p-value of < 0.05 was considered statistically significant.
3. Results
A total of 146 lactating women were recruited, of whom 3 dropped out of the study early, resulting in 143 women completing the study. Of the 143 women who completed the study, 113 were milk donors, 15 were mothers of very preterm infants admitted to the neonatal service, and 20 were vegetarians or vegans. The groups were not mutually exclusive. Thus, three of the donors were also mothers of very preterm infants admitted to the neonatal service, and another two were also ovo-lacto-vegetarians. In total, the study included 123 omnivores, 9 vegetarians (5 ovo-vegetarians and 4 ovo-lacto-vegetarians), and 11 vegans. Regarding the breastfed infants, at the time of the study, there were 17 preterm infants not admitted to the neonatal service (gestational age from 22+6 weeks to 36+4 weeks; from 38+5 weeks of postmenstrual age to 19.2 months of corrected age) and 15 very preterm infants admitted at the time of the study to the neonatal service (gestational age range from 23+5 weeks to 30+3 weeks; postmenstrual age range from 27+4 weeks to 41+1 weeks).
Figure 2 shows the distribution of the participants by group.
3.1. Characteristics of the Studied Population
Results from the socio-demographic, health, and anthropometric data are presented in Table 2, Table 3, Table 4, Table 5 and Table 6. Furthermore, Table 7 shows the average vitamin and mineral concentration in human milk of lactating women collected during four successive days. In terms of nutrient supplementation reported in the socio-demographic and health survey, 141 of 143 lactating women (98.6%) declared using pharmacological micronutrient supplements during pregnancy, and 129 of 143 (90.2%) during lactation. Most participants took folic acid (n = 138 (96.5%)), vitamin B12 (n = 135 (94.4%)), and iodine (n = 136 (95,1%)) supplements during pregnancy.
3.1. Generalized Estimating Equations
Table 8 shows the association between day-to-day fluctuations in the average micronutrient content in HM across the entire sample of lactating women and the day-to-day fluctuations in their average food and supplement intake according to the dietary record.
For some of the micronutrients studied, the GEE analyses revealed some positive associations between lactating mothers’ intake and their concentration in milk over the days studied.
Regarding vitamins, (1) for each daily serving of meat, fish, and eggs, total vitamin D3 levels in HM increased by 243.2 pg/mL (p=0.027); (2) for every 1 mg/day of riboflavin supplementation, free riboflavin levels in HM increased by 28.6 mcg/L (p=0.019); and (3) regarding vitamin B6, pyridoxal levels in HM increased by 6.3 mcg/L per 1 mg/day of vitamin B6 supplementation (p=0.001), and by 2 mcg/L per daily fruit ration (p=0.016), according to the adjusted coefficients of the model.
Concerning minerals, for each daily serving of meat, fish, and eggs, the daily selenium levels in HM increased by approximately 0.16 ppb (p=0.031).
No associations were found for the rest of the micronutrients studied (free thiamine, nicotinamide, pantothenic acid, folic acid, cobalamin, ascorbic acid, dehydroascorbic acid, retinol, α-tocopherol, γ-tocopherol, iodine, calcium, and phosphorous).
4. Discussion
To the best of our knowledge, this is the first study to longitudinally assess the effect of variations in the habitual diet and supplementation on daily variations in milk micronutrients in a sample of lactating women with different dietary patterns, gestational ages, and a wide range of lactation durations. Compared to other investigations regarding changes over time in HM micronutrient concentration, this was an observational study conducted under real-life conditions. That is, no intervention or modification of diet or regular intake of micronutrient supplements was made. A detailed study of the diet was carried out through a weighted dietary record compiled for 5 days in a row. Concomitantly, women expressed milk for 4 consecutive days, and the micronutrient content was analyzed on each of the days studied.
Under these conditions, we found that the usual day-to-day variations in the diet or the intake of commonly used supplements of lactating women had an impact on the fluctuation in the concentration of some micronutrients in their milk over the 4 days studied.
A positive association between the intake of daily servings of meat, fish, and eggs and the concentration of total vitamin D and selenium in milk was found. Likewise, the intake of vitamin B2 and B6 supplements contained in multi-nutrient supplements designed for lactating women in Spain was related to an increase in the content of free riboflavin and pyridoxal in milk. In addition, a higher daily intake of fruit was associated with an increased pyridoxal content in milk.
This should encourage medical professionals to emphasize the importance of women's nutrition during lactation; at the level of human milk banks, this knowledge may lead to the implementation of measures to optimize donors’ intake of micronutrients in order to increase the quality of donor HM. We should be aware that the diet of lactating mothers is a modifiable factor that can be improved with simple health advice.
The associations found are consistent with the limited knowledge available from studies with a cross-sectional design as well as with a longitudinal design but with an experimental design. In the literature, vitamin B2 and B6 concentrations in HM are strongly associated with maternal intake [2,3,4,30]. Concerning selenium, the levels of this mineral are usually high in eggs, meat, poultry, fish, and seafood [31]. Indeed, a previous study conducted in Italy [32] found a positive association between mother’s egg intake during gestation and fresh fish intake during lactation and the selenium content in HM. A recent systematic review concluded that there is a strong response of selenium content in milk to maternal selenium intake [5]. A transversal study in Galicia, a region of Spain, showed a positive correlation between adherence to the Mediterranean diet of lactating women (compared to the Atlantic diet) and the concentration of selenium in their milk [33]. Regarding vitamin D, there is some evidence of the response of vitamin D in HM to the mother's diet [4,5]. Eggs, meat, and fish are also good dietary sources of vitamin D, especially eggs, tuna, herring, and sardines [34]. However, concerns about the mercury content of fish can lead to restrictive fish consumption behaviors by pregnant and lactating women. Nevertheless, in a previous study, no significant relationship was found between mercury levels in HM and maternal consumption of any category of fish. Interestingly, the multiple linear regression models showed a negative association between maternal intake of freshwater fish and mercury levels in HM [35]. Small oily fish, such as salmon, sardines, mackerel, trout, anchovy, and herring, are valuable foods for breastfeeding mothers as they are a good source of selenium, vitamin D, and also omega-3, while being lower in mercury than other species [36,37].
On the other hand, we were not able to demonstrate the effect of habitual changes in mothers' diet on the content in the milk of other micronutrients such as vitamin A, E, B1, C, and iodine. However, the concentration of all these nutrients in HM has been shown to be influenced by dietary or supplemental intake in cross-sectional and/or longitudinal experimental studies [3,5,7,8,38]. One possible explanation is that small daily variations in the usual maternal diet or low-dose supplementation of these nutrients are probably not sufficient to influence daily milk concentration in well-nourished women. In fact, in a systematic review, higher doses of supplementation showed greater effects [7]. However, we cannot rule out that we were not able to detect associations that truly exist, as we did not control for possible confounding factors such as circadian rhythm, or the time elapsed between feeding and expression of milk. In a study conducted by Hampel et al. [39], afternoon and evening expressions provided the most representative milk samples for the micronutrient study, and acute effects of supplementation were observed for vitamins B1, B2, B6, and A at 2-4 h after administration. Nevertheless, in our study, we did not determine a schedule for milk sampling, but the women extracted their milk at the time that suited them best. It is also feasible that a larger sample size would have yielded significant results for some of the micronutrients not associated with diet in the present study.
5. Conclusions
Observational longitudinal analysis of successive days allows the quantification of the impact of habitual variations in diet and/or common supplement intake on day-to-day HM vitamin D, free riboflavin, pyridoxal, and selenium variations in a population of lactating women. This should encourage medical professionals to emphasize the importance of women's nutrition during lactation and promote measures to improve their nutrient intake.
Author Contributions
Conceptualization, N.U.-V., D.E.-V., N.R.G.-L., and C.R.P.-A.; methodology, N.U.-V., D.E.-V., and J.C.E.S.; formal analysis, N.U.-V., K.K., and A.M.-P.; investigation, N.U.-V., K.K, D.E.-V., and J.C.E.S.; writing—original draft preparation, N.U.-V., K.K., and A.M.-P.; writing—review and editing, N.U.-V., A.M.-P., K.K., D.E.-V., J.C.E.S., N.R.G.-L., and C.R.P.-A.; project administration, N.U.-V., N.R.G.-L., and C.R.P.-A.; funding acquisition, N.U.-V., D.E.-V., N.R.G.-L., and C.R.P.-A. All authors have read and agreed to the published version of the manuscript.
Funding
This research was funded by a grant from the Spanish Research Projects in Health funded by Instituto de Salud Carlos III (ISCIII)—the State Plan for Scientific and Technical Research and Innovation (grant FIS PI15/00995). Furthermore, this work received support from RETICS “Maternal and Child Health and Development Network” (SAMID Network) (RD16/0022/0015) and from the Spanish Ministry of Science, Innovation, and Universities (project PDI2020-114821RB-I00).
Institutional Review Board Statement
The study was conducted in accordance with the Declaration of Helsinki and approved by the Hospital 12 de Octubre’s Clinical Research Ethics Committee (protocol code 15/269, 29 September 2015).
Informed Consent Statement
Informed consent was obtained from all subjects involved in the study.
Data Availability Statement
The data presented in this study are available on request from the corresponding author. The data are not publicly available due to privacy issues.
Acknowledgments
We would like to thank our donors, the mothers of very premature babies admitted to our unit, and the vegetarian/vegan lactating mothers who altruistically participated in our study. Thank you for your generosity, which made this research possible. We also want to acknowledge the contribution of RETICS “Maternal and Child Health and Development Network” (SAMID Network).
Conflicts of Interest
The authors declare no conflicts of interest.
References
- Picciano, M.F. Nutrient composition of human milk. Pediatr. Clin. North. Am. 2001, 48, 53–67. [Google Scholar] [CrossRef] [PubMed]
- Bravi, F.; Wiens, F.; Decarli, A.; Dal Pont, A.; Agostoni, C.; Ferraroni, M. Impact of maternal nutrition on breast-milk composition: A systematic review. Am. J. Clin. Nutr. 2016, 104, 646–662. [Google Scholar] [CrossRef] [PubMed]
- Keikha, M.; Bahreynian, M.; Saleki, M.; Kelishadi, R. Macro- and Micronutrients of Human Milk Composition: Are They Related to Maternal Diet? A Comprehensive Systematic Review. Breastfeed. Med. 2017, 12, 517–527. [Google Scholar] [CrossRef]
- Dror, D.K.; Allen, L.H. Overview of Nutrients in Human Milk. Adv Nutr. 2018, 9, 278S–294S. [Google Scholar] [CrossRef]
- Falize, C.; Savage, M.; Jeanes, Y.M.; Dyall, S.C. Evaluating the relationship between the nutrient intake of lactating women and their breast milk nutritional profile: a systematic review and narrative synthesis. Br. J. Nutr. 2024, 131, 1196–1224. [Google Scholar] [CrossRef]
- Petersohn, I.; Hellinga, A.H.; van Lee, L.; Keukens, N.; Bont, L.; Hettinga, K.A.; Feskens, E.J.M.; Brouwer-Brolsma, E.M. Maternal diet and human milk composition: an updated systematic review. Front. Nutr. 2024, 10, 1320560. [Google Scholar] [CrossRef]
- Keikha, M.; Shayan-Moghadam, R.; Bahreynian, M.; Kelishadi, R. Nutritional supplements and mother's milk composition: a systematic review of interventional studies. Int Breastfeed J. 2021, 16, 1. [Google Scholar] [CrossRef]
- Ureta-Velasco, N.; Keller, K.; Escuder-Vieco, D.; Serrano, J.C.E.; García-Lara, N.R.; Pallás-Alonso, C.R. Assessment of Iodine Concentration in Human Milk from Donors: Implications for Preterm Infants. Nutrients 2022, 14, 4304. [Google Scholar] [CrossRef]
- Ureta-Velasco, N.; Keller, K.; Escuder-Vieco, D.; Fontecha, J.; Calvo, M.V.; Megino-Tello, J.; Serrano, J.C.E.; Romero Ferreiro, C.; García-Lara, N.R.; Pallás-Alonso, C.R. Human Milk Composition and Nutritional Status of Omnivore Human Milk Donors Compared with Vegetarian/Vegan Lactating Mothers. Nutrients 2023, 15, 1855. [Google Scholar] [CrossRef]
- Olsen, I.E.; Groveman, S.A.; Lawson, L.M.; Clark, R.H. , Zemel, B.S. New intrauterine growth curves based on United States Data. Pediatrics 2010, 125, 214–224. [Google Scholar] [CrossRef]
- World Health Organization. WHO Child Growth Standards: Length/Height-for-Age, Weight-for-Age, Weight-for-Length, Weight-fo-Height and Body Mass Index-for-Age: Methods and Development; World Health Organization: Geneva, Switzerland, 2006; ISBN 92-4-154693-X. [Google Scholar]
- Allen, L.H.; Carriquiry, A.L.; Murphy, S.P. Perspective: Proposed Harmonized Nutrient Reference Values for Populations. Adv. Nutr. 2020, 11, 469–483. [Google Scholar] [CrossRef] [PubMed]
- Gibson, R.S.; Rahmannia, S.; Diana, A.; Leong, C.; Haszard, J.J.; Hampel, D.; Reid, M.; Erhardt, J.; Suryanto, A.H.; Sofiah, W.N.; et al. Association of maternal diet, micronutrient status, and milk volume with milk micronutrient concentrations in Indonesian mothers at 2 and 5 months postpartum. Am. J. Clin. Nutr. 2020, 112, 1039–1050. [Google Scholar] [CrossRef] [PubMed]
- urck, D.; Bresson, J.L.; Burlingame, B.; Dean, T.; Fairweather-Tait, S.; Heinonen, M.; Hirsch-Ernst, K.I.; Mangelsdorf, I.; McArdle, H.J.; et al.; EFSA Panel on Dietetic Products, Nutrition and Allergies (NDA) Dietary reference values for thiamin. EFSA J. 2016, 14, 4653. [Google Scholar] [CrossRef]
- Turck, D.; Bresson, J.-L.; Burlingame, B.; Dean, T.; Fairweather-Tait, S.; Heinonen, M.; Hirsch-Ernst, K.; Mangelsdorf, I.; McArdle, H.; et al.; EFSA Panel on Dietetic Products, Nutrition and Allergies (NDA) Dietary Reference Values for riboflavin. EFSA J. 2017, 15, 4919. [Google Scholar] [CrossRef]
- EFSA Panel on Dietetic Products, Nutrition and Allergies (NDA). Scientific Opinion on Dietary Reference Values for niacin. EFSA J. 2014, 12, 3759. [Google Scholar] [CrossRef]
- EFSA Panel on Dietetic Products, Nutrition and Allergies (NDA). Scientific Opinion on Dietary Reference Values for pantothenic acid. EFSA J. 2014, 12, 3581. [Google Scholar] [CrossRef]
- EFSA Panel on Dietetic Products, Nutrition and Allergies (NDA). Scientific Opinion on nutrient requirements and dietary intakes of infants and young children in the European Union. EFSA J. 2013, 11, 3408. [Google Scholar] [CrossRef]
- EFSA Panel on Dietetic Products, Nutrition and Allergies (NDA). Scientific Opinion on Dietary Reference Values for cobalamin (vitamin B12). EFSA J. 2015, 13, 4150. [Google Scholar] [CrossRef]
- EFSA Panel on Dietetic Products, Nutrition and Allergies (NDA). Scientific Opinion on Dietary Reference Values for vitamin C. EFSA J. 2013, 11, 3418. [Google Scholar] [CrossRef]
- EFSA Panel on Dietetic Products, Nutrition and Allergies (NDA). Scientific Opinion on Dietary Reference Values for vitamin A. EFSA J. 2015, 13, 4028. [Google Scholar] [CrossRef]
- EFSA Panel on Dietetic Products, Nutrition and Allergies (NDA). Scientific opinion on dietary reference values for vitamin D. EFSA J. 2016, 14, 4547. [Google Scholar] [CrossRef]
- EFSA Panel on Dietetic Products, Nutrition and Allergies (NDA). Scientific Opinion on Dietary Reference Values for vitamin E as α-tocopherol. EFSA J. 2015, 13, 4149. [Google Scholar] [CrossRef]
- Semba, R.D.; Delange, F. Iodine in human milk: Perspectives for infant health. Nutr. Rev. 2001, 59, 269–278. [Google Scholar] [CrossRef] [PubMed]
- Andersson, M.; Braegger, C.P. The role of iodine for thyroid function in lactating women and infants. Endocr. Rev. 2022, 43, 469–506. [Google Scholar] [CrossRef] [PubMed]
- EFSA Panel on Dietetic Products, Nutrition and Allergies (NDA). Scientific Opinion on Dietary Reference Values for calcium. EFSA J. 2015, 13, 4101. [Google Scholar] [CrossRef]
- EFSA Panel on Dietetic Products, Nutrition and Allergies (NDA). Scientific Opinion on Dietary Reference Values for phosphorus. EFSA J. 2015, 13, 4185. [Google Scholar] [CrossRef]
- EFSA Panel on Dietetic Products, Nutrition and Allergies (NDA). Scientific Opinion on Dietary Reference Values for selenium. EFSA J. 2014, 12, 3846. [Google Scholar] [CrossRef]
- LASER Analytica. Comprehensive literature search and review of breast milk composition as preparatory work for the setting of dietary reference values for vitamins and minerals. EFSA Support. Publ. 2014, 11, 629E. [Google Scholar] [CrossRef]
- Kodentsova, V.M.; Vrzhesinskaya, O.A. Evaluation of the vitamin status in nursing women by vitamin content in breast milk. Bull Exp Biol Med. 2006, 141, 323–7. [Google Scholar] [CrossRef]
- Ullah, H.; Liu, G.; Yousaf, B.; Ali, M.U.; Abbas, Q.; Munir, M.A.M.; Mian, M.M. Developmental selenium exposure and health risk in daily foodstuffs: A systematic review and meta-analysis. Ecotoxicol. Environ. Saf. 2018, 149, 291–306. [Google Scholar] [CrossRef]
- Valent, F.; Horvat, M.; Mazej, D.; Stibilj, V.; Barbone, F. Maternal diet and selenium concentration in human milk from an Italian population. J. Epidemiol. 2011, 21, 285–92. [Google Scholar] [CrossRef] [PubMed]
- Sánchez, C.; Fente, C.; Barreiro, R.; López-Racamonde, O.; Cepeda, A.; Regal, P. Association between Breast Milk Mineral Content and Maternal Adherence to Healthy Dietary Patterns in Spain: A Transversal Study. Foods 2020, 9, 659. [Google Scholar] [CrossRef] [PubMed]
- Utri, Z.; Głąbska, D. Vitamin D Intake in a Population-Based Sample of Young Polish Women, Its Major Sources and the Possibility of Meeting the Recommendations. Foods 2020, 9, 1482. [Google Scholar] [CrossRef] [PubMed]
- Ursinyova, M.; Masanova, V.; Uhnakova, I.; Murinova, L.P.; Patayova, H.; Rausova, K.; Trnovec, T.; Stencl, J.; Gajdos, M. Prenatal and Early Postnatal Exposure to Total Mercury and Methylmercury from Low Maternal Fish Consumption. Biol Trace Elem Res. 2019, 191, 16–26. [Google Scholar] [CrossRef] [PubMed]
- EFSA Panel on Contaminants in the Food Chain (CONTAM); Scientific Opinion on the risk for public health relates to the presence of mercury and methylmercury in food. EFSA J. 2012, 10, 2985. [CrossRef]
- Costa, F.; Coelho, J.P.; Baptista, J.; Martinho, F.; Pereira, M.E.; Pardal, M.A. Mercury accumulation in fish species along the Portuguese coast: Are there potential risks to human health? Mar Pollut Bull. 2020, 150, 110740. [Google Scholar] [CrossRef]
- Ureta-Velasco, N.; Montealegre-Pomar, A.; Keller, K.; Escuder-Vieco, D.; Fontecha, J.; Calvo, M.V.; Megino-Tello, J.; Serrano, J.C.E.; García-Lara, N.R.; Pallás-Alonso, C.R. Associations of Dietary Intake and Nutrient Status with Micronutrient and Lipid Composition in Breast Milk of Donor Women. Nutrients 2023, 15, 3486. [Google Scholar] [CrossRef]
- Hampel, D.; Shahab-Ferdows, S.; Islam, M.M.; Peerson, J.M.; Allen, L.H. Vitamin Concentrations in Human Milk Vary with Time within Feed, Circadian Rhythm, and Single-Dose Supplementation. J Nutr. 2017, 147, 603–611. [Google Scholar] [CrossRef]
Figure 1.
Protocol for completion of the dietary record and collection of milk samples over time.
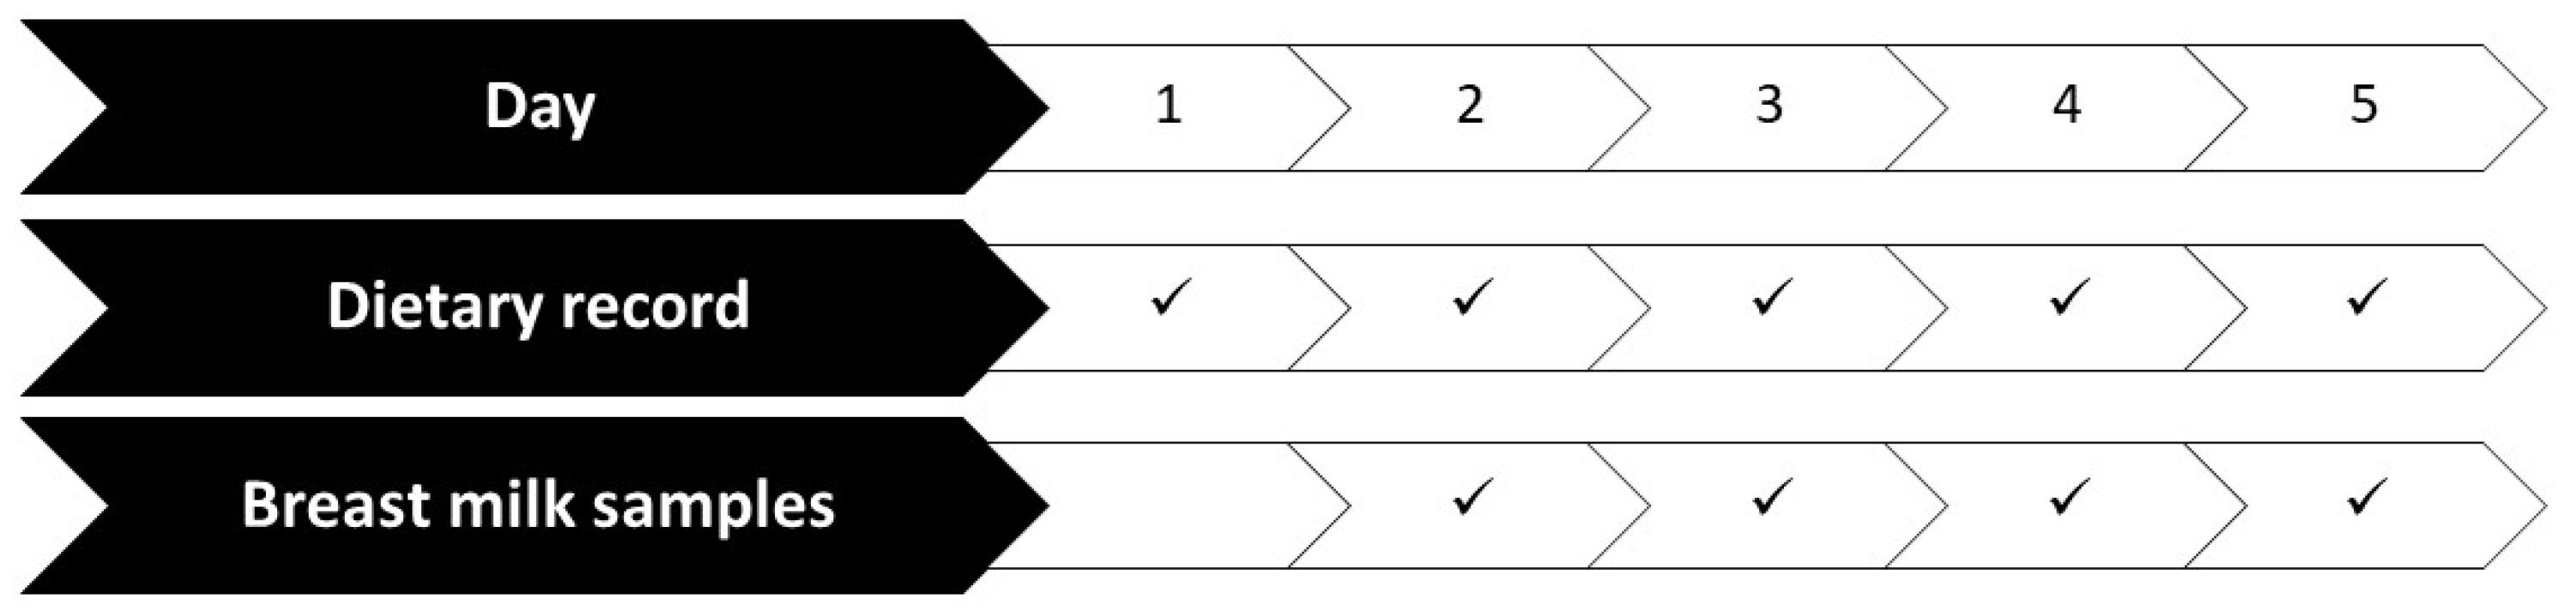
Figure 2.
Distribution of participants (n=143) by group. Abbreviations: D, human milk donors; P, mothers of preterm infants less than 32 weeks gestational age admitted to the neonatal service; V, vegetarian or vegan mothers. Number of total human milk donors = 113 (108 + 2 + 3). Number of total mothers of preterm infants less than 32 weeks of gestational age admitted to the neonatal service = 15 (12 + 3). Number of total vegetarian or vegan mothers = 20 (18 +2).
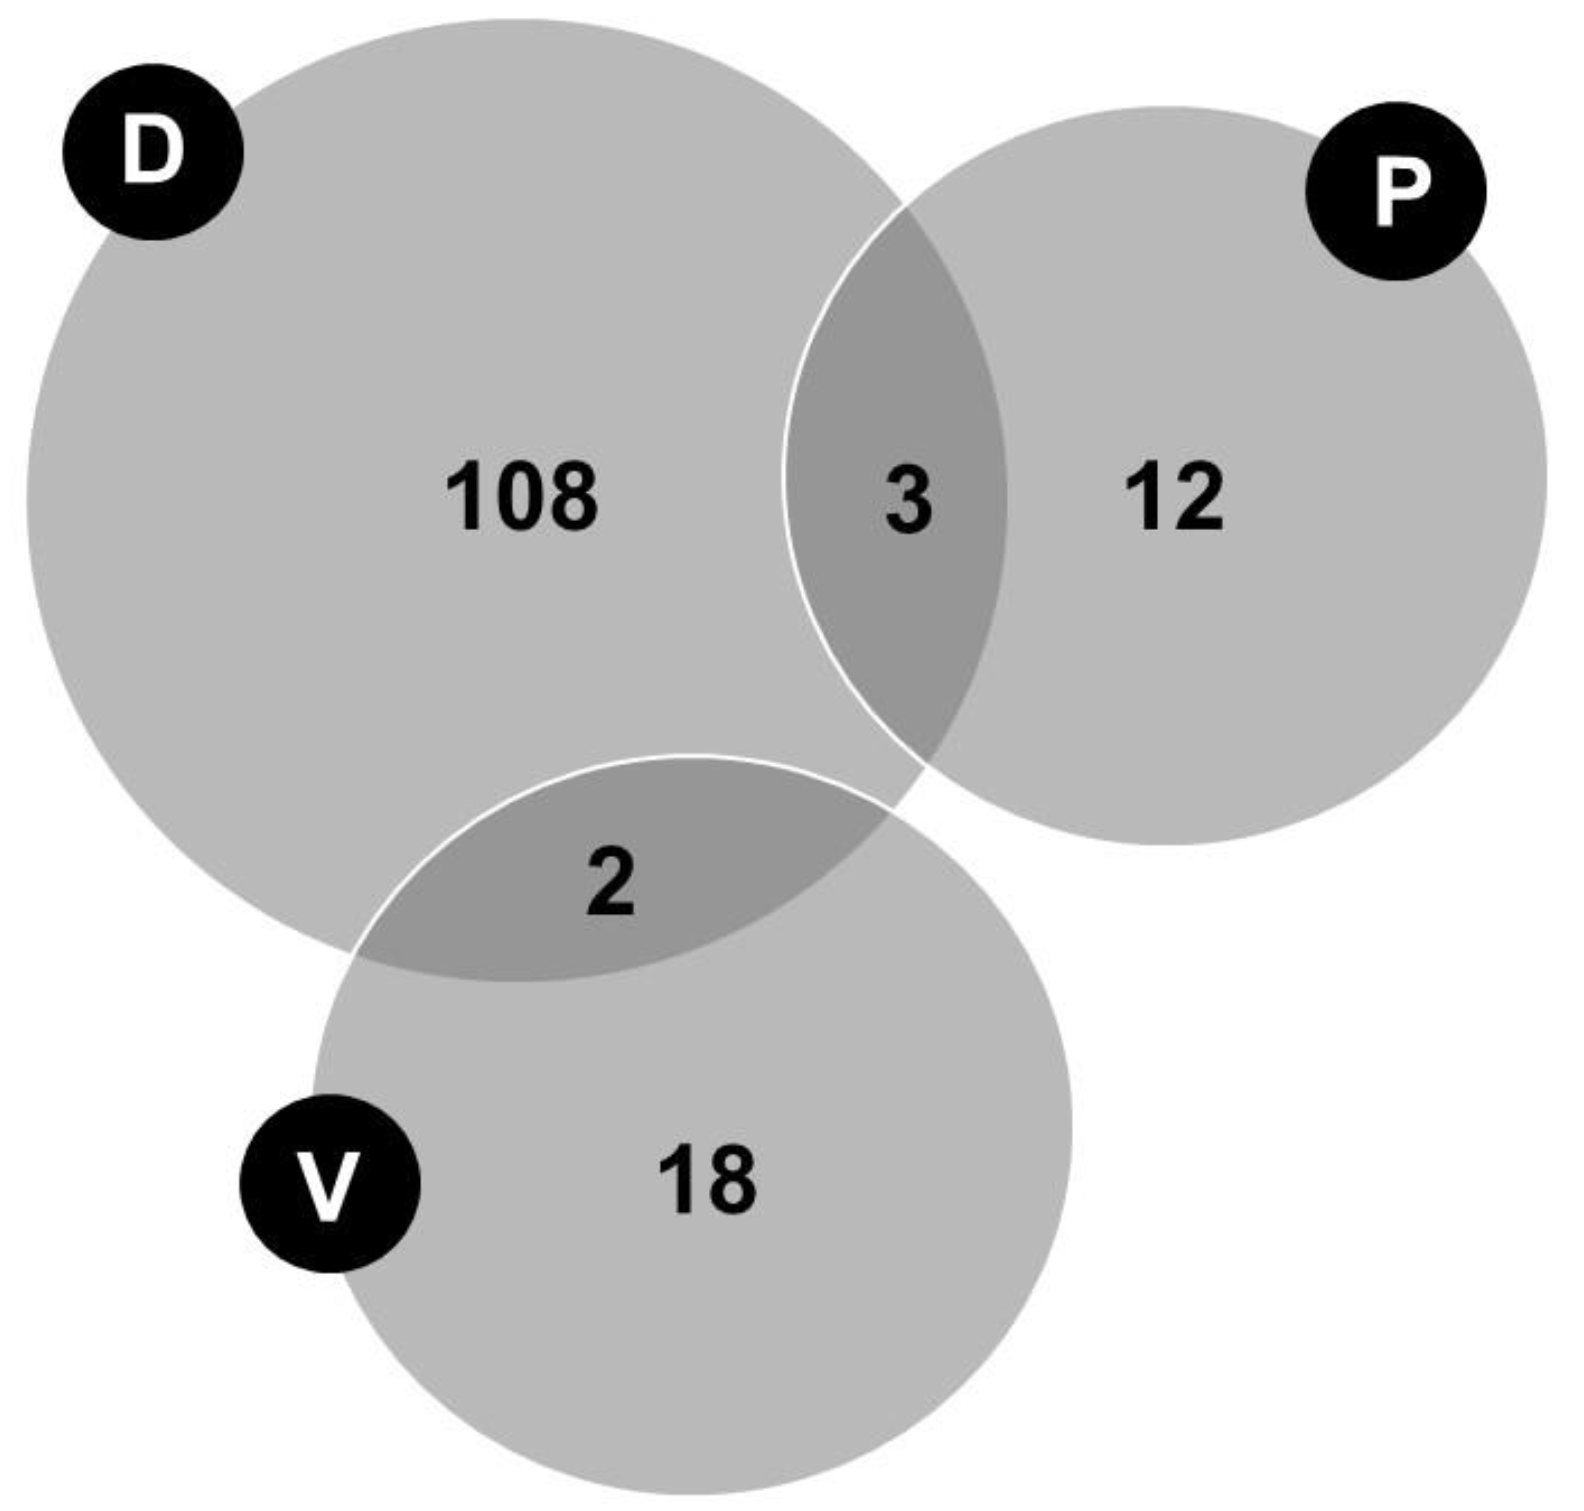

Table 1.
Analytical techniques used for the determination of micronutrients in human milk.
| Micronutrients | Analytical technique |
|---|---|
| Free thiamine | UPLC tandem mass spectrometry |
| Free riboflavin | UPLC tandem mass spectrometry |
| Nicotinamide | UPLC tandem mass spectrometry |
| Pantothenic acid | UPLC tandem mass spectrometry |
| Pyridoxal | UPLC tandem mass spectrometry |
| Folic acid | UPLC tandem mass spectrometry |
| Cobalamin | Competitive immunoassay method |
| Ascorbic acid | HPLC-DAD |
| Retinol | HPLC with a fluorescence and UV detector |
| Vitamin D3 | UPLC electrospray ionization/tandem mass spectrometry |
| 25(OH)D3 | UPLC electrospray ionization/tandem mass spectrometry |
| α-tocopherol | HPLC with a fluorescence and UV detector |
| γ-tocopherol | HPLC with a fluorescence and UV detector |
| Iodine | Inductively coupled plasma-mass spectrometry |
| Calcium | Inductively coupled plasma-mass spectrometry |
| Phosphorous | Inductively coupled plasma-mass spectrometry |
| Selenium | Inductively coupled plasma-mass spectrometry |
Abbreviations: UPLC, ultra-performance liquid chromatography; HPLC, high-performance liquid chromatography; DAD, diode array detector; UV, ultraviolet.
Table 2.
Lactating women characteristics (n = 143).
| Characteristic | |
|---|---|
| Age (years) | 35.61 (0.39) (4.67) * |
| Weight (kg) | 61.20 (55.20, 70.60) |
| Height (cm) | 163.85 (0.53) (6.39) * |
| Pre-pregnancy BMI (kg/m2) | 22.16 (20.55, 24.92) |
| Pre-pregnancy BMI (kg/m2) category | |
| Underweight (<18.5) | 6 (4.2%) |
| Normal (18.5–24.9) | 103 (72.0%) |
| Overweight (25–29.9) | 20 (14.0%) |
| Obese (≥30) | 14 (9.8%) |
| Current BMI (kg/m2) | 22.94 (21.12, 25.29) |
| Current BMI (kg/m2) category | |
| Underweight (<18.5) | 5 (3.5%) |
| Normal (18.5–24.9) | 101 (70.6%) |
| Overweight (25–29.9) | 19 (13.3%) |
| Obese (≥ 30) | 18 (12.6%) |
| Gestational weight gain (kg) | 11.00 (8.00, 13.60) |
| Postpartum weight retention (kg) | 1.00 (-0.60, 3.00) |
| Number of living children | |
| 0a –1 | 81 (56.6%) |
| 2 | 49 (34.3%) |
| ≥3 | 13 (9.1%) |
| Country of origin: Spain | 125 (87.4%) |
| Education level | |
| Secondary studies | 6 (4.2%) |
| Technical studies | 17 (11.9%) |
| University studies | 120 (83.9%) |
| Currently working (Yes) | 65 (45.5%) |
| Physical activity | |
| Sedentary | 35 (24.5%) |
| Low activity | 72 (50.3%) |
| Active/very active | 36 (25.2%) |
| Tobacco consumption | |
| Prior to pregnancy (Yes) | 28 (19.6%) |
| During pregnancy (Yes) | 3 (2.1%) |
| Currently (Yes) | 2 (1.4%) |
| Alcohol consumption | |
| Prior to pregnancy (Yes) | 72 (50.3%) |
| During pregnancy (Yes) | 2 (1.4%) |
| Currently (Yes) | 7 (4.9%) |
| Season during the study | |
| Spring | 30 (21.0%) |
| Summer | 23 (16.1%) |
| Autumn | 52 (36.4%) |
| Winter | 38 (26.6%) |
Quantitative variables following a normal distribution are described using the mean (standard error) (standard deviation), whereas the median (25th percentile, 75th percentile) is used for variables following a non-normal distribution. Qualitative variables are described by absolute and relative frequencies (%) of their categories. * Normal distribution. a One fetal death at 22+6 weeks of gestational age. Abbreviations: BMI, body mass index.
Table 3.
Lactation characteristics.
| Characteristic | n | |
|---|---|---|
| Duration of lactation of the previous child (months) | 59 a | |
| <3 | 0 (0.0%) | |
| 3–6 | 2 (3.4%) | |
| 6–12 | 12 (20.3%) | |
| 12–24 | 25 (42.4%) | |
| >24 | 20 (33.9%) | |
| Current breastfeeding time (months) | 143 | 6.05 (4.27, 11.20) |
| Type of lactation | 142 b | |
| Exclusive | 71 (50.0%) | |
| Partial | 71 (50.0%) | |
| Sum of breastfeeding times plus daily milk pumping sessions | 143 | |
| <5 | 14 (9.8%) | |
| 5–10 | 87 (60.8%) | |
| >10 | 39 (27.3%) | |
| Missing data | 3 (2.1%) | |
| Tandem breastfeeding (Yes) | 143 | 10 (7.0%) |
| Breastfeeding twins (Yes) | 143 | 4 (2.8%) |
| Type of milk extraction * | 143 | |
| Manual | 12 (8.4%) | |
| Mechanical breast pump | 15 (10.5%) | |
| Simple electric breast pump | 101 (70.6%) | |
| Double electric breast pump | 26 (18.2%) |
The variable “current breastfeeding time” is expressed as a median (25th percentile, 75th percentile) because of its non-parametric distribution. Qualitative variables are described by absolute and relative frequencies (%). a Women with previous children. b Sample size decreases due to one fetal death. * Categories do not exclude each other.
Table 4.
Baseline characteristics of the infants of the investigated lactating women.
| Characteristic | n | |
|---|---|---|
| Gestational age (weeks) | 143 | 39+3 (37+3, 40+2), 22+6–42+3 |
| Boy | 148a | 72 (48.6%) |
| Birth weight (grams) | 148a | 3150 (2550, 3420); 450-4640 |
| Birth weight percentile 1 | ||
| ≤25 | 49 (33.1%) | |
| 25–75 | 148a | 84 (56.8%) |
| ≥75 | 15 (10.1%) | |
| Age of infant (months) | 146b | |
| 0–6 | 73 (50.0%) | |
| 6–12 | 41 (28.1%) | |
| 12–50 | 32 (21.9%) | |
| Current weight percentile of breastfed child 2 | 146b | |
| ≤15 | 32 (21.9%) | |
| 15–85 | 94 (64.4%) | |
| ≥85 | 20 (13.5%) |
Quantitative variables are shown as medians (25th percentile, 75th percentile) because of their non-parametric distribution. Range is displayed after the coma. Qualitative variables are described by absolute and relative frequencies (%) of their categories. a The sample size increases due to births of twins (n=5). b Sample size decreases due to a fetal death and a postnatal death. 1 Olsen intrauterine growth curve [10]. 2 World Health Organization (WHO)’s child growth standards [11].
Table 5.
Consumption of pharmacological micronutrient supplements during the dietary record in lactating women (n = 143).
Table 5.
Consumption of pharmacological micronutrient supplements during the dietary record in lactating women (n = 143).
| Supplement | n (%) * | Daily Dose |
|---|---|---|
| Vitamin A, mcg | 43 (30.1%) | 640.0 (400.0, 800.0) |
| Vitamin D, mcg | 56 (39.2%) | 5.0 (3.0, 5.0) |
| Vitamin E, mg | 52 (36.4%) | 11.2 (6.3, 12.0) |
| Vitamin C, mg | 51 (35.7%) | 80.0 (48.0, 80.0) |
| Vitamin B1, thiamine, mg | 51 (35.7%) | 1.1 (0.7, 1.1) |
| Vitamin B2, riboflavin, mg | 51 (35.7%) | 1.4 (0.8, 1.4) |
| Vitamin B3, niacin, mg | 51 (35.7%) | 15.6 (9.6, 16.0) |
| Vitamin B5, pantothenic, mg | 51 (35.7%) | 5.7 (3.6, 6.0) |
| Vitamin B6, pyridoxine, mg | 51 (35.7%) | 1.4 (0.8, 1.4) |
| Vitamin B7, biotin, mcg | 51 (35.7%) | 50.0 (30.0, 50.0) |
| Vitamin B9, folic acid, mcg | 72 (50.3%) | 290.0 (165.0, 400.0) |
| Vitamin B12, cobalamin, mcg | 78 (54.5%) | 2.0 (1.6, 2.5) |
| Iodine, mcg | 75 (52.4%) | 160.0 (120.0, 200.0) |
| Calcium, mg | 38 (26.6%) | 160.0 (100.0, 200.0) |
| Iron, mg | 54 (37.8%) | 14.0 (8.4, 17.7) |
| Zinc, mg | 48 (33.6%) | 8.0 (5.3, 10.0) |
| Selenium, mcg | 46 (32.2%) | 20.0 (11.5, 45.0) |
Daily dose is expressed as median (25th percentile, 75th percentile) due to the non-parametric distribution of the variables. Qualitative variables are described by absolute and relative frequencies (%). * Number and percentage of lactating women taking supplements during the dietary record.
Table 6.
Prevalence of inadequate intakes of micronutrients in lactating women (n=143).
| Nutrient | H-AR [12] | n (%) |
|---|---|---|
| Thiamine (B1), mg | 1.2 | 11 (7.7%) |
| Riboflavin (B2), mg | 1.7 | 29 (20.3%) |
| Niacin (B3), mg | 13 | 0 (0.0%) |
| Pantothenic acid (B5), mg | 5.6 | 38 (26.6%) |
| Pyridoxine (B6), mg | 1.4 | 3 (2.1%) |
| Biotin (B7), μg | 36 | 52 (36.4%) |
| Folate food + folic acid (B9), μg | 380 (DFE) | 50 (35.0%) |
| Cobalamin (B12), μg | 2.4 | 5 (3.5%) |
| Vitamin C, mg | 145 | 51 (35.7%) |
| Vitamin A, μg RAE | 1020 | 45 (31.5%) |
| Vitamin D, μg | 10 | 122 (85.3%) |
| Vitamin E, mg | 16 | 70 (49.0%) |
| Iodine, μg | 209 | 60 (42.0%) |
| Calcium, mg | 860 (19–30 y) 750 (31–50 y) |
23 (16.1%) |
| Phosphorous, mg | 580 | 0 (0.0%) |
| Selenium, μg | 59 | 4 (2.8%) |
The number and percentage of lactating women with inadequate intakes of each nutrient (average nutrient intake during the 5 days of the dietary record below harmonized average requirements) are presented. Abbreviations: H-AR, Harmonized-Average Requirements; DFE, dietary folate equivalents; RAE, retinol activity equivalents; and y, years.
Table 7.
Average vitamin and mineral concentration in human milk of lactating women collected during four successive days. .
Table 7.
Average vitamin and mineral concentration in human milk of lactating women collected during four successive days. .
| Nutrient 1 | Lactating women | Mature Milk Nutrient Concentration Reference | |
|---|---|---|---|
| n (o) | Concentration | ||
| Free thiamin, B1 (UPLC-MS/MS) mcg/L | 143 (570) | 17.90 (9.08, 27.90) | Free thiamin 18.5 [13] Total thiamin 180 [14] |
| Free riboflavin, B2 (UPLC-MS/MS) mcg/L | 143 (570) | 40.38 (20.45, 97.70) | Free riboflavin 11.2 [13] Total riboflavin 364 [15] |
| Nicotinamide, B3 (UPLC-MS/MS) mcg/L | 143 (570) | 43.33 (26.23, 77.15) | Nicotinamide 275 [13] Total niacin 2100 [16] |
| Pantothenic acid, B5 (UPLC-MS/MS) mcg/L | 143 (570) | 2205.76 (39.62) (473.83) | 2500 [17] 1304 [13] |
| Pyridoxal, B6 (UPLC-MS/MS) mcg/L | 143 (570) | 36.73 (24.78, 53.90) | Pyridoxal 96 [13] B6 130 [18] |
| Folic acid, B9 (UPLC-MS/MS) mcg/L | 143 (570) | 18.48 (14.25, 23.70) | |
| Cobalamin, B12 (competitive immunoassay) | 142 (565) | ||
| pM | 482.46 (448.34, 533.41) | ||
| mcg/L | 0.65 (0.61, 0.72) | 0.5 [19] | |
| Ascorbic acid (HPLC-DAD) mg/dL | 142 (566) | 4.10 (0.15) (1.84) | |
| Dehydroascorbic acid (HPLC-DAD) mg/dL | 142 (566) | 1.86 (1.15, 2.81) | |
| Vitamin C * (HPLC-DAD) | 142 (566) | ||
| mg/dL | 6.40 (5.51, 7.16) | ||
| mg/L | 63.98 (55.07, 71.61) | 35–90 [20] | |
| Retinol (HPLC with fluorescence and UV detector) | 141 (561) | ||
| mcg/dL | 45.45 (27.29, 92.23) | ||
| mcg/L | 454.50 (272.88, 922.25) | 530 [21] | |
| Vitamin D3 (UPLC–electrospray ionization/tandem MS) | 143 (566) | ||
| pg/mL | 1132.95 (279.63, 4823.43) | ||
| mcg/L | 1.13 (0.28, 4.82) | 0.25–2 [22] | |
| 25(OH)D3 (UPLC–electrospray ionization/tandem MS) | 143 (567) | ||
| pg/mL | 61.20 (27.60, 118.85) | ||
| mcg/L | 0.06 (0.03, 0.12) | ||
| α-tocopherol (HPLC with fluorescence and UV detector) | 141 (561) | ||
| mcg/dL | 441.63 (362.09, 558.06) | ||
| mg/L | 4.42 (3.62, 5.58) | 4.6 [23] | |
| γ-tocopherol (HPLC with fluorescence and UV detector) | 141 (561) | ||
| mcg/dL | 51.25 (38.01, 69.83) | ||
| mg/L | 0.51 (0.38, 0.70) | 0.45 [13] | |
| Vitamin E (as TE) ** | 141 (561) | ||
| mcg/dL | 458.91 (379.28, 580.73) | ||
| mg/L | 4.59 (3.79, 5.81) | 5.2 [13] | |
| Iodine (ICP-MS) ppb (mcg/L) | 143 (570) | 142.65 (92.93, 207.28) | 50–100 [18] 100–200 [24,25] |
| Calcium (ICP-MS) ppm (mg/L) | 143 (570) | 92.40 (61.25, 126.10) | 200–300 [26] |
| Phosphorous (ICP-MS) ppm (mg/L) | 143 (570) | 130.55 (2.18) (26.12) | 120–140 [18,27] |
| Selenium (ICP-MS) ppb (mcg/L) | 143 (570) | 11.03 (9.25, 13.08) | 18 [28] |
Quantitative variables following a normal distribution are described by the mean (standard error) (standard deviation) whereas the median (25th percentile, 75th percentile) is used for variables following a non-normal distribution. n: number of lactating women with data. o: total number of the samples (observations) corresponding to each of the four human milk collection days. 1 The units of our results were converted to the units of the reference values for comparability. * Vitamin C (mg/dL) = ascorbic acid (mg/dL) + dehydroascorbic acid (mg/dL). ** Vitamin E (TE) (mg) = α-tocopherol (mg) + 0.25 × γ-tocopherol (mg) [29]. Abbreviations: UPLC, ultra-performance liquid chromatography; MS/MS, tandem mass spectrometry; HPLC, high-performance liquid chromatography; DAD, diode array detector; UV, ultraviolet; MS, mass spectrometry; TE, tocopherol equivalent; ICP, inductively coupled plasma; ppb, parts per billion; ppm, parts per million.
Table 8.
Longitudinal analysis of the relationship between changes in micronutrient content in human milk and fluctuation in mothers’ nutrient, supplement, and food group intake according to the 5-day dietary record (GEE models).
Table 8.
Longitudinal analysis of the relationship between changes in micronutrient content in human milk and fluctuation in mothers’ nutrient, supplement, and food group intake according to the 5-day dietary record (GEE models).
| Micronutrients in HM | Associated Variables | Coef | SE | z | P >|z| | 95% CI |
|---|---|---|---|---|---|---|
| Vitamin D3 + 25(OH)D3, pg/mL Mothers=143 Wald chi2(1) = 4.88 P>chi2=0.027 |
Meat, Fish, and eggs servings/day |
243.203 | 110.057 | 2.21 | 0.027 | [27.494, 458.911] |
| Free riboflavin, mcg/L Mothers=51 Wald chi2(2) =39.56 P>chi2= <0.001 |
B2 intake* mg/day |
7.312 | 11.541 | 0.63 | 0.526 | [-15.308, 29.931] |
| B2 supplement mg/day | 28.642 | 12.214 | 2.35 | 0.019 | [4.703, 52.581] | |
| Pyridoxal, mcg/L Mothers=51 Wald chi2(2) =17.08 P>chi2= <0.001 |
B6 supplement mg/day |
6.284 | 1.885 | 3.33 | 0.001 | [2.589, 9.978] |
| Fruit servings/day | 2.006 | 0.831 | 2.41 | 0.016 | [0.377, 3.634] | |
| Selenium, ppb Mothers=143 Wald chi2(1) =4.67 P>chi2=0.031 |
Meat, Fish, and eggs servings/day |
0.158 | 0.073 | 2.16 | 0.031 | [0.015, 0.301] |
In free riboflavin and pyridoxal models, 51 mothers registered intake of vitamin B1 and vitamin B6 supplements, respectively. *Control variable. Abbreviation: coef, coefficient; SE, standard error; ppb, parts per billion.
Disclaimer/Publisher’s Note: The statements, opinions and data contained in all publications are solely those of the individual author(s) and contributor(s) and not of MDPI and/or the editor(s). MDPI and/or the editor(s) disclaim responsibility for any injury to people or property resulting from any ideas, methods, instructions or products referred to in the content. |
© 2024 by the authors. Licensee MDPI, Basel, Switzerland. This article is an open access article distributed under the terms and conditions of the Creative Commons Attribution (CC BY) license (http://creativecommons.org/licenses/by/4.0/).
Copyright: This open access article is published under a Creative Commons CC BY 4.0 license, which permit the free download, distribution, and reuse, provided that the author and preprint are cited in any reuse.


