
Submitted:
16 October 2024
Posted:
17 October 2024
You are already at the latest version
Abstract
Flavonoids are a class of polyphenolic secondary metabolites found in plants. Due to their ubiquity in our daily dietary intake and their major anti-oxidative, anti-inflammatory and anti-mutagenic activities, they have been a major focus of wide-ranging research for the past two decades. Mass spectrometry combined with liquid chromatography is one of the most popular techniques for the analysis of flavonoids. In this study, high-resolution accurate mass electrospray tandem mass spectrometry was used to study 30 flavonoids in both positive and negative ionisation modes. From the data obtained, common losses are summarised and compiled. Dominating neutral losses are tabulated. The radical loss of CH3. was observed in flavonoids containing methoxy groups and three diagnostic product ions were identified which could be useful in structural elucidation of unknown flavonoids and flavonoid metabolites. Energy breakdown graphs were utilised to dis-tinguish between three pairs of structural isomers, and to help rationalise proposed fragmentation pathways. Lastly, a competition of loss of CH3. and methane were reported for rhamnetin and isorhamnetin in the negative ion mode for the first time. Proposed fragmentation pathways were given to rationalise the differences in peak intensities for this competitive process.
Keywords:
flavonoids
; mass spectrometry
; fragmentation
; structure characterisation
1. Introduction
Flavonoids are a class of polyphenolic secondary metabolites mainly found in plants. [1] They are present in fruits, nuts and vegetables and have become a part of our daily dietary intake. Flavonoids often contribute to the colour of flowers where they assist in pollination and provide UV protection. [2] Plants use them to aid growth and as a defence against disease and infection [2] and due to their unique structures, flavonoids have been found to have many important biological activities such as anti-oxidative, anti-inflammatory, anti-mutagenic and anti-carcinogenic. [3,4,5]
For example, the isoflavonoid glabridin from Glycyrrhiza glabra has been found to inhibit low-density lipoprotein oxidation by scavenging free radicals. [6] The human metabolism of flavonoids has been studied and reviewed in detail, [7] along with the mechanism for their antioxidant activity, absorption and bioavailability. [8,9,10] It has been noted that the configuration and number of hydroxyl groups and the substitution of the various functional groups on the structures of individual flavonoids affect their bioavailability, metabolism and biological activities. [11] Due to their diverse range of chemical and biological properties, their extensive applications include nutraceutical, pharmaceutical, medical, and cosmetic uses. [12,13]
The increasing awareness of the health benefits and pharmaceutical applications of flavonoids has led to a considerable increase in the number of studies of flavonoids using mass spectrometry (MS). The amount of available literature on flavonoid analysis by various MS techniques is overwhelming. Early studies of flavonoids were performed using methane chemical ionisation (CI) MS in the 1970s. [14,15] Results from several other MS techniques on the analysis of flavonoids were well summarised in a review paper published in 2000. [16] Electron ionisation (EI), CI, as well as desorption ionisation methods such as fast atom bombardment (FAB) were mentioned. It stated that the outcome of the spectra was heavily dependent on the selection of the MS techniques. Peak intensities of the sample ions in the spectra also depended on the particular ionisation technique and structure of the analytes.
As applications of electrospray ionisation (ESI) became mainstream, studies have started to implement ESI coupled with high-performance liquid chromatography tandem mass spectrometry (HPLC-MS/MS) to investigate various classes of flavonoids and their substitutes. [17,18] During these studies, specific fragmentations such as dehydration and loss of CO from protonated molecular ions were predominantly found. The fragmentation of flavonoids was also explored in the negative ion mode. [19,20] Several fragmentation pathways were proposed based on highly specific negative product ions due to the Retro Diels-Alder (RDA) process. Results from these studies demonstrated that in the analysis of flavonoids, positive ion mode gives more structural information, but when combined with negative ion mode, it could provide sufficient information for identifying unknown flavonoid compounds without resorting to challenging purification methods, and for identifying new metabolites. [21,22]
One common challenge in the analysis of flavonoids is the vast number of variations in their functional group's position, mainly in the locations of the hydroxy and the methoxy groups on the side rings. This results in a dominating presence of structural isomers within the same flavonoid subclasses. Since all MS techniques are based on mass-to-charge ratio (m/z) separation, separating these structural isomers is challenging. Errors resulting from unreliable peak separation or spectra interpretation are common. Therefore, after examining the existing literature, this study selected 30 commercially available flavonoids from six flavonoid classes and performed a systematic MS/MS analysis in both the positive and negative ion modes using ultra-high-resolution accurate mass ESI-MS/MS.
This systematic approach enabled the identification of diagnostics product ions, which can be used as fingerprints to investigate unknown flavonoids. Integration of positive and negative ion modes provides complimentary data. Energy breakdown graphs were sketched to demonstrate the relationship between collision energy and peak intensity of the product ions of selected isomeric flavonoid pairs, and to display distinctive features for each flavonoid which would otherwise be overlooked. Complete fragmentation pathways are also proposed for selected flavonoids. This paper also investigates the competition between neutral loss and radical loss observed for rhamnetin and isorhamnetin due to the position variation of the methoxy moiety.
2. Materials and Methods
In this study, 30 flavonoids from six sub-classes were analysed. They were all were obtained from Sigma Aldrich (purity ≥ 90%). The flavonoids were dissolved in water : methanol (1:1, 1 mg/mL) to make up standard solutions. The flavonoids were: Quercetin, Morin, Rhamnetin, Isorhamnetin, Kaempferide, Diosmetin, Kaempferol, Fisetin, 5-Hydroxyflavone, Galangin, Baicalein, Apigenin, Luteolin, Scutellarein, Chrysin, Daidzein, 6-Hydroxyflavanone, 7-Hydroxyflavonone, Gallocatechin, Epigallocatechin, Catechin, Epicatechin, Aromadedrin, Eriodictyol, Genistein, Sakuranetin, Naringenin, Genkwanin, Hispidulin, Wogonin.
Positive and negative ESI-MS/MS analyses were performed on an Orbitrap Elite mass spectrometer (Thermo Fisher Scientific) using a heated ESI source. The analyte solutions were diluted to 0.1 mg/mL in methanol:water (1:1) prior to analysis and were delivered using the autosampler module of an RS3000 UHPLC system (Dionex) at a flow rate of 10 μL/min. Tandem mass spectra were recorded in CID-MS/MS mode on isolated precursor ions (2 m/z window) with collision energies ramped from 0 to 50 eV. Energies were increased by 1 eV every 12 seconds. The resulting runs were 10 mins per sample. A full scan (50 – 500 m/z) was obtained then the selected precursor ion was automatically selected in data dependent mode, isolated and underwent CID-MS/MS using dry N2 as the collision gas. For all experiments the acquisition time was 0.25 mins per scan using FTMS mode at a resolution of 240,000. 2 microscans were summed with maximum ion accumulation time 200 ms.
3. Results and Discussion
Based on previous literature, [23] a numbering system is adapted in this paper. Figure 1 shows the basic structure of a flavonoid. Ring A is marked in red, ring B in blue and ring C in black. The atom numbering starts from the heterocyclic oxygen in ring C and ends on the ring B benzene carbon. A nomenclature is also added to clarify the assignment of the product ions. For example, a ring cleavage labelled 'rCx,yAorB' represents the cleavage location on ring C between carbon-carbon positions x and y, leaving either ring A or B intact.
3.1. Common Losses in the Positive Ion Mode
Positive ion mode ESI-MS/MS spectra were collected for all 30 flavonoids, and the neutral/radical losses from the precursor ions were tabulated (see Table A2 in Appendix A). The first trend to note is that flavonoids from the same group do not always have the same common losses, although there are degrees of similarity. Secondly, common losses are mostly dependent on the location and number of -OH groups (loss of H2O), -MeO groups (loss of CH3 radical) and the presence of a C=O function in ring C (loss of CO, mass 28). Any losses higher than 100 mass units result from ring cleavage through the RDA processes on ring C. Table 1 summarises the typical neutral losses observed in the positive ion mode.
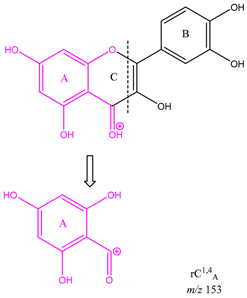
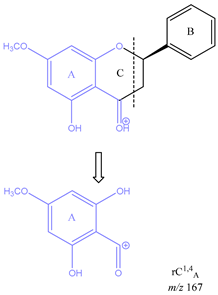
From the common losses, three product ions were found to be diagnostic for the structure of their precursor ion (PI). These are m/z 167, m/z 153 and m/z 151. Among these, m/z 153 is the most commonly observed and results from cleavage on ring C between atoms 1 and 4, leaving ring A intact and is therefore designated as rC1,4A. Product ion m/z 167 is also due to cleavage on ring C between atoms 1 and 4, leaving ring A intact and is therefore designated as rC1,4A. The difference between these two ions is due to a methoxy group on ring A. Lastly, ion m/z 151 is formed from cleavage on ring C between carbons 3 and 10, therefore designated as rC3,10A. All three product ions are listed in Table 2, along with the flavonoids (and their classes) which produced them.
Table 3 is a demonstration of the diagnostic properties of the product ions, it allows the observation of the structural correlation between precursor and product ions. Quercetin, sakuranetin and epigallocatechin are used as examples. All three product ions are coloured to highlight the exact structural resemblance to their respective PIs. Therefore, it can be concluded that the presence of m/z 153 demonstrates the presence of two OH groups in ring A (at C-6 and 8) and a C=O at C-4 in ring C. Observation of m/z 167 indicates the presence of an OH group on C-6, and a methoxy group on C-8, as well as a ketone on C-4 on ring C. Finally, product ion m/z 151 shows the presence of no ketone in ring C i.e., C-4 is an unoxidised CH2, but two OH groups on ring A on C-6 and C-8. The presence of these product ions gives a clear insight into the structures of their respective flavonoid precursor ions. These findings will be useful in the structural elucidation of unknown flavonoids.
3.2. Energy Breakdown Graphs for Isomeric Differentiation
Energy breakdown graphs are plots of collision energy versus relative intensity for the selected product ions and have proven to be extremely useful in isomeric differentiation for flavonoids. They can demonstrate the different energy thresholds for alternative fragmentation routes and showcase secondary losses during the fragmentation processes. They have been used previously for a variety of studies [24,25,26] as well as for the study of flavonoids. [27] In this paper, energy breakdown graphs were plotted for three pairs of isomeric flavonoids from their MS/MS spectra in positive ion mode.
3.2.1. Rhamnetin and Isorhamnetin
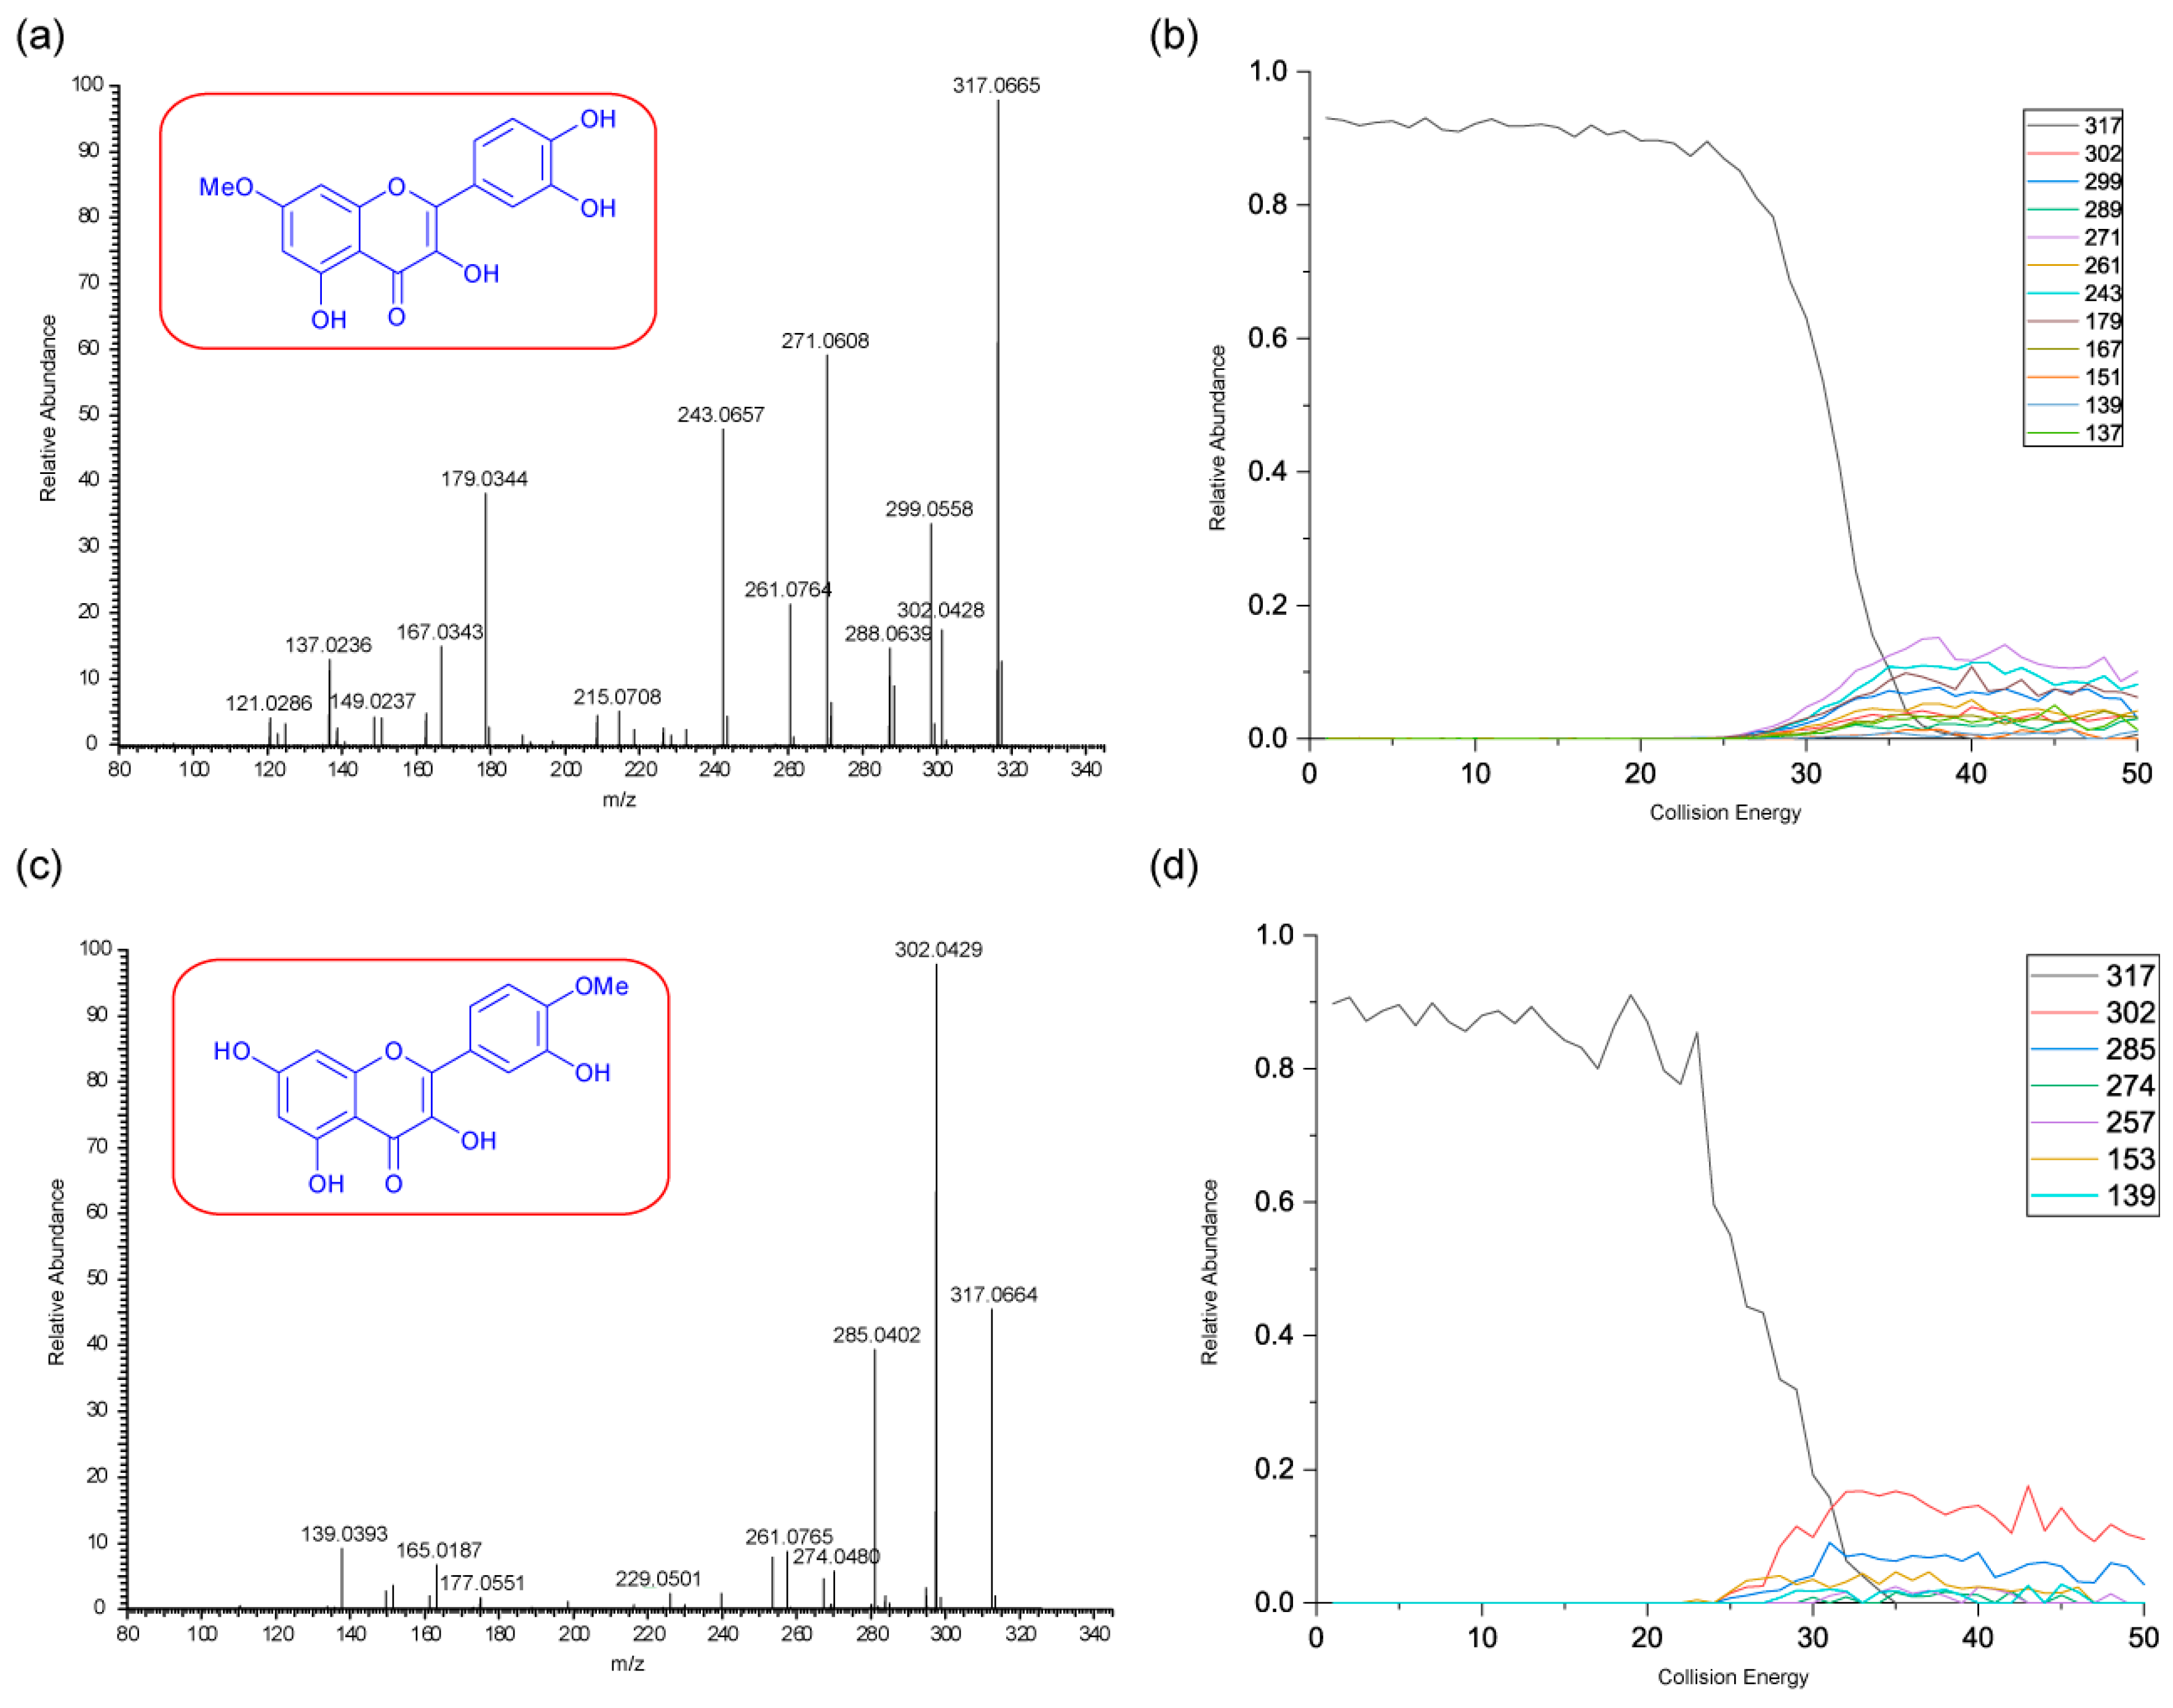
Rhamnetin and isorhamnetin are structural isomers differentiated by the location of the methoxy group (see Figure 6 for structures). Each of them has one methoxy group and four OH groups. Their energy breakdown graphs shown in Figure 2 indicates a few differences. Firstly, there are fewer product ions for isorhamnetin. Secondly, the difference in the intensity of product ion m/z 302. It is almost four times more intense for isorhamnetin compared to rhamnetin. These observations are both due to the intensity of the loss of the methyl radical. In the case of rhamnetin, the losses of H2O and CO compete and are a much-preferred fragmentation route. Except for the common losses of the methyl radical and of a CO, rhamnetin and isorhamnetin have noticeably different fragmentation pathways despite being structural isomers.
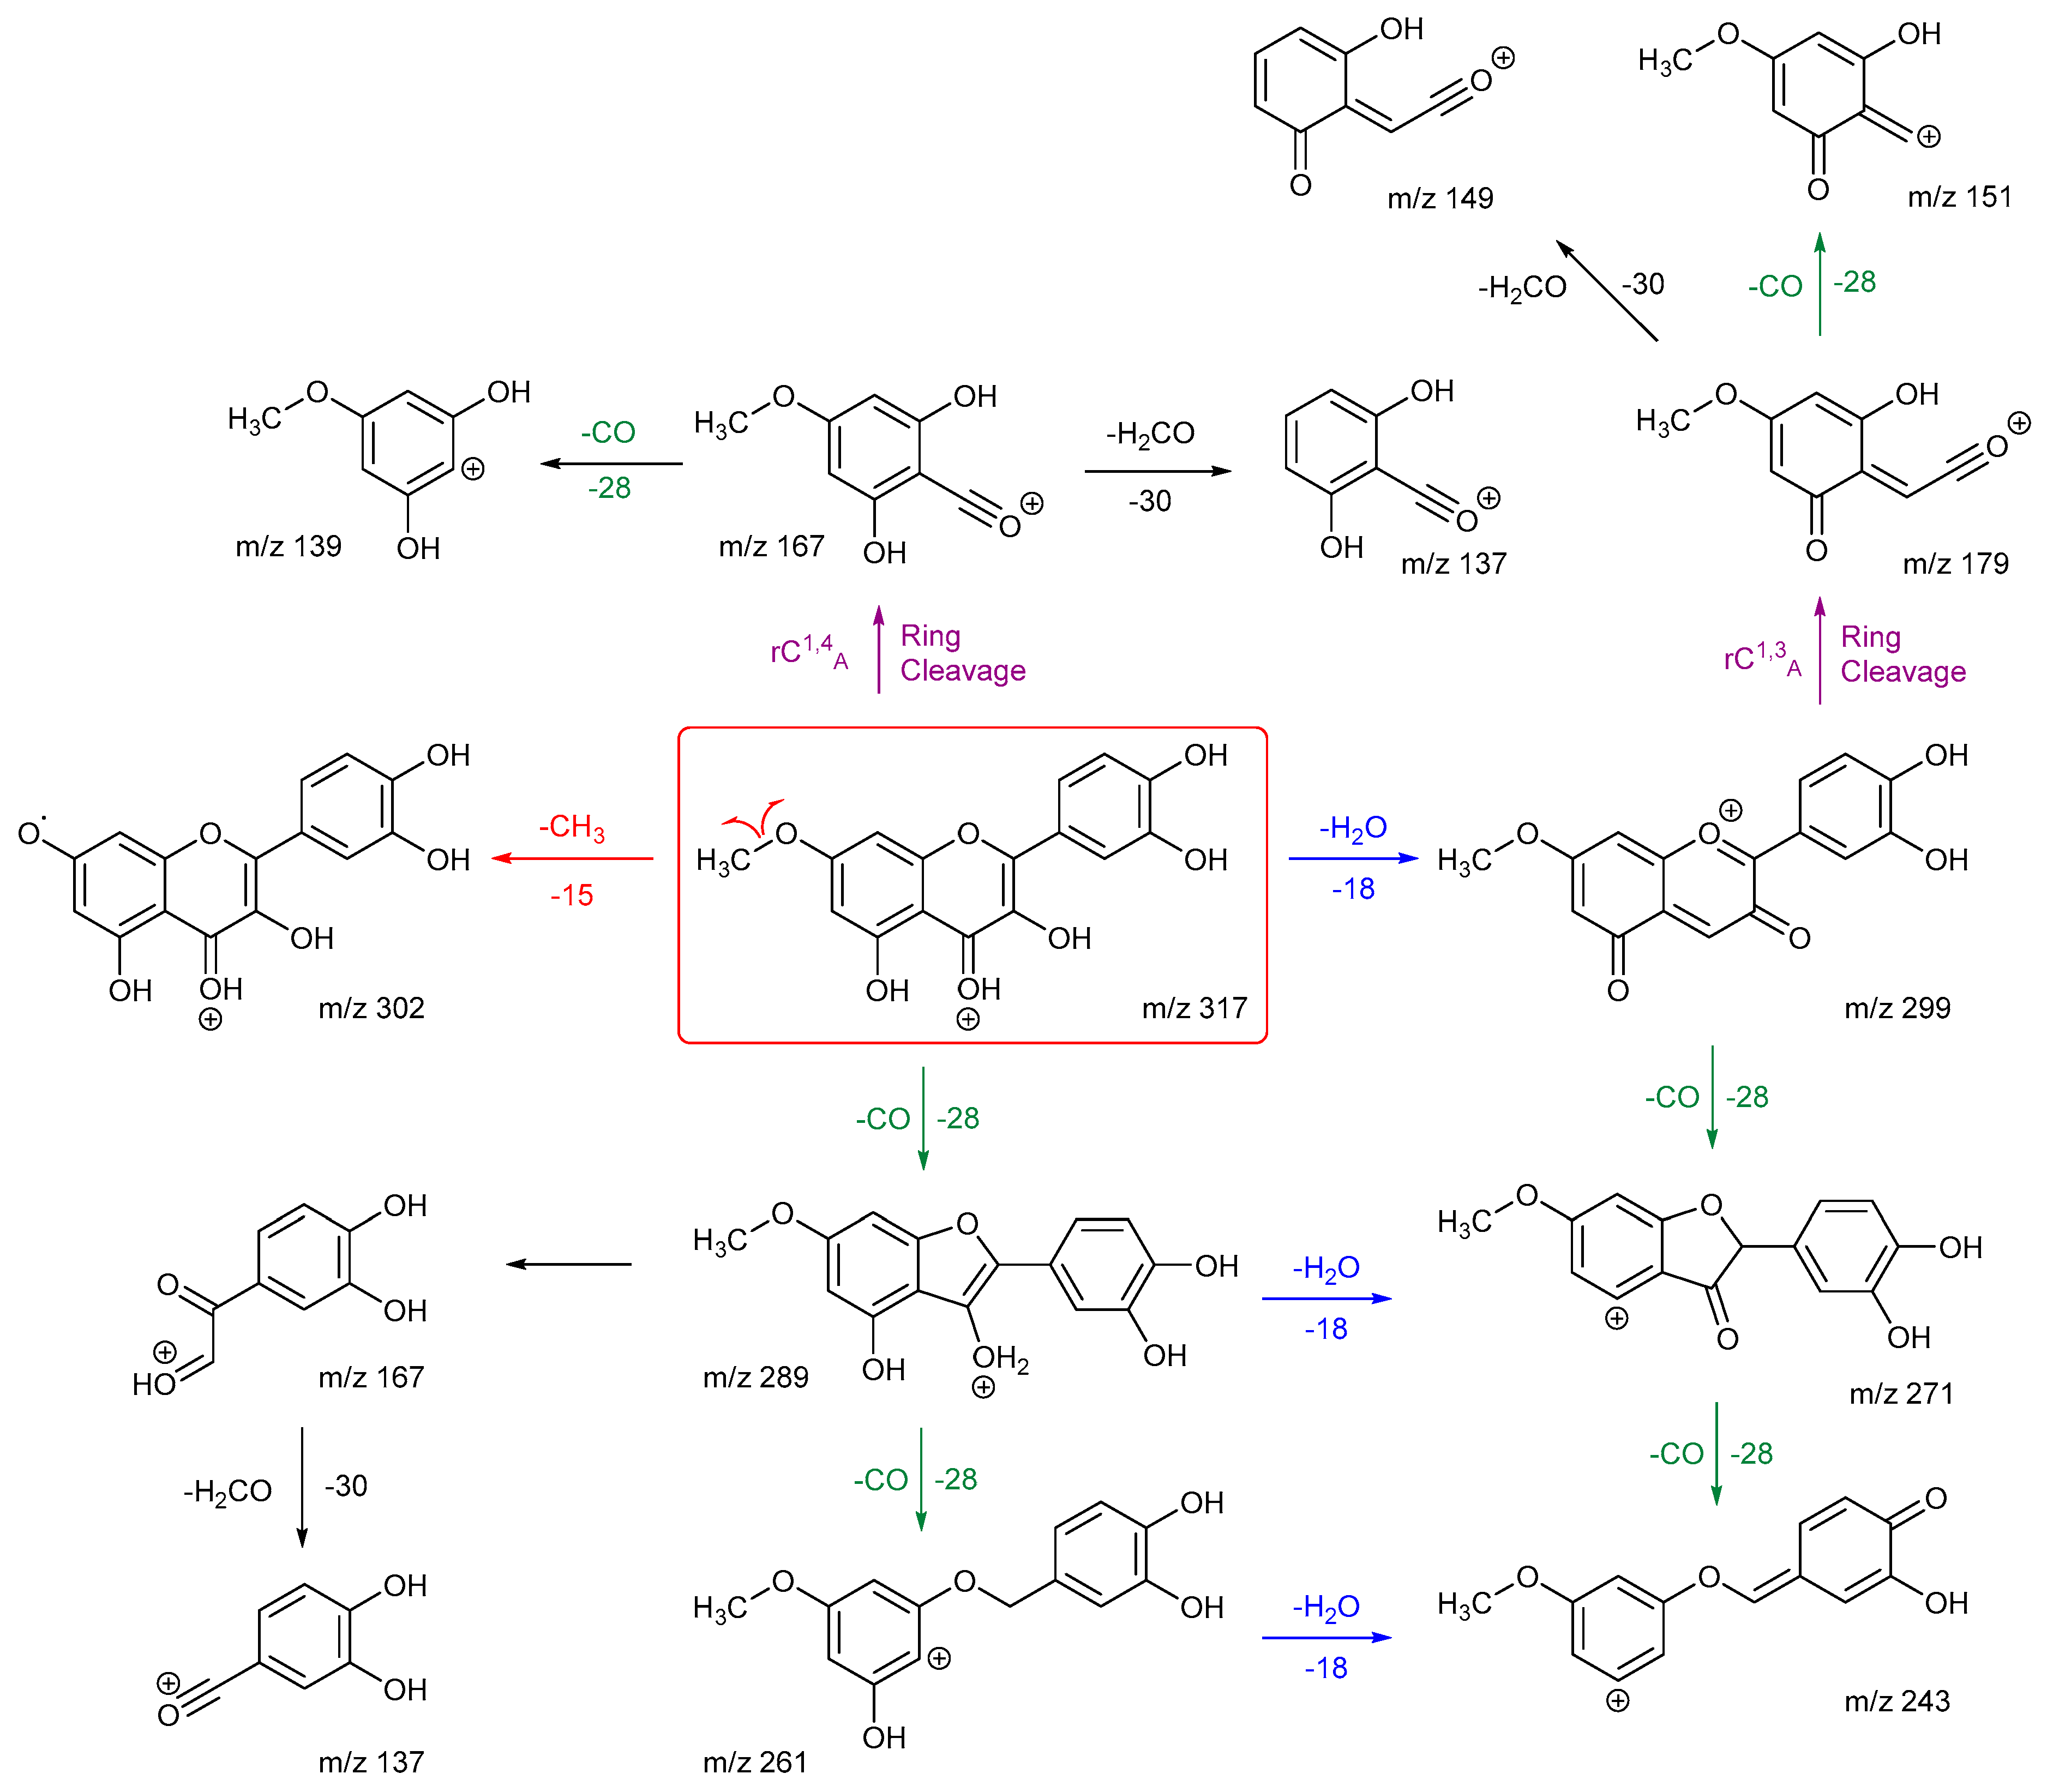
The fragmentation pathways and proposed structures of the product ions observed in the analyses of rhamnetin and isorhamnetin are shown in Scheme 1 and Scheme 2. The protonation site is on the carbonyl oxygen of ring C unless stated otherwise. Scheme 1 shows multiple losses of CO from rhamnetin, either after an initial loss of H2O or directly from the precursor ion. The competition between the loss of a methyl radical and other routes makes this route less favourable. The two ring cleavages are marked in purple. The first of which occurs after a water loss to produce m/z 179, which is the third most intense peak in the energy breakdown graph. The second ring cleavage results in m/z 167. However, this peak can also be produced through a loss of CO along with a C-O bond cleavage. Both routes go on to further lose H2CO to produce m/z 137 with the structure at the bottom left of the scheme being proposed as being the most likely.
Isorhamnetin has fewer product ions than rhamnetin, with m/z 302 as the most prominent. This can be explained by the formation of a stabilised radical, the structure of which is shown in Scheme 2. Compared to the structure of ion m/z 302 for rhamnetin, m/z 302 for isorhamnetin is stabilised by the adjacent hydroxy group and conjugation through ring B and C. The production of m/z 274 further proves this, as product ion m/z 302 is stable enough to undergo secondary fragmentation by loss of CO. A ring closure is proposed for ion m/z 274 to explain why it does not fragment further. The second most intense peak is m/z 285, which is the result of the loss of methanol. Protonation is proposed to be on the methoxy oxygen to induce an ortho elimination. This specific loss for isorhamnetin is diagnostic for the presence of a methoxy group on ring B at the ortho position, agrees with previous literature. [27] Kaempferide, which has a methoxy group at the same location, exhibits the exact same mechanism. [28]
The structural differences between rhamnetin and isorhamnetin also affect the location of ring cleavages. Isorhamnetin has two ring cleavages rC4,10 A and rC1,4 A. This is very different to rhamnetin, and it shows that even though both flavonols have the same number of OH groups and a methoxy group, the location of these functional groups significantly affects the formation of the product ions. The relative stability of the different radical ions produced influences the entire spectra. The stability of the ring B product ions also influences which fragmentation pathways would be followed.
3.2.2. Kaempferol and Fisetin
As with rhamnetin and isorhamnetin, both kaempferol and fisetin belong to the flavonol class. Both kaempferol and fisetin have four OH groups in their structures. However, kaempferol only has one OH group on ring A, whereas fisetin has two. The converse is true for ring B – (see structures in Figure 3). Differences in their product ions can be viewed in their energy breakdown graphs. Kaempferol has a dominant ion at m/z 177, resulting from a ring cleavage, whereas fisetin favours the loss of mass 46 to produce the ion at m/z 241. Product ion m/z 177 occurs at a much lower collision energy than the others for kaempferol. All product ions of fisetin occur at a collision energy of around 23 eV, as seen in the energy breakdown graph.
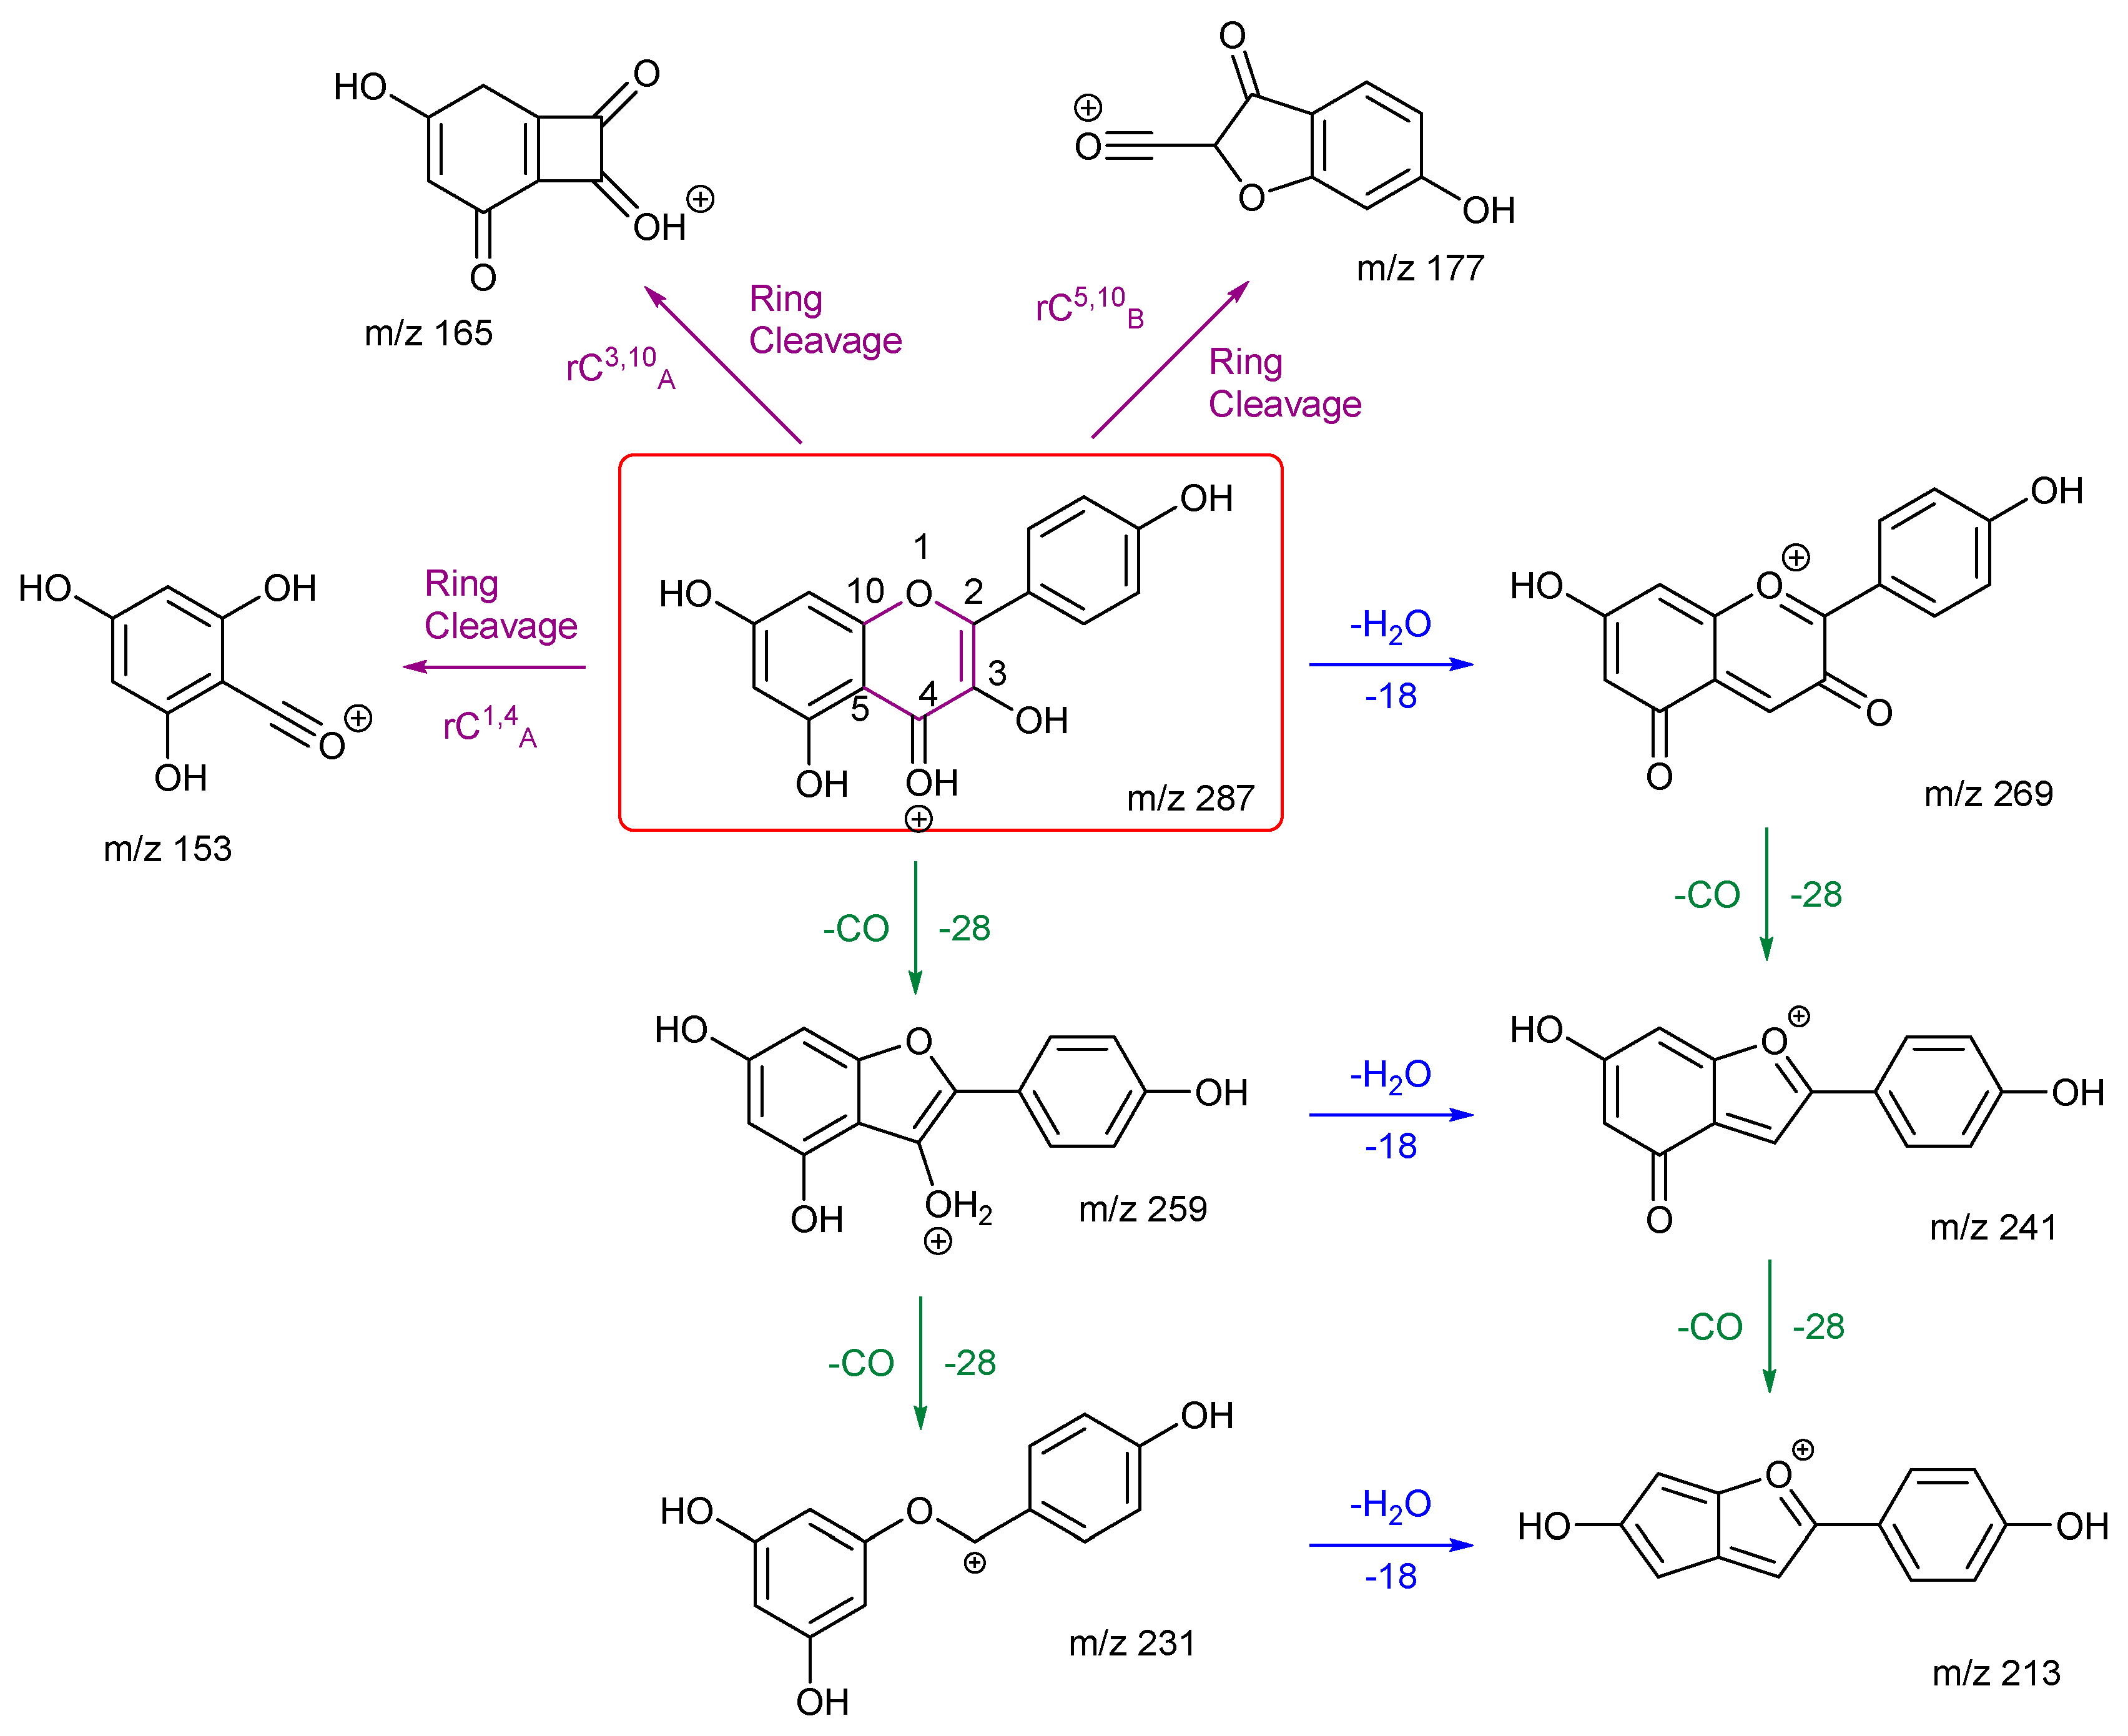
The fragmentation pathways and proposed structures of the product ions observed in the analyses of kaempferol and fisetin are shown in 3 and 4. The following discussion aims to rationalise the proposed product ion structures and their EBGs. Kaempferol has extensive ring cleavages, and the bonds broken are coloured in purple. The high peak intensity of product ion m/z 177 could be due to a stabilised five-membered ring structure with a tertiary carbocation. The diagnostic product ion m/z 153 is present with kaempferol. Extensive H2O and CO losses are also observed.
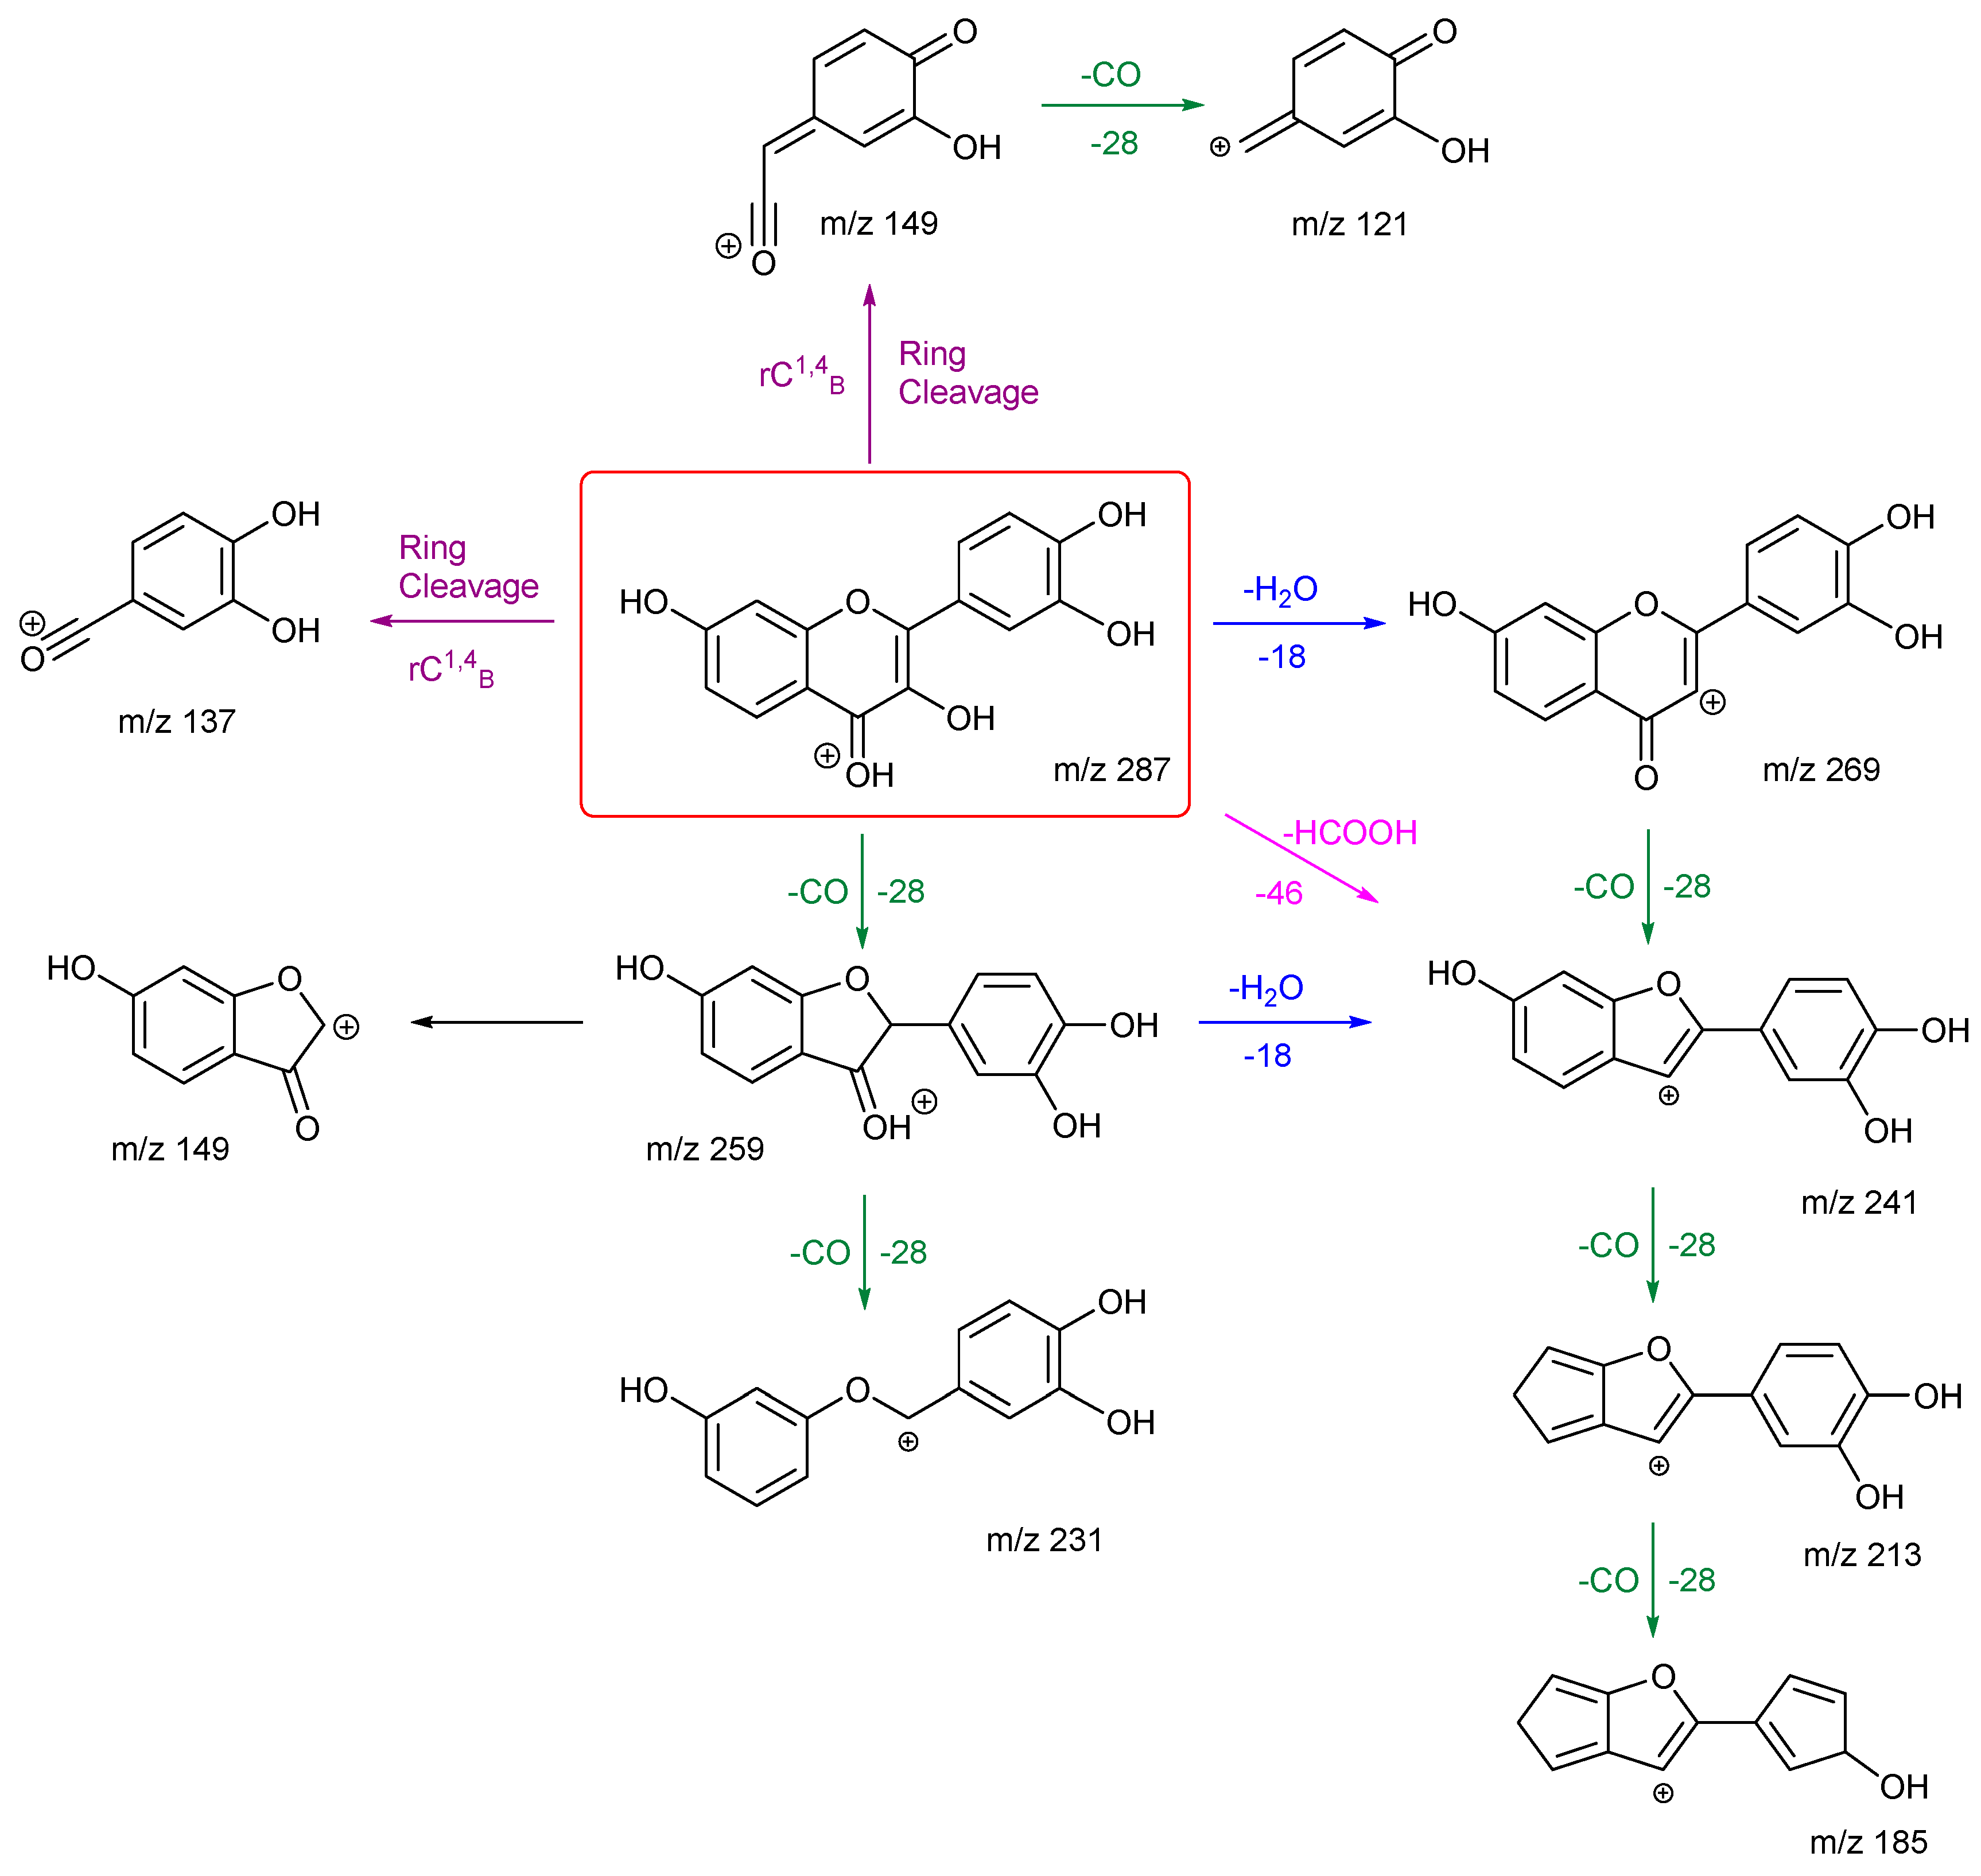
Fisetin follows the same number of H2O and CO losses to produce ions m/z 269, 259, 241, 231 and 213. From its EBG, the ion at m/z 241 is the most intense and occurs at much lower energy than the others. This suggests that it may be due to the loss of formic acid (HCOOH) in one step, as highlighted in Scheme 4, in addition to the first loss of H2O then followed by a CO. It then goes on to lose a CO to produce the ion at m/z 213. This agrees with the observation that the ion m/z 213 is the second most intense peak in the EBG. Compared to kaempferol, it has one less ring cleavage, and both product ions from these cleavages leave ring B intact. Product ion m/z 149 has two fragmentation pathways, with one occurring directly from the cleavage of ring C at atoms 1 and 4, the other is by a carbon-carbon bond breakage from ion m/z 259. The first is more likely according to the EBG. Both routes can be followed by another loss of CO to give product ion m/z 121. Finally, the ion at m/z 185 has the lowest intensity and requires the highest collision energy. This can be explained by a less favourable charge remote fragmentation and the need to break an already stabilised ring structure of m/z 213.
Scheme 3.
Proposed fragmentation pathway for kaempferol in positive ion mode. The formulae of all product ions are confirmed by accurate mass (average of 0.8 ppm) (Table A6 in Appendix B).
Scheme 3.
Proposed fragmentation pathway for kaempferol in positive ion mode. The formulae of all product ions are confirmed by accurate mass (average of 0.8 ppm) (Table A6 in Appendix B).
Scheme 4.
Proposed fragmentation pathway for fisetin in positive ion mode. The formulae of all product ions formed are confirmed by accurate mass (average of 0.4 ppm) (Table A7 in Appendix B).
Scheme 4.
Proposed fragmentation pathway for fisetin in positive ion mode. The formulae of all product ions formed are confirmed by accurate mass (average of 0.4 ppm) (Table A7 in Appendix B).
Kaempferol and fisetin differ in their locations, numbers, and remaining structures of the ring C cleavages. Product ions of these ring cleavages are key to their structural identification. Kaempferol has a diagnostic product ion m/z 153, which can distinguish it from fisetin due to the location of the OH group.
3.2.3. Chrysin and Daidzein
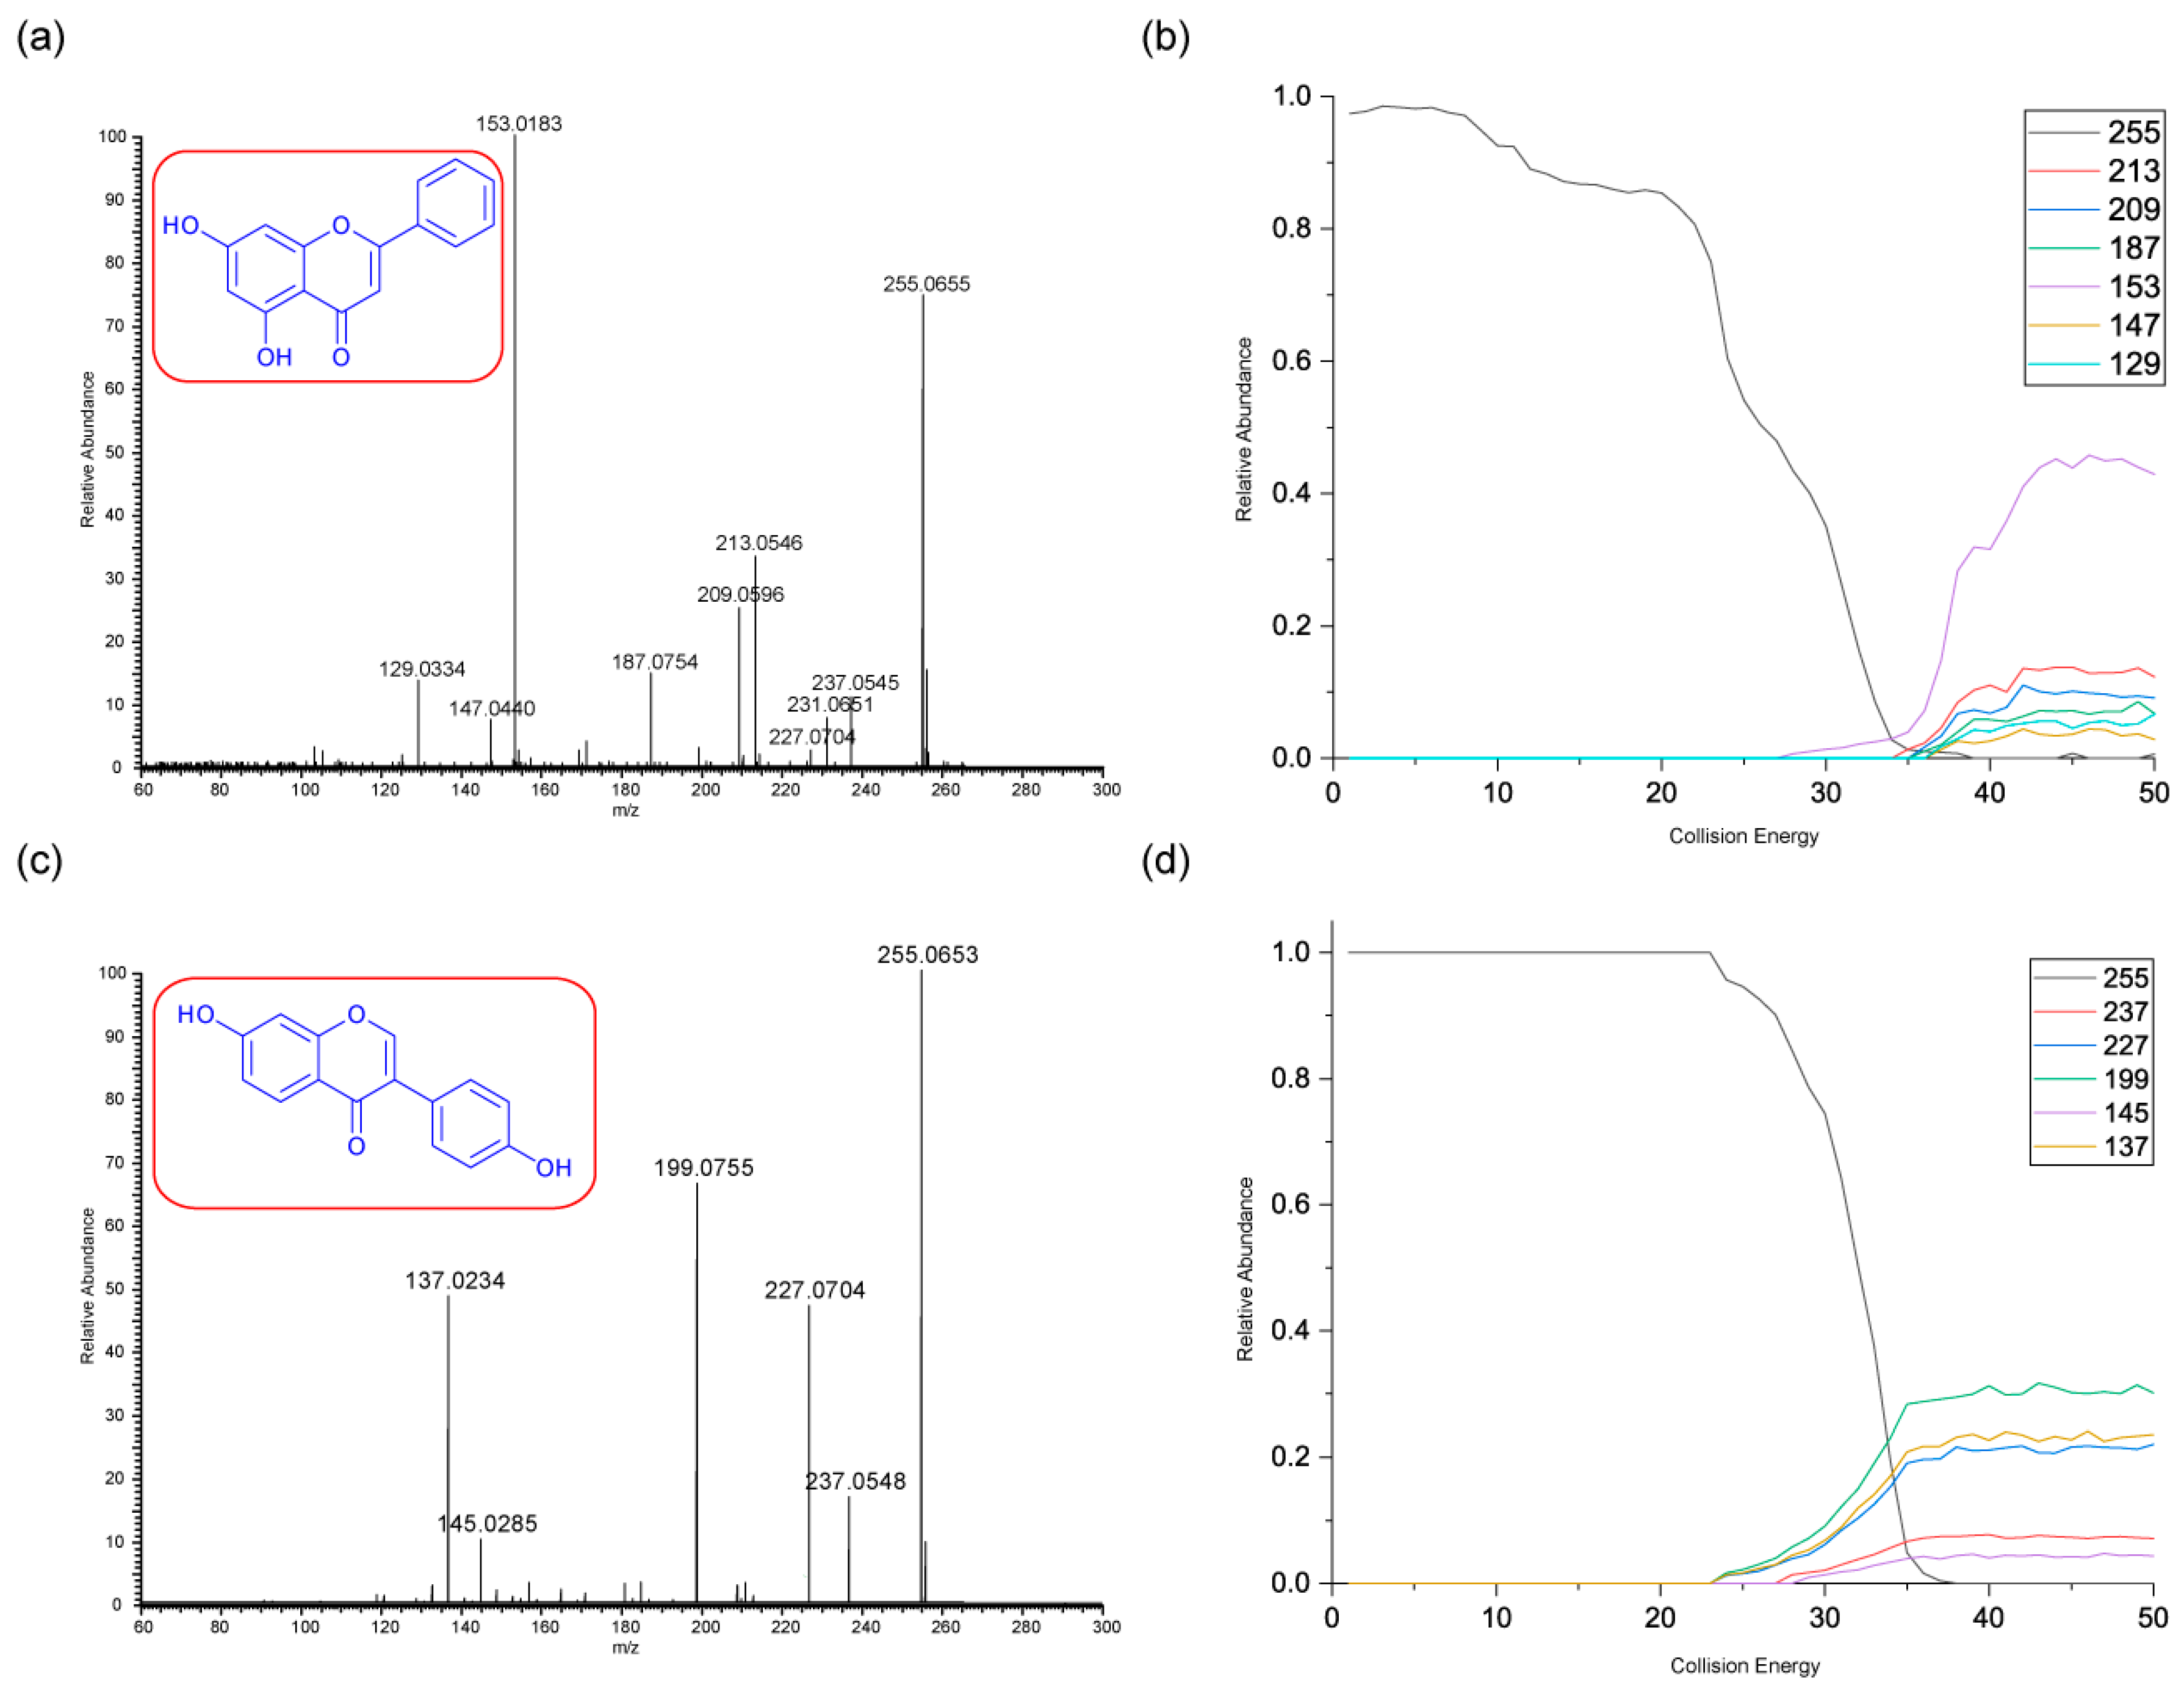
The final pair of isomeric flavonoids are chrysin and daidzein. They were selected as they are structural isomers but belong to different flavonoid classes. Both of their protonated molecular ions occur at m/z of 255. Their energy breakdown graphs are presented in Figure 4. Figure 4 gives very distinctive energy breakdown graphs of chrysin and daidzein. The most intense peak for chrysin is the product ion m/z 153, the diagnostic peak from a specific structure on ring A. This peak also first appears at lower collision energy compared to others. In contrast, daidzein has three product ions at the lower collision energy. These are m/z 199, 137 and 227.
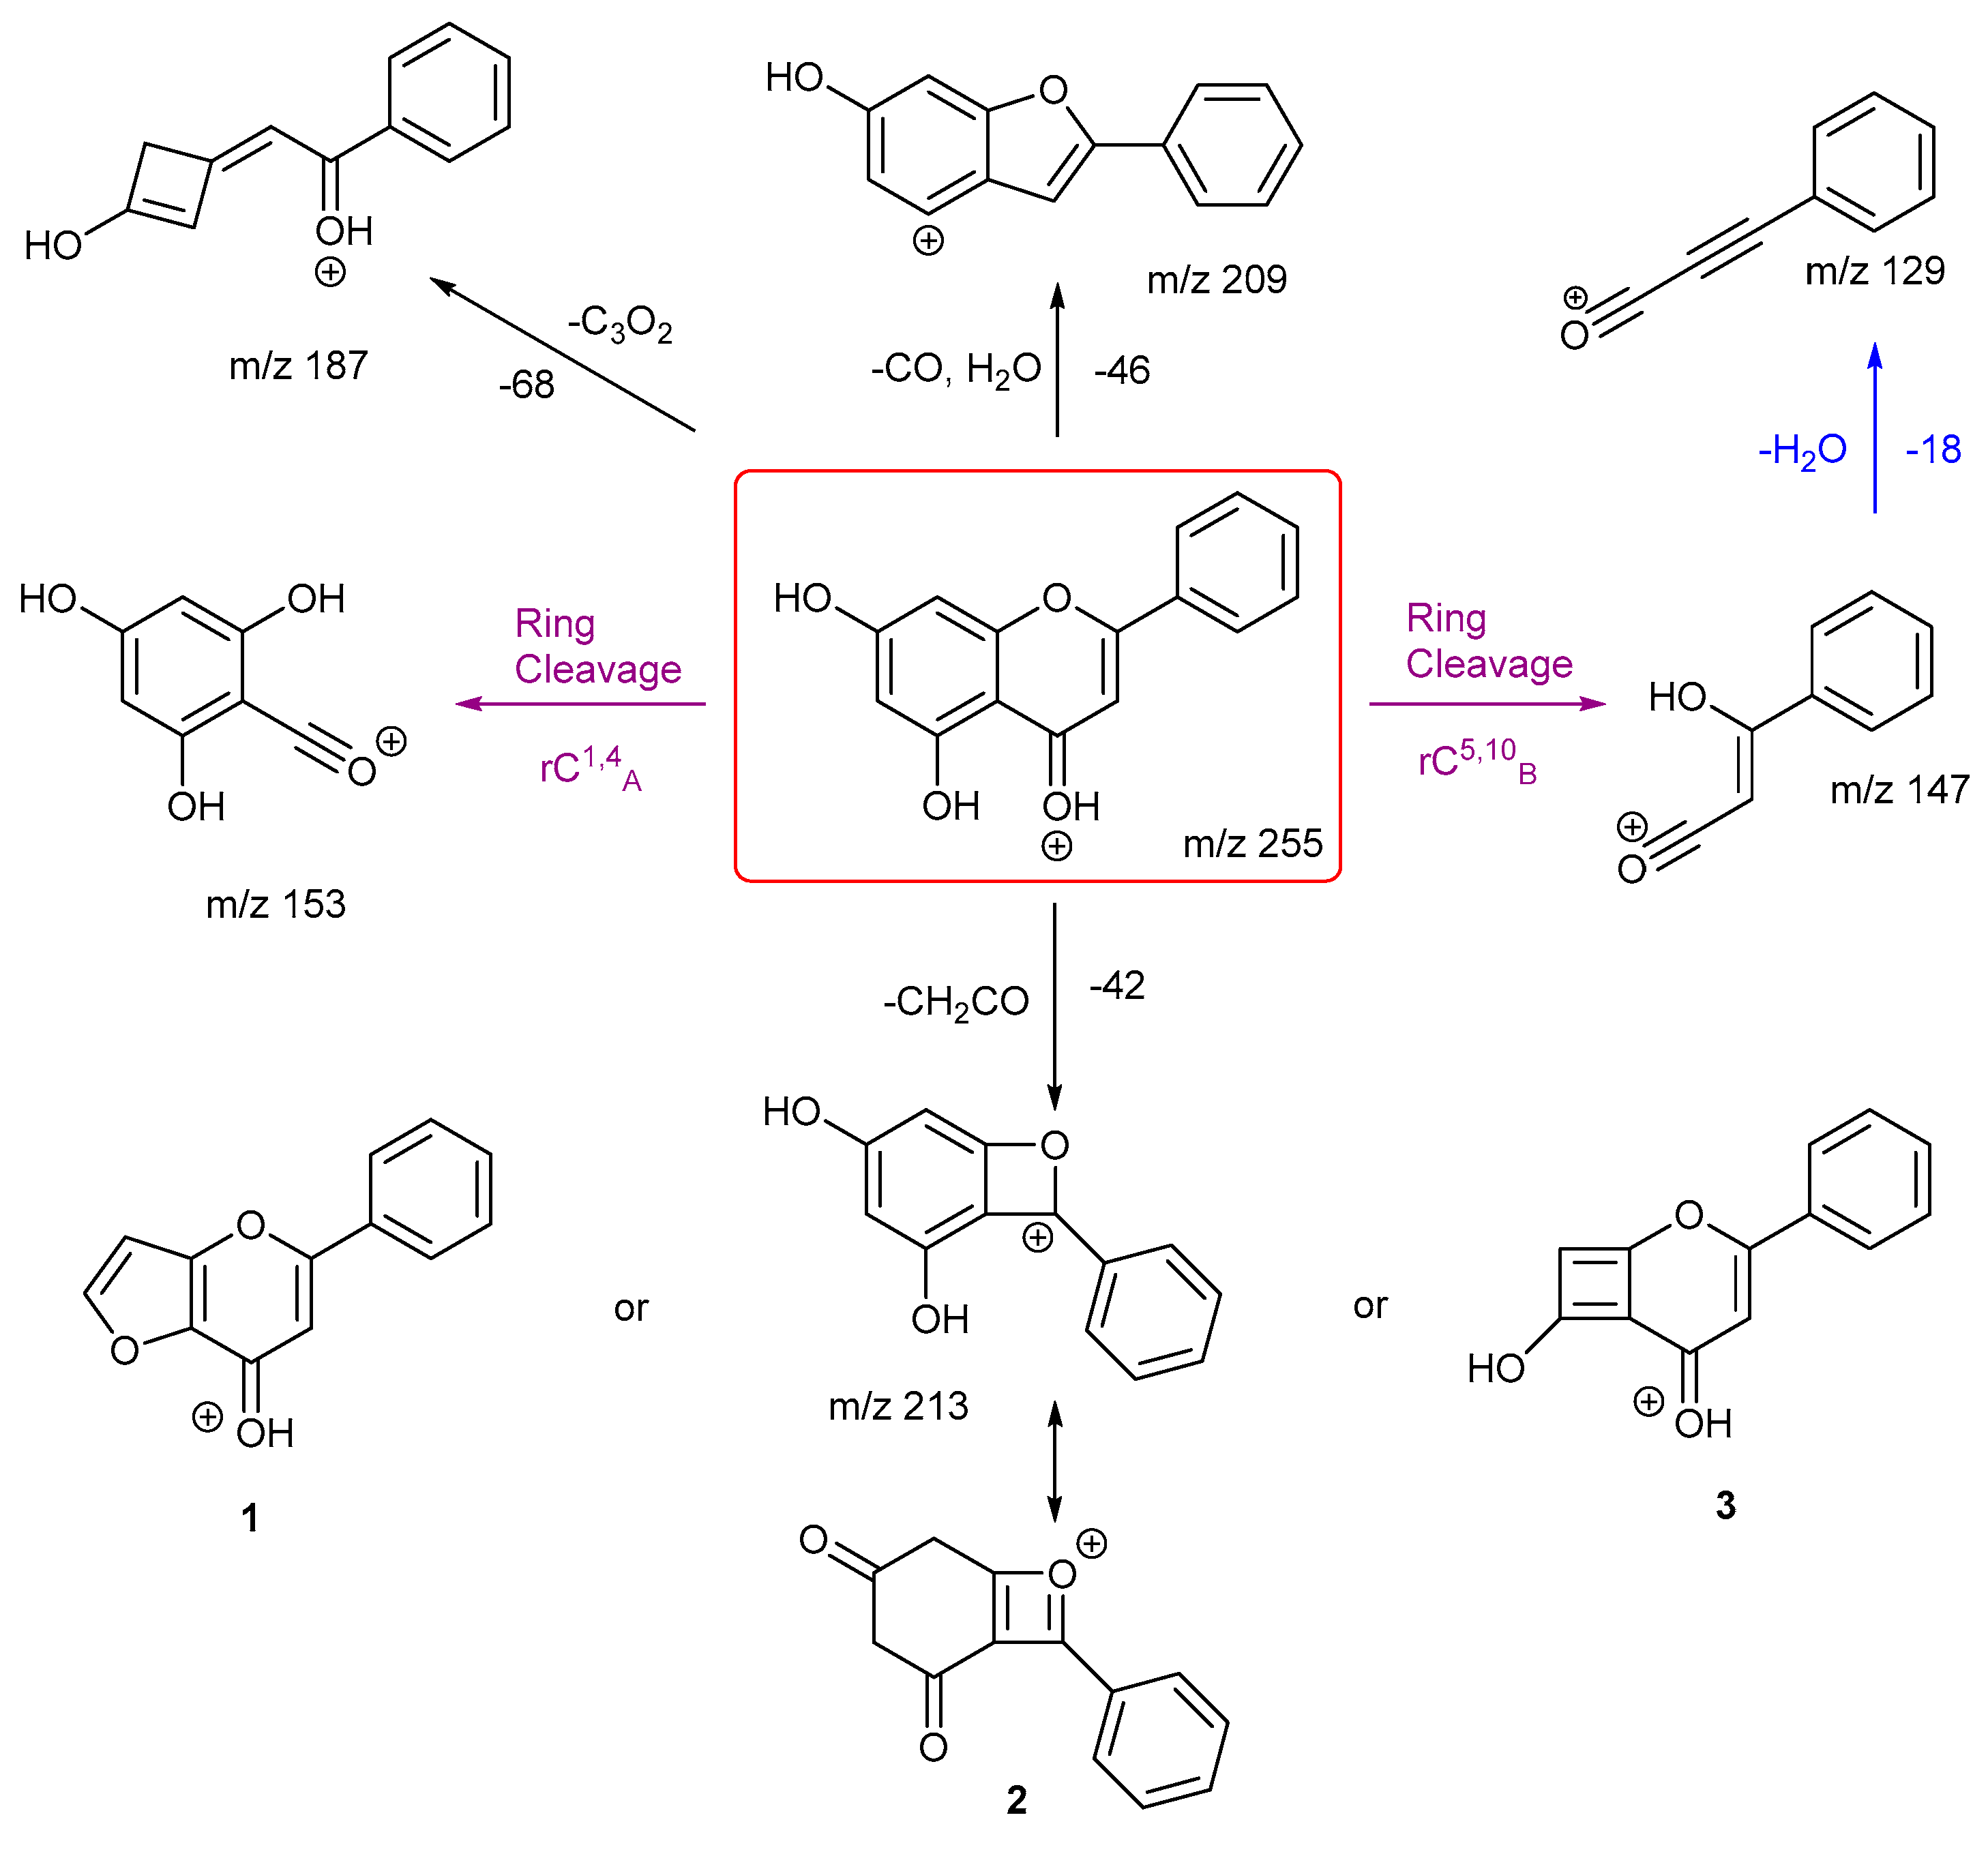
The proposed fragmentation scheme for chrysin and daidzein are shown in Scheme 5 and Scheme 6. Chrysin has two ring cleavages, including the diagnostic product ion for ring structure A. Also, it has a loss of formic acid to produce ion at m/z 209. There are also extensive ring contractions for chrysin, which agrees with previous literature. [29] The ion m/z 187 is created from a very unusual loss of carbon suboxide (C3O2,), first observed in 2001 for flavones and later in a few other studies both in positive and negative ion mode. [29,30,31] Although no mechanisms have been proposed. This could be an opportunity for future work to investigate a viable mechanism. Also, a loss of CH2CO gives three possible structures for product ion m/z 213. Structure 3 has been shown previously in the literature. [29] However, we believe structure 1 is more stabilised.
Daidzein has only one ring cleavage from the protonated PI which results in product ion m/z 137. The most intense peak m/z 199 is produced from the loss of a CO from m/z 227. Two possible structures are proposed for this ion, both involve a ring contraction to form a cyclopentadiene in their structure, depending on which CO is lost. Product ion m/z 145 has the lowest intensity, possibly due to a less favourable charge remote ring cleavage from ion m/z 237. In summary, for both chrysin and daidzein, ring cleavage on ring C is very energetically favourable. Chrysin has extensive ring contractions that result in the unusual neutral loss of C3O2. Daidzein can also undergo ring contraction to lose a CO.
3.2. Common Losses in the Negative Ion Mode
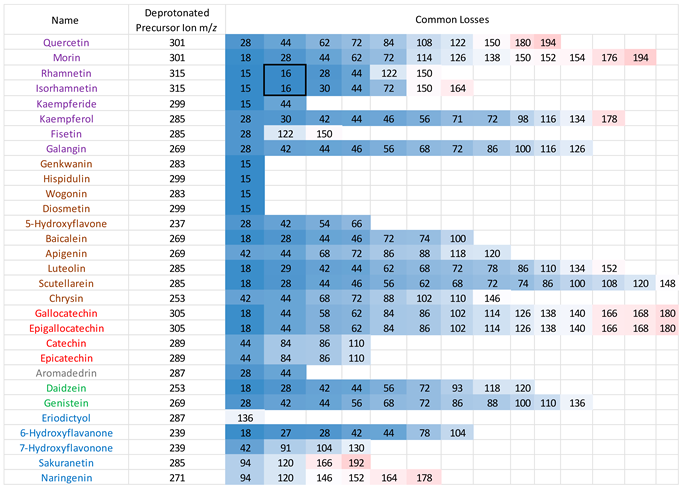
MS/MS data for the 30 flavonoids in negative ion mode were also investigated, and neutral/radical losses of their deprotonated precursor ions were summarised in Appendix A table A3. Flavonoids are grouped and marked by different colours based on their classes, as in the positive ion mode. The first trend is consistent with the observations in the positive ion mode. Flavonoids from the same classes do not always exhibit the same common losses. They only have the same common losses if they are structural isomers from the same flavonoid class. For example, in the flavone group, Genkwanin and Diosmetin both only produce a loss of 15, which corresponds to a CH3. radical loss. Gallocatechin and epigallocatechin, catechin and epicatechin, are two pairs of structural isomers that are all flavanols; hence, they have the same neutral losses.
Secondly, compared to the positive ion mode CID MS/MS data, there are more lower mass neutral losses. The most common ones are summarised in Table 4. Like with the positive ion mode, common losses in the negative ion mode are also dependent on the hydroxy and methoxy group locations. Other than the predominantly occurring loss of H2O, loss of CO is frequently observed. Any losses with higher than 100 mass units is likely to be an indication of ring cleavage on the ring C.
Results from the negative ion mode MS/MS have one major difference from the positive ion mode spectra. This is the loss of 16, which corresponds to a CH4 methane loss. This has been previously published in the literature of this research group, [32] and the data acquired here is strong evidence to further support this observation. Flavonols with a neutral loss of CH4 are highlighted in the box from Table A3. These are discussed and investigated further using energy breakdown graphs and proposed mechanisms.
3.4. Loss of CH3. and CH4
Both rhamnetin and isorhamnetin have a loss of 16, corresponding to the loss of methane confirmed by accurate mass measurement (see tables A10 and A11 in appendix B). This observation of CH4 elimination is very interesting and has been published before with heterocyclic aromatic amines [33] and the flavanone hesperetin but not with any other flavonoids. Hence, it remains the focus of the last part of this paper.
Out of all the flavonoids with methoxy groups, only rhamnetin and isorhamnetin exhibit a loss of CH4 in their negative ion MS/MS spectra. However, all the flavonoids mentioned share a common loss of a CH3. methyl radical. This could be because the unique CH4 loss requires a hydroxyl group on the meta carbon in ring C, which the flavone groups lack. An OH group on the neighbouring carbon is also essential to facilitate this mechanism. This explains why although kaempferide has a hydroxyl group on the meta carbon in ring C, and a methoxy group on ring B, the lack of an OH group on the same ring prevents the loss of 16.
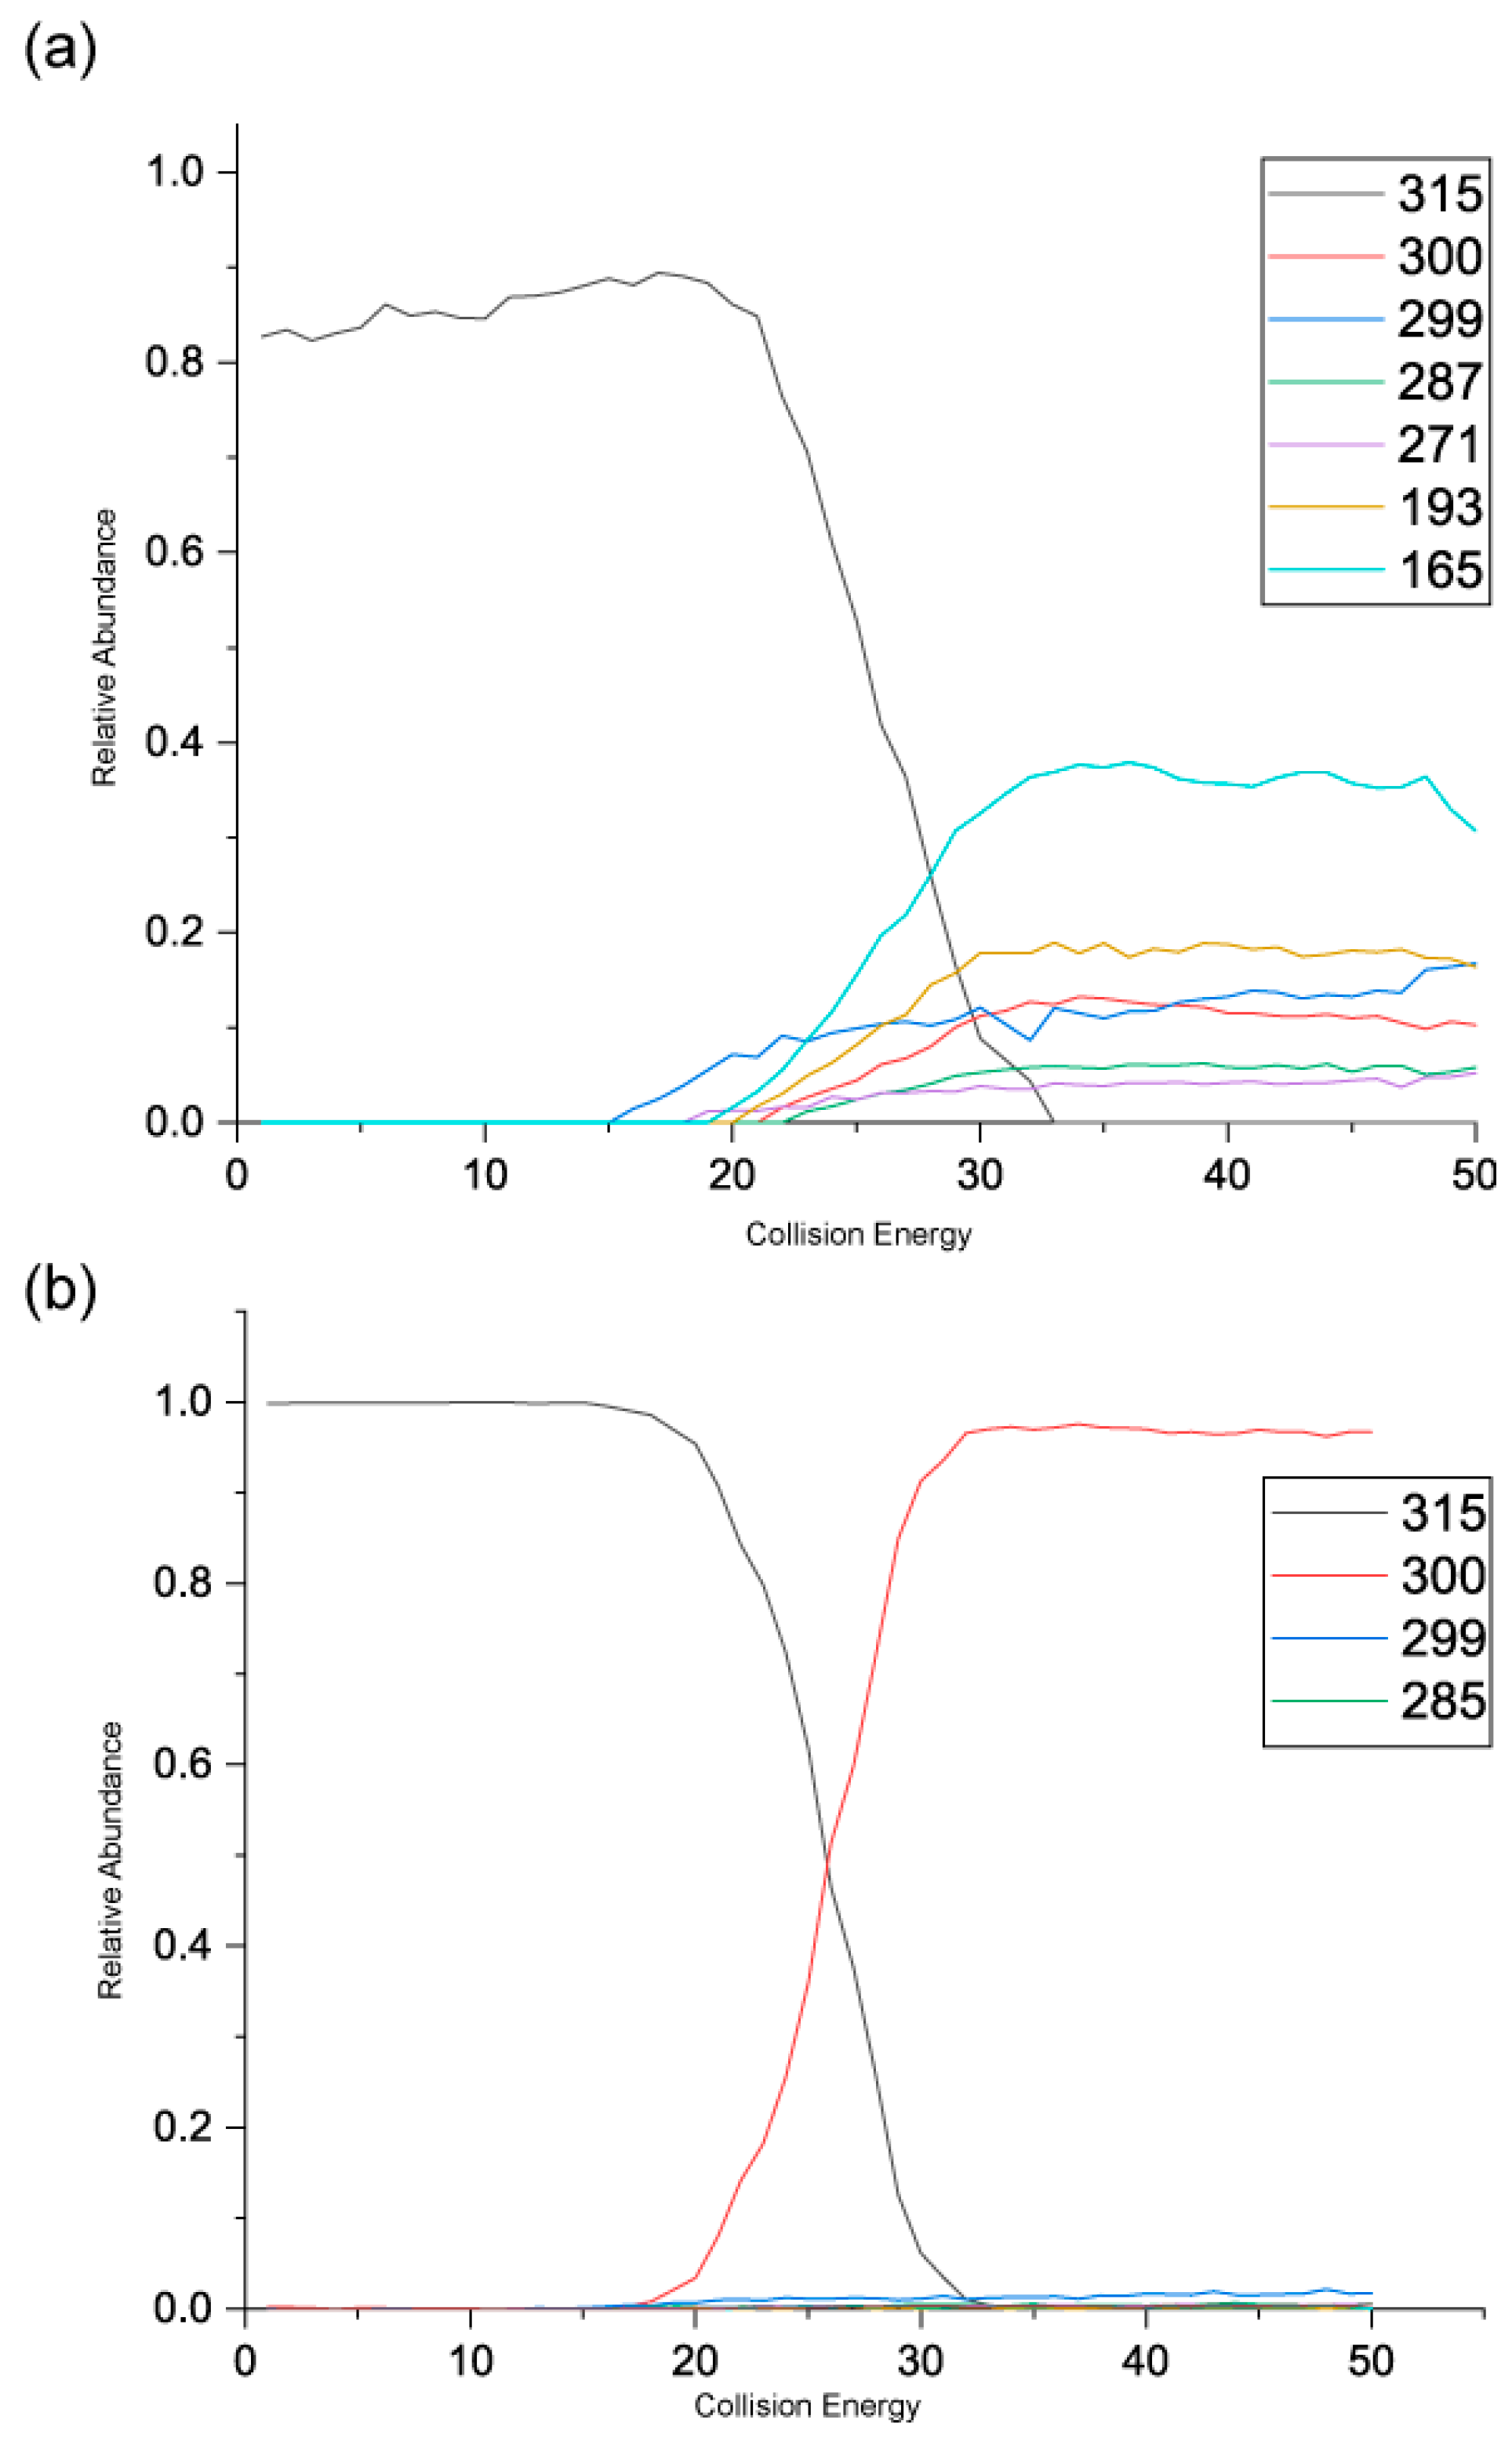
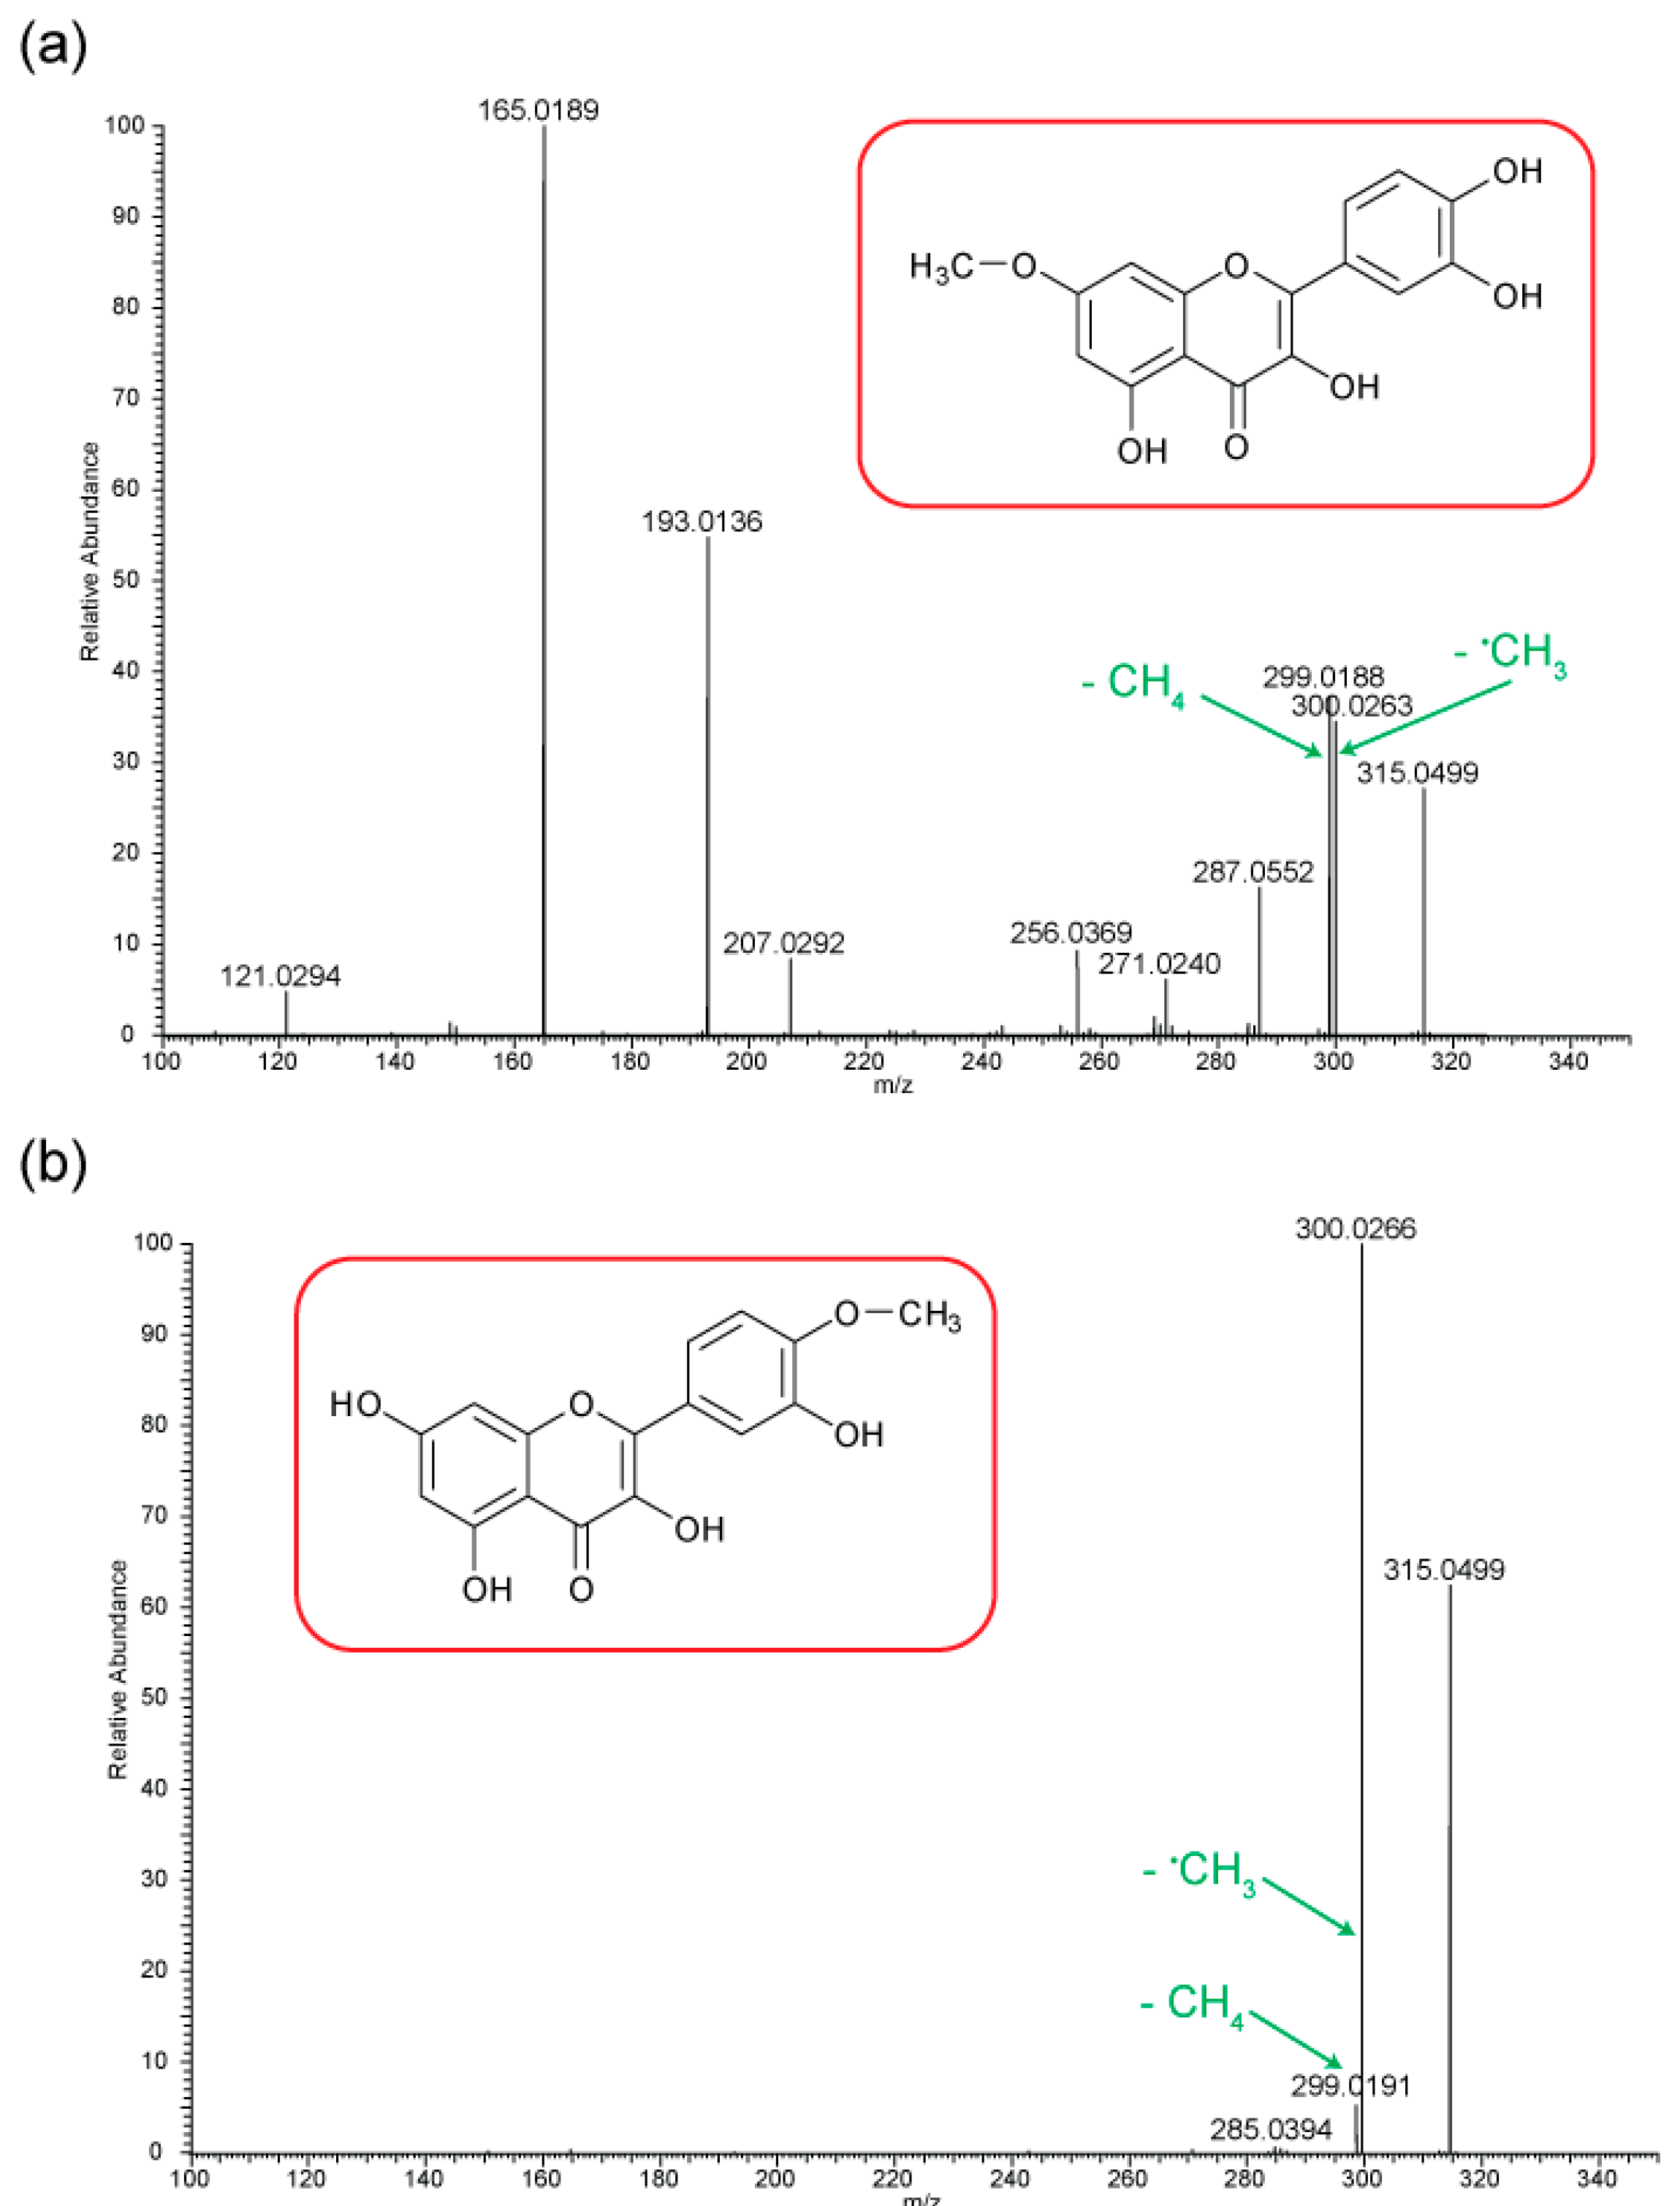
Figure 5 shows the negative ion MS/MS spectra for both rhamnetin and isorhamnetin. Although rhamnetin and isorhamnetin are structural isomers and belong to the same flavonol group, their negative ion MS/MS spectra are distinctively different. They both have losses of CH3. (m/z 300) and CH4 (m/z 299). Compared to isorhamnetin, m/z 299 of rhamnetin is at a much higher intensity and is slightly more intense than m/z 300. In contrast, for isorhamnetin, the loss of CH3. is a much more favourable route. For rhamnetin, a number of additional fragment routes are followed to generate losses of CO in much the same way as in positive ion mode. For isorhamnetin, the only additional product ion is m/z 285 (loss of MeOH from the PI) occurring at a very low intensity. The loss of the methyl radical totally dominates the spectrum.
Figure 6 shows distinctive differences in the product ions for these two flavonols, despite the similarity in their structures. Rhamnetin produces more intense product ion peaks, especially in the lower mass range (m/z 165). Whereas the loss of CH3. dominates the isorhamnetin spectrum. In the breakdown graph for rhamnetin, peak m/z 299 started to occur at CID energy 15eV and m/z 300 at just above 20eV. As the collision energy increases, m/z 299 peak intensity also increases. This supports our theory that loss of CH4, in the case of rhamnetin, is more energetically favourable than the loss of CH3. Figure 6 shows very low intensity for the loss of CH4 for isorhamnetin, as well as other product ions except m/z 300. This observation could be supported by a different mechanism for the loss of CH4, which is discussed next. The striking differences in the mass spectra between these two structurally isomeric flavonols in the negative ion mode build an excellent foundation for isomerisation differentiation. The unique loss of CH4 could be used for the structural elucidation of unknown flavonoids in future work.
Figure 6.
Energy breakdown graphs for (a) Rhamnetin and (b) Isorhamnetin for the negative ion ESI-MS/MS analysis.
Figure 6.
Energy breakdown graphs for (a) Rhamnetin and (b) Isorhamnetin for the negative ion ESI-MS/MS analysis.
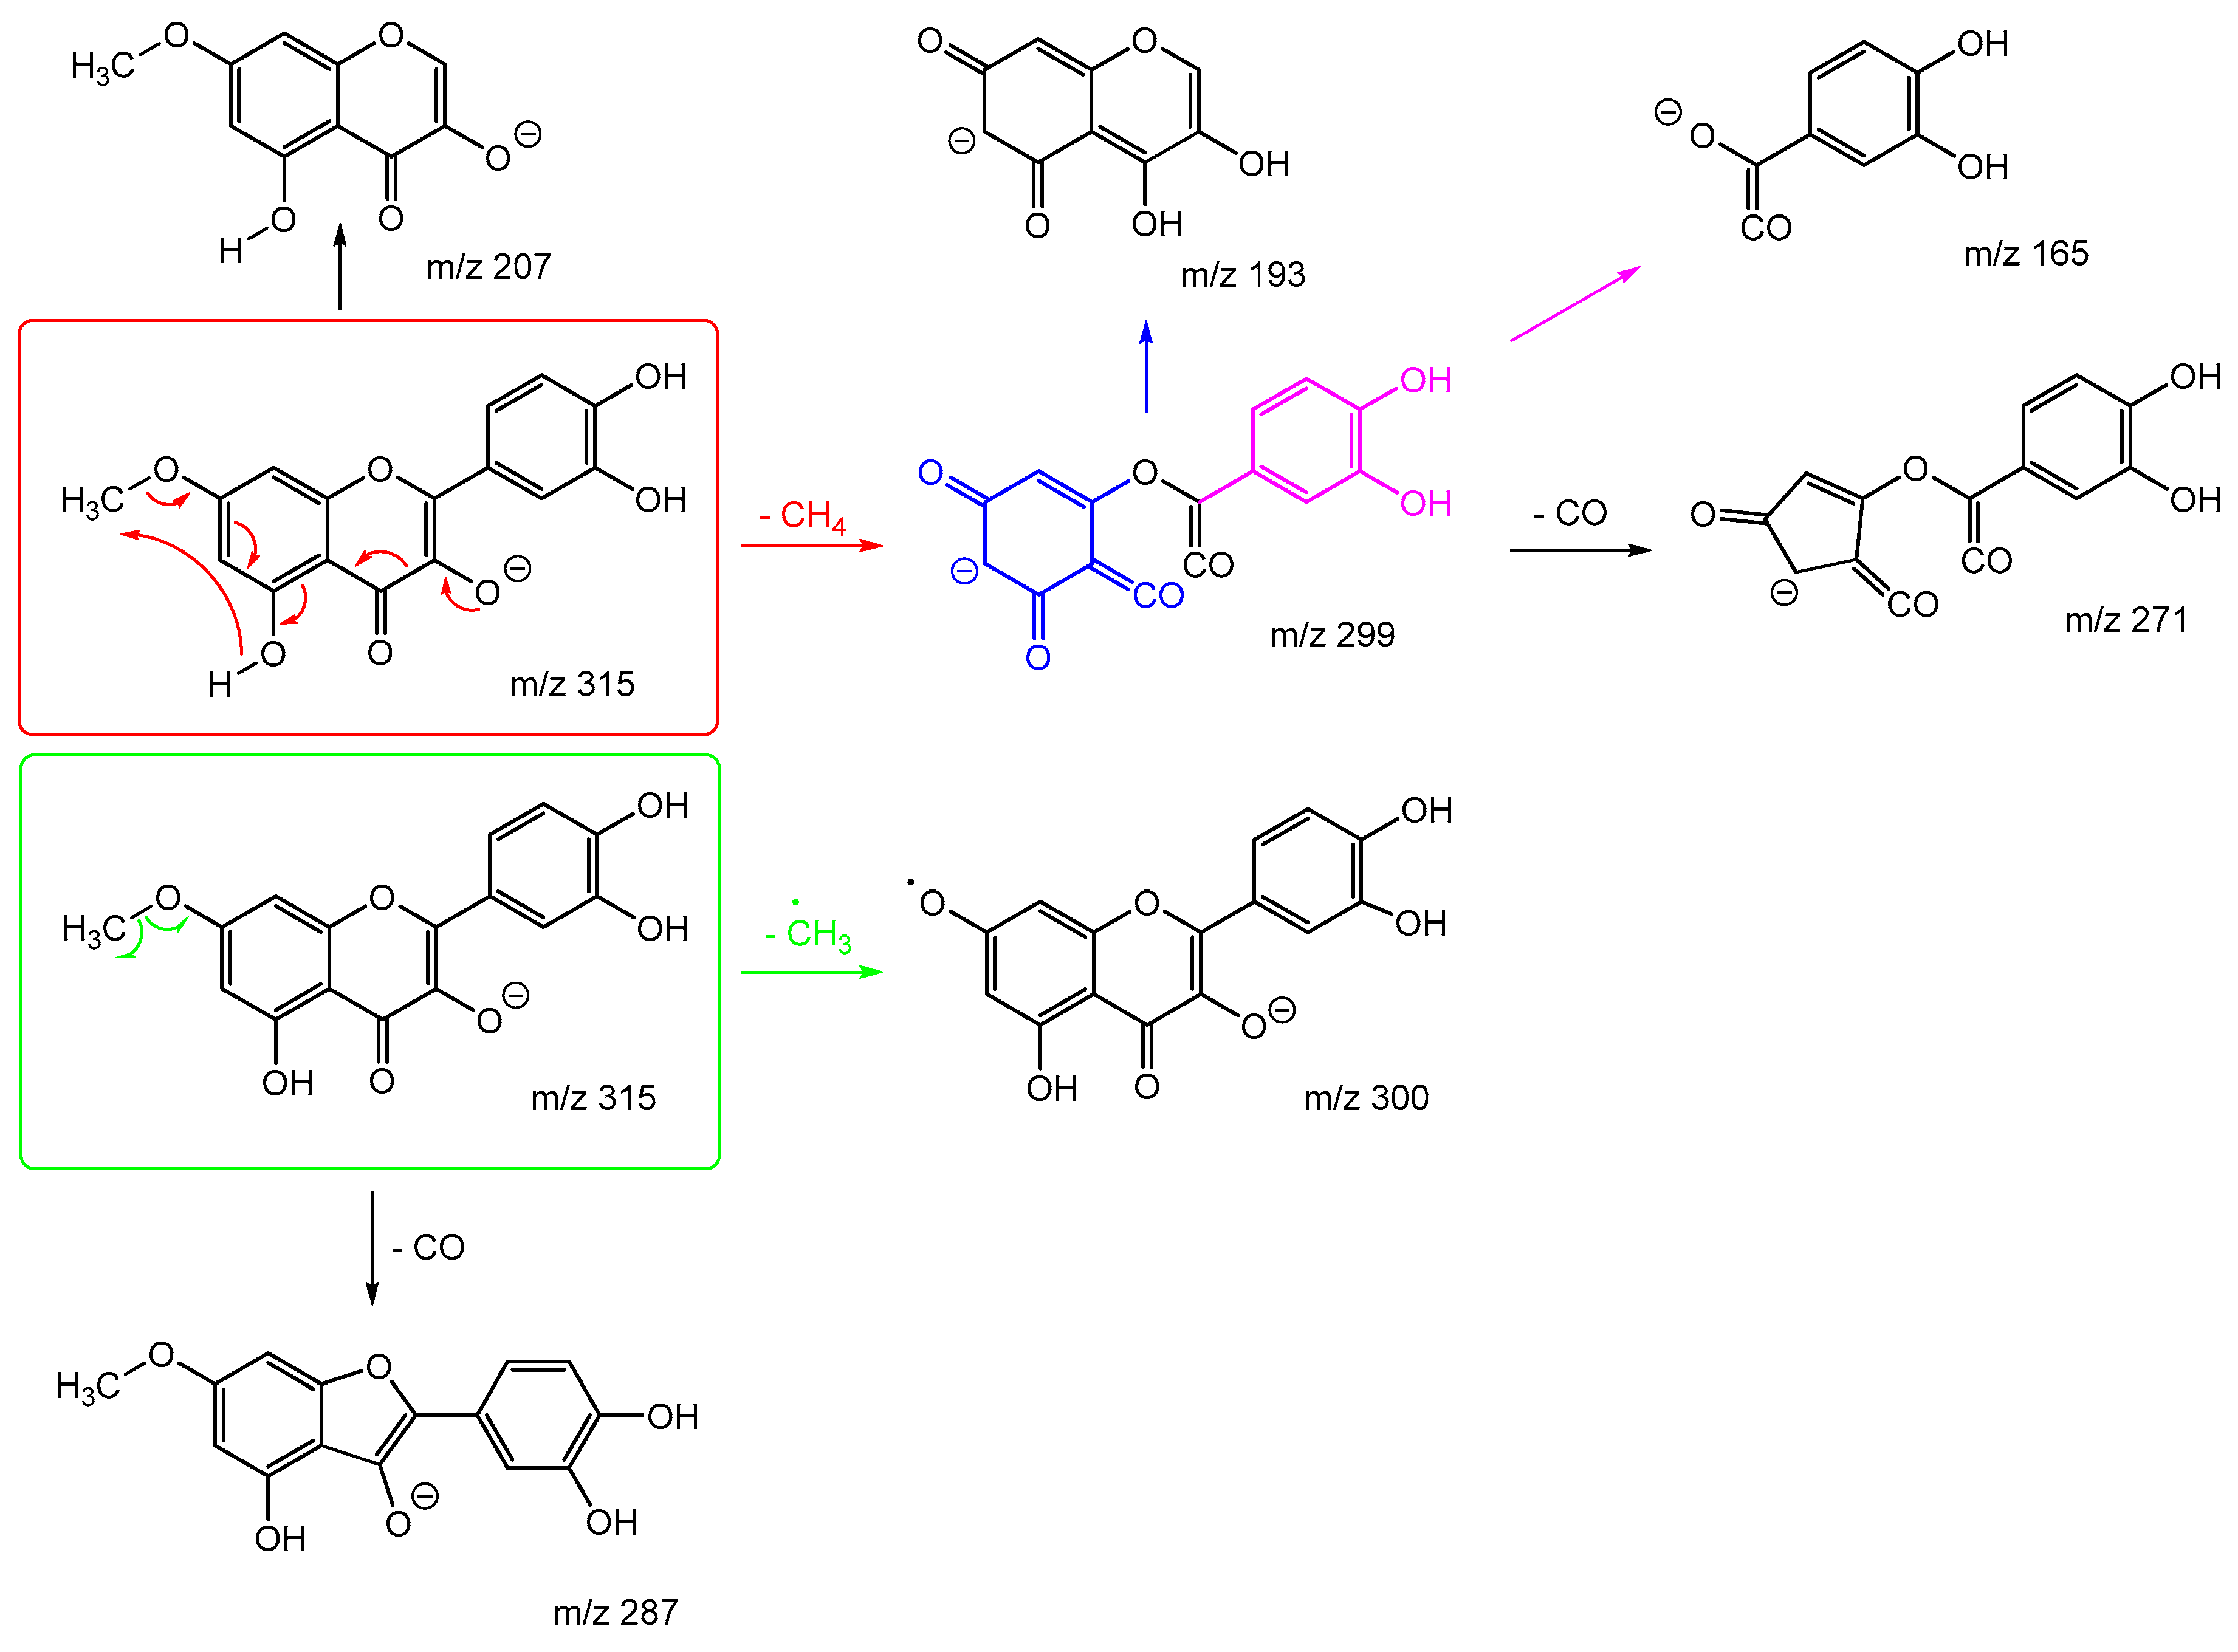
Scheme 7 and Scheme 8 are the proposed fragmentation pathways for rhamnetin and isorhamnetin including the proposed alternative mechanisms for the generation of product ions m/z 300 and 299 in the negative ion mode. In Scheme 7, the negative charge is proposed to be on the meta oxygen in ring C, facilitating a 1,5 hydride shift to eliminate CH4 on ring A. This also promotes a ring opening between C3 and C4 on ring C, resulting in the structure for product ion m/z 299 in Scheme 7. Fragmentation of m/z 299 further produces m/z 271, m/z 193 and m/z 165. For isorhamnetin, due to the different positions of the MeO and OH group, an alternative mechanism is proposed, as published in the literature for hesperetin. [32] Unlike the 1,5 hydride shift, this mechanism is less energetically favourable and could be a reason for the lower intensity of peak m/z 299 for isorhamnetin. The charge remote fragmentation and the lack of ring opening could also contribute to this lower intensity in Figure 5.
4. Conclusions
This study systematically investigated the fragmentation of 30 flavonoids using ESI (positive and negative ion mode) high-resolution accurate mass MS/MS. Common losses are summarised and compiled. Neutral losses such as H2O and CO are dominating. Radical loss of CH3. is consistently observed for flavonoids having methoxy groups in their structures in both positive and negative ion mode. In addition, in the positive ion mode, three diagnostic product ions are identified. There are m/z 153 – indicative of two OH groups on ring A; m/z 167 – indicative of one OH and one methoxy group on ring A; and m/z 151 – a flavanol, with no ketone oxygen but two OH groups on ring A. These findings could provide essential insight into the structural elucidation of unknown flavonoids and flavonoid metabolites.
The addition of energy breakdown graphs to the conventional tandem mass spectra dataset has proven to be a powerful analytical tool in isomer differentiation in the case of flavonoid studies. Three pairs of structural isomers are selected for detailed discussion using their MS/MS spectra and energy breakdown graphs to help visualising the proposed fragmentation pathways. It is shown that although they may share the same common losses, ring C cleavages are often diagnostic due to their distinct A and B ring structures and substitution patterns. Structural isomer flavonoids can display distinctive patterns in their energy breakdown graphs depending on functional group locations on ring A and B.
During the investigation of rhamnetin and isorhamnetin in the negative ion mode, both flavonols exhibit a highly unusual loss of methane apart from the usual radical loss of CH3. . This interesting finding initiated a more detailed examination on their MS/MS spectra and energy breakdown graphs. It was concluded that the loss of methane and radical loss of CH3. are in competition. By interpreting the proposed mechanisms for rhamnetin and isorhamnetin, the nature of this competition is revealed for the first time, and the observation of differences in peak intensities for these two routes could be rationalised.
The work carried out in this paper demonstrates the validity of using a combination of tandem mass spectrometry and energy breakdown graphs in the research for other natural products, especially in isomerisation identification, structural elucidation and qualitative study of these complex compounds. It also provides fundamental understanding to the existing flavonoid studies which could aid in many disciplines including food safety, pharmaceutical development and drug discovery.
Author Contributions
CJ and PJG contributed equally to this study. Conceptualization, PJG and CJ; methodology, PJG; software, CJ; validation, PJG and CJ; formal analysis, CJ; investigation, CJ; resources, PJG; data curation, PJG; writing—original draft preparation, CJ; writing—review and editing, PJG; visualization, CJ and PJG; supervision, PJG; project administration, PJG. All authors have read and agreed to the published version of the manuscript.
Funding
This research received no external funding.
Data Availability Statement
The raw data is available from the University of Bristol data repository listed under the DOI of this paper at: http://www.bristol.ac.uk/////. Additionally, the data can be made available by directly contacting the corresponding author.
Acknowledgments
CJ would like to thank Dr Chris Arthur for help with data extraction.
Conflicts of Interest
The authors declare no conflicts of interest. The funders had no role in the design of the study; in the collection, analyses, or interpretation of data; in the writing of the manuscript; or in the decision to publish the results.
Appendix A

Table A1.
List of abbreviations used throughout this paper.
| Abbrevaition | Meaning |
|---|---|
| CI | Chemical ionisation |
| EBG | Energy breakdown graph |
| EI | Electron ionisation |
| ESI | Electrosprayionisation |
| FAB | Fast atom bombardment |
| HPLC | High performance liquid chromatography |
| m/z | Mass-to-charge Ratio |
| MS | Mass spectrometry |
| MS/MS | Tandem mass ppectrometry |
| PI | Precursor Ion |
| ppm | Parts per million |
| RDA | Retro Diels-Alder reaction |
| UV | Ultraviolet |
Table A2.
List of the flavonoids studied in positive ion mode, their protonated molecular precursor ion m/z, and common neutral losses observed. The flavonoids are coloured by class: purple: flavonol; blue: flavanone; green: isoflavone; brown: flavone; red: flavanol and grey: flavanolol.
Table A2.
List of the flavonoids studied in positive ion mode, their protonated molecular precursor ion m/z, and common neutral losses observed. The flavonoids are coloured by class: purple: flavonol; blue: flavanone; green: isoflavone; brown: flavone; red: flavanol and grey: flavanolol.
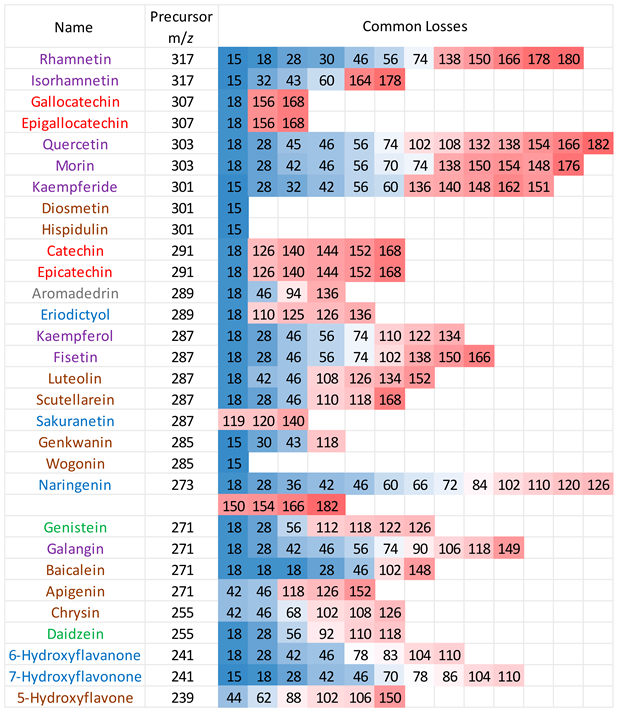 |
Table A3.
List of the flavonoids studied in negative ion mode, along with their deprotonated molecular precursor ion m/z, and common neutral losses observed. The flavonoids are coloured by class: Purple: Flavonol; Blue: Flavanone; Green: Isoflavone; Brown: Flavone; Red: Flavanol and Grey: Flavanolol.
 |
Appendix B
Table A4.
List of all product ions observed in the positive ion CID-MS/MS of rhamnetin (see Figure 2 and Scheme 1) including observed and theoretical m/z, formulae, mass measurement error (ppm) and identity.
| Observed m/z | Theoretical m/z | Formula | Error (ppm) | Identity |
|---|---|---|---|---|
| 317.0665 | 317.0656 | C16H13O7+ | 2.8 | [M+H]+ |
| 302.0428 | 302.0421 | C15H10O7+· | 2.3 | 317 -CH3· |
| 299.0558 | 299.0550 | C16H11O6+ | 2.7 | 317 -H2O |
| 289.0716 | 289.0707 | C15H13O6+ | 3.1 | 317 -CO |
| 288.0639 | 288.0634 | C15H12O6+ | 1.7 | 317 -OCH3· |
| 271.0608 | 271.0601 | C15H11O5+ | 3.3 | 289 -H2O |
| 261.0764 | 261.0757 | C14H13O5+ | 2.7 | 289 -CO |
| 243.0657 | 243.0652 | C14H11O4+ | 2.1 | 271 -CO |
| 179.0344 | 179.0339 | C9H7O4+ | 2.8 | 299 rC1,3A |
| 167.0343 | 167.0339 | C8H7O4+ | 2.4 | 317 rC1,4A |
| 151.0393 | 151.0390 | C8H7O3+ | 2.0 | 179 -CO |
| 149.0237 | 149.0233 | C8H5O3+ | 2.7 | 179 -H2CO |
| 139.0392 | 139.0390 | C7H7O3+ | 1.4 | 167 -CO |
| 137.0236 | 137.0233 | C7H5O3+ | 2.2 | 167 -H2CO |
Table A5.
List of all product ions observed in the positive ion CID-MS/MS of isorhamnetin (see Figure 2 and Scheme 2) including observed and theoretical m/z, formulae, mass measurement error (ppm) and identity.
| Observed m/z | Theoretical m/z | Formula | Error (ppm) | Identity |
|---|---|---|---|---|
| 317.0664 | 317.0656 | C16H13O7+ | 2.5 | [M+H]+ |
| 302.0429 | 302.0421 | C15H10O7+· | 2.6 | 317 -CH3· |
| 285.0402 | 285.0394 | C15H9O6+ | 2.8 | 317 -CH3OH |
| 274.0480 | 274.0472 | C14H10O6+ | 2.9 | 302 -CO |
| 261.0765 | 261.0757 | C14H13O5+ | 3.1 | ? |
| 257.0450 | 257.0444 | C14H9O5+ | 2.3 | 285 -CO |
| 165.0187 | 165.0182 | C8H5O4+ | 3.0 | ? |
| 153.0186 | 153.0182 | C7H5O4+ | 2.6 | 317 rC1,4A |
| 139.0393 | 139.0390 | C7H7O3+ | 2.2 | 317 rC4,10A |
Table A6.
List of all product ions observed in the positive ion CID-MS/MS of kaempferol (see Figure 3 and Scheme 3) including observed and theoretical m/z, formulae, mass measurement error (ppm) and identity.
| Observed m/z | Theoretical m/z | Formula | Error (ppm) | Identity |
|---|---|---|---|---|
| 287.0552 | 287.0550 | C15H11O6+ | 0.7 | [M+H]+ |
| 269.0447 | 269.0444 | C15H9O5+ | 1.1 | 287 -H2O |
| 259.0603 | 259.0601 | C14H11O5+ | 0.8 | 287 -CO |
| 241.0497 | 241.0495 | C14H9O4+ | 0.8 | 269 -CO / 259 -H2O |
| 231.0652 | 231.0652 | C13H11O4+ | 0.0 | 259 -CO |
| 213.0547 | 213.0546 | C13H9O3+ | 0.5 | 241 -CO / 231 -H2O |
| 177.0185 | 177.0182 | C9H5O4+ | 1.7 | 287 rC5,10B |
| 165.0183 | 165.0182 | C8H5O4+ | 0.6 | 287 rC3,10A |
| 153.0184 | 153.0182 | C7H5O4+ | 1.3 | 287 rC1,4A |
| 133.0284 | 133.0284 | C8H5O2+ | 0.0 | ? |
| 121.0283 | 121.0284 | C7H5O2+ | 0.8 | ? |
Table A7.
List of all product ions observed in the positive ion CID-MS/MS of fisetin (see Figure 3 and Scheme 4) including observed and theoretical m/z, formulae, mass measurement error (ppm) and identity.
| Observed m/z | Theoretical m/z | Formula | Error (ppm) | Identity |
|---|---|---|---|---|
| 287.0551 | 287.0550 | C15H11O6+ | 0.3 | [M+H]+ |
| 269.0446 | 269.0444 | C15H9O5+ | 0.7 | 287 -H2O |
| 259.0602 | 259.0601 | C14H11O5+ | 0.4 | 287 -CO |
| 241.0496 | 241.0495 | C14H9O4+ | 0.4 | 287 -H2CO2 / 269 -CO / 259 -H2O |
| 231.0652 | 231.0652 | C13H11O4+ | 0.0 | 259 -CO |
| 213.0547 | 213.0546 | C13H9O3+ | 0.5 | 241 -CO |
| 185.0598 | 185.0597 | C12H9O2+ | 0.5 | 213 -CO |
| 149.0234 | 149.0233 | C8H5O3+ | 0.7 | 287 rC1,4B / 259 -C6H6O2 |
| 137.0234 | 137.0233 | C7H5O3+ | 0.7 | 287 rC1,4B |
| 121.0284 | 121.0284 | C7H5O2+ | 0.0 | 149 -CO |
Table A8.
List of all product ions observed in the positive ion CID-MS/MS of chrysin (see Figure 4 and Scheme 5) including observed and theoretical m/z, formulae, mass measurement error (ppm) and identity.
| Observed m/z | Theoretical m/z | Formula | Error (ppm) | Identity |
|---|---|---|---|---|
| 255.0655 | 255.0652 | C15H11O4+ | 1.2 | [M+H]+ |
| 237.0545 | 237.0546 | C15H9O3+ | 0.4 | 255 -H2O |
| 231.0651 | 231.0652 | C13H11O4+ | 0.4 | 255 -C2 |
| 227.0704 | 227.0703 | C14H11O3+ | 0.4 | 255 -CO |
| 213.0546 | 213.0546 | C13H9O3+ | 0.0 | 255 -CH2CO |
| 209.0596 | 209.0597 | C14H9O2+ | 0.5 | 237 -CO |
| 187.0754 | 187.0754 | C12H11O2+ | 0.0 | 255 -C3O2 |
| 153.0183 | 153.0182 | C7H5O4+ | 0.7 | 255 rC1,4A |
| 147.0440 | 147.0441 | C9H7O2+ | 0.7 | 255 rC5,10B |
| 129.0334 | 129.0335 | C9H5O+ | 0.8 | 147 -H2O |
Table A9.
List of all product ions observed in the positive ion CID-MS/MS of daidzein (see Figure 4 and Scheme 6) including observed and theoretical m/z, formulae, mass measurement error (ppm) and identity.
| Observed m/z | Theoretical m/z | Formula | Error (ppm) | Identity |
|---|---|---|---|---|
| 255.0653 | 255.0652 | C15H11O4+ | 0.4 | [M+H]+ |
| 237.0548 | 237.0546 | C15H9O3+ | 0.8 | 255 -H2O |
| 227.0704 | 227.0703 | C14H11O3+ | 0.4 | 255 -CO |
| 199.0755 | 199.0754 | C13H11O2+ | 0.5 | 227 -CO |
| 145.0285 | 145.0284 | C9H5O2+ | 0.7 | 237 -C6H4O |
| 137.0234 | 137.0233 | C7H5O3+ | 0.7 | 255 rC1,4A |
Table A10.
List of all product ions observed in the negative ion CID-MS/MS of rhamnetin (see Figure 5 and Scheme 7) including observed and theoretical m/z, formulae, mass measurement error (ppm) and identity.
| Observed m/z | Theoretical m/z | Formula | Error (ppm) | Identity |
|---|---|---|---|---|
| 315.0499 | 315.0510 | C16H11O7- | 3.5 | [M-H]- |
| 300.0263 | 300.0276 | C15H8O7- | 4.3 | 315 -CH3· |
| 299.0188 | 299.0197 | C15H7O7- | 3.0 | 315 -CH4 |
| 287.0552 | 287.0561 | C13H11O2- | 3.1 | 315 -CO |
| 271.0240 | 271.0248 | C14H7O6- | 3.0 | 299 -CO |
| 207.0292 | 207.0299 | C10H7O5- | 3.4 | 315 -C6H4O2 |
| 193.0136 | 193.0142 | C9H5O5- | 3.1 | from 299 |
| 165.0189 | 165.0193 | C8H5O4- | 2.4 | from 299 |
| 121.0294 | 121.0295 | C7H5O2- | 0.8 | from 207? |
Table A11.
List of all product ions observed in the negative ion CID-MS/MS of isorhamnetin (see Figure 5 and Scheme 8) including observed and theoretical m/z, formulae, mass measurement error (ppm) and identity.
| Observed m/z | Theoretical m/z | Formula | Error (ppm) | Identity |
|---|---|---|---|---|
| 315.0499 | 315.0510 | C16H11O7- | 3.5 | [M-H]- |
| 300.0266 | 300.0276 | C15H8O7- | 3.3 | 315 -CH3· |
| 299.0191 | 299.0197 | C15H7O7- | 2.0 | 315 -CH4 |
| 285.0394 | 285.0405 | C15H9O6- | 3.9 | 315 -CH3OH |
References
- Roy, A.; Khan, A.; Ahmad, I.; Alghamdi, S.; Rajab, B.S.; Babalghith, A.O.; Alshahrani, M.Y.; Islam, S.; Islam, M.R. Flavonoids a Bioactive Compound from Medicinal Plants and Its Therapeutic Applications. Biomed. Res. Int 2022, 5445291. [Google Scholar] [CrossRef] [PubMed]
- Panche, A.N.; Diwan, A.D.; Chandra, S.R. Flavonoids: An Overview. J. Nutr. Sci., 2016, 5, e47. [Google Scholar] [CrossRef] [PubMed]
- Pietta, P-G. Flavonoids as Antioxidants. J. Nat. Prod., 2000, 63, 1035–1042. [Google Scholar] [CrossRef]
- Ginwala, R.; Bhavsar, R.; Chigbu, D.G.I; Jain, P.; Khan, Z.K. ; Potential Role of Flavonoids in Treating Chronic Inflammatory Diseases with a Special Focus on the Anti-Inflammatory Activity of Apigenin. Antioxidants, 2019, 8, 35. [Google Scholar] [CrossRef] [PubMed]
- Ayachi, A.; Boy, G.; Samet, S.; Téné, N.; Bouzayani, B.; Treilhou, M.; Mezghani-Jarraya, R.; Billet, A. Isolation, NMR Characterization, and Bioactivity of a Flavonoid Triglycoside from Anthyllis henoniana Stems: Antioxidant and Antiproliferative Effects on MDA-MB-231 Breast Cancer Cells. Antioxidants, 2024, 13, 793. [Google Scholar] [CrossRef]
- Fuhrman, B.; Buch, S.; Vaya, J.; Belinky, P.A.; Coleman, R.; Hayek, T. , Aviram, M. Licorice Extract and its Major Polyphenol Glabridin Protect Low-density Lipoprotein Against Lipid Peroxidation: In vitro and Ex vivo Studies in Humans and in Atherosclerotic Apolipoprotein E-deficient Mice. Am. J. Clin. Nutr., 1997, 66, 267–275. [Google Scholar] [CrossRef]
- Chen, Z.; Zheng, S.; Li, L.; Jiang, H. Metabolism of Flavonoids in Human: A Comprehensive Review. Curr. Drug Metab., 2014, 15, 48–61. [Google Scholar] [CrossRef]
- Cassidy, A.; Minihane, A-M. The Role of Metabolism (and the Microbiome) in Defining the Clinical Efficacy of Dietary Flavonoids. Am. J. Clin. Nutr., 2017, 105, 10–22. [Google Scholar] [CrossRef]
- Walle, T. Absorption and Metabolism of Flavonoids. Free Radic. Biol. Med., 2004, 36, 829–837. [Google Scholar] [CrossRef]
- Hollman, P.C.H. Absorption, Bioavailability, and Metabolism of Flavonoids. Pharm. Biol., 2004, 42, 74–83. [Google Scholar] [CrossRef]
- Kumar, S.; Pandey, A.K. Chemistry and Biological Activities of Flavonoids: An Overview. Sci. World J, 2013. [Google Scholar] [CrossRef]
- Nutho, B.; Tungmunnithum, D. Anti-Aging Potential of the Two Major Flavonoids Occurring in Asian Water Lily Using In Vitro and In Silico Molecular Modeling Assessments. Antioxidants, 2024, 13, 601. [Google Scholar] [CrossRef] [PubMed]
- Ullah, A.; Munir, S.; Badshah, S.L.; Khan, N.; Ghani, L.; Poulson, B.G.; Emwas, A.H.; Jaremko, M. Important Flavonoids and Their Role as a Therapeutic Agent. Molecules, 2020, 25, 5243. [Google Scholar] [CrossRef]
- Kingston, D.G.I. Mass Spectrometry of Organic Compounds—VI : Electron-impact Spectra of Flavonoid Compounds. Tetrahedron, 1971, 27, 2691–2700. [Google Scholar] [CrossRef]
- Yinon, J.; Issachar D,; Boettger, H. G. Studies in Chemical Ionization Mass Spectrometry of Some Flavonoids. Org. Mass. Spectrom., 1978, 13, 167–171. [Google Scholar] [CrossRef]
- Stobiecki, M. Application of Mass Spectrometry for Identification and Structural Studies of Flavonoid Glycosides. Phytochem. 2000, 54, 237–256. [Google Scholar] [CrossRef]
- Hughes, R.J.; Croley, T.R.; Metcalfe, C.D.; March, R.E. A Tandem Mass Spectrometric Study of Selected Characteristic Flavonoids. Int. J. Mass. Spectrom., 2001, 210, 371–385. [Google Scholar] [CrossRef]
- Tsimogiannis, D.; Samiotaki, M.; Panayotou, G.; Oreopoulou, V. Characterization of Flavonoid Subgroups and Hydroxy Substitution by HPLC-MS/MS. Molecules, 2007, 12, 593–606. [Google Scholar] [CrossRef]
- Fabre, N.; Rustan, I.; de Hoffmann, E.; Quetin-Leclercq, J. Determination of Flavone, Flavonol, and Flavanone Aglycones by Negative Ion Liquid Chromatography Electrospray Ion Trap Mass Spectrometry. J. Am. Soc. Mass. Spectrom., 2001, 12, 707–715. [Google Scholar] [CrossRef]
- Cuyckens, F.; Claeys, M. Mass Spectrometry in the Structural Analysis of Flavonoids. J. Mass Spectrom., 2004, 39, 1–15. [Google Scholar] [CrossRef]
- Prasain, J.K.; Wang, C-C. ; Barnes, S. Mass Spectrometric Methods for the Determination of Flavonoids in Biological Samples. Free Radical Biol. Med., 2004, 37, 1324–1350. [Google Scholar] [CrossRef]
- Chalet, C.; Hollebrands, B.; Janssen, H-G. ; Augustijns, P.; Duchateau, G. Identification of Phase-II Metabolites of Flavonoids by Liquid Chromatography–Ion-Mobility Spectrometry–Mass Spectrometry. Anal. Bioanal. Chem., 2018, 410, 471–482. [Google Scholar] [CrossRef] [PubMed]
- Careri, A.; Mangia, M.; Musci, M. Overview of the Applications of Liquid Chromatography–Mass Spectrometry Interfacing Systems in Food Analysis: Naturally Occurring Substances in Food. J. Chromatogr. A, 1998, 794, 263–297. [Google Scholar] [CrossRef]
- Butcher, C.P.G.; Dyson, P.J.; Johnson, B.F.G.; Langridge-Smith, P.R.R.; McIndoe, J.S.; Whyte, C. On the Use of Breakdown Graphs Combined with Energy-dependent Mass Spectrometry to Provide a Complete Picture of Fragmentation Processes. R. Commun. Mass Spectrom., 2002, 16, 1595–1598. [Google Scholar] [CrossRef]
- Mörlein, S.; Schuster, C.; Paal, M.; Vogeser, M. Collision Energy-Breakdown Curves - An Additional Tool to Characterize MS/MS Methods. Clin. Mass Spectrom., 2020, 18, 48–53. [Google Scholar] [CrossRef]
- Murakami, T.; Iwamuro, Y.; Ishimaru, R.; Chinaka, S.; Kato, N.; Sakamoto, Y.; Sugimura, N.; Hasegawa, H. Energy-Resolved Mass Spectrometry for Differentiation of the Fluorine Substitution Position on the Phenyl Ring of Fluoromethcathinones. J. Mass Spectrom., 2019, 54, 205–212. [Google Scholar] [CrossRef]
- Ma, Y.L.; Li, Q.M.; van den Heuvel, H.; Claeys, M. Characterization of Flavone and Flavonol Aglycones by Collision-Induced Dissociation Tandem Mass Spectrometry. R. Commun. Mass Spectrom., 1997, 11, 1357–1364. [Google Scholar] [CrossRef]
- Baracco, A.; Bertin, G.; Gnocco, E.; Legorat, M.; Sedocco, S.; Catinella, S.; Favretto, D.; Traldi, P. A Comparison of the Combination of Fast-Atom Bombardment with Tandem Mass Spectrometry and of Gas Chromatography with Mass Spectrometry in the Analysis of a Mixture of Kaempferol, Kaempferide, Luteolin and Oleouropein. R. Commun. Mass Spectrom., 1995, 9, 427–436. [Google Scholar] [CrossRef]
- Kang, J.; Hick, L.A.; Price, W.E. A Fragmentation Study of Isoflavones in Negative Electrospray Ionization by MSn Ion Trap Mass Spectrometry and Triple Quadrupole Mass Spectrometry. R. Commun. Mass Spectrom., 2007, 21, 857–868. [Google Scholar] [CrossRef]
- Schmidt, J. Negative Ion Electrospray High-Resolution Tandem Mass Spectrometry of Polyphenols. J. Mass Spectrom., 2016, 51, 33–43. [Google Scholar] [CrossRef]
- Zhang, L.; Xu, L.; Xiao, S.S.; Liao, Q.F.; Li, Q.; Liang, J.; Chen, X.H.; Bi, K.S. Characterization of Flavonoids in the Extract of Sophora flavescens Ait. by High-Performance Liquid Chromatography Coupled with Diode-Array Detector and Electrospray Ionization Mass Spectrometry J. Pharm. Biomed. Anal., 2007, 44, 1019–1028. [Google Scholar] [CrossRef]
- Gates, P.J.; Lopes, N.P. Characterisation of Flavonoid Aglycones by Negative Ion Chip-Based Nanospray Tandem Mass Spectrometry. Int. J. Anal. Chem., 2012, 2012, 259217. [Google Scholar] [CrossRef] [PubMed]
- Lopes, N.P.; Fonseca, T.; Wilkins, J.P.; Staunton, J.; Gates, P.J. Novel Gas-Phase Ion–Molecule Aromatic Nucleophilic Substitution in β-carbolines. Chem. Commun. 2003; 72–73. [Google Scholar] [CrossRef]
Figure 1.
The basic structure of flavonoids. The atom numbering system employed throughout this study is also included.
Figure 1.
The basic structure of flavonoids. The atom numbering system employed throughout this study is also included.
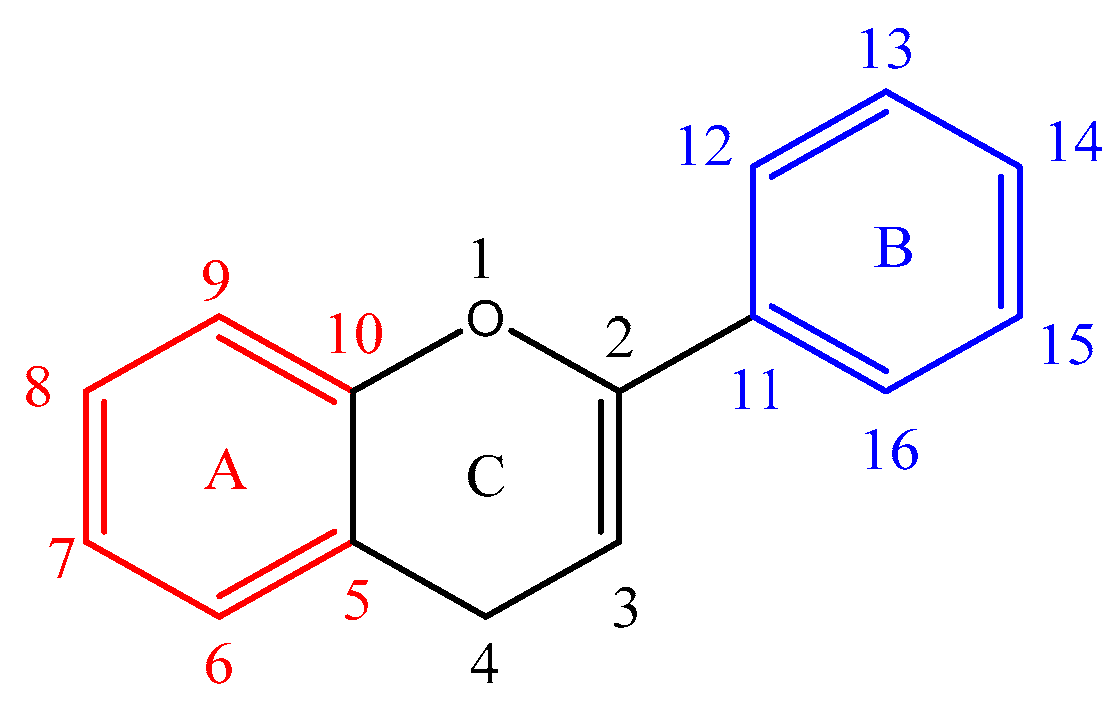
Figure 2.
The positive ion mode CID MS/MS spectra and energy breakdown graphs (EBG) of rhamnetin and isorhamnetin. Spectrum (a) is the MS/MS (32 eV and PI m/z 317) and graph (b) is the EBG for rhamnetin whereas spectrum (c) is the MS/MS (31 eV and PI m/z 317) and graph (d) is the EBG isorhamnetin.
Figure 2.
The positive ion mode CID MS/MS spectra and energy breakdown graphs (EBG) of rhamnetin and isorhamnetin. Spectrum (a) is the MS/MS (32 eV and PI m/z 317) and graph (b) is the EBG for rhamnetin whereas spectrum (c) is the MS/MS (31 eV and PI m/z 317) and graph (d) is the EBG isorhamnetin.
Scheme 1.
The proposed fragmentation pathway for rhamnetin in positive ion mode. The formulae of all product ions are confirmed by accurate mass (2.4ppm) (Table A4 in Appendix B).
Scheme 1.
The proposed fragmentation pathway for rhamnetin in positive ion mode. The formulae of all product ions are confirmed by accurate mass (2.4ppm) (Table A4 in Appendix B).
Scheme 2.
Proposed fragmentation pathway for isorhamnetin in positive ion mode. The formulae of all product ions are confirmed by accurate mass (average of 2.7ppm) (Table A5 in Appendix B).
Scheme 2.
Proposed fragmentation pathway for isorhamnetin in positive ion mode. The formulae of all product ions are confirmed by accurate mass (average of 2.7ppm) (Table A5 in Appendix B).
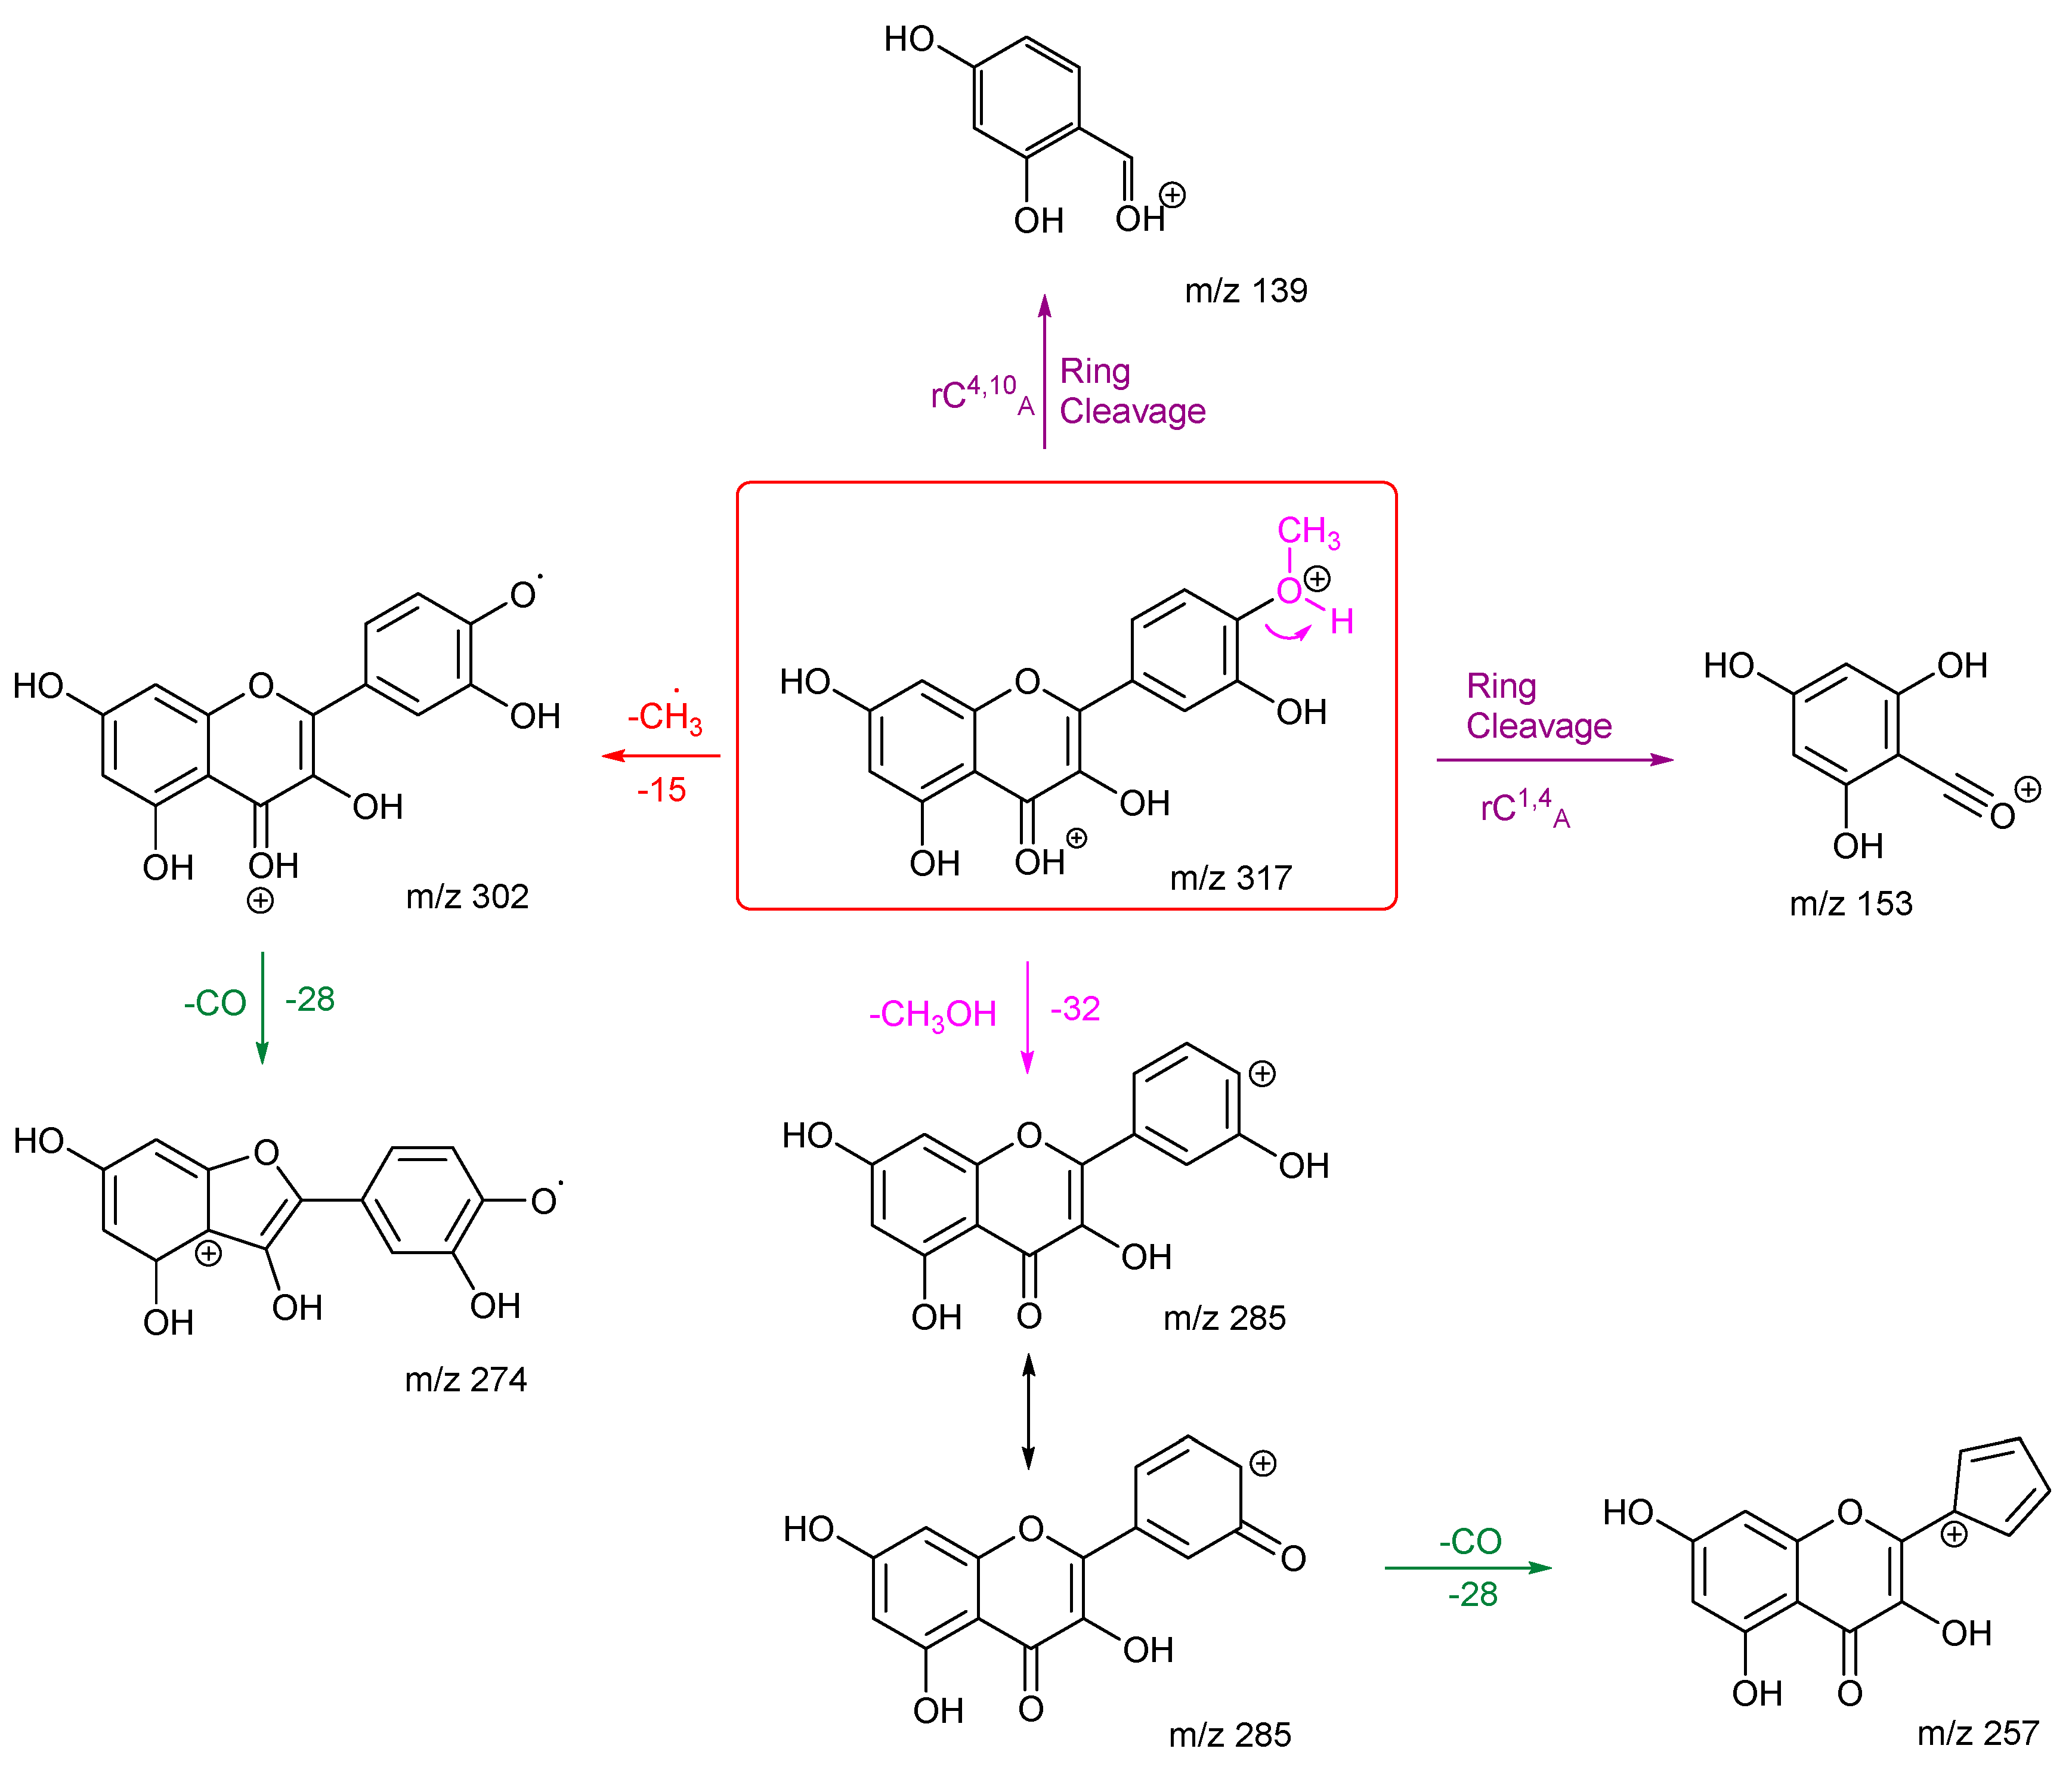
Figure 3.
The positive ion mode CID MS/MS spectra and energy breakdown graphs (EBG) of kaempferol and fisetin. Spectrum (a) is the MS/MS (31 eV and PI m/z 287) and graph (b) is the EBG for kaempferol whereas spectrum (c) is the MS/MS (32 eV and PI m/z 287) and graph (d) is the EBG fisetin.
Figure 3.
The positive ion mode CID MS/MS spectra and energy breakdown graphs (EBG) of kaempferol and fisetin. Spectrum (a) is the MS/MS (31 eV and PI m/z 287) and graph (b) is the EBG for kaempferol whereas spectrum (c) is the MS/MS (32 eV and PI m/z 287) and graph (d) is the EBG fisetin.
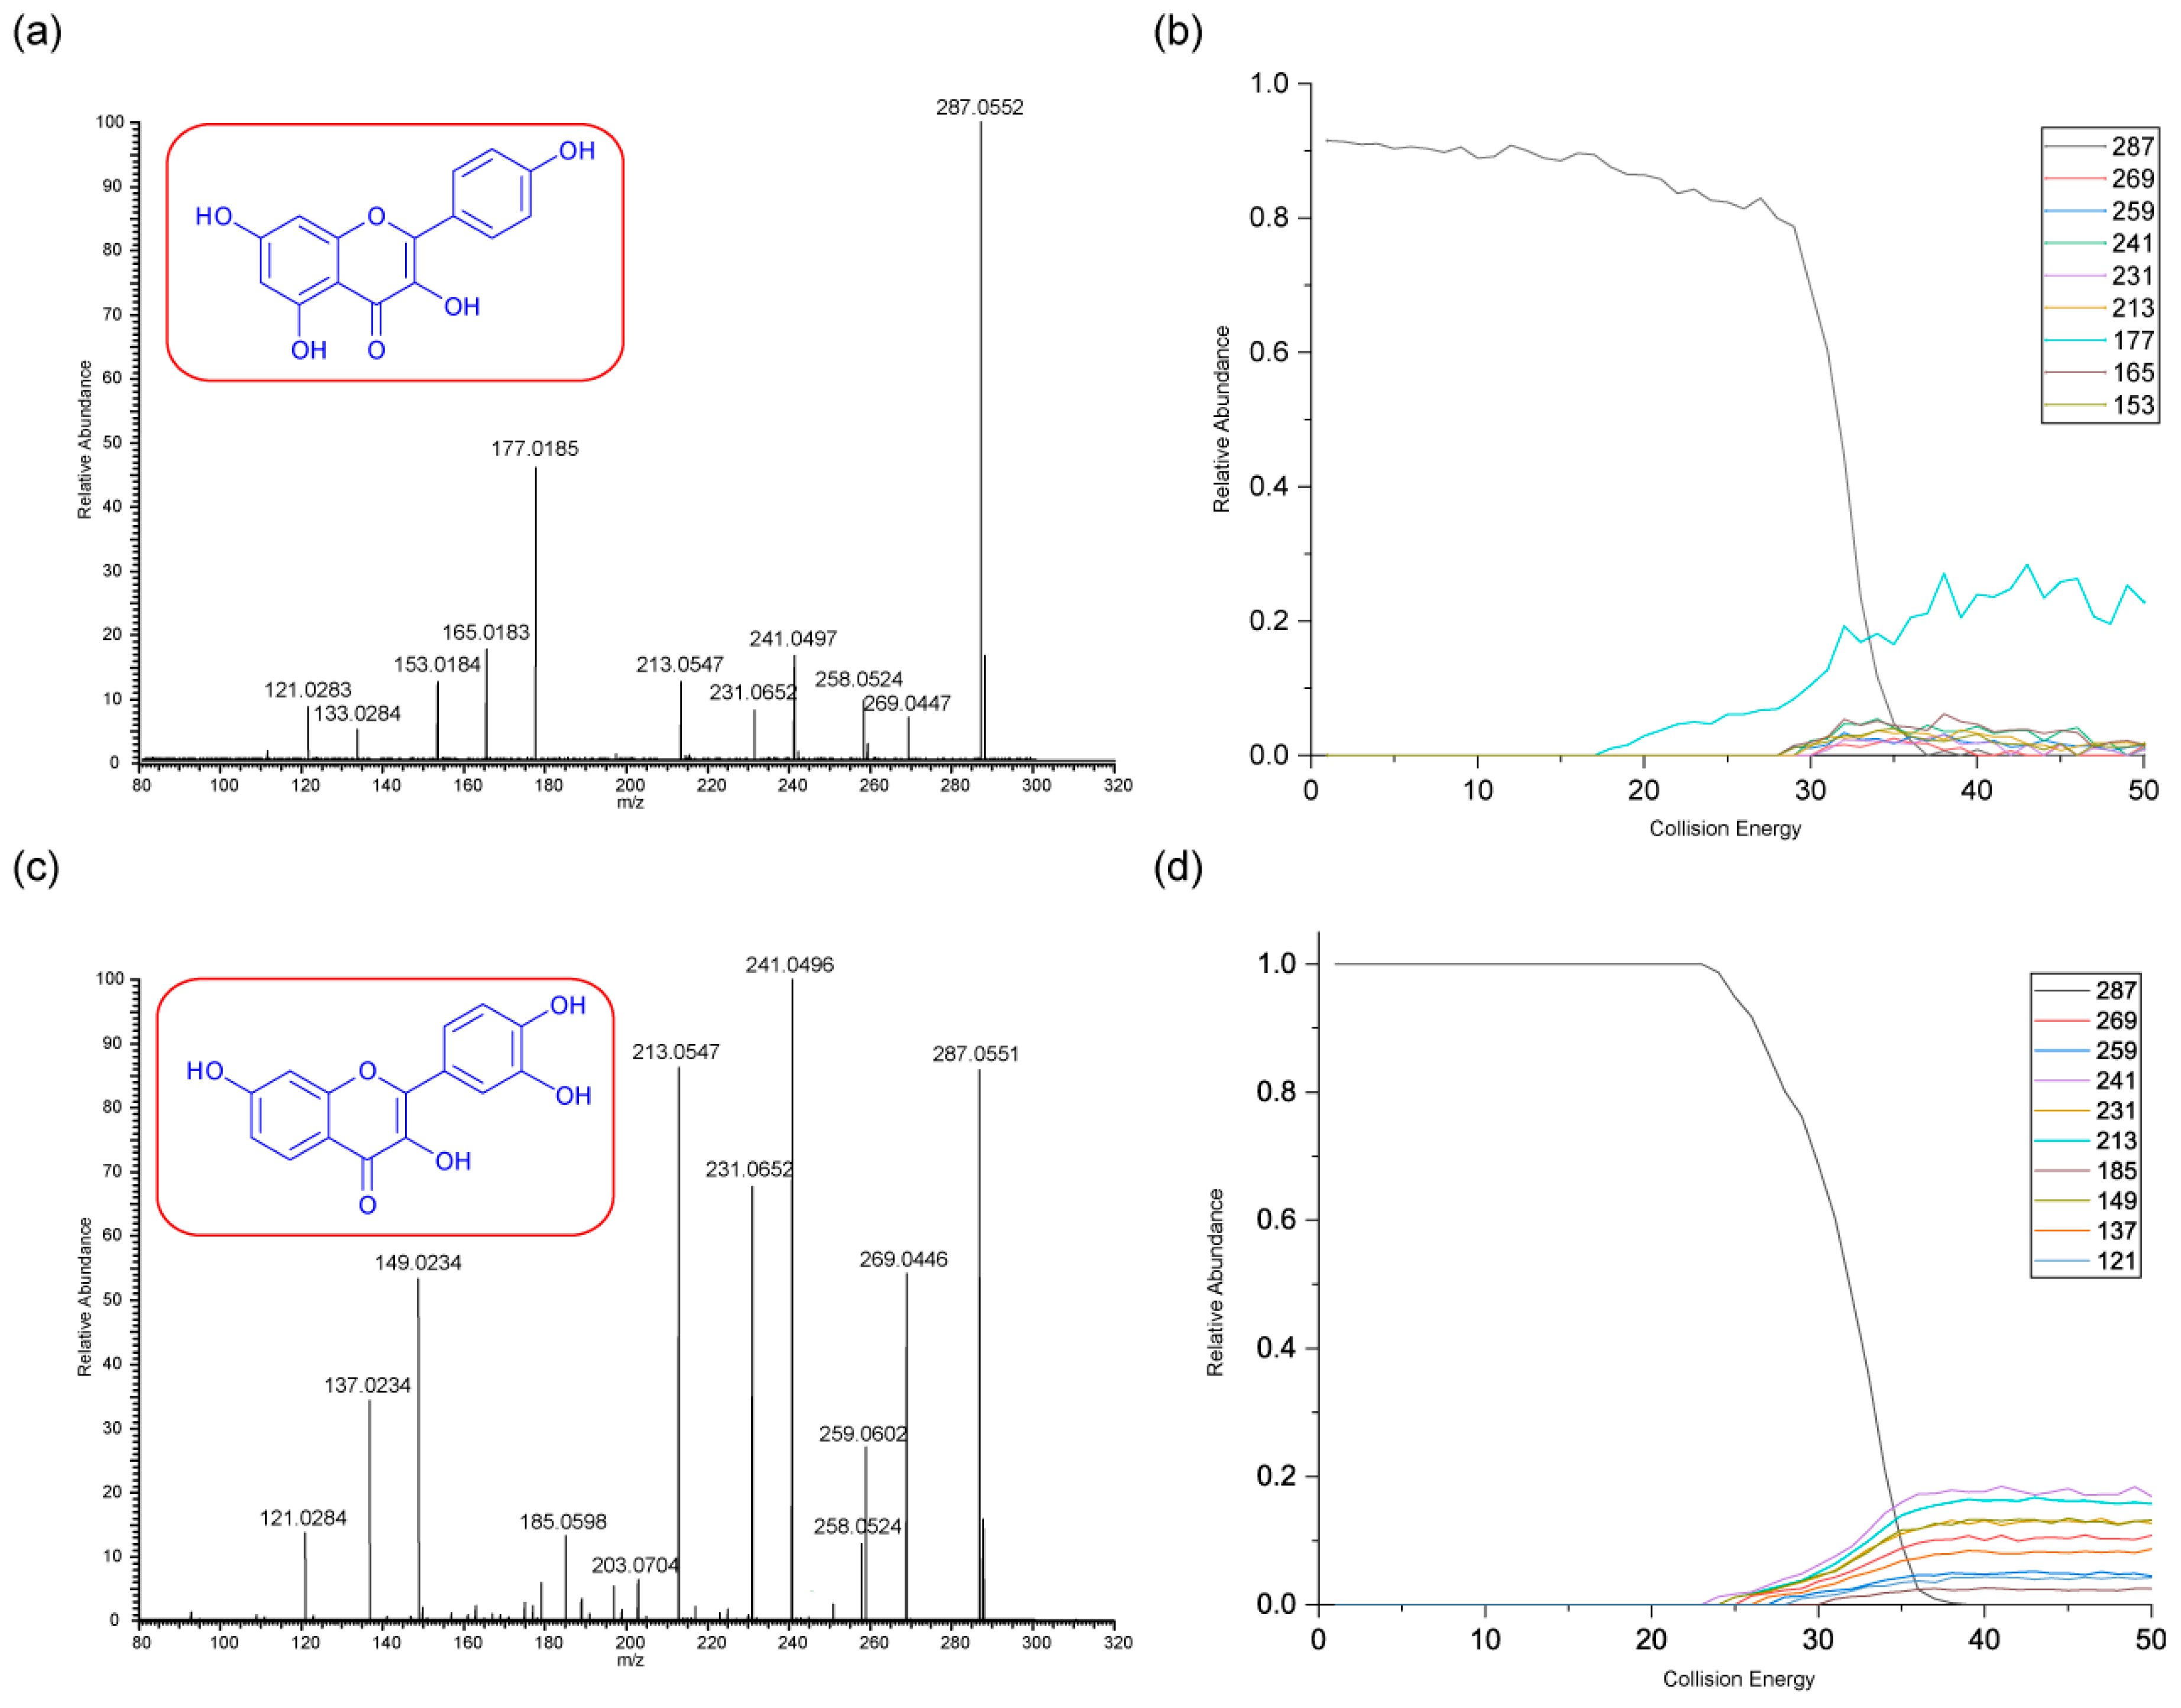
Figure 4.
The positive ion mode CID MS/MS spectra and energy breakdown graphs (EBG) of chrysin and daidzein. Spectrum (a) is the MS/MS (35 eV and PI m/z 255) and graph (b) is the EBG for chrysin whereas spectrum (c) is the MS/MS (30 eV and PI m/z 255) and graph (d) is the EBG diadzein.
Figure 4.
The positive ion mode CID MS/MS spectra and energy breakdown graphs (EBG) of chrysin and daidzein. Spectrum (a) is the MS/MS (35 eV and PI m/z 255) and graph (b) is the EBG for chrysin whereas spectrum (c) is the MS/MS (30 eV and PI m/z 255) and graph (d) is the EBG diadzein.
Scheme 5.
Proposed fragmentation pathway for chrysin in positive ion mode. The formulae of all product ions formed are confirmed by accurate mass (average of 0.5 ppm) (Table A8 in Appendix B).
Scheme 5.
Proposed fragmentation pathway for chrysin in positive ion mode. The formulae of all product ions formed are confirmed by accurate mass (average of 0.5 ppm) (Table A8 in Appendix B).
Scheme 6.
Proposed fragmentation pathway for daidzein in positive ion mode. The formulae of all product ions formed are confirmed by accurate mass (average of 0.6 ppm) (Table A9 in Appendix B).
Scheme 6.
Proposed fragmentation pathway for daidzein in positive ion mode. The formulae of all product ions formed are confirmed by accurate mass (average of 0.6 ppm) (Table A9 in Appendix B).
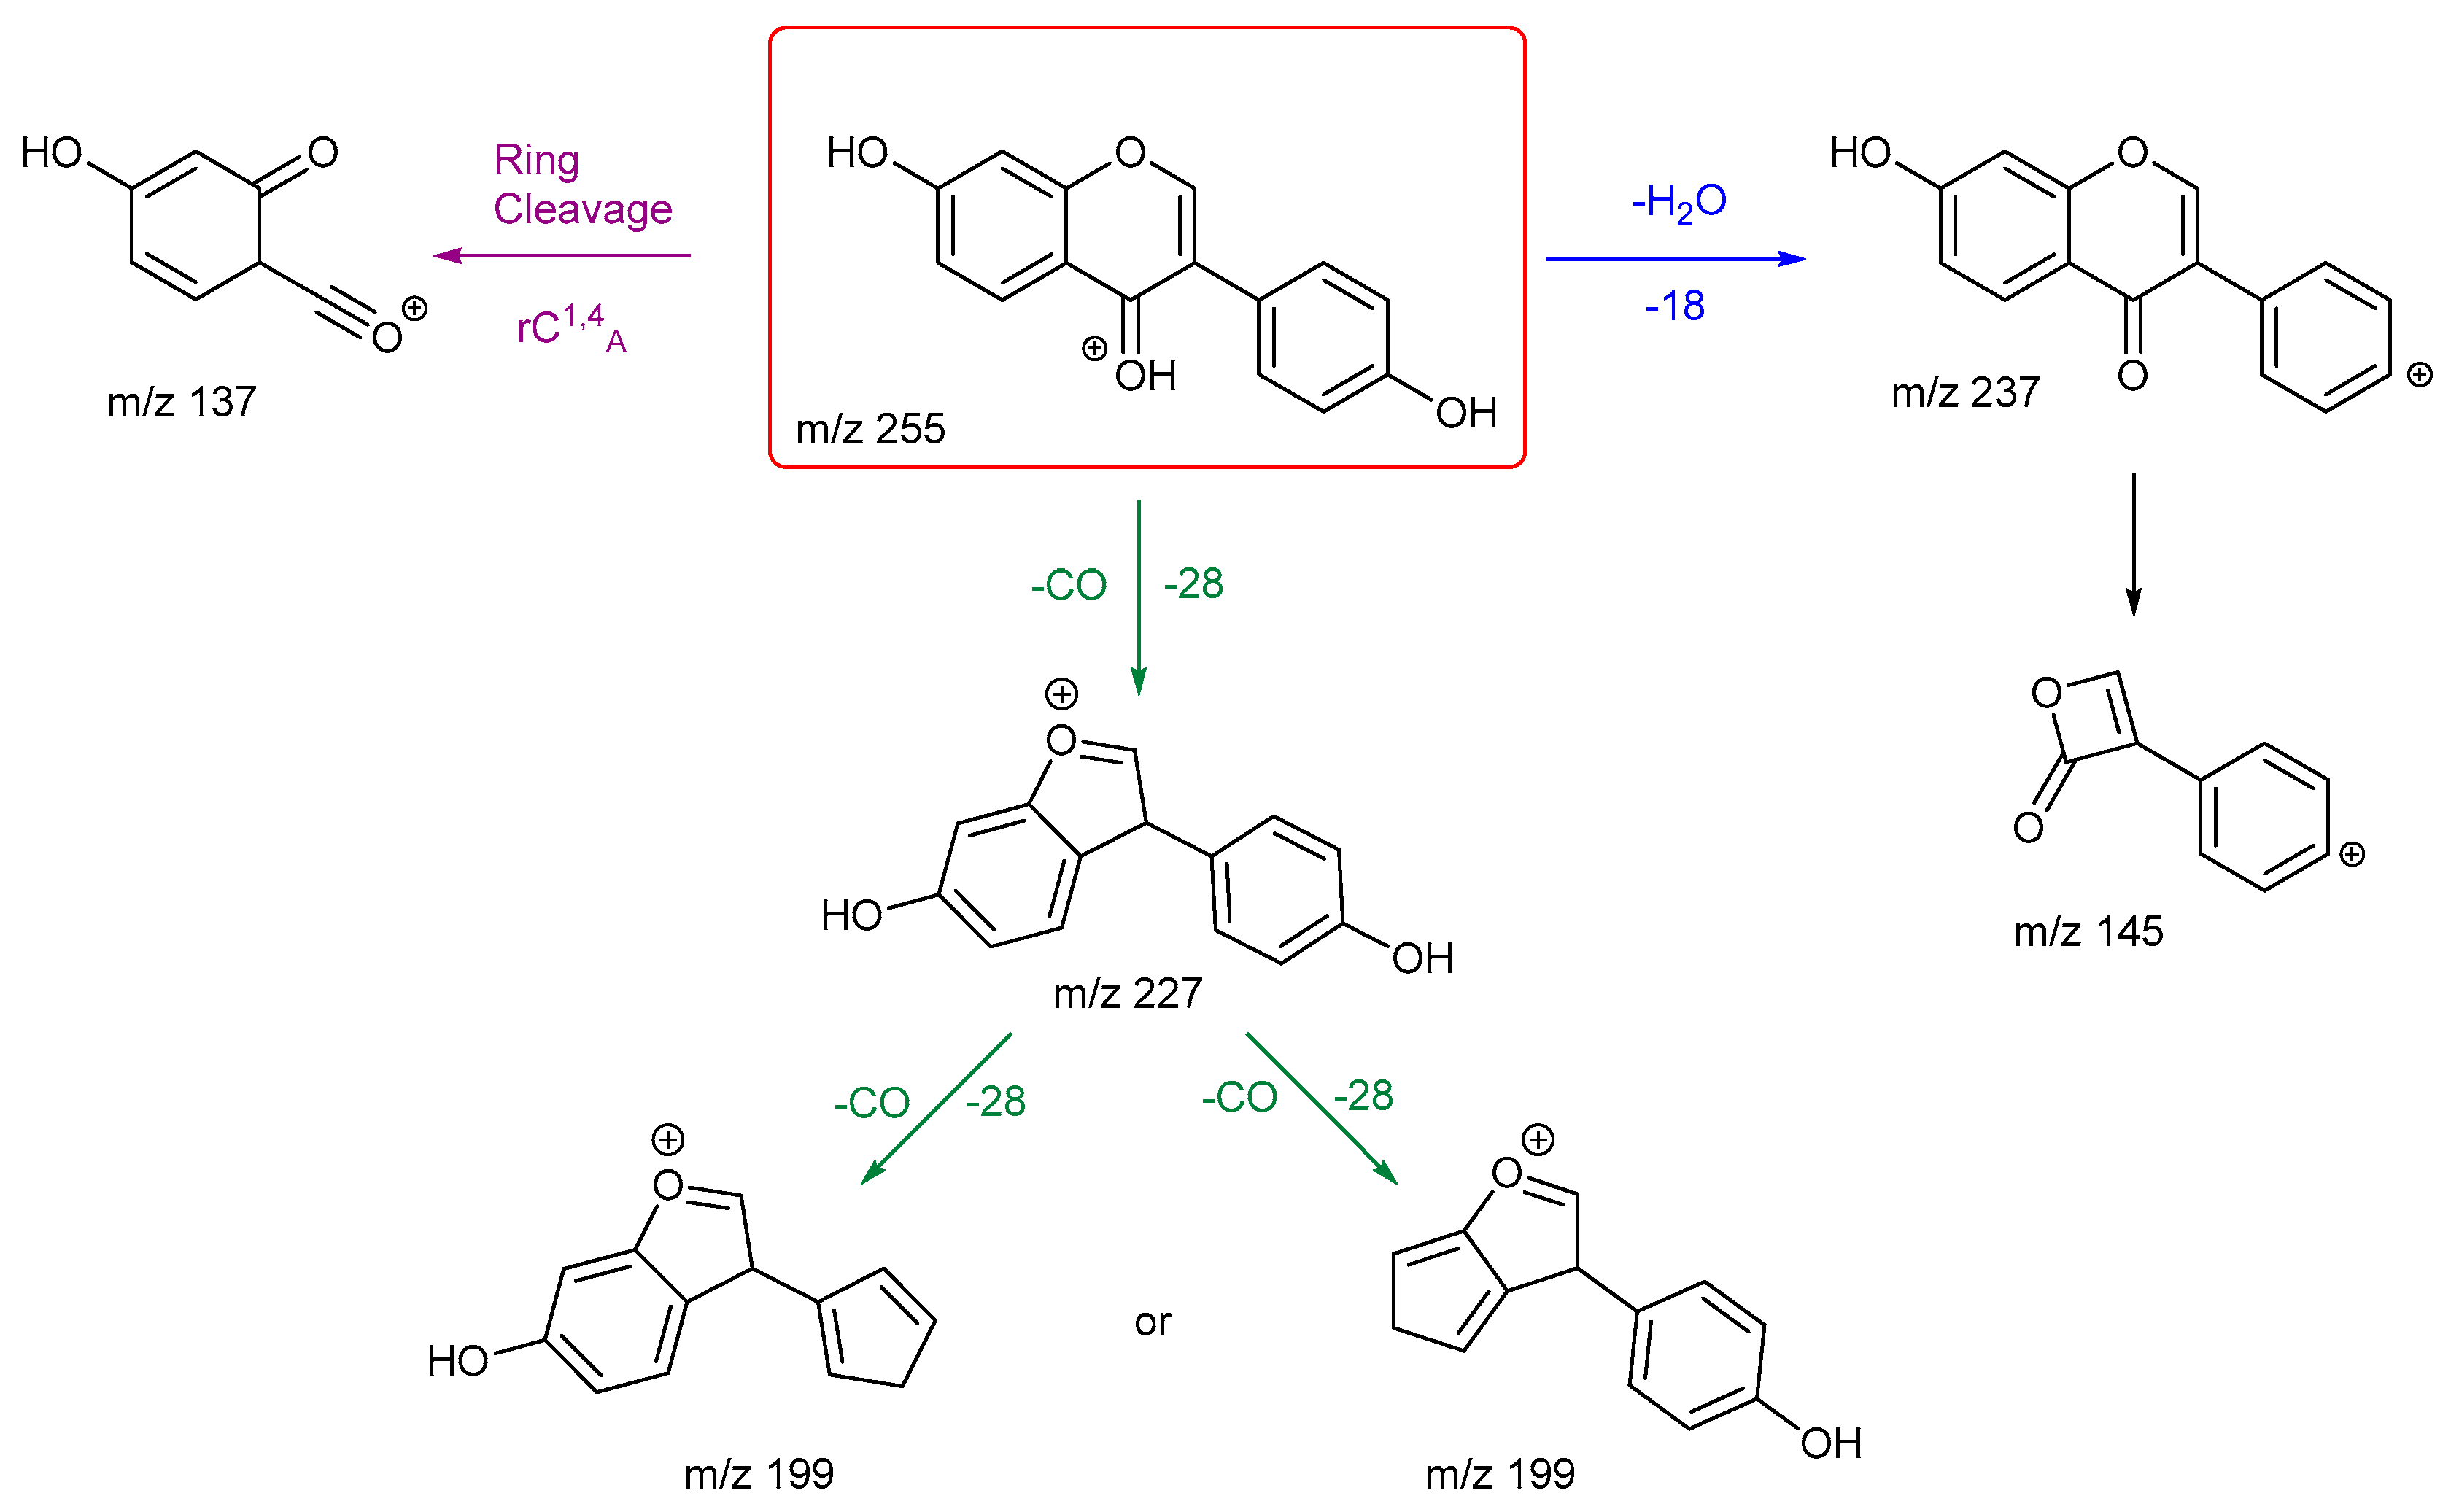
Figure 5.
Negative ion ESI-MS/MS spectra of (a) rhamnetin and (b) isorhamnetin. PI m/z 315 in both cases. Product ions at m/z 300 (loss of CH3·) and m/z 299 (loss of CH4) are highlighted.
Figure 5.
Negative ion ESI-MS/MS spectra of (a) rhamnetin and (b) isorhamnetin. PI m/z 315 in both cases. Product ions at m/z 300 (loss of CH3·) and m/z 299 (loss of CH4) are highlighted.
Scheme 7.
Proposed fragmentation pathway for rhamnetin in negative ion mode. The red route shows loss of CH4 and the green loss of CH3. The formulae of all product ions are confirmed by accurate mass (average of 2.6 ppm) (Table A10 in Appendix B).
Scheme 7.
Proposed fragmentation pathway for rhamnetin in negative ion mode. The red route shows loss of CH4 and the green loss of CH3. The formulae of all product ions are confirmed by accurate mass (average of 2.6 ppm) (Table A10 in Appendix B).
Scheme 8.
Proposed fragmentation pathway for isorhamnetin in negative ion mode. The red route shows loss of CH4 and the green loss of CH3. The formulae of all product ions are confirmed by accurate mass (average of 3.2 ppm) (Table A11 in Appendix B).
Scheme 8.
Proposed fragmentation pathway for isorhamnetin in negative ion mode. The red route shows loss of CH4 and the green loss of CH3. The formulae of all product ions are confirmed by accurate mass (average of 3.2 ppm) (Table A11 in Appendix B).
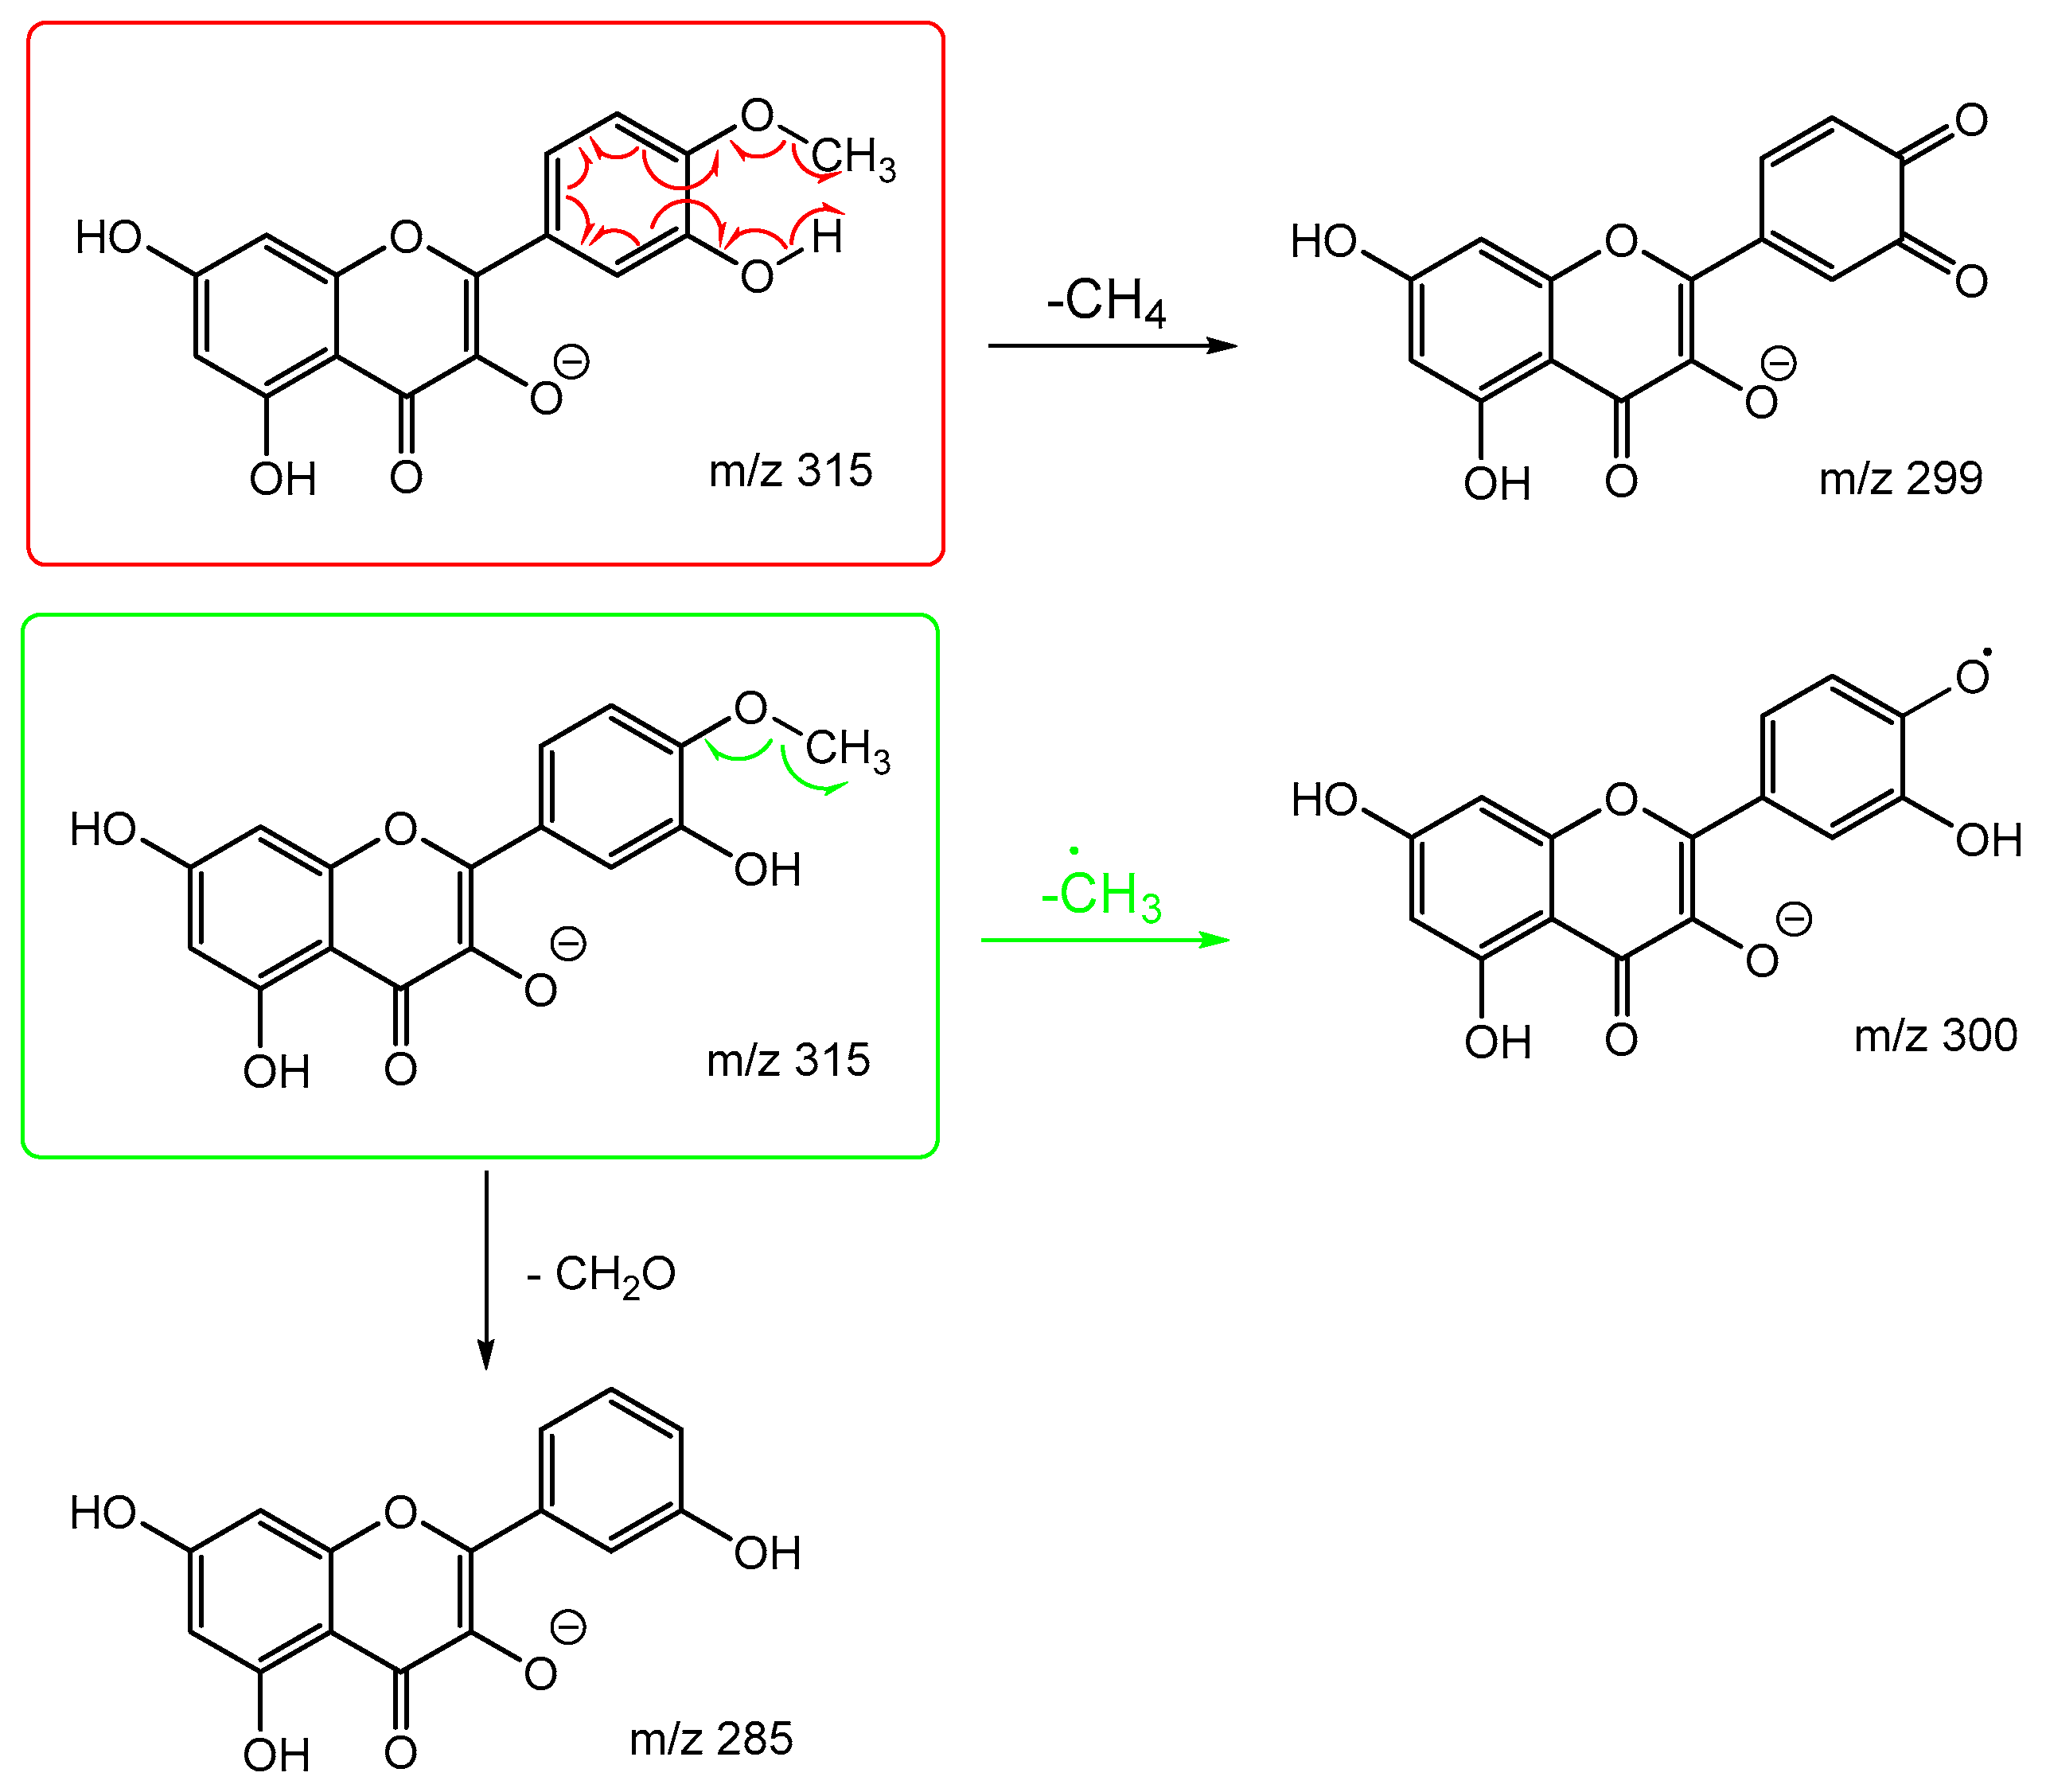
Table 1.
Identification of some of the most common neutral losses observed for positive ion ESI-MS/MS analysis of the 30 flavonoids studied.
Table 1.
Identification of some of the most common neutral losses observed for positive ion ESI-MS/MS analysis of the 30 flavonoids studied.
| Common Loss | Mass | Common Loss | Mass | Common Loss | Mass | Common Loss | Mass |
| CH3. | 15 | CH4O | 32 | CO2 | 44 | CH4O + CO | 60 |
| H2O | 18 | 2 x H2O | 36 | H2O + CO | 46 | H2O + 2 x CO | 74 |
| CO | 28 | C2H2O | 42 | 2 x CO | 56 | 3 x CO | 84 |
Table 2.
The key diagnostic product ions, with the flavonoids (and their classes) where they were observed. See Appendix for the colour code to designated flavonoid classes.
Table 2.
The key diagnostic product ions, with the flavonoids (and their classes) where they were observed. See Appendix for the colour code to designated flavonoid classes.
| Product Ion | Name | Nomenclature | Class |
| m/z 153 | Quercetin | rC1,4A | Flavonol |
| Morin | |||
| Isorhamnetin | |||
| Kaempferide | |||
| Kaempferol | |||
| Galangin | |||
| Apigenin | Flavone | ||
| Luteolin | |||
| Chrysin | |||
| Aromadedrin | Flavanolol | ||
| Eriodictyol | Flavanone | ||
| Naringenin | |||
| Genistein | isoflavone | ||
| m/z 167 | Rhamnetin | rC1,4A | Flavonol |
| Sakuranetin | Flavanone | ||
| Genkwanin | Flavone | ||
| m/z 151 | Gallocatechin | rC3,10A | Flavanols |
| Epigallocatechin | |||
| Catechin | |||
| Epicatechin |
Table 3.
The production of the diagnostic product ions m/z 153, 167 and 151 exemplified in the MS/MS analyses of quercetin, sakuranetin and epigallocatechin. These product ions provide direct insight into the structure of the protonated PIs of these flavonoids.
Table 3.
The production of the diagnostic product ions m/z 153, 167 and 151 exemplified in the MS/MS analyses of quercetin, sakuranetin and epigallocatechin. These product ions provide direct insight into the structure of the protonated PIs of these flavonoids.
| Quercetin | Sakuranetin | Epigallocatechin |
 |
 |
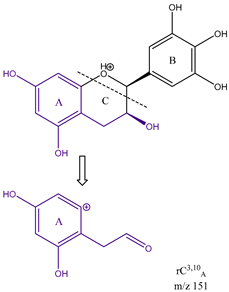 |
Table 4.
Identification of some of the most common neutral losses observed for negative ion mode ESI-MS/MS analysis of the 30 flavonoids studied.
Table 4.
Identification of some of the most common neutral losses observed for negative ion mode ESI-MS/MS analysis of the 30 flavonoids studied.
| Common Loss | Mass | Common Loss | Mass | Common Loss | Mass |
| CH3. | 15 | C2H2O | 42 | CO2 + H2O | 62 |
| CH4 | 16 | C2O | 44 | H2O + 2CO | 74 |
| H2O | 18 | H2O + CO | 46 | 3 x CO | 84 |
| CO | 28 | 2 x CO | 56 |
Disclaimer/Publisher’s Note: The statements, opinions and data contained in all publications are solely those of the individual author(s) and contributor(s) and not of MDPI and/or the editor(s). MDPI and/or the editor(s) disclaim responsibility for any injury to people or property resulting from any ideas, methods, instructions or products referred to in the content. |
© 2024 by the authors. Licensee MDPI, Basel, Switzerland. This article is an open access article distributed under the terms and conditions of the Creative Commons Attribution (CC BY) license (http://creativecommons.org/licenses/by/4.0/).
Copyright: This open access article is published under a Creative Commons CC BY 4.0 license, which permit the free download, distribution, and reuse, provided that the author and preprint are cited in any reuse.


