Submitted:
17 October 2024
Posted:
17 October 2024
You are already at the latest version
Abstract
The requirements for accurate models of renewable energy power plant are urgent for power system operation analysis. Most existing model research in this area is for wind turbine and photovoltaic (PV) power generation unit, a rare renewable power plant model validation mainly adopts the single-machine infinite-bus system. The single equivalent machine method is always used, and the interactions between the power plant and the grid are ignored. The voltage at the interface bus is treated as constant, although this is not consistent with its actual characteristics. The phase shifter method of hybrid dynamic simulation has been applied in the model validation of wind farm. However, this method is heavily dependent on phasor measurement units (PMU) data, resulting in limited application scope, and it is difficult to realize the model error location step by step. In this paper, the fast-responding generator method is used for renewable power plant model validation. The complete scheme comprising model validation, error localization, parameter sensitivity analysis, and parameter correction is proposed. Model validation is conducted based on measured records from a large-scale PV power plant in northwest China. The comparison of simulated and measured data verifies the feasibility and accuracy of the proposed scheme.
Keywords:
hybrid dynamic simulation
; fast-responding generator
; renewable power plant
; model validation
; parameter calibration
1. Introduction
In recent years, renewable energy sources such as wind power and photovoltaic (PV) power have developed rapidly worldwide. Renewable energy generation has strong volatility and intermittency, and its large-scale integration has an increasingly significant impact on the power grid [1]. Accurate model parameters for renewable energy power plants are urgently needed for system operation analysis [2,3].
GE [4,5], IEC [6], EPRI [7], WECC [8,9] have carried out renewable energy modeling work and developed modeling and validation standards. However, the operating conditions of renewable energy are variable, and the single unit capacity is small, with multiple equipment types. For example, one wind farm may contain over 200 single units, another PV power plant includes inverters from 10 different manufacturers with different control strategies [10]. There is still significant room for improvement in the modeling and parameter validation of renewable power plants [11,12].
In terms of parameter validation of renewable energy generation system models, most existing research has focused on wind turbines [2,4,6,9] and PV power generation units [13,14,15], with relatively little research on power plants. Moreover, the validation of power plant model parameters is mostly based on single machine infinite bus systems [16,17,18,19,20], which multiply the component capacity and do not conform to the actual characteristics of power system. Reference [21] conducted parameter validation of actual PV power plant models according to Chinese national standard [22]. However, its validation method is difficult to avoid equivalent errors in external systems, and there are problems such as numerous model components, difficult analysis of mutual influences, and difficulty in locating error sources.
The hybrid dynamic simulation method, which injects the PMU measurement signal into the simulation platform, is an effective solution for the above issues. These methods include direct data injection [23], phase-shifting transformer [24], fast-responding generator [25], variable impedance [26], and controlled voltage source method [27]. At present, this method is mainly used for model validation of synchronous generators [23,24,25,26,27,28,29] and pumped storage power stations [30], the research on parameter validation of renewable energy power plant models started relatively late [31,32,33]. Although significant progress has been made, there are still the following problems: (1) existing research adopts the phase-shifting transformer method, which obtains voltage amplitude and voltage phase angle data by installing PMUs specifically in selected actual wind farms. However, in reality, renewable power plants are generally connected to the grid through lower voltage levels (such as 35kV or 10kV), and PMUs are rarely equipped, making it difficult to obtain voltage phase angle data. Meanwhile, renewable energy power stations are generally equipped with dynamic reactive power compensation devices on the 35kV/10kV side, and the lack of PMUs makes it difficult to locate model parameter errors that originate from the renewable energy itself or the reactive power compensation devices. (2) The advantages and disadvantages of various hybrid dynamic simulation methods have not been comprehensively compared, and it has not been pointed out which method is more suitable for model validation of large renewable energy power plants. (3) There have been no literature reports on the complete model validation process and parameter correction effect of actual large-scale PV power plants.
On the basis of reference [34], this paper first analyzes and points out that the fast-responding generator method is suitable for parameter validation of renewable power plant models, and then proposes its specific implementation plan; On this basis, a complete solution for model validation was proposed based on a large-scale PV power plant in northwest China, and the feasibility of the proposed solution was verified by comparing simulation and measured data.
2. Basic Principles of Hybrid Dynamic Simulation
The dynamic characteristics of the power system can be described by a set of differential-algebraic equations, as shown in Equation (1):
where x=(x1, x2, …, xN) is a state variable, y=(y1, y2, …, yM) is an algebraic variable, θ is a system parameter. f contains N equations, g contains M equations.
If the values of the boundary condition algebraic variables are known in advance (i.e. measured values, denoted as yi=y*(t)), Equation (1) can be rewritten as:
where y’=(y1, y2, …, yi-1, yi+1,…, yM), g’ is a new algebraic equation, It has one less algebraic variable yi than g, therefore, g’ contains M-1 equations and M-1 algebraic variables,then it can be solved. For the time t of change, yi=y*(t) substitute the value at time t into Equation (2) to represent the change in boundary conditions, and achieve the interface between measured data and power system simulation program. For cases where the state variables are known, the approach is similar.
For the four main variables in the power system (voltage amplitude, voltage phase angle/frequency, active power, and reactive power), if any two of them are known, the remaining two can be obtained through calculation. For example, using voltage amplitude and voltage phase angle as input signals for the research system, active and reactive power can be calculated through simulation. Then, the simulated active and reactive power can be compared with the measured values to verify the correctness of the model.
3. Comparison of Existing Hybrid Dynamic Simulation Methods
The hybrid dynamic simulation requires injecting the measured data into the power system simulation software. The most ideal scenario is to directly inject the measured data into simulation software, which can ensure complete accuracy of equivalent values to external systems. However, this requires direct operation of the underlying source code of the simulation software. At present, most mainstream power system simulation softwares have certain user-defined functions, but the source code is generally not publicly available, making it difficult to directly inject measured data. It is necessary to use certain carriers (components of power system) to inject measured data into the simulation platform and participate in simulation calculations.
In addition, the four hybrid dynamic simulation methods include: phase-shifting transformer method, fast-responding generator method, variable impedance method (similar to variable admittance method [35]), and ideal controlled voltage source method.
Among them, the phase-shifting transformer method is to connect an external system equivalent to an ideal transformer in series with a generator with a very large inertia. By changing the transformation ratio and phase angle of the ideal transformer, the voltage and phase angle at the boundary points are ensured to be consistent with the measured values. The fast-responding generator method equates the external system to a generator equipped with a fast excitation system and a fast speed regulation system, using their fast adjustments to maintain consistency. The variable impedance method uses a series power supply with varying impedance to achieve accurate equivalence of external systems. The ideal controlled voltage source method equates the external system to a controlled voltage source, and ensures consistency with the measured value by controlling the voltage’s amplitude and phase angle of the voltage source.
From the requirements of actual measurement data, both phase-shifting transformer method and ideal controlled voltage source method require voltage phase angle, which must be provided by PMU. The fast-responding generator method requires voltage amplitude and frequency amplitude, while the variable impedance method requires voltage amplitude and power, which can be provided by general measuring equipment (without PMU).
In summary, considering the accuracy of equivalent external systems, the requirements for on-site measured data, and the difficulty of implementation on mainstream simulation software platforms, the advantages and disadvantages of the five hybrid dynamic simulation methods are compared in Table 1.
According to Table 1, the fast-responding generator method is more suitable for validating model of the renewable power plant. However, it should be pointed out that the consistency of data timescales is the foundation of hybrid dynamic simulation methods. When using the fast-responding generator method, it is also necessary to perform basic checks on the simultaneity of measured data of different electrical quantities, otherwise it is difficult to ensure the application effect.
4. Implementation Scheme of the Fast-Responding Generator Method
Considering the ability of custom modeling and the convenience of data file reading operations, this paper selects DIgSILENT/PowerFactory software to implement the fast-responding generator method.
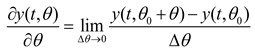
Firstly, models of the excitation system and speed regulation system of the synchronous generator are established through the DSL (DIgSILENT simulation language) function of the DIgSILENT/PowerFactory software. The excitation and speed regulation systems can use common models (as shown in Figure 1), and by setting appropriate time constants and control parameters, the synchronous generator has fast adjustment characteristics and can quickly track changes of measured data.
Then, the measured voltage amplitude Vmea and frequency amplitude fmea are read into the established excitation and speed regulation system models through text files (*. txt) as reference values for their controllers, as shown in equation (3). This enables the implementation of a hybrid dynamic simulation method based on a fast-responding generator.
5. Validation of Actual PV Power Plant Model based on Fast-Responding Generator Method
5.1. Overview of the Actual PV Power Plant
The research object is a 300MW large-scale PV power plant (YRHG) in northwest China, as shown in Figure 2.
The YRHG PV power plant consists of two parts, Part I with a capacity of 200MW and Part II with a capacity of 100MW, including a total of 600 PV inverters provided by 11 different manufacturers. The power plant is connected to the transmission grid through 35kV/110kV/330kV boosting, as shown in Figure 3. In addition, two Static Var Compensators (SVC) with capacities of -40Mvar~40Mvar and -20Mvar~20Mvar are installed at the low voltage side (35kV) of the power plant.
In June 2013, a single-phase (A-phase) short circuit occurred on the 750kV QD-YK line. The short-circuit point is located 2 kilometers away from the QD converter station on the line. Due to the proximity of the YRHG PV power plant studied to the short-circuit point and the fact that some PV inverters do not have low voltage ride through (LVRT) capability, a total of 41 inverters were disconnected from the grid in both parts of the YRHG PV power plant during this short-circuit event.
5.2. Model Establishment and Injection of Measured Data
The modeling of YRHG PV power plant was carried out on the DIgSILENT/PowerFactory platform, as shown in Figure 4. When using the fast-responding generator method, the system above the high voltage side (330kV) is equivalent to a fast-responding generator, with the upper transformer of the YRHG PV power plant as the boundary. Initialize based on the active power, reactive power, and voltage values injected from the measured data, and obtain an initial state consistent with the measured values by adjusting the power flow calculation results.
Process the instantaneous values of the measured three-phase voltage, calculate the effective voltage value, and use the symmetrical component method to extract its fundamental positive sequence quantity. On the basis of extracting the fundamental positive sequence component, commonly used filtering algorithms can be used to preprocess the measured positive sequence component with different window lengths. The smoothing effect increases with the increase of window length, but during faults, a large window length is not conducive to reflecting voltage drops. In addition, if non-linear filtering algorithms are used, the effect can be further improved, especially during transient processes. Using non-linear filtering algorithms results in smaller voltage drop errors than using linear filtering algorithms. Figure 5 shows the results of extracting positive, negative, and zero sequences from the measured voltage values. It can be seen that the positive sequence component (UL1) is the main component, the negative sequence component (UL2) is relatively small, and the zero sequence component (UL0) is the smallest.
If the period of the measured data is not consistent with the simulation step size, synchronization processing between the measured data and the simulation data needs to be carried out, that is, interpolation or sampling. The synchronization process is shown in Figure 6. Inject the calculated measured voltage fundamental positive sequence and measured frequency signals into the excitation system and speed regulation system models of the fast-responding generator, respectively. The voltage and frequency data are presented in separate text files, and each simulation step receives one measured data to achieve fast tracking of the simulated output on the measured data. The measured voltage and frequency signals injected into the simulation model are shown in Figure 7.
5.3. Hybrid Dynamic Simulation Effect
As shown in Figure 8, the voltage tracking is very ideal, and the frequency tracking has small phase and amplitude deviations, indicating that the injection of the measured values of the boundary bus is good overall.
Under the voltage and frequency injection conditions shown in Figure 8, the comparison between the simulated output active power and reactive power and the measured values is shown in Figure 9. From the figure, it can be seen that the simulation values of reactive power have a small deviation from the measured values, but the deviation between the simulation values of active power and the measured values is large. The slow recovery process of the measured values was not simulated, indicating that the simulation model parameters of the active control part of the YRHG PV power plant are inaccurate.
5.4. Error Localization
Since the error mainly comes from active power, for SVC does not output active power, it can be determined that the error is caused by the active control link of the PV power generation system itself. The next step is to locate which parameters the error comes from.
Based on Equation (1), the sensitivity of parameters to the output trajectory can be solved using parameter perturbation [36], and solved in incremental difference form as follows:
 where y is the unit value of active power or reactive power output; θ is the system parameter; is the parameter variation; t is time.
Select the mean square error (MSE) of active power and reactive power as the model validation feature indicator, and calculate the MSE by changing different control parameter values by a certain percentage (such as 5%). The MSE of active power and reactive power is calculated as follows:
where and are the new values of active power and reactive power, and are their original values, is the number of sampling points.
The active power control model of PV power generation system is shown in Figure 10, details of the model can be seen in [8]. In order to improve the efficiency of electromechanical transient simulation, the active power control process has been simplified, mainly involving the calculation of active current command values (main parameter is Tpord), as well as the limits of active current reference value and active current reference value’s change rate (main parameters are rrpwr and Tg) during low voltage periods in PV power generation systems.
Calculate the MSE that affects the main parameters of the active control system of the PV power generation system separately, and select rrpwr, Tg, Tpord for the active control system. The MSE calculation results are shown in Table 2. It can be seen that the parameters rrpwr and Tg have a significant impact on the active power control system.
5.5. Parameter Calibration and Its Effects
For the deviation between the simulated values of active power and the measured values, based on the sensitivity analysis results of the output trajectory of the parameters, the rrpwr and Tg of the PV active control system need to be carefully considered. In this section, batch simulation is adopted to sequentially traverse the range of parameter values (when traversing a certain parameter, other parameters remain unchanged) to obtain the corrected parameters.
The calibration results are shown in Table 3.
After using the calibrated parameter as shown in Table 3, the simulation results of the PV power plant model are shown in Figure 11. The figure further compares the differences between the research results using the fast-responding generator method and the conventional model validation method. It can be seen that the conventional model validation method, even if manually adjusted multiple times to make the voltage drop change very close to the actual voltage measurement value, and even if a detailed model of the PV power plant is established, is difficult to reflect the measured value changes of frequency, and there are still significant errors in the fitting of active power. If the single machine multiplication method is used to simulate the PV power plant and the infinite power source is used to simulate the equivalent power grid, it will inevitably bring more significant errors.
6. Conclusions
This paper conducts research on the validation of renewable energy power plant models using a hybrid dynamic simulation method. The task of model validation is highly important and challenging, particularly for power systems that incorporate large-scale renewable energy sources. The success of model validation hinges on both the availability of comprehensive measured data and the ongoing innovation in validation techniques. The paper proposes a dual-approach for model validation in complex power systems, combining both “inside-out” and “outside-in” modeling validation methods. Specifically, “inside-out” refers to traditional modeling validation methods, while “outside-in” pertains to hybrid dynamic simulation methods. By analyzing and comparing five hybrid dynamic simulation methods, the paper concludes that the fast-responding generator method is best suited for validating large-scale renewable energy models. The paper further outlines a concrete implementation of the fast-responding generator method, encompassing model validation, error localization, parameter sensitivity analysis, and parameter correction. The feasibility and accuracy of this proposed scheme are validated through its application in the model validation of an actual PV power plant in northwest China, with comparisons between simulated and measured data.
The primary emphasis of this paper lies in the validation of the electromechanical transient model (positive sequence) of renewable power plants. Given that the control of renewable energy generation units may span multiple frequency bands [37], and their model functionalities are becoming increasingly diverse, the complexity of renewable power plant models is escalating. However, on-site measured data remains relatively scant. Consequently, the paper suggests that the next research direction should focus on a hybrid mechanism- and data-driven modeling and model verification method for renewable power plants [38,39].
Author Contributions
Conceptualization, D.Z. and J. M.; methodology, D.Z. and J. M.; validation, Y.N., C.Z., M.Q., and Y. L.; formal analysis, D.Z., Y.N. and C.Z.; investigation, J.M.; resources, D.Z., M.Q. and Y. L.; data curation, D.Z., M.Q. and Y. L. All authors have read and agreed to the published version of the manuscript.
Funding
This work was supported in part by the Science & Technology Program of SGCC “Key technologies of active frequency support for mid and long distance offshore wind farm with multiple grid-forming converter connected via VSC-HVDC”. (5108-202218280A-2-241-XG), in part by National Natural Science Foundation of China (51607160), and in part by Natural Science Foundation of Jiangsu Province (BK20160146).
Data Availability Statement
The data presented in this study are available on request from the corresponding author due to (specify the reason for the restriction).
Acknowledgments
We would like to express our gratitude to all the reviewers for providing valuable advice.
Conflicts of Interest
The authors declare no conflicts of interest.
References
- CAI, X.; Zhang, N.; Du, E.; An, Z.; W, N.; Kang, C. Low inertia power system planning considering frequency quality under high penetration of renewable energy. IEEE Trans. Power Syst. 2024, 39, 4537-4548. [CrossRef]
- Asmine, M.; Brochu, J.; Fortmann, J.; Gagnon, R.; Kazachkov, Y.; Langlois, C.; Larose, C.; Muljadi, E.; MacDowell, J.; Pourbeik, P.; Seman, S.; Wiens, K. Model validation for wind turbine generator models. IEEE Trans. Power Syst. 2011, 26, 1769-1782. [CrossRef]
- Yamashita, K.; Renner, H.; Villanueva, S.; Lammert, G.; Aristidou, P.; Martins, J.; Zhu, L.; Ospina, L.; Cutsem, T. Industrial recommendation of modeling of inverter-based generators for power system dynamic studies with focus on photovoltaic. IEEE Power and Energy Tech. Syst. Journal 2018, 5, 1-10. [CrossRef]
- Clark, K.; Miller, N.; Sanchez-Gasca, J. Modeling of GE wind turbine-generators for grid studies. General Electric International, Inc. 2010.
- Clark, K.; Miller, N.; Walling, R. Modeling of GE solar photovoltaic plants for grid studies. General Electric International, Inc. 2010.
- IEC Standard 61400-27-1. Wind Turbines - Part 27-1: Electrical simulation models— wind turbines. 2015.
- Pourbeik, P. Specification of the second generation generic models for wind turbine generators. USA: Electric Power Research Institute 2014.
- WECC Renewable Energy Modeling Task Force. WECC PV power plant dynamic modeling guide. 2014.
- Pourbeik, P.; Sanchez-Gasca, J.; Senthil, J.; Weber, J.; Zadkhast, P.; Ramasubramanian, D.; Rao, S.; Bloemink, J.; Majumder, R.; Zhu, S.; Tucker, D.; Wang, S. A generic model for inertia-based fast frequency response of wind turbines and other positive-sequence dynamic models for renewable energy systems. IEEE Trans. Energy Conver. 2024, 39, 425-434. [CrossRef]
- Zhang, Z.; Liao, S.; Sun, Y.; Xu, J.; Ke, D.; Wang, B.; Chen, R. Unified dynamic equivalent model for distributed photovoltaic generation systems with different fault-ride-through strategies. IEEE Trans. Sustain. Energ. 2023, 14, 1876-1883. [CrossRef]
- Pourbeik, P.; Etzel, N.; Wang, S. Model validation of large wind power plants through field testing. IEEE Trans. Power Syst. 2018, 9, 1212-1219. [CrossRef]
- Han, P.; Lin, Z.; Wang, L.; Fan, G.; Zhang, X. A survey on equivalence modeling for large-scale photovoltaic power plants. Energies 2018, 11, 1463. [CrossRef]
- Ma, J.; Zhao, D.; Qian, M.; Zhu, L.; Geng, H. Modelling and validating photovoltaic power inverter model for power system stability analysis. The Journal of Engineering 2017, 13, 1605-1609. [CrossRef]
- Liu, M.; Huang, J.; Zhang, J.; Cao L. Model validation and error analysis of photovoltaic grid-connected inverter based on BDEW standard. Autom. Electr. Power Syst. 2014, 38, 196-201.
- Satoh, H.; Yamashita, K.; Shirasaki, K.; Kitauchi, Y. Root-mean square model of three-phase photovoltaic inverter for unbalanced fault. IEEE Open Access Journal of Power and Energ. 2020, 7, 501-513. [CrossRef]
- Liu, M.; Huang, J.; Zhou, R.; Lin, X.; Li, Y. Research on modelling and verification for PV power plants with AVC system. International Conference on Renewable Power Generation (RPG). 2015, 1-5.
- Soni, S. Solar PV plant model validation for grid integration studies. Arizona: Arizona state university 2014.
- Badrzadeh, B. Acceptance testing and validation of stability type models of wind power plants. IEEE PES General Meeting 2013.
- Chao, P.; Li, W.; Peng, S.; Liang, X.; Zhang, L.; Shuai, Y. Fault ride-through behaviors correction-based single-unit equivalent method for large photovoltaic power plants. IEEE Trans. Sustain. Energy 2021, 12, 715-726. [CrossRef]
- Vargas, F.; Rivera, J.; Mira, S.; Salgado, C.; Leon, J.; Lopez, E. Real-time monitoring of solar photovoltaic power plants: A concentrated validation study. IEEE Colombian Conference on Applications of Computational Intelligence (ColCACI) 2024, 1-6.
- Qu, L.; Ge, L.; Zhu, L.; Niu, S.; Zhang, S.; Bao, S. Transient modeling and test validation of PV power plant. Autom. Electr. Power Syst. 2018, 42, 170-175.
- GB/T 32892-2016. Model and parameter test regulation for photovoltaic power system. Beijing: Standards Press of China 2017.
- Wu, S.; Wu, W.; Zhang, B.; Zhang, Y. A hybrid dynamic simulation validation strategy by setting V-Ɵ buses with PMU data,” Autom. Electr. Power Syst. 2010, 34, 12-16.
- Huang, Z.; Guttromson, R.; Hauer, J. Large-scale hybrid dynamic simulation employing field measurements. IEEE PES General Meeting 2004, 1-7.
- Kosterev, D. Hydro turbine-governor model validation in Pacific Northwest. IEEE Trans. Power Syst. 2004, 19, 1144-1149. [CrossRef]
- Ma, J.; Han, D.; Sheng, W.; He, R.; Yue, C.; Zhang, J. Wide area measurements-based model validation and its application. IET Gener., Transm., Distrib. 2008, 2, 906-916. [CrossRef]
- Chen, G.; He, J.; Wu, X.; Liu, Y.; Shi, B. Validity evaluation of a generator set model based on hybrid dynamic simulation,” Autom. Electr. Power Syst. 2011, 35, 34-38.
- Huang, Z.; Du, P.; Kosterev, D.; Yang, S. Generator dynamic model validation and parameter calibration using phasor measurements at the point of connection. IEEE Trans. Power Syst. 2013, 38, 1939-1949. [CrossRef]
- Hajnoroozi, A.; Aminifar, F.; Ayoubzadeh, H. Generating unit model validation and calibration through synchrophasor measurements. IEEE Trans. Smart Grid. 2015, 6, 441-449. [CrossRef]
- Tsai, C.; Chang-Chien, L.; Chen, I.; Lin, C.; Lee, W.; Wu, C.; Lan, H. Practical considerations to calibrate generator model parameters using phasor measurements. IEEE Trans. Smart Grid. 2017, 8, 2228-2238. [CrossRef]
- Zhang, Y.; Muljadi, E.; Kosterev, D.; Singh, M. Wind power plant model validation using synchrophasor measurements at the point of interconnection. IEEE Trans. Sustain. Energ. 2015, 6, 984-992. [CrossRef]
- Cheng, X.; Lee, W.; Sahni, M.; Cheng, Y.; Lee, L. Dynamic equivalent model development to improve the operation efficiency of wind farm. IEEE Trans. Ind. Appl. 2016, 52, 2759-2767. [CrossRef]
- Göksu, Ö.; Altin, M.; Fortmann, J.; Sørensen, P. Field validation of IEC 61400-27-1 wind generation type 3 model with plant power factor controller. IEEE Trans. Energy Conver. 2016, 31, 1170-1178. [CrossRef]
- Zhao, D.; Li, C.; Ma, J.; Qian, M.; Liu, Y.; Zhang, L.; Zhu, L. Hybrid data simulation based model validation method for solar PV plant. International Conference on Renewable Power Generation (RPG) 2015, 1-6.
- Yang, J.; Ma, J.; Tao, H. An error emendation strategy for low frequency oscillation based on power system hybrid simulation. Autom. Electr. Power Syst. 2010, 34, 20-23.
- Guddanti, B.; Orrego, J.; Roychowdhury, R.; Illindala, M. Sensitivity analysis based identification of key parameters in the dynamic model of a utility-scale solar PV plant. IEEE Trans. Power Syst. 2022, 37, 1340-1350. [CrossRef]
- Nouri, B.; Kocewiak, Ł.; Shah, S.; Koralewicz, P.; Gevorgian, V.; Sørensen, P. Generic multi-frequency modelling of converter-connected renewable energy generators considering frequency and sequence couplings. IEEE Trans. Energy Conver. 2022, 37, 547-559. [CrossRef]
- Qin, S.; Wang, P.; Li, S.; Zhao, H.; Wang, J.; Luo, J. Stability region assessment with mechanism-data driven equivalent impedance for wind power plant. IEEE Trans. Power Electron. 2024, 39, 9355-9366. [CrossRef]
- Wei, J.; Yang, W.; Li, X.; Wang, J. Data-driven modeling for photovoltaic power output of small-scale distributed plants at the 1-s time scale. IEEE Access 2024, 12, 117560-117571. [CrossRef]
Figure 1.
Implementation of fast-responding generator method: (a) Measured voltage is injected as reference of excitation system; (b) Measured frequency is injected as reference of speed governor.
Figure 1.
Implementation of fast-responding generator method: (a) Measured voltage is injected as reference of excitation system; (b) Measured frequency is injected as reference of speed governor.
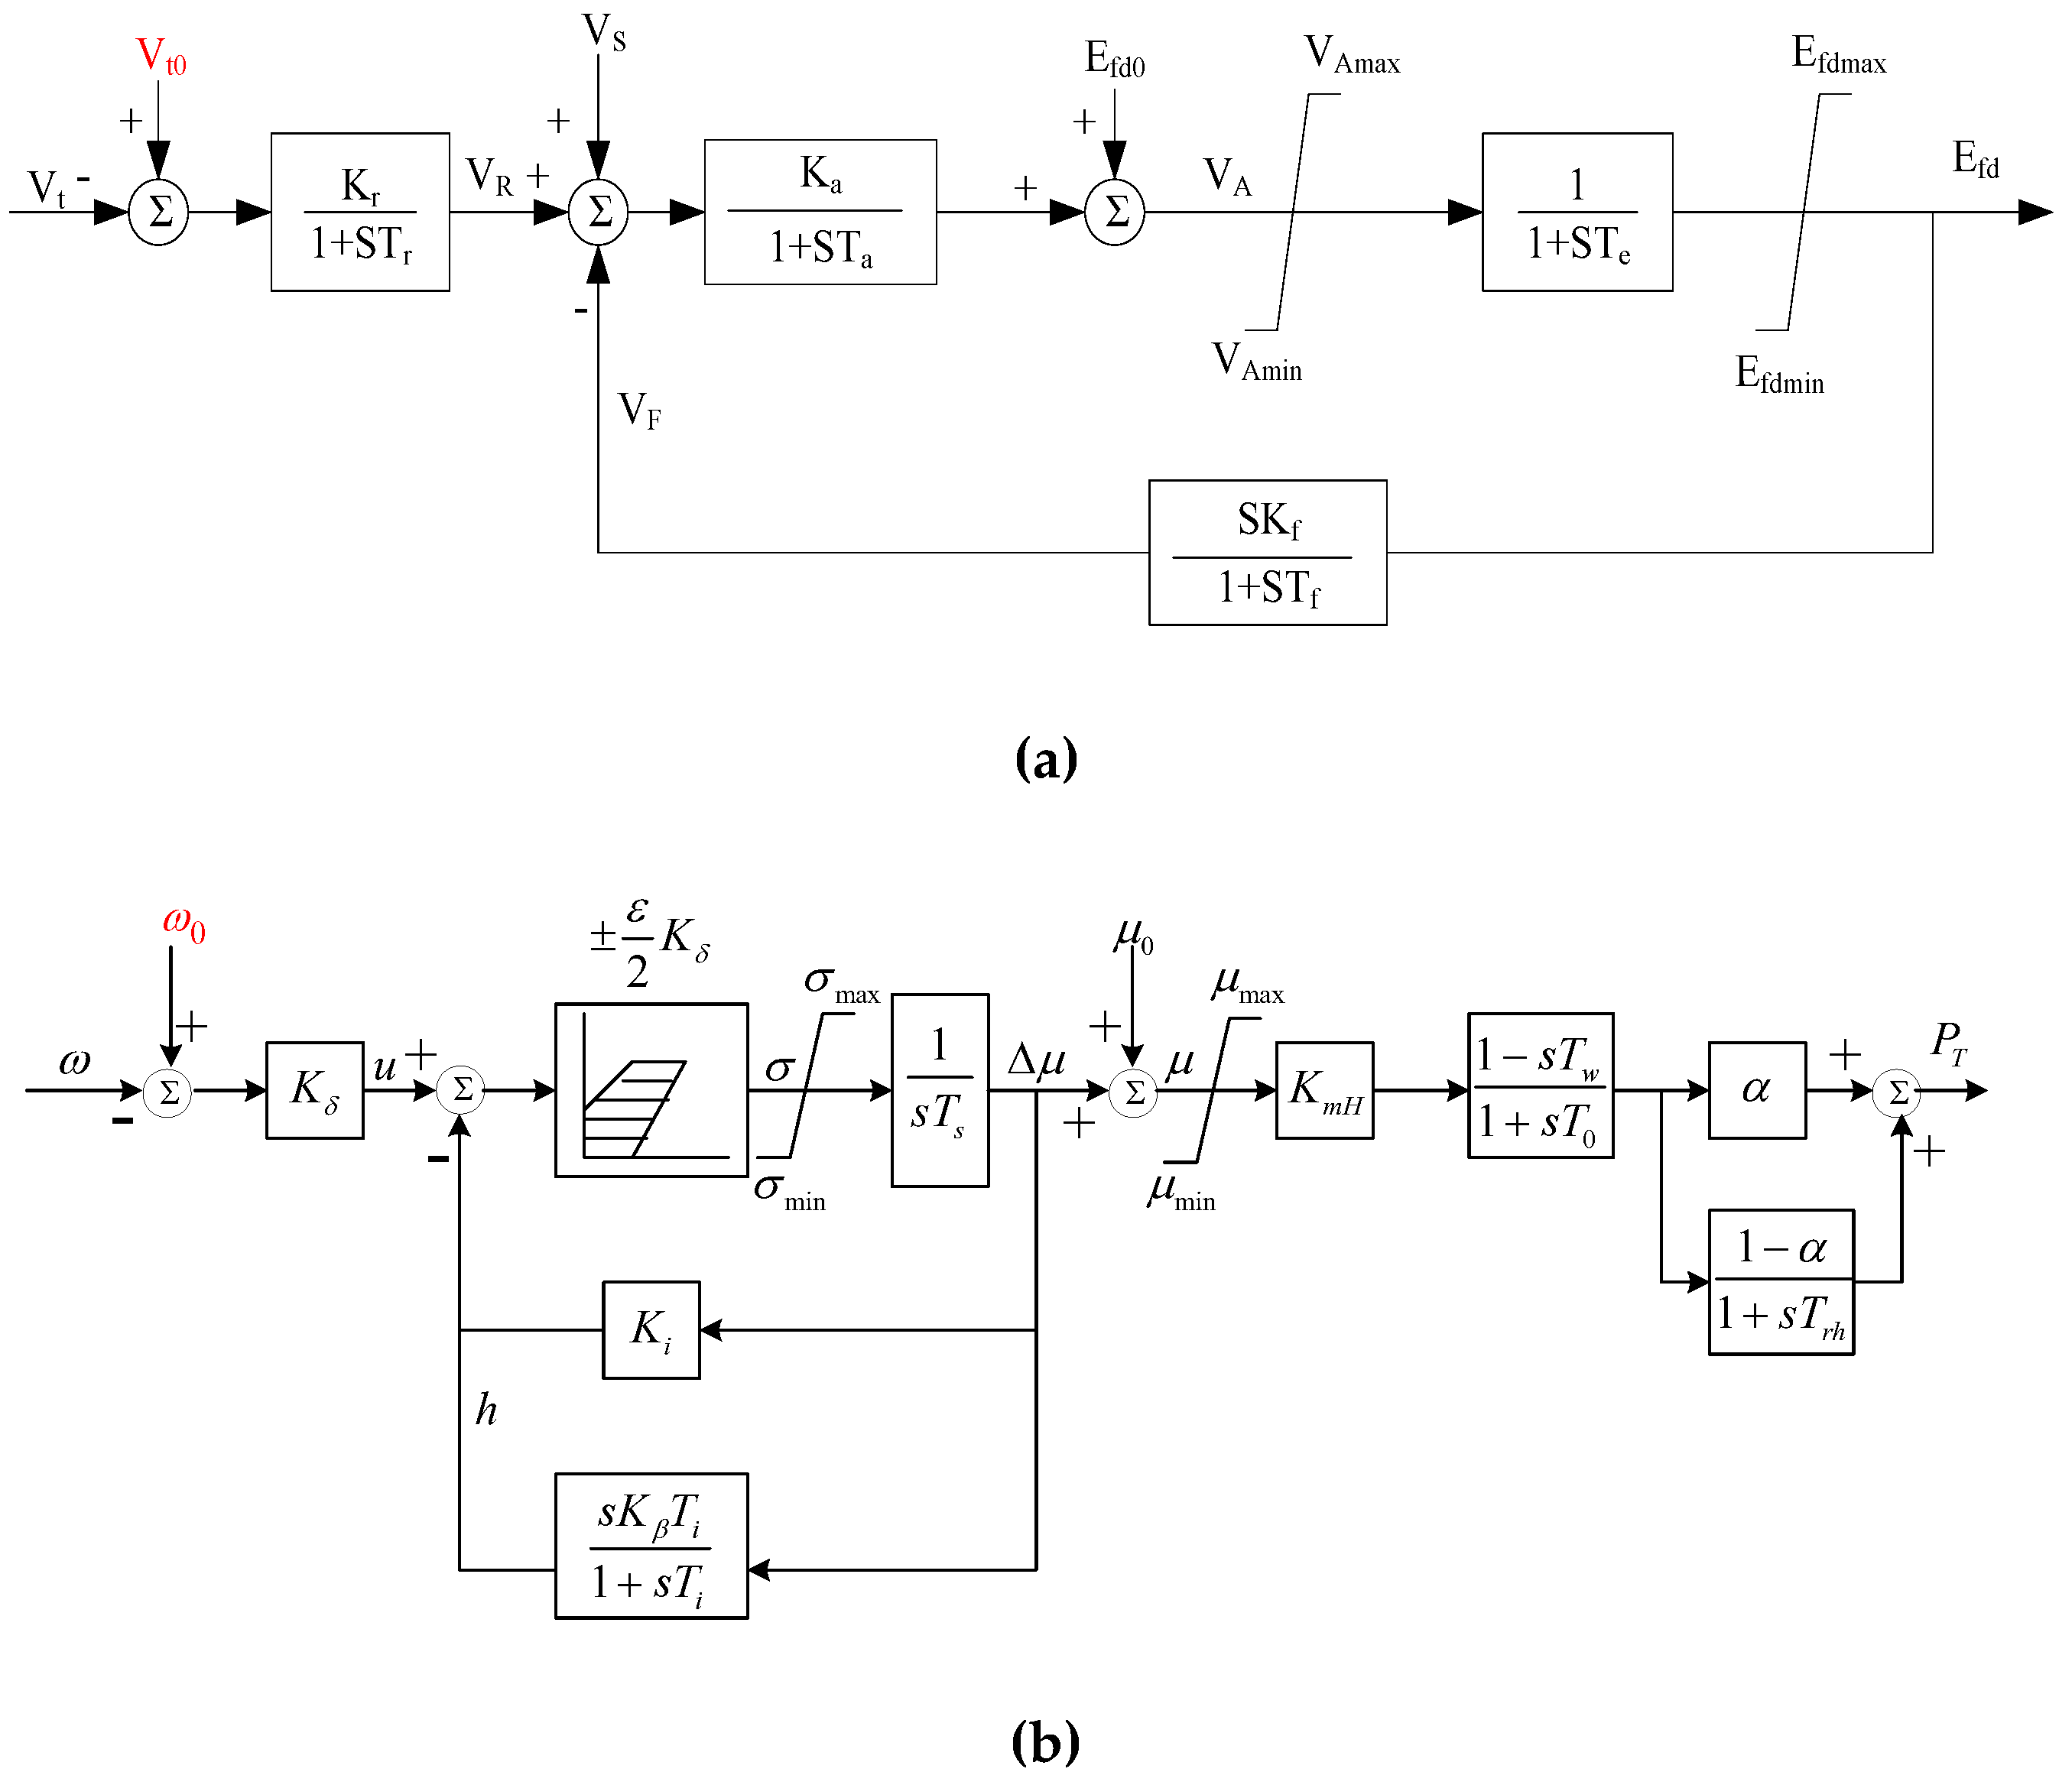
Figure 2.
Structure of a power system with a practical PV power plant.
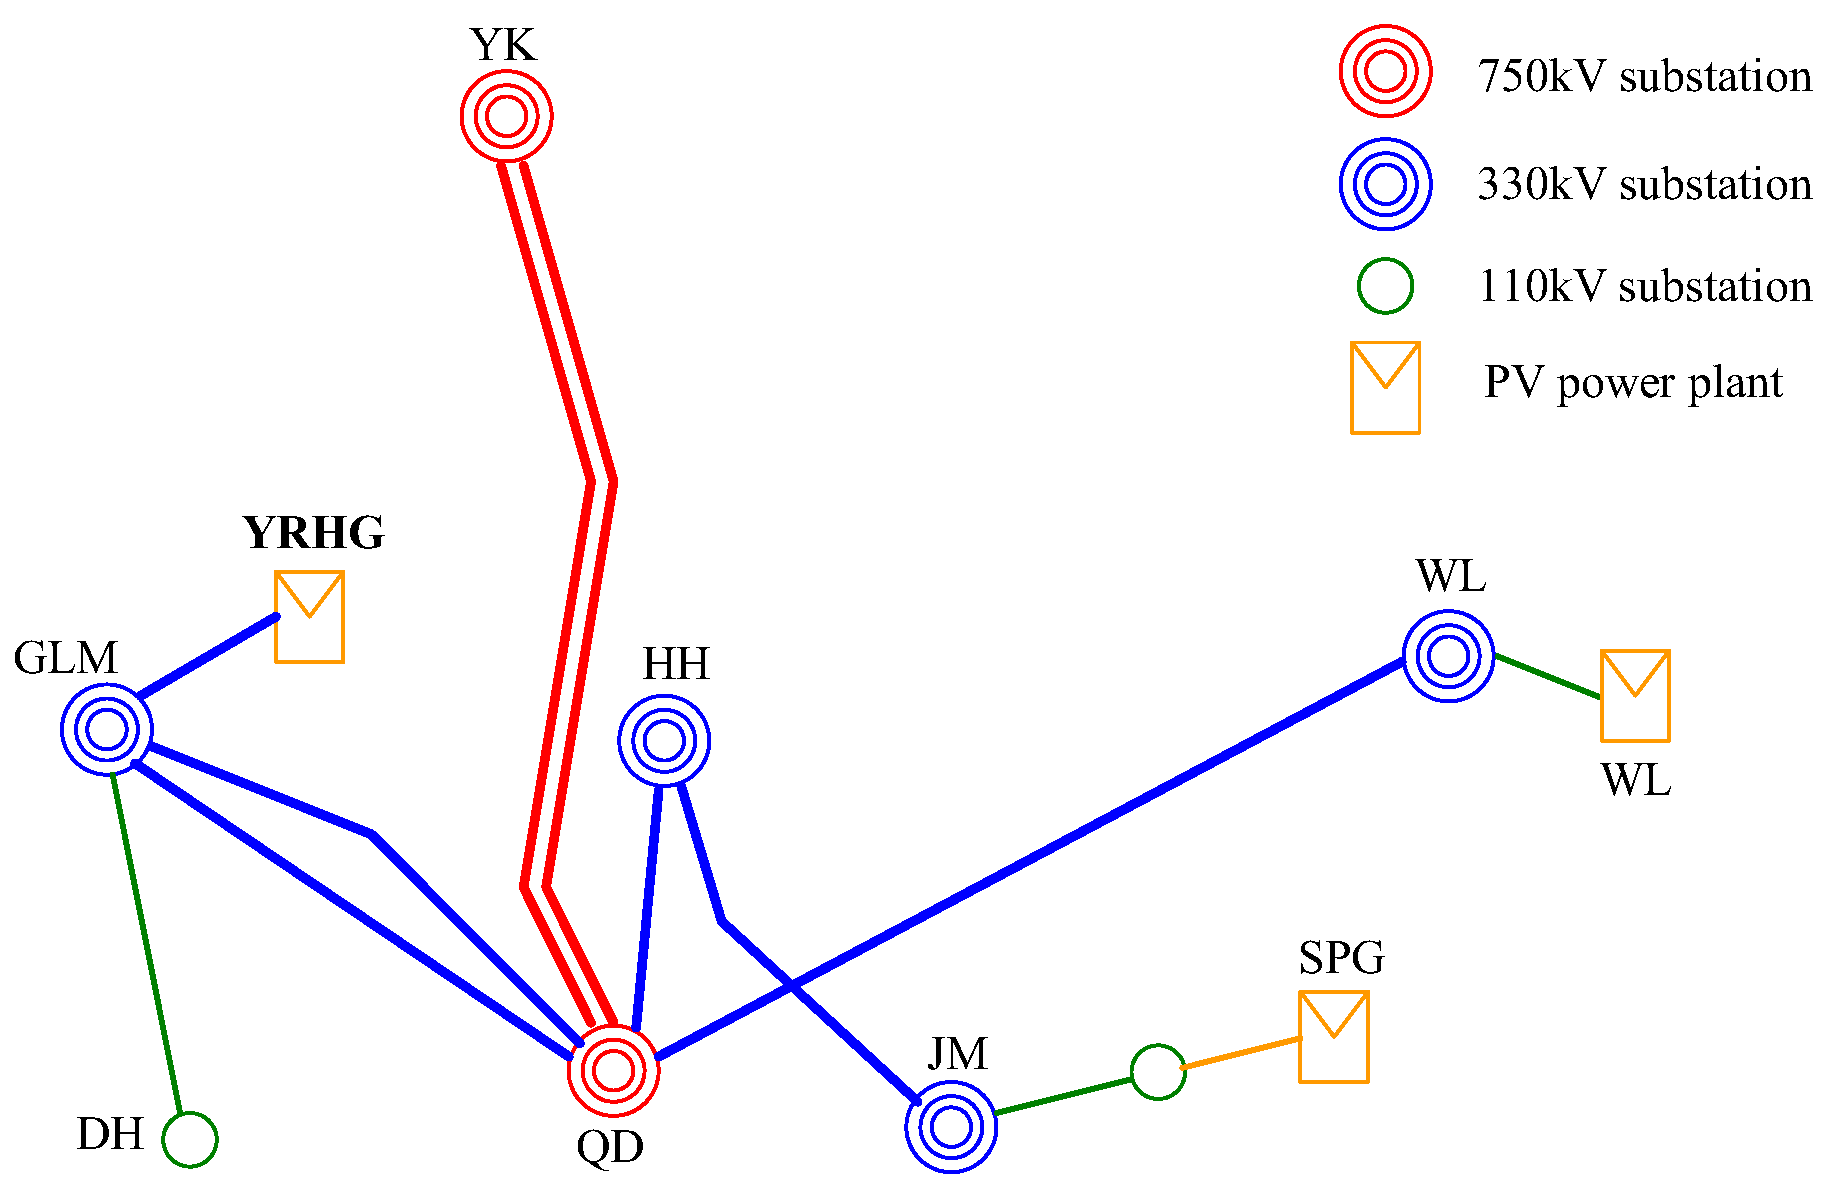
Figure 3.
Internal structure of YRHG PV power plant.
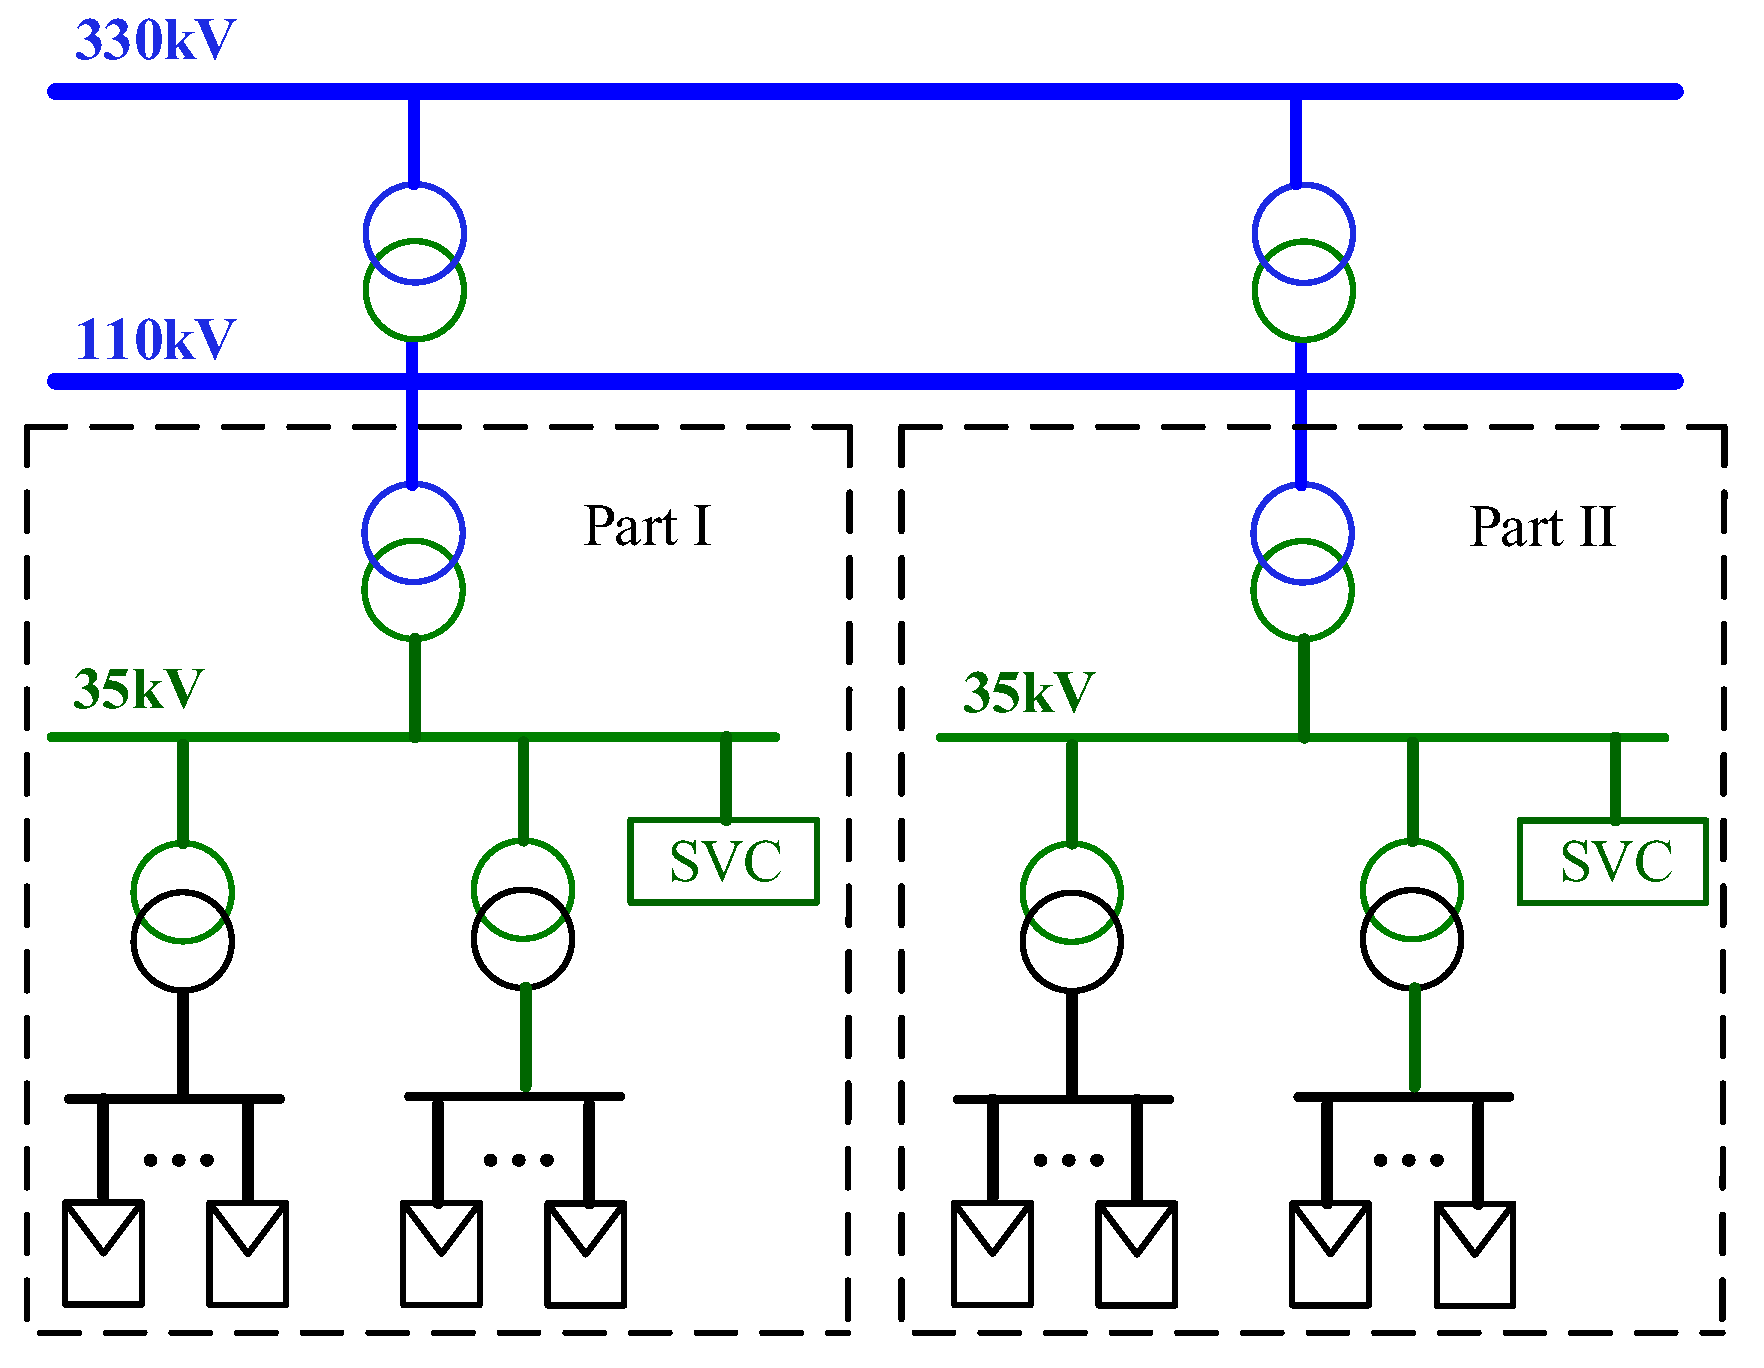
Figure 4.
Modelling of YRHG PV power plant based on fast-responding generator method: (a) The whole model in DIgSILENT/PowerFactory; (b) PV power generation model under a certain feeder.
Figure 4.
Modelling of YRHG PV power plant based on fast-responding generator method: (a) The whole model in DIgSILENT/PowerFactory; (b) PV power generation model under a certain feeder.
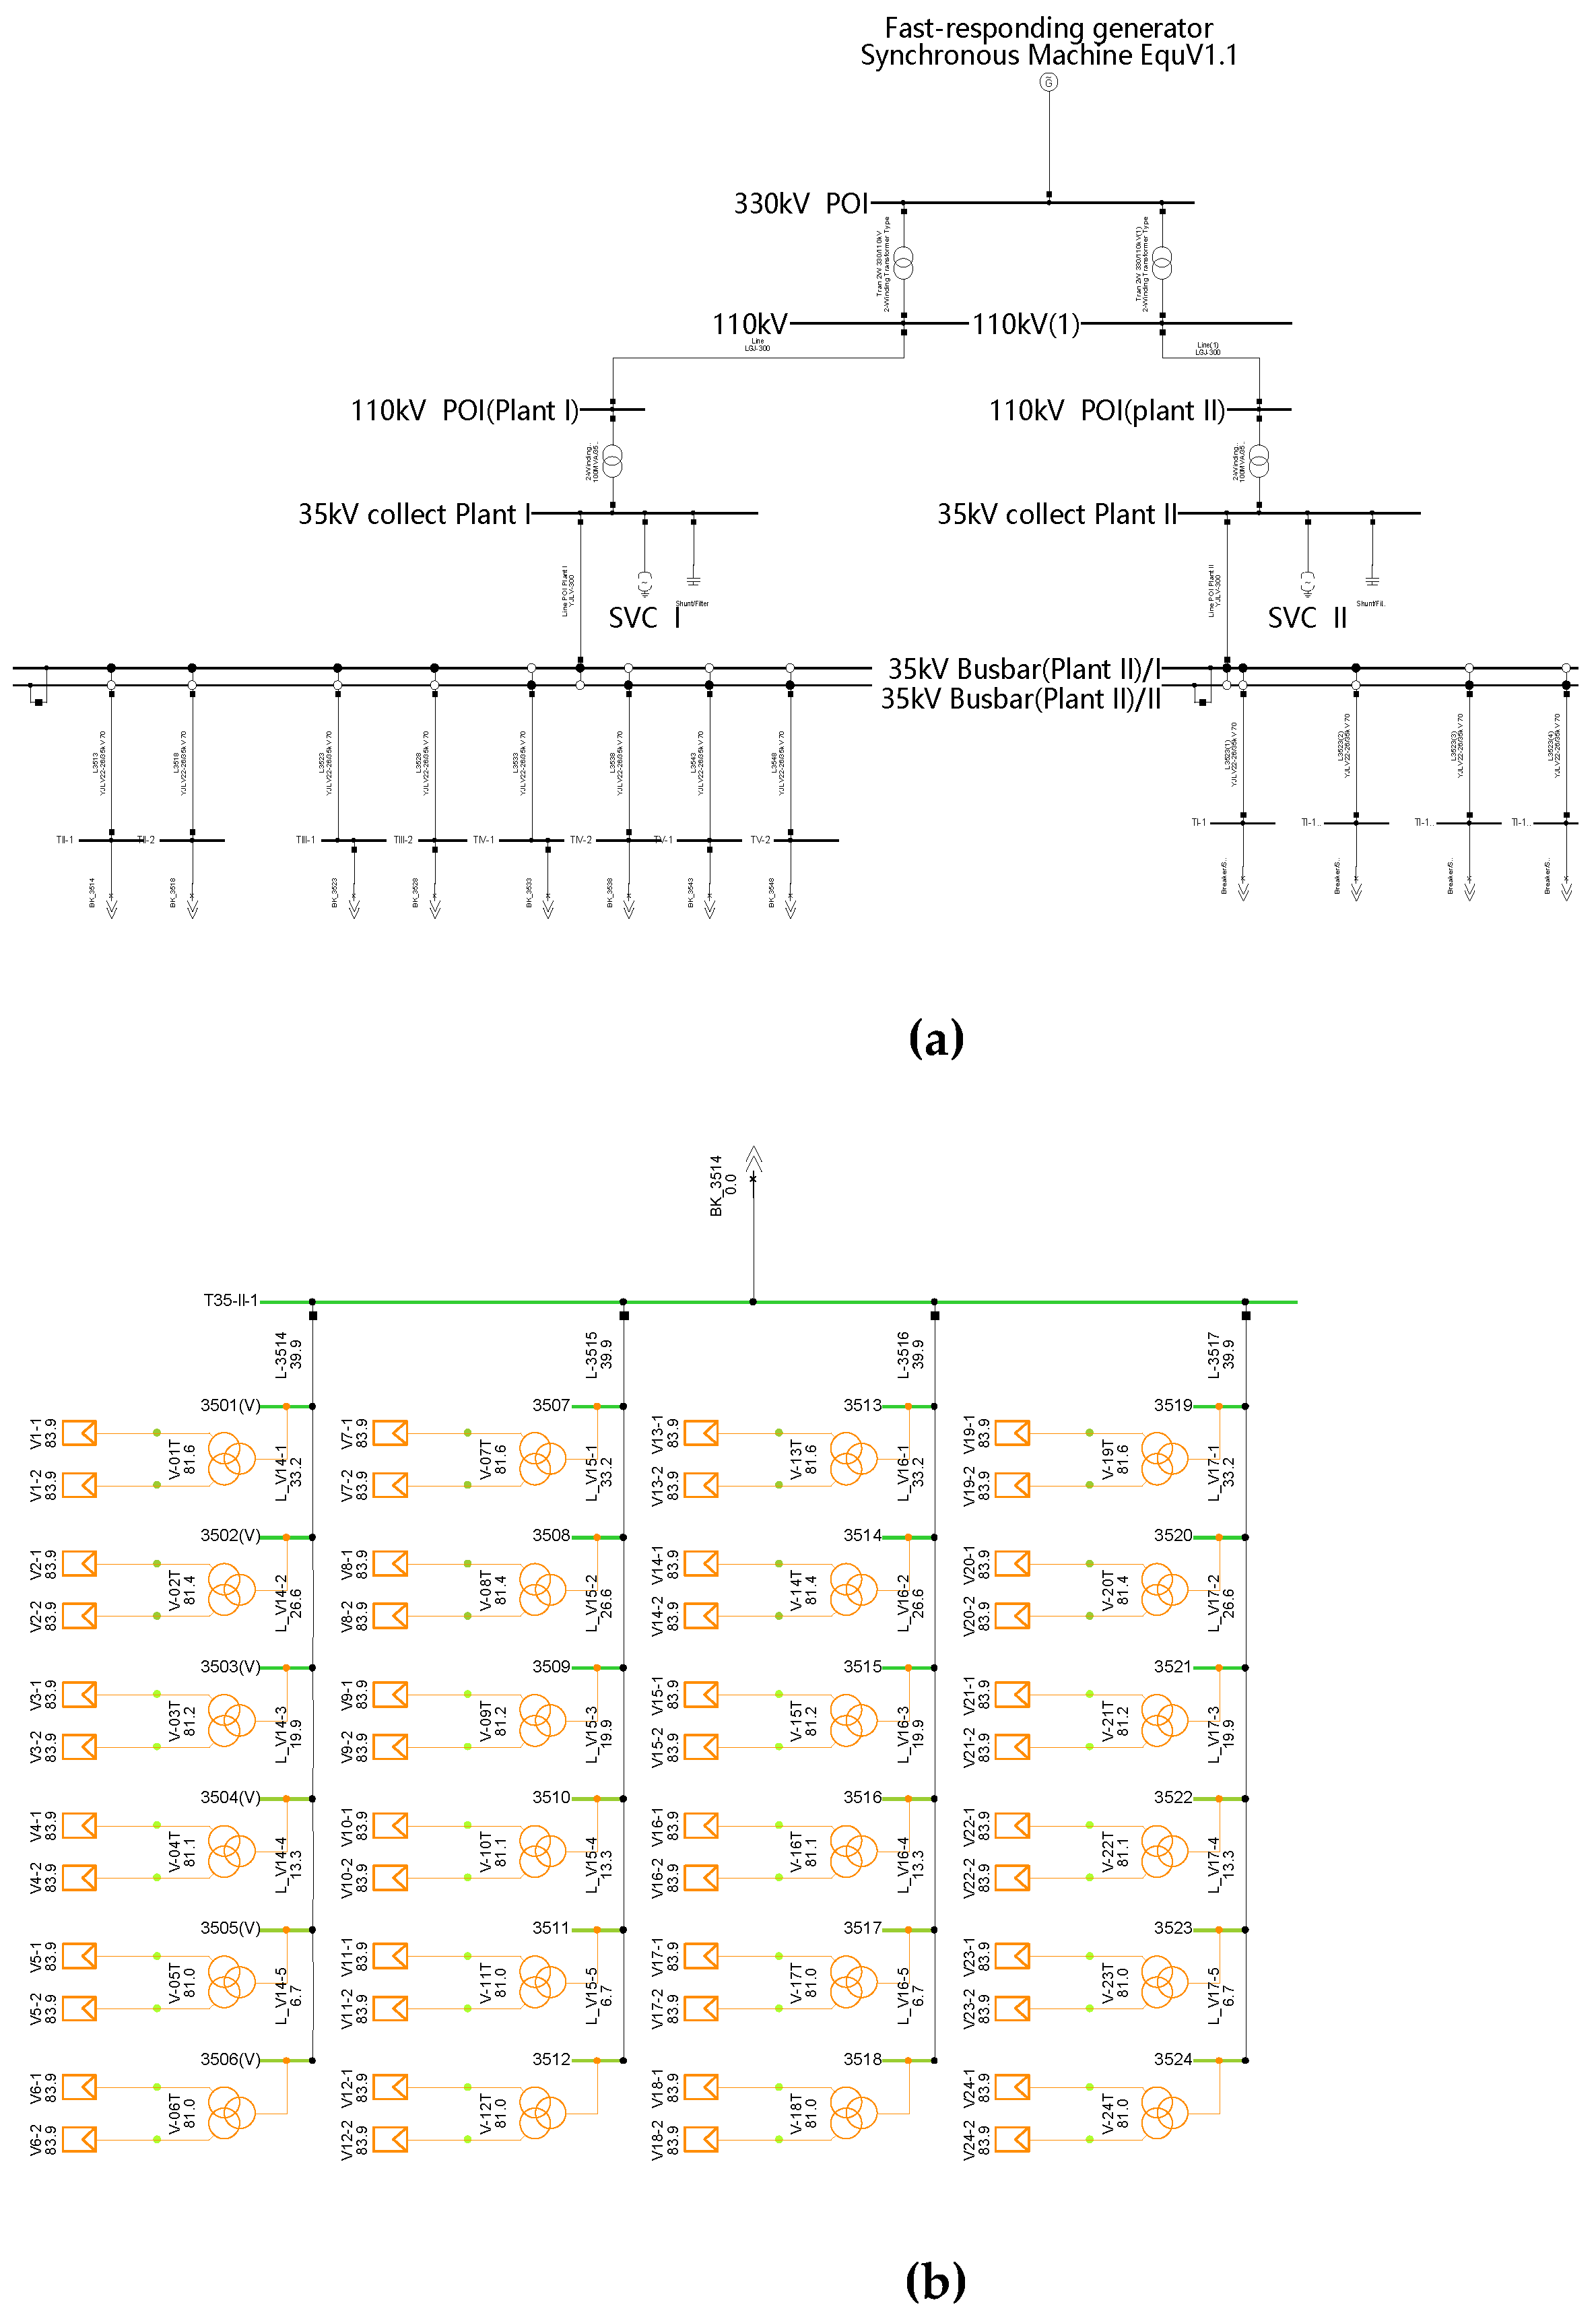
Figure 5.
Positive, negative and zero sequence component of voltage.
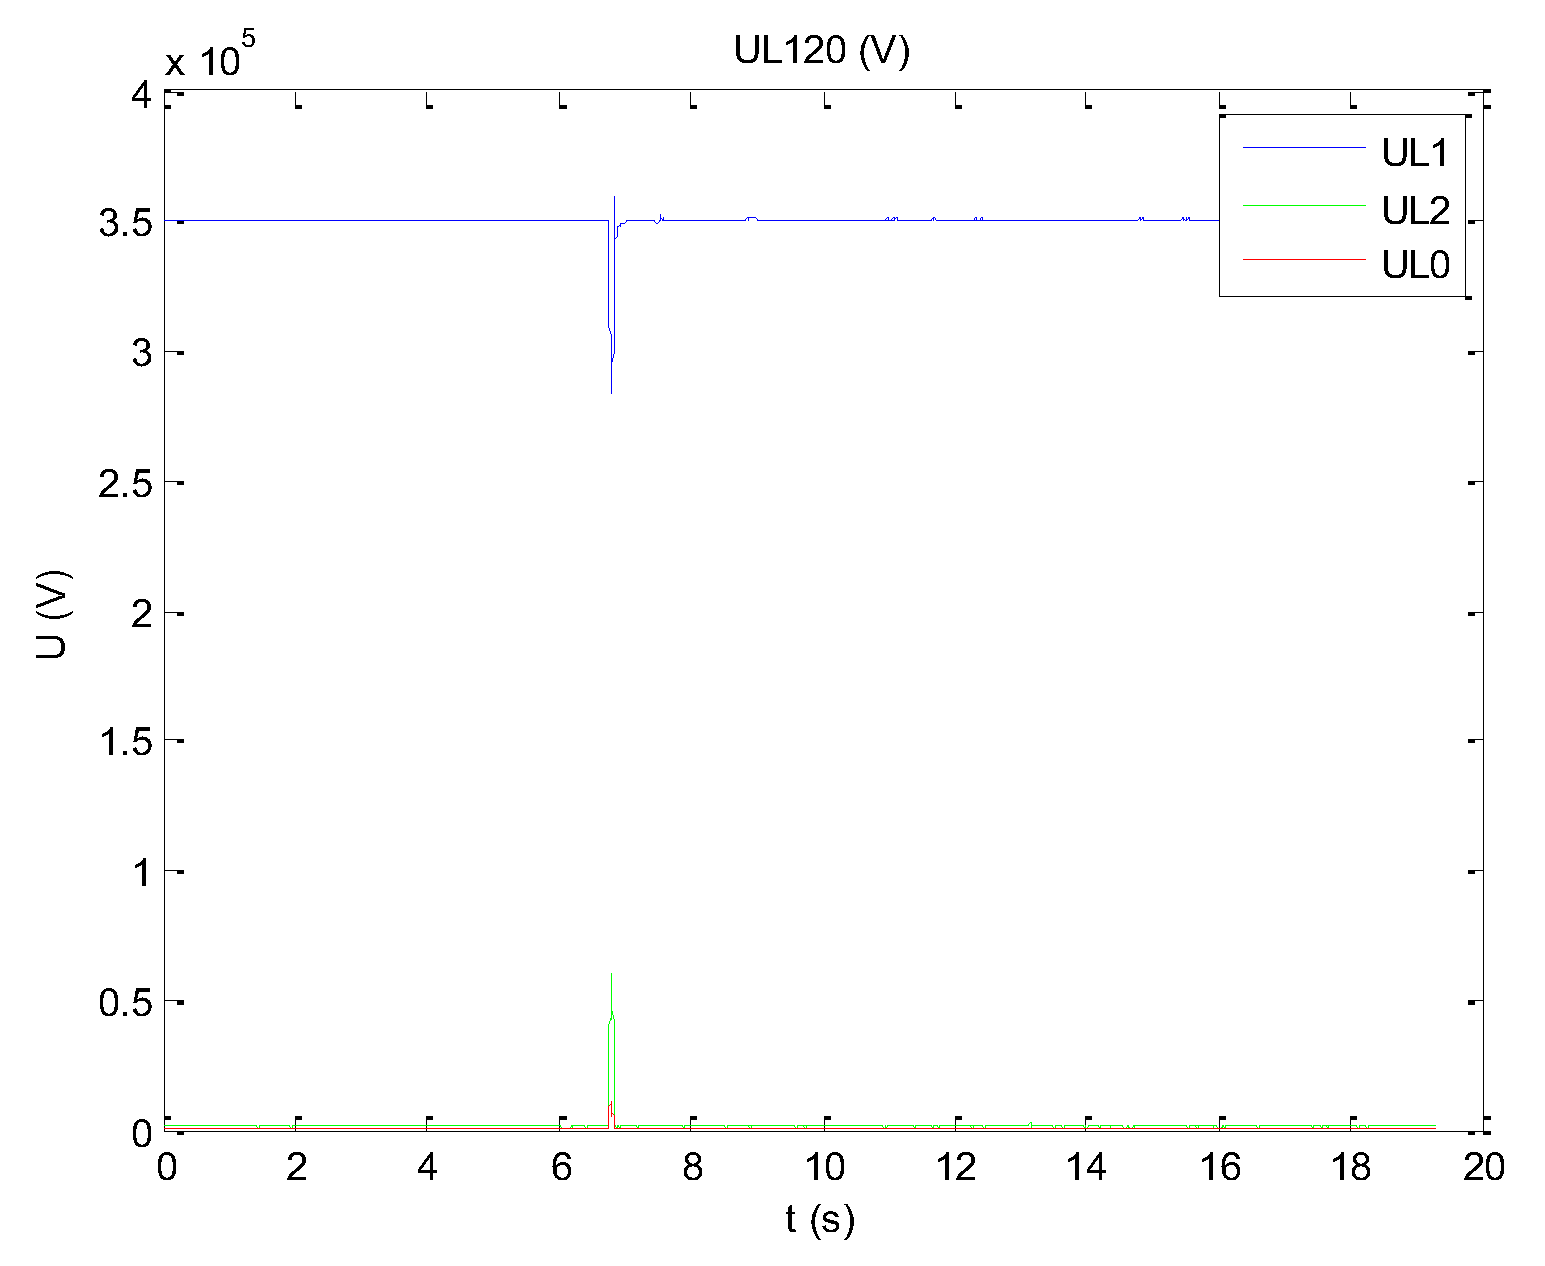
Figure 6.
Synchronization of measured data and simulation step size.
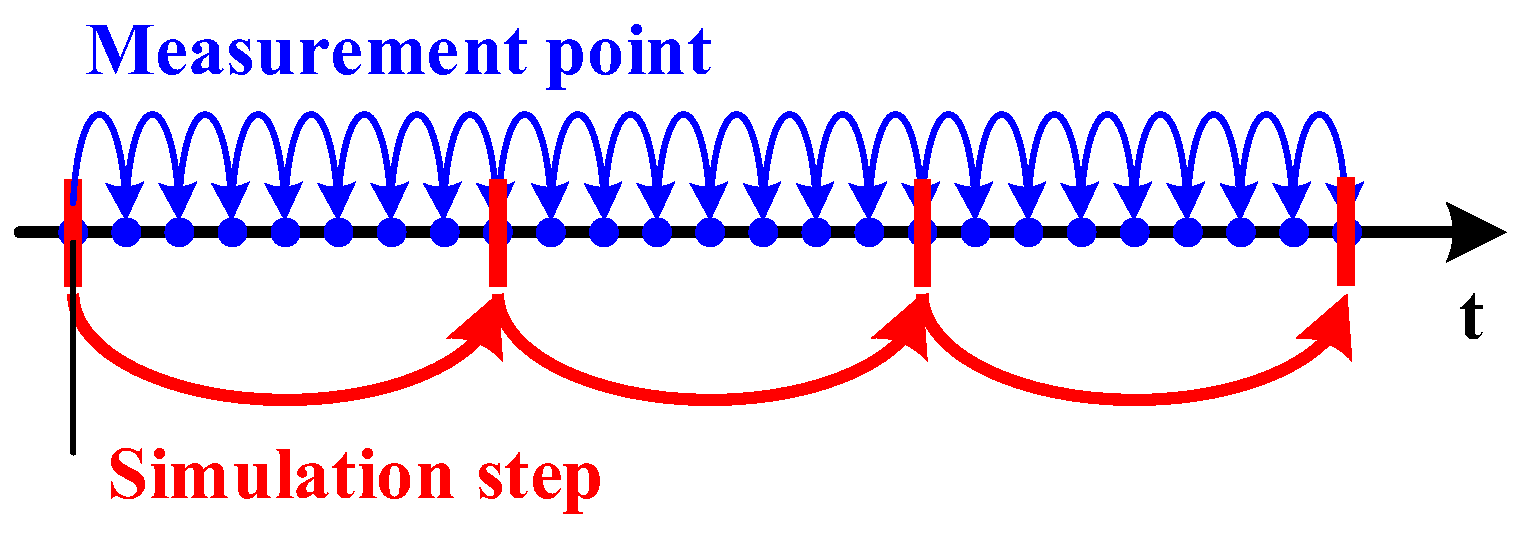
Figure 7.
The injection data of measured voltage and frequency: (a) Amplitude of measured voltage; (b) Amplitude of measured frequency.
Figure 7.
The injection data of measured voltage and frequency: (a) Amplitude of measured voltage; (b) Amplitude of measured frequency.
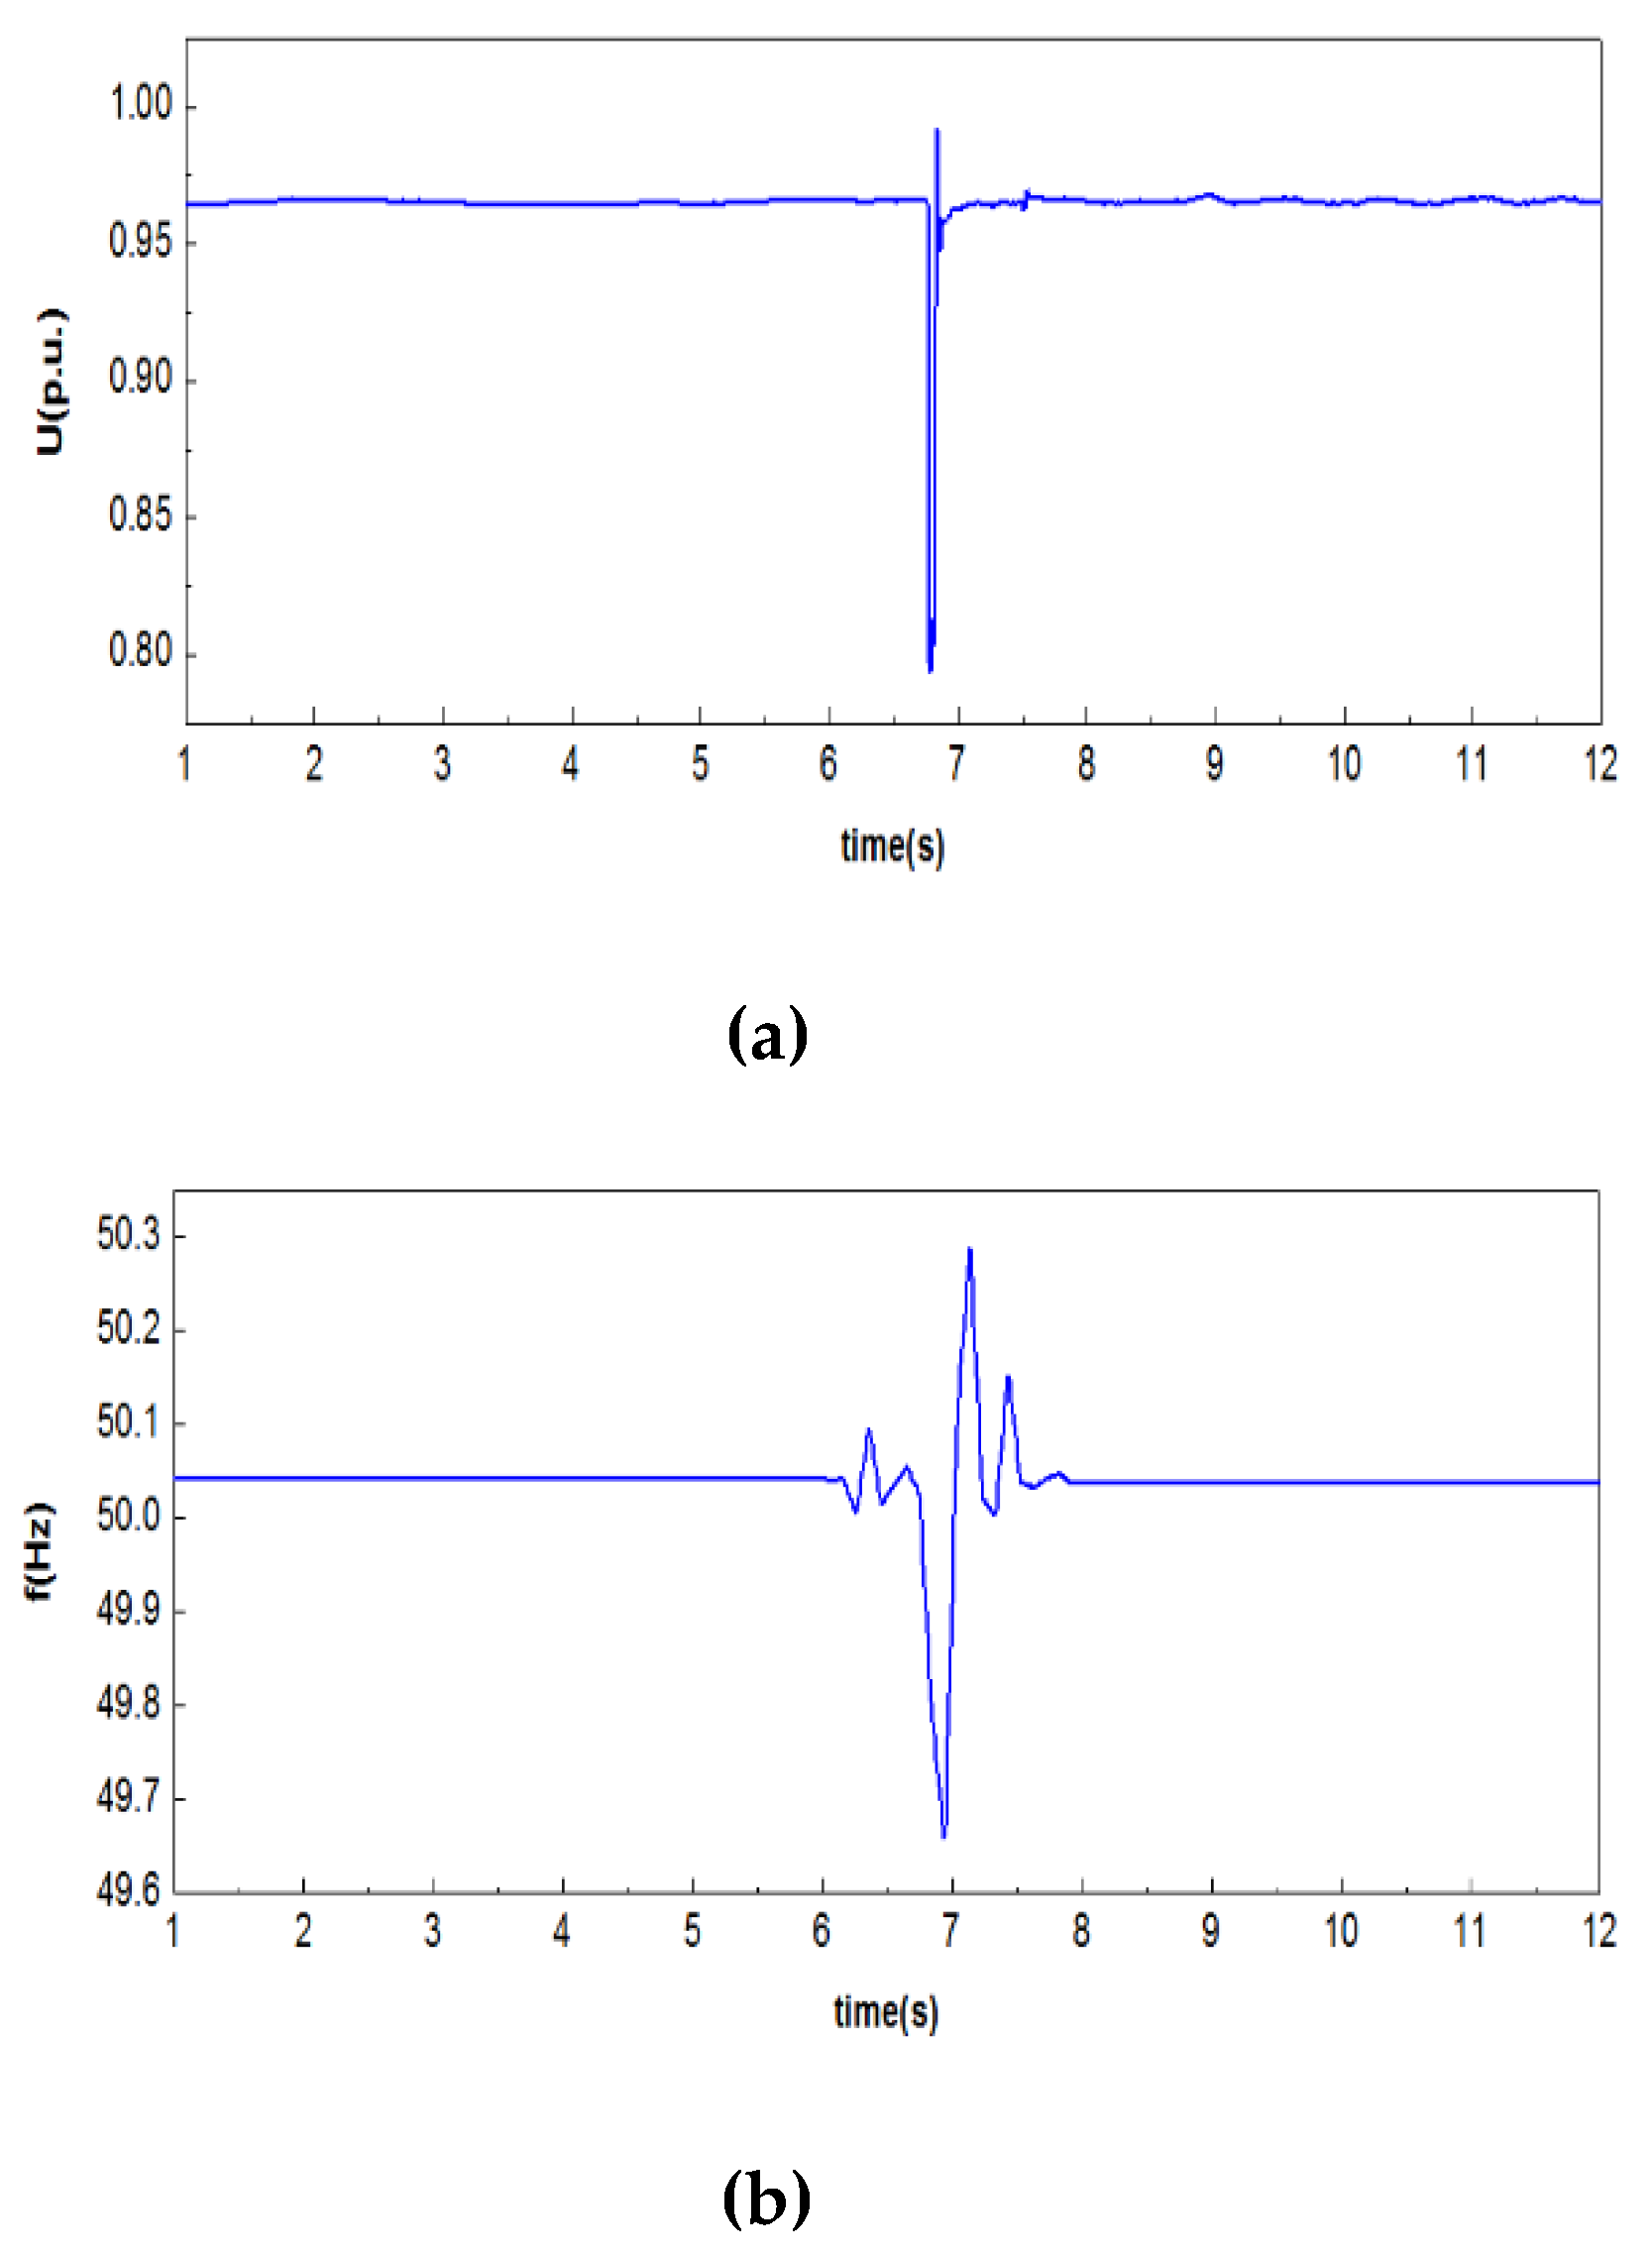
Figure 8.
Comparison of voltage and frequency between simulation outputs and measured data (red line: simulation output, blue line: measured data): (a) Amplitude of voltage; (b) Amplitude of frequency.
Figure 8.
Comparison of voltage and frequency between simulation outputs and measured data (red line: simulation output, blue line: measured data): (a) Amplitude of voltage; (b) Amplitude of frequency.
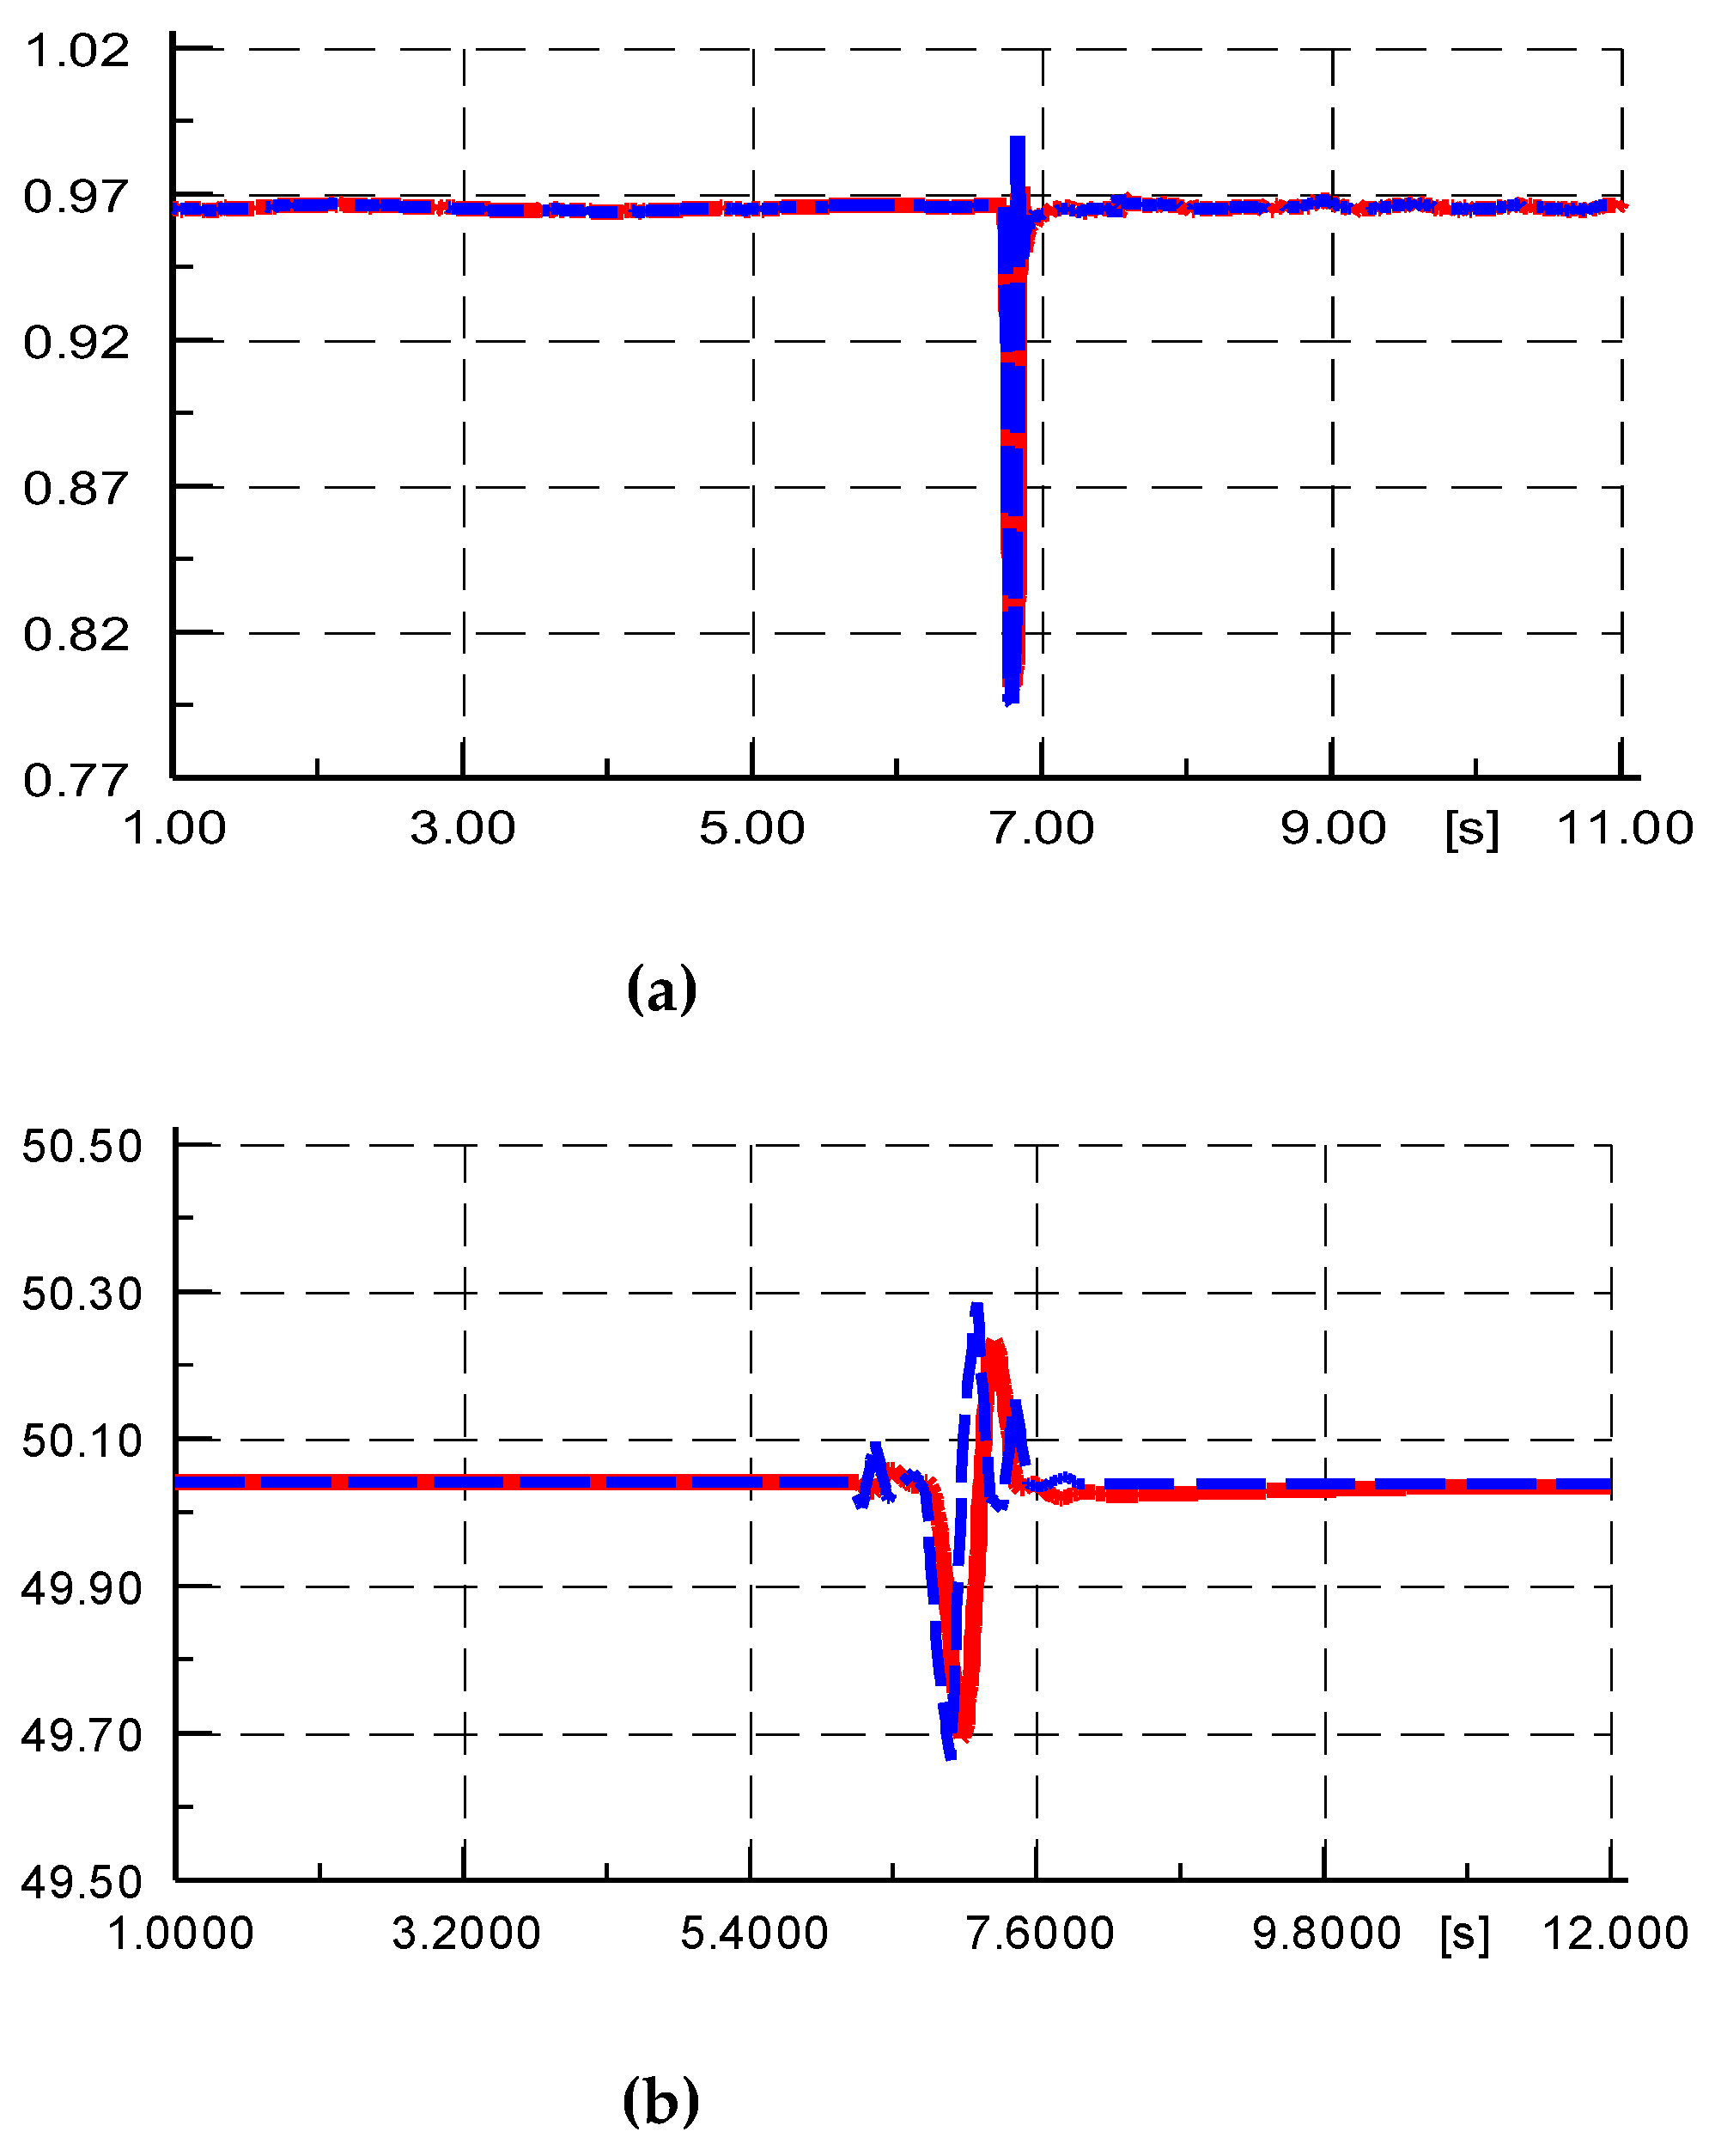
Figure 9.
Comparison of real and reactive power between simulation outputs and measured data (red line: simulation output, blue line: measured data): (a) Active power; (b) Reactive power.
Figure 9.
Comparison of real and reactive power between simulation outputs and measured data (red line: simulation output, blue line: measured data): (a) Active power; (b) Reactive power.
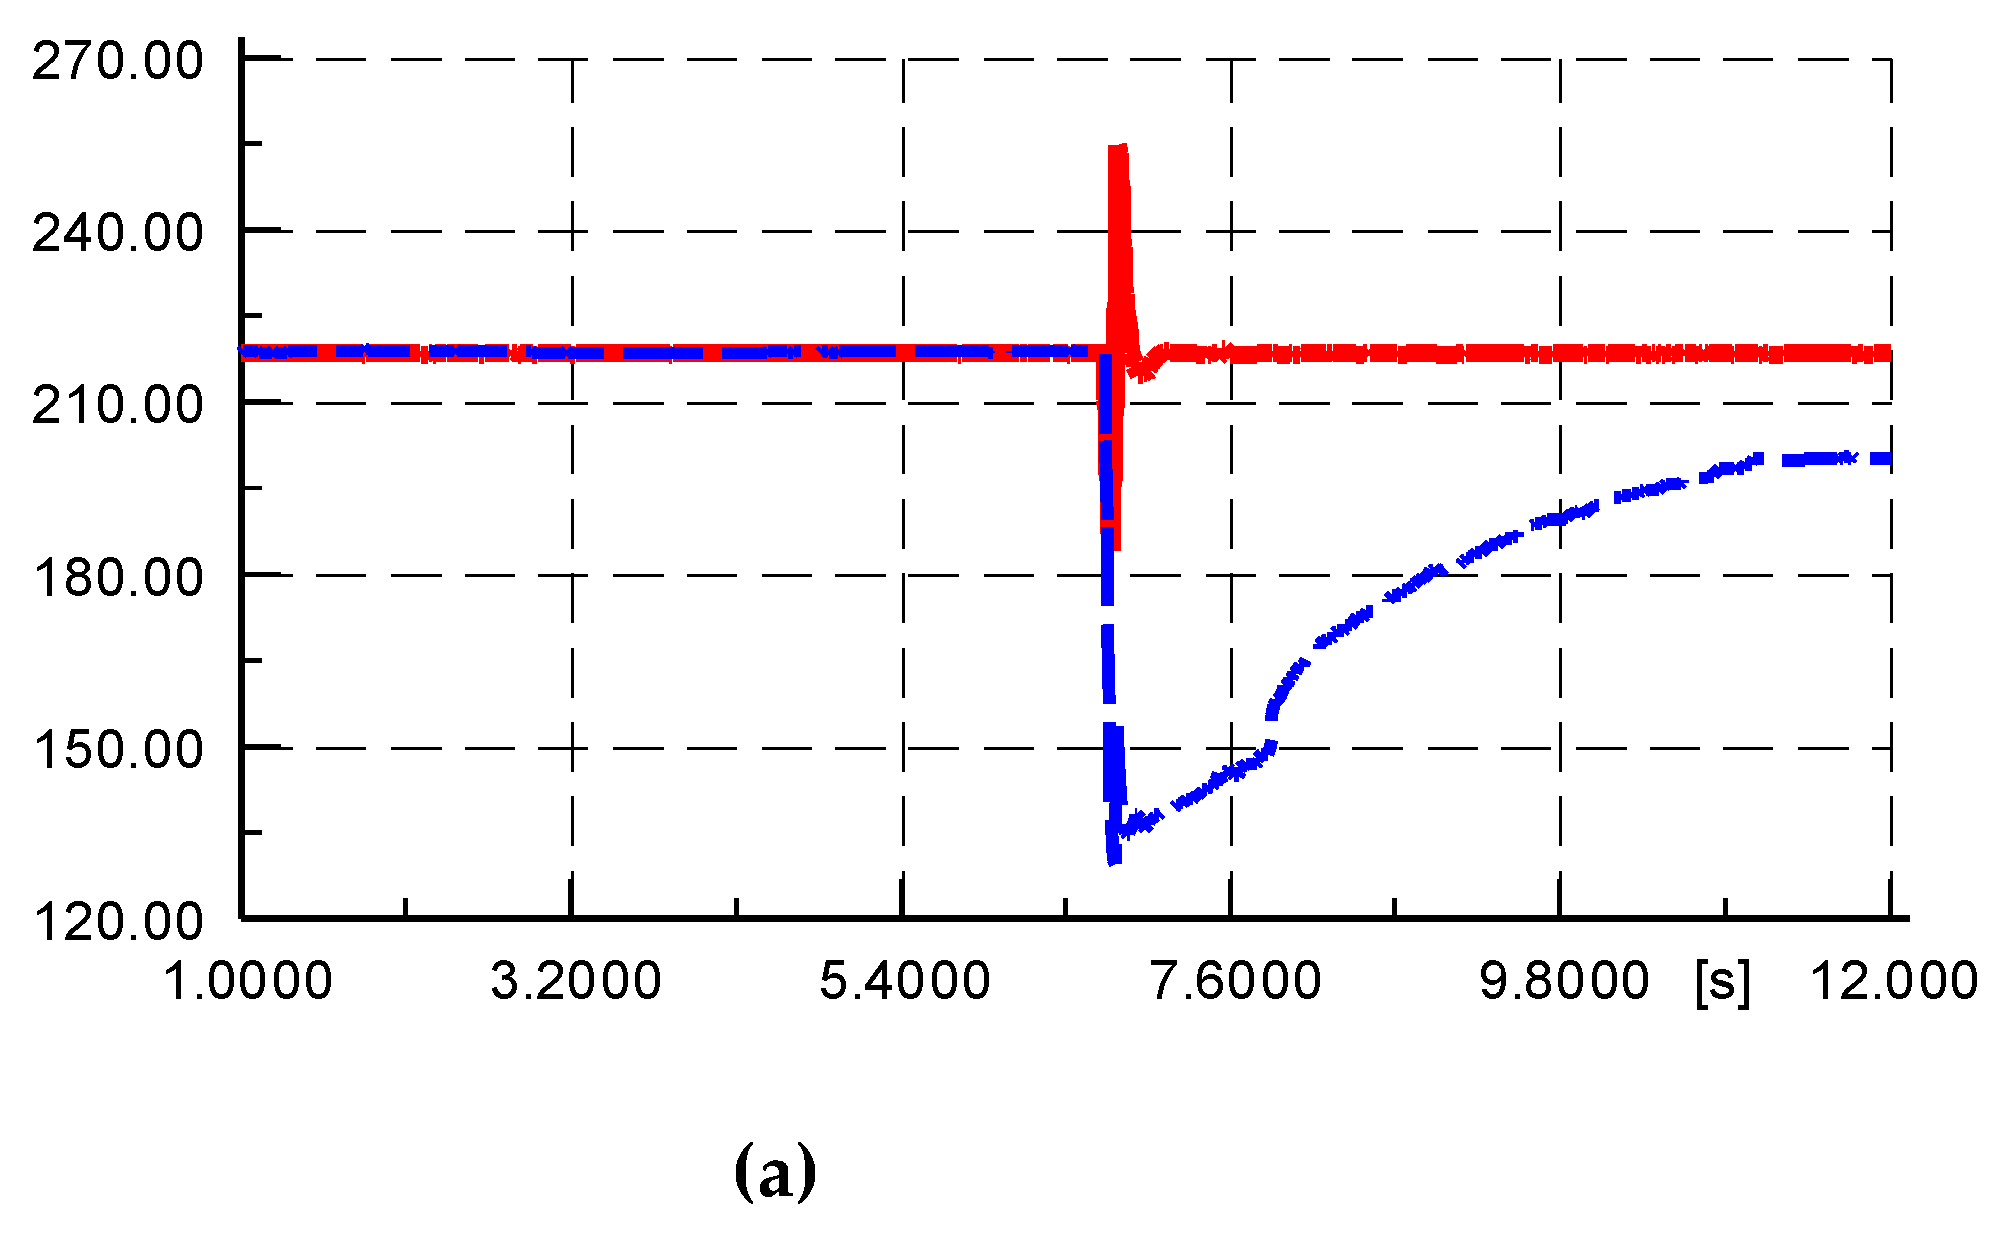
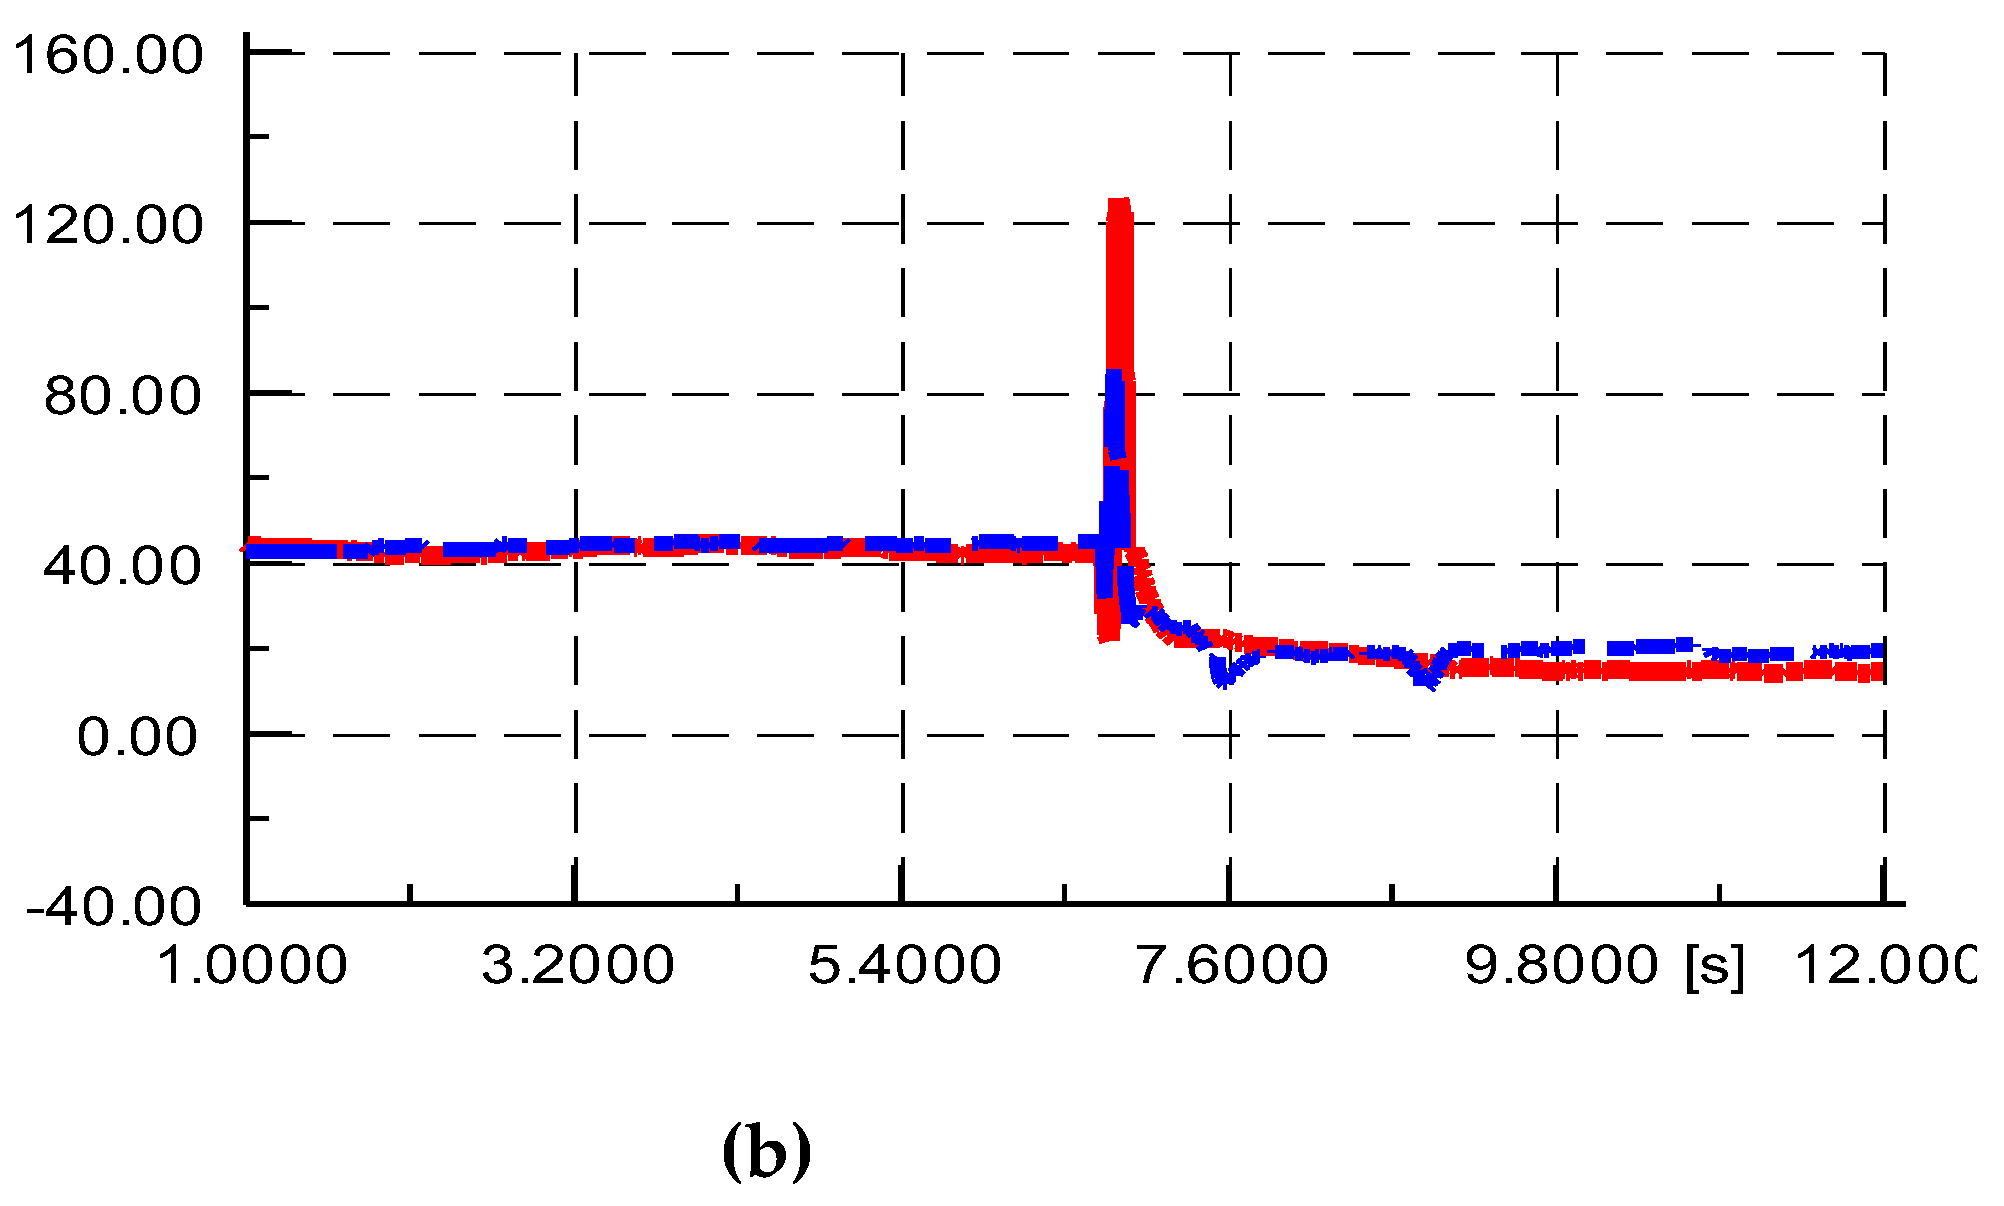
Figure 10.
Active power control models of PV power generation system: (a) Calculation of active power current command; (b) Limitation of active power change.
Figure 10.
Active power control models of PV power generation system: (a) Calculation of active power current command; (b) Limitation of active power change.
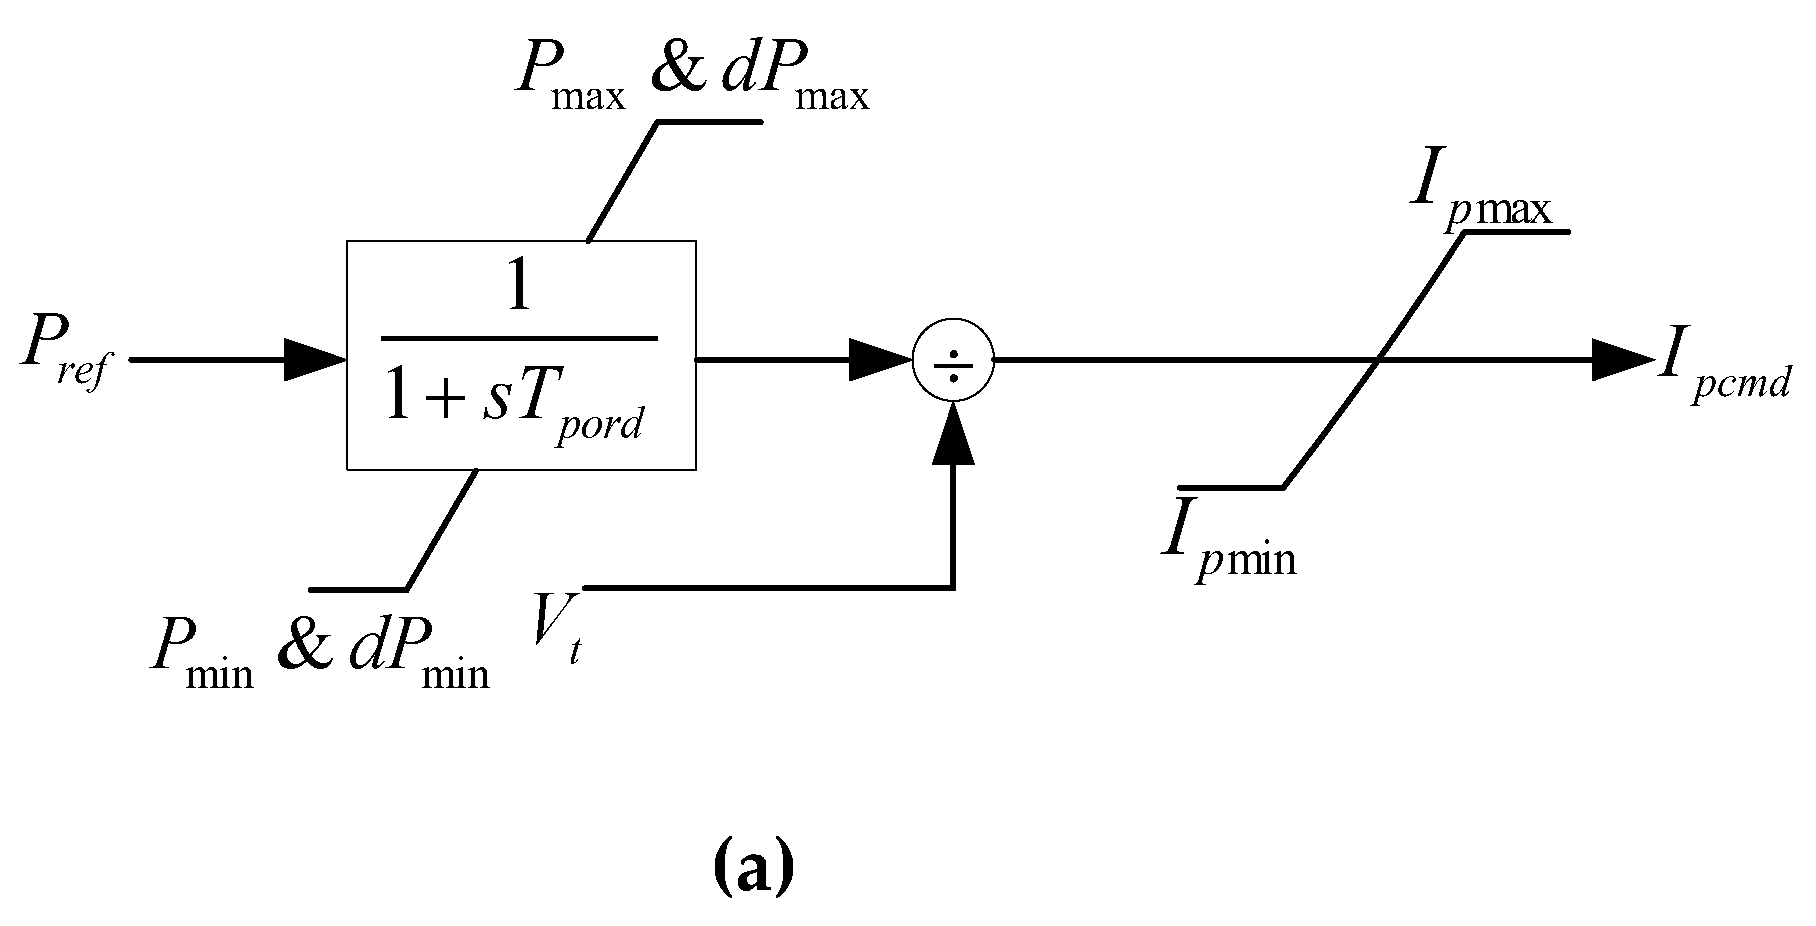
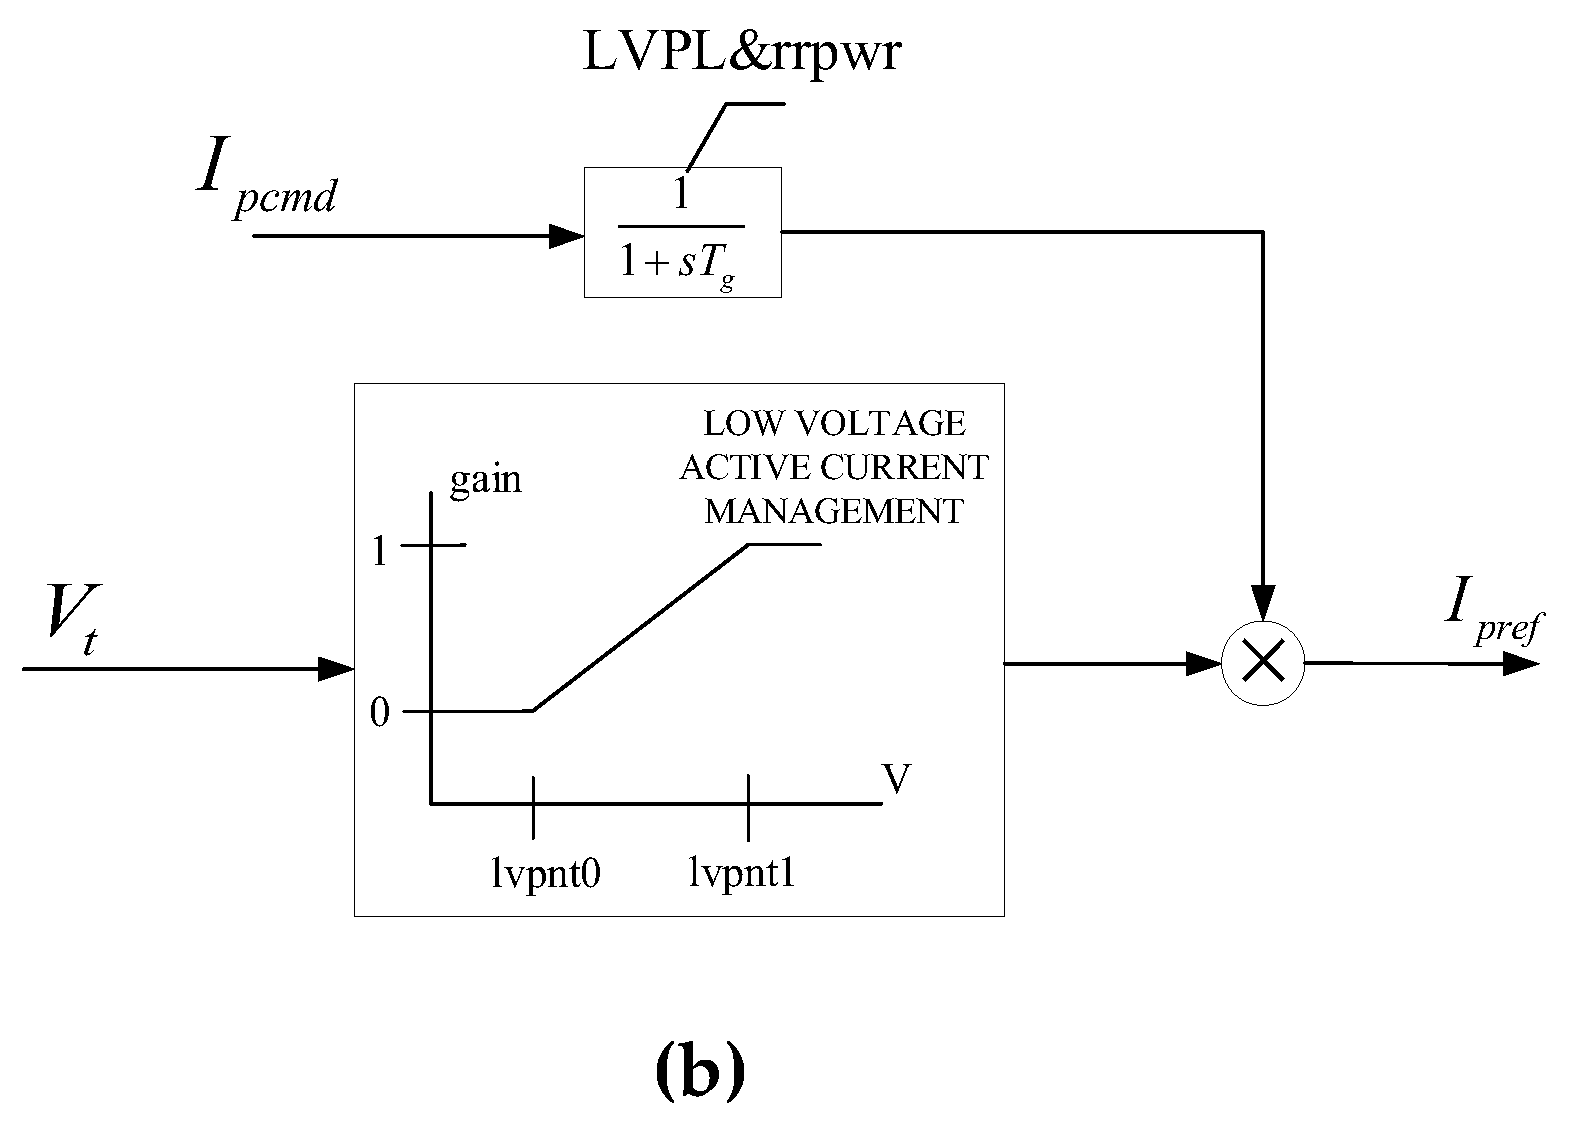
Figure 11.
Comparison of simulation output and measured data after parameter calibration (red line: simulation output of the fast-responding generator method, blue line: measured data, green line: simulation output of the conventional method): (a) Amplitude of voltage; (b) Active power.
Figure 11.
Comparison of simulation output and measured data after parameter calibration (red line: simulation output of the fast-responding generator method, blue line: measured data, green line: simulation output of the conventional method): (a) Amplitude of voltage; (b) Active power.
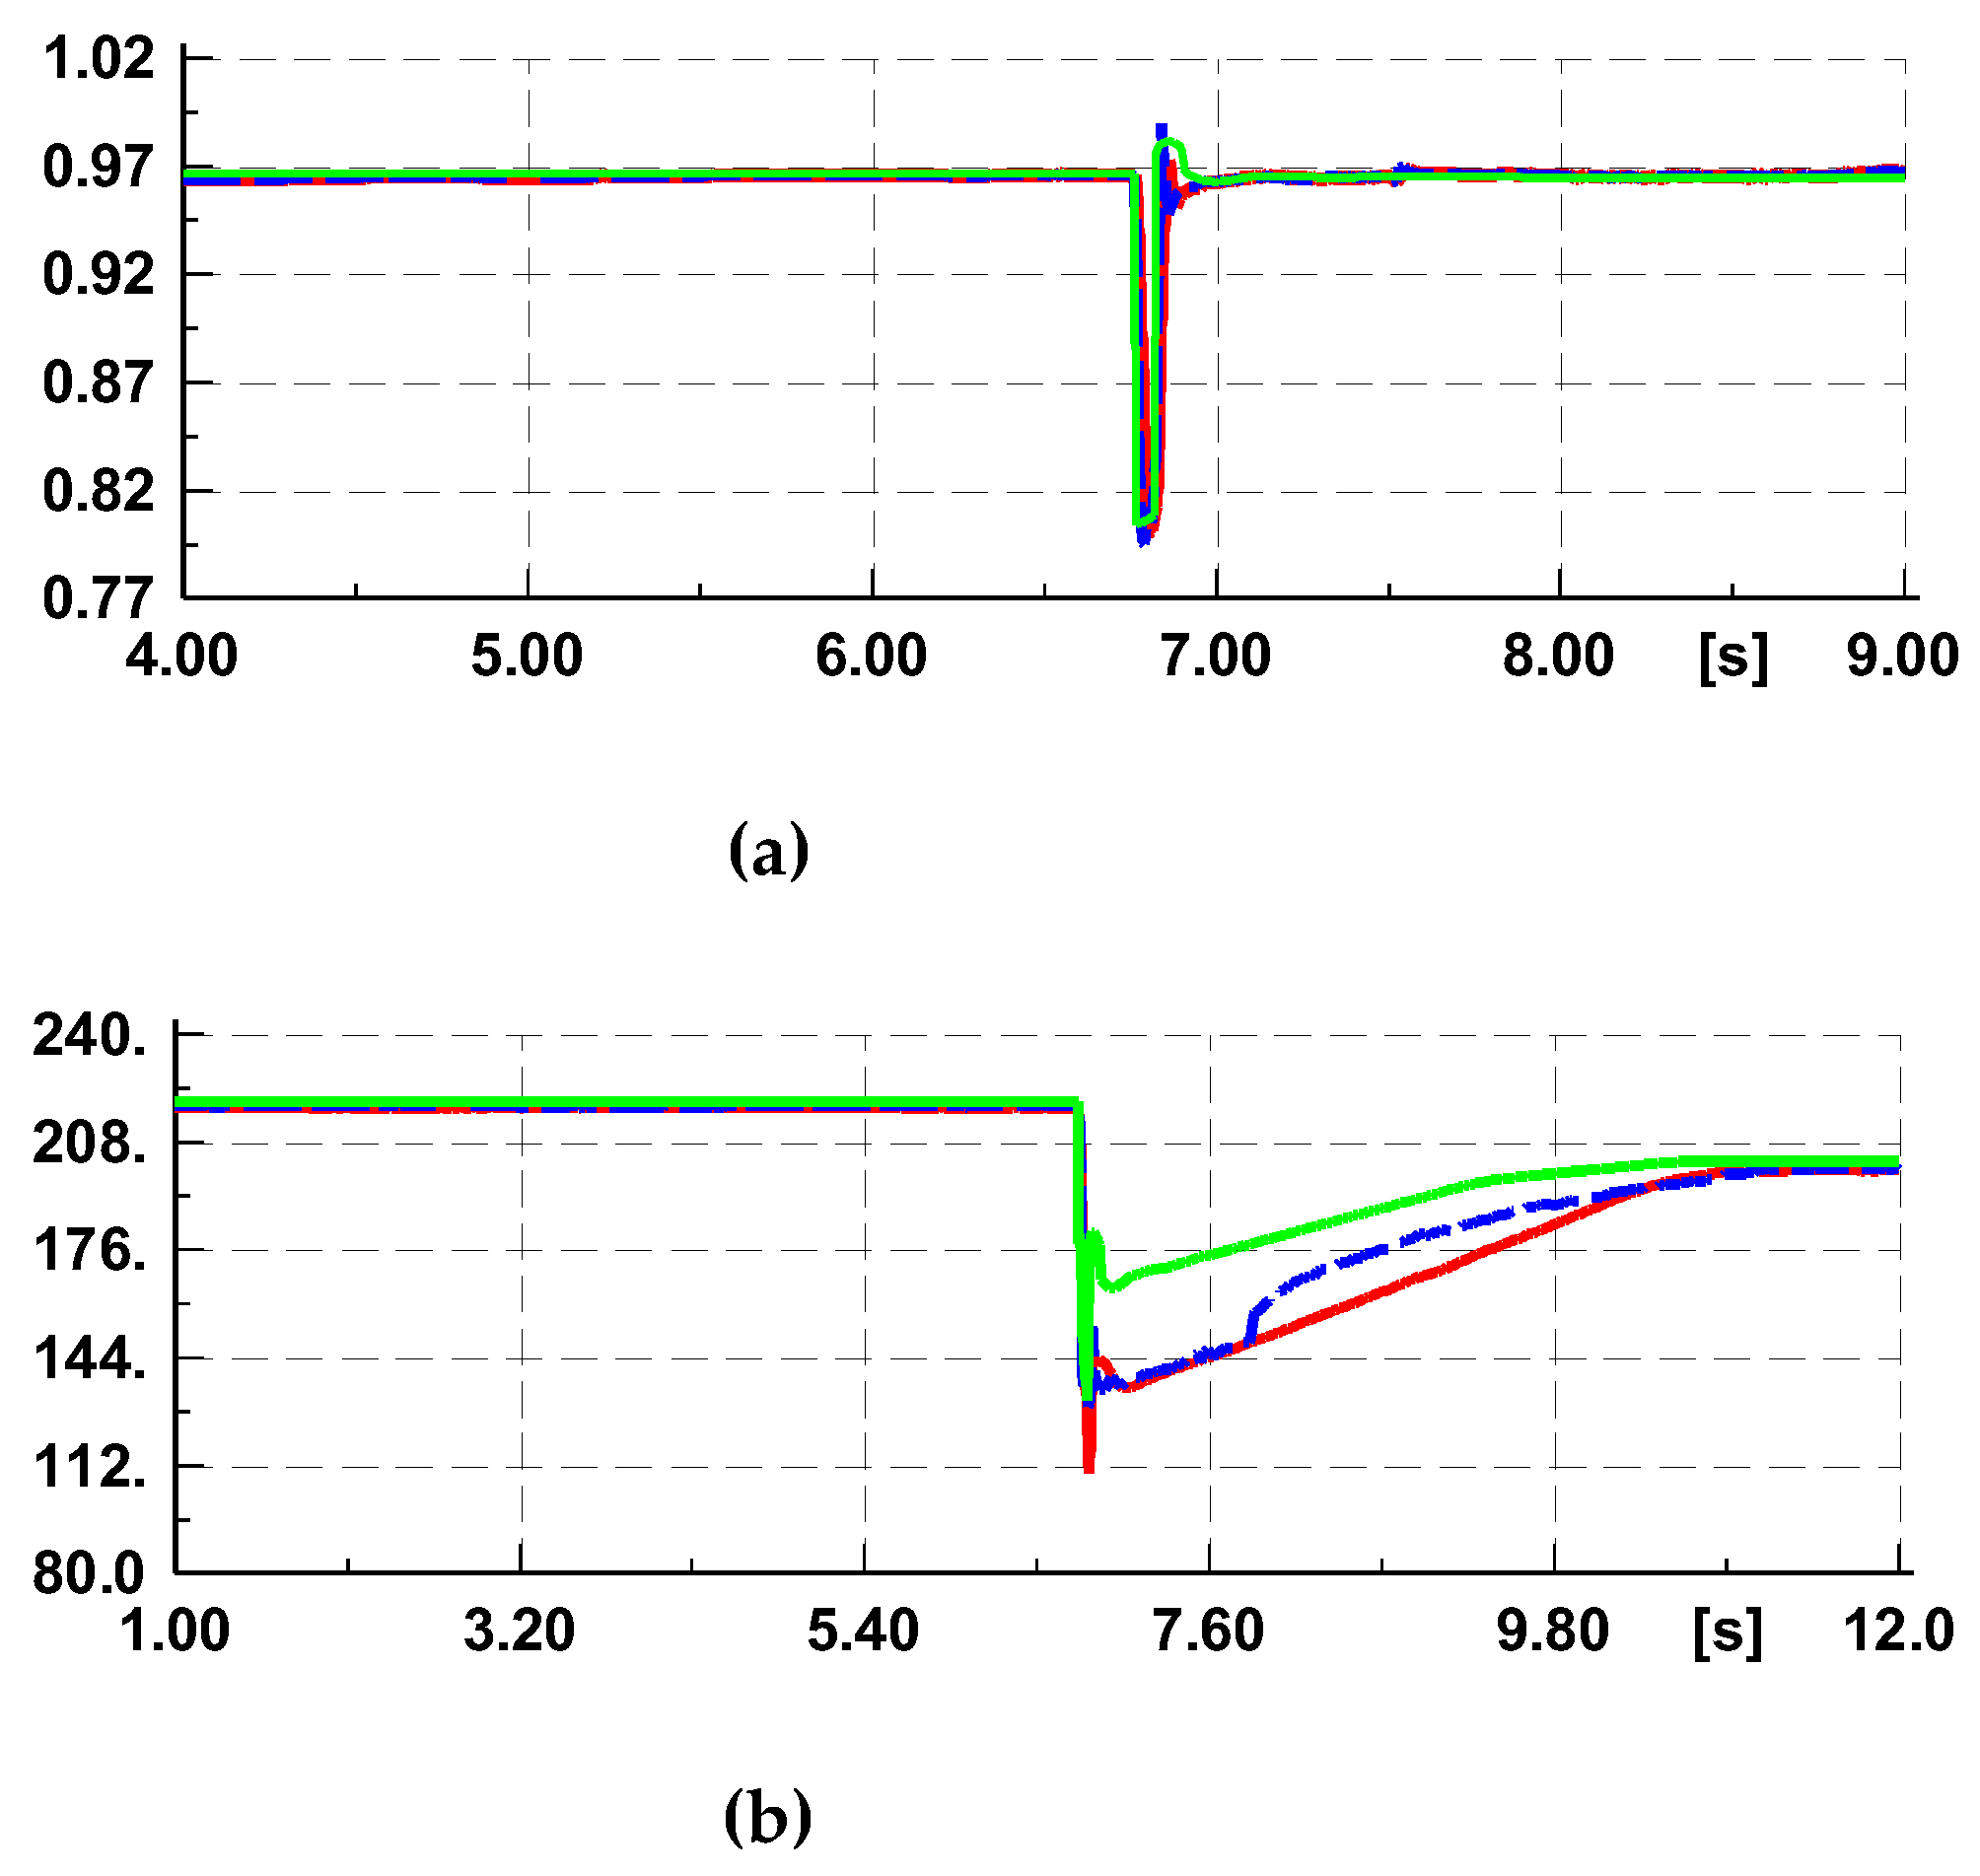

Table 1.
Comparison of hybrid dynamic simulation methods.
| Method name | Accuracy of equivalence | Requirement of measured data | Suitable simulation platforms |
|---|---|---|---|
| Direct injection | best | high | little |
| Phase-shifting transformer | good | highest | medium |
| Fast-responding generator | good | low | many |
| Variable impedance | good | low | medium |
| Ideal controlled voltage source | good | highest | many |
Table 2.
Impact of active control parameters on MSE.
| Control part | Parameter | MSE(P) |
|---|---|---|
| PV inverter’s active power control | rrpwr | 0.5571 |
| Tg | 0.3852 | |
| Tpord |
Table 3.
Calibration results of active power control parameters.
| Parameter | Meaning of parameters | Default value [8] | Corrected value |
|---|---|---|---|
| rrpwr | Limit value of active current ramp rate after voltage recovery (p.u/s) | 10.0 | 1.00 |
| Tg | Regulation delay of inverter (s) | 0.02 | 0.01 |
Disclaimer/Publisher’s Note: The statements, opinions and data contained in all publications are solely those of the individual author(s) and contributor(s) and not of MDPI and/or the editor(s). MDPI and/or the editor(s) disclaim responsibility for any injury to people or property resulting from any ideas, methods, instructions or products referred to in the content. |
© 2024 by the authors. Licensee MDPI, Basel, Switzerland. This article is an open access article distributed under the terms and conditions of the Creative Commons Attribution (CC BY) license (http://creativecommons.org/licenses/by/4.0/).
Copyright: This open access article is published under a Creative Commons CC BY 4.0 license, which permit the free download, distribution, and reuse, provided that the author and preprint are cited in any reuse.


