Submitted:
25 June 2025
Posted:
26 June 2025
Read the latest preprint version here
Abstract
The rise in energy use and industrial activities emitting CO2 has become a major environmental concern globally. This study examines Azerbaijan’s current efforts in reducing carbon emissions and promoting sustainable development, offering strategic recommendations for managing the country's carbon footprint. The goal is to help shape more effective policies by analyzing the link between economic activity and environmental impact. Using an econometric model covering the period from 1990 to 2023, the research finds that economic growth in Azerbaijan is associated with an increase in per capita CO2 emissions, driven by heightened industrial output, energy demand, and other economic factors. Additionally, a long-term positive relationship between population growth and emissions per capita highlights growing energy needs, consumer demand, and transportation usage. Given the strong connection between economic expansion and emissions, the findings suggest that it may be too early to confirm the applicability of the Environmental Kuznets Curve in the context of Azerbaijan’s developing economy.
Keywords:
CO2 emissions
; energy consumption
; Kuznets curve
1. Introduction
Carbon footprints significantly influence climate change, with greenhouse gas emissions contributing directly to global warming. According to the World Meteorological Organization (WMO), the decade from 2011 to 2020 was the warmest on record, and CO₂ emissions increased by 31% between 1990 and 2005. By 2008, these emissions had intensified the Earth’s radiative forcing by 35% compared to 1990 levels (WMO, 2023). The Paris Agreement, an international climate accord adopted by 196 countries at COP21, came into force on November 4, 2016. Its main aim is to keep global temperature increases well below 2°C above pre-industrial levels, ideally limiting the rise to 1.5°C (UNCC, 2016). As the largest contributor to global emissions, the energy sector is critical in addressing the climate crisis. Since the signing of the United Nations Framework Convention on Climate Change in 1992, CO₂ emissions from energy and industrial sectors have surged by 60%, despite numerous global initiatives aimed at curbing them. Effectively managing carbon footprints is essential to mitigating global climate change. One of the key environmental concerns is the release of CO₂ into the atmosphere due to expanding energy use and industrialization. This issue is particularly pressing in developing countries, where rapid economic growth often exacerbates environmental degradation. In Azerbaijan, increased industrial activity and economic expansion have led to noticeable changes in CO₂ emissions in recent years. Given the country’s reliance on fossil fuels, its carbon emissions remain high. As such, it is important to assess Azerbaijan’s per capita CO₂ emissions from both environmental and economic perspectives.This study aims to examine the influence of various economic and environmental factors on per capita CO₂ emissions in Azerbaijan using econometric modeling. Identifying the main variables driving these emissions and assessing their impact across different economic sectors is crucial. The research findings will support the formulation of strategies to manage the country’s carbon footprint and provide insights for enhancing Azerbaijan’s environmental policies and reducing carbon emissions.
2. Carbon Footprint: International Outlook
Carbon dioxide, a greenhouse gas, is the main driver of climate change and rising temperature. As of 2022, the United States was the largest historical emitter having released 427 billion metric tons of carbon dioxide (GtCO₂) since the industrial revolution, meanwhile China is the second with over 260 GtCO₂ (Tiseo, 2023). China’s carbon dioxide emissions have five folded since 1990 and the country is responsible for about 34% of global CO₂ emissions by 2023. In contrast, CO₂ emissions in the UK have nearly halved compared to 1990 levels. Although developed nations like the UK, the US, Japan, and Germany have seen overall reductions in emissions since 1990, developing regions have experienced huge rises. For instance, in India, emissions have surged nearly fivefold due to rapid economic growth, while Vietnam’s emissions have skyrocketed by 20 times (Tiseo, 2024a). Global CO2 emissions from fossil fuels and industry have risen by more than 60% since 1990, totaling 37.15 billion metric tons (GtCO₂) in 2022 and reaching 53 billion metric tons in 2023. China is the largest emitter of global greenhouse gases, followed by the US. Although it was not always the leading emitter, China`s emissions have surged dramatically in recent decades due to industrialization and economic growth rate. CO₂ emissions in China have risen by over 4 times, whereas the US CO₂ emissions have fell by 2.6% since 1990. Therefore, China was the world’s greatest emitter by a significant margin in 2023, accounting for 30% of global greenhouse gas emissions (Tiseo, 2024; 2024b), (EDGAR, 2024). In 2023, China, US, EU, India, Russia, and Brazil continued to be the largest CO2 emitters globally. Collectively, these countries represent 49.8% of the world’s population, 63.2% of global GDP and 64.2% of global fossil fuel consumption, and 62.7% of global fossil CO2 emissions (EDGAR, 2024). Fossil CO2 made up 73.7% of total greenhouse gas emissions, followed by methane (CH4) at 18.9%, nitrous oxide (N2O) at 4.7%, and fluorinated gases (F-gases) at 2.7% in 2023. Global fossil CO2 emissions have increased by 72.1% since 1990 (EDGAR, 2024).In the EU-27, net greenhouse gas emissions, including those from international aviation, fell by 30% from 1990 to 2021. Projections from EU Member States suggest that net emissions will be reduced by 48% by 2030 from 1990 level. However, there will still be a 7%-point shortfall from the 2030 target. The European Green Deal for Europe set a firm target for achieving climate neutrality by 2050 at the latest and mandates a reduction in net greenhouse gas emissions of at least 55% by 2030 compared to 1990 levels (EEA, 2023).In advanced economies, GDP growth has led to a peak in CO2 emissions in 2007, followed by a decrease.
3. Carbon Footprint: Literature Review
In their groundbreaking work, Meadows et al. (1972) analyzed the interplay between population growth, industrial expansion, and resource use, warning that continued trends could lead to economic and environmental collapse by the century’s end. The study emphasized that economic growth is inherently constrained by the planet’s ecological limits—such as finite natural resources and limited capacity to absorb pollution—and called for regulatory measures to curb overconsumption and environmental degradation. The Kyoto Protocol, implemented in 2005, marked a pivotal step in global climate governance by setting binding emissions reduction targets specifically for industrialized nations. Achieving these goals, however, requires structural changes to national economies, particularly by reducing the size of high-emission sectors and promoting low-carbon industries. Such shifts may come at an economic cost. For example, Chang (2015) found that reducing China’s emissions from 5,707.16 to 5,452.12 million tons would necessitate industrial restructuring, potentially decreasing GDP by 82.59 billion Yuan (approximately USD 11.6 billion in Dinda and Coondoo (2006) examined CO₂ emissions and income in 88 countries (1960–1990), identifying long-term cointegration between the two. They found regional variations in causality: income drove emissions in Central America; emissions influenced income in Europe; and a bidirectional relationship existed in Africa. Their earlier research (2002) challenged the EKC hypothesis and noted that developed nations typically saw causality running from emissions to income, while developing countries often experienced the reverse or a two-way relationship. In the Iranian context, Lotfalipour et al. (2010) found that both economic growth and fossil fuel consumption influenced emissions in the short term (1967–2007), stressing the need for clean energy strategies.Hasanov, Bulut, and Suleymanov (2017) analyzed energy consumption and growth in 10 oil-exporting Eurasian countries. Their results showed that energy use was a major driver of economic activity, especially in economies reliant on oil. The authors called for diversification and greater energy efficiency to ensure sustainable development. In a related study, Hasanov et al. (2019) found evidence of the EKC in Kazakhstan, where emissions eventually declined after surpassing a certain income threshold, underscoring the importance of technology and regulation in balancing growth and environmental protection.Nordin and Sek (2019), using panel data from 13 oil-importing and 11 oil-exporting countries, confirmed that energy consumption closely tracks economic growth, particularly in oil-exporting nations. These countries face greater challenges in reducing emissions due to their dependence on fossil fuels. In contrast, oil importers have more flexibility to shift to cleaner energy sources. Still, both groups show that energy consumption is tightly bound to growth, requiring innovative solutions to decouple emissions from economic development.
4. Econometric Assessment of Carbon Footprints in Azerbaijan: Methodology
Data and descriptive statistics: Data and Descriptive Statistics
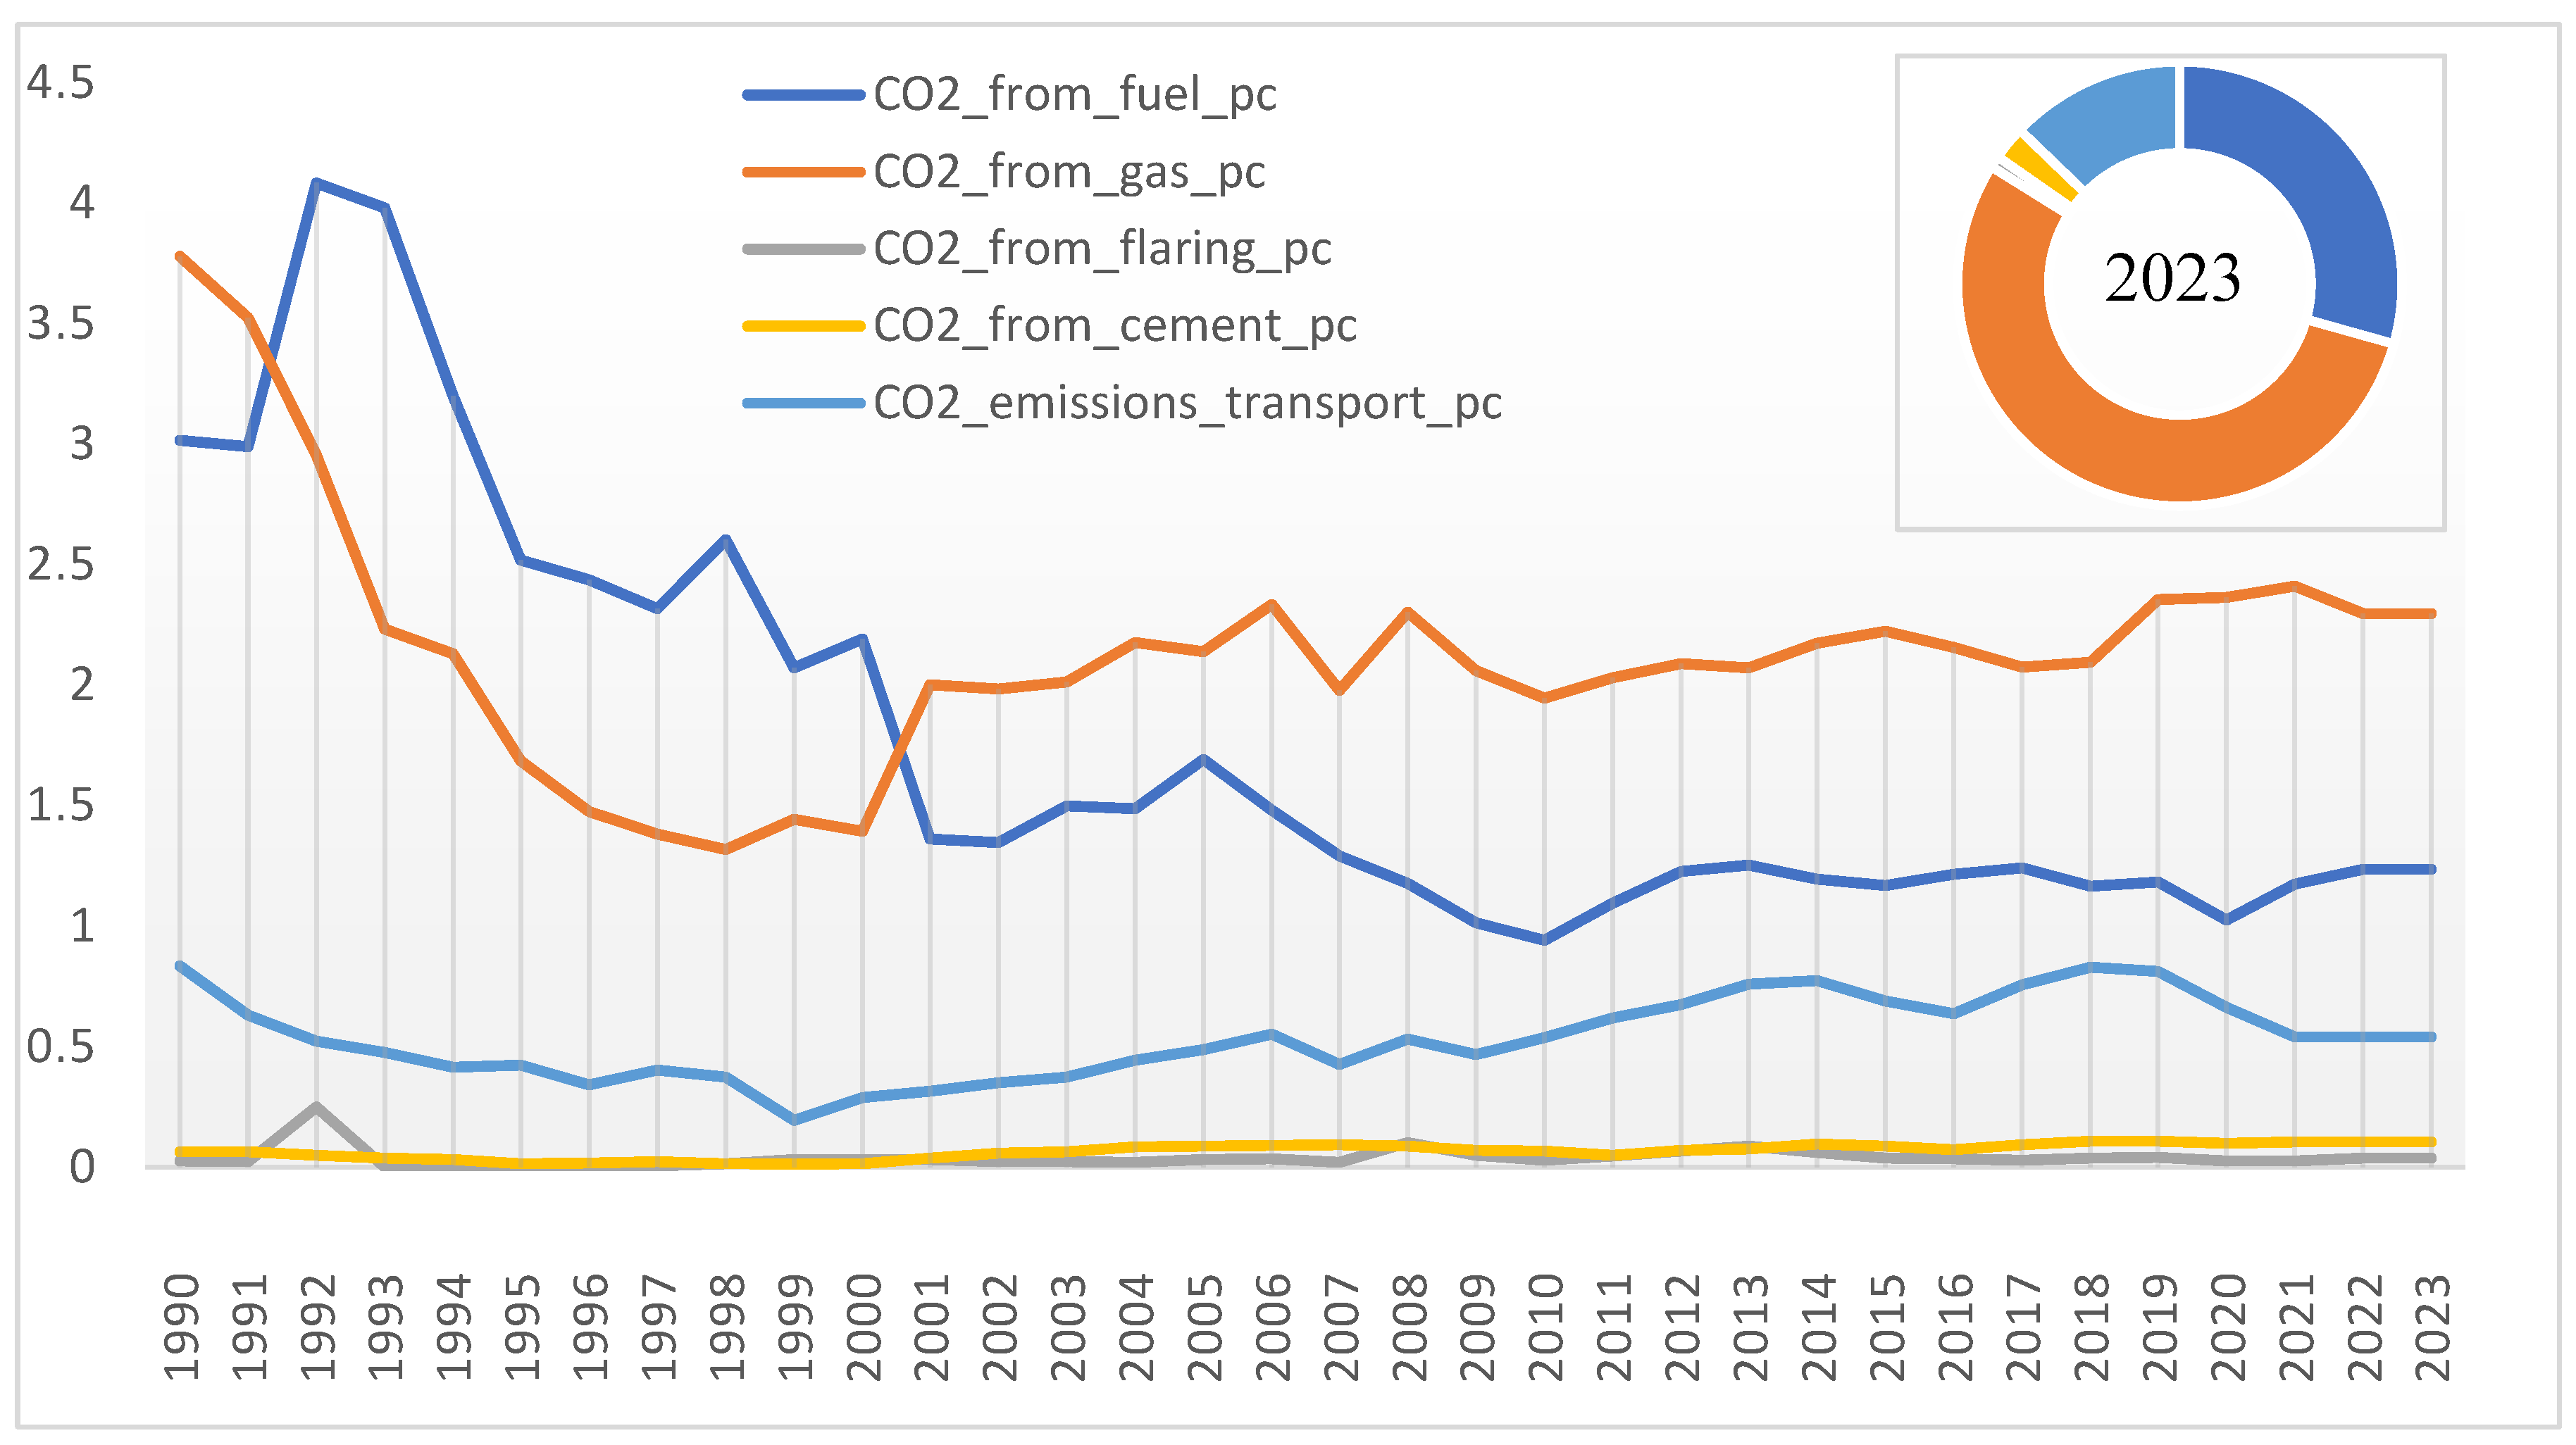
Figure 1 illustrates the trends in carbon footprints across various sectors in Azerbaijan from 1990 to 2023. The data indicates a general decline in nearly all categories of carbon emissions since 1990. This downward trend has been the subject of extensive academic discussion, with several studies attributing the decline to factors such as the economic and industrial stagnation that followed the collapse of the Soviet Union. However, it is important to note that the observed reduction may present a somewhat misleading picture. The data reflects per capita carbon dioxide emissions, and discrepancies between population growth and economic development must be taken into account. Given the non-linear relationship between these variables and atmospheric emissions, simplistic interpretations may overlook underlying complexities.As shown in the figure, although carbon dioxide emissions declined across most sectors during the 1990s, a notable rise in gasoline consumption has been observed since the early 2000s. The transport sector, in particular, has experienced a steady upward trend in emissions. Nevertheless, these increases appear to have stabilized at a relatively consistent level in the decades following the initial surge.
In Figure 1, the main share of the amount of carbon dioxide emissions in 2023 falls on the share of gasoline consumption, which makes 55%.
For the period 1990-2023 GDP rate, population change, total carbon dioxide emissions, per capita CO2 emissions from transportation, cement production, fuel and gasoline consumption, as well as per capita fossil fuel consumption, electricity from renewable energy resources (terawatt/hour), graphs of percentage of use of renewable resources in electricity production of the country are shown in Figure 2. First, let’s try to explain the trends in the graph in a coherent way. In general, the amount of carbon dioxide per person for the period 1990-2023 in the country was between 7-8 tons per year in the early 90s, but as a result of a dramatic decrease by 2010, it settled between 3-4 tons and by 2023 this stability has been maintained. Along with these time series, the population growth rate was 7 million in 1990. 10 million people in 2023. level with a stable trend. At the same time, the decrease in the population growth rate has been observed more prominently in recent years. However, we cannot say the same for GDP per capita. Because, during this time series, there was a decline until 95, a gradual increase between 1995 and 2005, a dramatic increase between 2005 and 2010, and then stability until 2023. The graph shows a high acceleration of the GDP growth rate mainly between 1993-1997, and then in 2004-2006.
Conclusion and suggestions
The analysis demonstrates that per capita fossil fuel consumption has a substantial impact on carbon dioxide (CO₂) emissions in Azerbaijan. According to the regression results, each additional kilowatt-hour of fossil fuel consumption per capita leads to a 0.55-unit increase in total CO₂ emissions. Moreover, the model shows that approximately 75% of the effect of natural or policy-induced shocks on CO₂ emissions is corrected in the subsequent period, suggesting a strong tendency for emissions to revert to their long-run trend.
To date, Azerbaijan lacks a comprehensive time series analysis examining the dynamic relationship between income and CO₂ emissions. Addressing this gap, the present study applied a cubic functional form, consistent with the Environmental Kuznets Curve (EKC) framework, to ensure accuracy and policy relevance. To strengthen the robustness of the results, five different econometric techniques were used, and potential small sample size biases were addressed. The empirical results confirm a long-run relationship between income and CO₂ emissions in Azerbaijan. Although the data revealed a U-shaped curve, the turning point lies beyond the study period (1992–2013), indicating that CO₂ emissions continue to rise with income. This finding suggests that the EKC hypothesis does not yet apply to Azerbaijan’s current stage of development. Given the country’s status as a developing, fossil fuel-dependent economy, substantial income growth is still needed before emissions might begin to decline. The one-to-one long-run relationship between income and emissions implies that without targeted environmental policy, economic growth will likely continue to drive up CO₂ levels. As such, growth strategies centered around heavy industries—particularly oil, coal, and metals—risk further environmental degradation. Alternatively, prioritizing the expansion of low-carbon sectors such as services and information technologies would be more conducive to sustainable development.
In conclusion, this study emphasizes the importance of integrating environmental considerations into economic policy. To mitigate emissions effectively, Azerbaijan should:
- Reduce dependence on fossil fuels,
- Increase the share of renewables in the energy mix,
- Implement strong environmental regulations, including carbon taxation, emissions trading systems, and carbon capture initiatives.
These measures will be essential for aligning economic development with environmental sustainability and positioning Azerbaijan on a more climate-resilient path.
References
- Begum, R.A. , Sohag, K., Abdullah, S.M.S. and Jaafor, M. (2015), “CO2 emissions, energy consumption, economic and pollution growth in Malaysia”, Renewable and Sustainable Energy Reviews, Vol. 41, pp. [CrossRef]
- Chang, N. Changing industrial structure to reduce carbon dioxide emissions: a Chinese application. J. Clean. Prod. 2015, 103, 40–48. [Google Scholar] [CrossRef]
- Chen, J.H. and Huang, Y.-F. (2014), “Nonlinear environment and economic growth nexus: a panel smooth transition regression approach”, Journal of International and Global Economic Studies, Vol. 7 No. 2, pp. 1-16.
- Coondoo, D.; Dinda, S. Causality between income and emission: a country group-specific econometric analysis. Ecol. Econ. 2002, 40, 351–367. [Google Scholar] [CrossRef]
- Dinda, S.; Coondoo, D. Income and emission: A panel data-based cointegration analysis. Ecol. Econ. 2006, 57, 167–181. [Google Scholar] [CrossRef]
- Dogru, T.; Bulut, U.; Kocak, E.; Isik, C.; Suess, C.; Sirakaya-Turk, E. The nexus between tourism, economic growth, renewable energy consumption, and carbon dioxide emissions: contemporary evidence from OECD countries. Environ. Sci. Pollut. Res. 2020, 27, 40930–40948. [Google Scholar] [CrossRef] [PubMed]
- Dong, B.; Ma, X.; Zhang, Z.; Zhang, H.; Chen, R.; Song, Y.; Shen, M.; Xiang, R. Carbon emissions, the industrial structure and economic growth: Evidence from heterogeneous industries in China. Environ. Pollut. 2020, 262, 114322. [Google Scholar] [CrossRef] [PubMed]
- EDGAR (2022). CO2 emissions of all world countries, 2022 report. EDGAR - Emissions Database for Global Atmospheric Research. European Commission. https://edgar.jrc.ec.europa. 2022.
- EDGAR (2024). GHG emissions of all world countries 2024 report. European Commission. https://edgar.jrc.ec.europa. 2024.
- EEA (2023) Total net greenhouse gas emission trends and projections in Europe, published 24 Oct 2023, European Environment Agency, https://www.eea.europa.
- Grossman, G.; Krueger, A. Environmental Impacts of a North American Free Trade Agreement. NBER Working Paper No. 3914; National Bureau of Economic Research, Inc.: Cambridge, MA, USA, 1991. [Google Scholar]
- Hossain, S. (2014), “Multivariate granger causality between economic growth, electricity consumption, exports and remittance for the panel of three SAARC countries”, European Scientific Journal, Vol. 8, pp. 349-376.
- Hasanov, F.J.; Mikayilov, J.I.; Mukhtarov, S.; Suleymanov, E. Does CO2 emissions–economic growth relationship reveal EKC in developing countries? Evidence from Kazakhstan. Environ. Sci. Pollut. Res. 2019, 26, 30229–30241. [Google Scholar] [CrossRef] [PubMed]
- Hasanov, F.; Bulut, C.; Suleymanov, E. Review of energy-growth nexus: A panel analysis for ten Eurasian oil exporting countries. Renew. Sustain. Energy Rev. 2017, 73, 369–386. [Google Scholar] [CrossRef]
- IEA (2021) Net Zero by 2050: A Roadmap for the Global Energy Sector, INTERNATIONAL ENERGY AGENCY https://www.iea. 2050.
- IEA (2024), The relationship between growth in GDP and CO2 has loosened; it needs to be cut completely, IEA, Paris https://www.iea.org/commentaries/the-relationship-between-growth-in-gdp-and-co2-has-loosened-it-needs-to-be-cut-completely, Licence: CC BY 4.
- Lee, J.W.; Brahmasrene, T. Investigating the influence of tourism on economic growth and carbon emissions: Evidence from panel analysis of the European Union. Tour. Manag. 2013, 38, 69–76. [Google Scholar] [CrossRef]
- Liddle, B. What are the carbon emissions elasticities for income and population? Bridging STIRPAT and EKC via robust heterogeneous panel estimates. Glob. Environ. Chang. 2015, 31, 62–73. [Google Scholar] [CrossRef]
- Lotfalipour, M.R.; Falahi, M.A.; Ashena, M. Economic growth, CO2 emissions, and fossil fuels consumption in Iran. Energy 2010, 35, 5115–5120. [Google Scholar] [CrossRef]
- Meadows, D.H.; Meadows, D.L.; Randers, J.; Behrens, W.W. The Limits to Growth. A Report for the Club of Rome’s Project on the Predicament of Mankind; Universe Books: New York, NY, USA, 1972; ISBN 0876631650. [Google Scholar]
- Nordin, S.K.B.S.; Sek, S.K. Investigating the Relationship on CO2, Energy Consumption and Economic Growth: A Panel Data Approach. J. Rev. Glob. Econ. 2019, 8, 637–642. [Google Scholar] [CrossRef]
Disclaimer/Publisher’s Note: The statements, opinions and data contained in all publications are solely those of the individual author(s) and contributor(s) and not of MDPI and/or the editor(s). MDPI and/or the editor(s) disclaim responsibility for any injury to people or property resulting from any ideas, methods, instructions or products referred to in the content. |
© 2025 by the authors. Licensee MDPI, Basel, Switzerland. This article is an open access article distributed under the terms and conditions of the Creative Commons Attribution (CC BY) license (https://creativecommons.org/licenses/by/4.0/).
Copyright: This open access article is published under a Creative Commons CC BY 4.0 license, which permit the free download, distribution, and reuse, provided that the author and preprint are cited in any reuse.


