
Submitted:
16 October 2024
Posted:
17 October 2024
You are already at the latest version
Abstract
Light quality within greenhouses is a critical factor for crop development and is essential for optimal photosynthetic activity. Modifying the optical properties of cover materials can significantly enhance crop performance. This study aimed to assess the effects of an experimental plastic cover, characterized by high transmittance of photosynthetically active radiation (PAR) and high light diffusivity, on the growth, yield, fruit quality, photosynthetic activity, and fungal disease incidence in two cucumber (Cucumis sativus L.) crops. The trials were conducted over two consecutive autumn-winter crop seasons in a multispan greenhouse divided into two sectors, separated by a vertical polyethylene sheet. The experimental plastic cover was installed in the West sector (40 m × 25 m), while a standard commercial cover was used in the East sector (40 m × 20 m). Results demonstrated that plants grown under the experimental cover exhibited an 8.5% and 15.3% increase in photosynthetic activity during the first and second crop seasons, respectively. PAR radiation at the canopy level was also higher in the experimental sector by 8% and 10.5% across both seasons. Additionally, marketable yield increased by 4.2% in the first season and 14.3% in the second season under the experimental cover. No significant differences were observed in fruit quality and plant growth parameters between the two sectors. The experimental plastic cover, with its high PAR transmittance and light diffusivity, enhanced the internal light environment of the greenhouse without incurring additional costs. This improved light environment positively influenced photosynthetic activity and yield in cucumber crops. Furthermore, a lower incidence of fungal diseases was observed in plants grown under the experimental cover during both crop cycles.
Keywords:
Greenhouse cover plastic
; PAR transmittance
; diffusivity
; photosynthetic activity
; cucumber
1. Introduction
Greenhouse production is often associated with high operational costs, particularly during off-season cultivation and when climate control systems rely on fossil fuels. In the Mediterranean region, specifically in Almeria, Spain, passive climate control systems are widely used. These systems do not require external energy inputs, thereby reducing the overall cost of crop production [1]. Almeria is the Mediterranean region with the highest concentration of greenhouses in Europe, covering 33,635 hectares [2]. These greenhouses are predominantly covered with plastic films, a common choice in warm climates like the Mediterranean.
Solar radiation is a key factor for agricultural crops, providing the necessary energy for photosynthesis, biochemical processes, and cell elongation [3]. Under adequate CO₂ concentration and optimal greenhouse temperatures, photosynthetic activity is primarily driven by light intensity. Consequently, solar radiation is the most critical factor for plant growth due to its direct impact on photosynthesis [4]. Photosynthesis supports plant growth, biomass accumulation, germination, and flowering, among other functions that depend not only on the quantity but also on the quality of light [5]. The photosynthetic rate of leaves is determined by the amount of photosynthetic protein per unit leaf area and the stomatal conductance of CO₂ [6]. Plants grown under low light conditions are more susceptible to photo inhibition than those grown under high light intensity [7]. Generally, increases in net photosynthetic rate correspond to increases in light intensity. To adapt to varying light environments, plants have developed numerous mechanisms, including morphological and physiological changes at the leaf level [8]. Low light levels can lead to an increase in specific leaf area and plant height, adaptations that enhance light capture and meet the photosynthetic demand [9].
Recent advancements have focused on developing greenhouse cover materials that modify light properties, such as photo-selective plastics, UV-blocking films, and high light diffusivity covers. These innovative covers can minimize energy losses and enhance crop yields without additional energy input [10,11,12]. Plastic covers designed to improve both the quality and quantity of light reaching the crops offer a significant advantage in promoting plant growth and productivity compared to traditional covers [13].
Selecting the appropriate greenhouse cover material is crucial for optimizing protected crop development, as the optical properties of these materials directly influence the greenhouse microclimate [14]. Transmittance is considered the most critical optical property, as increasing the cover's transmittance enhances photosynthesis and yield while reducing energy requirements during colder periods [15]. The transmittance of polyethylene (PE) plastic covers ranges between 70% and 90%. Ideally, a cover material should allow 100% transmission of photosynthetically active radiation, which is efficiently utilized by plants in the photosynthesis process [16]. The average PAR transmittance of a single-layer plastic-covered tunnel greenhouse is approximately 80% on cloudy days and 78% on sunny days [17]. To leverage diffuse light in greenhouses, diffuse cover materials are used to increase light diffusion without reducing overall light transmission [18]. Diffuse cover materials, which can transform 45-71% of direct light into diffuse light, create more homogeneous light profiles, leading to improved crop growth and yields [19,20,21]. Additionally, diffuse light results in lower leaf and flower temperatures and reduced photo inhibition, due to less severe local peaks in light intensity [20,22,23]. Photosynthetic processes can be 10-15% more efficient under diffuse light compared to direct light [24].
Different radiometric properties of cover materials have distinct effects on the greenhouse microclimate and crop yield [25]. The use of energy-efficient cover materials, which alter light transmittance [26], can reduce cooling and heating needs [27,28]. Appropriate greenhouse cover materials can lower annual cooling and heating loads by 9.8% and 6.3%, respectively [29]. Furthermore, innovative cover materials can not only reduce production costs and mitigate negative impacts on total yield but can also improve fruit quality when combined with optimal time of harvest [30].
The initial hypothesis of this study is that using an experimental plastic cover with high PAR transmittance and high light diffusivity will improve radiation conditions inside the greenhouse, thereby enhancing photosynthetic activity in cucumber crops. This enhancement is expected to increase production, profitability, and economic and environmental sustainability, as this approach does not involve additional energy expenditure. Therefore, the objective of this study was to investigate the impact of an experimental plastic cover with high PAR transmittance and high light diffusivity on photosynthetic activity, plant development, yield, and fruit quality of cucumber (Cucumis sativus L.) during two consecutive autumn-winter seasons in a Mediterranean greenhouse. Additionally, the study assessed the effects of the experimental plastic cover on the main fungal diseases that commonly affect cucumber crops, as these findings are crucial for determining the crop's overall development [31].
2. Materials and Methods
2.1. Experimental Site
The present investigation was carried out during the autumn-winter seasons of 20/21 and 21/22 at the Centre for Innovation and Technology Transfer ‘Fundación UAL-ANECOOP’ (Latitude: 36°51’53.2” N. Longitude: 2°16’58.8” W; Altitude: 87 m). A multispan greenhouse (1800 m2 – orientation: 118°N) was divided into two similar sectors (East and West sectors) by a vertical plastic sheet. Ventilation is controlled by Synopta Software 5.4.2.3931422 (Ridder Growing Solutions B.V., Maasdijk, The Netherlands), a centralised climate control and data logging system with a weather station. The outside climatic parameters were measured by a meteorological station located 135 m North of the experimental greenhouse (Table 3) during the two crop seasons (Figure 1, Figure 2, Figure 3, Figure 4, Figure 5 and Figure 6).
The greenhouse had roof vents in the first crop season, while in the second crop season side vents were installed on both sides of the greenhouse (North and South). As a result of the new side vents, the ventilation surface increased in both sectors of the greenhouse (Table 1).
The experimental plastic cover (AA Politiv (1999) Ltd., Kibbutz Einat, Israel) was installed in the West sector, while the commercial plastic cover was installed in the East sector. Both plastic covers were developed by Politiv Europe S.L. (Israel) according to the standards UNE-EN 13206:2017 [32] and ASTMD 1003-13 [33] for optical properties (Table 2). Modifying the optical properties of the experimental plastic cover did not increase the cost.
The average service life of plastic covers is estimated to be four seasons in central North Europe and two to three seasons in the Mediterranean regions [34,35]. Emekli et al. [34] determined an initial PAR transmittance of 80.1-83% and losses in PAR transmittance were 4.9-6.2% at the end of the service life. In our case, both cover plastics were in their second year of service life; at that time, the optical properties of the experimental cover plastic will not have deteriorated.
2.2. Crop System
To determine the influence of plastic cover on cucumber crops (Cucumis sativus L.), two consecutive autumn-winter seasons with the commercial variety Insula (Rijk Zwaan Iberica, S.A., Almeria, Spain) were carried out. The transplant was carried out on 4 September 2020 in the first crop season and on 8 September 2021 in the second. In both crop seasons, plants develop in ‘arenado’ sand mulched soil, which is stratified soil that is commonly used in Almeria greenhouses [1]. The plant density was 1.2 plants/m2, with the cultivation lines perpendicular to the ridge of the greenhouse. Fertigation was applied uniformly in both sectors by drip irrigation and managed in both experimental sectors by the SUPRA irrigation controller (Hermisan, Alicante, Spain). Cucumber crop management tasks (cleaning, trellising, pruning and harvesting) were carried out at the same time in both sectors. The total period in both cucumber crop seasons was 18 weeks.
2.3. Microclimate Measurement Equipment
To compare the effect of the two plastic covers on the greenhouse microclimate, six HOBO® Pro Temp-HR U23-001 (Onset Computer Corp., Pocasset, MA, USA) with temperature and humidity sensors (Table 3) on the midvertical profiles of both sectors at a height of 1 m in the three central spans of the greenhouse. The autonomous HOBO air temperature and humidity sensors were protected from solar radiation by open boxes.

Table 3.
Characteristics of all sensors used for microclimate measurements.
| Parameter | Sensor | Manufacturer | Rank | Accuracy |
|---|---|---|---|---|
| Outside climatic parameters measured at the weather station | ||||
| Outside solar radiation | Kipp Solari−MII | HortiMax B.V. (Maasdiijk, Holland) |
±2000 W m–2 | ±5% or ±20W m–2 |
| Wind speed | Anemometer−MII | 0−40 ms–1 | ±5% | |
| Wind direction | Vane Meteostation II | 0−360 ° | ±5° | |
| Outside temperature | Pt1000 IEC 751 1/3B | Vaisala Oyj (Helsinki, Finland) |
–25 –75 °C | ±0.2 °C |
| Outside humidity | HUMICAP HMT100 | 0–100% | ±2.5% | |
| Inside climate parameters | ||||
| Inside air temperature | HOBO® Pro Temp-HR U23-001 | Onset Computer Corp. (Pocasset, USA) |
–4 –70 °C ±0.18 °C |
0 −100% ±2.5% |
| Inside relative humidiy | ||||
2.4. Measurement of Photosynthesis Activity
Twelve plants were randomly selected in each experimental sector on each measurement day and photosynthetic activity was measured at intermediate plant height, on mature and fully expanded leaves [36] following the methodology used by Jiang et al. [37]. The equipment used was a portable LCi SD analyser (ADC BioScientific Limited, Hertfordshire, United Kingdom) equipped with an IRGA CO2 and H2O concentration sensor (infrared gas analysis; with a CO2 measurement range of 0 to 2000 ppm, 0 to 75 mbar H20, with accuracy ± 2 %; and PAR radiation of 0 to 3000 m-2 s-1). The photosynthetic rate, the evapotranspiration rate, the concentration of CO2 in the leaf environment, the PAR radiation reaching the leaf surface, the leaf temperature, and the stomatal conductance were measured. The data reading route was different for each measurement day and was randomly assigned to avoid the position of the sun altering the measurements. Furthermore, data were always recorded during the same time interval, between 12:00 and 12:30 hours.
2.5. Measurement Equipment for Crop Development and Yield Analysis
To evaluate crop development, groups of four plant lines with four plants per line (16 plants) were randomly selected in each sector. To be able to determine the growth adequately, the same selected plants were measured on each measurement day. The instruments used were a tape measure and a digital gauge with a measuring range of 0 to 150 mm and an accuracy of 0.01 mm (Medid Precision, SA, Spain). The morphological parameters measured every 15 days (in the same plants) were: distance from the apical meristem of the plant to the last node (NT), which was measured considering the last node under the last leaf at physiological maturity; total length of the stem (LS), calculated from NT and the distance from the last node to the ground; length of two internodes (LI), measured below the last leaf at physiological maturity; stem diameter (DS) and number of nodes (NN).
To determine cucumber yield, marketable and non-marketable yields were weighted every week. Four plants lines (R1-R4 considered statistical repetitions) for each sector were selected and the yield collected in these lines was weighted with a Mettler Toledo electronic scale (Mettler-Toledo, SAE, Spain) with a sensitivity of 20 g and a maximum capacity of 60 kg.
For the evaluation of the quality of the fruit, ten cucumbers were randomly selected from each sector and harvest. Weight measurements (WF) were performed using an electronic scale PB3002-L (Delta Range®; Mettler Toledo, SA, L’Hospitalet de Llobregat, Spain, with a sensitivity of 0.1 g); the diameter of the fruit (DF) using a 150 mm digital gauge (Medid Precision, SA, Barcelona, Spain); the length of the fruit (LF) using a measuring tape and the content of soluble solids (TSS) using a refractometer (PAL1, Atago Co. LTD., Fukuoka, Japan, with a precision of ± 0.2 %).
2.6. Development of Fungal Diseases
During the two crop seasons, a parallel trial was carried out to determine the effect of the plastic cover with high PAR transmissivity and high diffusivity on the main fungal diseases that usually attack the cucumber crop [31]. For the design of the trial, the standards of the European and Mediterranean Plant Protection Organisation (EPPO) were followed. For diseases of downy mildew and powdery mildew diseases, EPPO standards PP 1/181 (conduct and reporting of efficacy evaluation trials), PP 1/152 (design and analysis of efficacy evaluation trials), PP 1/57 (powdery mildew in cucurbits) and PP 1/65 (downy mildew of lettuce and other vegetables, PSPECU) are applicable. For more detailed information, consult Ávalos-Sánchez et al. [31].
2.6. Statistical Analysis
The data presented are an average of the results obtained in two independent trials (autumn-winter 2020 and 2021 crop season) with a minimum of 4 replicates for each treatment at yield (harvest date). The growth and photosynthesis parameters of 12 plants were evaluated in each experimental sector and ten cucumber fruits (in each harvest) were used to analyse the quality of the yield. The results were analysed using variance analysis (considered significant if the p value is ≤0.05) and comparing mean values with Fisher’s least significant difference method (LSD). Previously, the normality of the data was assessed using the Kolmogorov-Smirnov test. Bartlett’s, Cochran’s and Hartley’s tests were used to determine whether the two sectors had similar parameter variances. When there was a statistically significant difference between standard deviations, parametric analysis using analysis of variance was not feasible. In this case, a nonparametric analysis was performed with the Friedman test, where each row represents a block (the measurement date) using the box and whisker plot [38].
3. Results
3.1. Microclimate
The microclimatic parameters measured at 1 m height (air temperature, relative humidity and absolute humidity) showed a similar behaviour during the first crop season, with slight differences between the East and West sectors of the greenhouse (Figure 1, Figure 2 and Figure 3).
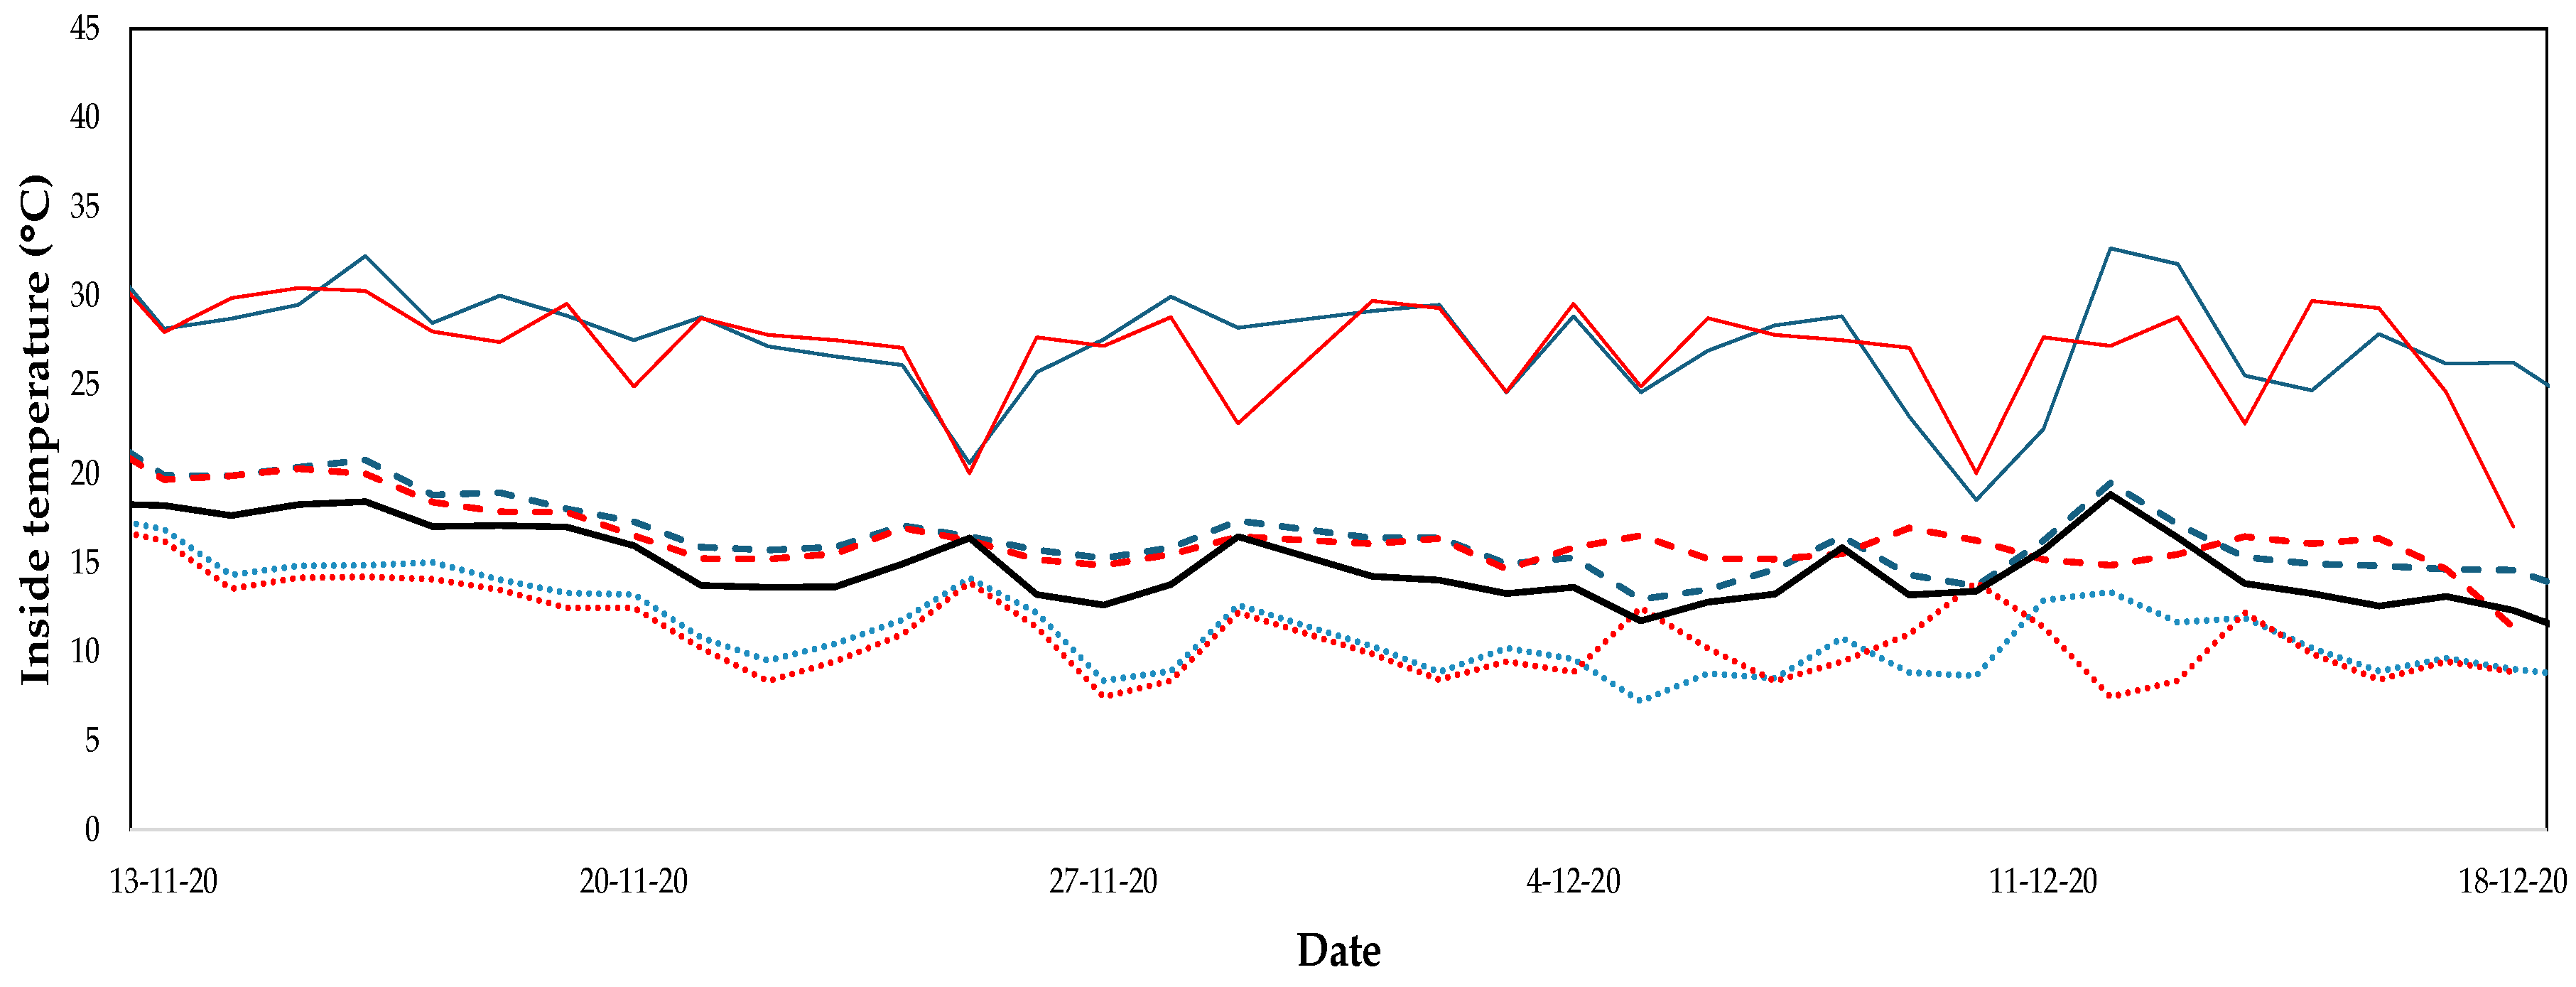
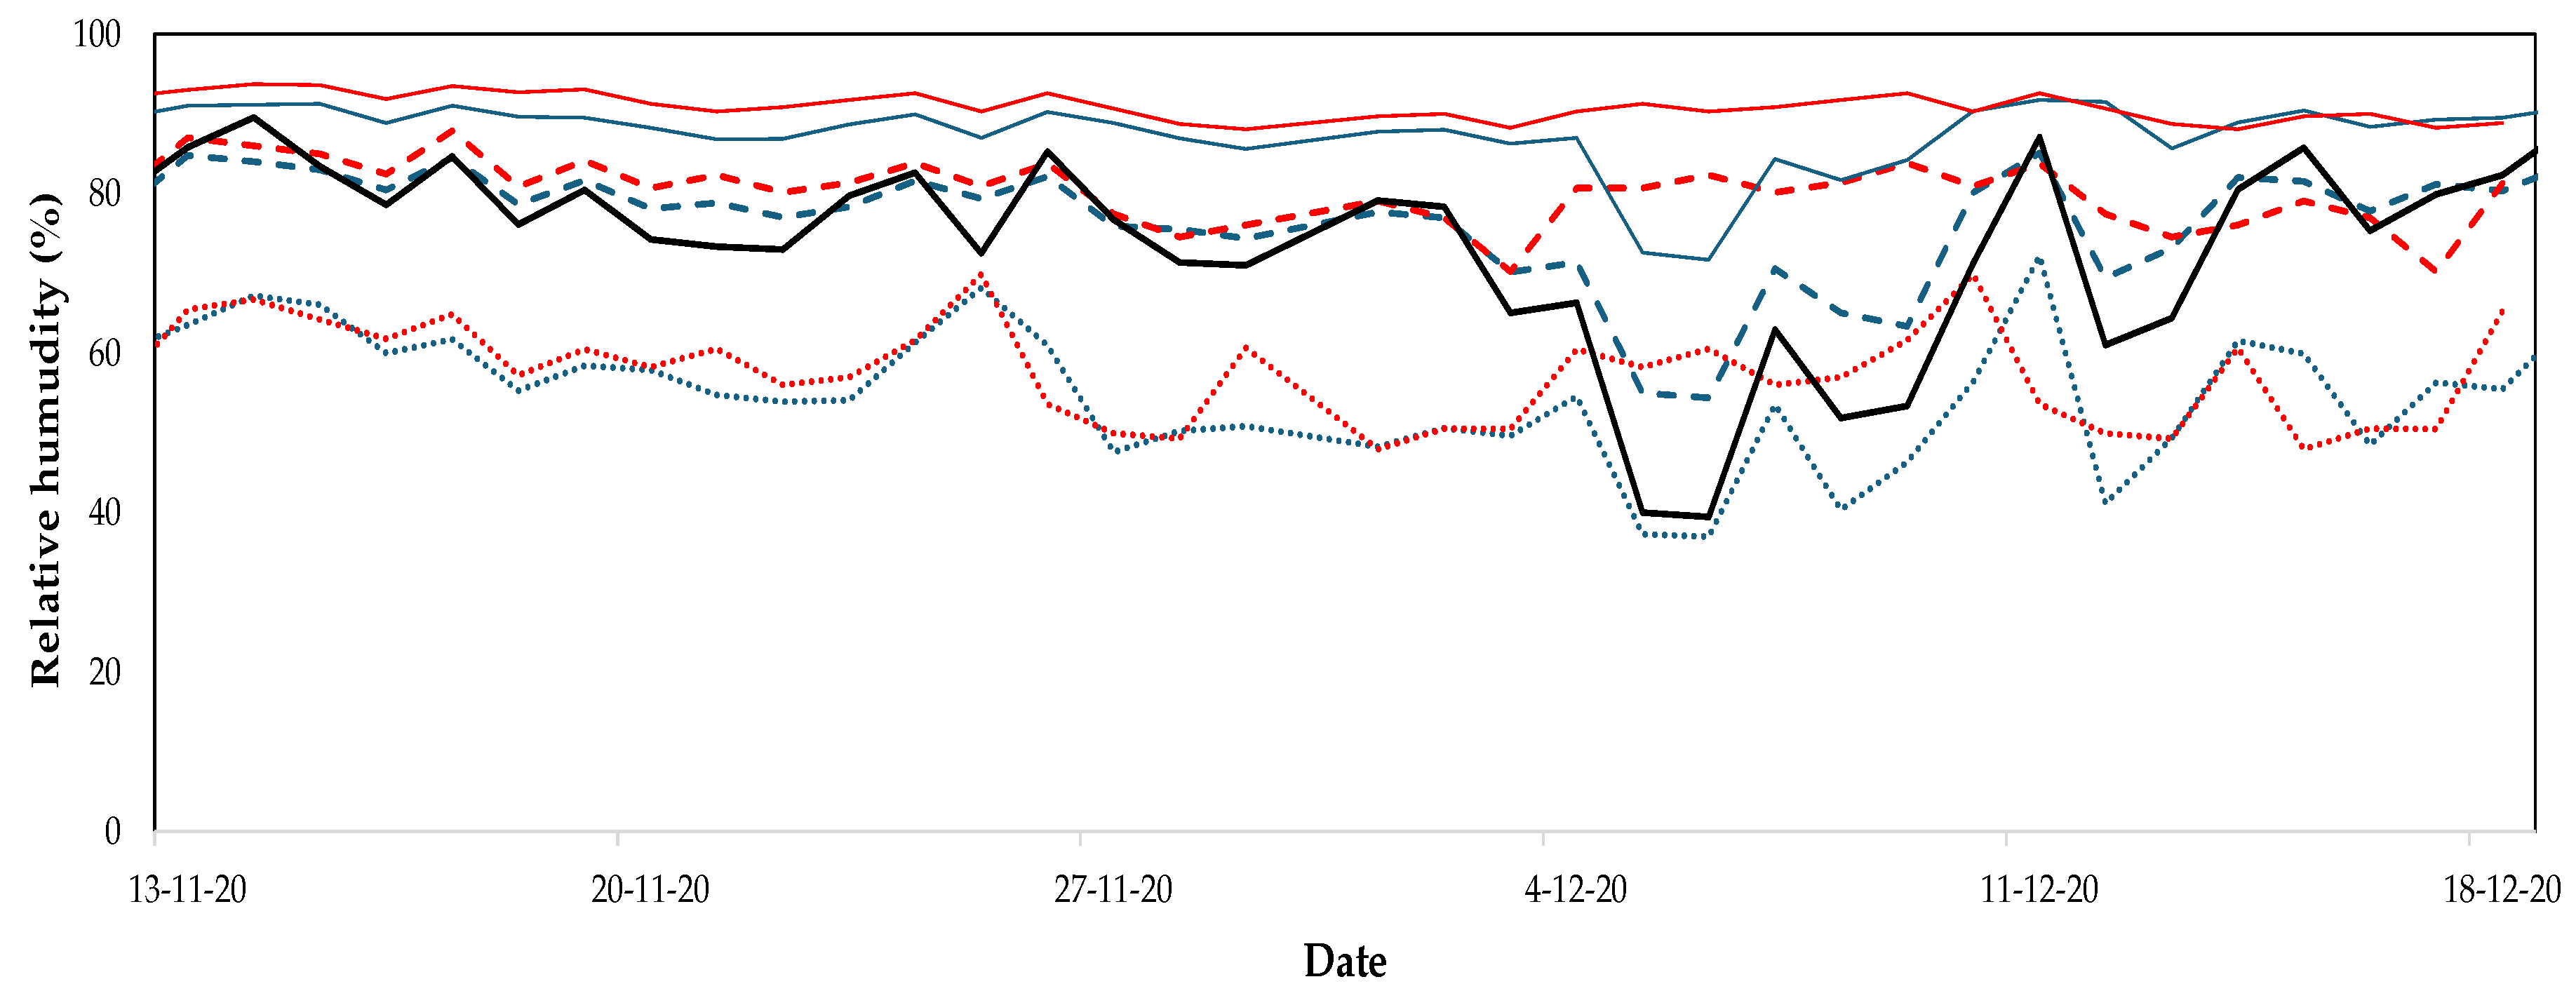
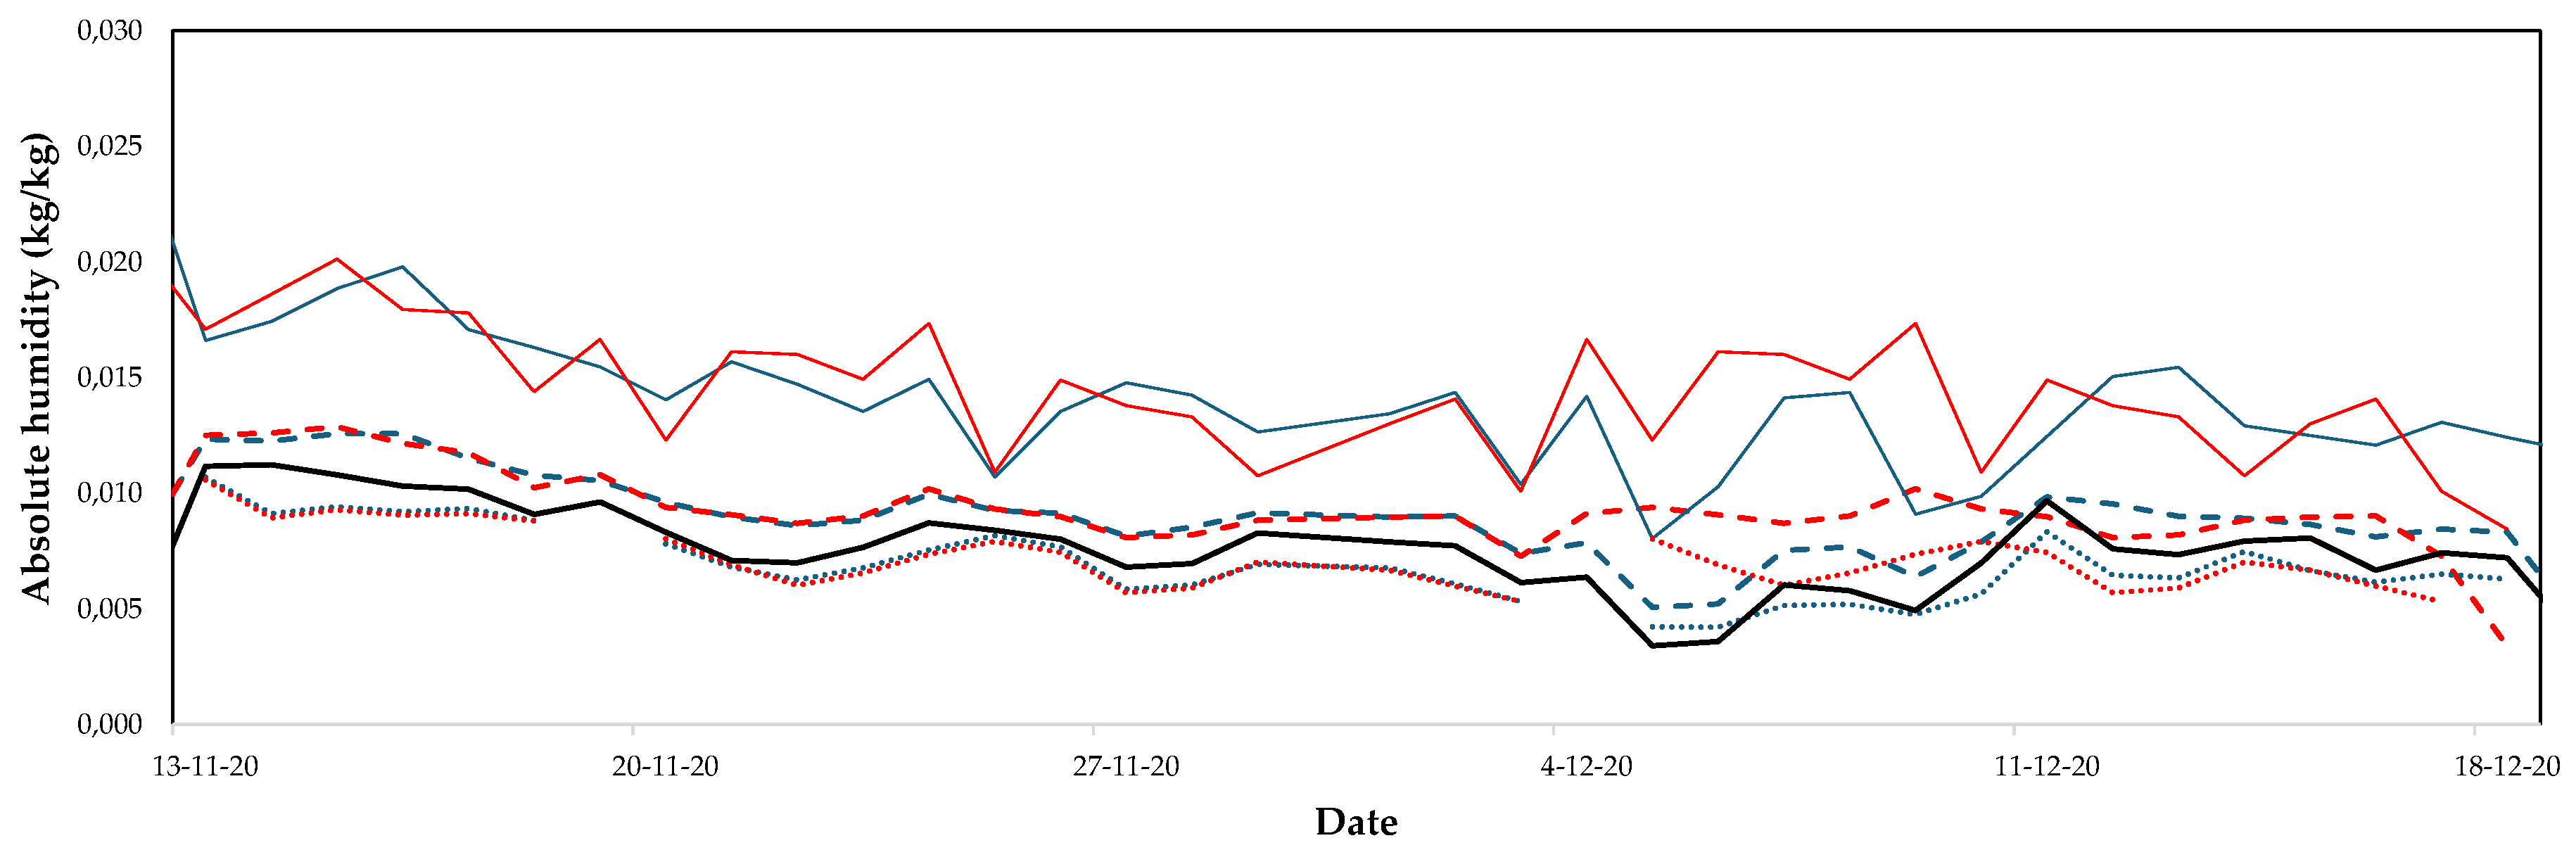
Figure 1.
Evolution of air temperature outside (–––) and average (- - -), maximum (–––) and minimum (···) temperature inside of the greenhouse in the East sector with commercial plastic cover. Average (- - -), maximum (–––) and minimum (···) temperature inside the greenhouse in the West sector with experimental plastic cover. Crop season 20/21.
Figure 2.
Evolution of relative humidity outside (–––) and average (- - -), maximum (–––) and minimum (···) temperature inside of the greenhouse in the East sector with commercial plastic cover. Average (- - -), maximum (–––) and minimum (···) temperature inside the greenhouse in the West sector with experimental plastic cover. Crop season 20/21.
Figure 3.
Evolution of absolute humidity outside (–––) and average (- - -), maximum (–––) and minimum (···) temperature inside of the greenhouse in the East sector with commercial plastic cover. Average (- - -), maximum (–––) and minimum (···) temperature inside the greenhouse in the West sector with experimental plastic cover. Crop season 20/21.
During the second crop season, as in the first, the microclimatic parameters measured (air temperature, relative humidity and absolute humidity) behaved in a similar way (Figure 4, Figure 5 and Figure 6). Although it should be noted that the average inside temperature values were slightly lower in the eastern sector of the greenhouse (Figure 4).
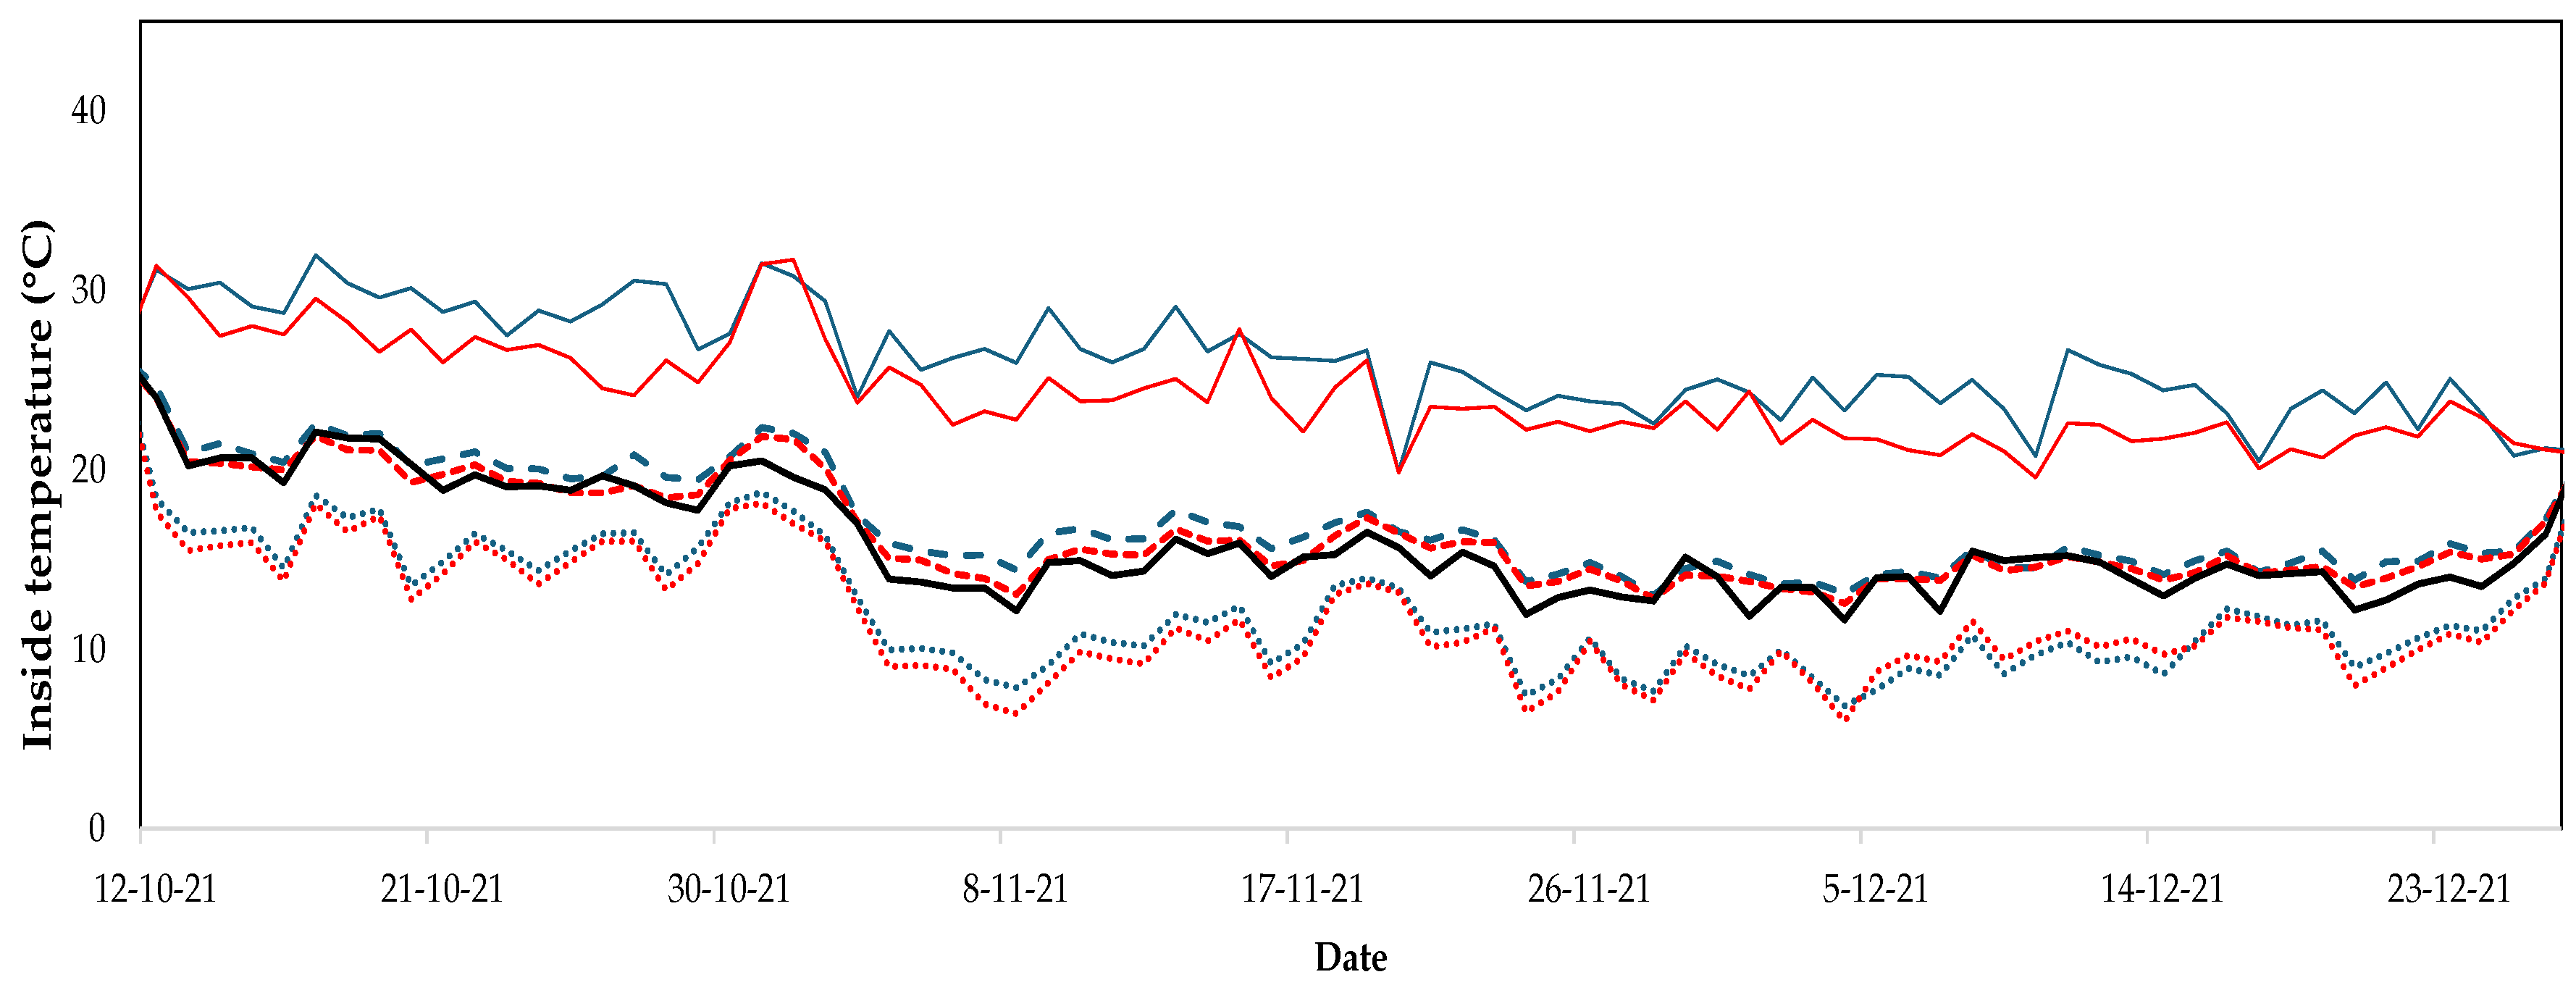
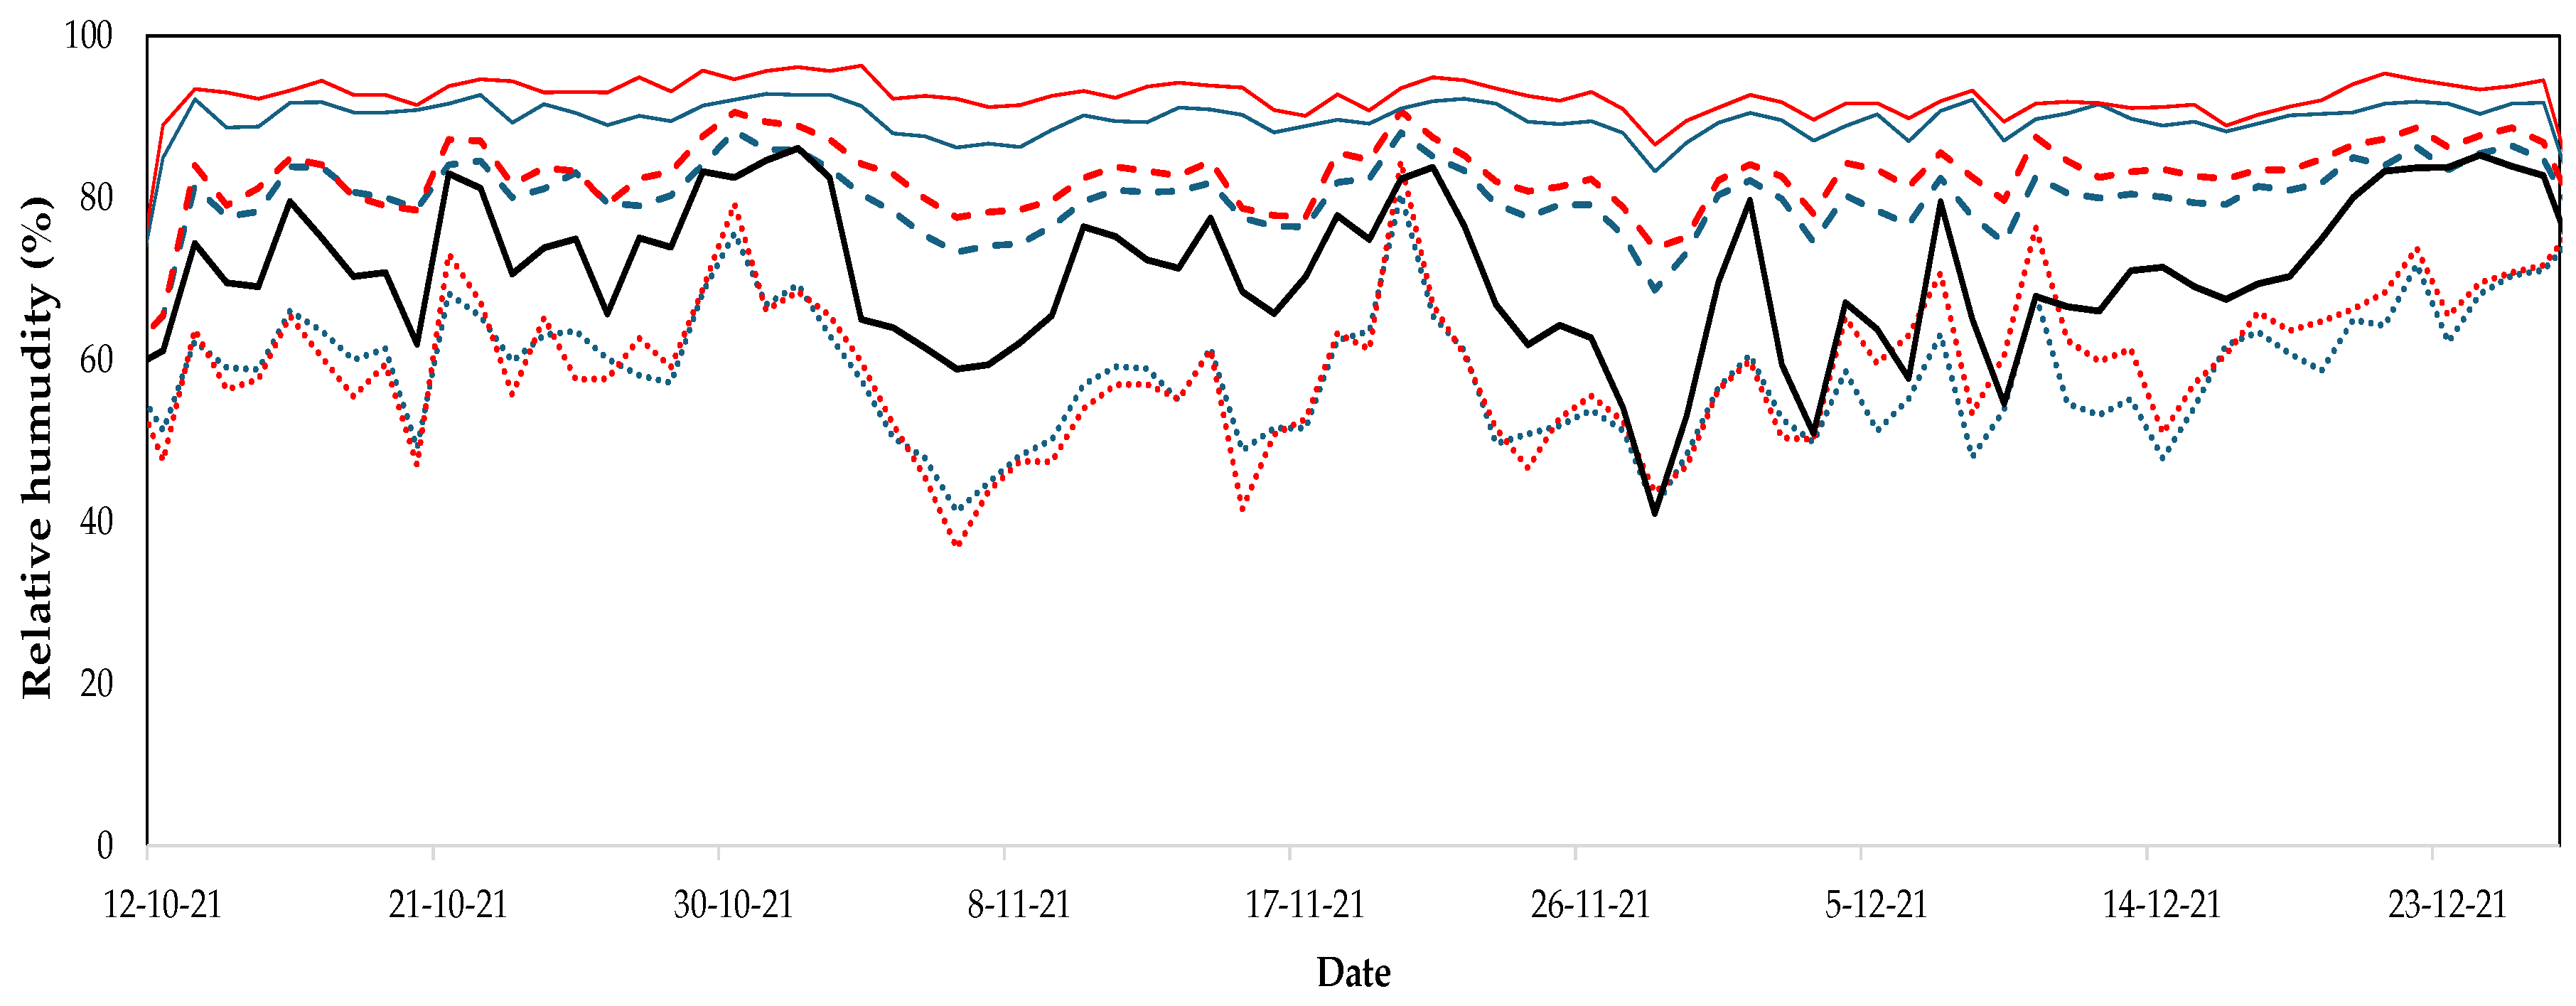
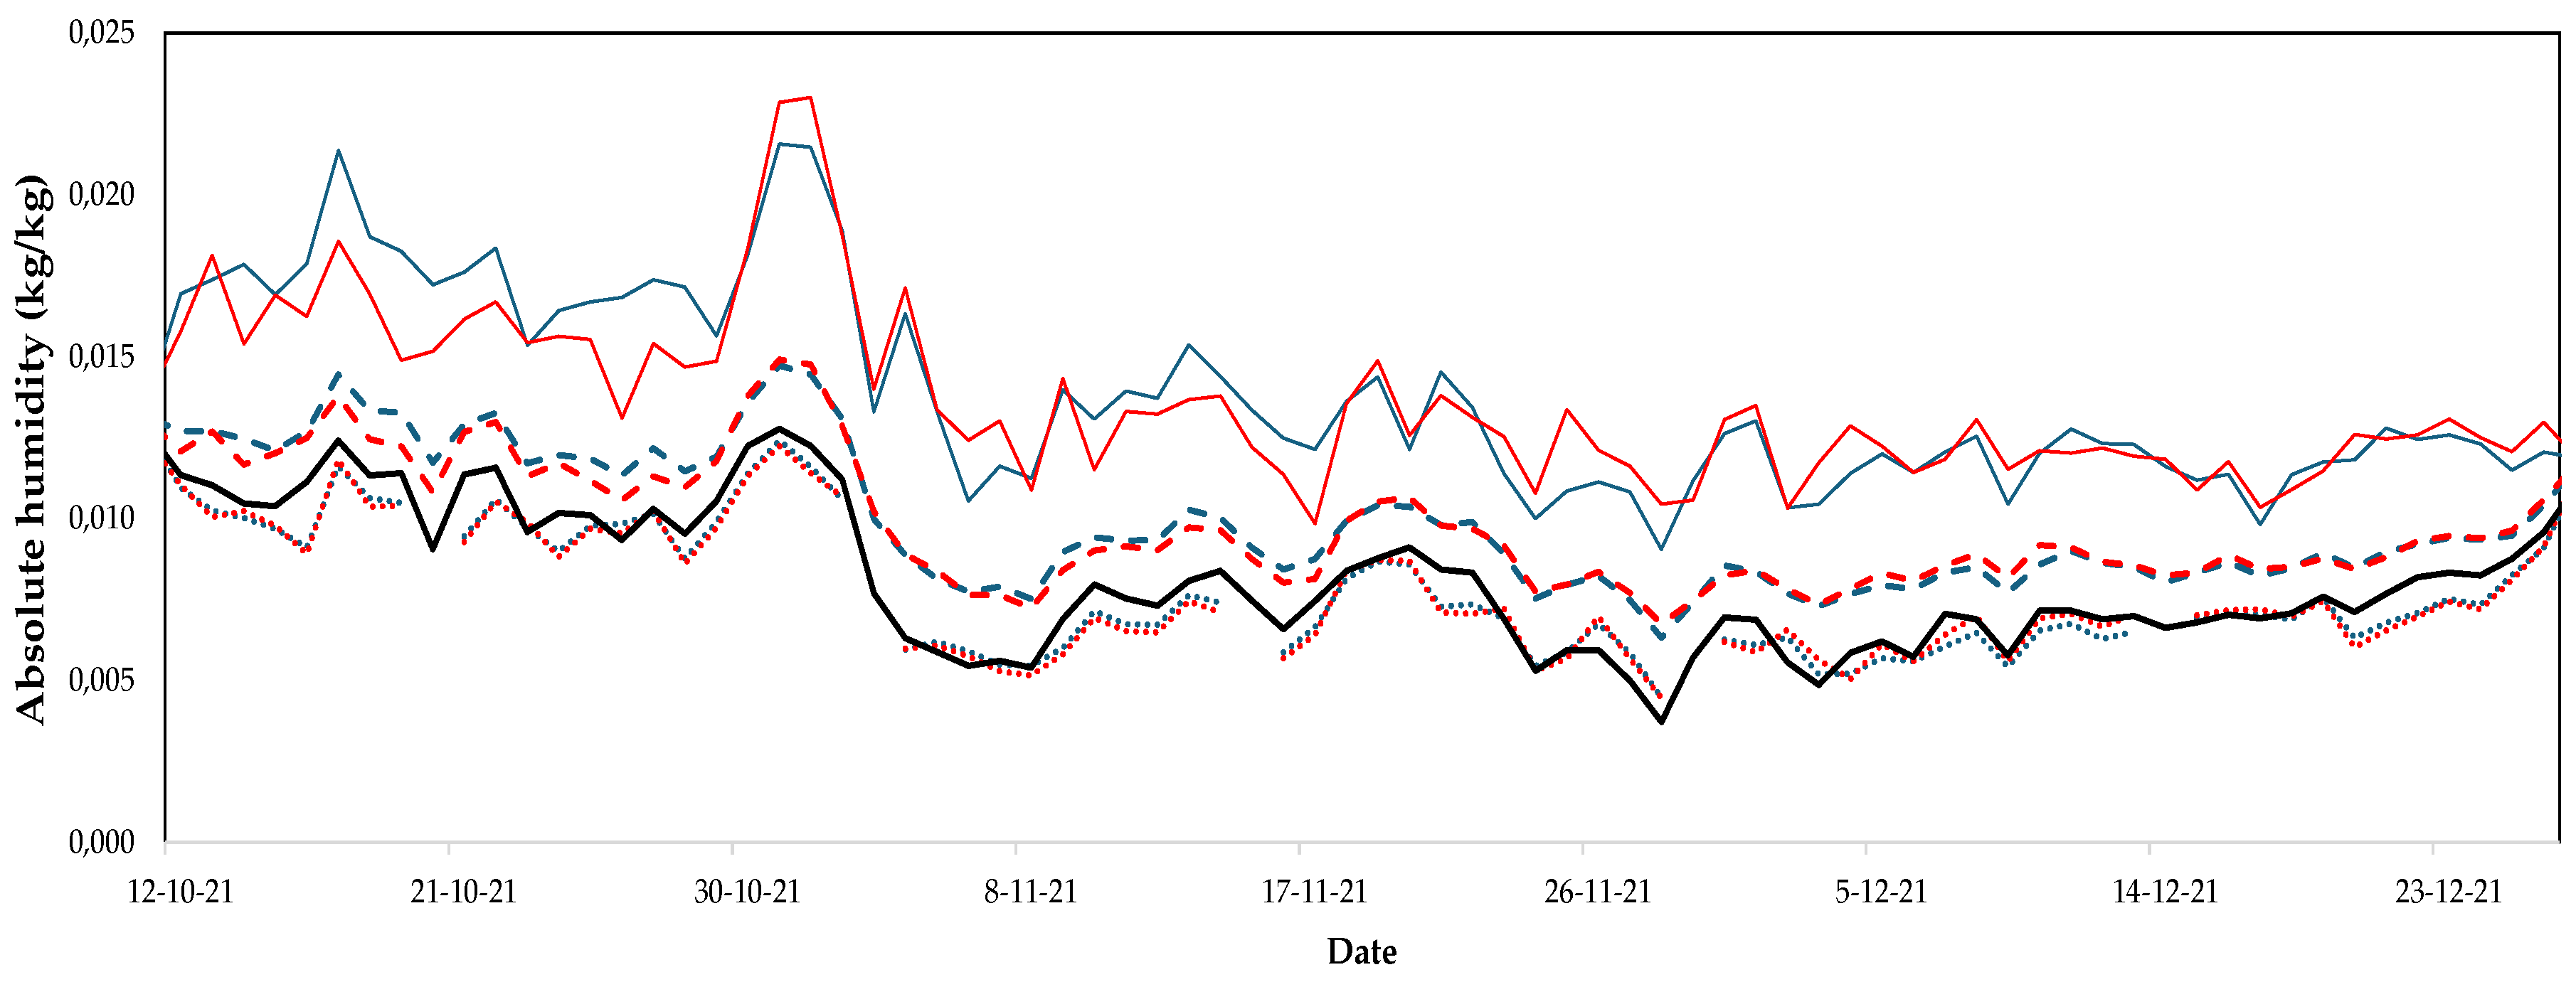
Figure 4.
Evolution of air temperature outside (–––) and average (- - -), maximum (–––) and minimum (···) temperature inside of the greenhouse in the East sector with commercial plastic cover. Average (- - -), maximum (–––) and minimum (···) temperature inside the greenhouse in the West sector with experimental plastic cover. Crop season 20/21.
Figure 5.
Evolution of relative humidity outside (–––) and average (- - -), maximum (–––) and minimum (···) temperature inside of the greenhouse in the East sector with commercial plastic cover. Average (- - -), maximum (–––) and minimum (···) temperature inside the greenhouse in the West sector with experimental plastic cover. Crop season 20/21.
Figure 6.
Evolution of absolute humidity outside (–––) and average (- - -), maximum (–––) and minimum (···) temperature inside of the greenhouse in the East sector with commercial plastic cover. Average (- - -), maximum (–––) and minimum (···) temperature inside the greenhouse in the West sector with experimental plastic cover. Crop season 20/21.
The inside air temperatures (average, maximum and minimum) were higher in the sector with the experimental plastic cover during the first crop season (Table 4). This would be reasonable behaviour, as the experimental plastic cover allows more PAR and total radiation to pass through with the same ratio of the ventilation surface (Table 1). The small increase in air temperature (0.2 °C) observed in the sector with the experimental plastic cover corresponded to the increase in leaf surface temperature (1.1 °C) during the first crop season (Table 6).
As in the first crop season, in the second crop season the air temperature values were higher in the sector with experimental plastic cover (Table 4), with an increase of 0.4 °C in the average air temperature, 1.3 °C in the maximum temperature and 0.2 °C in the leaf surface temperature by 0.2 °C (Table 6).
Humidity values were similar between both experimental sectors in both crop seasons (Table 4). Similarly, crop evapotranspiration, which is mainly related to absolute humidity, was similar in both experimental sectors and in both crop seasons, with no statistically significant differences (Table 6).
3.2. Fungal Diseases
In greenhouses, there are favourable environments for the development of pests in the crop, due to the warm and humid environment that exists under the plastic covers [39]. Interfering in the development of the pathogen cycle is important in any integrated pest management (IPM) strategy. One of the ways to interfere with the environmental conditions of greenhouses is to modify the spectral properties of the greenhouse film cover, which in turn affects the development of some pathogens in the plant [40]. Light has an important effect on the formation of the conidia of some fungi; the exposure of the mycelia to ultraviolet light or blue light affects the development of the fungus [41]. Greenhouse cover films, which block or decrease ultraviolet radiation [42], prevent the sporulation of various phytopathogenic fungi [43]. For this reason, we consider that it is essential to analyse the results obtained in the parameters analysed in our trial (photosynthesis, plant growth, yield and fruit quality) in terms of the percentage of infection of the main fungal diseases that attack cucumber crops in our geographical area.
The most important disease in both seasons was powdery mildew; however, for the first crop season, downy mildew reached infection rates similar to powdery mildew. In the second crop season, statistically significant differences were observed in the three fungal diseases studied. The incidence of fungal diseases studied was generally lower in the greenhouse sector with the experimental plastic cover (Table 5), due to the higher PAR transmissivity and the higher light diffusivity of the plastic cover. It should be noted that during the second crop season, the infection rates of the three diseases studied were higher in both sectors compared to the results obtained in the first crop season, which was subsequently reflected in the results obtained in photosynthesis, plant development, yield and fruit quality.
3.3. Photosynthetic Activity
In the first crop season, the photosynthetic activity measured in leaves was higher in plants in the sector with experimental plastic cover, with an average value of 12.9 μmol CO2 m-2 s-1 compared to 11.8 μmol CO2 m-2 s-1 measured in plants in the sector with commercial plastic cover (without statistically significant differences). This represents an increase in photosynthetic activity of 8.5 %. The use of experimental plastic cover with higher transmittance to PAR radiation increased PAR radiation at leaf level by 8 %, from 604 μmol m-2 s-1 in plants of the sector with commercial plastic cover to 657.2 μmol m-2 s-1 in plants of the sector with experimental plastic cover. The CO2 concentration at canopy level was 418.0 ppm in the plants of the sector with experimental plastic cover, while in the plants of the sector with commercial plastic cover it was 415.9 ppm. The value of the CO2 concentration should be lower in the West sector because plants performed more photosynthesis (Table 6), it is possible that in the eastern sector the CO2 concentration was higher even though less was spent on photosynthesis. Leaf temperature was 1.1 °C higher in plants in the sector with experimental plastic cover, which is reasonable because the experimental plastic cover allows both PAR radiation and global radiation to pass through, producing a slight increase in plant temperature. Finally, evapotranspiration and stomatal conductance were practically the same in both experimental sectors (Table 6).
In the second crop season, the measured photosynthetic activity was 15.3 % higher in plants in the sector with experimental plastic cover (10.5 μmol CO2 m-2 s-1) compared to the photosynthetic activity measured in plants in the sector with commercial plastic cover (8.9 μmol CO2 m-2 s-1), with statistically significant differences. PAR radiation measured at the canopy level in plants in the sector with commercial plastic cover was 537.5 μmol m-2 s-1 and 600 μmol m-2 s-1 in plants in the sector with experimental plastic cover, an increase of 10.5 %, but without statistically significant differences. It is noticeable that the experimental plastic cover has a positive effect on plant photosynthesis. This was also favored by the fact that the plants in the commercial plastic cover sector had a higher fungal disease infection rate than the plants in the experimental plastic cover. (Table 5). The concentration of CO2 in plants under the influence of the commercial plastic cover (418.2 ppm) was 4.6 % higher compared to the concentration of concentration of CO2 in plants in the sector with the experimental plastic cover (404.1 ppm), without statistically significant differences. As in the first crop season, the leaf temperature of plants grown in the sector with experimental plastic cover was slightly higher (0.2 °C) than the leaf temperature of plants in the sector with commercial plastic cover. The other two measured parameters (evapotranspiration and stomatal conductance) showed similar values in the plants of the two experimental sectors (Table 6).
The incidence of fungal diseases was significantly higher in the second crop season (Table 5), which affected the results obtained for photosynthetic activity and PAR radiation at the leaf level (Table 6).
Table 6.
Average values of the measurements made on the leaves of plants grown in the two greenhouse sectors with different plastic covers. Photosynthetic activity PA [µmol CO2 m−2 s−1, PAR radiation QPAR [µmol m−2 s−1], leaf temperature TL [°C], CO2 concentration CL [ppm], evapotranspiration EL [mmol m−2 s−1] and stomatal conductance CE [mol m−2 s−1].
| Sectors | Plastic Cover | PA | QPAR | TL | CL | EL | CE |
|---|---|---|---|---|---|---|---|
| Cucumber crop season 20/21 | |||||||
| East | Commercial | 11.8a ± 3.2 | 604.2a ± 145.4 | 26.7a ± 3.9 | 415.9a ± 20.2 | 2.3a ± 1.0 | 0.20a ± 0.11 |
| West | Experimental | 12.9a ± 2.8 | 657.0a ± 138.9 | 27.8a ± 3.1 | 418.0a ± 37.5 | 2.5a ± 0.9 | 0.19a ± 0.10 |
| Cucumber crop season 21/22 | |||||||
| East | Commercial | 8.9a ± 1.9 | 537.3a ± 149.2 | 27.8a ± 2.4 | 418.2a ± 48.5 | 3.2a ± 1.0 | 0.21a ± 0.11 |
| West | Experimental | 10.5b ± 2.3 | 600.1a ± 172.9 | 28.0a ± 2.6 | 404.1a ± 25.8 | 3.2a ± 0.8 | 0.22a ± 0.11 |
a Values with different letters in the same column show statistically significant differences with a confidence level of 95.0% (p value ≤ 0.05).
The use of the experimental plastic cover with higher transmittance allowed an increase in PAR radiation measured on the leaves of the crop of 8% in the first crop season and 10.5 % in the second crop season (Figure 7a). This resulted in an increase in photosynthetic activity of 8.5 % during cucumber crop 20/21 and of 15.3 % in cucumber crop 21/22 (Figure 7b). In the second crop season, the fungal diseases studied (powdery mildew, downey mildew and gummy stem blight) showed higher infection rates in the sector with commercial plastic mulch with statistically significant differences. The increased attack of fungal diseases could lead to a decrease in photosynthesis and yield, although the climatic conditions (Figure 4, Figure 5 and Figure 6) and the ventilation surface (Table 1) were better than in the first crop season.
Statistical analysis showed significantly higher photosynthetic activity in cucumber leaves in the sector with experimental plastic cover by 8.4 % in the first crop season and of 11.2 % in the second. Photosynthesis activity increases under diffuse plastic cover materials in tomato and cucumber crops [19,44,45]. Furthermore, when diffuse cover materials combined with high transmittance, photosynthetic activity increased by 21.5 % in a spring-summer tomato crop season [46]. Statistical analysis showed an increase in PAR radiation at the leaf level of 10 % in the first crop season (statistically significant difference) and 17.2 % in the second crop season. It should be noted that despite having a similar PAR radiation level in both crop season, photosynthetic activity decreases significantly in both sectors in the second crop cycle. This behaviour of photosynthetic activity may be due to the higher percentage of fungal diseases that attacked the cucumber crop during the second crop season (Table 5), mainly plants in the sector with commercial plastic cover.
3.3. Plant Morphology
In general, there were no statistically significant differences between any of the morphological parameters analysed. Only the average value of the length of the internode was statistically higher in plants under the influence of experimental plastic cover in the second crop season, with statistically significant differences (Table 7).
In the first crop season, the average total length of the stem and the average length of the apical meristem were higher in plants in the sector with the commercial plastic cover. Although the length of the stem was higher in plants covered with commercial plastic, the number of nodes was the same in both sectors. However, the marketable yield was higher (4.2 %) in the sector with the experimental plastic cover (9.6 kg/m2) compared to the marketable yield in the sector with the commercial plastic cover (9.2 kg/m2) (Figure 8a). In the second crop season, the parameters analysed did not follow the same pattern as in the first crop season. In this case, the length of the plant was higher (1.7 %) in plants with experimental plastic cover, and this could be related to the length of the internodes, which is higher, with statistically significant differences (Table 7). However, the number of nodes in this crop season was higher in the sector with commercial plastic cover compared to the number of nodes with experimental plastic cover (Table 7). Cucumber production is related to the number of nodes because it is mainly this part of the plant where the fruits develop. However, the marketable yield was 14.3 % higher in the sector with experimental plastic cover (7 kg/m2) compared to the marketable yield in the sector with commercial plastic cover (6 kg/m2) (Figure 8a).
Due to the higher percentage of fungal diseases during the first crop season (Table 5) plant growth was clearly affected in the parameter’s total length of the stem, the length of the apical meristem, the diameter of the stem and the number of nodes.
Several authors have documented the positive effects of diffuse light on the yield and growth of greenhouse crops [18,47,48]. In previous research, tomato plants grown under high transmittance plastic cover with high transmittance (experimental plastic cover) were found to show increased growth and development [46]. In addition to plant growth, light has an important effect on the formation of conidia of some fungi [39]. It was observed that plants grown under the influence of commercial cover film had a higher percentage of infection of the three fungal diseases that most affect cucumber crops (powdery mildew, downy mildew, and gummy stem blight). In the first crop season, powdery mildew showed a higher infection rate, causing a very rapid development of the disease. For this reason, although the plants grew well, the high presence of powdery mildew caused a decrease in yield (Figure 8). In the second crop season, the three fungal diseases studied showed a high percentage of infection in plants in the sector with commercial plastic cover (Table 5). Analysing the morphological parameters of the plant growth and fruit quality parameters, we can observe that during the first crop season the plants and fruits harvested under the influence of the commercial plastic cover showed better results. However, in the second crop season, it was plants and fruits harvested under the influence of the experimental plastic cover that showed better results. This result may be related to the high infection rate of fungal diseases, mainly during the second crop season. The fungal diseases studied can reduce plant growth, cause premature drying of leaves and subsequently cause a reduction in fruit quality and marketability [43].
3.4. Yield and Fruit Quality
The yield results in the first season of cucumber crops show an increase in marketable yield of 0.4 kg/m2 in the greenhouse sector with experimental plastic cover, an increase of 4.2 % compared to the yield in the sector with commercial plastic cover (Figure 8a). Furthermore, the total cumulative yield was 5 % higher with the experimental plastic cover (12.1 kg/m2) compared to the total cumulative yield in the sector with the commercial plastic cover (11.5 kg/m2) (Figure 8b). During the second season of cucumber crop, in the sector with experimental plastic cover, the marketable yield (7 kg/m2) and the total yield (9.4 kg/m2) were 14.3 % (Figure 8a) and 14.9 % (Figure 8b) higher, respectively, compared to the marketable yield (6 kg/m2) and the total cumulative yield (8 kg/m2) in the sector with commercial plastic cover (Figure 8).
This 4.2 % and 14.3 % increase in marketable yield (Figure 8a) could be the result of the higher transmittance and diffusivity of the experimental plastic cover, and the lower infection rate of fungal diseases in plants in this sector of the greenhouse. Several studies have shown that the use of diffuse plastic cover improves cucumber yield from 4.8 to 14 % [48,49]. This increase in yield was not only observed in cucumber crops, but other authors have also shown increases in tomato and pepper crops of up to 6% [21,50] under diffuse plastic cover and 3.2 % combined with higher transmittance [46,51].
In both crop season, plants in the experimental plastic cover sector have been shown to have lower rates of fungal disease infection (Table 5) and therefore photosynthetic activity (Table 6) and yield (Figure 8) showed better results, possibly favoured by the higher PAR transmissivity and high light diffusivity of the experimental plastic cover. Although the positive effect of the experimental plastic cover on cucumber crop production is remarkable, it should be noted that during the second crop season, fungal diseases reached higher infection rates. This higher level of fungal diseases could be the cause of considerable crop losses. Since downy mildew, caused by the fungus Pseudoperonospora cubensis, it is one of the most dangerous diseases that attack cucumbers, causing serious crop losses [52].
In both cucumber crop seasons, the statistical analysis of the quality parameters of the fruits did not show statistical differences between the fruits harvested under the influence of the two plastic covers tested (Table 8). The most notable parameter was the weight of the fruits, because it was 2.4 % higher in the first crop and 6.6 % in the second in the fruit harvest under the influence of the experimental plastic cover. The rest of the parameters analysed were similar during the two crop seasons.
In the second crop season, the weight, length and soluble solids content of the harvested fruits were lower compared to the fruits harvested in the first crop season (Table 8), possibly because of the higher percentage of fungal diseases (Table 5). This could be because attacks by these fungi cause significant economic damage to production, reducing crop yields [53].
Although the quality parameters varied between in the two crop seasons, the marketable and total yields were always higher in the sector with experimental plastic cover (Figure 8a,b). Several authors have observed positive effects on fruit maturity [54] and fruit weight in the tomato crop under diffuse plastic cover [48,55].
4. Conclusions
Based on the comparison between the experimental plastic cover with high photosynthetically active radiation (PAR) transmittance and high light diffusivity, and a standard commercial plastic cover, the following conclusions can be drawn:
− The experimental plastic cover significantly increased average photosynthetic activity in cucumber leaves by 8.5% during the first crop season and by 15.3% during the second crop season, due to its higher PAR transmittance.
− PAR radiation at the canopy level was also enhanced under the experimental cover, with increases of 8% in the first crop season and 10.5% in the second crop season compared to the commercial cover.
− As a result of the improved photosynthetic activity and increased PAR radiation at the canopy level, the marketable yield of cucumbers grown under the experimental plastic cover was 4.2% higher in the first crop season and 14.3% higher in the second crop season.
− No statistically significant differences were observed in plant growth parameters (such as stem length and thickness, number of nodes, and internode length) or in fruit quality parameters (including weight, diameter, length, and soluble solid content) across both crop seasons between the two cover types.
− Plants grown under the experimental plastic cover not only received more PAR radiation and exhibited higher photosynthetic rates, but also had a lower incidence of fungal diseases, resulting in healthier plants and higher yields in both crop seasons compared to those grown under the commercial cover.
Author Contributions
Conceptualization, F.D.M.-A., A.L.-M., F.B., A.P-F. and D.L.V.-M.; methodology, F.D.M.-A., A.L.-M. and M.Á.M.-T; data analysis, M.Á.M.-T., F.D.M-A and A.L.-M.; writing original draft preparation, M.Á.M.-T.; review and editing, A.L.-M., A.P-F, D.L. V-M and F.B.; project administration, D.L.V.-M.; funding acquisition, F.D.M.-A. and D.L.V.-M. All authors have read and agreed to the published version of the manuscript.
Funding
This research was funded by POLITIV EUROPA S.L. and the Spanish Ministry of Science, Innovation and Universities by the National R+D+i Plan Project PID2019-111293RB-I00 project Improving greenhouse profitability by increasing photosynthetic activity with passive climate control techniques (RINFOC).
Acknowledgments
The authors would like to thank POLITIV EUROPE, the University of Almería-ANECOOP Foundation for their collaboration and assistance during the development of this study, the CIAIMBITAL Research Centre, and the financial support from the Spanish Ministry of Universities for the Requalification Aid granted to M.A.M.T. (Modality Margarita Salas).
Conflicts of Interest
The authors declare no conflicts of interest.
References
- Valera, D.L.; Belmonte, L.J.; Molina-Aiz, F.D.; López, A. Greenhouse agriculture in Almería. A comprehensive techno-economic analysis. Publicaciones Cajamar, Almería, Spain, 2016; pp. 408. Available online: https://publicacionescajamar.es/series-tematicas/economia/greenhouse-agriculture-in-almeria-a-comprehensive-techno-economic-analysis.
- CAGPDS. Cartography of greenhouses in Almeria, Granada and Malaga. [In Spanish]. Consejería de Agricultura, Ganadería, Pesca y Desarrollo Sostenible (CAGPDS). Junta de Andalucía. Secretaria General de Agricultura, Ganadería y Alimentación. Sevilla, Spain, pp. 29. 2023. Available online: www.juntadeandalucia.es/sites/default/files/2024-1/Cartografia%20_inv_AL_GR_MA_v231031.pdf (accessed on 30 August 2024).
- Zheng, J.; Meng, S.; Zhang, X.; Zhao, H.; Ning, X.; Chen, F.; Omer-Abaker, A.A.; Ingenhoff, J.; Liu, W. Increasing the comprehensive economic benefits of farmland with Even-lighting Agrivoltaic Systems. PLoS ONE 2021, 16(7), e0254482. [Google Scholar] [CrossRef] [PubMed]
- Zhang, G.; Shen, S.; Takagaki, M.; Kozai, T.; Yamori, W. Supplemental Upward Lighting from Underneath to Obtain Higher Marketable Lettuce (Lactuca sativa) Leaf Fresh Weight by Retarding Senescence of Outer Leaves. Front Plant Sci. 2015, 14(6), 1110. [Google Scholar] [CrossRef] [PubMed]
- Bures, S.; Urrestarazu, M.; Kotiranta, S. LED light has been described as the most revolutionary invention in horticultural lighting in recent decades. Artificial Light in Agriculture. Valencia, Spain, 2018; pp.46. Available online: https://www.bibliotecahorticultura.com/publicaciones/tecnicas-de-cultivo/iluminacion-artificial-en-agricultura/.
- Higashide, T.; Heuvelink, E. , 2009. Physiological and Morphological Changes Over the Past 50 Years in Yield Components in Tomato. J. Amer. Soc. Hort. Sci. 2009, 134(4), 460–465. [Google Scholar] [CrossRef]
- Long, S.P.; Humphries, S.; Falkowski, P.G. Photoinhibition of Photosynthesis in Nature. Annu. Rev. Plant Physiol. Plant Mol. Biol. 1994, 45, 633–662. [Google Scholar] [CrossRef]
- Zhang, S.; Ma, K.; Chen, L. Response of photosynthetic plasticity of Paeonia suffruticosa to changed light environments. Environ. Exp. Bot. 2003, 49(2), 121–133. [Google Scholar] [CrossRef]
- Steinger, T.; Roy, B.A.; Stanton, M.L. Evolution in stressful environments II: adaptive value and costs of plasticity in response to low light in Sinapis arvensis. J. Evol. Biol. 2003, 16(2), 313–323. [Google Scholar] [CrossRef]
- Kittas, C.; Tchamitchian, M.; Katsoulas, N.; Karaiskou, P.; Papaioannou, C. Effect of two UV-absorbing greenhouse-covering films on growth and yield of an eggplant soilless crop. Sci. Hortic. 2006, 110(1), 30–37. [Google Scholar] [CrossRef]
- Ilic, Z.; Fallik, E. Light quality manipulation improves vegetable quality at harvest and postharvest: A review. Environ. Exp. Bot. 2017, 139, 79–90. [Google Scholar] [CrossRef]
- Murakami, K.; Fukuoka, N.; Noto, S. Improvement of greenhouse microenvironment and sweetness of melon (Cucumis melo L.) fruits by greenhouse shading with a new kind of near-infrared ray-cutting net in mid-summer. Sci. Hort. 2017, 218, 1–7. [Google Scholar] [CrossRef]
- Wargent, J.J.; Elfadly, E.M.; Moore, J.P.; Paul, N.D. Increased exposure to UV-B radiation during early development leads to enhanced photoprotection and improved long-term performance in Lactuca sativa. Plant Cell Environ. 2011, 34, 1401–1413. [Google Scholar] [CrossRef]
- Von Elsner, B.; Briassoulis, D.; Waaijenberg, D.; Mistriotis, A.; Von Zabeltitz, C.; Gratraud, J.; Russo, G.; Suay-Cortes, R. Review of Structural and Functional Characteristics of Greenhouses in European Union Countries: Part I, Design Requirements. J. Agric. Eng. Res. 2000, 75, 1–16. [Google Scholar] [CrossRef]
- Dieleman, J.A.; Marcelis, L.F.M.; Elings, A.; Dueck, T.A.; Meinen, E. Energy saving in greenhouses: Optimal use of climate conditions and crop management. Acta Hortic. 2006, 718, 203–210. [Google Scholar] [CrossRef]
- Papadakis, G.; Briassoulis, D.; Scarascia-Mugnozza, G.; Vox, G.; Feuilloley, P.; Stoffers, J.A. Radiometric and thermal properties of, and testing methods for, greenhouse covering materials. J. Agric. Eng. Res. 2000, 77, 7–38. [Google Scholar] [CrossRef]
- Farkas, I.; Weihb, P.; Biró, A.; Laube, W.; Eitzinger, J.; Wójcicki, A. Modeling of radiative PAR transfer in a tunnel greenhouse. Math. Comput. Simul. 2001, 56, 357–368. [Google Scholar] [CrossRef]
- Hemming, S.; Dueck, T.; Janse, J.; Van Noort, F. The effect of diffuse light on crops. Acta Hortic. 2008, 801(2), 1293–1300. [Google Scholar] [CrossRef]
- Li, T.; Heuvelink, E.; Dueck, T.A.; Janse, J.; Gort, G.; Marcelis, L. 2014a. Enhancement of crop photosynthesis by diffuse light: quantifying the contributing factors. Ann. Bot. 2014a, 114(1), 145–156. [Google Scholar] [CrossRef]
- Li, T.; Heuvelink, E.; Van Noort, F.; Kromdijk, J.; Marcelis, L. Responses of two Anthurium cultivars to high daily integrals of diffuse light. Sci. Hortic. 2014b, 179, 306–313. [Google Scholar] [CrossRef]
- Hemming, S.; Swinkels, G.L.; Van Breugel, A.J.; Mohammadkhani, V. Evaluation of diffusing properties of greenhouse covering materials. Acta Hortic. 2016, 1134, 309–316. [Google Scholar] [CrossRef]
- Kempkes, F.; Stanghellini, C.; Victoria, N.G.; Bruins, M. Effect of diffuse glass on climate and plant environment: First results from an experiment on roses. Acta Hortic. 2012, 952, 255–262. [Google Scholar] [CrossRef]
- Urban, O.; Klem, K.; Ač, A.; Havránková, K.; Holišová, P.; Navrátil, M.; Zitová, M.; Kozlová, K.; Pokorný, R.; Šprtová, M.; Tomášková, I.; Špunda, V.; Grace, J. Impact of clear and cloudy sky conditions on the vertical distribution of photosynthetic CO2 uptake within a spruce canopy. Funct. Ecol. 2012, 26(1), 46–55. [Google Scholar] [CrossRef]
- Brodersen, C.R.; Vogelmann, T.C.; Williams, W.E.; Gorton, H.L. A new paradigm in leaf-level photosynthesis: direct and diffuse lights are not equal. Plant Cell Environ. 2008, 31(1), 159–164. [Google Scholar] [CrossRef] [PubMed]
- Baeza, E.; Hemming, S.; Stanghellini, C. Materials with switchable radiometric properties: Could they become the perfect greenhouse cover? Biosyst. Engin. 2020, 193, 157–173. [Google Scholar] [CrossRef]
- Gao, Y.; Dong, J.; Isabella, O.; Santbergen, R.; Tan, H.; Zeman, M.; Zhang, G. Modeling and analyses of energy performances of photovoltaic greenhouses with sun tracking functionality. Appl. Energy. 2019, 233, 424–442. [Google Scholar] [CrossRef]
- Abdel-Ghany, A.; Al-Helal, I.; Alzahrani, S.; Alsadon, A.; Ali, I.; Elleithy, R. Covering materials incorporating radiation-preventing techniques to meet greenhouse cooling challenges in arid regions: A review. Sci. World 2012. [Google Scholar] [CrossRef] [PubMed]
- Samaranayake, P.; Liang, W.; Chen, Z.H.; Tissue, D.; Lan, Y.C. Sustainable Protected Cropping: A Case Study of Seasonal Impacts on Greenhouse Energy Consumption during Capsicum Production. Energies 2020, 13 (17), 4468. [Google Scholar] [CrossRef]
- Baneshi, M.; Gonome, H.; Maruyama, S. Wide-range spectral measurement of radiative properties of commercial greenhouse covering plastics and their impacts into the energy management in a greenhouse. Energy 2020, 210 (17), 118535. [Google Scholar] [CrossRef]
- Petropoulos, S.; Fernandes, A.; Katsoulas, N.; Barros, L.; Ferreira, I. The effect of covering material on the yield, quality and chemical composition of greenhouse-grown tomato fruit. J. Sci. Food Agric. 2019, 99, 3057–3068. [Google Scholar] [CrossRef]
- Ávalos-Sánchez, E.; Moreno-Teruel, M.Á.; Molina-Aiz, F.D.; López-Martínez, A.; Peña-Fernández, A.; Baptista, F.; Valera-Martínez, D.L. Influence of the Diffusivity and Transmittance of a Plastic Greenhouse Cover on the Development of Fungal Diseases in a Cucumber Crop. Agronomy 2022, 12, 2743. [Google Scholar] [CrossRef]
- UNE-EN 13206: 2017+A1 Plastics. Thermoplastic Covering Films for Use in Agriculture and Horticulture; Asociación Española de Normalización (UNE): Madrid, Spain; 6p. Available online: https://www.une.org/encuentra-tu-norma/busca-tunorma/norma/?Tipo=N&c=N0064784 (accessed on 15 June 2020).
- ASTM D 1003-13. Standard Test Method for Haze and Luminous Transmittance of Transparent Plastics; American Society for Testing and Materials (ASTM): West Conshohocken, PA, USA; 64p. Available online: https://www.astm.org/Standards/D1003.htm (accessed on 15 June 2020).
- Emekli, N.Y.; Buyuktas, K.; Bascetincelik, A. Changes of the light transmittance of the LDPE films during the service life for greenhouse application. J. Build. Eng. 2016, 6, 126–132. [Google Scholar] [CrossRef]
- Dilara, P.A.; Briassoulis, D. Degradation and stabilization of low-density polyethylene films used as greenhouse covering materials. J. Agric. Eng. Res. 2000, 76, 309–321. [Google Scholar] [CrossRef]
- Hogewoning, S.W.; Douwstra, P.; Trouwborst, G.; Van Ieperen, W.; Harbinson, J. An artificial solar spectrum substantially alters plant development compared with usual climate room irradiance spectra. J. Exp. Bot. 2010, 61(5), 1267–1276. [Google Scholar] [CrossRef] [PubMed]
- Jiang, C.; Johkan, M.; Hohjo, M.; Tsukagoshi, S.; Ebihara, M.; Nakaminami, A.; Maruo, T. Photosynthesis, plant growth, and fruit production of single-truss tomato improves with supplemental lighting provided from underneath or within the inner canopy. Sci. Hortic. 2017, 222, 221–229. [Google Scholar] [CrossRef]
- Statgraphics 2020. Statgraphics®Centurion 19. User Manual. Statgraphics Technologies. https://www.statgraphics.net/wp-content/uploads/2015/03/Centurion-XVI-Manual-Principal.pdf (accessed on 29 July 2024).
- Xu, L.L.; Li, F.; Xie, H.Y.; Liu, X.Z. A novel method for promoting conidial production by a nematophagous fungus, Pochonia chlamydosporia AS6.8. World J. Micro. Biotechnol. 2009, 25, 1989–1994. [Google Scholar] [CrossRef]
- Su, Y.Y.; Qi, Y.L.; Cai, L. Induction of sporulation in plant pathogenic fungi. Mycology 2012, 3(3), 195–200. [Google Scholar] [CrossRef]
- Fernández-Ortuño, D.; Torés, J.A.; De Vicente, A.; Pérez-García, A. Field resistance to QoI fungicides in Podosphaera fusca is not supported by typical mutations in the mitochondrial cytochrome b gene. Pest Manag. Sci. 2008, 64, 694–702. [Google Scholar] [CrossRef]
- Pérez-García, A.; Romero, D.; Fernández-Ortuño, D.; López-Ruiz, F.; De Vicente, A.; Torés, J. A. The powdery Mildew Fungus Podosphaera Fusca (synonym Podosphaera Xanthii), a Constant Threat to Cucurbits. Mol. Plant Pathol. 2009, 10(2), 153–160. [Google Scholar] [CrossRef]
- Lebeda, A.; Krístková, E.; Sedláková, B.; McCreight, J.D.; Coffey, M.D. Cucurbit powdery mildews: methodology for objective determination and denomination of races. Eur. J. Plant Pathol. 2016, 144, 399–410. [Google Scholar] [CrossRef]
- Fan, B.; Zhao, S.; Sun, S.; Qu, Y.; Zhou, Q.; Wang, P. Preliminary research on growth of cucumber under the diffuse ligth film. J. Shanxi Agric. Univ. 2016, 36, 633. [Google Scholar]
- Sun, S.; Zhou, Q.; Fan, B.; Zhao, S.; Wang, P.; Qu, Y. Effect of diffuse light thin film on tomato growth and fruit quality. China Veg. 2016, 5, 22–26. [Google Scholar]
- Moreno-Teruel, M.Á.; Molina-Aiz, F.D.; Peña-Fernández, A.; López-Martínez, A.; Valera-Martínez, D.L. The Effect of Diffuse Film Covers on Microclimate and Growth and Production of Tomato (Solanum lycopersicum L.) in a Mediterranean Greenhouse. Agronomy 2021, 11, 860. [Google Scholar] [CrossRef]
- Gu, L.; Baldocchi, D.; Verma, S.B.; Black, T.A.; Vesala, T.; Falge, E.M.; Dowty, P.R. Advantages of diffuse radiation for terrestrial ecosystem productivity. J. Geophys. Res. 2002, 107 (D6). [Google Scholar] [CrossRef]
- Dueck, T.; Janse, J.; Li, T.; Kempkes, F.; Eveleens, B. Influence of diffuse glass on the growth and production of tomato. Acta Hortic. 2012, 956, 75–82. [Google Scholar] [CrossRef]
- Zheng, L.; Zhang, Q.; Zheng, K.; Zhao, S.; Wang, P.; Cheng, J.; Zhang, X.; Chen, X. Effects of Diffuse Light on Microclimate of Solar Greenhouse, and Photosynthesis and Yield of Greenhouse-grown Tomatoes. HortScience 2020, 55, 1605–1613. [Google Scholar] [CrossRef]
- Hee, C.; SungHyun, Y.; YunIm, K.; HarkJu, K.; SiYoung, L. Environments and Canopy Productivity of Green Pepper (Capsicum annuum L.) in a Greenhouse Using Light-diffused Woven Film. Korean J. Hortic. Sci. Technol. 2005, 23, 367–371. [Google Scholar]
- Ávalos-Sánchez, E.; Moreno-Teruel, M.Á.; López-Martínez, A.; Molina-Aiz, F.D.; Baptista, F.; Marín-Membrive, P.; Valera-Martínez, D.L. Effect of Greenhouse Film Cover on the Development of Fungal Diseases on Tomato (Solanum lycopersicum L.) and Pepper (Capsicum annuum L.) in a Mediterranean Protected Crop. Agronomy 2023, 13, 526. [Google Scholar] [CrossRef]
- Ojiambo, P.S.; Gent, D.H.; Quesada-Ocampo, L.M.; Hausbeck, M.K.; Holmes, G.J. Epidemiology and population biology of Pseudoperonospora cubensis: a model system for management of downy mildews. Annu. Rev. Phytopathol. 2015, 53, 223–246. [Google Scholar] [CrossRef]
- Savory, E.A.; Granke, L.L.; Quesada-Ocampo, L. M.; Varbanova, M.; Hausbeck, M.K.; Day, B. The cucurbit downy mildew pathogen Pseudoperonospora cubensis. Mol. Plant Pathol. 2011, 12(3), 217–226. [Google Scholar] [CrossRef]
- López Camelo, A.F.; Gómez, P.A. Comparison of color indexes for tomato ripening. Hortic. Bras. 2004, 22, 534–537. [Google Scholar] [CrossRef]
- Van der Ploeg, A.; Van der Meer, M.; Heuvelink, E. Breeding for a more energy efficient greenhouse tomato: Past and future perspectives. Euphytica 2007, 158, 129–138. [Google Scholar] [CrossRef]
Figure 7.
PAR radiation (a) and photosynthetic activity (b) of cucumber crops with commercial plastic cover (■) and experimental plastic cover (■) in the 20/21 and 21/22 crop seasons.
Figure 7.
PAR radiation (a) and photosynthetic activity (b) of cucumber crops with commercial plastic cover (■) and experimental plastic cover (■) in the 20/21 and 21/22 crop seasons.
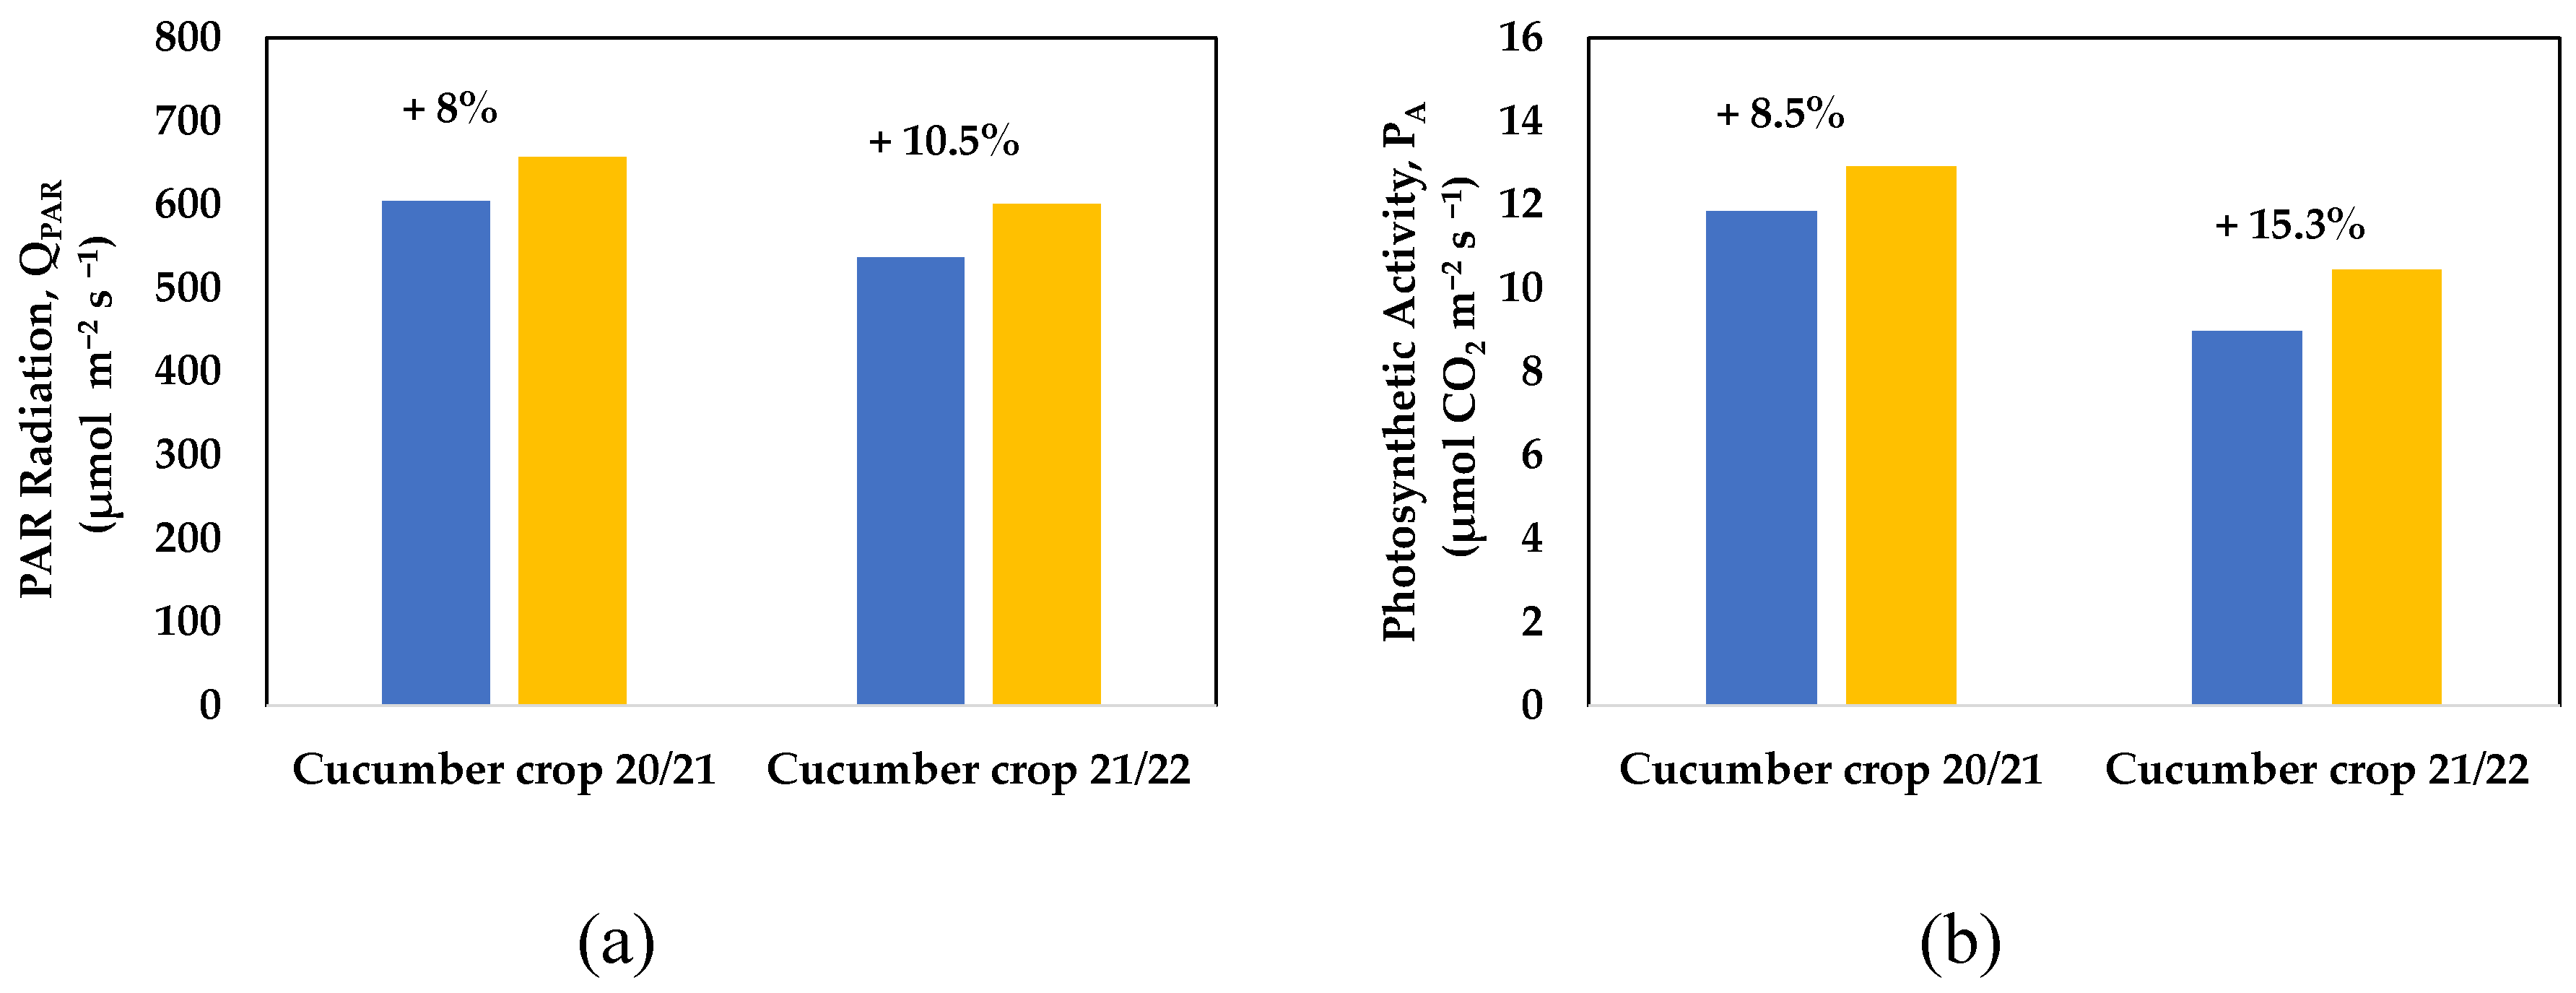
Figure 8.
Cumulative marketable (a) and total yield (b) of cucumber crops with commercial plastic cover (■) and experimental plastic cover (■) in 20/21crop season and 21/22 crop season.
Figure 8.
Cumulative marketable (a) and total yield (b) of cucumber crops with commercial plastic cover (■) and experimental plastic cover (■) in 20/21crop season and 21/22 crop season.
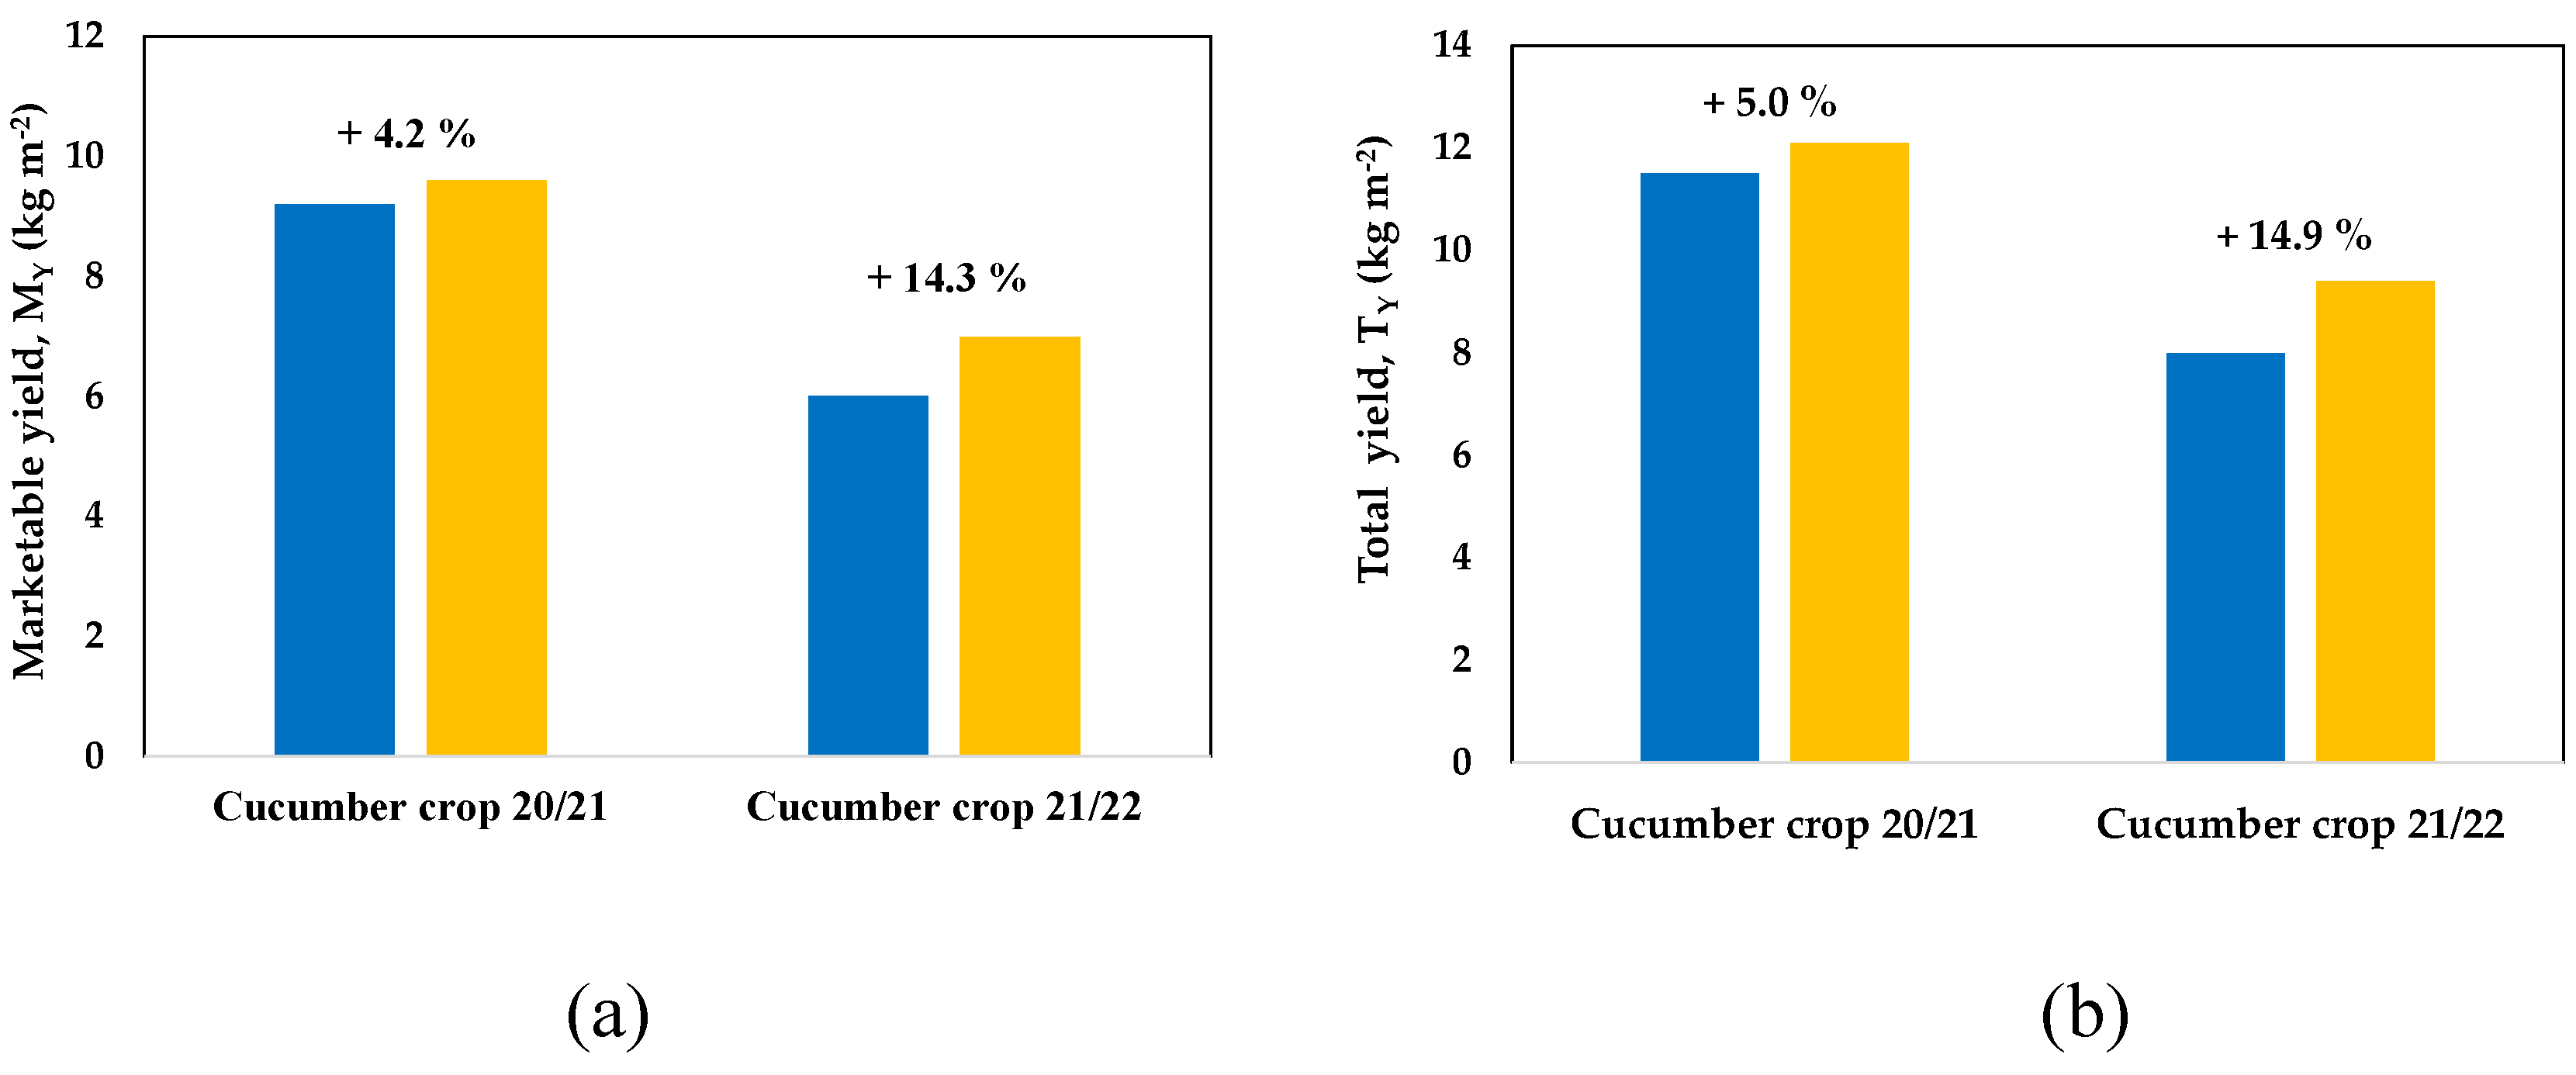
Table 1.
Characteristics of the two sectors of the experimental greenhouse. Sc (m2): crop surface Sv (m2): vent opening surface and Sv/Sc (%): ventilation surface/ greenhouse surface ratio.
Table 1.
Characteristics of the two sectors of the experimental greenhouse. Sc (m2): crop surface Sv (m2): vent opening surface and Sv/Sc (%): ventilation surface/ greenhouse surface ratio.
| Sector | Plastic cover | Dimensions | Sc | Crop season 20/21 | Crop season 21/22 | ||
|---|---|---|---|---|---|---|---|
| Sv | Sv/Sc | Sv | Sv/Sc | ||||
| West | Experimental | 40 m × 25 m | 1000 | 109.1 | 10.9 | 232.2 | 23.2 |
| East | Commercial | 40 m × 20 m | 800 | 84.9 | 10.6 | 193.9 | 24.2 |
Table 2.
Optical properties of the plastic cover used in the trial (provided by the manufacturer). Transmission of photosynthetically active radiation TPAR [400-700nm], TUV light transmission TUV [300-380], light diffusion D, thermal efficiency T.
Table 2.
Optical properties of the plastic cover used in the trial (provided by the manufacturer). Transmission of photosynthetically active radiation TPAR [400-700nm], TUV light transmission TUV [300-380], light diffusion D, thermal efficiency T.
| Sector | Plastic cover | TPAR | TUV | D | T |
|---|---|---|---|---|---|
| West | Experimental | 0.90 | 0.24 | 0.55 | 0.90 |
| East | Commercial | 0.85 | 0.24 | 0.60 | 0.85 |
Table 4.
Average, maximum and minimum values of temperature T [°C], relative humidity HR [%] and absolute humidity x [kg kg−1] measured at height of 1 m in the North, central and South areas of the two sectors of the greenhouse.
Table 4.
Average, maximum and minimum values of temperature T [°C], relative humidity HR [%] and absolute humidity x [kg kg−1] measured at height of 1 m in the North, central and South areas of the two sectors of the greenhouse.
| Cucumber crop season 20/21 | Cucumber crop season 21/22 | |||||
|---|---|---|---|---|---|---|
| T | HR | x | T | HR | x | |
| Average values | ||||||
| East-Commercial plastic | 15.6 ± 1.4 | 76.1 ± 5.2 | 0.0064±0.0005 | 17.2±3.0 | 78.8±2.8 | 0.0084±0.0007 |
| West-Experimental plastic | 15.8 ± 1.8 | 76.2 ± 4.7 | 0.0062± 0.0003 | 16.8±2.9 | 79.8±2.3 | 0.0087±0.0007 |
| Average daily maximum values | ||||||
| East-Commercial plastic | 30.8 ±1.4 | 92.2 ±1.5 | 0.0173±0.0030 | 28.2±3.7 | 93.4±1.9 | 0.0182±0.0044 |
| West-Experimental plastic | 31.9 ± 0.8 | 91.9 ±0.5 | 0.0191±0.0044 | 29.5±3.4 | 93.3±1.1 | 0.0175±0.0044 |
| Average daily minimum values | ||||||
| East-Commercial plastic | 6.7 ± 3.4 | 38.6 ±10.6 | 0.0020±0.0010 | 8.4±3.5 | 41.1±6.1 | 0.0029±0.0010 |
| West-Experimental plastic | 7.1 ± 3.1 | 39.5 ±9.5 | 0.0022±0.0010 | 8.6±3.2 | 43.4±5.1 | 0.0030±0.0009 |
Table 5.
Average value of percentage of infection at the end of the trial in both sectors of the experimental greenhouse. (Extracted from Ávalos-Sánchez et al. [31]).
Table 5.
Average value of percentage of infection at the end of the trial in both sectors of the experimental greenhouse. (Extracted from Ávalos-Sánchez et al. [31]).
| Sectors | Plastic Cover | Powdery mildew Sphaerotheca fuliginea |
Downey mildew Pseudoperonospora cubensis |
Gummy stem blight Didymella bryoniae |
|---|---|---|---|---|
| End of first crop season (24/12/2020) | ||||
| East | Commercial | 34.11b ± 30.32 | 19.05a ± 23.37 | 7.69a ± 19.30 |
| West | Experimental | 12.38a ± 21.18 | 15.79a ± 23.78 | 8.94a ± 20.18 |
| End of second crop season (18/12/2021) | ||||
| East | Commercial | 45.22b ± 34.93 | 47.14b ± 35.07 | 32.74b ± 37.58 |
| West | Experimental | 19.49a ± 24.17 | 37.86a ± 33.27 | 25.71a ± 33.15 |
a Values with different letters in the same column show statistically significant differences with a confidence level of 95.0% (p value ≤ 0.05).
Table 7.
Average values of the morphological parameters measured in plants grown in sectors with different plastic covers. Total length of the stem LS [cm], length of the apical meristem NT [cm], length of the internodes LI [cm], diameter of the stem DS [mm], number of nodes NN.
Table 7.
Average values of the morphological parameters measured in plants grown in sectors with different plastic covers. Total length of the stem LS [cm], length of the apical meristem NT [cm], length of the internodes LI [cm], diameter of the stem DS [mm], number of nodes NN.
| Sectors | Plastic Cover | LS | NT | LI | DS | NN |
|---|---|---|---|---|---|---|
| Cucumber crop season 20/21 | ||||||
| East | Commercial | 340.9a ± 175.4 | 24.9a ± 4.8 | 10.5a ± 1.8 | 13.6a ± 2.0 | 25a ± 9.3 |
| West | Experimental | 338.7a ± 173.0 | 23.2a ± 4.7 | 10.6a ± 1.8 | 13.9a ± 1.6 | 25a ± 9.5 |
| Cucumber crop season 21/22 | ||||||
| East | Commercial | 245.6a ± 184.3 | 13.0a ± 6.7 | 10.3a ± 2.0 | 11.2a ± 2.6 | 21a ± 11.1 |
| West | Experimental | 249.8a ± 184.8 | 13.3a ± 6.5 | 11.4b ± 2.2 | 11.8a ± 3.0 | 20a ± 10.4 |
a Values with different letters in the same column show statistically significant differences with a confidence level of 95.0% (p value ≤ 0.05).
Table 8.
Average values of the production quality parameters measured for plants grown in areas with different plastic covers. Weight WF [g], diameter DF [mm], fruit length LF [cm] and soluble solids content SSF [˚Brix]. .
Table 8.
Average values of the production quality parameters measured for plants grown in areas with different plastic covers. Weight WF [g], diameter DF [mm], fruit length LF [cm] and soluble solids content SSF [˚Brix]. .
| Sectors | Plastic Cover | WF | DF | LF | SSF |
|---|---|---|---|---|---|
| Cucumber crop season 20/21 | |||||
| East | Commercial | 474.3a ±105.4 | 33.8a ± 4.0 | 44.4a ± 2.7 | 3.7a ± 0.8 |
| West | Experimental | 463.0a ± 80.9 | 32.8a ± 3.1 | 44.7a ± 4.3 | 3.4a ± 0.5 |
| Cucumber crop season 21/22 | |||||
| East | Commercial | 399.5a ± 73.9 | 41.5a ± 3.7 | 33.4a ± 2.2 | 2.9a ± 0.4 |
| West | Experimental | 427.7a ± 99.6 | 42.5a ± 3.8 | 33.9a ± 2.8 | 2.8a ± 0.4 |
a Values with different letters in the same column show statistically significant differences with a confidence level of 95.0% (p value ≤ 0.05).
Disclaimer/Publisher’s Note: The statements, opinions and data contained in all publications are solely those of the individual author(s) and contributor(s) and not of MDPI and/or the editor(s). MDPI and/or the editor(s) disclaim responsibility for any injury to people or property resulting from any ideas, methods, instructions or products referred to in the content. |
© 2024 by the authors. Licensee MDPI, Basel, Switzerland. This article is an open access article distributed under the terms and conditions of the Creative Commons Attribution (CC BY) license (http://creativecommons.org/licenses/by/4.0/).
Copyright: This open access article is published under a Creative Commons CC BY 4.0 license, which permit the free download, distribution, and reuse, provided that the author and preprint are cited in any reuse.


