
Submitted:
14 October 2024
Posted:
15 October 2024
You are already at the latest version
Abstract
To address the complex challenges posed by climate change and its effects on surface environments, subsoil, and groundwater, evaluating the impacts of Degradation-Resistant Organic Compounds (DROCs), such as fats and oils, is crucial. Increasing variability in temperature and precipitation has exacerbated DROC dispersal, particularly near open dumps and poorly managed landfills. As a global pollution issue, DROC’s pervasive and persistent nature requires urgent attention. This study aims to develop and implement effective strategies to detect and describe the stages of DROC decomposition. Identifying sites where DROCs are trapped and their dispersion can facilitate planning remediation efforts and mitigating adverse effects on ecosystems and human health. The study focuses on evaluating DROCs’ annual spatiotemporal distribution, improving waste management practices, monitoring the subsoil, and implementing remediation strategies. DROCs persist through various stages in groundwater, making effective detection methodologies essential. Continuous monitoring, subsoil characterization, and diverse climatic observations are necessary, especially in areas with improper landfill selection. Poor waste management contributes significantly to DROC pollution, exacerbated by current consumerism and increasing waste. The research highlights the importance of improving waste management practices and judiciously selecting landfill sites to prevent further degradation. Apparent resistivity variations in the subsoil, linked to DROC dispersal, are analyzed to map affected areas and understand propagation under different environmental conditions. New tools and methodologies aim to enhance DROC monitoring and remediation strategies. Adopting sustainable waste management practices and carefully selecting disposal sites is essential to mitigating DROC’s impacts, reducing greenhouse gas emissions, and protecting environmental and public health. Addressing risks associated with excessive consumption, inadequate waste management, and poor landfill selection is crucial for restoring ecosystem resilience and environmental protection.
Keywords:
Climate change
; organic compounds
; wastes
; groundwater
; remediation strategies
1. Introduction
The economic growth worldwide has positively correlated with an exponential increase in population, urbanization, technological advancement, industrialization, and economic development, however, it also has a direct association with increased consumerism. Globally, the demographic increase in recent decades has exacerbated current consumerism and the rapid rise in the generation of solid and liquid waste (SLW), raising concerns about its potential impact on the atmosphere and contributions to climate change [1,2]. The generation of these wastes significantly contributes to greenhouse gas (GHG) emissions, exacerbating climate change. The worldwide average production of SLW by a person is approximately 0.74 kg per day, though this figure varies widely between countries, ranging from 0.11 to 4.54 kg per capita per day. The generation of SLW for 2025, is expected to reach 2.2 billion tons, not considering more than 1/3 of the remaining garbage uncollected [3]. By 2050, the global production of SLW is projected to reach 3.40 billion tons, with growth rates of 19% in industrialized nations and 40% in developing countries [4]. The major amounts of these wastes stem from daily activities in residential, commercial, and institutional sectors, driven largely by consumerism and intensified by climate change, rather than from exceptional events. Integrally the problem poses a significant worldwide challenge to the sustainability of superficial waters, groundwater water, air, and public health. Despite regulatory frameworks and infrastructure investments, consumerism continues with environmental degradation and social inequities, largely due to inadequate liquid and solid waste management (LSWM) [5]. In Mexico, despite the regulations outlined in the “Official Daily of Federation” in 2023 [6] (p. 10-37), waste management practices are often implemented indiscriminately, further exacerbating the issue. This problem is intensified by the uncontrolled expansion of many OAGDs, frequently used for final waste disposal. These sites generate emissions of GHGs, contributing to environmental degradation and, posing significant public health risks [7]. Since the latter half of the 20th century, the industrialization of México has intensified and increased the demand for raw materials to support rising consumption patterns among a growing population [8]. This has resulted in an uncontrolled expansion of many Open-air Garbage Dump (OAGD), which contribute not only to environmental degradation through leachate production but also generate GHG emissions to the atmosphere [9]. The issue has extended beyond rural areas, exacerbating environmental changes and contributing to climate change. Therefore, it could be said that in Mexico, rapid urbanization, industrialization, and resource consumption have intensified these problems, highlighting the urgent need to address LSWM more effectively and sustainably [10]. Like other regions, Mexico now faces significant environmental, social, and economic challenges linked to growing population and consumerism, which are closely associated with inadequate LSWM practices [3].
Mexican consumerism is evident in the proliferation of various sites by final deposit of LSW: Sanitary Landfills (SLs), Controlled Fills (CFs), and the uncontrolled areas occupied by OAGDs, where LSW does not receive any treatment [3]. Although sanitary SLs are globally recognized as effective for final disposal LSWM, they have become inadequate for handling the large volumes of waste generated over decades due to demographic growth. This issue, exacerbated by consumerism and poor LSWM practices, has led to an increase in GHG emissions globally, contributing to climate change [4,11,12]. DROCs within porous media of subsoil undergo anaerobic decomposition, producing fats and oils (DROCs). On (OAGDs, leachates from LSW, when unmanaged, become significant sources of GHG emissions, including methane (CH₄) and other gases. Consequently, inadequate LSWM at OAGDs has made them major contributors to global GHG emissions, exacerbating climate change [4,11,13]. DROCs contaminate groundwater, and air, destroy habitats, and obstruct the groundwater flow (ф) when their concentration and density are high. This OAGD behavior in the best manner possible highlights the need for LSW management practices to be sustainable [4,14].
To address these challenges, engineered landfilling techniques, advanced infrastructure, and recycling systems have emerged as promising solutions to minimize environmental harm and optimize natural resource use [15,16]. Proper site selection for landfills is crucial to prevent leachates from contaminating groundwater; however, not all sites have the ideal hydrological and granulometric conditions for landfill construction [17,18].
In Mexico, GHG emissions in 2000 were approximately 600 × 10⁶ tons of carbon dioxide equivalent (tCO₂e) [19] (p. 185), for 2024, taking as a baseline the emission levels produced in the 2000s, the emissions are projected to increase by a factor of 33.75, reaching approximately 54,000 × 10⁶ tCO₂e. This significant rise is largely due to diverse factors such as increased mobility, industrial activity, consumerism, and the recent economic recovery following the COVID-19 pandemic in 2020 [12]. During the pandemic in 2020, the GHG emissions in Mexico were 804 × 10⁶ tCO₂e, indistinctively the presence of world problematic health, the emission reflects the economic development and population growth. However, if supposed that the primary source of GHG emissions in Mexico continues to be fossil fuel combustion, and is persistently the inadequate LSWM practices, consumerism, and other effects in the environment are likely to lead to unremedied GHG emissions and could be a rise of 62.5% by 2050, reaching approximately 87,750 × 10⁶ tCO₂e. This figure reflects economic development and population growth.
High concentrations of leachates and the DROC’s decomposition in OAGDs could spread to aquifers in Mexico. Preventing environmental degradation by controlling and separating the leachates through effective LSMW practices is essential. In parallel, the detection of DROCs, as well as the monitoring of subsoil and groundwater systems, is crucial for site remediation. Understanding the distribution of DROC transformation stages on subsoil is critical because some compounds may adhere to aquifer walls and others interact with subsoil properties and the hydraulic parameters from the aquifer.
Factors such as the depth, porous media, the mass transport in porous media (TIMP), and groundwater ф direction, affect the concentration of DROCs are mentioned in [16,20,21]. Understanding to address the areas with DROC anomalies associated in subsoil with alterations due to the potential harm they can cause to an ecosystem, is a social interest. However, the recovery of groundwater, which provides collective well-being to society, is an activity that society must tackle in collaboration with governmental institutions [22]. Effective remediation requires a multidisciplinary approach, including public awareness, policy reforms, infrastructure improvements, and technological innovations [22]. The geoelectrical and geo-radar methods have been used to characterize landfills [23,24]. Geoelectrical methods have been successfully applied to detect groundwater contamination within surface-subsoil (S-S) systems [24]. Studies in various countries have detected and detailed contaminants [25,26,27,28]. Notably high lead contamination in buried waste was identified in Egypt [29]. The impact of environmental conditions on S-S systems was studied in Italy[30]. However, the effects of DROCs in S-S structures in fully have not yet been studied, mainly due to the nonlinearity in the mass diffusion equations as they travel through anisotropic TIPM. Therefore, to describe the stability, equicontinuity, and convergence of the methods used to define each DROC stage is essential. The stability, equicontinuity, and convergence, are due to the leachate compounds being denser than water, determining their adherence to aquifer walls or movement according to TIMP and ф. Some contaminants remain above the water table, while others migrate through the saturated zone, increasing their decomposition and adherence. The DROCs highlight issues related to the infiltration and accumulation of leachates from poorly managed landfills [22]. These insights are central to understanding the spatial-temporal distribution of DROCs in a coastal old OAGD in Guasave Municipality, which served as the final destiny of LSW for over 60 years. The principal information analyzed for the detection of DROC stages in this paper were two geoelectrical dipole-dipole surveys conducted in 2022 and 2023 to obtain apparent resistivity (ϱa) values and assess the transformation and invasion areas of DROCs. This study focuses on the contamination of subsoil layers in S-S systems, proposing strategies for managing contamination in areas affected by various stages of DROCs due to inadequate LSWM practices in an OAGD in Mexico.
2. Materials and Methods
2.1. Area Study
In the northwest of Mexico, an OAGD situated approximately 8.5 km from Guasave City and 8.15 km from Sinaloa River, better known as "The Agricultural Heart of Mexico," was selected for this study. The selection of this site was based on its potential to produce DROCs and its ecosystem transitioning from mountainous to coastal, enabling the study of the DROC’s transformation in the movement anisotropically TIPM originating in the Sierra Madre Occidental (SMO) traveling to the coast through the free and unconfined aquifer. In the late 1990s, one SL was built adjacent to this old OAGD, reducing its dependence.
Indistintivelly the OAGD has continued operating without any on-site remediation. The prolonged lack of remediation efforts has likely led to the accumulation of various contaminants mixed with leachates in the subsoil. The Sinaloa River Basin — where the OAGD is located — is vital to Mexico's economy due to the significant agricultural activities in which an important number of food products are produced. The total population in 2020 of Guasave Municipally was 289,370 people, with 50.6% being women and 49.4% men. From 2024 approximately is estimated a rise of 327,012 people [31]. The historical geology of the region has been significantly influenced by tectonic activity that occurred approximately 60 million years ago, marking the transition from the Late Cretaceous to the Paleogene period. This era is characterized by the rapid movement of the Pacific Plate colliding with the Farallon Plate, which subsequently subducted beneath the North American Plate. This tectonic interaction generated tensile stresses that resulted in folding and ultimately gave rise to the majestic peaks of the Sierra Madre Occidental (SMO) [32,33,34]. Hydric and eolic erosion of igneous rocks from the SMO has transported sediments to the surrounding areas. These unconsolidated sediments form the subsoil and surface soil, today are essential for agriculture in the region. The weathering processes enhance nutrient availability and water retention in soils, where this old OAGD; the production agricultural significantly impacting [35,36,37]. The annual precipitation ranges from 231.1 to 760.0 mm, with croplands replacing the original vegetation and the Sinaloa River serving as the primary water source for agriculture and human consumption [38,39].
2.2. Equipment Specifications and Data Processing in Tomographies
2.2.1. Tomography: Equipment Characteristics
Two geoelectrical tomographies (GTs) were conducted using a multi-electrode dipole-dipole array to measure the resistivity (ϱa) values in the subsoil surrounding the selected OAGD. The measurements were collected for two consecutive years: October 2022 (ϱa2022) and August 2023 (ϱa2023). The GT method involved injecting a direct current (DC) of 1 ampere (A) into the stratigraphic sedimentary layers of the subsoil. This DC was supplied by a SARIS-Scintrex resistivity meter, using two pairs of electrodes: one fixed (A-B) and one mobile (M-N). The separation between the fixed and mobile electrodes was maintained at 0.5 meters, consistent with the Wenner-type geoelectric method. The resistivity meter used had the following specifications: 1A- DC output, 100 W power, 500 volts (V) for voltage injection, 11 MΩ internal impedance, and frequency range from 5 to 6 Hz during each DC injection.
2.2.2. Methodology for Tomograph
The initial and final points of lines in each GTs lines were accurately positioned using a portable 13-channel Hammer/GPS device, ensuring precise UTM coordinates. The GsT lines started in the SW direction near the agricultural Tapachula Branch Channel and finished in the NE direction (SW-NE) just before the Hidalgo Drain, running nearly parallel to the penitentiary building located to the right of the OAGD (Figure 1).
Despite the extensive data collection, some transcription errors occurred during fieldwork. These errors were meticulously corrected during data processing, and the data were electronically processed and securely stored. To visualize the spatial distribution of annual ϱa values and enhance the finite-difference methodology, the ρa values from each GT survey were organized in x/z coordinates, where x represented length and z represented the vertical or depth. Subsequently, geoelectrical pseudo-sections were generated. The annual geoelectrical pseudo-sections were obtained using software that included parameters such as electrode separation A-B and M-N (for calculating the geometric constant array), the number of required steps, and the distances of each measurement from the initial coordinates. Kriging interpolation with SURFER 10.0 software was used to visualize the spatial distribution of each annual ϱa value [40].
2.3. TIMP Equations and DROC Criteria for ϱa Analysis
This part explored how ϱa and TIMP equations can be correlated to model and interpret the movement and retention of contaminants like DROCs, providing a deeper mathematical and physical context. The development of this research focused on evaluating ρa about the transport and retention of DROCs in porous media, using equations based on the TIMP model. For this, resistivity measurements were conducted using the 1-A-DC direct current method, following the methodology described by [41,42,43]. The measurements allowed us to determine the electrical properties of subsoil materials a foundational framework for interpreting the distribution of DROCs across different geological layers of the subsoil was provided, in both saturated and unsaturated zones. The anomalies analysis the determination of the temporal variation of ϱa values enabled, indicating the movement or retention of DROCs in various geological layers. Additionally, the anisotropy of the porous media was evaluated to determine its influence on the subsurface’s ability to retain or remove these contaminants. Zones with high and low DROC concentrations were also differentiated, allowing for the identification of anomalies corresponding to areas where contaminants might be migrating toward the geological basement in the free-type aquifer. Additionally, the anisotropy of the porous media was evaluated to determine its influence on the subsurface’s ability to retain or remove these contaminants. Zones with high and low DROC concentrations were also differentiated, allowing for the identification of areas where contaminants might be migrating towards saturated, not saturated zona, traveling over the water table or to the geological basement into the bottom from free-type aquifers.
The high probability of DROC presence was attributed to the long-term deposition LSW products containing leachates throughout the old OAGD lifespan. These organic compounds may have reacted over time, forming new substances and adding complexity to the system analysis. Laboratory studies detected DROCs as substances soluble in hexane (C6H14). This enabled the research to focus on DROC invasions during periods of TIMP anisotropy related to product mixtures in subsoil.
A key aspect of this analysis for modeling the anomalous transport process of DROCs in porous was using the Lévy-type diffusion coefficients dia. Unlike classical diffusion models, Lévy-type coefficients allowed the capture of irregular trajectories and random jumps in contaminant movement, which are common in heterogeneous and anisotropic media [44]. This proved particularly relevant in modeling the long-range transport of DROCs, enabling a more accurate interpretation of ϱa measurements and contaminant behavior over time. Using these coefficients helped us better understand the complexity of ф in subsoil, as the movement of DROCs did not follow a simple diffusion pattern. The anisotropy of the subsurface and the natural ф variations made resistivity measurements influenced by environmental factors and changing conditions in the porous media. This justifies the need to use non-linear diffusion models, such as Lévy-type coefficients, to adequately represent the anomalies observed in the apparent resistivity measurements over the years. The following section will develop the equations that respond to the previously described observations, linking apparent resistivity with the behavior of DROCs in the subsurface under the influence of TIMP anisotropy and Lévy-type diffusion coefficients.
To avoid inadequate formulations that present issues due to the lack of stability, equicontinuity, compactness, and convergence —factors that may arise when considering minimal assumptions or excluding attributes related to the annual variability of it was necessary to adopt approaches beyond classical diffusion models. To represent the journey of the OAGD through the subsurface geological layers via TIMP anisotropy and to formulate the transformation of apparent resistivity for each stage of OAGD, it was established that the ф in the areas surrounding the OAGD occurs as the sum of three types of ф: (1) an OAGD with ф produced by molecular diffusion, (2) another OAGD with ф produced by turbulent diffusion, and (3) an OAGD with ф produced by shear ф dispersion. Of these, the фs with the greatest magnitude in transport through the porous medium are molecular diffusion and turbulent diffusion, which can be modelled using functional operators suited to the anisotropic behavior of the porous system [45,46,47]. In this context, the traditional Laplace operators (), which do not account for abrupt changes in the S-S system, proved insufficient to represent turbulent ф. It was essential to consider that the movement of the TIMP through porous media is not smooth but includes jumps and discontinuities, necessitating the use of a generalized Laplace operator[48].
This generalized in operator approach extended the classic Laplacian operator through the Lévy-type-diffusion operator, capable of simulating these abrupt jumps and discontinuities in the transport processes through porous media. Incorporating this diffusion model allowed for better handling of the complex spatiotemporal dynamics of DROC concentration levels, whose behaviur shows both linear (continuous) and nonlinear (discontinuous) characteristics depending on stochastic conditions [49,50,51].
This approach enabled precise simulation of transport phenomena in complex porous media, accounting for both predictable continuous ф and abrupt, unpredictable changes caused by nonlinear dynamics. To reduce uncertainty in predicting the convergence of both movements within the porous medium, where the analysis of spatiotemporal variability for ρa with a monotonic finite-difference scheme was selected.
This scheme was enhanced by combining general nonlinear Lévy-type diffusion equations with constant equations of little to no spatiotemporal variability. These combining nonlinear and lineal elements were represented in the next equation [52]:
where ρa (x, t) was the annual solution obtained in Ω-m from ϱa, and ∂tu the nonlinear equation associated with the behavior from TIMP and ρa (x, t), reflecting the changes in the complex i system of the OAGD; Lσ, μ was the numerical operator used to simulate Lévy-type diffusion in the porous media of subsoil, both linear and nonlinear movements of the TIMP and, defining the spatiotemporal dynamics of anisotropic transport in the areas adjacent to the OAGD, and (u) the numerical operator and represent the linear movement utilizing non-decreasing and completely continuous equations.
The first term in equation 1 is generally known as the porous media equation and common is associated with predetermined non-negative scalar magnitudes in space and time; in this case, for ρa = ρa (x, t), it was s represented as follows [53]:
where, ∂tu = Δ(um) occurs in dimension d equal to or greater than the unit (∂tu = Δ(um) ∈ d ≥ 1), m was as a constant greater than the unitary value (m > 1) and, Δ = Δx was the Laplace operator interacting with the spatial variables. Given that and represented the Laplace operator expression), then in generalized terms the equation 2 can been represented as follows [53]:
where was a term refers to the temporal derivative by measuring its changes over time at a given spatial point between the compatible distance from 25 to 73 m of both GTs, and it resulted crucial for modelling the temporal dynamics of contaminant transport and dispersion in the subsoil; was the diffusion coefficient depended from the value acquired and described how the contaminants have variations indicates wit resistivity and how they were propagated in the subsoil through the porous media, this coefficient may vary with the concentration of OAGDS in the subsoil; the spatial gradient of , and it measured how this change are based on the position , this term was fundamental for modelling the anisotropic transport of contaminants in the porous media; was the punctual product by the gradient and diffusion of ) using a divergence operator for describing the net ф of apparent resistivity through any given volume.
Equation 3 describes changes in resistivity present with the diffuse in space and describes the evolution form of apparent resistivity based on its spatial and temporal gradients, enabling the characterization of contaminant transport in complex porous media, such as those near OAGDs sites form of apparent resistivity based on its spatial and temporal gradients, enabling the characterization of contaminant transport in complex porous media, such as those near to OAGDs sites [54].
In the second term of equation 1, theoperator was nonlinear diffusion and its combined dynamics was obtained summing terms of the following equation:
Where represented the simulated portion of the probabilistic model that described random movements within the subsoil in the porous media using the parameters ϕ and TIMP. On the other hand, was the local probabilistic representation of anomalies or noise, which masked the information about real movement that was not considered in the acquired value of
In this study, the diffusion operator modeled processes involving jumps, corresponding to a generalization of Laplace operators, commonly associated with Levy processes—probabilistic models that describe random movements with a discontinuous increment to obtain the variations ρa within geological layers due to interconnection parameters like density, weight, texture, porosity, and aquifer hydraulic properties, affecting DROCs degradation.
This presentation through equation 1, was a methodology that enabled the examination of traction with movements that are not strictly smooth, where the anisotropy of TIMP could also exhibit abrupt changes. It also allowed us to map these factors for low qualitative assessment of DROC coverage and degradation through ρa distribution. This mapping helps discuss results to define the DROC phases in the S-S system and link them to GHG emissions (CO2 and CH4). Identifying these areas is essential for estimating GHG emissions and addressing their environmental impacts, which climate change is accelerating. Substances such as C6H14, fatty acids, soaps, fats, waxes, hyDROCarbons, and oils play a significant role in LSWM strategies to mitigate these effects.
2.4. Dynamic Nature of DROCs and Their Association with ρa Values
The literature indicates that changes in the typology of ρa anomalies at specific sites are often correlated with anisotropy in the porous media of the subsoil, especially in contaminated DROC sites. According to [55] and [56], high ρa values typically characterize "aged" (IA) or "mature" DROCs invasions. These highly conductive anomalies are associated with DROCs entering porous media, where they undergo metamorphosis or transformation. Analyzing the spatial distribution of ρa values over time helps identify areas traversed by DROCs in saturated and unsaturated zones from the aquifer. Three types of displacements influenced by TIPM anisotropy and three configurations of final deposition are observed. The following scenarios describe these possible final DROCs distributions:
- Controlled Displacement from the Surface: Parameters such as transmissibility, storage capacity, effective porosity, and hydraulic conductivity of the unconfined aquifer determine the DROCs' movement to deeper zones, characterized by heavier masses.
- Continued Travel of Substances: DROCs may have different arrival times at the water table. This could involve two types of movements over the water table or continued travel within the aquifer, contributing to the spread of contamination.
- Arrival of Heaviest DROCs at the Aquifer Bottom: The heaviest DROCs may settle at the bottom of the aquifer.
- To analyze the associations between ρa2022 and ρa2023 and their respective DROC phases, we followed the principles established in equations 1, 2, 3, and 4, which account for both linear and nonlinear representations simulating the anisotropy of TIMP. In this context, we considered the measurements of ρa, incorporating both previously reported limits and ranges found in the literature, as well as new ranges proposed for the first time in this study:
- RI Phase: Characterized by high ρa values (>35 Ωm), following the criteria of [23].
- RI/II Phase: For the DROCs interface within the old/intermediate zone the range of 25 to 35 Ωm was proposed.
- II Phase: Associated with the zone between RI/AI, where DROCs metamorphosis occurs, with a range of 18–25 Ωm.
- Leachate-Free (Flw) Zone: Defined by a range of 11 to 18 Ωm, as reported by [28].
2.5. Correlation Analysis of ρa2022 and ρa2023 with DROCs Transformation Phases
To analyze the annual ρa measurements, a detailed statistical assessment was conducted for each dataset. For both ρa2022 and ρa2023, key statistical parameters were evaluated, including minimum (ρamin) and maximum (ρamax) values, mean (), median (ρam), mode (ρaMo), and total sum (Σρa) [57]. Dispersion parameters included absolute range (Rabs), standard deviation (σ0), variance (σ²), determination coefficient (R²), non-determination or alienation coefficient (k = 1 - R²), coefficient of variation (Cv), standard error of (SE), and correlation coefficient (R). Symmetry was assessed using skewness (Swew_ρa) and kurtosis (Kurt_ρa), as well as positional statistical parameters Q25th and Q75th. Given that only two annual samples were available, estimating the 95% confidence intervals (95% CI) was necessary to represent the full range of DROCs distribution across the site [57].
Differences between ρ̅a, σ0, and σ² across years were attributed to the behavior of ρa in specific zones within porous media, reflecting transformations and interactions with TIPM. These variations between ρa2022 and ρa2023 represent the cumulative impact of Flw zones and DROCs invasion/transformation phases (RI, II, AI, Flw zones), which can vary in magnitude and shape over time under TIPM influence. Statistical software packages, STATISTIC 7.0 (SSI, 2004) and PASS 2.7b [58] were used to compute these parameters. The coefficient of alienation (1 - R²) at each stage (%) characterized the transformed mass and annual coverage (m²) affected by TIPM. Linear regression analyses were performed to validate the association between ρa values and DROC invasions, focusing on vertical variations in DROCs within materials drilled to depths of 22 m and 58 m outside the garbage dump during 2023 monitoring.
3. Results
3.1. Annual Dynamic Processes of DROCs Stages
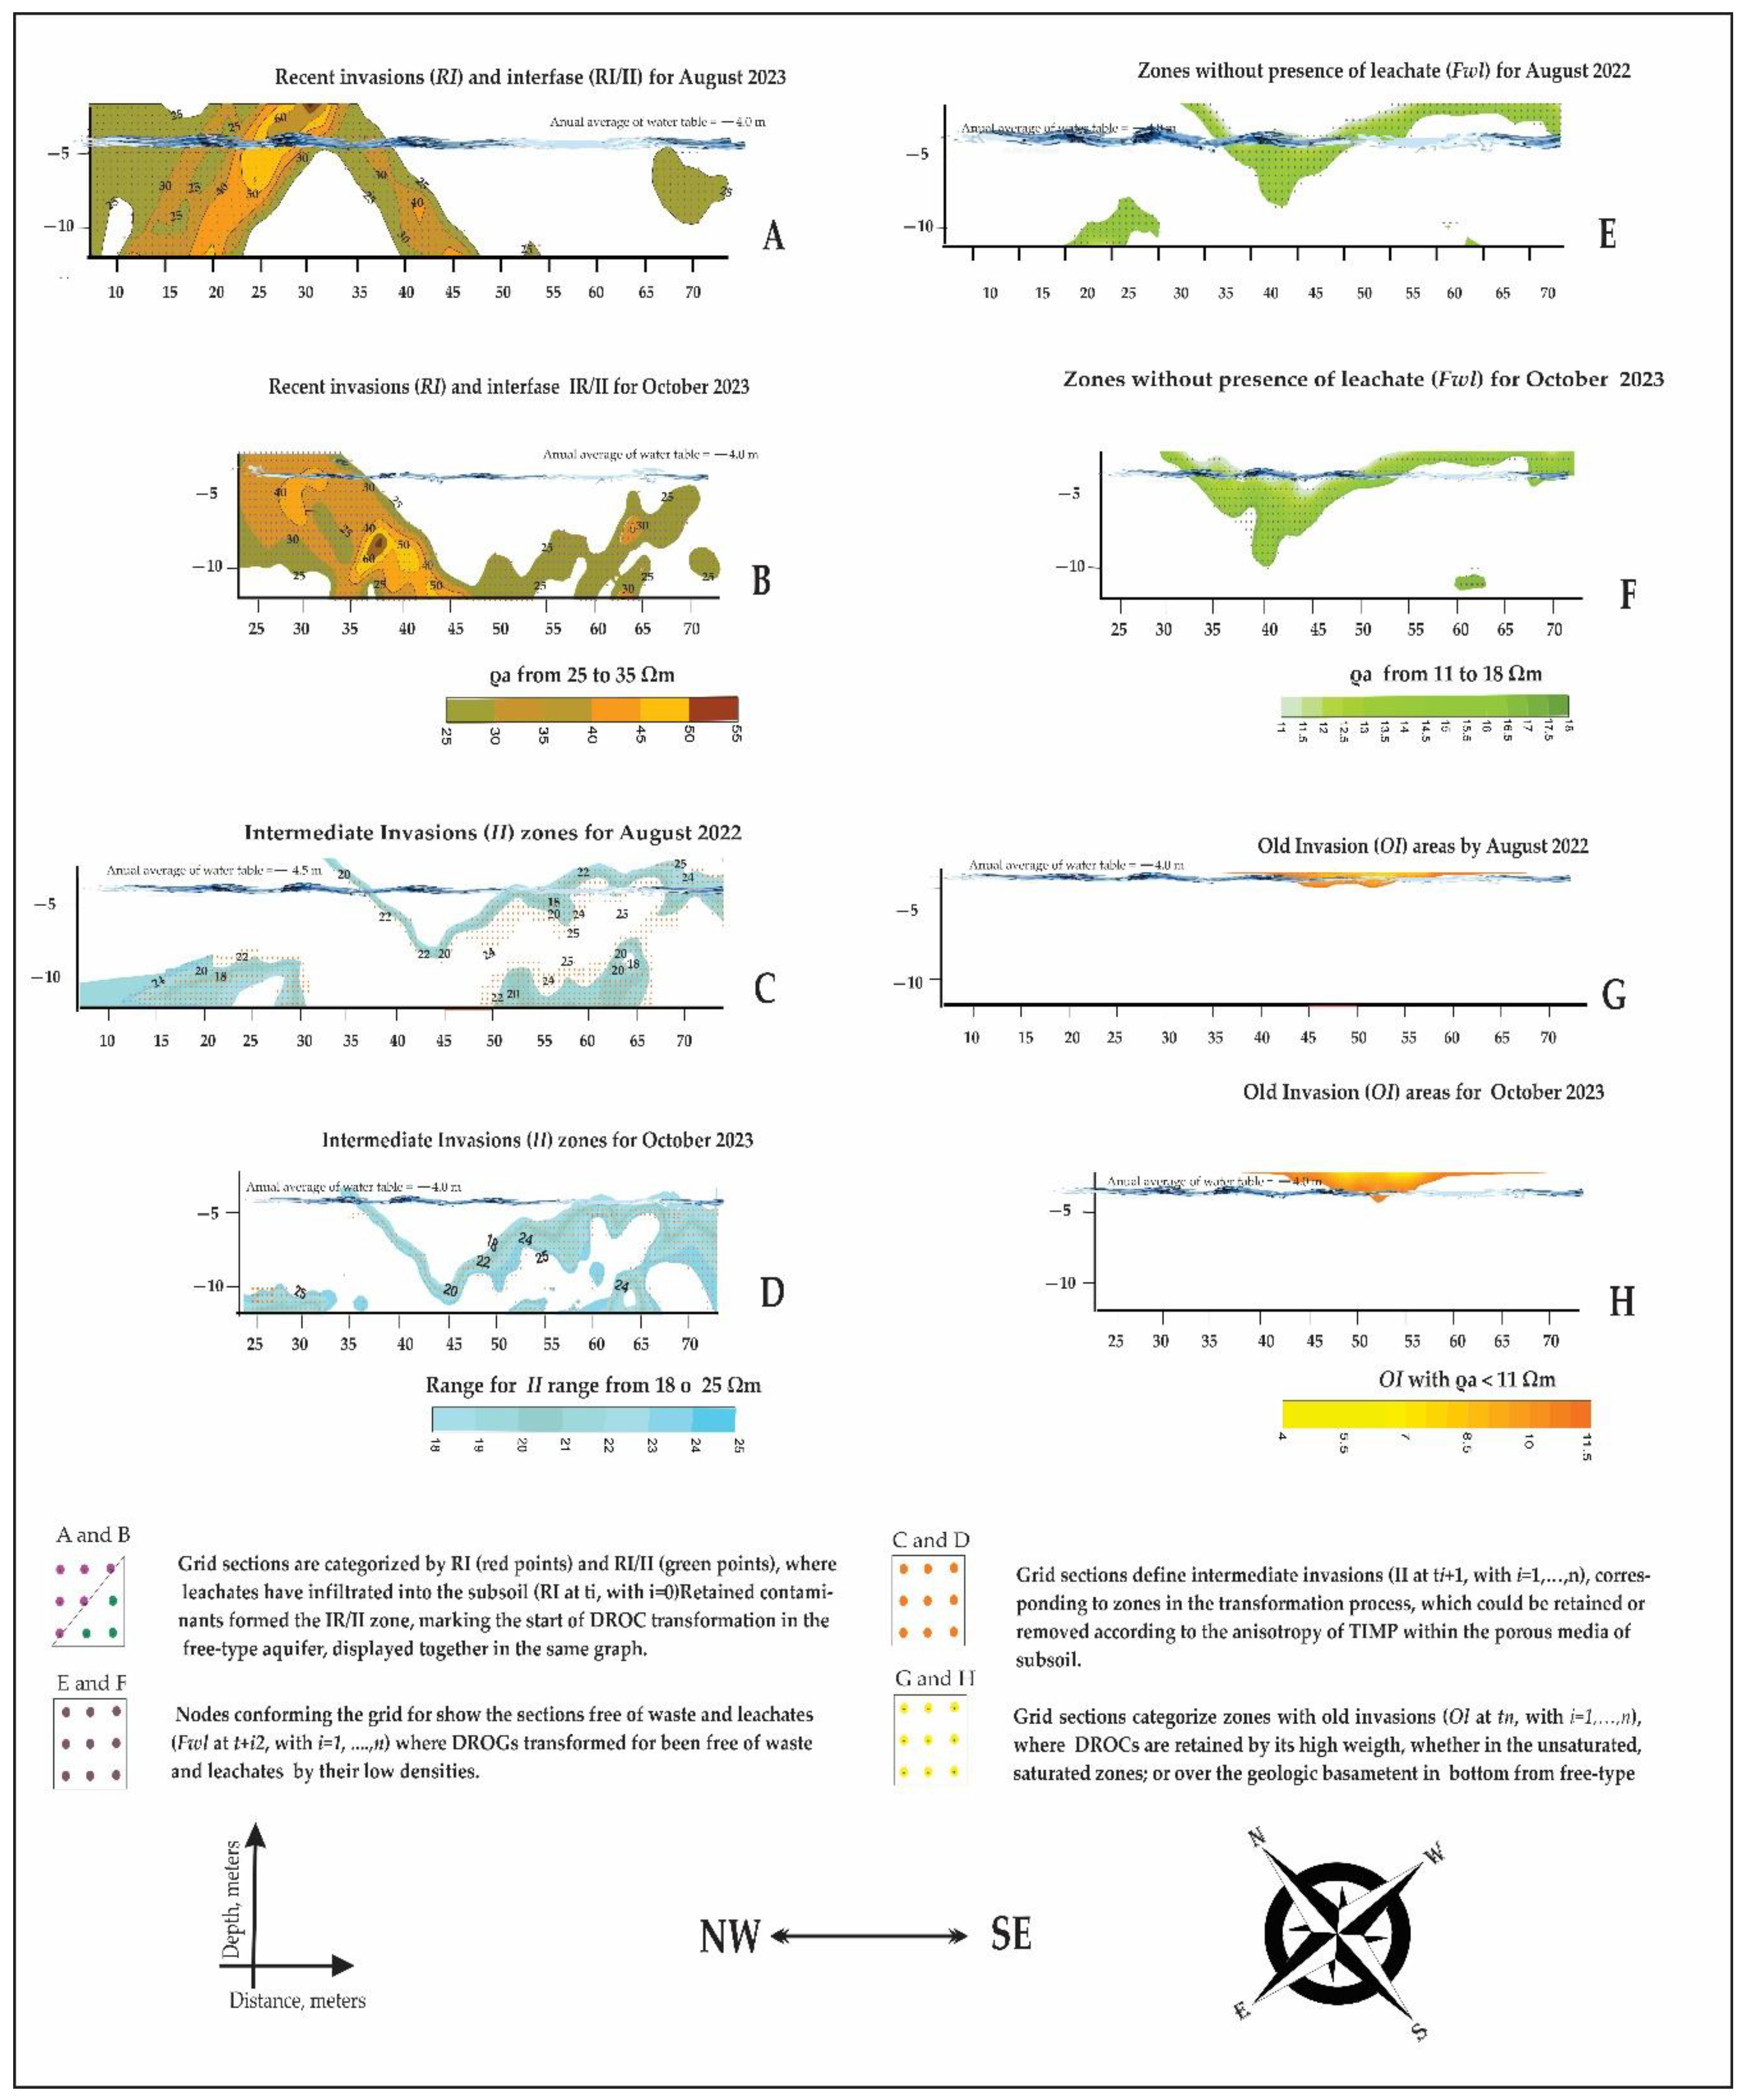
In the NW-SE direction—similar to the regional groundwater ф in the area—the annual measurements from ρa highlighted dynamic processes in the subsoil zones adjacent to the OAGD. These zones provided valuable information on the spatial variation of DROC stages in 2022 and 2023, illustrated in graphs A and B of Figure 2. The 16-meter length disparity between the lines can be attributed to the uncontrolled expansion of the garbage dump one year after the initial measurements, complicating the full analysis of DROC dynamic processes in the initially proposed exploration area of 846.6 m².
To address this, the focus shifted to a smaller, more consistent area of 647.40 m², where both annual datasets provided comparable information. This refined focus allowed for a more accurate analysis of the spatial variability and dynamic processes of DROCs, improving the detection and examination of transformation processes and phase interfaces.
The regions identified with significant changes under varying environmental conditions provided valuable insights into DROC behavior. This analysis is crucial for understanding the impact of uncontrolled waste expansion on subsoil properties and developing effective LSWM strategies. The normality test confirmed that both ρa2022 and ρa2023 datasets followed a normal distribution, with Shapiro-Wilk values of 0.91 and 0.99, respectively. Statistical parameters derived from the PASS 2.7 program are summarized in Table 1. The minimum and maximum ρa values were 7.31 and 6.54 Ωm (ρamin) and 56.88 and 42.18 Ωm (ρamax) for 2022 and 2023, respectively. The mean ρa (ϱ̅a) was 20.5 Ωm in 2022 and 23.43 Ωm in 2023, with mode values (ϱaMo) of 21.93 and 23.65 Ωm.
The sum of ρa (Σϱa) was 2193.34 Ωm for 2022 and 2365.66 Ωm for 2023. Dispersion parameters, absolute range (Rabs) in Ωm for 2022 was 49.67 and in 2023 35.,64, σ0 respectively in the same years were 8.82 Ωm and 7.74 Ωm, while the variance (σ²) was 77.87 Ωm² in 2022 and 59.95 Ωm² in 2023. Coefficient of variation (CV) values were 40.23 in 2022 and 32.73 in 2023, with determination coefficients (R²) of 0.88 and 0.77, respectively. Skewness (Swew_ρa) ranged from 1.30 to 0.082, and kurtosis (Kurt_ϱa) ranged from 2.48 to -0.31. The geometric mean (Mg) varied from 20.37 to 22.24 Ωm. The 25th percentile (Q25th) ranged from 16.86 to 18.17 Ωm, and the 75th percentile (Q75th) ranged from 25.60 to 29.17 Ωm.
The results suggest that the DROCs at the RI/II interface experienced minimal changes in characteristics between 2022 and 2023. The consistency of ρa values over time indicates a stable condition in the subsoil's electrical and potentially chemical properties. The refined focus on a smaller, consistent area allowed for a more accurate analysis of DROCs' dynamic processes and highlighted the need for ongoing monitoring and remediation in OAGD environments. This stability is essential for understanding the long-term impact of waste decomposition on subsoil properties and serving to inform more effective LSWM strategies.
3.2. Assessment of Subsoil Dynamics Using 95% Confidence Interval
According to [57] criteria, the 95% CI range for ρa2022 was from 20.20 to 23.66 Ωm and for ρa2023 it was from 22.13 to 25.17 Ωm. Notably, both 95% CIs have true ϱ̅a values with relatively narrow ranges (3.46 for 2022 and 3.04 for 2023). The differences in ranges were slightly higher in 2022 (0.42). Overall, the ϱ̅a values for ρa2022 and ρa2023 exhibit very similar behavior; however, in 2022, the 95% CI of the ρa distribution was less compact than in 2023 (21.93 Ωm < 23.66 Ωm). Consequently, σ0 and σ2 showed significantly higher values (greater dispersion) in 2022 (8.82 Ωm > 7.74 Ωm). Despite the minimal variations observed in the two sets of ICI95% results, notable disparities were detected in the behavior of σ2 values, with higher values noted in ρa2022 (77.87 Ωm2 > 59.95 Ωm2). The general variation in measurements deviated from by approximately 8.82 Ωm in 2022 and 7.74 Ωm in 2023. The 2023 distribution presented a higher grade of homogeneity, characterized by lower σ2 values (59.95 Ωm²). These findings suggest a dynamic in the subsoil related to DROCs degradation, where its aggregates persist within the porous media of the subsoil since the inception of operations at the OAGD in the area. To associate σ0 and σ2 of annual variation of ϱa as an indicator of increases or decreases on the entire DROCs was considered not incorrect because the ф intensity and the TIMP are not constant and have heterogeneity and anisotropy mediated in subsoil by TIMP.
3.3. Evaluation of Linear Relationships and Model Fit for Subsoil DROCs Variability
In the area where annual measurements coincided, Part C of Figure 2 depicts the Coefficient of Correlation R (1, -1) and coefficients of determination R² (0, 1) for [ϱa2022 vs. ρa2023], illustrating a linear association. The correlation coefficient R = -0.745 indicates an inverse relationship: as ϱa2022 values increased, ϱa2023 values decreased. The graphical representation shows dispersion values starting with minimal density in the lower left and increasing towards greater dispersion at the upper right.
This correlation pattern revealed two distinct regions with varying adjustment levels. The lower left zone showed a good fit, with minimal and unbiased differences between observed values and model predictions. In contrast, the upper right zone exhibited undesirable residual patterns, indicating bias in the results. The data graphically in part C of Figure 2 shows a clear decreasing linear trend. However, the correlation coefficient of R = 0.745 indicates that while 74.5% of the total information follows a linear trend, the remaining 25.5% does not align perfectly. The misalignment in the dataset over time is attributed to changes in the subsoil of DROCs, leading to new massif conditions influenced by TIMP and the potential of ф. The precise determination of how validate the model adjusted and understand how much the annual measures information could describe the annual changes indicatives of the transformation process of one to other phases of DROCs was carried out through the magnitudes acquired between the R² and R²_ adjusted coefficients.
The information associated with the annual changes of DROCs represented through the factor K, and to obtain is could use the factor R², but on this occasion, it was not obtained on this manner; the best option by it precision was the adjusted R², hence the results of factor K were presented applying the expression K = 1 - R²_adjusted. The results of the R² and R²_adjusted coefficients appear in Figure 2, this graphical representation of the model, showing the data distribution adjusted to a linear trend. Note the approximate similarity in the magnitudes of both coefficients represented by a minimal difference of 0.05 units, defined by the values R² = 0.55 ≈ R²_adjusted = 0.50.
The proximity in the magnitudes of coefficients R2 and adjustmen_R2 allowed establishing the model's fit certainty with the annual data used, regarding its linear trend behavior through the equation ρa2023 = 9.312*0.65ρa2022. Considering this similarity between coefficients indicating a high probability that the model will have good predictive performance in the annual distribution of the areas occupied by the transformed DROCs, and the measurements provide a well-structured model, the adjusted R² value was chosen to define the sites that occupy the new zones with DROCs in the subsoil porous system. Thus, both measurements significantly contributed to the model's fit, and observing no penalty for the variables, as both are explanatory in the model, suggested that the model variables were relevant and necessary. It was indicated how much of the information shared its σ² and also the remaining information K (1-R²_adjusted = 0.05) of 50%, which represents the information within the porous system that occupies the space with the annual changes of the different DROCs phases distributed in the subsoil. Regarding time, the amount of leachate generated in the OAGD since the moment that primary arrives at the porous media of subsoil is dispersing and transforming to constitute the new zones with changes in the concentration of DROCs, and this similarity between coefficients allowed the establishment of a model that not represent noise in the adjustment relevant and robust information over these new zones represent the phases of DROCs transformed. Concerning R² = 0.55, the shared σ2 between ϱa2022 and ϱa2023 was practically the same result as R2_adjustet.
3.4. DROCs Transformation Dynamics and Invaded Areas: Linear Nonlinear Analysis
According to the model results, perceptually 50 % have not shared information on measures corresponding to DROCs transformed and one year after on subsoil occupying the areas invaded according to the next process:
- (1)
- The transformation of DROCs begins with the arrival of leachates from the surface, originating from the OAGD. These total invasions characterize the IR zone, which can encompass both the saturated and unsaturated zones of the aquifer and serve as a continuous source feeding the subsoil system of DROCs that will be transformed through the dynamics of the porous medium.
- (2)
- An interface IR/II indicating changes in the concentration of leachates arriving before the transformation process, and are now tending to reach the next intermediate phase II.
- (3)
- The intermediate phase II usually accumulates the most amount of mass/time due to the retard and prolonged process required to reach the conditions to reach the next phase.
- (4)
- The final stage of the process determines the status of DROCs: either it is retained within the porous medium or completely purged from the groundwater system. Independently of all these transformation processes of DROCs, there is a zone characterized by its granulometric conditions, predominantly represented by the presence of clayey bodies. This gives it high not-permeability against the invasion of leachate-laden water according to ф, allowing it to remain with zones unpolluted.
- (5)
- The Flw zone is usually found in the aquifer's unsaturated zone close to the surface. Here, there is a risk that it could break through the impermeable layer of its geological structure, which might turn it into a leachate zone.
3.5. Analysis and Association with RI Stage
The transformation of DROCs began immediately after leachates entered the porous media, initiating their progression from the RI stage until they reached their final state, either dispersed or retained within the unsaturated or saturated zones of the aquifer. The measurements obtained at the OAGD site reflect significant annual differences between 2022 and 2023. In 2022, ρamin and ρamax values ranged from 25.17 to 56.87 Ωm, with an average ϱ̅a of 33.07 Ωm. The σ0 of 8.1 Ωm and the σ2 of 66.73 Ωm² indicated considerable dispersion, reflecting variability in subsurface conditions during that year. Additionally, the total sum Σϱa was 893.02 Ωm, suggesting greater variability in leachate behavior. In contrast, in 2023, the resistivity values ranged from 25.01 to 42.18 Ωm, with an average ϱ̅a of 31.0 Ωm. The σ0 decreased to 4.49 Ωm, and the σ2 dropped to 20.20 Ωm², indicating less variability compared to 2022, even though the total resistivity Σϱa increased to 1271.295 Ωm. This suggests a greater accumulation of contaminants but with a more homogeneous distribution. The ICI95% for 2022 ranged from 20.20 to 23.66 Ωm, while in 2023, it ranged from 22.13 to 25.17 Ωm. The annual differences of 3.46 Ωm in 2022 and 3.04 Ωm in 2023 reflect a slight decrease in resistivity in 2023, indicating a stabilization in the DROC transformation process within the subsoil. In summary, the annual changes in ρa, σ0, and σ2 between 2022 and 2023 highlight the evolving subsurface conditions, especially in the initial phase of DROC transformation. The greater dispersion observed in 2022 may be related to the arrival and initial transformation of leachates in the porous media, while 2023 showed a more stable and homogeneous distribution. These results are crucial for understanding the dynamics of leachates in the OAGD environment and help develop effective environmental management strategies.
3.6. Annual Variation ϱa on Subsoil for Interface RI/II
The ρa values at the RI/II interface were 25.17–33.63 Ωm in 2022 (ρa2022) and 25.01–34.62 Ωm in 2023 (ϱa2023), indicating minimal changes in the characteristics of DROCs over time. The ranges of ϱa values at this interface were similar between the two years, with 2022 showing a range of 25.17–33.63 Ωm and 2023 showing a range of 25.01–34.62 Ωm. This stability suggests that DROC characteristics at this interface remained relatively constant throughout the time duration of this study. The minimal variation in ρa values at the RI/II interface between 2022 and 2023 suggests a low degree of change in DROCs' characteristics over time.
This stability implies that the subsoil's electrical and potentially chemical properties in this area of the OAGD environment remained consistent. Such findings are essential for understanding the persistence of DROCs in the subsoil and assessing the long-term impact of waste decomposition in the region. This stability could indicate that the environmental conditions at this interface allow for a slow degradation or transformation of DROCs, making it crucial to consider when developing remediation strategies for similar environments.
3.7. Characterization AI Invasions and Degradation
The statistical results of the TIPM anisotropy/S-S interaction in the AI phase illustrate significant variations in ϱa annual measurements between 2022 and 2023. In 2022, the ϱa values (ρamin and ρamax), ranged from 25.17 Ωm to 56.87 Ωm, with a total Σρa of 893.02 Ωm. The average was 33.07 Ωm, with a σ0 of 8.1 Ωm and σ2 of 66.73 Ωm². In contrast, the 2023 measurements showed ϱa values ranging from 7.30 Ωm to 10.79 Ωm, with Σϱa of 78.07 Ωm, of 9.75 Ωm, σ0 of 1.35, and σ2 of 1.82 Ωm². The annual differences in statistical parameters between 2022 and 2023 were as follows: Δρamin = 6.54 Ωm, Δρamax = 10.61 Ωm, ΔΣϱa = 54.46 Ωm, Δ = 9.07 Ωm, Δσ0 = 1.63, and Δσ2 = 2.65 Ωm². These differences highlight a significant decrease in ϱa values and variability from 2022 to 2023, indicating changes in the subsoil conditions or composition, potentially due to environmental factors or ongoing OAGD processes. Furthermore, the reduction in area cover for the AI phase, monitored at a rate of 12 m²/year (from 49.92 to 37.44 m²), underscores the resilience of the subsoil in these areas. This minimal decrease in area cover can be linked to natural Flw processes, with 112.32 m² transitioning into Flw zones in 2023.
The dynamics in Flw zone from 2021, when this research began, to 2023 exhibited fluctuations: 37.92 m² (2021), 49.92 m² (2022), and 37.44 m² (2023). The positive correlation and the linear regression equation indicate a significant relationship between the ϱa values of 2022 and 2023, with 55% shared variability over the studied depth range.
Figure 3.
Annual variations in Ωm of apparent resistivities within anisotropic TIMP travel in the subsoil surrounding OAGDs were measured along a NW-SE direction intersects the preferential direction of groundwater flow. Measurement reflects the association spatiotemporal of changes in concentration for each stages of DROCs on subsoil.
3.8. Results of Evolution from Flw Zones
The evolution for Flw zones revealed that 90% (61.25 m²) maintained consistent ϱa values (R² = 0.90) between 2022 and 2023, indicating a minimal change in leachates presence. However, a 10% area (61.25 m²) showed increased ϱa, likely due to new leachate infiltration, influenced by the dynamic anisotropy of TIMP in the aquifer. In part C of Figure 2, the linear regression showed a positive correlation of 74.5%, highlighting spatial clusters of similar ϱa values. A linear regression equation ρa2023 = 0.65 ρa2022 + 9.31 depicted a shared variability of 55% between 21 to 73 m, illustrating consistent trends in ϱa over the studied area. In 2022, the Flw zone exhibited ρa2022 values ranging from 11.17 to 17.87 Ωm, with Σρa = 379.56 Ωm, average = 15.1 Ωm, σ0 = 2.12 Ωm, and σ2 = 4.52 Ωm². In 2023, the range was from 11.88 to 17.98 Ωm, with ΣX = 271.21 Ωm, average = 15.06 Ωm, σ0 = 2.08 Ωm, and σ2 = 4.33 Ωm². The slight differences in Δ = 0.11 Ωm, Δσ0 = 0.046 Ωm, and Δσ2 = 0.19 Ωm² between the two years suggest a stable trend in the Flw zones between the two years suggest a stable trend in the Flw zones, hence, the ϱa characteristics of these zones remained largely unchanged.
The consistency in trends of statistical parameters suggests that ϱa characteristics are influenced by underlying geological features and leachate dynamics. These stable ϱa values and minimal annual changes in the Flw zones highlight the effectiveness of porous media in the subsoil surrounding the OAGD in preventing pollution processes. The observed variance in ϱa, in a small portion of the area, underscores the need for continuous monitoring to manage new leachate infiltration effectively. The spatial correlation and linear regression analysis further validate the consistent trends in ϱa, providing valuable insights into the subsoil dynamics and the behavior of leachate in the OAGD environment. These findings emphasize the importance of understanding geological features and their interaction with leachate dynamics to ensure effective OAGD management. The consistent ϱa measurements indicate a stable subsoil environment, which is crucial for maintaining the integrity of the Flw zones. Additionally, the slight increase in ϱa in certain areas highlights the dynamic nature of the OAGD environment and the potential for new leachate infiltration. Continuous monitoring and analysis of ϱa trends are essential for the early detection and management of changes, ensuring the long-term stability and environmental safety of OAGD sites. The study’s results contribute to a better understanding of the interactions between leachate and geological features, offering a foundation for developing more effective strategies for OAGD management and pollution prevention.
3.9. Causes of Degradation in DROCs Stages
Delving deeper into the dynamics underlying DROCs degradation, this study invokes the mass transfer principle to unravel the intricate interplay between environmental dynamics and material migration within OAGD ecosystems. This analytical approach facilitates the inference that the OAGD’s yearly dynamics, particularly within the zone where annual measurements were shared, act as catalysts for the migration of DROCs from the surface, crossing geological layers in the subsoil at different depths (Result ϱa2021: 81.12 m²; Result ρa2022: 168.48 m²; Result ρa2023: 255.84 m²). This nuanced understanding of DROC degradation in the subsoil underscores the complexity of OAGD ecosystems, where environmental factors intricately interact with geological materials and groundwater properties to shape subsoil dynamics over time. Such insights have profound implications for WMLS in OAGS and propose remediation strategies, advocating for a holistic approach that integrates computational modelling with empirical observations to inform effective decision-making processes [59]. The observed changes are particularly driven by heightened contamination risks during specific periods, due to decreases in annual precipitation average (P2022 = 855.82 and P2023 = 733.6 mm, with Δp = -122.2) notably from July to October when the pluvial annual magnitudes averages in Sinaloa state are the highest (189.47 mm in 2022 and 174.8 for 2023)[60]. Local rainfall interacts with contaminants, potentially displacing leachates and facilitating their migration through soil pores. Variations in precipitation intensity further influence this process, affecting the movement of pollutants and contributing to biomass accumulation across different phases of DROCs.
The hypothetical scheme presented in Figure 5 aims to illustrate how the various phases of DROCs (Degradation-Resistant Organic Compounds) behave in the subsurface under static conditions, providing a conceptual framework to predict their future dispersion and accumulation in porous media. This scheme not only offers a visual representation of the retention of DROCs in the subsurface of the old OAGD (open-air garbage dump) but also anticipates scenarios where a full invasion of these substances could occur if preventive measures are not implemented. According to the classification used for DROC stages, the dynamic behavior of the S-S (soil-subsurface) system is shown in Figure 5, revealing changes in relation to depth and the porosity of the subsoil’s porous media. Through this hypothetical model, we aim to understand how DROC phases interact with the physical properties of the soil, specifically in relation to local topography, subsurface permeability variability, and the capacity of geological layers to retain or allow the passage of these compounds. Additionally, the scheme helps visualize how the characteristics of porous media can either facilitate or limit the movement of DROCs, directly affecting groundwater quality and ecosystem health. The model also highlights the importance of waste decomposition processes in the landfill, where gas emissions contribute to global climate change. These gases are released into the atmosphere, accelerating global warming and altering local and regional climate patterns. Therefore, the scheme is not only useful for understanding the current behavior of DROCs in the subsurface but also serves as a tool for assessing the long-term impact of poor waste management and how these processes could exacerbate future climate variability in different seasons.
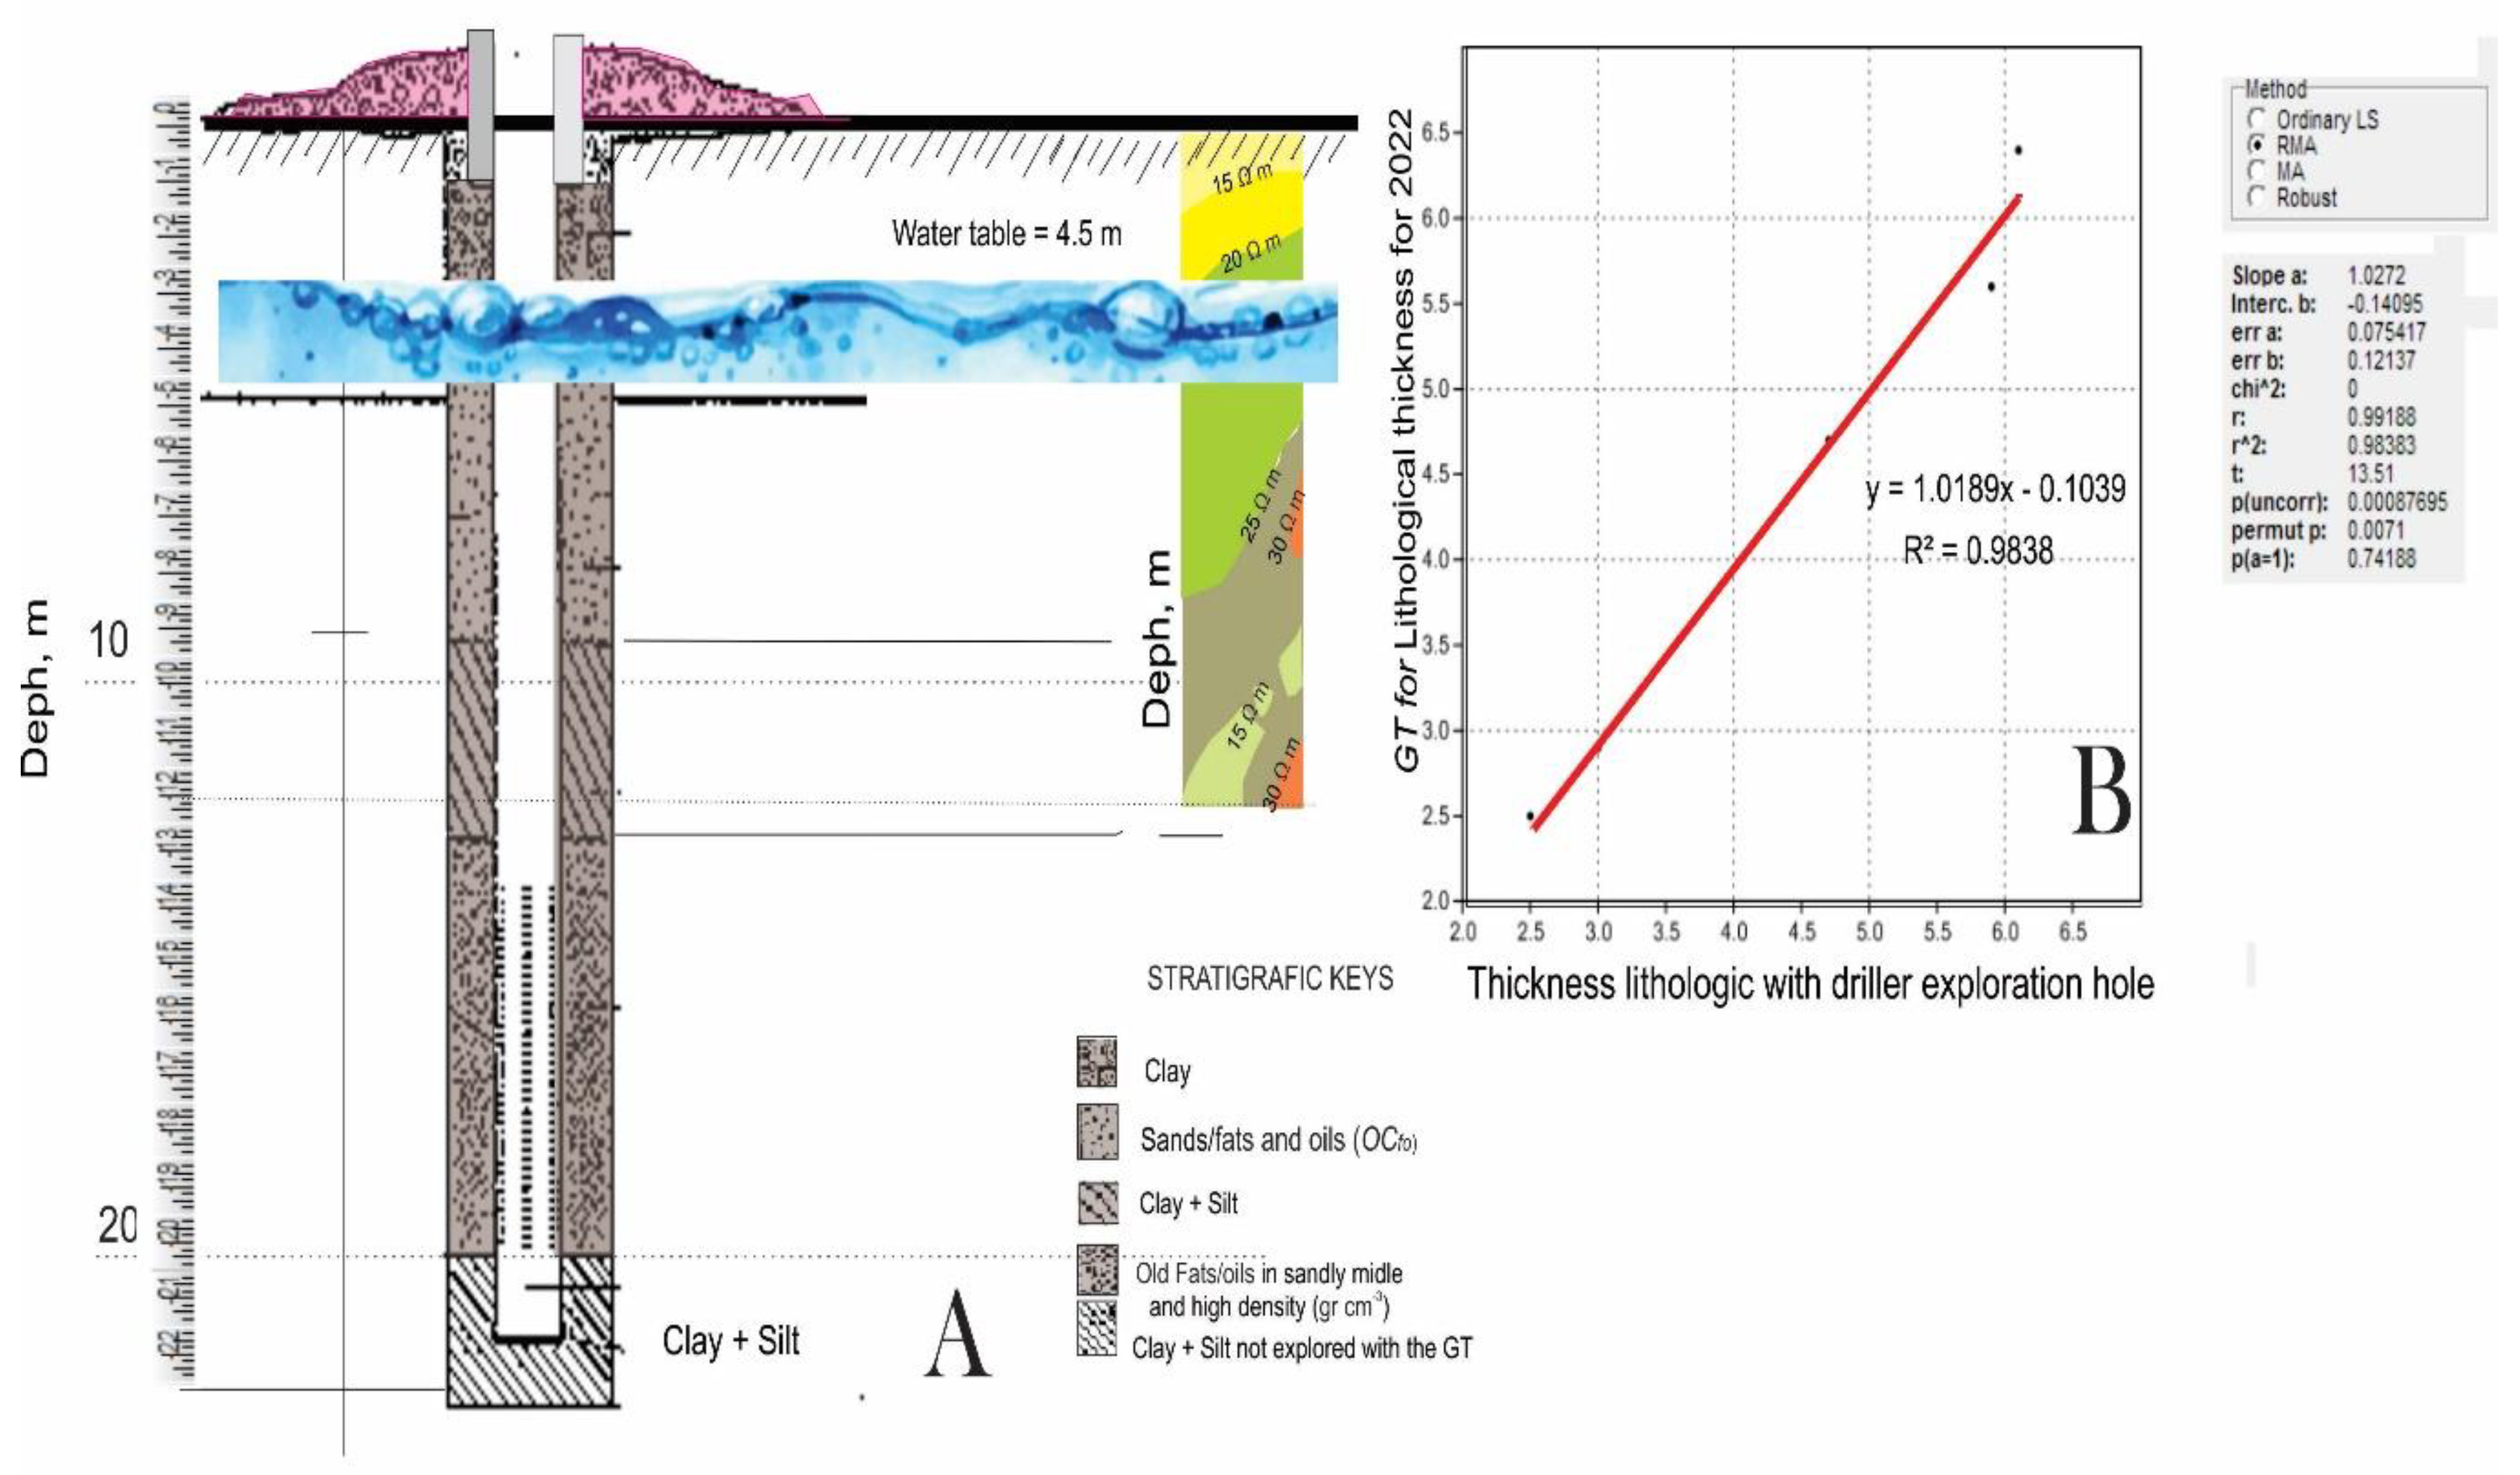
Figure 4.
(A) Exploratory well drilled to 22 m of depth illustrating one ssample from Sinaloa aquifer River for it hydrogeological units on subsoil with presence of fats and oils and, (B) linear correlation (R2 = 0.98) between the hydrogeological thicknesses of the associated to phases of DROCs.
Figure 4.
(A) Exploratory well drilled to 22 m of depth illustrating one ssample from Sinaloa aquifer River for it hydrogeological units on subsoil with presence of fats and oils and, (B) linear correlation (R2 = 0.98) between the hydrogeological thicknesses of the associated to phases of DROCs.
On the other hand, over time, variations in density ф will alter the structure of DROCs, impacting each phase of water infiltration dynamics and influencing the movement and retention of these compounds in the subsurface layers. Quantifying these changes in the subsoil involves comparative analyses of initial versus altered water infiltration rates, reflecting shifts in physical properties as new areas emerge [59]. Controlling variations in soil bulk density necessitates adaptive management strategies based on subsoil utilization and vegetation types, aiming to mitigate environmental impacts effectively.
This approach allows scientists and policymakers to anticipate environmental challenges, formulate appropriate remediation strategies, and design better waste management practices to reduce the risks of large-scale DROC invasion into porous media. Additionally, these measures contribute to lowering greenhouse gas emissions, addressing both environmental pollution and climate change.
3.10. Direct and Indirect Analysis and Validation of DROC Stages within OAGD
The results of the different phases of DROCs, detected indirectly from the surface in the subsoil, are shown in parts A and B of Figure 2. These results were validated directly and indirectly in the surrounding subsoil areas of the OAGD in zones where the annual ϱa measurements shared information. The direct confirmation was conducted with the results of stratigraphic variability in a borehole drilled to a depth of 22 m from the surface (part A of Figure 4). Part A of this figure presents the stratigraphic column, where it can be observed that most of the sediments are composed of different types of unconsolidated sedimentary materials. Laboratory granulometric analyses through sieving determined the granulometry in the drilled borehole, which consisted of particles of various sizes: clay (< 0.002 mm), silt (0.002-0.06 mm), sand (0.06 - 2 mm), gravel (2 - 6 mm), and pebbles (60 -250 mm). This detailed characterization of the sedimentary material is crucial for understanding leachate dynamics, as each sediment has different permeability and porosity properties that affect the transport and dispersion of contaminants.
The results were compared with the ϱa values obtained indirectly from the surface using the Dipole-Dipole geoelectric geophysical tool (part B of Figure 2). The Dipole-Dipole technique is a non-invasive method that provides a ϱa profile of the subsoil, offering an indirect but detailed view of the geological structure and the distribution of sedimentary materials. The coincidence between the ϱa values and the stratigraphic information obtained through drilling provides robust validation of the geophysical data.
3.11. Validation and Lineal Correlation Results
The correlation between the type of material crossed by the drilling and the thicknesses detected with the Dipole-Dipole technique confirms the indirect detection.
The depth of these strata corresponds to the points in the borehole vertical where water samples were taken for laboratory analysis of DROC concentration. The stratigraphic granulometry allowed for the correlation of material type with the probable dispersion velocities of leachates from the source of the OAGD.
This information is crucial for understanding how leachates move through the subsoil and how different sedimentary layers can act as barriers or facilitators for contaminant transport. The similarity between the strata, validated by both direct drilling techniques and indirect Dipole-Dipole geoelectric detection, confirms that the methodology for DROC detection is effective despite hydrological heterogeneity in aquifer properties and a variable storage coefficient. The ability to correlate directly and indirectly the DROCs presence validates only the effectiveness of the techniques employed also providing a more comprehensive understanding of the subsoil hydrological system.
3.12. Effectiveness of Methodology and DROCs Analysis
Standard gravimetric analysis confirmed the presence of DROCs in each stratum crossed by the borehole. The procedural blanks used in the laboratory showed a DROCs residue mass of less than 5 mg, indicating the absence of concentrations greater than 5 mgL-1 and ruling out significant contamination during the analysis process. This detailed detection of DROCs in the stratigraphic samples provides valuable information on the vertical distribution of these compounds in the subsoil, contributing to the understanding of leachate dynamics in the OAGD environment.
The DROC confirmation through gravimetric analysis was a critical step in validating the findings of the indirect detection techniques and direct drilling. The analysis of gravimetric results allows for precise quantification of contaminants in soil and water samples, ensuring that the interpretations for ϱa and stratigraphic data results are accurate and reliable.
3.13. Validation of Detection Methods for DROCs in OAGD and LSWM
The three analysis methods employed in this study—direct borehole drilling, Dipole-Dipole geoelectric detection, and laboratory gravimetric analysis—confirmed the validity and effectiveness of the indirect methodology used.
Each method offers a complementary perspective, reinforcing the reliability of the results and emphasizing the importance of a multidisciplinary approach to evaluating leachate contamination in the subsoil of the anywhere OAGD, and this integration not only enhances the accuracy of detecting and quantifying DROCs; but also establishes a robust foundation for the correct development of LSWM and mitigation strategies by pollutants. By identifying and quantifying DROCs across different geological stratigraphy, LSWM can design more precise and targeted interventions, reducing environmental impact and improving the sustainability of LSW disposal practices
3.14. Causes of DROCs Degradation Phases
Delving deeper into the underlying dynamics, the study invoked the mass transfer principle to unravel the interplay between environmental dynamics and material migration within the OAGD. This analytical approach facilitated the inference of the OAGD's yearly dynamics, particularly within the RI stage, which in subsoil acted as catalysts for the migration of DROC from the surface to varying depths within the subsoil layers. Consequently, this phenomenon resulted in an annual augmentation of invasion surfaces, starting from a modest coverage area of 81.12 m² in 2021, which progressively expanded to 168.48 m² in 2022. It ultimately culminated at a substantial 255.84 m² in 2023.
This nuanced understanding underscores the complex and dynamic nature of OAGD ecosystems, wherein environmental factors intertwine with the underlying material properties to dictate the temporal evolution of subsoil dynamics. Such insights hold profound implications for the management and remediation strategies employed within land OAGD environments, advocating for a holistic approach that integrates computational modeling with empirical observations to inform effective decision-making processes.
These changes were driven by the heightened risk of contamination during certain periods of the year, particularly from September to October, due to increased precipitation. Local rainfall interacts with contaminants, potentially causing the displacement of leachates and their migration through the pores of the S-S. Moreover, this phenomenon can be influenced by variations in the magnitude of the velocity of ф. Changes in ф, corresponding to the intensity of rainfall, create conditions conducive to the movement of pollutants through the S-S, facilitating biomass accumulation across various DROCs phases. This process also contributes to the restoration of porosity, thereby altering water infiltration dynamics. During the various stages of this process, the changes can be quantified in the S-S by conducting a comparative analysis between the initial water infiltration rate and the altered infiltration rate resulting from changes in the physical properties of the S-S [59]. In any scenario, the emergence of new areas will lead to variations in soil bulk density within the S-S, necessitating the implementation of new management strategies for S-S utilization and vegetation types.
However, during DROC invasions, the initial porous conditions were altered, leading over time to collapses in the S-S system or the cementation across all pore dimensions. This demonstrates that TIMP anisotropy can induce variations in water infiltration and alter the sedimentary structure of the S-S system in the presence of DROC phases
Part B of Figure 4 illustrates the linear regression among the five stratigraphical zones of the well and those observed in ρa2023 (with the thickness of the last two beds of the well kept constant). Notably, the last two beds, located between 12.5 and 22 m, exceed the maximum depth explored by both GTs, which is 12 m. Despite this, a linear regression value of 0.98 (R2 = 0.98) was achieved by comparing the sedimentary thicknesses and lithological variations in the well, extending up to 12 m deep. This suggests an acceptable lithological correlation for the saturated and unsaturated zones (refer to Fig. 4, part B). The exploratory well drilled to a depth of 22 m, provided valuable insights into hydrogeological characteristics in deeper formations that could not be reached by the GTs. Depths of 12.5 m and 19.5 m were particularly significant, revealing sedimentary facies containing fats and oils. Their high molecular weight and greater density suggested transport from the lateral zone of the garbage dump, where the highest concentration of waste and the primary source of DROCs were located.
Within the aquifer at greater depths (sometimes associated with aquitards and confined aquifers separated by clays and composed of sandy, lagoon sediments), typical geoelectrical ϱa values ranged between 25 and 35 Ωm. Noteworthy, the area has the heaviest rainfall from July to September [61]. Given that the measurements were taken one month after the rainy season had ended, it's possible that the rain contributed to the year-to-year changes in ϱa values as a function of TIMP.
This phenomenon could elucidate the local behavior of DROC dispersion in the S-S, as illustrated in parts A, D, and G of Figure 4, where data were collected in October, just one month after the rainy season [62]. Rainfall has a pronounced influence on the dynamics of S-S transport, particularly in August, when rainfall typically occurs at its highest. Figure 4 depicts the annual changes in the areas covered by the three phases of DROCs and in a similar manner in the Flw stage due to rainfall.
4. Discussions
The challenges associated with Landfill Solid Waste Management (LSWM) primarily arise in areas where suitable land for waste disposal is limited, leading to the use of OAGDs. Although subsoil and groundwater systems possess a natural capacity for biological self-recovery—a key factor in defining resilience levels for sustainability—relying solely on single annual linear observations of the entire landfill area, in this case; is inadequate. The measurements, numerical processes, and their interpretations, based on the physical laws governing these phenomena, are essential for accurately characterizing subsoil systems. In this study, the numerically defined processes, combined with current linear projections of DROCs transformation, highlight a high risk of contamination, emphasizing the need for comprehensive preventive measures. This underscores the need for proactive measures and continuous monitoring to ensure the long-term sustainability of the landfill. The results of this study highlight changes in DROCs at the OAGD site, reflecting their dispersion or fixation to the subsoil. The DROCs degradation could occur under two scenarios: within initial non-static surface degradation phases or in areas initially classified as Flw zones but later affected by the saturated zone of the unconfined-free aquifer. It is important to note that dispersion analysis does not necessarily indicate increases or decreases in the overall properties of stability, equicontinuity, and convergence; because the leachate compounds are denser than water, their adherence to aquifer walls or movement is influenced by TIMP and ф. After that, some contaminants cross the unsaturated zone, reach groundwater, and remain above the water table, while others migrate through the unsaturated zone and travel to the saturated zone, which increases its decomposition and adherence. The issue of DROCs highlights the infiltration and accumulation of leachates from poorly managed landfills. Moreover, the dispersion analysis, which does not encompass every phase transformation in specific areas, represents the transformation along the measurement lines and indicates the need for comprehensive measurements to understand the behavior and impact on the total subsoil in sites surrounding the OAGD.
OAGD deposits pose numerous social, economic, and environmental challenges, and their mitigation cannot be fully addressed by simply transitioning to disposal techniques such as SLs and CFs. This study emphasizes the critical need for these transitions to prevent leachate production and reduce GHG emissions. Such a shift is essential to avoid the proliferation of poorly selected disposal sites and to ensure groundwater sustainability, especially in regions with unsuitable geological conditions and high subsoil permeability.
A key advantage of SLs or CFs techniques is their involvement in extracting recyclable materials from LSW, helping to reduce GHG emissions (CO₂ and CH₄). It is irrefutable that effective SLWM practices ensure that leachate is properly treated and does not migrate through the subsoil, thus preventing contamination of groundwater and geological layers. Engineer SL techniques—including compacted liner bottoms, groundwater monitoring systems, leachate collection, treatment systems, and gas collection systems—are designed to ensure the safe disposal of LSW while minimizing environmental impacts.
Geophysical and statistical tools used in this study revealed average behaviors of DROC formation and changes. The lack of year-to-year correlation and the differences between statistical measures of apparent resistivity (ρa) in 2022 and 2023 may be attributed to DROC dynamics and the presence of Flw zones. The strong positive correlation between ρa2023 vs. ρa2023 values in specific areas suggests a consistent pattern across different phases and conditions. This synchronicity indicates that changes in ρa in one zone tend to reflect in others, pointing to interconnected landfill environments where changes propagate due to diverse factors like leachate ф pathways, soil composition, and microbial activity. Understanding these interrelations is crucial for accurate forecasting and effective landfill management.
Characterizing contamination based on spill behavior is complex, but identifying spill stages is crucial for remediation. This study presents a means to classify contamination based on ρa values, identifying potential sources and distinguishing between past and recent spills. The landfill site studied was ideal for this model because it gave the facility to define the travel of DROCs within the porous system. The dispersal of DROCs from the landfill site accumulated over many years and interacted with groundwater and local stratigraphy, allowing a quantitative determination of DROC coverage areas based on incursion and dispersion influenced by the anisotropy of TIMP. This analysis of the geometry associated with DROC coverage phases illustrated dispersion over time, employing geophysical data to obtain the tomography relatively straightforward.
The extensive history of solid waste storage at the landfill for over 40 years facilitated the continuous invasion of DROCs into porous media from this OAGD, where the wide coverage of the RI/II interface at the current time indicates significant waste deposition and mass transformation in the subsoil of sites surrounding the OAGD, posing risks to subsoil health and human safety. DROC invasion into stratigraphy follows different scenarios: RI, characterized by high ρa values not associated with secondary products of landfill cessation, suggests ongoing waste ф and contamination transfer. Phase II, marked by intermediate ρa values, represents physical-chemical reactions and ion decomposition processes (Figure 5). Phase AI, identified by lower ρa values, indicated the mass transformation that alters the properties of DROCs, leading to high concentrations that interact with groundwater and the formation of maximum degradation zones.
Monitoring and identifying SLW is crucial because the contaminants released during decomposition, pose environmental and health risks. This condition permits us to say that LSWM must adhere to strict environmental standards and international treaties signed by Mexico, which require remediation operations based on geographic, geological, and environmental factors. Despite financial constraints not being a barrier, Mexico struggles with fully implementing these regulations, however, some areas have begun to be addressed. Given Mexico's annual growth of 1.4% over the past five years, a targeted review of solid waste management policies is urgent. Federal support for research centers has identified various forms of contamination; however, enforcement remains inadequate. This study contributes to research efforts initiated in the 1990s to characterize coastal aquifers in the Guasave Valley, which is experiencing subsidence from agricultural overexploitation and the recompilation of LSW proceeded by this intense activity.
In summary, phases RI, RI/II, and II were identified as having the greatest potential for mass transformation leading to increased GHG emissions. This transformation, as indicated by ρa values from 2022 to 2023, suggests a reduction in the total mass within AI zones due to enhanced degradation facilitated by the porous nature of the subsurface, and changes with the precipitation deficit. The observed decrease in ρa values points to significant changes in subsurface properties resulting from the invasion of the AI zone, which impacts leachate mobility, dispersion, and retention. These findings highlight the importance of ongoing monitoring and effective management to track areas affected by DROCs and to understand the extent of degradation phases in the subsurface.
Moreover, studies in the literature have defined the behavior of resistivity in the subsurface to identify apparent resistivity values in an integrated manner, establishing correlations between laboratory studies, drilling and direct field measurements [63,64].
However, despite existing studies, this correlation analysis defining the total resistivity value in the subsurface has not been an exclusive representation of the type of material or its evolution over time. It is essential to observe the resilience capacity of an ecosystem before restoring after the contamination load from leachates principally those OAGD located in areas with a low probability of stopping infiltration from the surface into various subsurface layers. The measurements are crucial for successfully mitigating the environmental impacts through targeted remediation efforts. Effective remediation requires a thorough understanding of contaminants the dispersion and transformation stage patterns, including the hydrodynamics and hydrogeochemicals properties of subsoil and their interactions with ϕ. Although the federal and state governments have initiated efforts to protect and rehabilitate contaminated lands, many sites in the Mexican territory that require subsoil remediation, particularly in agricultural valleys like Guasave Valley—better known as "The Agricultural Heart of Mexico"—remain affected. These efforts often lack the necessary financial support to achieve the objectives outlined in the National Program for the Remediation of Contaminated Sites [13].
Preventing and controlling contamination and preserving aquifer quality requires treatment methodologies that effectively eliminate DROCs and other chemical substances adhering to pore walls within the porous system, and overall expanding the scope of regulations outlined in the Official Mexican Standards and including additional factors of interest will help comply with international treaties and ensure that Mexican products meet permissible limits for each chemical compound. For example, water quality standards require that DROC concentrations don't exceed 25 mgL-1 [65]. Establishing essential strategies for proper waste management and site selection is crucial. This includes locating landfills in areas that do not risk contaminating aquifers with studies of hydrogeochemical, hydraulic, geophysical techniques, and others; collaborating to identify useful resources for policy negotiation promoting research to discover and inform other not common remediation techniques and new management practices.
Future research should emphasize extended monitoring, the refinement of the problem as a complex system for the prediction of models, and the incorporation of additional factors such as temperature, moisture content, subterranean ф direction, transmissivity, and hydraulic conductivity of the aquifer, among others. In summary, the phases RI, RI/II, and II were identified as having the highest potential for increased greenhouse gas emissions. The DROCs transformation, indicated by ρa values from 2022 to 2023, suggests a reduction in total DROCs within the AI zones due to enhanced degradation phases through the porous medium. The decline in ρa values points to significant changes in subsoil properties caused by the AI zone invasion, affecting leachate dispersion and retention.
5. Conclusions
In context with the accelerating climate change and its extensive environmental In the context of the accelerating climate change and its extensive environmental impacts; addressing DROCs contamination, particularly in groundwater, has become increasingly critical. Undegraded chemical components from leachates can significantly contaminate water sources, posing serious risks to human health and local biodiversity. Transitioning from OAGDs and uncontrolled landfills to engineered landfills is essential. This transition should focus on improving waste recycling processes and implementing sustainable strategies for managing LSW to mitigate severe impacts on subsoil, groundwater, and GHG emissions. Understanding subsoil pollution, especially concerning degradation-resistant organic compounds like DROCs, is vital. Climate change exacerbates this issue by altering contaminant dispersal patterns, particularly for the LSW which on porous media persist due to their slow degradation rates. This issue, particularly in various regions, arises from inadequate infrastructure which significantly hampers effective LSMW.
Once subsoil damage occurs, effective remediation strategies become imperative. These strategies must involve a comprehensive understanding of contaminant dynamics, including identifying pollution sources, tracking the transport of contaminants, and mapping their distribution. Developing adaptable tools for detecting and monitoring DROC contamination, combined with real-time monitoring and predictive modeling, is crucial for enhancing remediation efforts. This study emphasizes the geophysical methods used, to identify the DROCs, particularly electrical techniques, to analyze ρa variations in OAGDs and detecting DROCs its degradation. By correlating ρa changes with GHG emissions, future research could identify critical moments when emissions are likely to occur, enabling preemptive opportunities for mitigation actions. This approach is particularly significant given the ongoing impacts of climate change, where every determination to reduce GHG emissions contributes to global efforts in combating the current warming.
The findings highlight the need for continuous and detailed monitoring to fully understand the extent of contamination and its evolution over time. Integrating scientific research with practical solutions will contribute to global efforts to restore ecosystem resilience and safeguard groundwater resources. Addressing complex contamination dynamics in coastal OAGD environments, particularly in areas with inadequate or absent waste management systems, will be crucial for managing environmental. public health risks and, ensuring groundwater sustainability for future generations.
Annual observations alone may not provide a complete picture of LSW dispersion and transformation across the total selected OAGD area. Therefore, additional measurements of ρa in surrounding zones are necessary. This case highlights the importance of continuous surveillance to manage and mitigate environmental risks associated with coastal dumpsites and other waste dump sites with high permeability, making them highly susceptible to leachate dispersion.
The study also underscores the critical need to transition from OAGDs to more advanced disposal systems, such as controlled landfills. Utilizing engineered techniques like leachate collection systems, gas emission controls, and compacted liner bottoms is essential to prevent leachate production and reduce GHG emissions. This transition is vital to avoid the proliferation of inadequately selected disposal sites and to ensure groundwater sustainability, particularly in regions with inappropriate geological conditions and high permeability in the subsoil.
The strong correlations between ρa values across various phases suggest synchronicity in contamination behavior, which could enhance forecasting and management strategies. This underscores a need to integrate geophysical techniques with traditional methods like drilling and lab analysis and understand better the contamination patterns and their environmental effects. Variations in ρa and contamination patterns across different phases and locations define the need for more refined and prolonged monitoring efforts. Future studies should focus on extending monitoring periods, improving predictive models, and incorporating additional environmental factors such as temperature and moisture content to increase the accuracy of contamination assessments and management strategies. The policy implications of the findings on this work are significant, emphasizing the need for stricter adherence to environmental regulations and international treaties related to waste management in OAGDs. Despite progress, there is a continued need for improvement in waste management practices and increased investment in research to address the evolving challenges posed by rising consumerism and its associated OAGD contamination. However, combining geoelectric technologies with traditional analytical methods to define the stages of DROCs can significantly aid researchers and policymakers in developing more effective strategies for managing and mitigating the environmental impacts of OAGDs. To achieve a characterization of OAGD contamination, future research should prioritize enhancing monitoring techniques, improving predictive models, and such as was mentiomed, to incorporating additional environmental variables into calculations for representing each stage of DROCs.
Substantial progress is still needed in Mexico to implement effective preventive measures for detecting each stage of DROCs in many OAGDs. Strengthening regulatory frameworks, improving waste management practices, and investing in innovative monitoring and remediation technologies will be crucial for addressing the environmental challenges posed by these OAGDs with contamination in the subsoil. Additionally, enhanced collaboration between researchers, policymakers, and industry stakeholders will be vital for developing and applying effective strategies to mitigate the impacts of contamination in many OAGDs. Beyond the studied garbage dump, it is important to mention that other sites have also experienced alterations in their natural properties due to various sources of contamination, some of which remain unidentified.
Effective strategies to mitigate pollution impacts must also be applied to surface environments, subsoil, and groundwater in numerous clandestinely dispersed OAGDs in Mexico's agricultural regions. This is crucial for protecting the economy, as these areas contribute significantly to the national economy, accounting for 1% of the GDP.
Obtain an effective remediation requires a thorough understanding of the dispersion patterns of contaminants, including the hydrodynamic and hydrogeochemical properties of the subsurface and their interactions with directions. Although federal and state governments have initiated efforts to protect and rehabilitate contaminated lands, many sites, particularly in agricultural valleys like Guasave Valley—known as "The Agricultural Heart of Mexico"—remain affected. These efforts often lack the necessary financial support to achieve the objectives outlined in the National Program for the Remediation of Contaminated Sites [13].
Preventing and controlling contamination, as well as preserving aquifer quality, requires treatment methodologies that effectively eliminate DROCs and other chemical substances adhering to pore walls within the porous system. Expanding the scope of regulations outlined in the Official Mexican Standards and including additional factors of interest will help comply with international treaties and ensure that Mexican products meet permit limits for each chemical compound. For example, water quality standards require that DROC concentrations do not exceed 25 mg/L.1 [65]. Establishing essential strategies for proper waste management and site selection is crucial. These strategies must include locating landfills in areas that do not pose a risk of contaminating aquifers, collaborating to identify useful resources for policy negotiation, and promoting research to inform the results of new remediation and management practices. LSWM should involve authorized enterprises to manage OAGDs effectively and base decisions on sound arguments aligned with current regulations and standards. The study underscores the limitations of focusing solely on environmental engineering perspectives and highlights the need for transformative changes in waste management strategies. Effective LSWM should enable rapid, non-destructive, and cost-effective remediation, sectorized according to the characteristics of the degradation states of OAGDs. The methodology presented provides valuable insights into understanding spills in unsaturated and saturated zones over time and can serve as a useful tool for ensuring compliance with regulations and establishing the standards for LSW remediation and management.
Author Contributions
Conceptualization, M.,N.C.; writing and preparation of original draft, S.,L.R.; English revision, discussions and conclusion, P.,M.S.; methodology, J.,M.M.; data preparation, O.,L.C.; writing—review and editing, M.,L.d.G.T. and M.,N.C; introduction and project administration, L.A.,S.G.; formal analysis of literature, process and analysis statistical/mathematical dataset. All authors have read and agreed to the published version of the manuscript.
Funding
The research was funded by the Investigation and Postgrade Secretariat (SIP) of the National Polytechnic Institute (IPN) through annual call for research projects individual and multidisciplinary with 0220924, 20231294, and 20241198 projects.
Institutional Review Board Statement
Not applicable.
Informed Consent Statement
Not applicable.
Data Availability Statement
El conjunto de datos utilizado para la obtención de los presentes resultados en este estudio puede estar disponible previa solicitud directamente al correo electrónico del autor de correspondencia. Los datos no se incluyeron directamente en este documento, pero el total de los métodos estadísticos y el programa de cómputo empleado se describen exhaustivamente en el manuscrito.
Acknowledgments
The authors express their gratitude to the Secretariat of Investigation and Postgraduate Studies (SIP) of the National Polytechnic Institute for the financial support provided through projects 20220924, 20231294, and 20241198. We appreciate the encouragement received throughout all stages of research, including fieldwork, office work, and resource and material management. Additionally, we extend our sincere thanks to the editor and anonymous reviewers for their valuable feedback. Special appreciation goes to the CIIDIR department's investigation and other affiliated research centers, whose critical comments and insights were instrumental in developing the arguments presented in this work. Finally, we acknowledge our colleagues from the Departments of Environmental Media, Natural Resources, Aquaculture, and Biotechnology at CIIDIR-IPN Sinaloa Unit for their support.
Conflicts of Interest
To mitigate potential conflicts of interest, several measures have been implemented to ensure transparent and comprehensive disclosure throughout all stages of the research. To prevent any possible conflicts of interest, arising from funding sources, all necessary permissions were obtained for the applied methods in the areas surrounding the OAGD. Complete transparency was ensured by disclosing the funding sources. A rigorous approach was considered for data collection and analysis. The methodology employed was based on tools that can be independently verified, ensuring that external influences do not affect the research outcomes. We actively sought collaboration with experts in the field to provide diverse perspectives not tied to any particular interests, focusing solely on objective assessments of the developments and analyses, conducted.
References
- Gupta, N.; Gupta, R. Solid Waste Management and Sustainable Cities in India: The Case of Chandigarh. Environ Urban 2015, 27, 573–588. [Google Scholar] [CrossRef]
- Rana, R.; Ganguly, R.; Gupta, A.K. An Assessment of Solid Waste Management System in Chandigarh City, India. Electronic Journal of Geotechnical Engineering 2015, 20. [Google Scholar]
- Hoornweg, D.; Bhada-Tata, P. WHAT A WASTE A Global Review of Solid Waste Management; Urban Development & Local Government Unit, Ed.; Ira.; 15: Washington, DC 20433 USA, 2012; Vol. 15.
- Kaza, S.; Yao, L.C.; Bhada-Tata, P.; Van Woerden, F. What a Waste 2.0: A Global Snapshot of Solid Waste Management to 2050; washinghton, D.W.Bank., Ed.; 1ra ed.; Washington, DC: World Bank.: Washington, DC, 2018; Vol. 1; ISBN 978-1-4648-1347-4.
- Hemidat, S.; Achouri, O.; El Fels, L.; Elagroudy, S.; Hafidi, M.; Chaouki, B.; Ahmed, M.; Hodgkinson, I.; Guo, J. Solid Waste Management in the Context of a Circular Economy in the MENA Region. Sustainability 2022, 14, 480. [Google Scholar] [CrossRef]
- Diario Oficial de la Federación Ley General Para La Prevención y Gestión Integral de Los Residuos.; Secretaría de Medio Ambiente y Recursos Naturales.: CDMX, Mexico, 2023; pp. 10–37.
- García-Mondragón, D.; Cervantes-Zepeda, I.; Gómez-Demetrio, W.; Gallego-Alarcón, I.; García-Pulido, D.; González-Blanco, G. Gestión de Los Residuos Sólidos En México: Análisis Cualitativo de Los Diagnósticos Básicos. INTER DISCIPLINA 2023, 11, 215–242. [Google Scholar] [CrossRef]
- Hard, J. Nineteenth Century Urban Labor Precursors of the Mexican Revolution: The Development of an Ideology. The Americas Journal 2015, 30, 297–318. [Google Scholar] [CrossRef]
- SEMARNAT Mexico`s State of the Environmental Report. Environmental Statistical Compendium. Key and Environmental Performance Indicators; Edicion 2012; CDMX, 2012.
- Martínez, J.E.D.; Caballero, M.J.L. Densificación Urbana Como Solución Sostenible a Ciudades Difusas. DELOS 2022, 12, 2–12. [Google Scholar]
- SEMARNAT Norma Oficial Mexicana NOM-083-SEMARNAT-2003.“Especificaciones de Protección Ambiental Para La Selección Del Sitio, Diseño, Construcción, Operación, Monitoreo, Clausura y Obras Complementarias de Un Sitio de Disposición Final de Residuos Sólidos Urbanos y de Manejo Especial,”; CDMX, 2021; pp. 1–15.
- BBVV Research Global | The COVID-19 Impact on Consumption in Real Time and High Definition: Dec 17th. Available online: https://www.bbvaresearch.com/en/publicaciones/global-the-covid-19-impact-on-consumption-in-real-time-and-high-definition-dec-17th/ (accessed on 1 October 2024).
- SEMARNAT Guía Técnica Para Orientar En La Elaboración de Estudios de Caracterización de Sitios Contaminados. 2010, 1, 9–212.
- The World Bank What a Waste : A Global Review of Solid Waste Management. Available online: https://hdl.handle.net/10986/17388 (accessed on 25 April 2024).
- Ferronato, N.; Gorritty Portillo, M.A.; Guisbert Lizarazu, E.G.; Torretta, V.; Bezzi, M.; Ragazzi, M. The Municipal Solid Waste Management of La Paz (Bolivia): Challenges and Opportunities for a Sustainable Development. Waste Management & Research 2018, 36, 288–299. [Google Scholar] [CrossRef]
- Ghafourian, K.; Mohamed, Z.; Ismail, S.; Malakute, R.; Abolghasemi, M. Current Status of the Research on Construction and Demolition Waste Management. Indian J Sci Technol 2016, 9. [Google Scholar] [CrossRef]
- Josimovi, B.; Mari, I. Methodology for the Regional Landfill Site Selection. Sustainable Development - Authoritative and Leading Edge Content for Environmental Management 2012. [CrossRef]
- Arjwech, R.; Somchat, K.; Pondthai, P.; Everett, M.; Schulmeister, M.; Saengchomphu, S. Assessment of Geological, Hydrogeological and Geotechnical Characteristics of a Proposed Waste Disposal Site: A Case Study in Khon Kaen, Thailand. Geosciences (Basel) 2020, 10, 109. [Google Scholar] [CrossRef]
- Castrejón, D.; Zavala, A.M.; Flores, J.A.; Flores, M.P.; Barrón, D. Analysis of the Contribution of CCS to Achieve the Objectives of Mexico to Reduce GHG Emissions. International Journal of Greenhouse Gas Control 2018, 71, 184–193. [Google Scholar] [CrossRef]
- Mariano, N.-C.; Omar, L.-C.; Patricia, M.-S.; Rosario, R.-G.; de Guevara-Torres María, L.; José, A.-C. Aquifer/Water Sources Drip Factor as Alternative to Measure Climatic Effects on Disponibility of Water Agricultural Irrigation in Semi-Arid/Arid Zones. IOP Conf Ser Earth Environ Sci 2018, 171, 012031. [Google Scholar] [CrossRef]
- Sellers, K. Fundamentals of Hazardous Waste Site Remediation; Routledge, 2018; ISBN 9780203755273.
- Sepúlveda, T.V.; Trejo, J.V. Tecnologías de Remediación Para Suelos Contaminados. In Jiménez Editores; 2002; Vol. 65, pp. 1–64 ISBN 968-817-557-9.
- Robledo, F.E.; Martinelli, H.P. Caracterización de Zonas Contaminadas Por Derrames Recientes de HiDROCarburos Mediante Métodos Geofísicos. SCIELO, Geoacta 2011, 36, 129–150. [Google Scholar]
- Aizebeokhai, A.P. 2D and 3D Geoelectrical Resistivity Imaging: Theory and Field Design. Scientific Research and Essays 2010, 5, 3592–3605. [Google Scholar]
- Mota, R.; Monteiro Santos, F.A.; Mateus, A.; Marques, F.O.; Gonçalves, M.A.; Figueiras, J.; Amaral, H. Granite Fracturing and Incipient Pollution beneath a Recent Landfill Facility as Detected by Geoelectrical Surveys. J Appl Geophy 2004, 57, 11–22. [Google Scholar] [CrossRef]
- Pomposiello, C.; Dapeña, C.; Boujon, P.; Favetto, A. Tomografías Eléctricas En El Basurero Municipal Ciudad de Gualeguychú, Provincia de Entre Ríos: Evidencias de Contaminación. Revista de la Asociacion Geologica Argentina 2009, 64, 1851–8249. [Google Scholar]
- BELMONTE, S.I.; JIMÉNEZ, M.E.; BORTOLOTTI, A. Estudio de Una Pluma Contaminante Producida Por Lixiviados, Utilizando Métodos Geoeléctricos. Geos 2008, 28, 142. [Google Scholar]
- Suárez, J.; Zúñiga, H. Detección De Capas De Desechos Con Métodos Geoeléctricos : Caso Relleno Sanitario Río Azul, Detection of Waste´S Layers With Geoelectric Methods : Case Of. Revista Geologica De America Central. 2013, 129–139. [Google Scholar]
- Khalil, M.H. Magnetic, Geo-Electric, and Groundwater and Soil Quality Analysis over a Landfill from a Lead Smelter, Cairo, Egypt. J Appl Geophy 2012, 86, 146–159. [Google Scholar] [CrossRef]
- Pedretti, D.; Masetti, M.; Beretta, G.P.; Vitiello, M. A Revised Conceptual Model to Reproduce the Distribution of Chlorinated Solvents in the Rho Aquifer (Italy). Groundwater Monitoring & Remediation 2013, 33, 69–77. [Google Scholar] [CrossRef]
- DMP Guasave: Economía, Empleo, Equidad, Calidad de Vida, Educación, Salud y Seguridad Pública | Data México. Available online: https://www.economia.gob.mx/datamexico/es/profile/geo/guasave (accessed on 2 October 2024).
- Ferrari, L.; López-Martínez, M.; Orozco-Esquivel, T.; Bryan, S.E.; Duque-Trujillo, J.; Lonsdale, P.; Solari, L. Late Oligocene to Middle Miocene Rifting and Synextensional Magmatism in the Southwestern Sierra Madre Occidental, Mexico: The Beginning of the Gulf of California Rift. Geosphere 2013, 9. [Google Scholar] [CrossRef]
- Bryan, S.E.; Orozco-Esquivel, T.; Ferrari, L.; López-Martínez, M. Pulling Apart the Mid to Late Cenozoic Magmatic Record of the Gulf of California: Is There a Comondú Arc? Geological Society, London, Special Publications 2014, 385, 389–407. [Google Scholar] [CrossRef]
- Duque-Trujillo, J.; Ferrari, L.; Orozco-Esquivel, T.; López-Martínez, M.; Lonsdale, P.; Bryan, S.E.; Kluesner, J.; Piñero-Lajas, D.; Solari, L. Timing of Rifting in the Southern Gulf of California and Its Conjugate Margins: Insights from the Plutonic Record. Geol Soc Am Bull 2015, 127, 702–736. [Google Scholar] [CrossRef]
- Cotler, H.; Corona, J.A.; Galeana-Pizaña, J.M.; Cotler, H.; Corona, J.A.; Galeana-Pizaña, J.M. Erosión de Suelos y Carencia Alimentaria En México: Una Primera Aproximación. Investigaciones geográficas 2020. [CrossRef]
- Lal, R. Soils and Sustainable Agriculture. A Review. Agron Sustain Dev 2008, 28, 57–64. [Google Scholar] [CrossRef]
- Herrero, M.; Thornton, P.K.; Power, B.; Bogard, J.R.; Remans, R.; Fritz, S.; Gerber, J.S.; Nelson, G.; See, L.; Waha, K.; et al. Farming and the Geography of Nutrient Production for Human Use: A Transdisciplinary Analysis. Lancet Planet Health 2017, 1, e33–e42. [Google Scholar] [CrossRef]
- Fernández, A.; Pérez-Campos, X. Lithosphere Thickness in the Gulf of California Region. Tectonophysics 2017, 719–720. [Google Scholar] [CrossRef]
- Michaud, F.; Royer, J.Y.; Bourgois, J.; Dyment, J.; Calmus, T.; Bandy, W.; Sosson, M.; Mortera-Gutiérrez, C.; Sichler, B.; Rebolledo-Viera, M.; et al. Oceanic-Ridge Subduction vs. Slab Break off: Plate Tectonic Evolution along the Baja California Sur Continental Margin since 15 Ma. Geology 2006, 34, 13. [Google Scholar] [CrossRef]
- Emery, X. Conditioning Simulations of Gaussian Random Fields by Ordinary Kriging. Math Geol 2007, 39. [Google Scholar] [CrossRef]
- Corriols, M.; Dahlin, T. Geophysical Characterization of the León-Chinandega Aquifer, Nicaragua. Hydrogeol J 2008, 16, 349–362. [Google Scholar] [CrossRef]
- Áridos De La Mesa, V.; Caso, C.; Dulcita, L.; De Ramos, V.; Potosí, L.; Héctor López-Loera, M. Boletín de La Sociedad Geológica Mexicana Volumen 66. Boletín de la Sociedad Geológica Mexicana 2014, 66, 165–181. [Google Scholar]
- Guillermo, B.; Salvatierra, Ñ.; Osman, B. Evaluación Del Subsuelo Mediante La Prospección Geofísica – Geoeléctrica En El Ámbito de Estudio Del Cerco Perimétrico de La Facultad de Ingeniería de Minas Civil Ambiental–UNH 2020.
- Zhou, G.L.; Hou, Z.T. Stochastic Generalized Porous Media Equations with Lévy Jump. Acta Math Sin Engl Ser 2011, 27, 1671–1696. [Google Scholar] [CrossRef]
- Vázquez, J.L. The Mathematical Theories of Diffusion: Nonlinear and Fractional Diffusion. arXiv: Analysis of PDEs 2017, 2186, 205–278. [Google Scholar] [CrossRef]
- Ignat, L.I.; Stan, D. Asymptotic Behavior of Solutions to Fractional Diffusion–Convection Equations. J Lond Math Soc 2017, 97, 258–281. [Google Scholar] [CrossRef]
- Chen, L.; Holzinger, A.; Jüngel, A.; Zamponi, N. The Mathematical Theories of Diffusion: Nonlinear and Fractional Diffusion. arXiv: Analysis of PDEs 2017, 47, 2217–2269. [Google Scholar] [CrossRef]
- Salomoni, V.A.; De Marchi, N. A Fractional Approach to Fluid Flow and Solute Transport within Deformable Saturated Porous Media. Int J Comput Mater Sci Eng 2022, 11. [Google Scholar] [CrossRef]
- Benson, D.A.; Meerschaert, M.M. A Simple and Efficient Random Walk Solution of Multi-Rate Mobile/Immobile Mass Transport Equations. Adv Water Resour 2009, 32, 532–539. [Google Scholar] [CrossRef]
- Wu, W.; Zhai, J. Stochastic Generalized Porous Media Equations Driven by Lévy Noise with Increasing Lipschitz Nonlinearities. J Evol Equ 2021, 21, 4845–4871. [Google Scholar] [CrossRef]
- Metcalfe, G.; Lester, D.; Trefry, M. A Primer on the Dynamical Systems Approach to Transport in Porous Media. Transp Porous Media 2023, 146, 55–84. [Google Scholar] [CrossRef]
- del Teso, F.; Endal, J.; Jakobsen, E.R. Robust Numerical Methods for Nonlocal (and Local) Equations of Porous Medium Type. Part I: Theory. SIAM J Numer Anal 2019, 57, 2266–2299. [Google Scholar] [CrossRef]
- Vazquez, J.L. The Porous Medium Equation; Oxford University PressOxford, 2006; ISBN 0198569033.
- Essaid, H.I.; Bekins, B.A.; Cozzarelli, I.M. Organic Contaminant Transport and Fate in the Subsurface: Evolution of Knowledge and Understanding. Water Resour Res 2015, 51, 4861–4902. [Google Scholar] [CrossRef]
- Shevnin, V.; Delgado-Rodríguez, O.; Fernández-Linares, L.; Zegarra Martínez, H.; Mousatov, A.; Ryjov, A. Geoelectrical Characterization of an Oil-Contaminated Site in Tabasco, Mexico. Geofísica Internacional 2005, 44, 251–263. [Google Scholar] [CrossRef]
- Atekwana, E.A.; Atekwana, E.A. Geophysical Signatures of Microbial Activity at HyDROCarbon Contaminated Sites: A Review. Surv Geophys 2010, 31, 247–283. [Google Scholar] [CrossRef]
- Bermejo Fraile, B. Análisis de Los Datos En Un Proyecto de Investigación. Matronas profesión 2005, 6, 30–36. [Google Scholar]
- Hammer, Ø.; Harper, D.A.T.; Ryan, P.D. Past: Paleontological Statistics Software Package for Education and Data Analysis. Palaeontologia Electronica 2001, 4, 1–9. [Google Scholar]
- Bi, Y.; Zou, H.; Zhu, C. Dynamic Monitoring of Soil Bulk Density and Infiltration Rate during Coal Mining in Sandy Land with Different Vegetation. Int J Coal Sci Technol 2014, 1. [Google Scholar] [CrossRef]
- SMN-conagua Resúmenes Mensuales de Temperaturas y Lluvia. Available online: https://smn.conagua.gob.mx/es/climatologia/temperaturas-y-lluvias/resumenes-mensuales-de-temperaturas-y-lluvias (accessed on 8 October 2024).
- Norzagaray Campos, M.; Muñoz Sevilla, P.; Montiel Montoya, J.; Llanes Cárdenas, O.; Ladrón de Guevara Torres, M.; Serrano García, L.A. Rainfall Potential and Consequences on Structural Soil Degradation of the Most Important Agricultural Region of Mexico. Atmosphere (Basel) 2024, 15, 581. [Google Scholar] [CrossRef]
- Cuevas-Reyes, V.; Loaiza Meza, A.; Gutiérrez Gutiérrez, O.G.; Borja Bravo, M.; Rosales-Nieto, C.A. Tipología de Productor y Efectos Indirectos Del Cambio Climático En La Ganadería Bovina En Sinaloa. Rev Mex Cienc Pecu 2024, 15, 555–569. [Google Scholar] [CrossRef]
- Reynolds, J. An Introduction to Applied and Environmental Geophysics; John Wiley & Sons, Ed.; Segunda.; 2011; Vol. 2.
- Khoshouei, M.; Bagherpour, R. Measurement, Prediction, and Modeling of the Drilling Specific Energy by Soft Rock Properties during the Drilling Operation. Measurement 2023, 222, 113679. [Google Scholar] [CrossRef]
- SEMARNAT NOM-001-SEMARNAT-2021, Que Establece Los Límites Permisibles de Contaminantes En Las Descargas de Aguas Residuales En Cuerpos Receptores Propiedad de La Nación; 2022; Vol. 8.
Figure 1.
Localization of the old OAGD selected for study transformations of DROCs in the transition from mountainous to coastal landscapes; and inmerses within the anisotropic movement of TIPM traveling through the unconfined aquifer in Sinaloa State, Mexico.
Figure 1.
Localization of the old OAGD selected for study transformations of DROCs in the transition from mountainous to coastal landscapes; and inmerses within the anisotropic movement of TIPM traveling through the unconfined aquifer in Sinaloa State, Mexico.
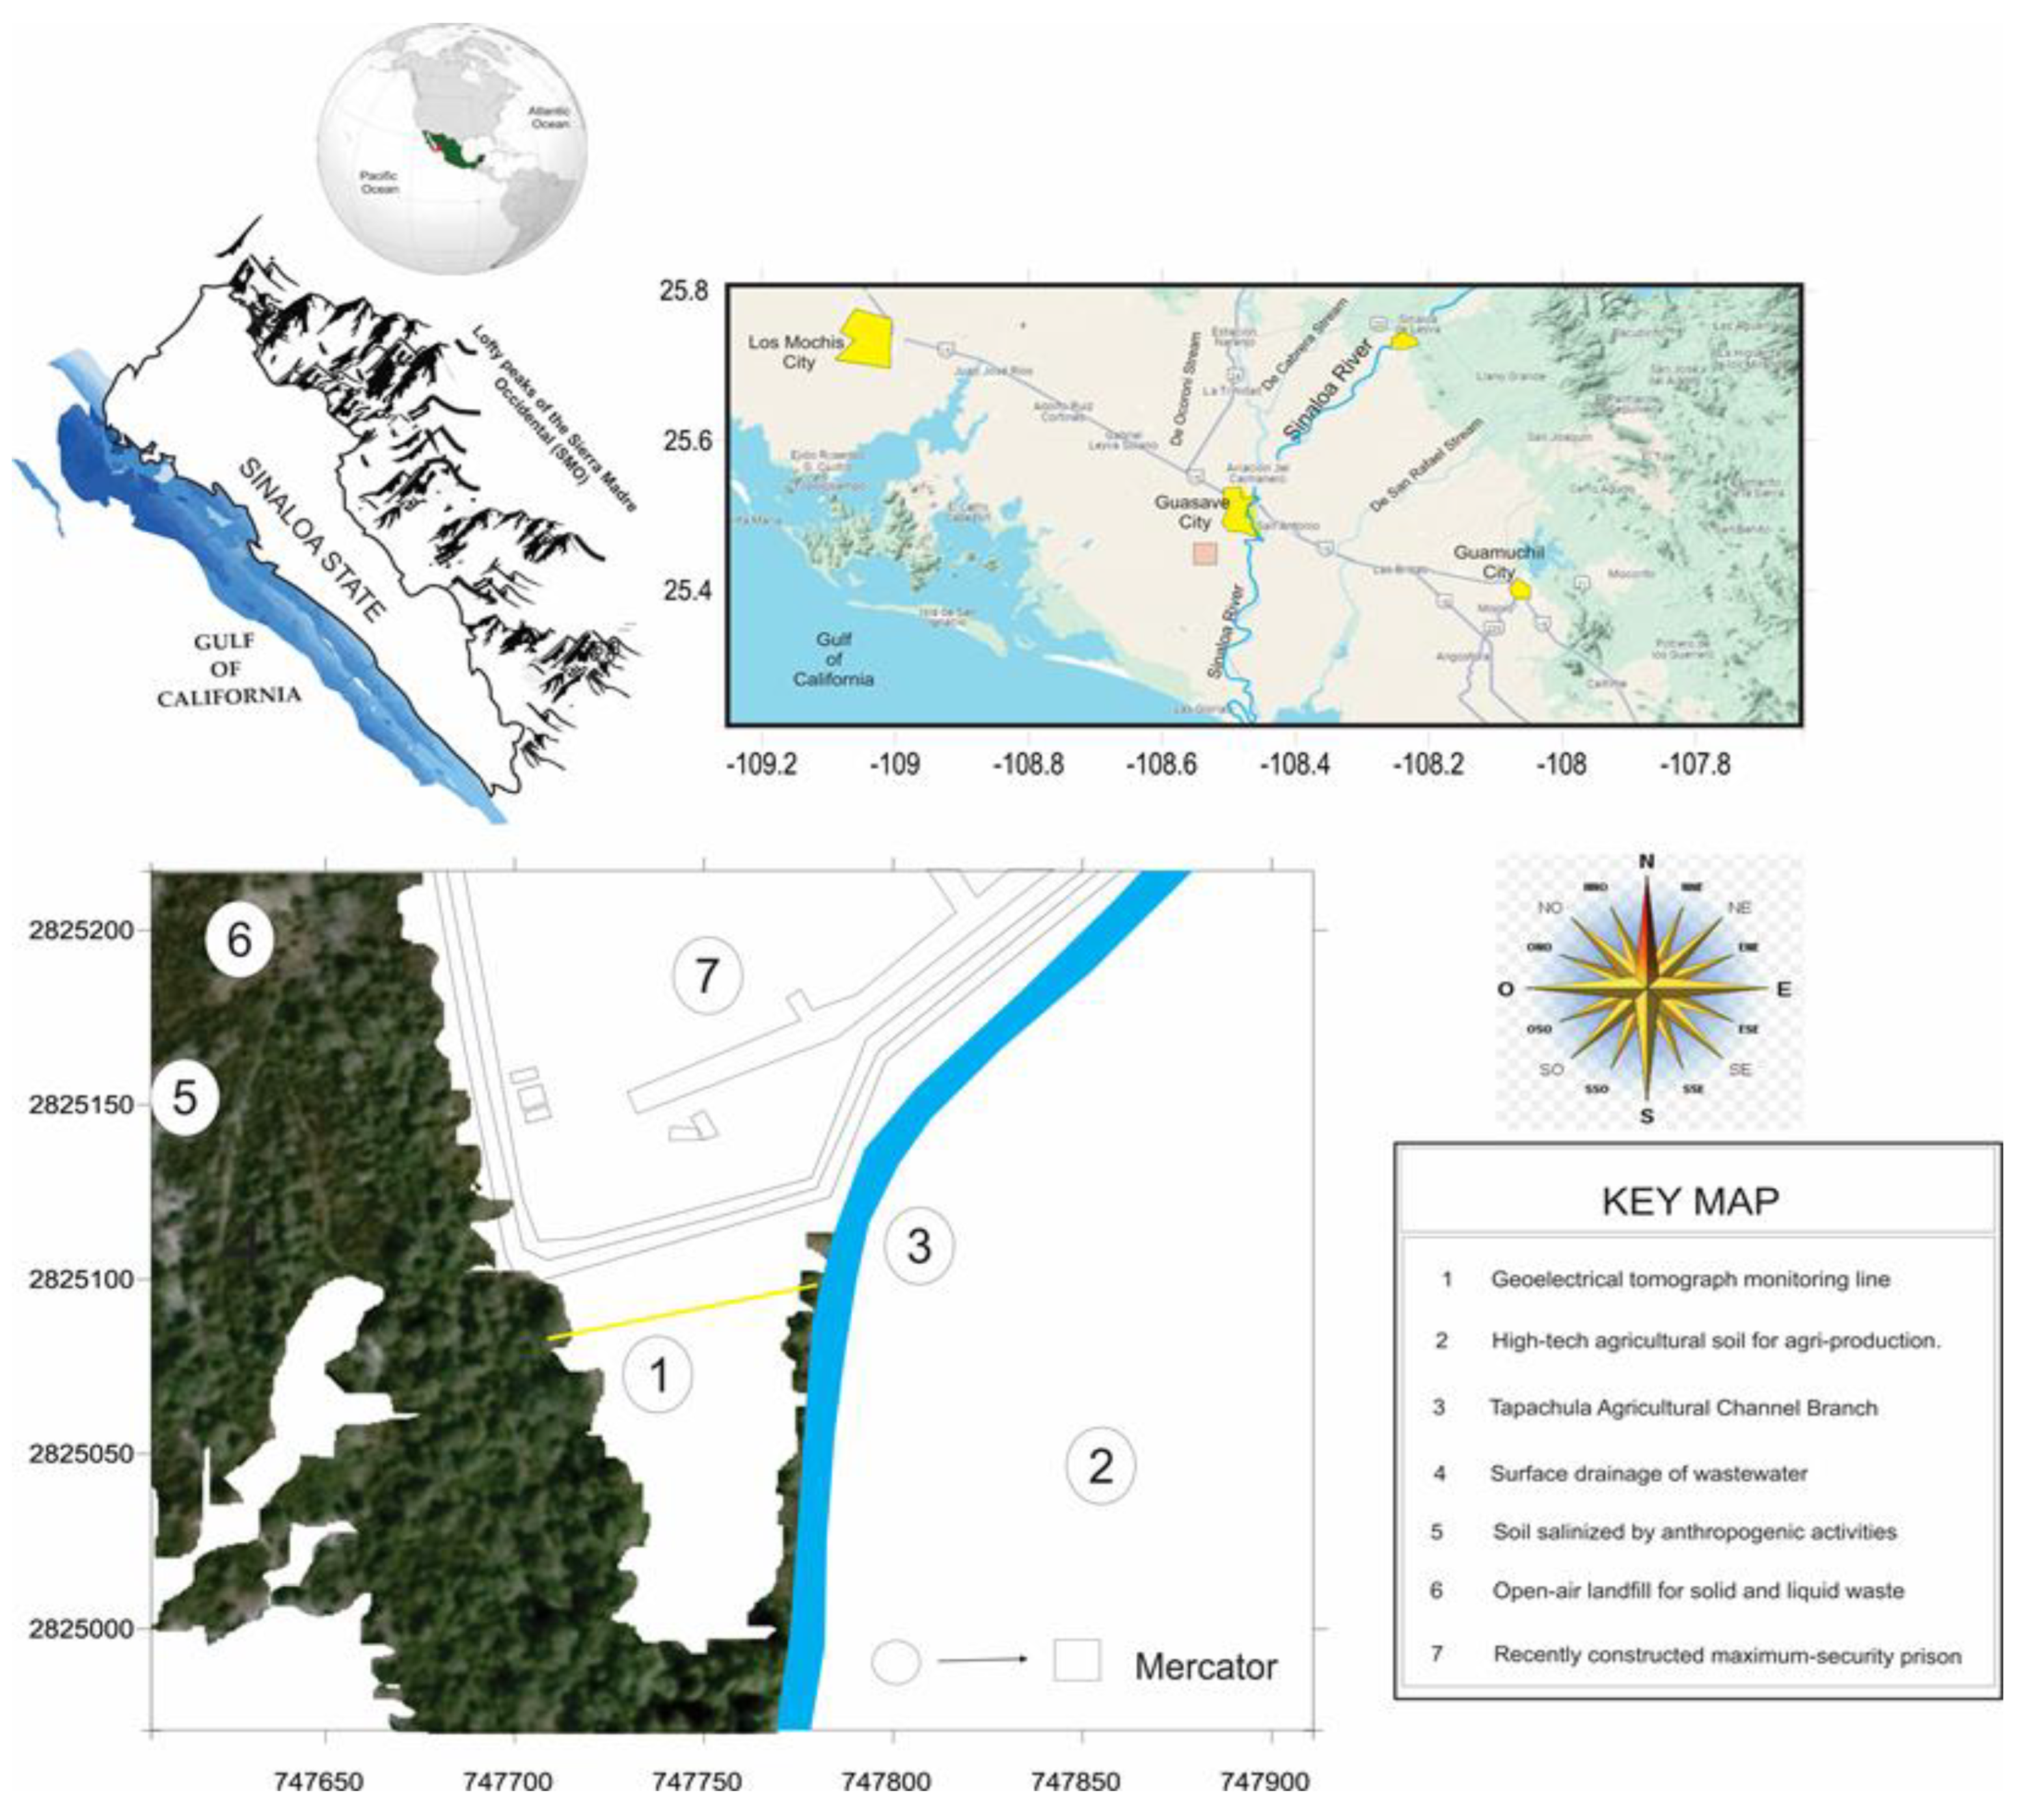
Figure 2.
(A) Geoelectrical psudoresistivity section (dipole–dipole) in Ωm, done in October 2022 (longuitude = 78 m). (B) Same section type for August 2023 (longuitude = 54 m), and (C) Multiple Lineal Regression: (ϱa2022 vs. ρa2023). The exploration depth was 12.5 m in the OAGD from Guasave Municipality, Sinaloa, México.
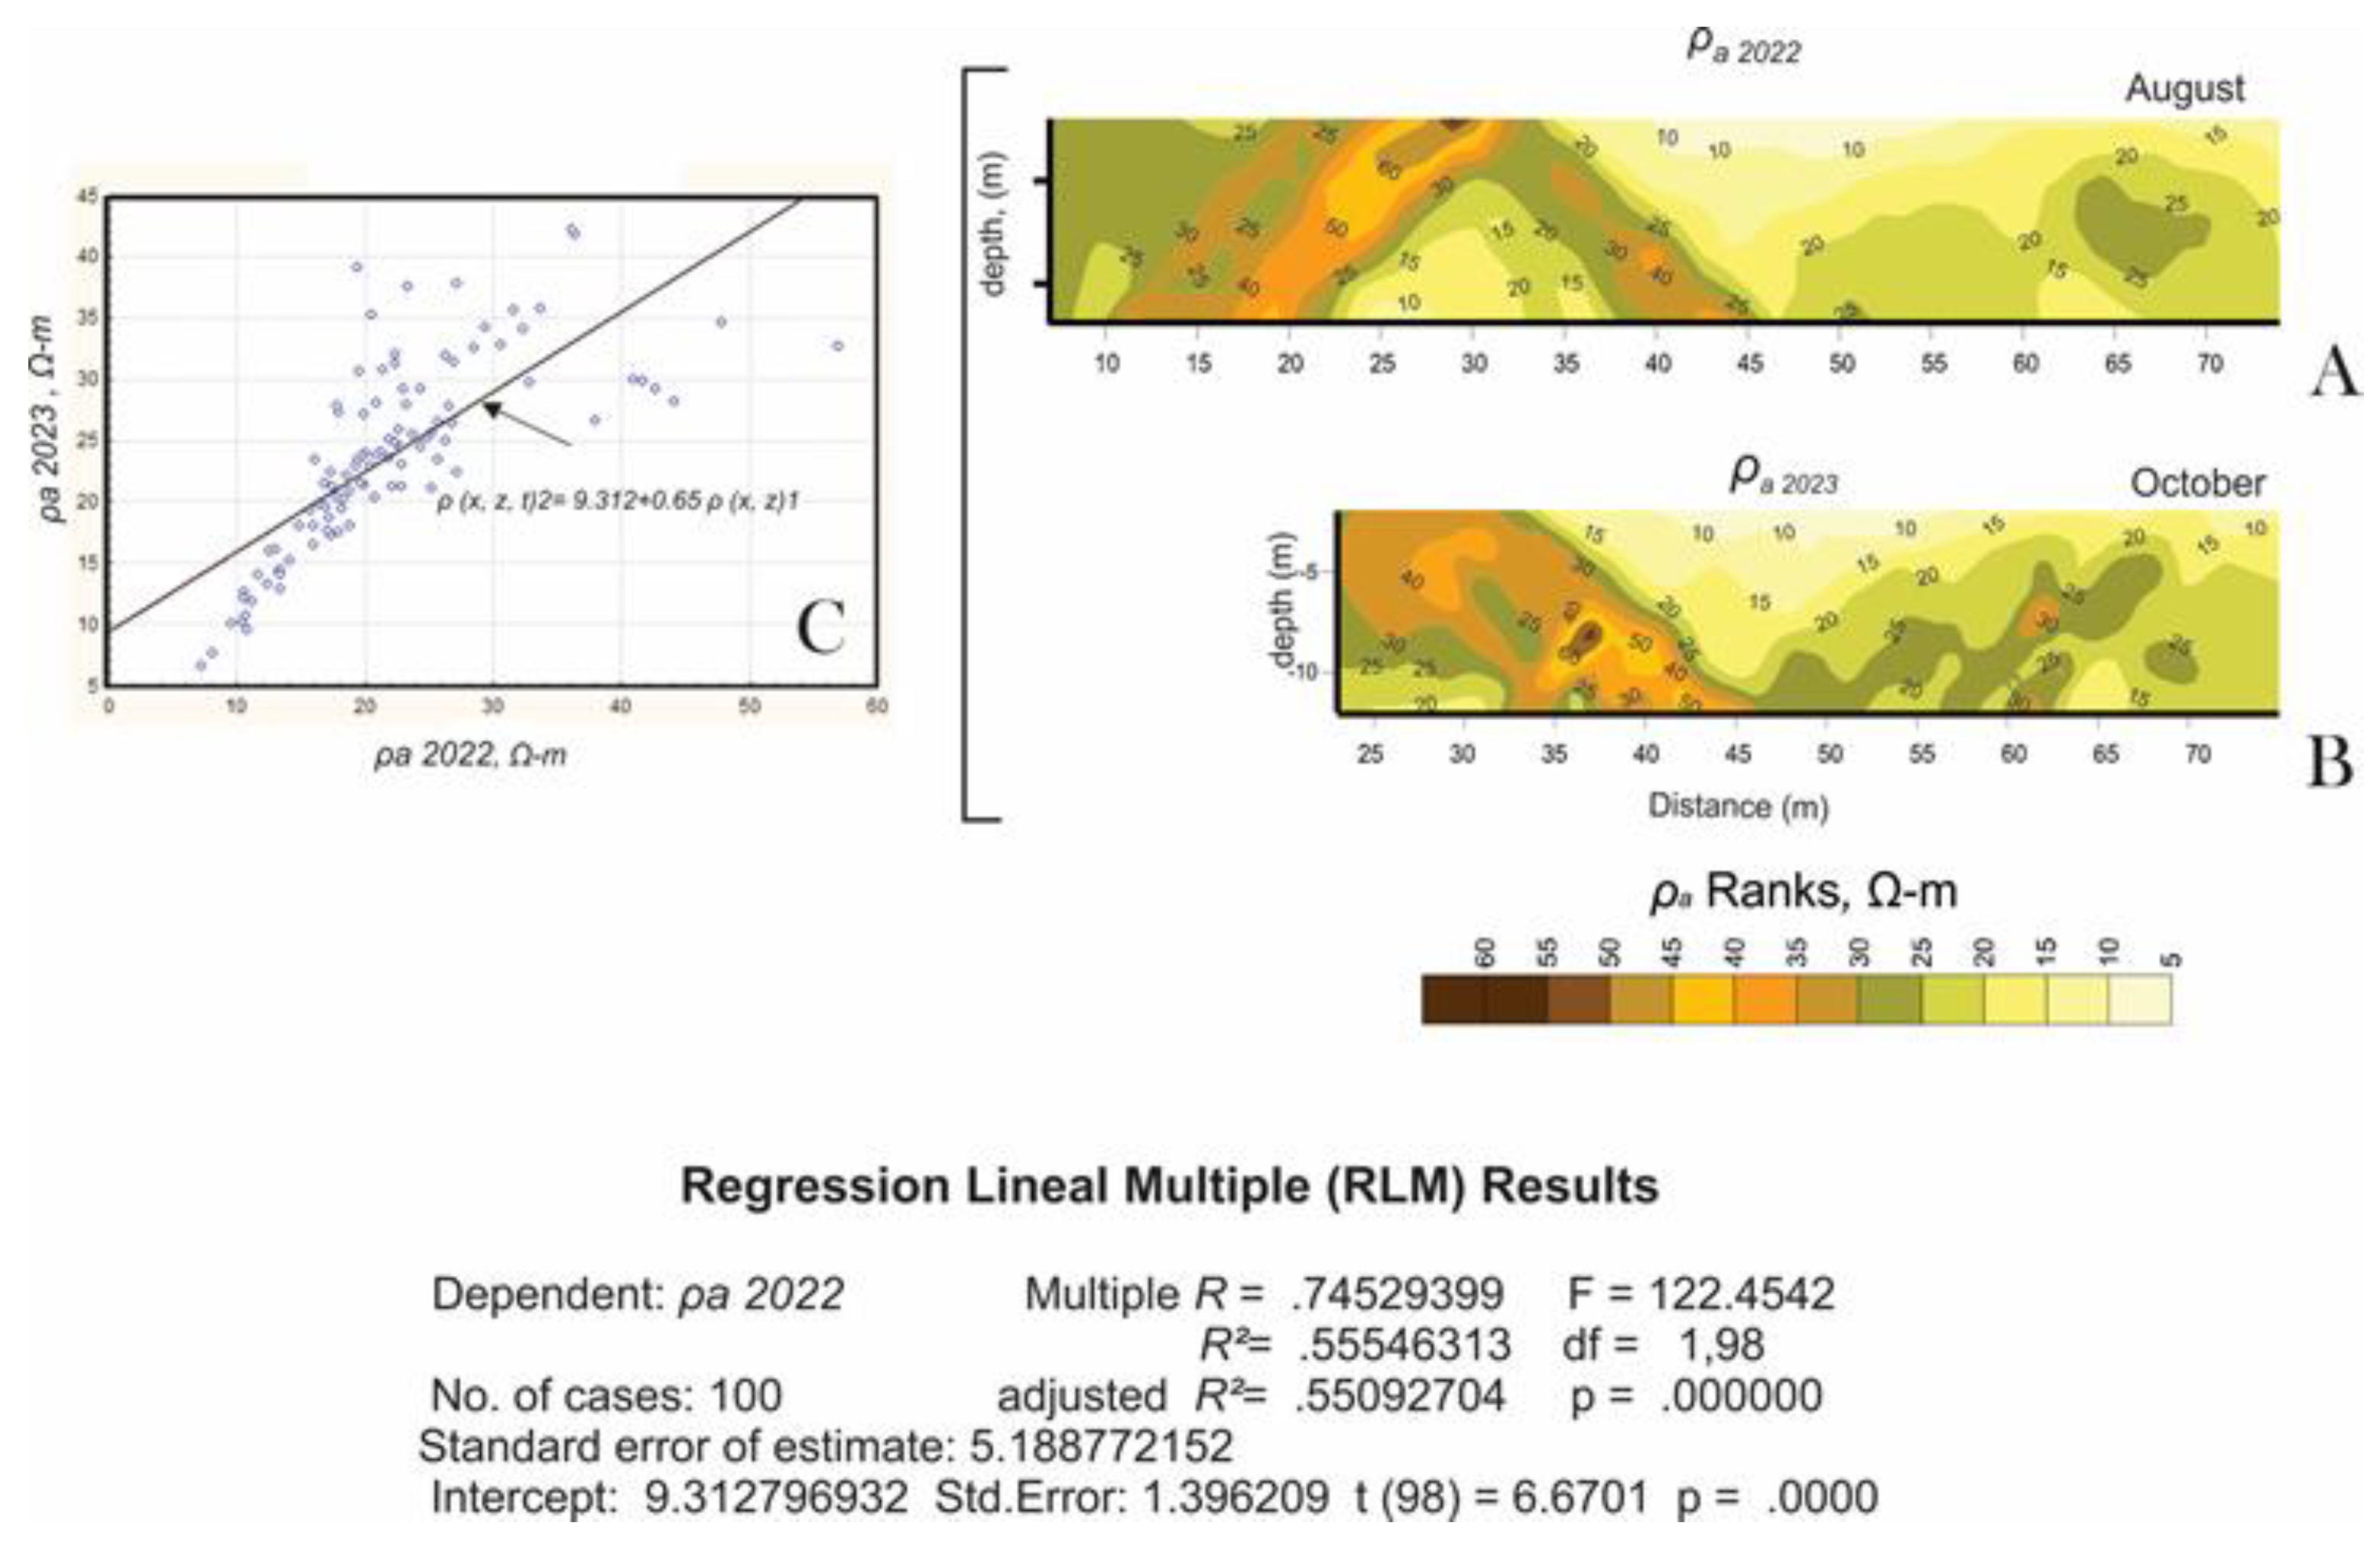
Figure 5.
Scheme hypothetically of porous media in subsoil and the persistent organic compounds as fats and oil, illustrating the degradation stages over time and their movement based on weights and densities simulating the occurrence of dispersion in the old OAGD studied. Are observe the gas compound’s source and contribution of greenhouse gases to the atmosphere. The solutes DROCs are dispersed over the distance and decreased according to the transport TIMP in groundwater.
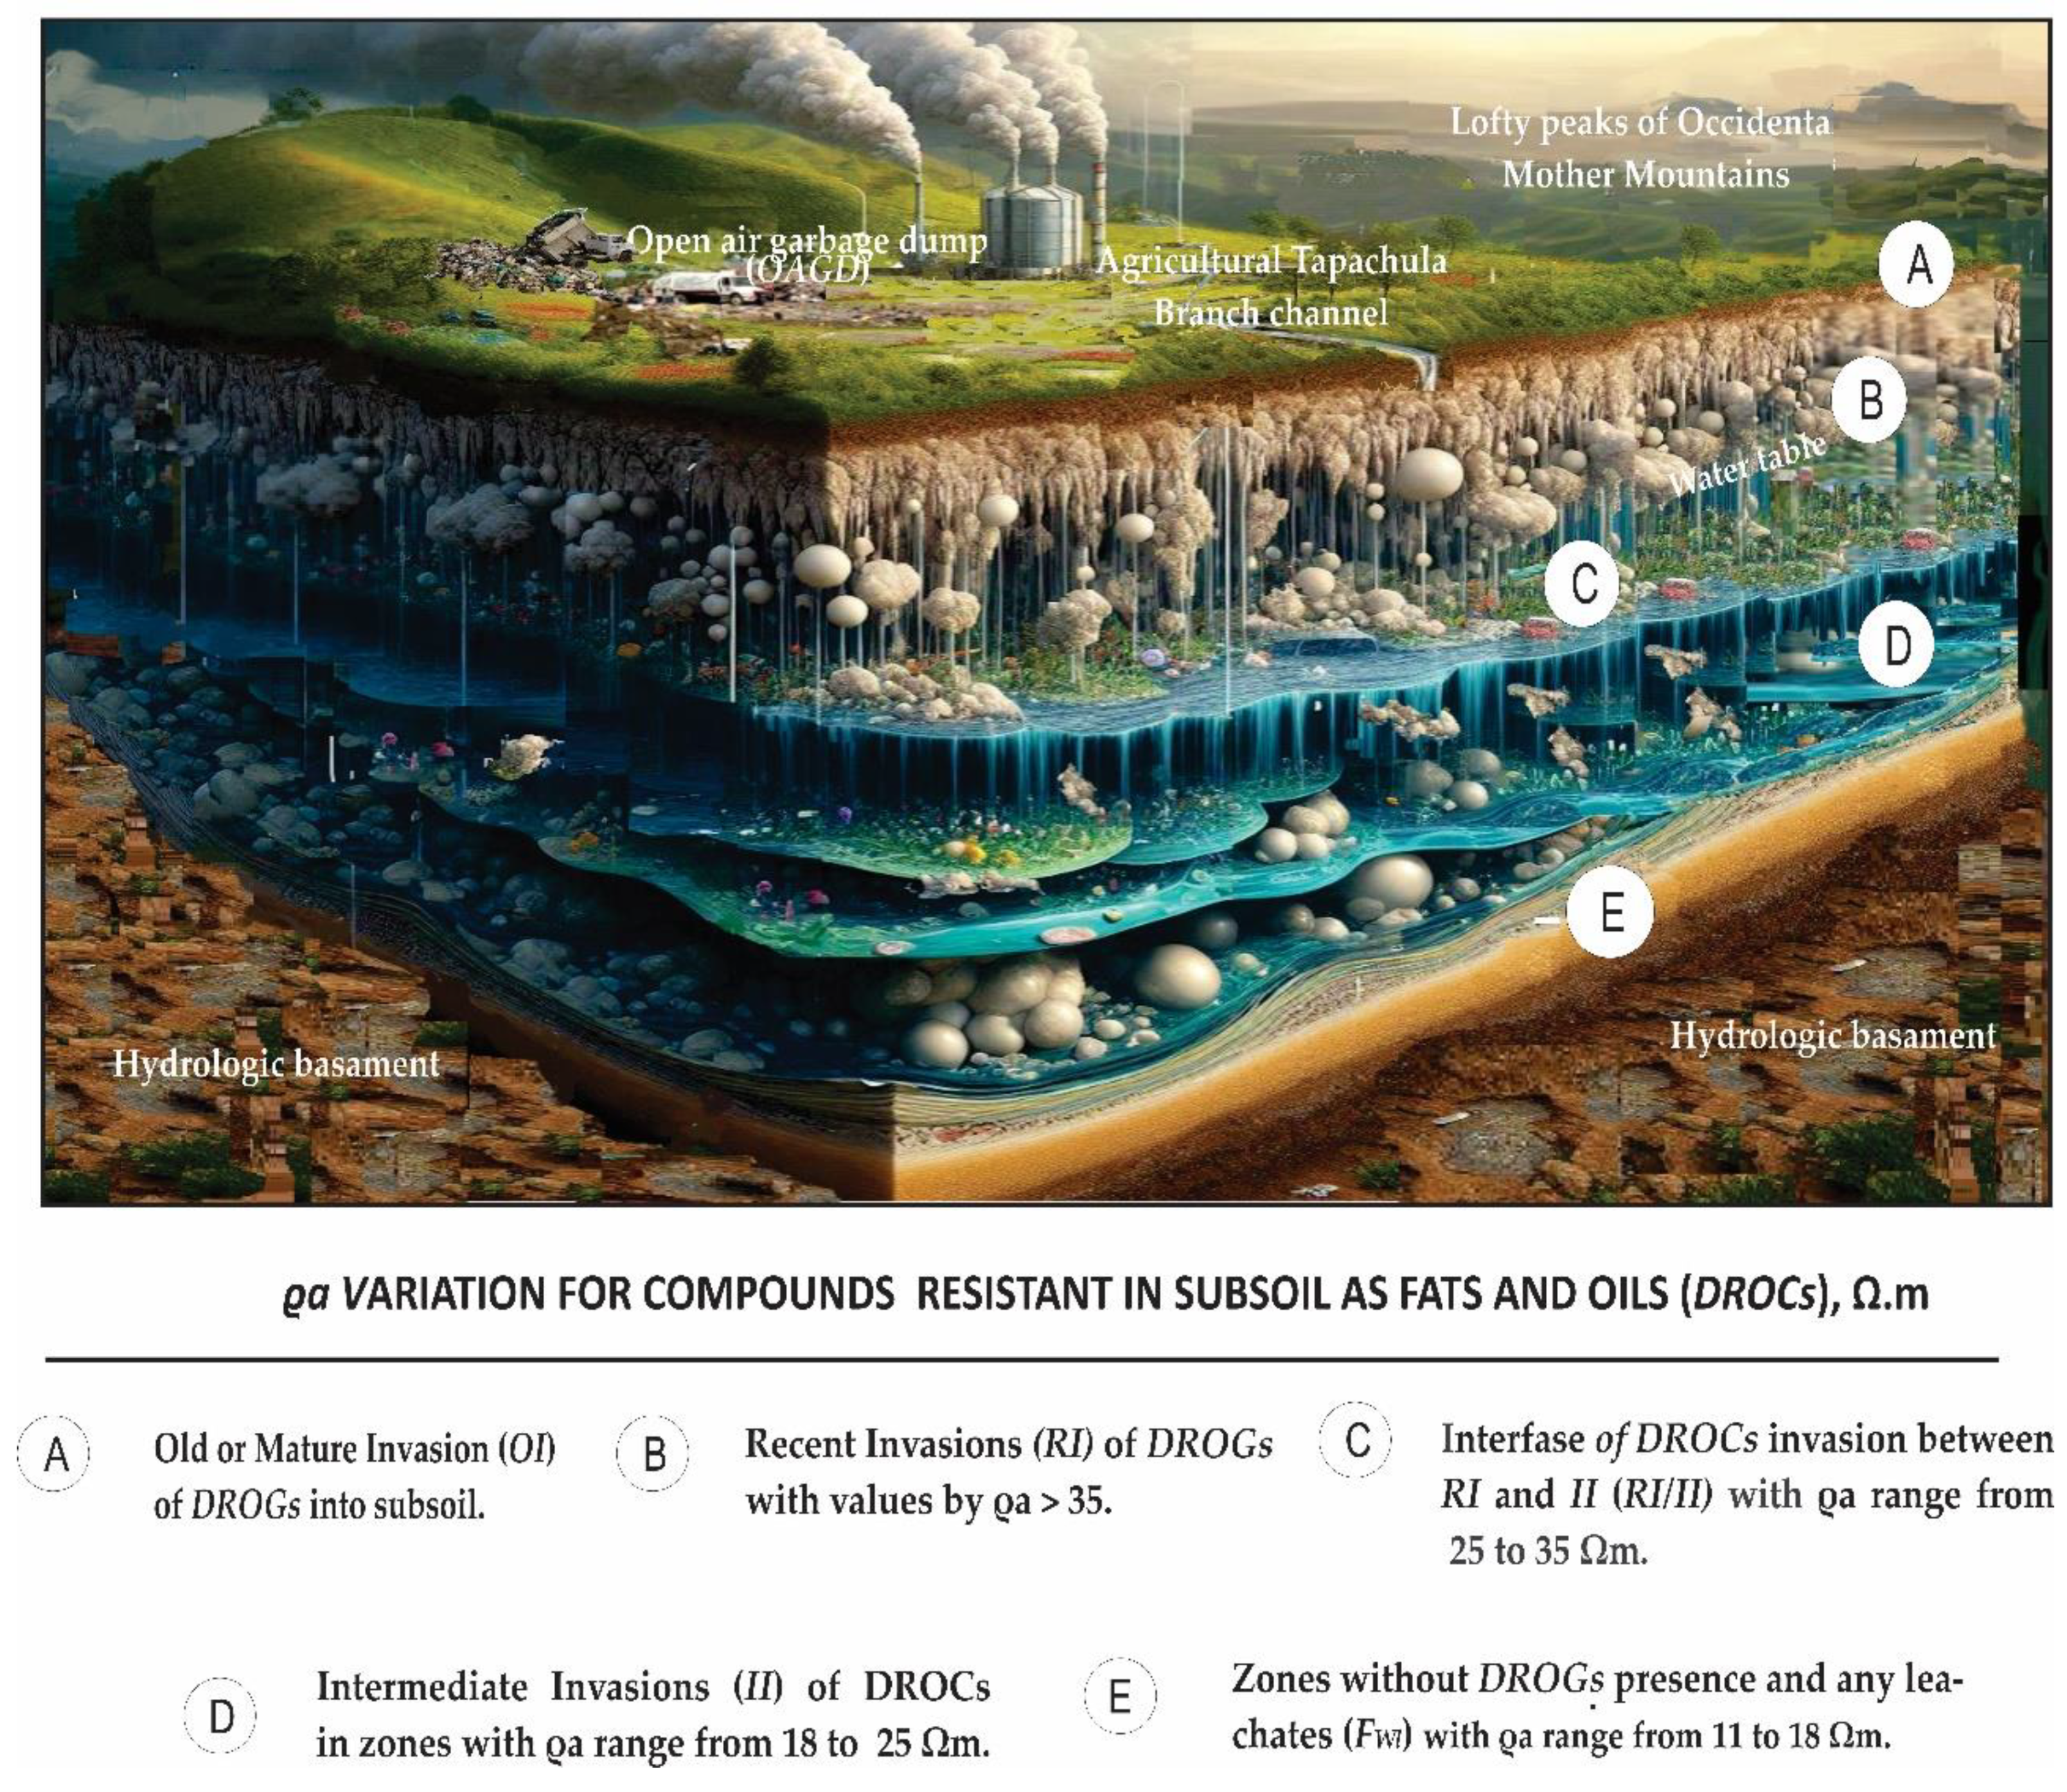

Table 1.
(A) Normality tests, and (B) statistical evaluation and central, tendency, and dispersion parameters statistical for analysis ρa2022 and ρa2023.
Table 1.
(A) Normality tests, and (B) statistical evaluation and central, tendency, and dispersion parameters statistical for analysis ρa2022 and ρa2023.
| A | B | ||||
|---|---|---|---|---|---|
| ρa2022 | ρa2023 | ρa2022 | ρa2023. | ||
| Normal test | Ωm | Ωm | Parameter statistic | Ωm | Ωm |
| Shapiro-Wilk W | 0,91 | 0,99 | ϱamin | 7.31 | 6.54 |
| p (normal) | 0 | 0,92 | ϱamax | 56.88 | 42.18 |
| Jarque-Bera JB | 49,36 | 0,62 | Σϱa | 2193.34 | 2365.66 |
| p (normal) | 0 | 0,73 | 21.93 | 23.66 | |
| p (Monte Carlo) | 0 | 0,7 | SEϱa | 0.88 | 0.77 |
| Chi^2 | 8,48 | 0,24 | σ2 | 77.87 | 59.95 |
| p (normal) | 0 | 0,62 | σ0 | 8.82 | 7.74 |
| Anderson-Darling A | 2,28 | 0,12 | ϱam | 20.51 | 23.43 |
| p (normal) | 0 | 0,99 | ϱaMo | 21.93 | 23.65 |
| Rabs | 49,67 | 35,64 | |||
| R2[ρa2022 vs. ρa2022 ] | 0,555 | ||||
| R²_adjusted | 0,551 | ||||
| 1-R2 | 0,49 | ||||
| Cv | 40,23 | 32,73 | |||
| R [ρa2022 vs. ρa2022 ] | 0,745 | ||||
| Q25th | 16.86 | 18.17 | |||
| Q75th | 25.6 | 29.17 | |||
| Swew_ ρa | 1.3 | 0.08 | |||
| Kurt _ ρa | 2.48 | − 0.31 | |||
| Mg | 20.37 | 22.24 | |||
| Q25th | 16.86 | 18.17 | |||
| Q75th | 25.6 | 29.17 | |||
| 95%IC | 20.20–23.66 | 22.13–25.17 | |||
| Keys for individual annual statistical parameters (punctual, dispersion, symmetry, and confidence interval) evaluated: minimum (ρamin) and maximum (ρamax) values, total sum (Σρa) mean (ρ̅a), standard error of ρa (SEρ̅a), standard deviation (σ0), variance (σ²), median (ρam), mode (ρaMo), absolute range (Rabs), standard deviation (σ0), variance (σ²), determination coefficient (R²), non-determination or alienation K coefficient (1 - R²), coefficient of variation (Cv), correlation coefficient (R), symmetry skewness (Swew_ρa), symmetry kurtosis (Kurt_ρa), positional percentile 25 % parameters (Q25th), positional percentile 75 % (Q75th) and 95% confidence intervals (95%CI). | |||||
Disclaimer/Publisher’s Note: The statements, opinions and data contained in all publications are solely those of the individual author(s) and contributor(s) and not of MDPI and/or the editor(s). MDPI and/or the editor(s) disclaim responsibility for any injury to people or property resulting from any ideas, methods, instructions or products referred to in the content. |
© 2024 by the authors. Licensee MDPI, Basel, Switzerland. This article is an open access article distributed under the terms and conditions of the Creative Commons Attribution (CC BY) license (http://creativecommons.org/licenses/by/4.0/).
Copyright: This open access article is published under a Creative Commons CC BY 4.0 license, which permit the free download, distribution, and reuse, provided that the author and preprint are cited in any reuse.


