
Submitted:
15 October 2024
Posted:
15 October 2024
You are already at the latest version
Abstract
Understanding hydrological processes is vital for managing phenomena such as floods and droughts and incorporating them into planning processes, as urbanization and the consequent increase in impervious surfaces have reduced natural landscapes, negatively impacting water infiltration and increasing surface runoff, which has led to more frequent urban floods. Recent research highlights the growing need to develop hydrological solutions at increasingly specific urban scales, emphasizing the importance of data collection, modeling, and micro-basin delineation, which are crucial for analyzing runoff behavior, sediment transport, and water quality. Topographical data is fundamental for hydrological analysis and can be collected through on-site surveys using tools such as total stations and GPS. However, these methods can be costly and time-consuming. Alternatively, remote sensing techniques, such as Digital Elevation Models (DEMs), offer cost-effective and efficient ways to gather topographical information. DEMs, often combined with Geographic Information Systems (GIS), represent elevation data and are widely available for free from various global agencies. These tools are invaluable in hydrological studies, as they help to model basin morphology and surface runoff patterns accurately. However, although there are models with global coverage, their resolutions are only occasionally optimal for hydrographic analysis. Additionally, some countries have regulatory agencies and institutions that generate geographic information, including DEMs, from national to local scales.
Keywords:
Unmanned Aerial Vehicles (UAVs)
; Hydrological processes
; Urbanization
; Basin delineation
; High-resolution DEM
; Photogrammetry
; GIS software
; Topography
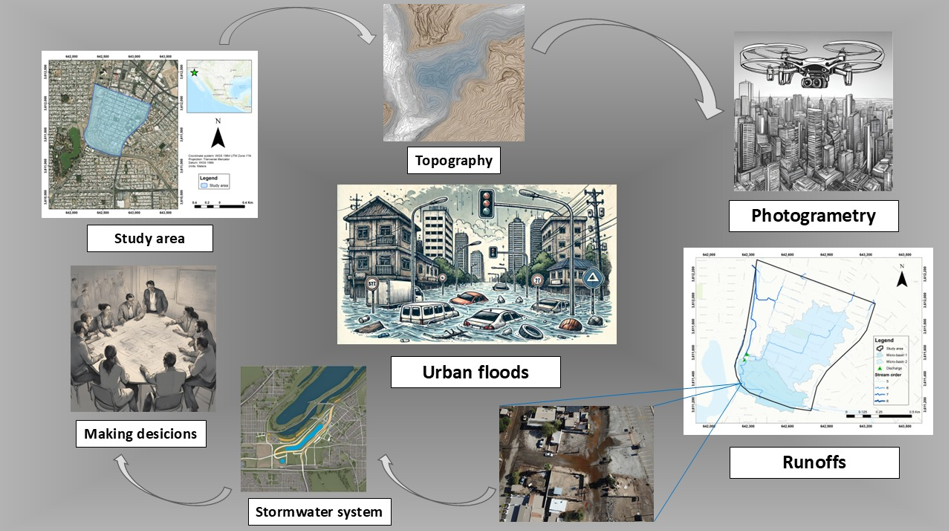
1. Introduction
In recent years, flooding in urban areas has become a serious problem worldwide, as documented in recent studies [1,2,3,4]. Understanding hydrological processes and estimating the associated variables are essential to evaluating phenomena such as floods, droughts, and desertification. These issues are critical priorities in managing and administrating a given area. The inclusion of these aspects in the political agenda leads to informed decision-making about study area [5]. As noted in previous studies [6,7], the unplanned growth of urban areas has led to increased impervious surfaces. This trend has reduced natural landscapes such as forests, bodies of water, and crops, negatively impacting surface runoff speed and duration. In addition, the decrease in water infiltration volume via soils hurts aquifers recharge and causes maximum flood volumes [8,9]. These events have significant adverse effects on economic development, public health, and quality of life, and they mainly affect developing countries [10]. Urbanization negatively impacts stormwater drainage systems, often leading to congestion, flash floods, and water quality deterioration. Historically, urban waterways have been confined to narrow river corridors with channels lined by concrete or other artificial materials. Additionally, waterways in or near urban areas are negatively affected by solid pollutants carried in stormwater runoff [11].
The hydrological analysis of intra-urban basins has been of great importance in the disciplines of hydrology [12,13,14,15]. One of the most relevant components of urban hydrology is basin delineation, including the surface runoff characteristics [16], and it is an indispensable factor for analyzing hydrodynamic behavior, sediment transport, basin management, and quality of water [17].
Factors such as topography define the routes by which surface runoff moves throughout a basin, making it a critical element that influences the hydrological response of the basin to precipitation [18]. Topography must be analyzed to develop hydrological studies. Sometimes, this information is obtained directly on-site (in situ) by carrying out topographic surveys and using specialized equipment such as total station and GPS/GNSS equipment. However, the costs of carrying out these procedures are usually relatively high. They may also present deficiencies in the land surface definition [19].
Nowadays, there are indirect methods to obtain topographic information, such as remote sensing techniques, which, for cases such as hydrological studies, basin morphologies, and configuration of surface runoff within a basin, are usually very useful. [20]. A typical tool to use is a Digital Elevation Model (DEM), which is comprised of raster files (files made up of pixels) that mathematically and visually represents the elevation values concerning the mean sea level (msl) and the earth as a whole. When used in combination with Geographic Information Systems (GIS), the earth’s surface and the elements found on it are represented as closely as possible to reality [21].
At a global level, governmental and non-governmental agencies and institutions provide various DEMs of various spatial resolutions, the acquisition of which is free of charge. Table 1 presents some of the available databases.
Although there are models with global coverage, their resolutions are only sometimes optimal for hydrographic analysis. Additionally, some countries have regulatory agencies and institutions that generate geographic information, including DEMs, at national and local scales.
In Mexico, the National Institute of Statistics and Geography (INEGI) is the Autonomous public agency responsible for gathering and disseminating information on Mexico’s territory, resources, population, and economy, which allows us to learn about the characteristics of the country and assist in decision-making [21], It is also, the data source for DEMs, with a maximum resolution of 5 meters, this allows for a more detailed representation of the Earth’s surface and its elements compared to global-scale data sources.
However, the resolutions may still need to be revised to delineate small basins precisely and determine the runoff volume. For this reason, Mark et al.‘s [22] study recommends using a DEM with a resolution between 0.1 and 0.4 meters.
Several investigations have highlighted the importance of resolving DEMs. For example, Pérez & Cohen [23], analyzed how the resolution of different DEMs (90m, 15m, 25cm, and 4cm) affects the modeling of hydrological processes. The results revealed that the areas with more significant runoff and sedimentation varied depending on the resolution of the DEM used in the modeling. However, it was observed that DEMs with resolutions of 25cm and 4cm provided similar results in describing a hydrological system. Consequently, for hydrological modeling purposes, it was concluded that using a higher resolution DEM of 25cm did not significantly affect the results.
Likewise, Fleischmann et al.‘s [24], carried out a study in the Itajaí River basin in Brazil, which covers approximately 15,000km2. Their research demonstrated how it is possible to leverage information from a high-resolution (1m) DEM to improve a basin’s hydrological and hydrodynamic modeling compared to a conventional low-resolution (90m) DEM. They concluded that the 1m DEM more accurately represented the behavior of the floodplains in the inertial flow propagation model. However, they also suggested that it is unnecessary to use the high-resolution model throughout the basin and instead propose the creation of a mixed DEM. In this approach, the high-resolution DEM would be used only in the most critical channels where floodplains occur on their banks.
In recent years, high-resolution DEM has seen significant advancements, largely due to photogrammetry and Unmanned Aerial Vehicles (UAVs), commonly known as drones. These technologies have diverse applications, including upgrading, studying, monitoring, inspection, and other activities in specific areas [25]. They also offer higher resolutions than satellite images [26]. Image capture with UAVs is particularly valuable for generating DEMs and has numerous applications in cartography, orthophotography, agronomy, topography, architecture, and others, noted that due to the precision of data obtained with UAVs, it has been classified as an appropriate tool for water resources management [27].
Implementing new technologies utilizing DEM has significantly advanced the understanding of the Earth’s surface. For this research, DEM is the primary source for delineating intra-urban micro-basins [28]. Technologies that use the Global Positioning System (GPS), Global Navigation Satellite System (GNSS), UAVs, and specialized software in photogrammetric restitution will allow morphometric analyses of micro-basins [29], to be carried out more accurately than the DEM available from various government sources and private sectors.
In Mexico, there are norms and regulations regarding DEMs [30] and methodologies for hydrological calculations [31]. However, it is necessary to mention that the resolution or optimal tools for the correct delimitation of an intra-urban basin must be regulated. Therefore, the goal of this research is to compare different DEMs and tools to delineate an intra-urban basin by analyzing its morphometric parameters. With the results obtained, considerations can be made so that decision-makers consider updating and regulating these hydrological analyses.
2. Materials and Methods
This research consists of three main phases, as shown in Figure 1. In the first phase, flight planning and the generation of the DEM were carried out. Subsequently, in the second phase, a DEM with a resolution of 5m was obtained from the INEGI, which covers the surface of the study area. The third phase concluded by carrying out the morphometric calculations of the micro-basins generated using both models.
2.1. Study Area
The study area is located in Mexicali, Baja California, mainly in the El Vidrio neighborhood, next to the Río Nuevo. This river crosses the city and also serves as a boulevard. This area covers approximately 0.75 km2. Due to its proximity to the New River bed, it has the lowest elevations in the city, even below MSL. Historically, this area has experienced flooding problems during rain events.
Figure 2.
Location of the study area.
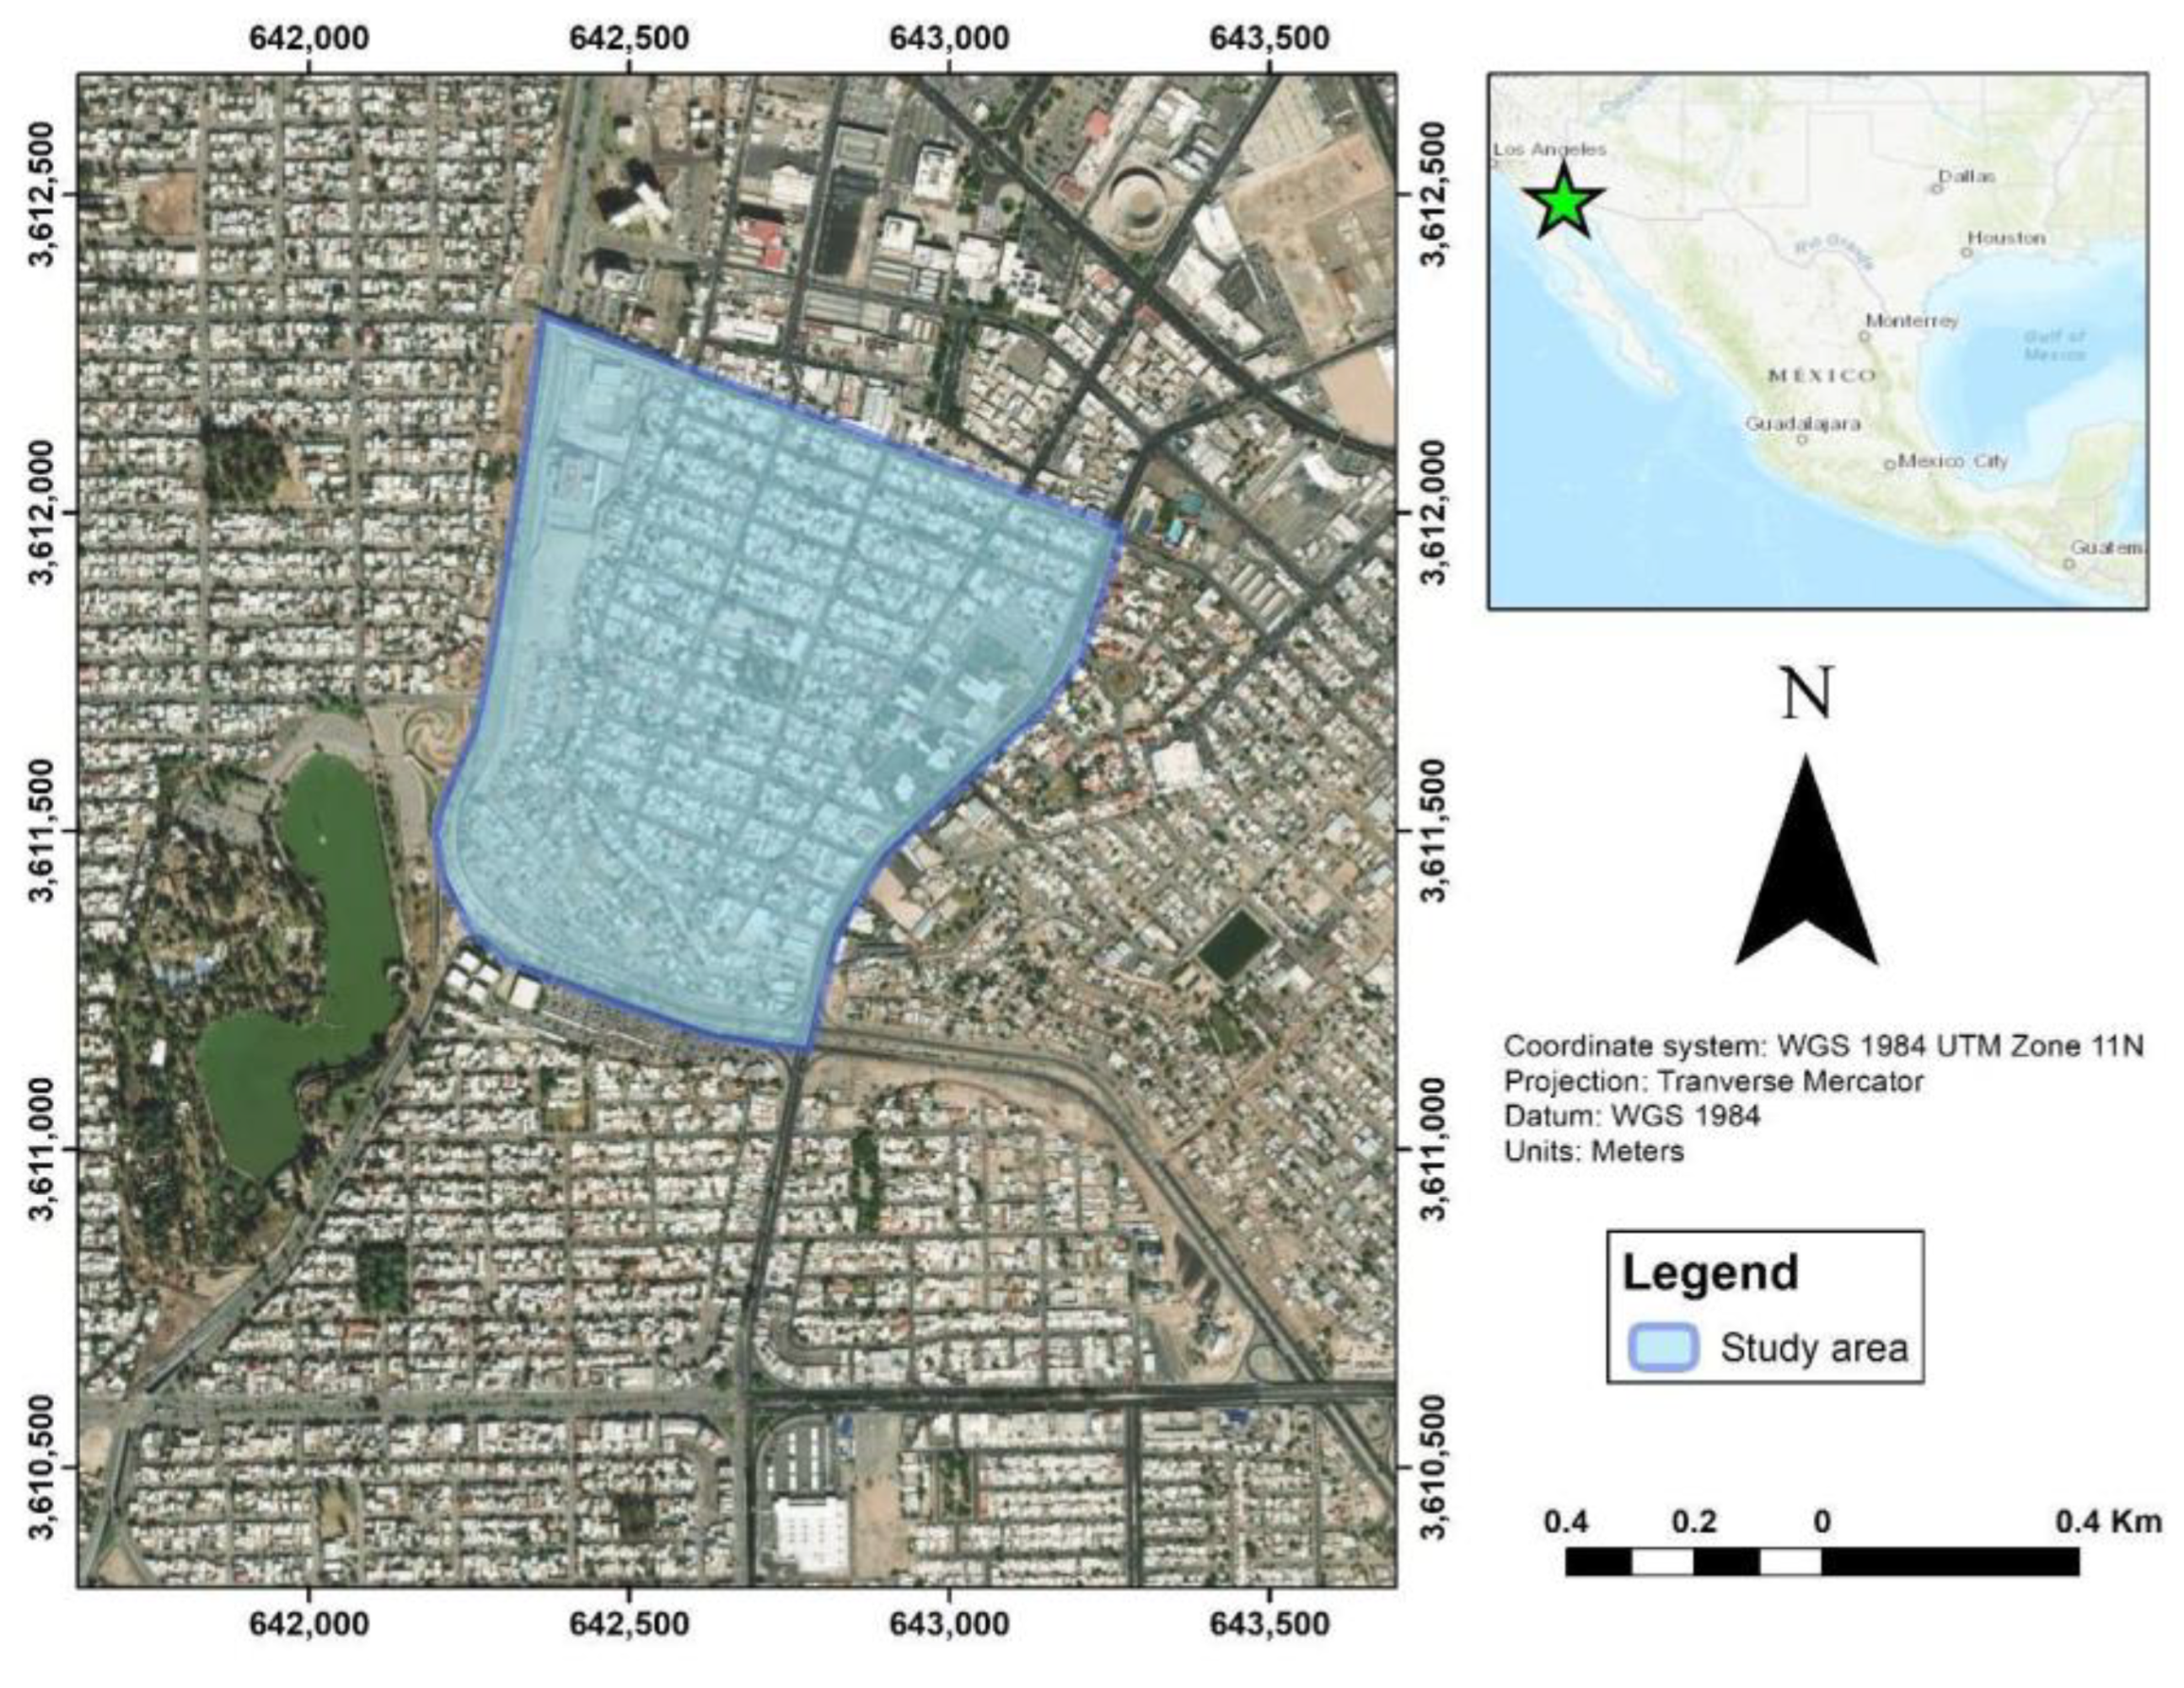
El Vidrio is located within the “Salton Sea” basin, a transboundary basin with the United States and part of the Colorado River Delta. The city’s predominant climate is arid, with extreme temperatures at different times of the year. The highest average temperatures occur in July and August, just below 32 °C, and the monthly minimum ranges between 11 and 14 °C in January [32].
Regarding precipitation events, they present an annual total of 20 to 60mm, with September recorded as the month with the highest millimeters of precipitation; on the contrary, May and June present the lowest [32].
The study area is located entirely within the city, which, as a consequence, has paving in a large amount of the roads, modifying their runoff coefficient (C), making the surface impermeable, without allowing water to infiltrate into the ground and generating more significant surface runoff that would cause problems for the population.
2.2. DEM Generation
The generation of the DEM through the use of the UAV involves carrying out a series of steps, such as planning and an autonomous flight plan, considering from the surface to be flown over to meteorological conditions (temperature, wind speed, and others). Place physical marks called ground control points (GCP) and obtain their coordinates using GPS/GNSS equipment to calibrate the DEM. Operation of the UAV with the previous flight planning, verification of the characteristics of obtaining images, overlap between them, and flight time, among others (the GCP marks must be appreciated when obtaining images). Generate the DEM using the obtained images; the GCP coordinates, and the specialized photogrammetric restitution software (for this study, the Agisoft Metashape 1.6.0 software was used).
2.3. Generation of Surface Runoff Networks and Their Orders
Once the DEM is generated, it is exported in raster format and loaded into the three GIS software, ArcGIS 10.5, GlobalMapper 21.1, and SAGA GIS 2.3.2 to generate surface runoff and micro-basins layers, using the hydrological tools of each software. Strahler method was used for each runoff to establish runoff orders. For this goal, a series of steps must be carried out, which vary between each software; Figure 3, Figure 4, and Figure 5 describe the procedures to be carried out for each of them. This exact procedure is carried out using the INEGI DEM.
2.4. Estimation of Morphometric Parameters
As a result of generating the micro-basins in the study area using GIS software, vector polygons (shapefile format) are created to represent their shape and dimensions, and therefore, using essential GIS tools, some parameters can be estimated. Of these micro-basins, related to their shapes, such as:
- Micro-basin Area (A)
- Micro-basin Perimeter (P)
- Basin Length (L)
- Main channel length (Lc)
- Main channel slope
According to Sri Harto [33], these parameters mainly influence the peak time, peak flow and base time.
Additionally, with the abovementioned parameters, it is possible to estimate other parameters that describe the hydrological behavior mentioned in Table 2.
3. Results and Discussions
3.1. DEM Generated by UAV
The UAV DEM was generated from the photogrammetric procedure using 1,275 high-resolution photographs, integrating all point classifications. The procedure obtained maximum elevation values of 24m above sea level and minimum elevation values of 7.5m below MSL (Figure 6).
3.2. UAV-INEGI DEMs Comparison
A comparison is made between the DEMs concerning the spatial resolutions that each one presents, in which the DEM generated by UAV and the photogrammetric process presents a better resolution (0.13m/pix, Figure 7) compared to the model obtained from the INEGI databases (5m/pix, Figure 8). Consequently, there are some differences in elevations between the two models, particularly in the maximum elevations, since the INEGI DEM has a maximum elevation of 14.2 meters above sea level. In contrast, the DEM generated by UAVs has a maximum elevation of 24 meters above sea level. These differences are due to the better resolution of the UAV DEM, which detects elements such as power lines, treetops, and other existing elements, which are elements that the resolution of the INEGI DEM cannot detect. However, these elements, such as treetops, do not affect runoff generation since different software can omit specific pixels that generate errors in the model’s definition.
3.3. Generation of Runoff and Basin Layers
The generation of surface runoff in the study area is carried out based on the DEM generated by UAV and a photogrammetric process against the INEGI DEM, using three different GIS software (ArcGIS, GlobalMapper, and SAGA GIS) obtaining a total of 9 micro-basins generated by the three software already mentioned (Table 3) and making a comparison of the results obtained as shown in Figure 9, Figure 10, Figure 11, Figure 12, Figure 13, Figure 14.
3.4. Morphometric Parameters of the Micro-Basins
Once the micro-basins and runoffs were generated, the primary morphometric parameters, such as the area, perimeters, and length of the micro-basins, were calculated using GIS software and the essential tools of geometric calculations. The results are shown in Table 4 and Table 5.
Additionally, other morphometric parameters related to the shape of the micro-basins were calculated, such as concentration times, compactness coefficient, Horton shape factor, and elongation ratio, which allow these parameters to describe the hydrological behavior of the micro-basins.
3.5. Stream Order (Strahler)
Streams generated from the UAV DEM and photogrammetric process using the ArcGIS and SAGA software has an order of 8. In contrast, those generated by the GlobalMapper software show an order of 6.
Furthermore, the generation of runoff from the INEGI DEM shows very similar behaviors between the ArcGIS and GlobalMapper software, with the difference that the runoff order through ArcGIS is of order 3. At the same time, those generated by GlobalMapper are of order 4.
Stream order on its own may not be particularly useful. However, it can serve as an indicator for other stream characteristics like the number of streams, slope, drainage area, and water discharge. [34].
3.6. Time of Concentration
The lowest concentration time calculated with the two DEM and the three GIS software was 0.60 minutes; this value was presented in micro-basin 1 of the INEGI DEM and the SAGA GIS software. This short duration is due to the relationship between both the average slope of the mainstream (0.02035 m/m) as well as its length (0.39Km), showing a very steep slope in a relatively short distance, allowing a flow in which the water that flows through the micro-basin reaches the point of exit or discharge in a short period.
The highest concentration time was 1.69 minutes in micro-basin 1 of the UAV and ArcGIS software-generated DEM. This concentration time is due to the average slope of the primary runoff (0.00304m/m) and its length (0.39km), which indicates that it takes more time to drain the water from the furthest points toward the exit or outlet points [35].

Table 6.
Concentration time calculation.
| Time of concentration (Tc) | |||||
|---|---|---|---|---|---|
| UAV | INEGI | ||||
| Software | Equation | Micro-basin 1 | Micro-basin 2 | Micro-basin 1 | Micro-basin 2 |
|
ArcGIS |
|
1.25 |
1.71 |
1.69 |
0.78 |
|
GlobalMapper |
0.99 |
1.54 |
0.65 |
||
|
SAGA GIS |
1.61 |
0.60 |
|||
3.7. Compactness Coefficient (Gravelius)
The lowest compactness factor calculated with the two DEM and the three GIS software was 1.70, which occurred in two micro-basins: micro-basin 1 of the DEM generated with UAV and the ArcGIS software and micro-basin 1 of the DEM of the INEGI with the ArcGIS software. These basins have an elongated to oblong rectangular shape and present lower concentrations of water volumes in precipitation events.
The highest compactness factor calculated was 5.32, which occurred in micro-basin 1 of the DEM generated by UAV and the GlobalMapper software, which, in comparison with micro-basins 1 and 2 generated with the INEGI DEM and the GlobalMapper software, do show changes. Significant in the values (2.03 and 2.08 respectively), however, the compactness results of both models and using the same software describe the micro-basins with a rectangular shape (since their values are more significant than 1.75), indicating that they are elongated micro-basins and present lower concentrations of water volumes [36].
Table 7.
Compactness coefficient calculation.
| Compactness coefficient calculation (Kc) | |||||
|---|---|---|---|---|---|
| UAV | INEGI | ||||
| Software | Equation | Micro-basin 1 | Micro-basin 2 | Micro-basin 1 | Micro-basin 2 |
|
ArcGIS |
|
1.70 |
2.18 |
1.70 |
1.75 |
|
GlobalMapper |
5.32 |
2.03 |
2.08 |
||
|
SAGA GIS |
3.43 |
1.94 |
|||
3.8. Form Factor (Horton)
Regarding the calculation of the Horton shape factor, the results obtained were very similar using the two DEM and the three GIS software, obtaining a maximum value of 0.39, present in micro-basin 2 with the INEGI DEM and the GlobalMapper software, whose value indicates that the basin is “neither elongated nor widened,” having a balance between discharge volumes in the main channel and concentration volumes.
The minimum calculated value was 0.22, presented in micro-basin 1 of the INEGI DEM and ArcGIS software and micro-basin 1 of the UAV DEM and the SAGA GIS software, this indicates that these basins are elongated and present lower volumes of water because the main channel is longer than the secondary channels, and the concentration times for precipitation events are different [37].
Table 8.
Horton form factor calculation.
| Form factor (Horton, Kf) | |||||
|---|---|---|---|---|---|
| UAV | INEGI | ||||
| Software | Equation | Micro-basin 1 | Micro-basin 2 | Micro-basin 1 | Micro-basin 2 |
|
ArcGIS |
|
0.34 |
0.24 |
0.22 |
0.33 |
|
GlobalMapper |
0.35 |
0.28 |
0.39 |
||
|
SAGA GIS |
0.22 |
0.31 |
|||
3.9. Elongation Ratio
In the elongation ratio, very similar values were shown in all the generated basins, the maximum value of which was 0.71, which was presented in micro-basin 2 of the INEGI DEM and the GlobalMapper software, and the minimum value was 0.53, a value present in two micro-basins. In micro-basin 2 of the DEM with UAV and the SAGA GIS software and micro-basin 1 of the DEM of the INEGI and the ArcGIS software, however, the maximum value and the minimum value are within the category of a flat basin with accidental portions, since this category is between the range of 0.5 and 0.8 [38].
Table 9.
Elongation ratio calculation.
| Elongation radio (Re) | |||||
|---|---|---|---|---|---|
| UAV | INEGI | ||||
| Software | Equation | Micro-basin 1 | Micro-basin 2 | Micro-basin 1 | Micro-basin 2 |
|
ArcGIS |
|
0.66 |
0.55 |
0.53 |
0.65 |
|
GlobalMapper |
0.66 |
0.60 |
0.71 |
||
|
SAGA GIS |
0.53 |
0.62 |
|||
4. Conclusions and Recommendations
GIS software and hydrological tools facilitate the processing of the DEM in generating micro-basins in the study area. GIS software such as ArcGIS, GlobalMapper, and SAGA GIS are viable options for carrying out these studies; however, the results of this software are variable, especially in the geometry of the micro-basins and their surface runoff.
That is why; despite obtaining viable results in each, the following recommendation is made for the ideal scenario: ArcGIS software is the most suitable for large-scale hydrological projects. It obtains results with greater precision, especially in the geometry of the generated basins. Additionally, it shows an excellent capacity for processing spatial information. Otherwise, GlobalMapper software meets the objectives of generating micro-basins and surface runoff with precision. However, it shows some deficiencies in processing high-resolution raster information (DEM). Therefore, it is advisable to use this software for medium and large projects. It has a low territorial extension. Finally, SAGA GIS software is recommended for smaller-scale projects and academic-educational purposes since this program showed problems in processing micro-basins and runoffs using both DEMs, even showing issues in the software (not responding).
Concerning the DEM, the generated DEM’s resolution of 0.13cm/pix, compared to the INEGI DEM’s horizontal resolution of 5m/pix and 1m/pix vertical resolution, allows for a better definition of the existing elements on the Earth’s surface and the topography of the study area.
Organizations such as the National Water Commission (CONAGUA), the regulatory body for the preservation and regulation of water in Mexico, need to specify the specialized software for hydrological studies. Consequently, and as mentioned previously, differences may occur in the results of said studies when different software is used for hydrological analysis.
In the singular case of the city of Mexicali, being a city that does not present significant variations in elevations in its relief, it is of utmost importance to be able to identify the minimum changes in elevation, a fundamental element to analyze the behavior of the basins, and therefore It is advisable to carry out and generate high-resolution DEMs with UAVs, whose spatial resolutions are around centimeter precision. On the contrary, when using free access DEMs such as those already mentioned, whose spatial resolutions and precisions are lower compared to the DEMs generated by UAVs, they can present results with less reliability when using hydrological tools. of GIS software, mainly in calculations of expenses or flows.
Runoffs were define through a logical process based on previous knowledge of the study area and the existence of a pumping station in the southeastern part. This station determines the direction of the runoff, which coincided with the location of the pumping station, which led us to establish that the generation of the micro-basins would be determined by the discharge points of the different flows that converge in the vicinity of the pumping station pumps water to the vault of the New River applying Strahler’s method. Small runoffs generated outside the study area were discarded.
The study area of El Vidrio, one of the most prone areas to flooding during rain and extraordinary events, has been the first area in which this work methodology has been applied, obtaining better results than previous studies on this site.
The practical application of this methodology yields significant results for local authorities and decision-makers. It provides crucial insights for urban flood management, urban development planning, infrastructure project designs, and construction methods, thereby preventing physical and socioeconomic vulnerabilities.
This research methodology’s adaptability is more comprehensive than a specific study area. It can be applied anywhere such information is needed, with necessary adjustments based on site-specific conditions. In urban hydrology, the results obtained can significantly influence water management decision-making.
Author Contributions
Walter Avila-Ruiz: Investigation, Writing – Original Draft and Methodology; Carlos Salazar-Briones*: Conceptualization, Methodology, Formal Analysis, Writing – Original Draft, Writing – Review & Editing,; José Mizael Ruiz-Gibert: Methodology, Validation, Investigation, Data Curation, Writing – Review & Editing; Marcelo A. Lomelí-Banda: Software, Writing – Review & Editing; Juan Alejandro Saiz-Rodríguez: Software, Writing – Review & Editing.
Funding
This research received no external funding.
Conflicts of Interest
The authors declare no conflicts of interest.
References
- Miller, J. D. , & Hess, T. Urbanization impacts on storm runoff along a rural-urban gradient. Journal of Hydrology 2017, 552, 474–489. [Google Scholar]
- Roodsari, B. K. , & Chandler, D. G. Distribution of surface imperviousness in small urban catchments predicts runoff peak flows and stream flashiness. Hydrological Processes 2017, 31, 2990–3002. [Google Scholar]
- Sunde, M. G. (2016). An Integrated Modeling Approach for Estimating the Potential Hydrologic Impacts of Urbanization and Climatic Changes in Hinkson Creek Watershed.
- Yao, L. , Wei, W., & Chen, L. How does imperviousness impact the urban rainfall-runoff process under various storm cases? Ecological indicators 2016, 60, 893–905. [Google Scholar]
- Burgos, V. H. , & Salcedo, A. P. Modelos digitales de elevación: Tendencias, correcciones hidrológicas y nuevas fuentes de información. Encuentro de Investigadores en Formación en Recursos Hídricos (2, 2014, Ezeiza, Buenos Aires, Argentina). Disponible en: http://www. ina. gov. ar/ifrh-2014/Eje1/1.11. pdf. Consultado 2014, 1, 2015. [Google Scholar]
- Kuang, W. Mapping global impervious surface area and green space within urban environments. Science China Earth Sciences 2019, 62, 1591–1606. [Google Scholar] [CrossRef]
- Sarkar Chaudhuri, A. , Singh, P., & Rai, S. C. Assessment of impervious surface growth in urban environment through remote sensing estimates. Environmental Earth Sciences 2017, 76, 1–14. [Google Scholar]
- Brun, S. E. , & Band, L. E. Simulating runoff behavior in an urbanizing watershed. Computers, environment and urban systems 2000, 24, 5–22. [Google Scholar]
- Moscrip, A. L. , & Montgomery, D. R. Urbanization, flood frequency, and Salmon abundance in Puget lowland streams 1. JAWRA Journal of the American Water Resources Association 1997, 33, 1289–1297. [Google Scholar]
- Rossi-Espagnet, A. , Goldstein, G. B., & Tabibzadeh, I. Urbanization and health in developing countries: a challenge for health for all. World health statistics quarterly= Rapport trimestriel de statistiques sanitaires mondiales 1991, 44, 186–247. [Google Scholar]
- Haris, H. , Chow, M. F., Usman, F., Sidek, L. M., Roseli, Z. A., & Norlida, M. D. (2016, March). Urban stormwater management model and tools for designing stormwater management of green infrastructure practices. In IOP conference series: earth and environmental science (Vol. 32, No. 1, p. 012022). IOP Publishing.
- Niemczynowicz, J. Urban hydrology and water management–present and future challenges. Urban water 1999, 1, 1–14. [Google Scholar] [CrossRef]
- Price, R. K. , & Vojinovic, Z. Urban flood disaster management. Urban water journal 2008, 5, 259–276. [Google Scholar]
- Schirmer, M. , Luster, J. , Linde, N., Perona, P., Mitchell, E. A. D., Barry, D. A.,... & Durisch-Kaiser, E. River restoration: morphological, hydrological, biogeochemical and ecological changes and challenges. Hydrology and Earth System Sciences Discussions 2013, 10, 10913–10941. [Google Scholar]
- Vannier, O. , Braud, I. , & Anquetin, S. Regional estimation of catchment-scale soil properties by means of streamflow recession analysis for use in distributed hydrological models. Hydrological Processes 2014, 28, 6276–6291. [Google Scholar]
- Fletcher, T. D. , Andrieu, H. , & Hamel, P. Understanding, management and modelling of urban hydrology and its consequences for receiving waters: A state of the art. Advances in water resources 2013, 51, 261–279. [Google Scholar]
- Li, F. , Chen, J. , Liu, Y., Xu, P., Sun, H., Engel, B. A., & Wang, S. Assessment of the impacts of land use/cover change and rainfall change on surface runoff in China. Sustainability 2019, 11, 3535. [Google Scholar]
- Billen, G. , Garnier, J. , & Rousseau, V. Nutrient fluxes and water quality in the drainage network of the Scheldt basin over the last 50 years. Hydrobiologia 2005, 540, 47–67. [Google Scholar]
- Wu, S. , Li, J. , & Huang, G. H. A study on DEM-derived primary topographic attributes for hydrologic applications: Sensitivity to elevation data resolution. Applied Geography 2008, 28, 210–223. [Google Scholar]
- Westoby, M. J. , Brasington, J. , Glasser, N. F., Hambrey, M. J., & Reynolds, J. M. ‘Structure-from-Motion’photogrammetry: A low-cost, effective tool for geoscience applications. Geomorphology 2012, 179, 300–314. [Google Scholar]
- Díaz Gómez, A. R. , & Gaspari, F. J. (2017). Modelización geoespacial del escurrimiento superficial en cuencas de las sierras del sudoeste, Tucumán, Argentina.
- Instituto Nacional de Estadística y Geografía (INEGI) (2020) Relieve continental. Available at: https://www.inegi.org.mx/temas/relieve/continental/(Accessed: 12 September 2024).
- Mark, O. , Weesakul, S., Apirumanekul, C., Aroonnet, S. B., & Djordjević, S. (2004). Potential and limitations of 1D modelling of urban flooding. In Journal of Hydrology (Vol. 299, Issues 3–4).
- Pérez, A. M. M. , & Cohen, I. S. IMPACTO DE LA RESOLUCIÓN DEL MDE EN LA MODELACIÓN DE PROCESOS HIDROLÓGICOS.
- Fleischmann, A. , Paiva, R., & Collischonn, W. Can regional to continental river hydrodynamic models be locally relevant? A cross-scale comparison. Journal of Hydrology X 2019, 3, 100027. [Google Scholar]
- Vergara, Ó. W. , & Duarte, H. Generación de modelos digitales mediante fotogrametría, utilizando vehículos aéreos no tripulados (UAV’s). Revista Tecnología y Productividad 2017, 3, 63–69. [Google Scholar]
- Quispe, O. C. Analisis de GSD para la generacion de cartografia utilizando la tecnologia drone, huaca de la Universidad Nacional Mayor de San Marcos. Revista del Instituto de Investigación de la Facultad de Minas, Metalurgia y Ciencias geográficas 2015, 18, 21–27. [Google Scholar]
- Acharya, B. S., Bhandari, M., Bandini, F., Pizarro, A., Perks, M., Joshi, D. R., ... & Sharma, S. Unmanned aerial vehicles in hydrology and water management: Applications, challenges, and perspectives. Water Resources Research 2021, 57, e2021WR029925. DEM-Based Urban and Rural Inundation Scenarios from Point-Source Flood Volumes. Sustainability, 16, 875.
- Kyaw, K. K., Bonaiuti, F., Wang, H., Bagli, S., Mazzoli, P., Alberoni, P. P., ... & Castellarin, A. (2024). Fast-Processing.
- Hanafi, F., & Iryanthony, S. (2019, December). Drone Application for Micro Basin and Flow Identification on Hilly Area, UNNES, Central Java. In Proceedings of the 1st International Conference on Environment and Sustainability Issues, ICESI 2019, 18-19 July 2019, Semarang, Central Java, Indonesia.
- Instituto Nacional de Estadística y Geografía (INEGI) (2014) Norma Técnica para la Generación de Modelos Digitales de Elevación con fines geográficos. Available at: https://www.inegi.org.mx/contenidos/temas/mapas/normas/norma_mde_inegi_dof2dic2014.pdf Accessed: (20 September 2024).
- Comisión Nacional del Agua. (s/f). Biblioteca Digital de MAPAS. gob.mx. Recuperado el 21 de septiembre de 2024, de https://www.gob.mx/conagua/documentos/biblioteca-digital-de-mapas.
- Gobierno de Mexicali (2011) Atlas de riesgos del municipio de Mexicali, B.C. Available at: https://www.mexicali.gob.mx/transparencia/administracion/atlas/pdf/0.pdf/(Accessed: 19 September 2024).
- Sri Harto, Synthetic Unit Hydrograph of GAMMA I. 1985.
- Huang, S. L. , Budd, W. W., Chan, S. L., & Lin, Y. C. Stream order, hierarchy, and energy convergence of land use. Ecological Modelling 2007, 205, 255–264. [Google Scholar]
- Alamri, N. , Afolabi, K., Ewea, H., & Elfeki, A. Evaluation of the time of concentration models for enhanced peak flood estimation in arid regions. Sustainability 2023, 15, 1987. [Google Scholar]
- Gravelius, H. (1914). Morphometry of Drainage Bassins. Quaternary International, v. Goschen Ve.
- Horton, R. E. Erosional development of streams and their drainage basins; hydrophysical approach to quantitative morphology. Geological society of America bulletin 1945, 56, 275–370. [Google Scholar] [CrossRef]
- Marinao, M. A. (2023). Estudio hidrológico e hidráulico para el diseño de un puente sobre Arroyo Nahuel Niyeu (Bachelor’s thesis, Universidad Nacional del Comahue. Facultad de Ingeniería.).
Figure 1.
Methodological procedure for the generation of micro-basins and calculation of parameters.
Figure 1.
Methodological procedure for the generation of micro-basins and calculation of parameters.
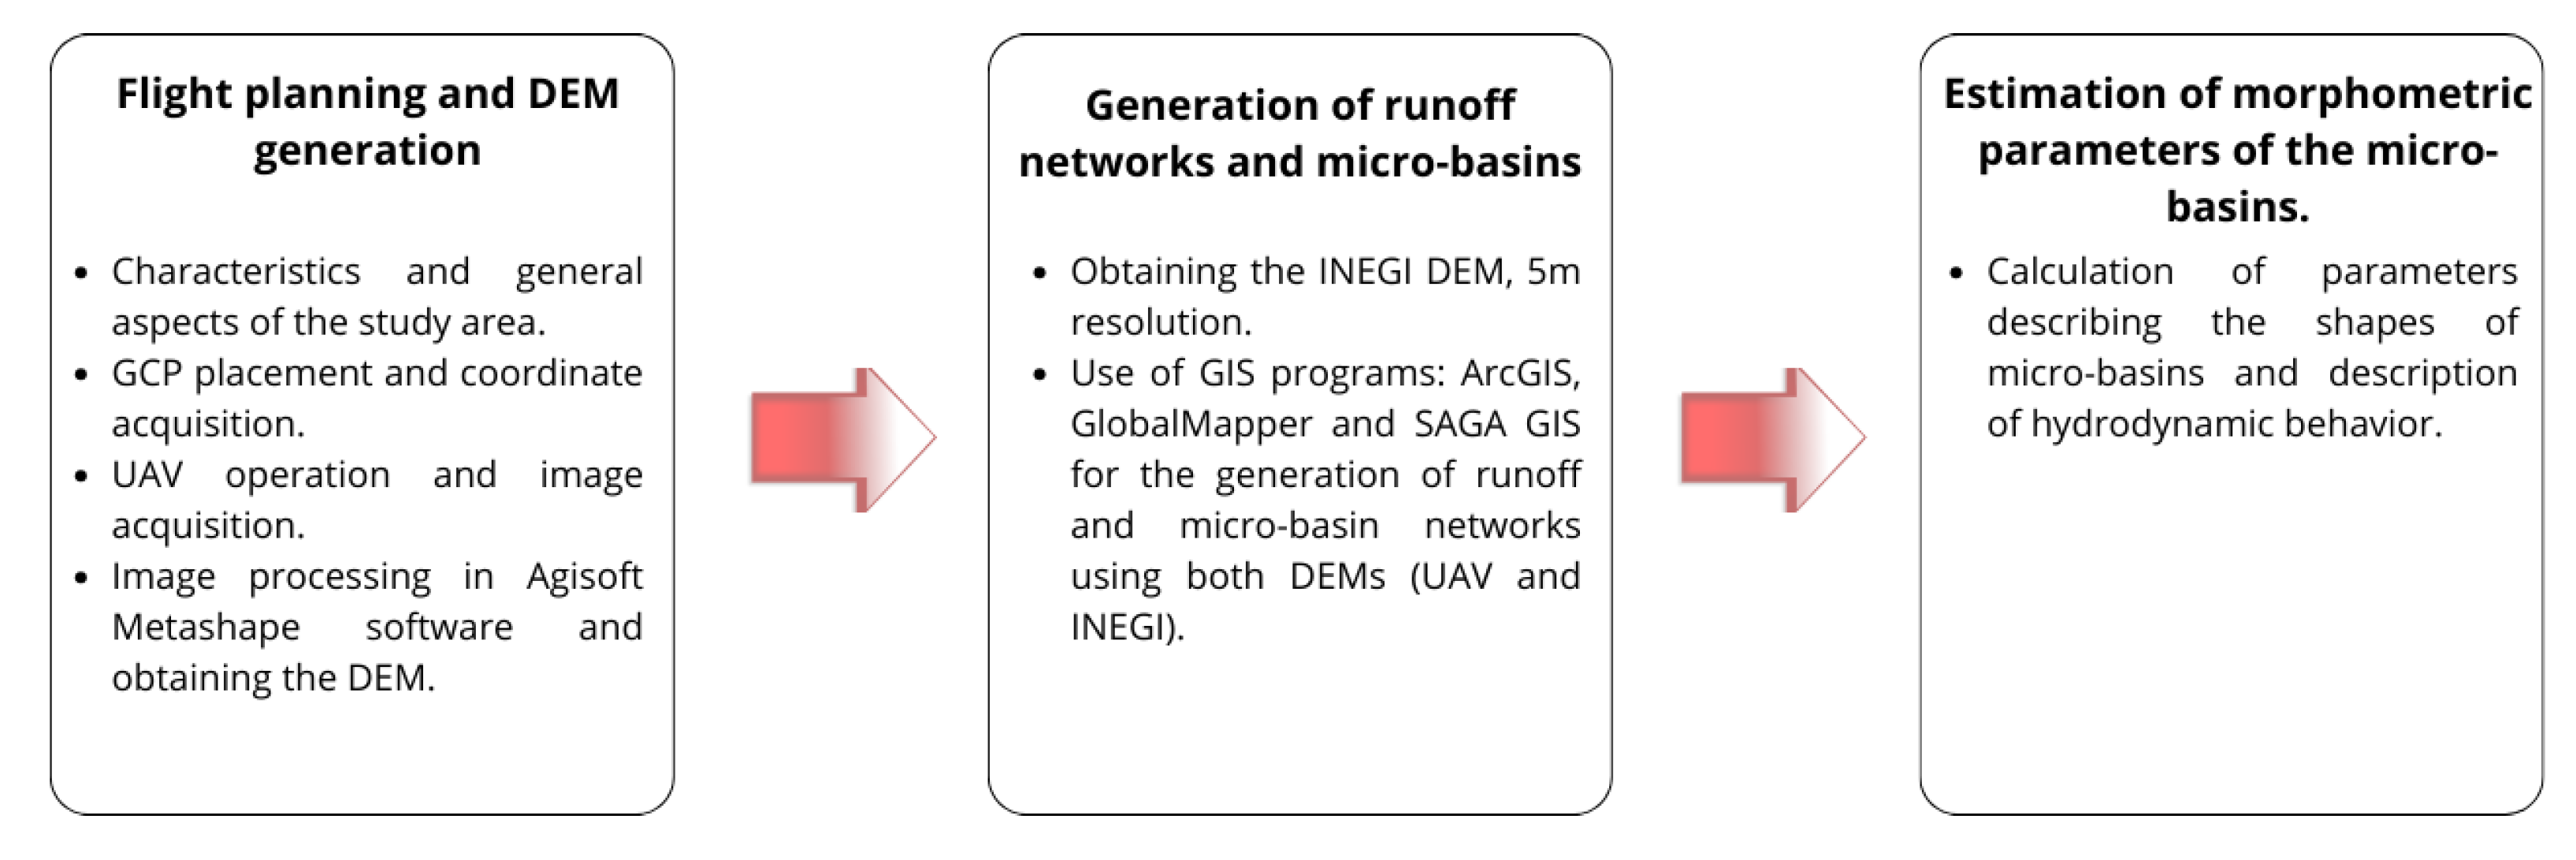
Figure 3.
Diagram of runoffs generation and micro-basins in the ArcGIS software.
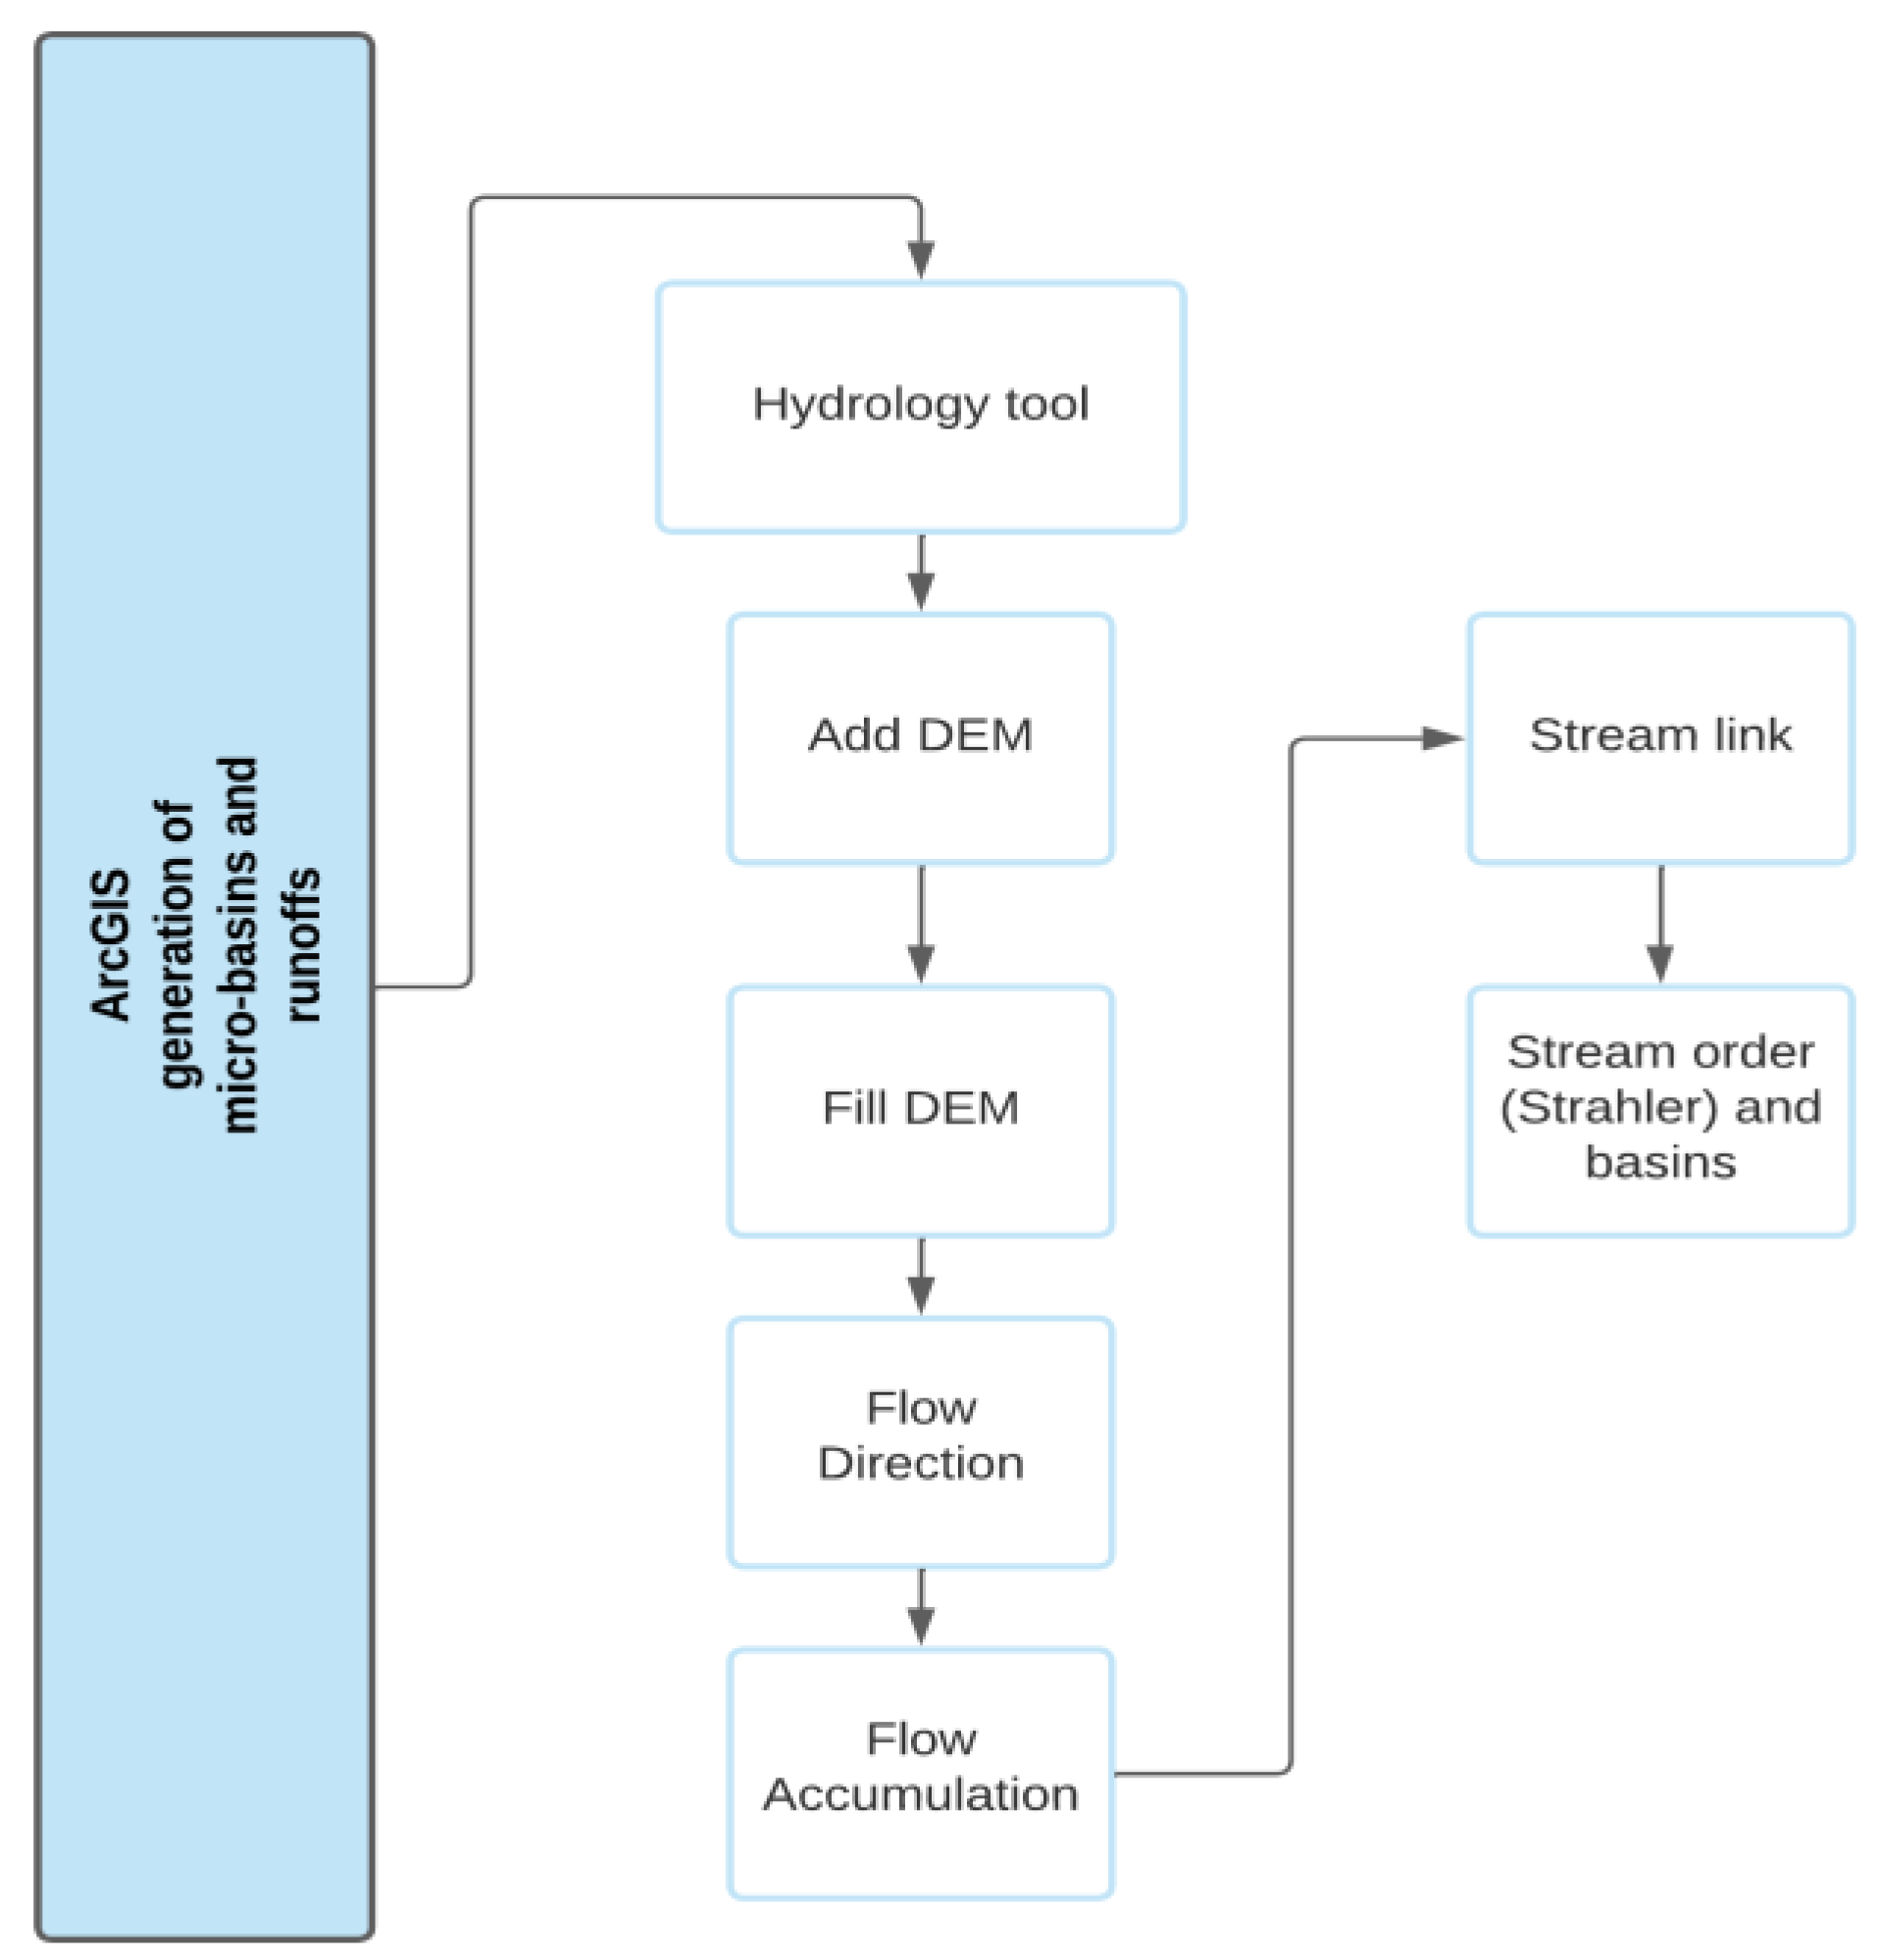
Figure 4.
Diagram of runoffs generation and micro-basins in the GlobalMapper software.
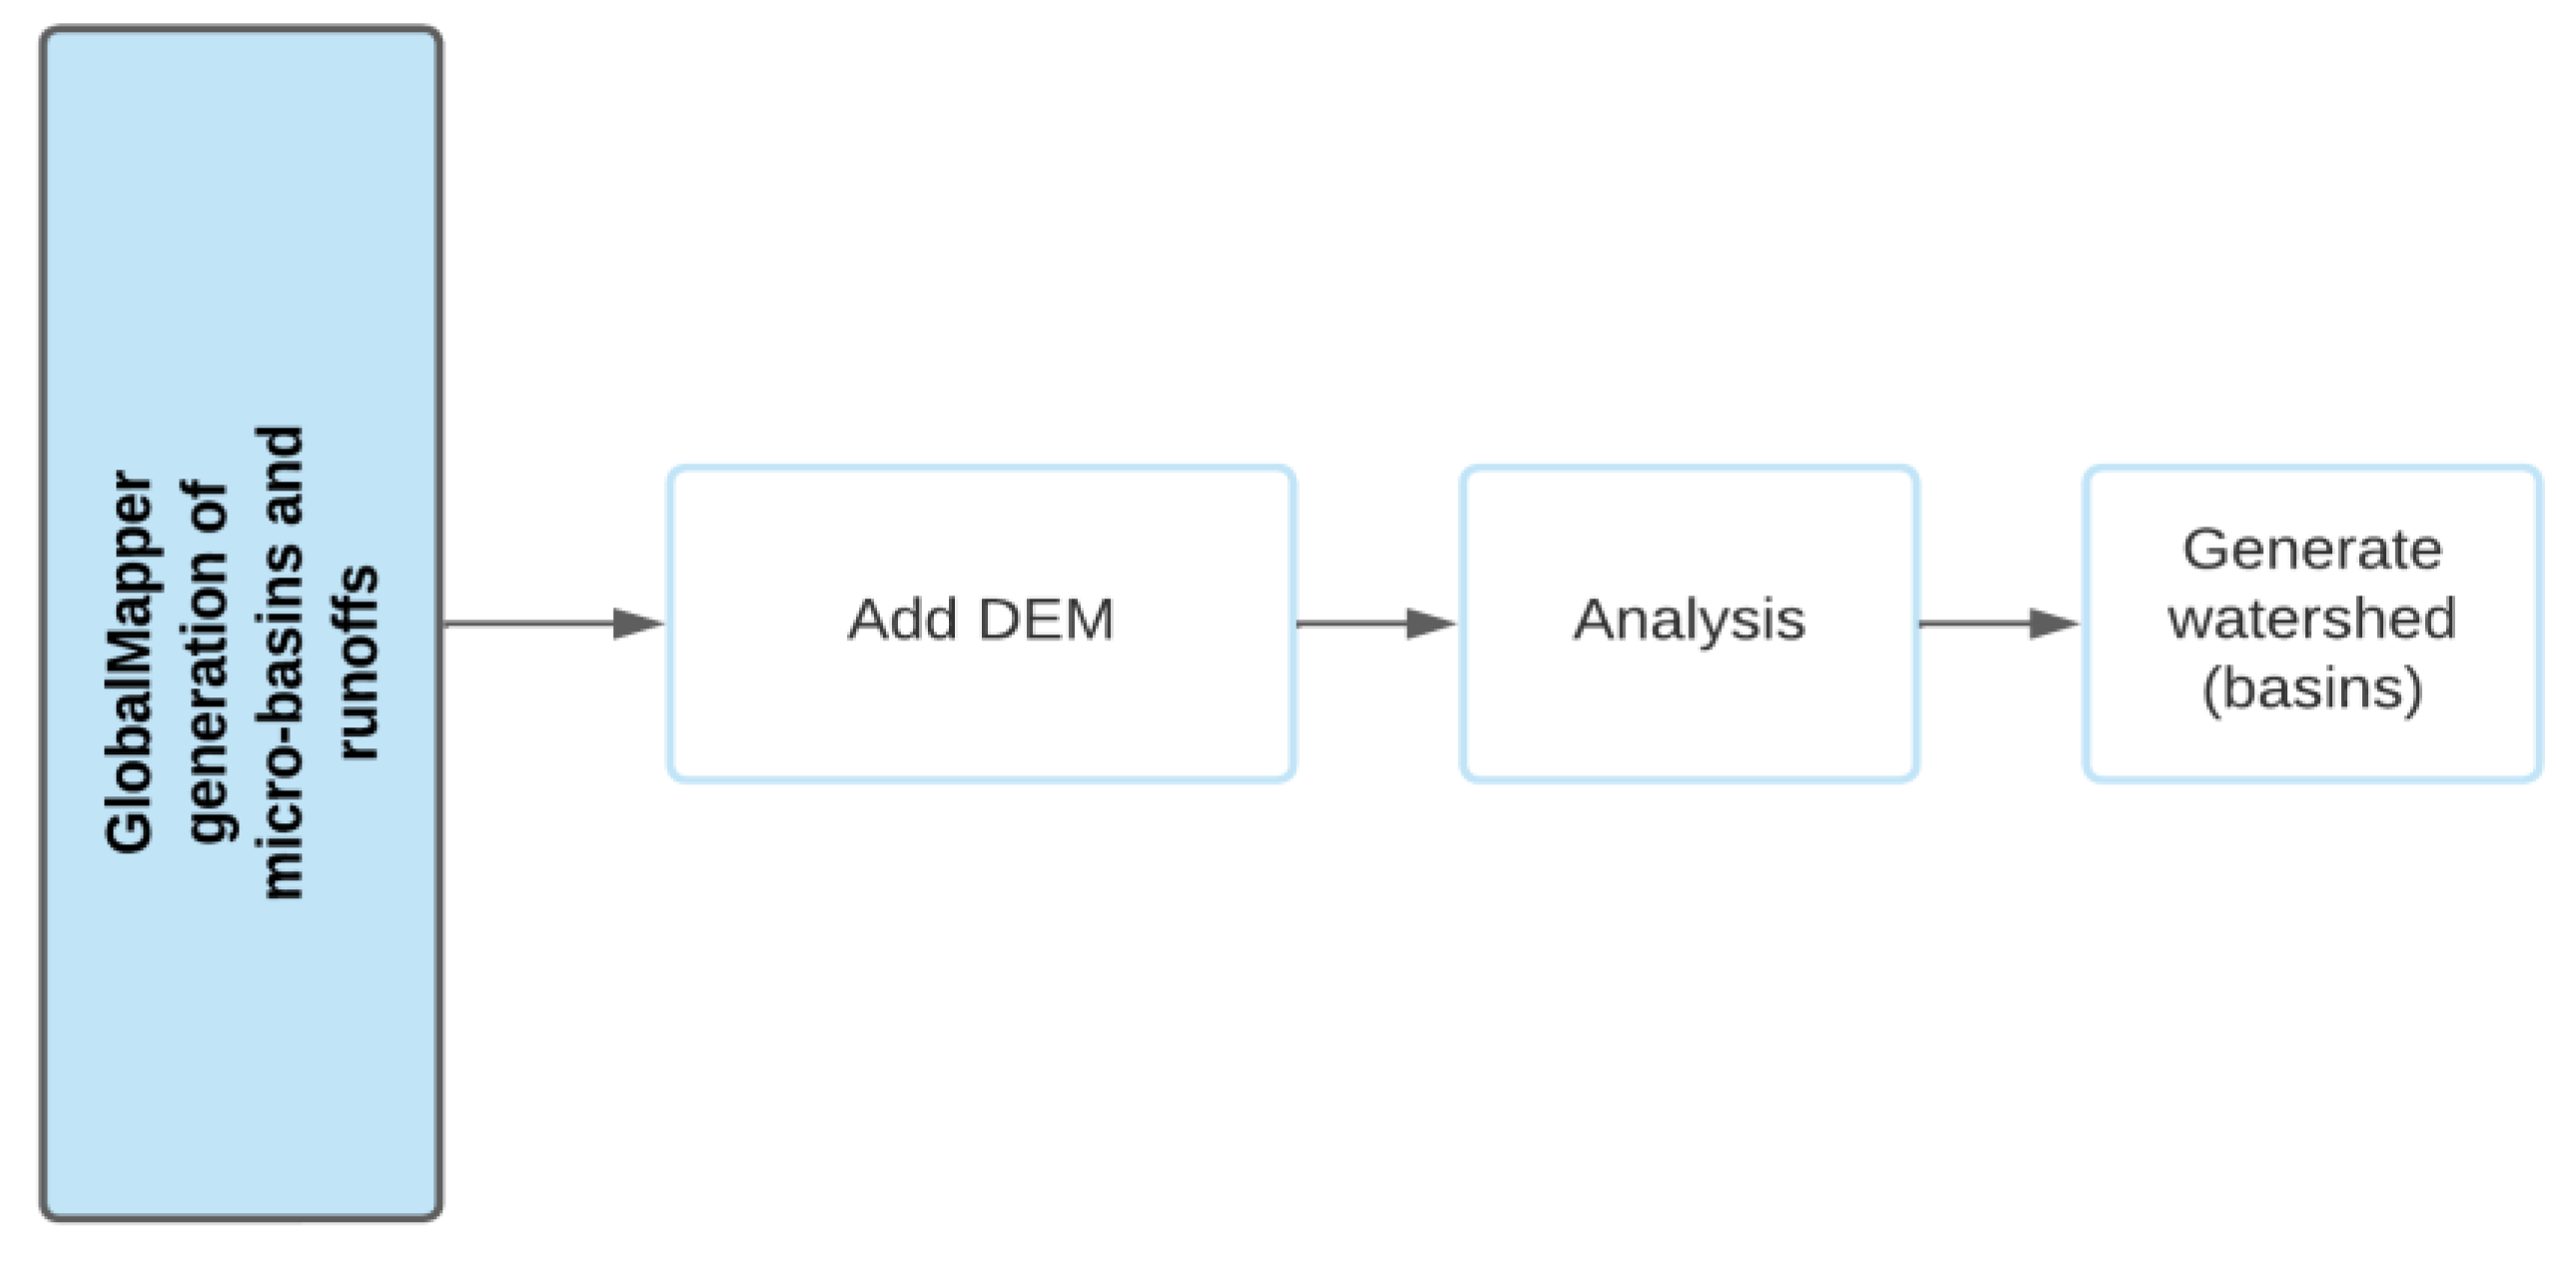
Figure 5.
Diagram of runoffs generation and micro-basins in the SAGA GIS software.
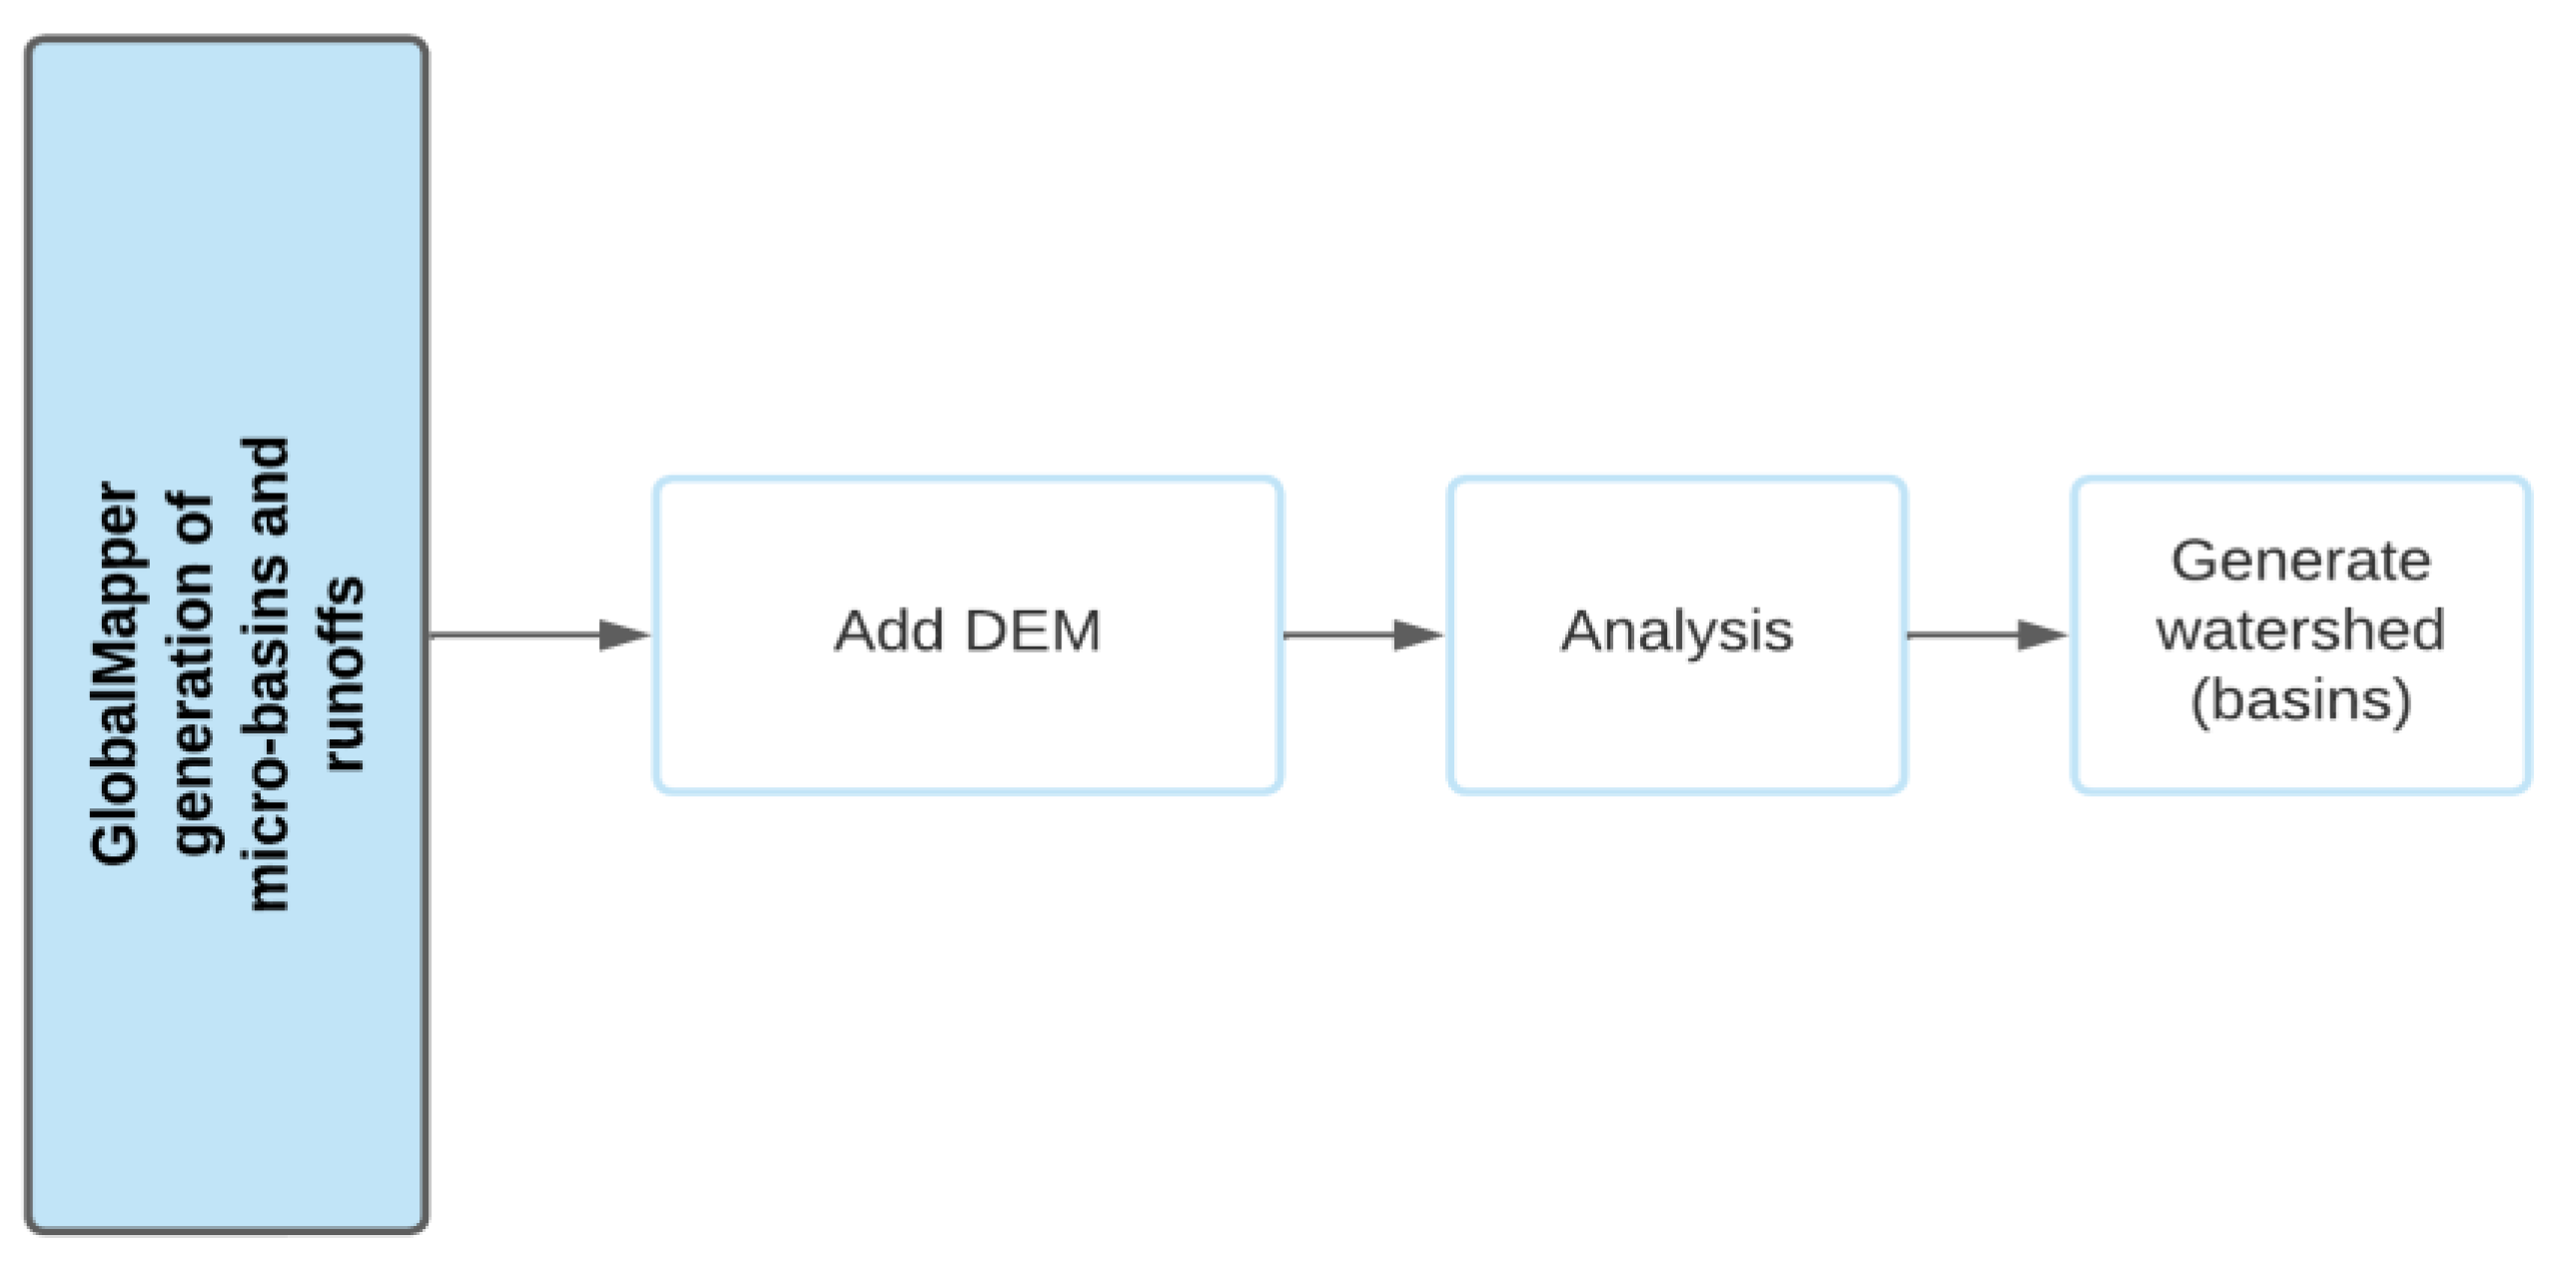
Figure 6.
DEM generated by UAV, plan view.
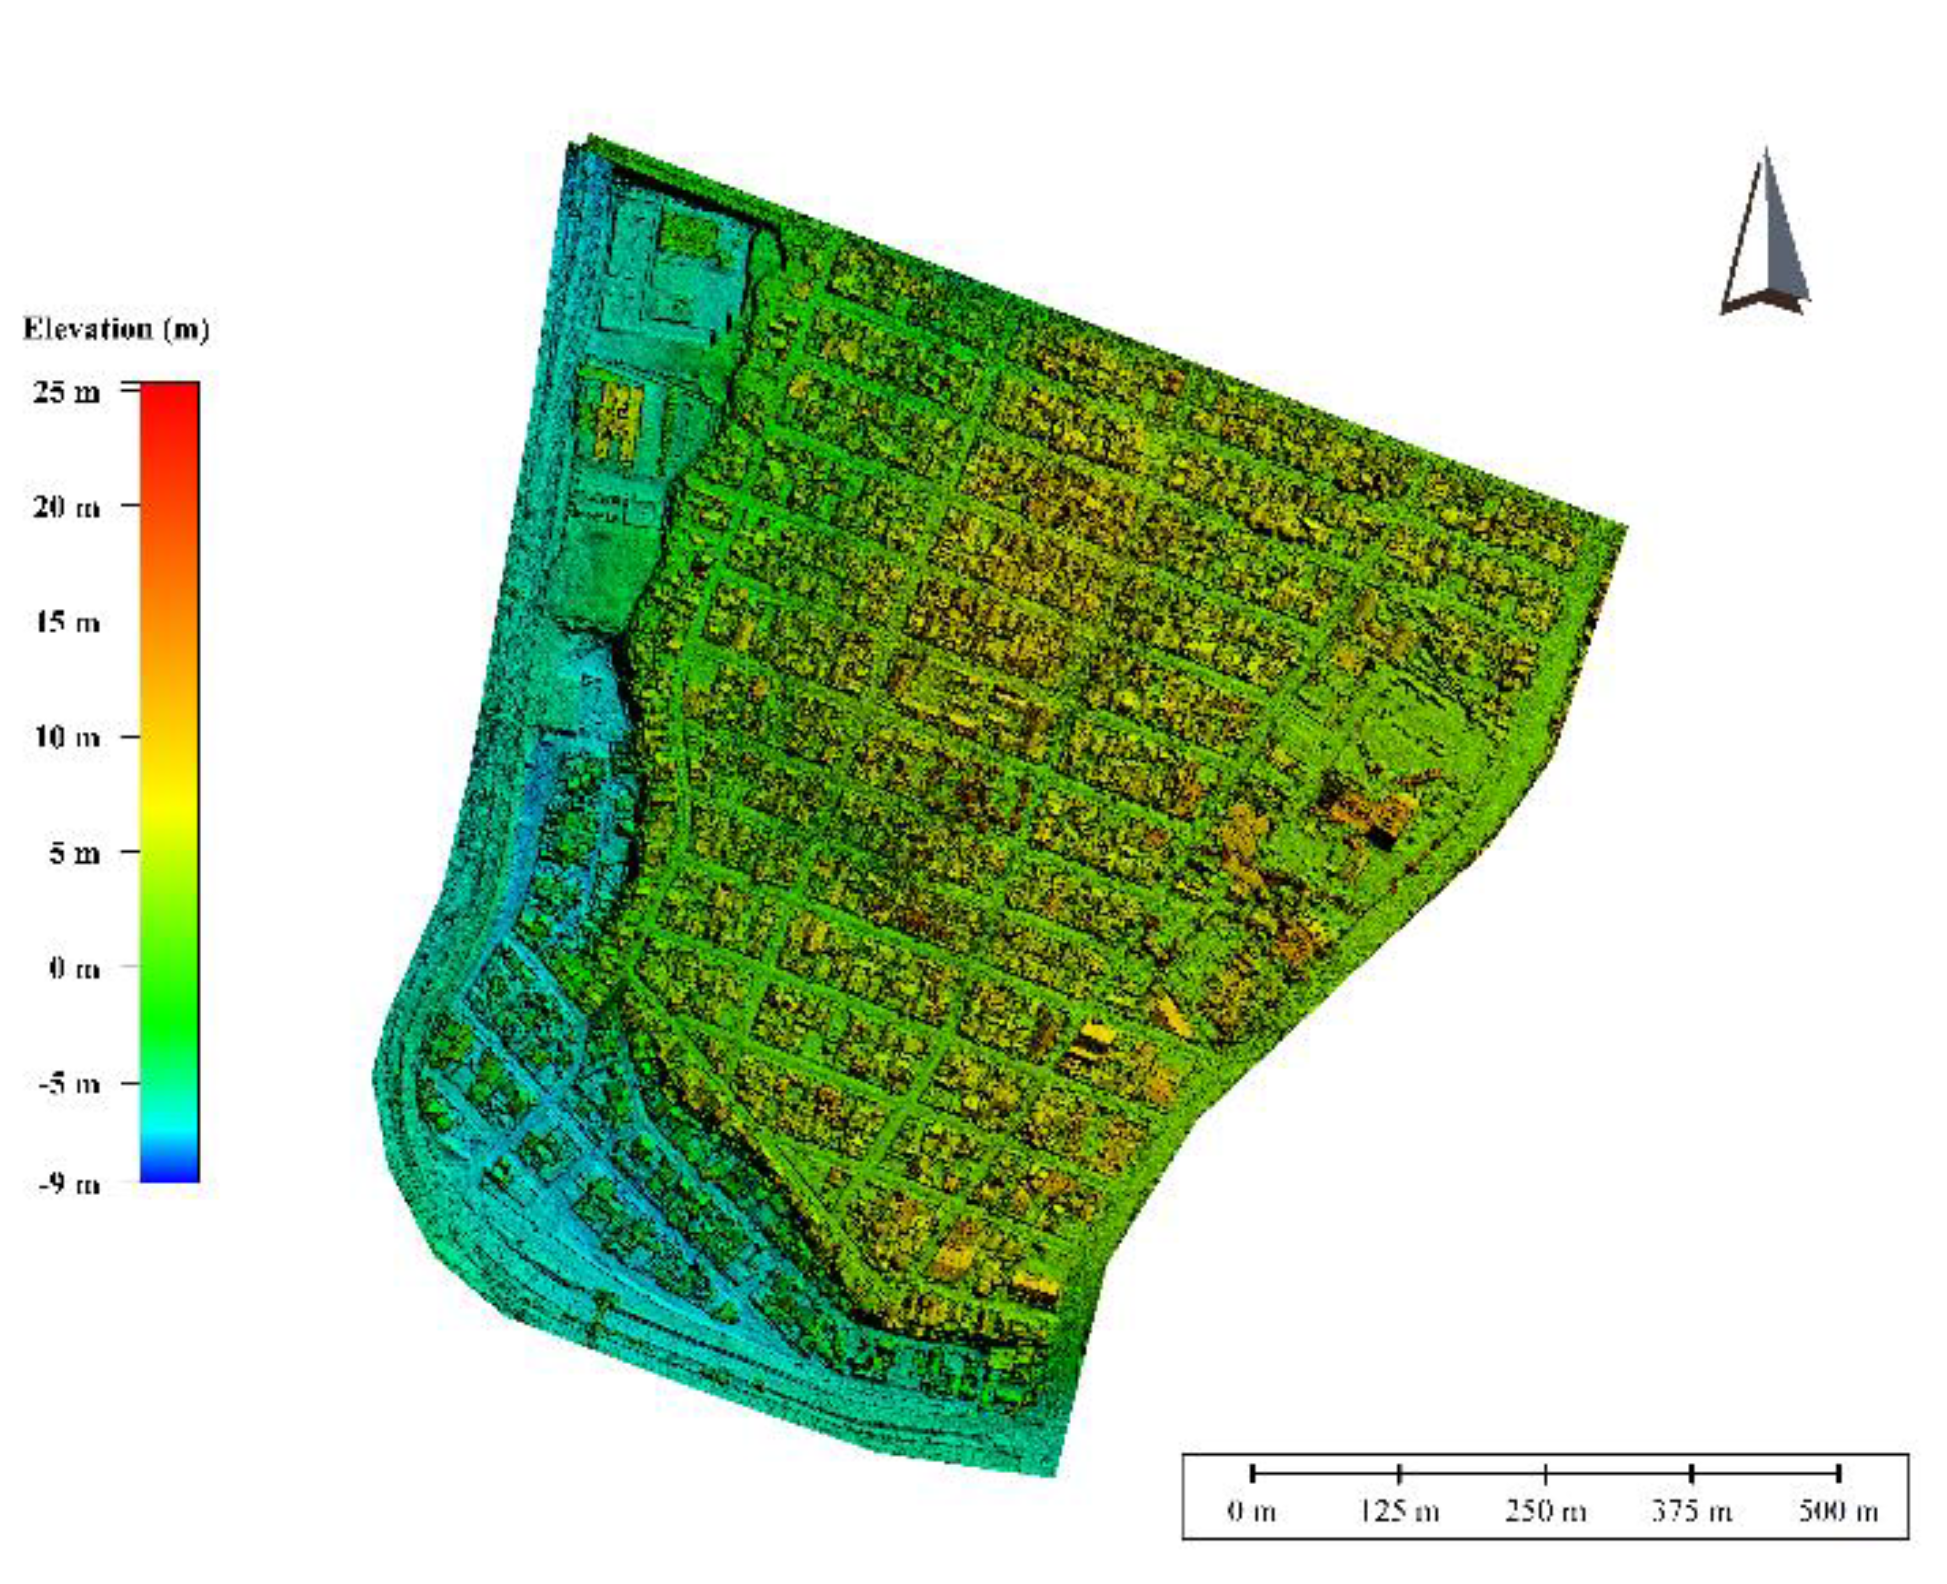
Figure 7.
INEGI DEM, resolution 5m.

Figure 8.
UAV DEM, resolution 0.13m.
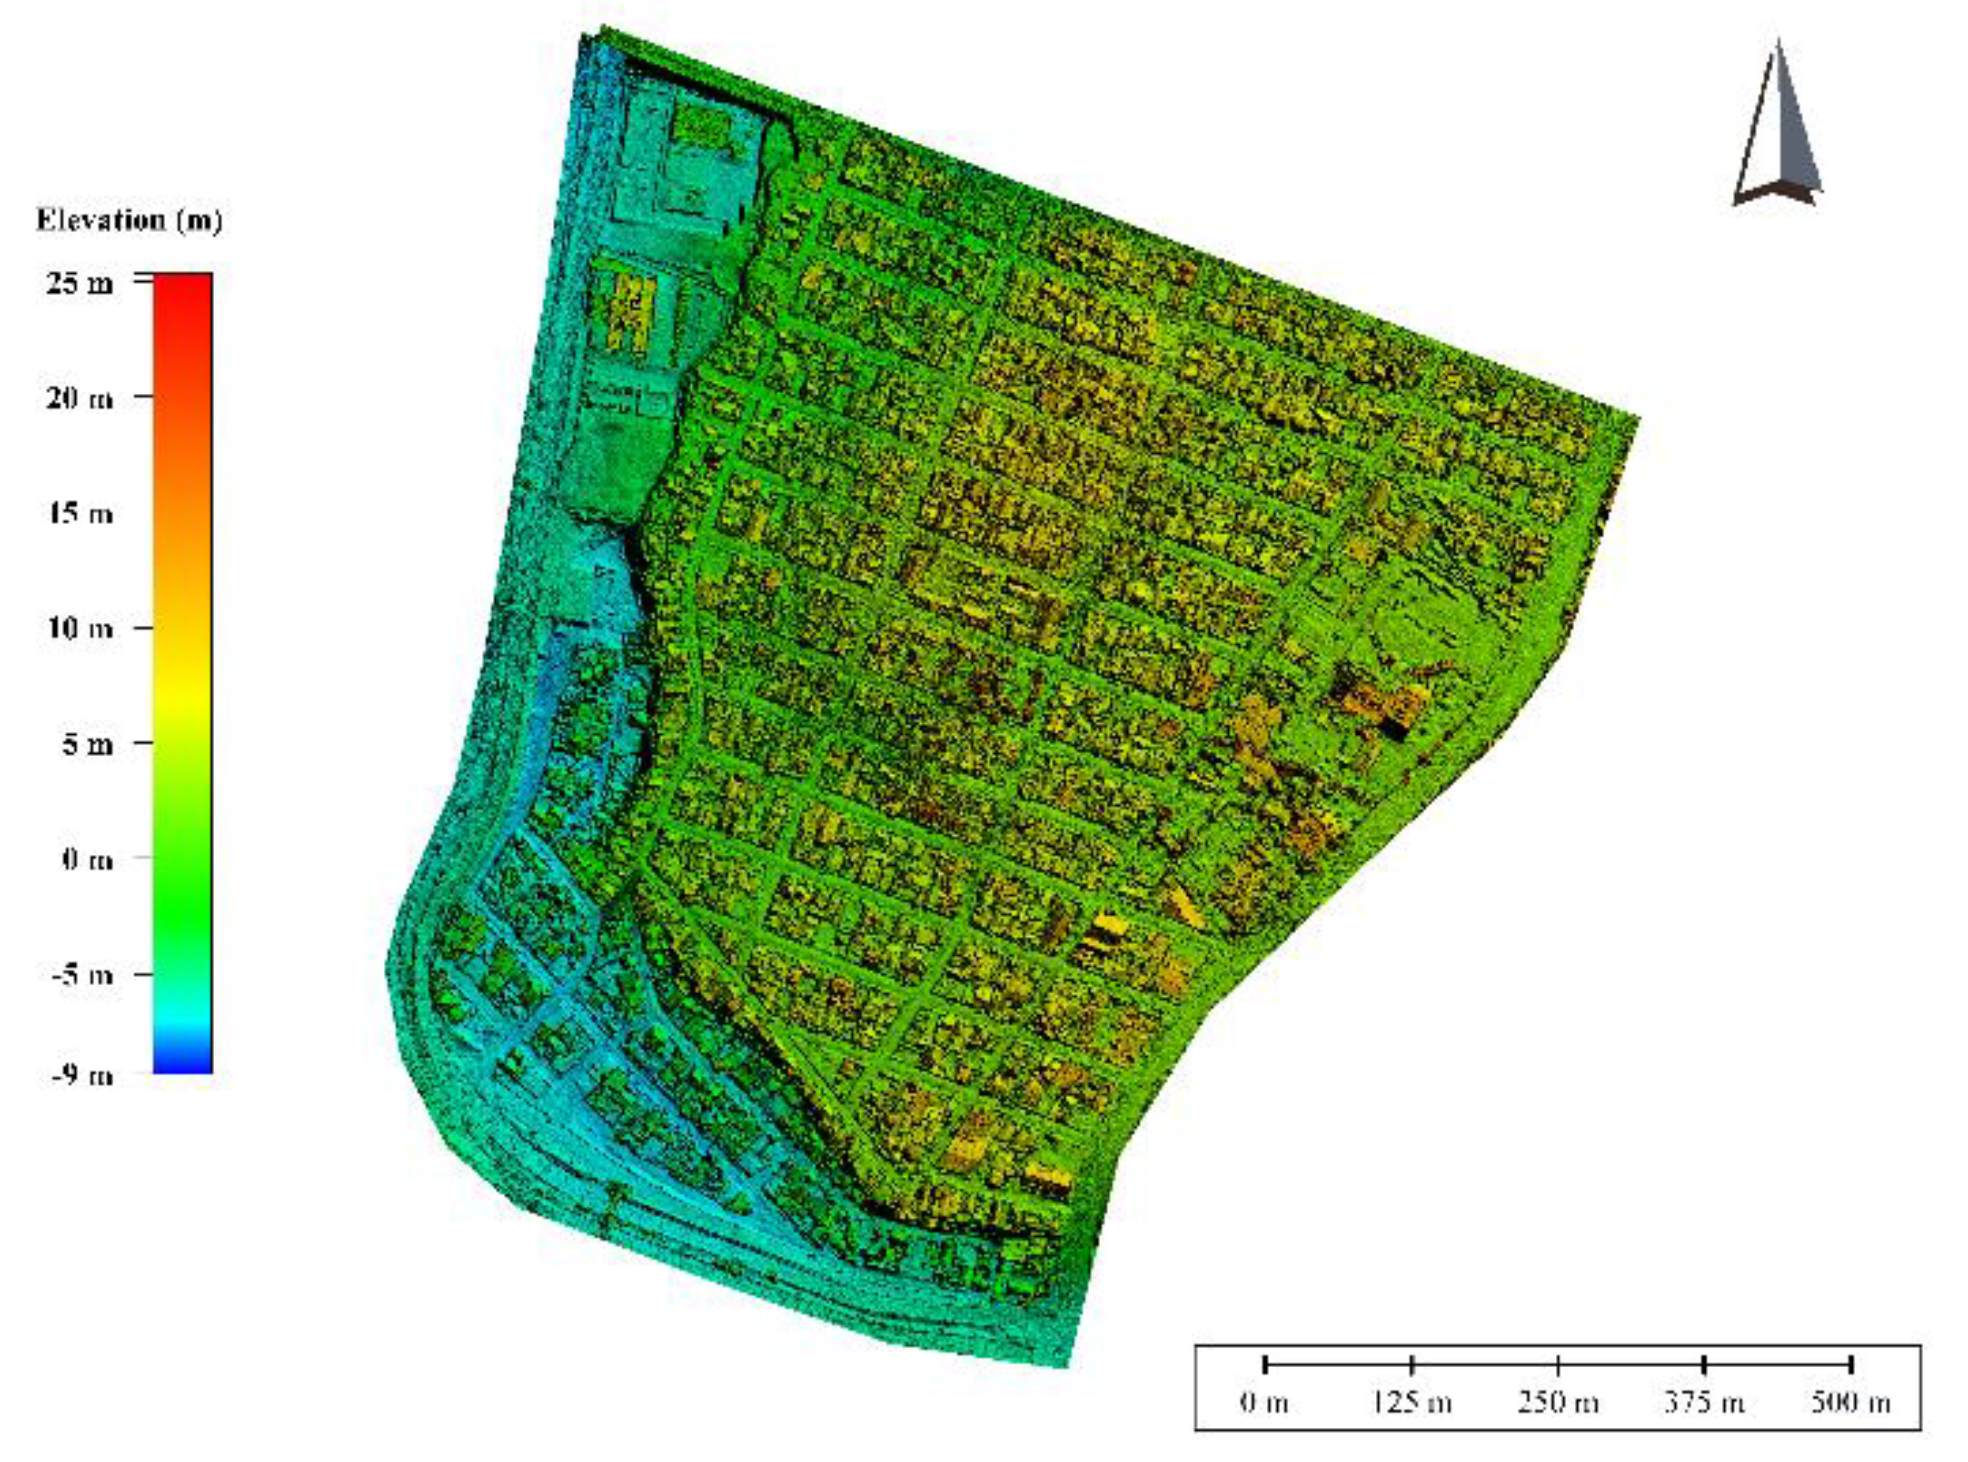
Figure 9.
Runoffs and micro-basins generated by the UAV DEM and ArcGIS software.
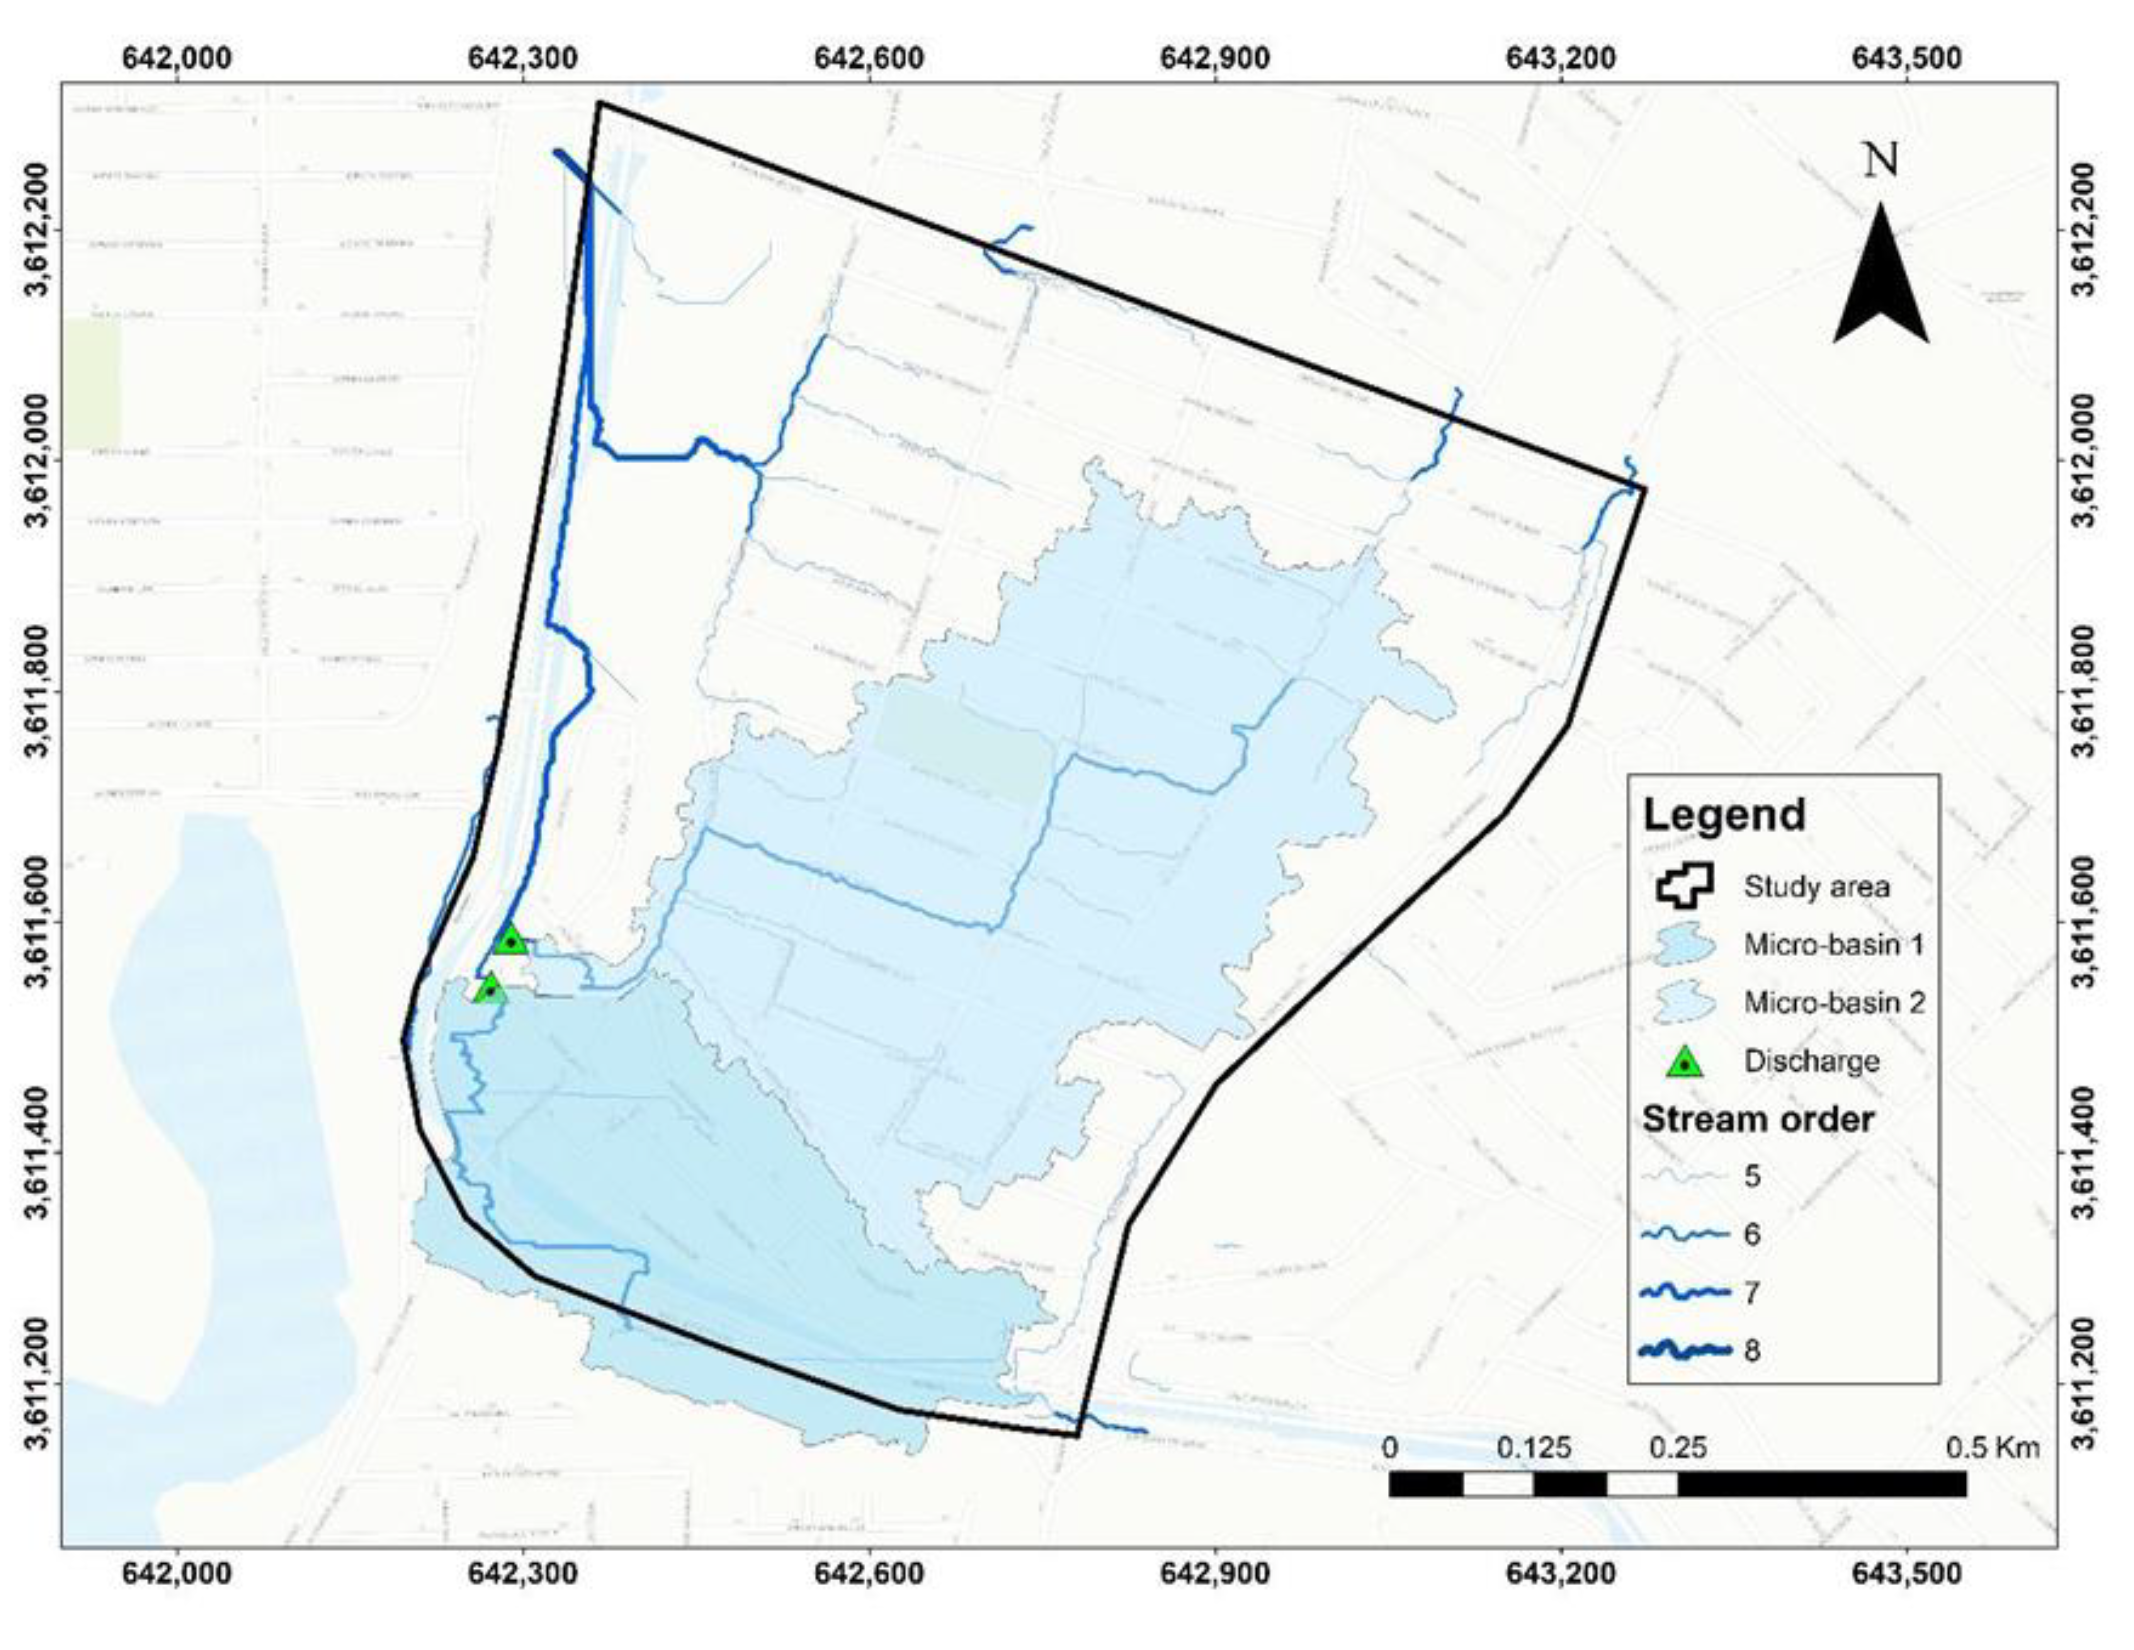
Figure 10.
Runoffs and micro-basins generated by INEGI DEM and ArcGIS software.
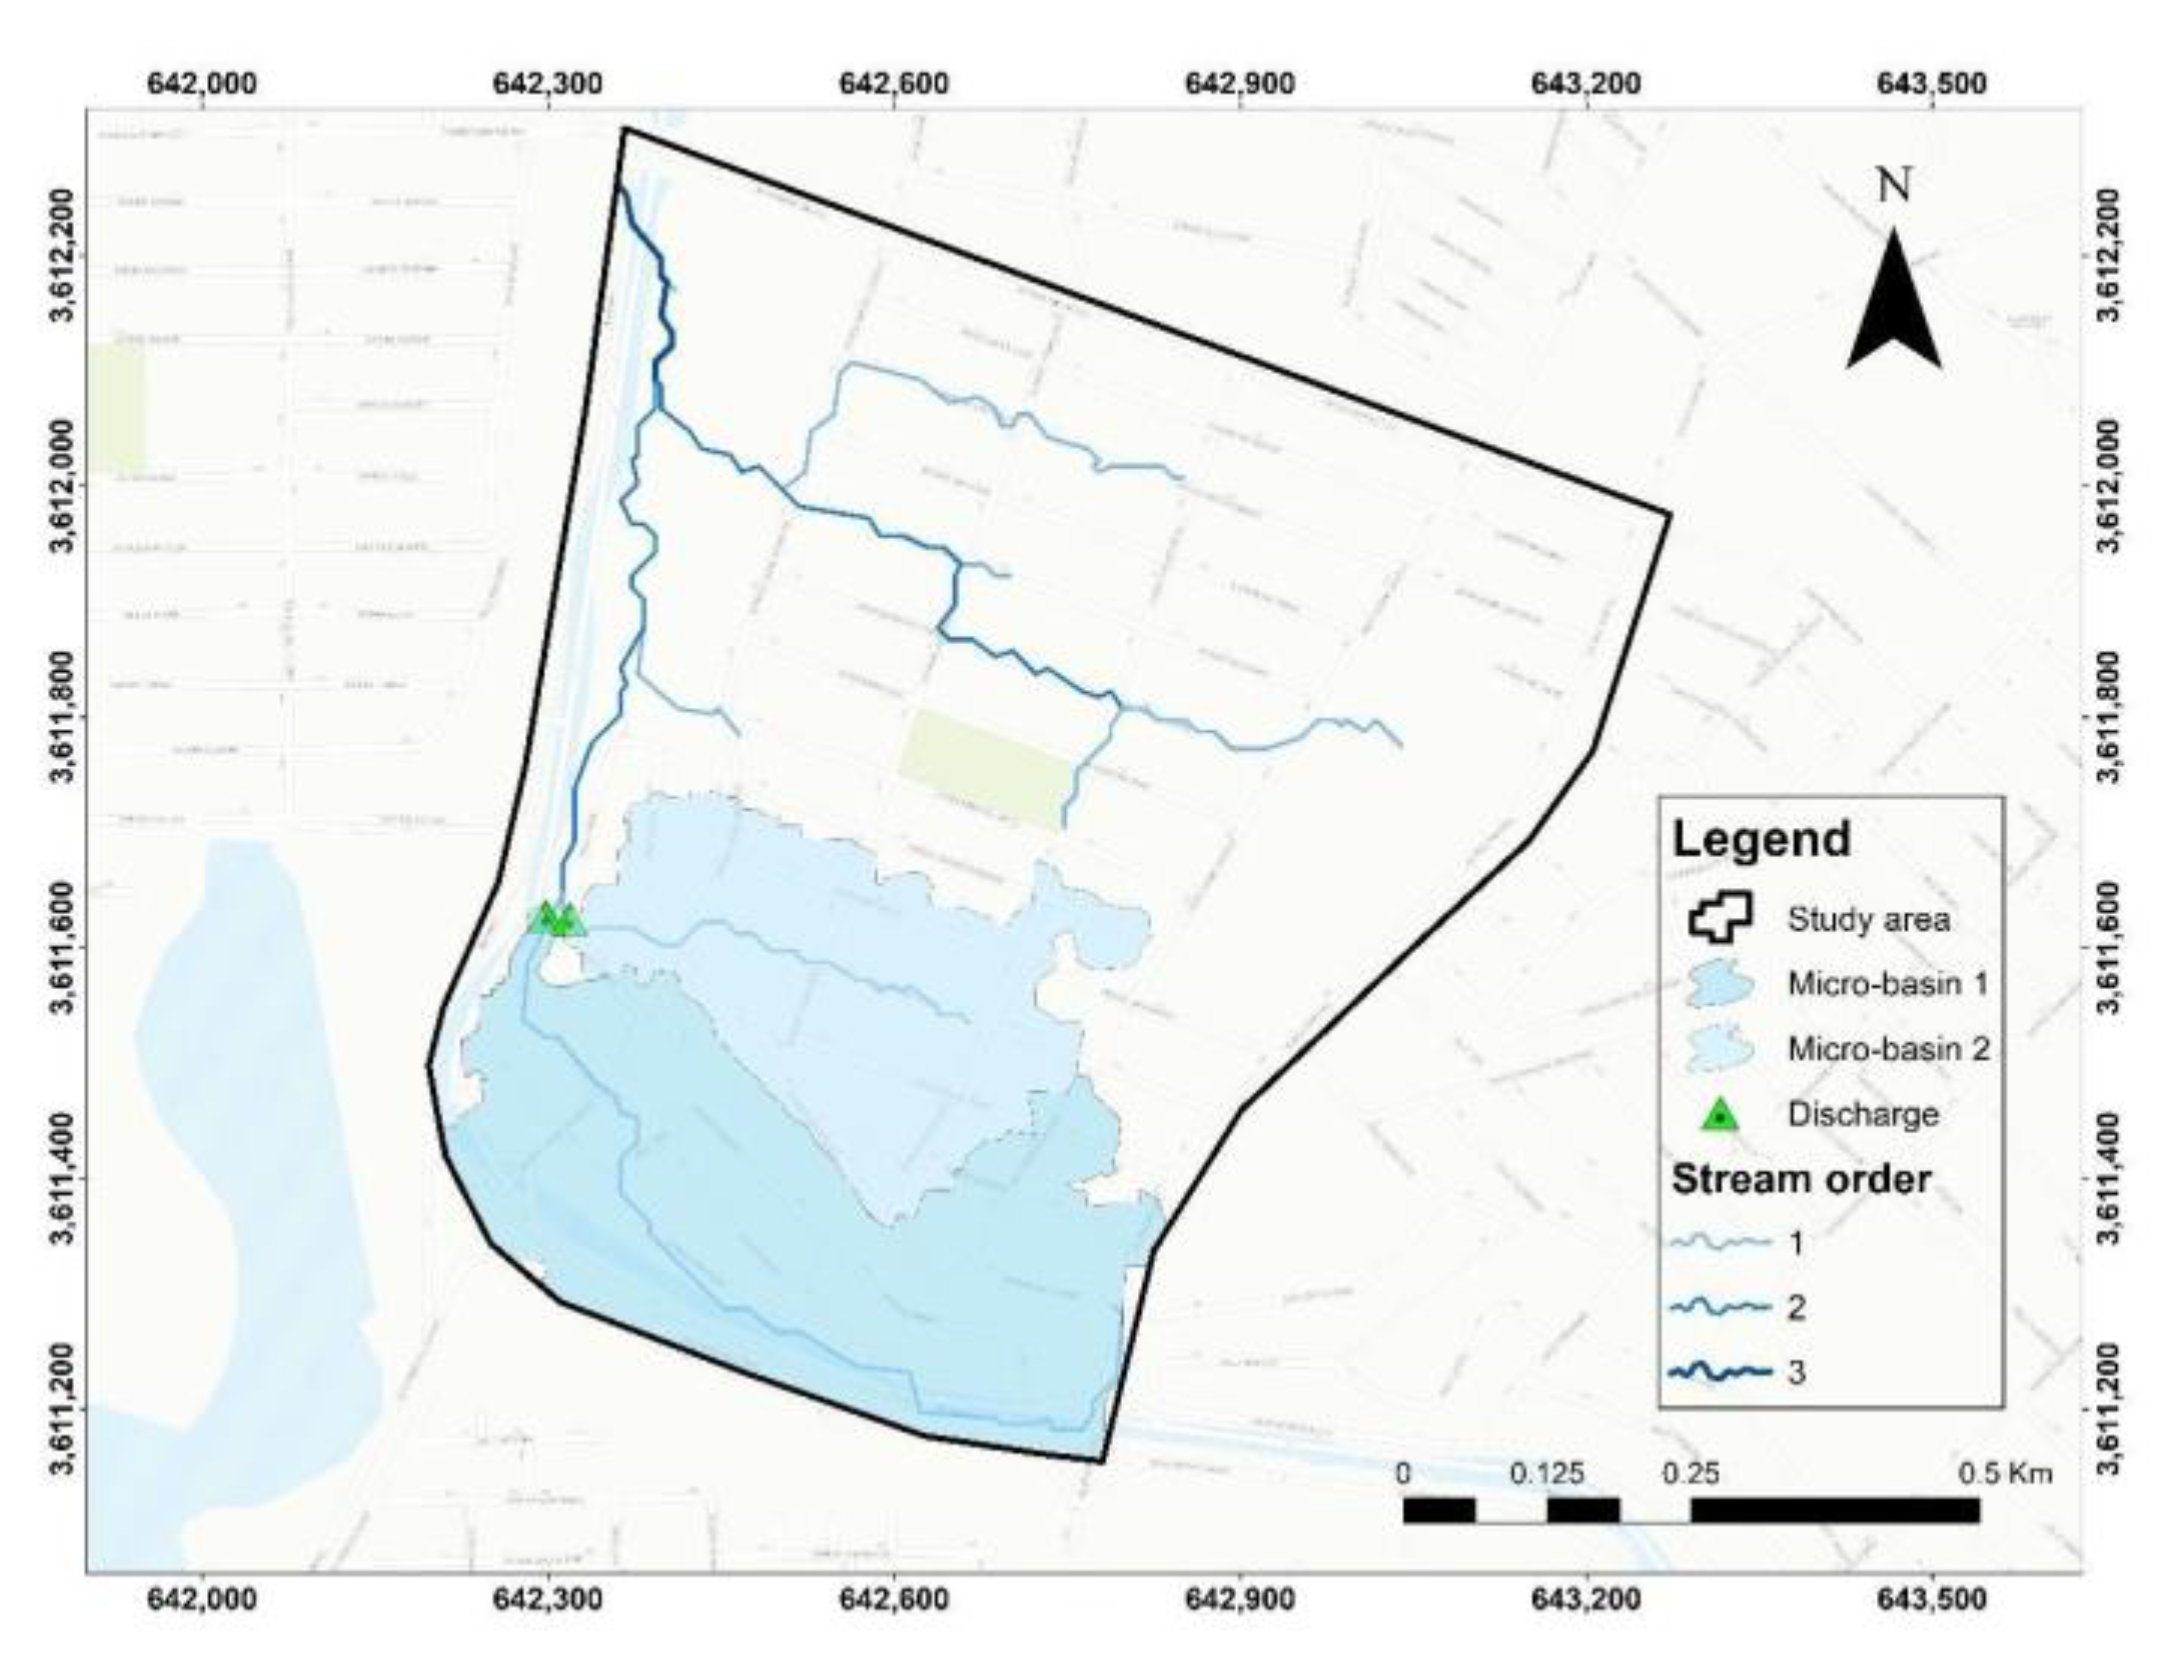
Figure 11.
Runoffs and micro-basin generated by UAV DEM and GlobalMapper software.
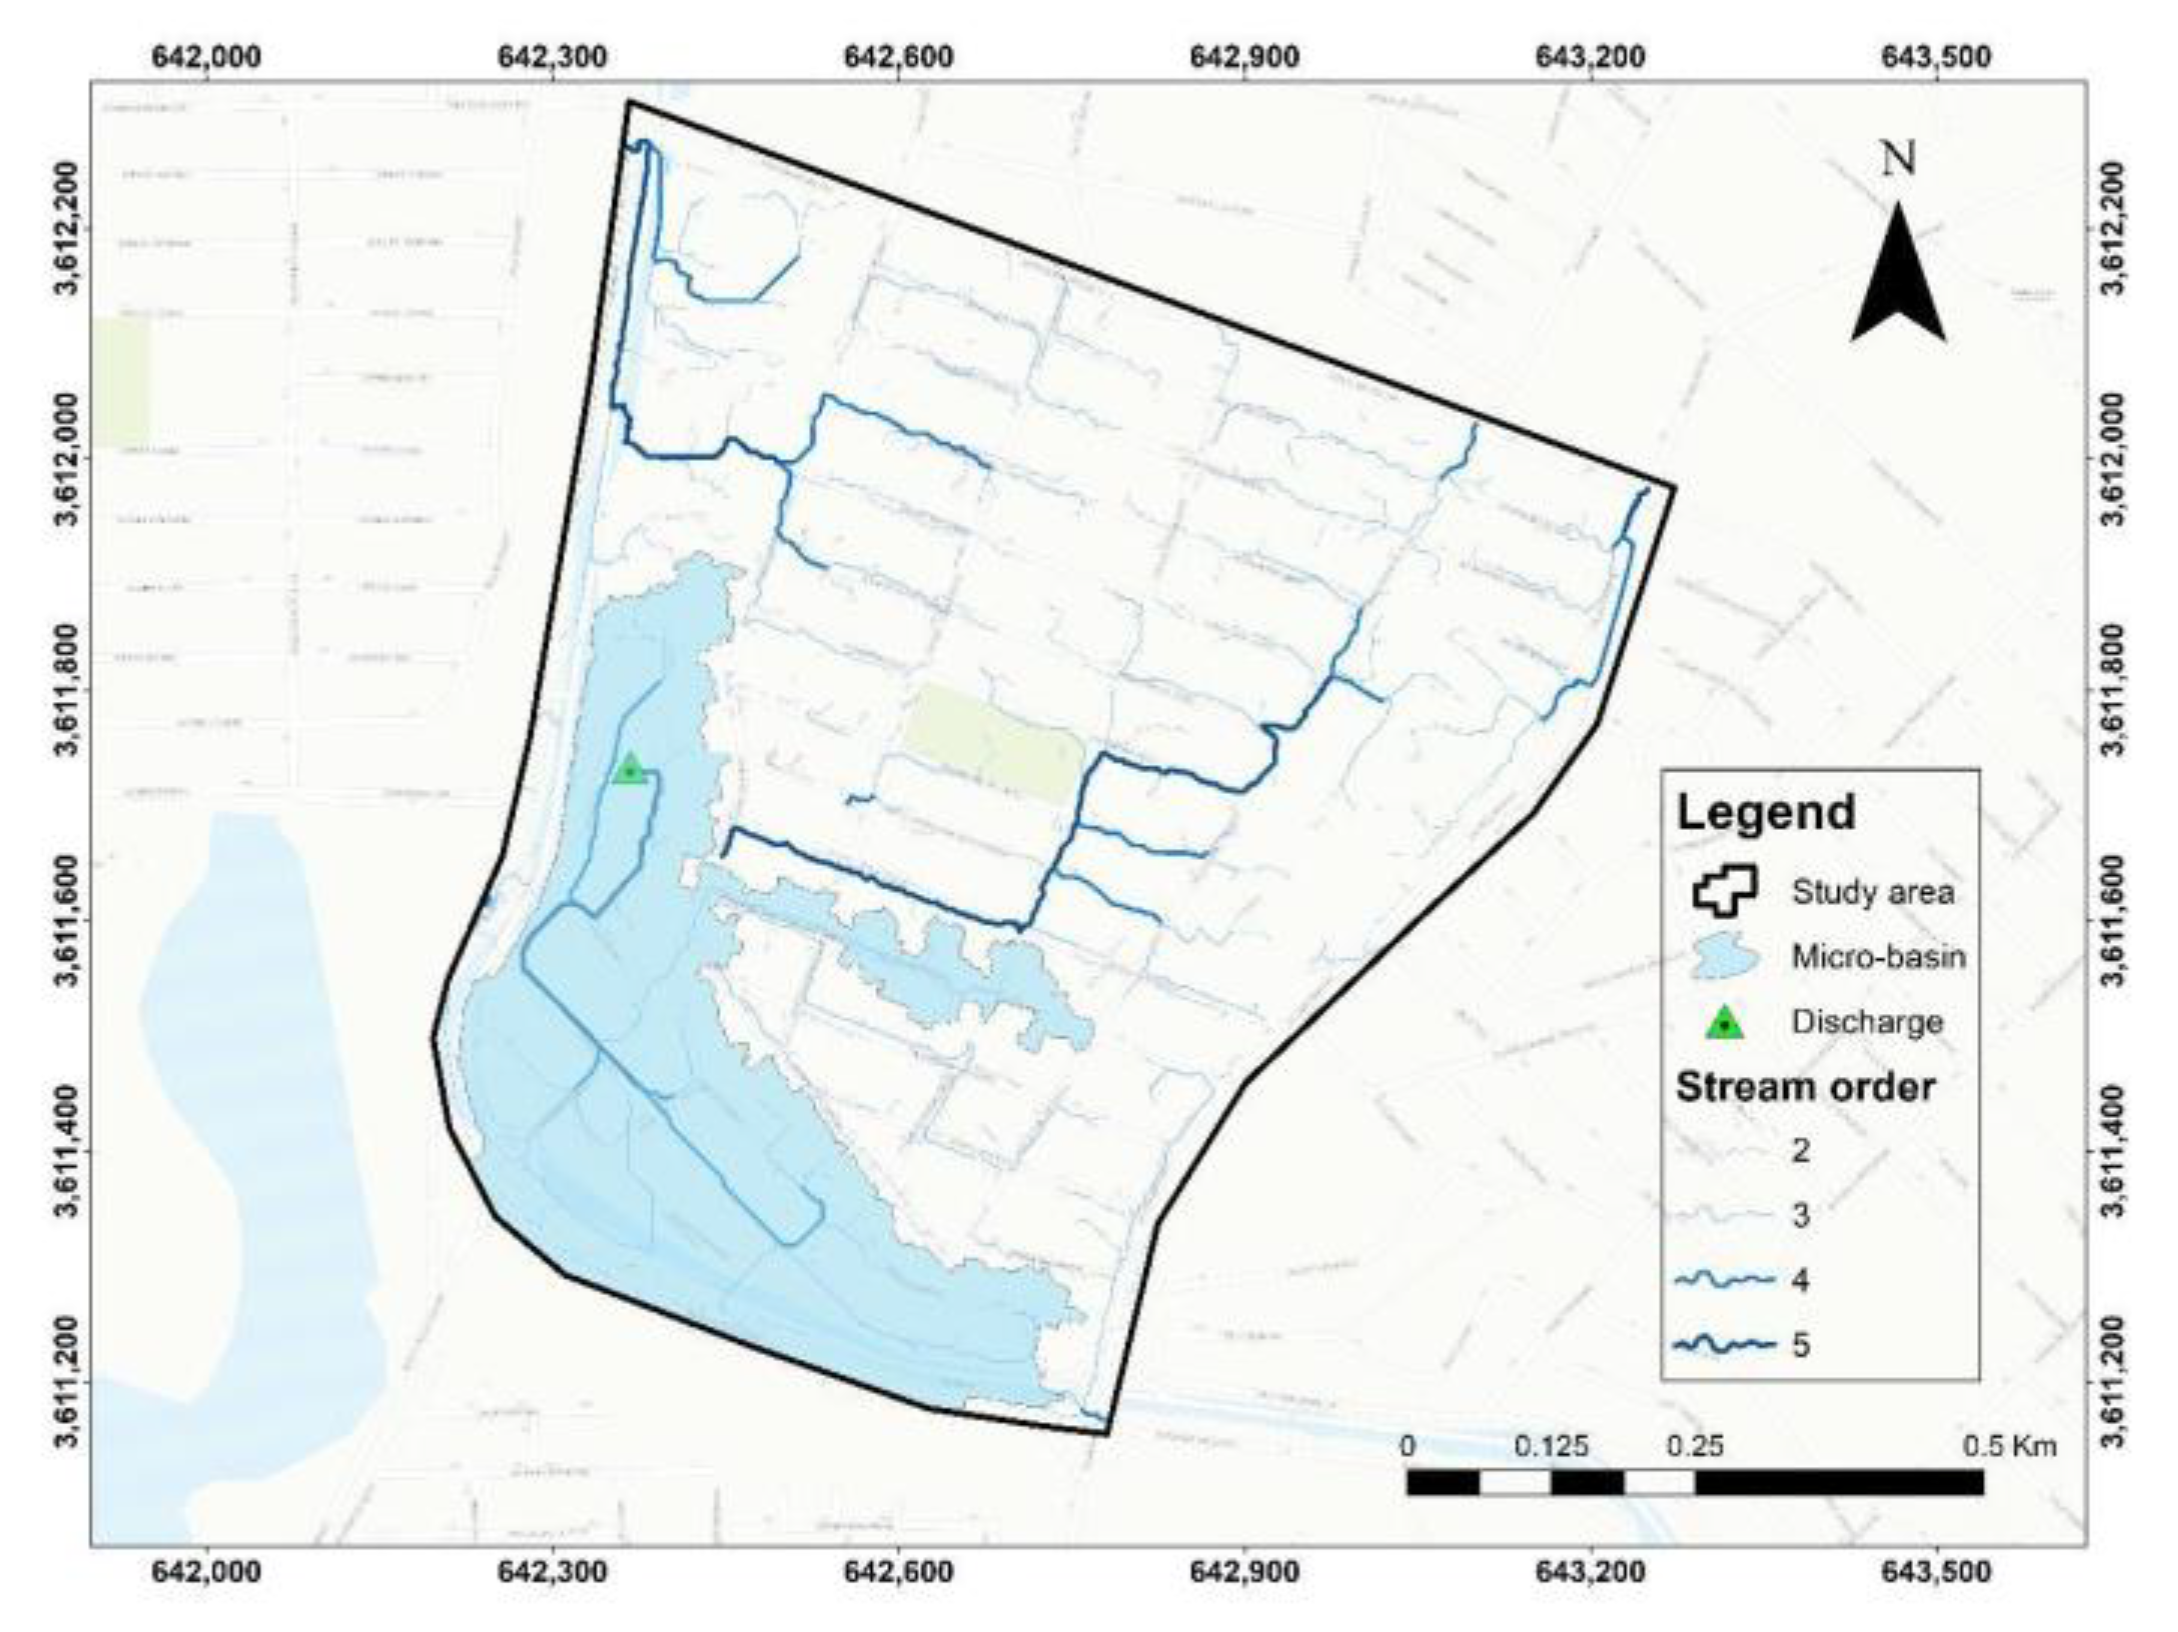
Figure 12.
Runoffs and micro-basins generated by INEGI DEM and GlobalMapper software.
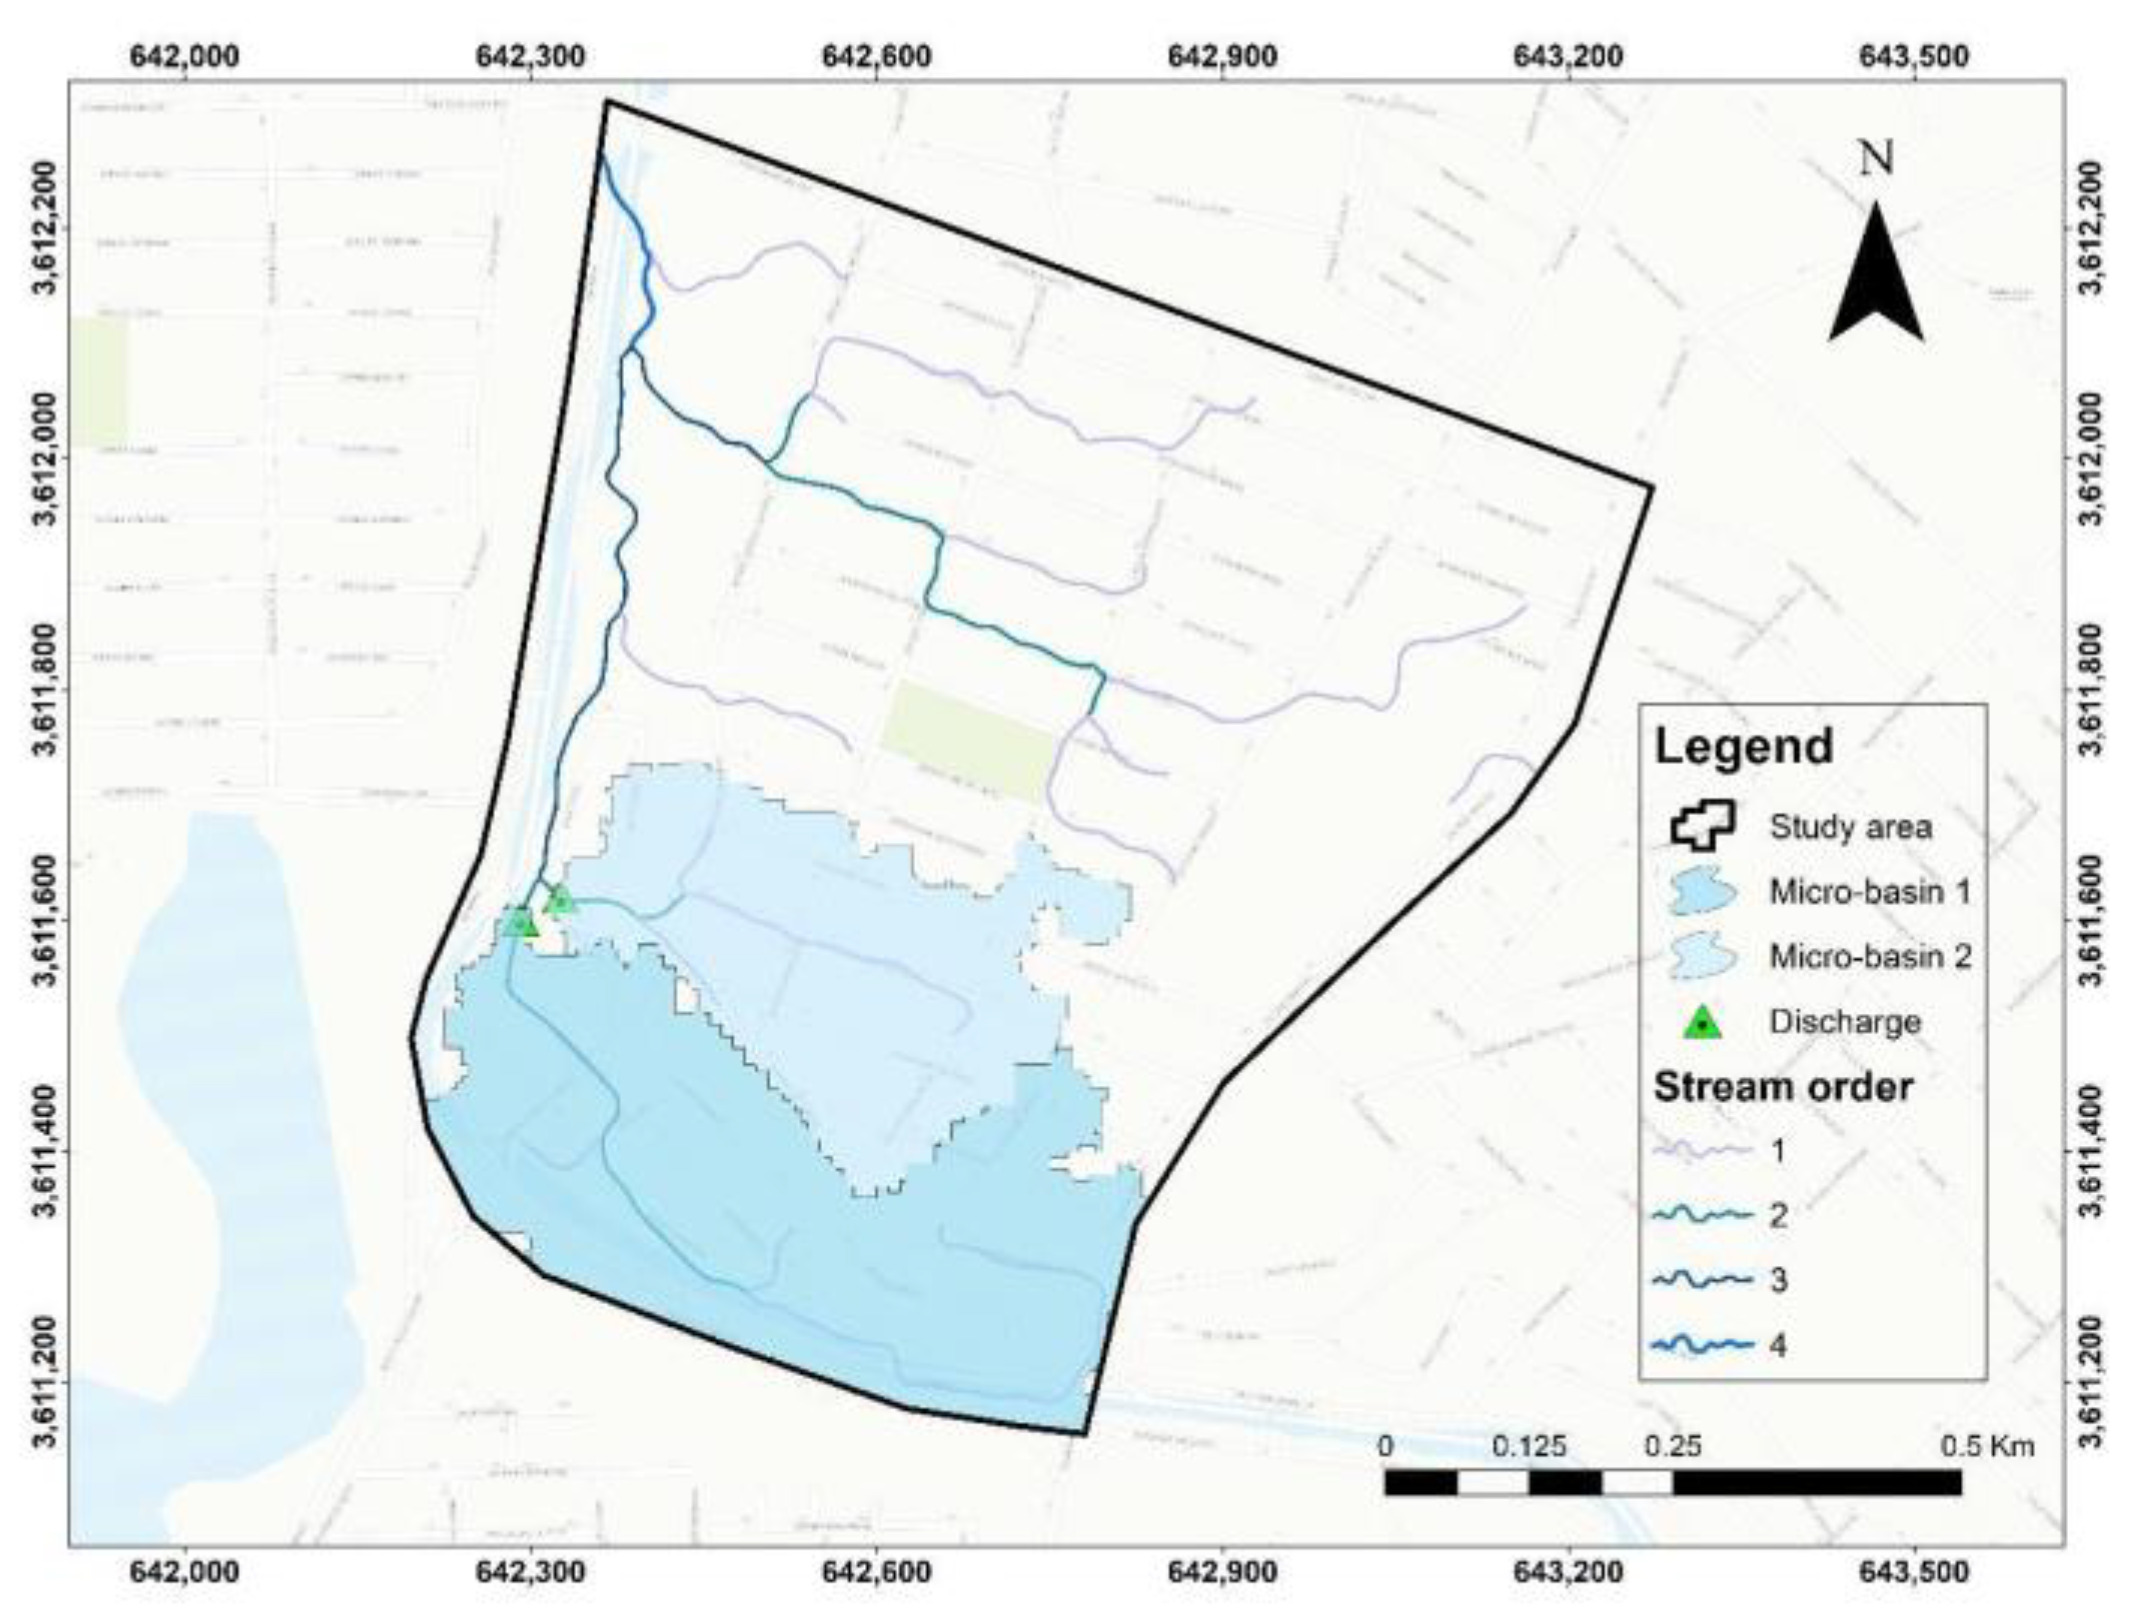
Figure 13.
Runoff and micro-basins generated by UAV DEM and SAGA GIS software.
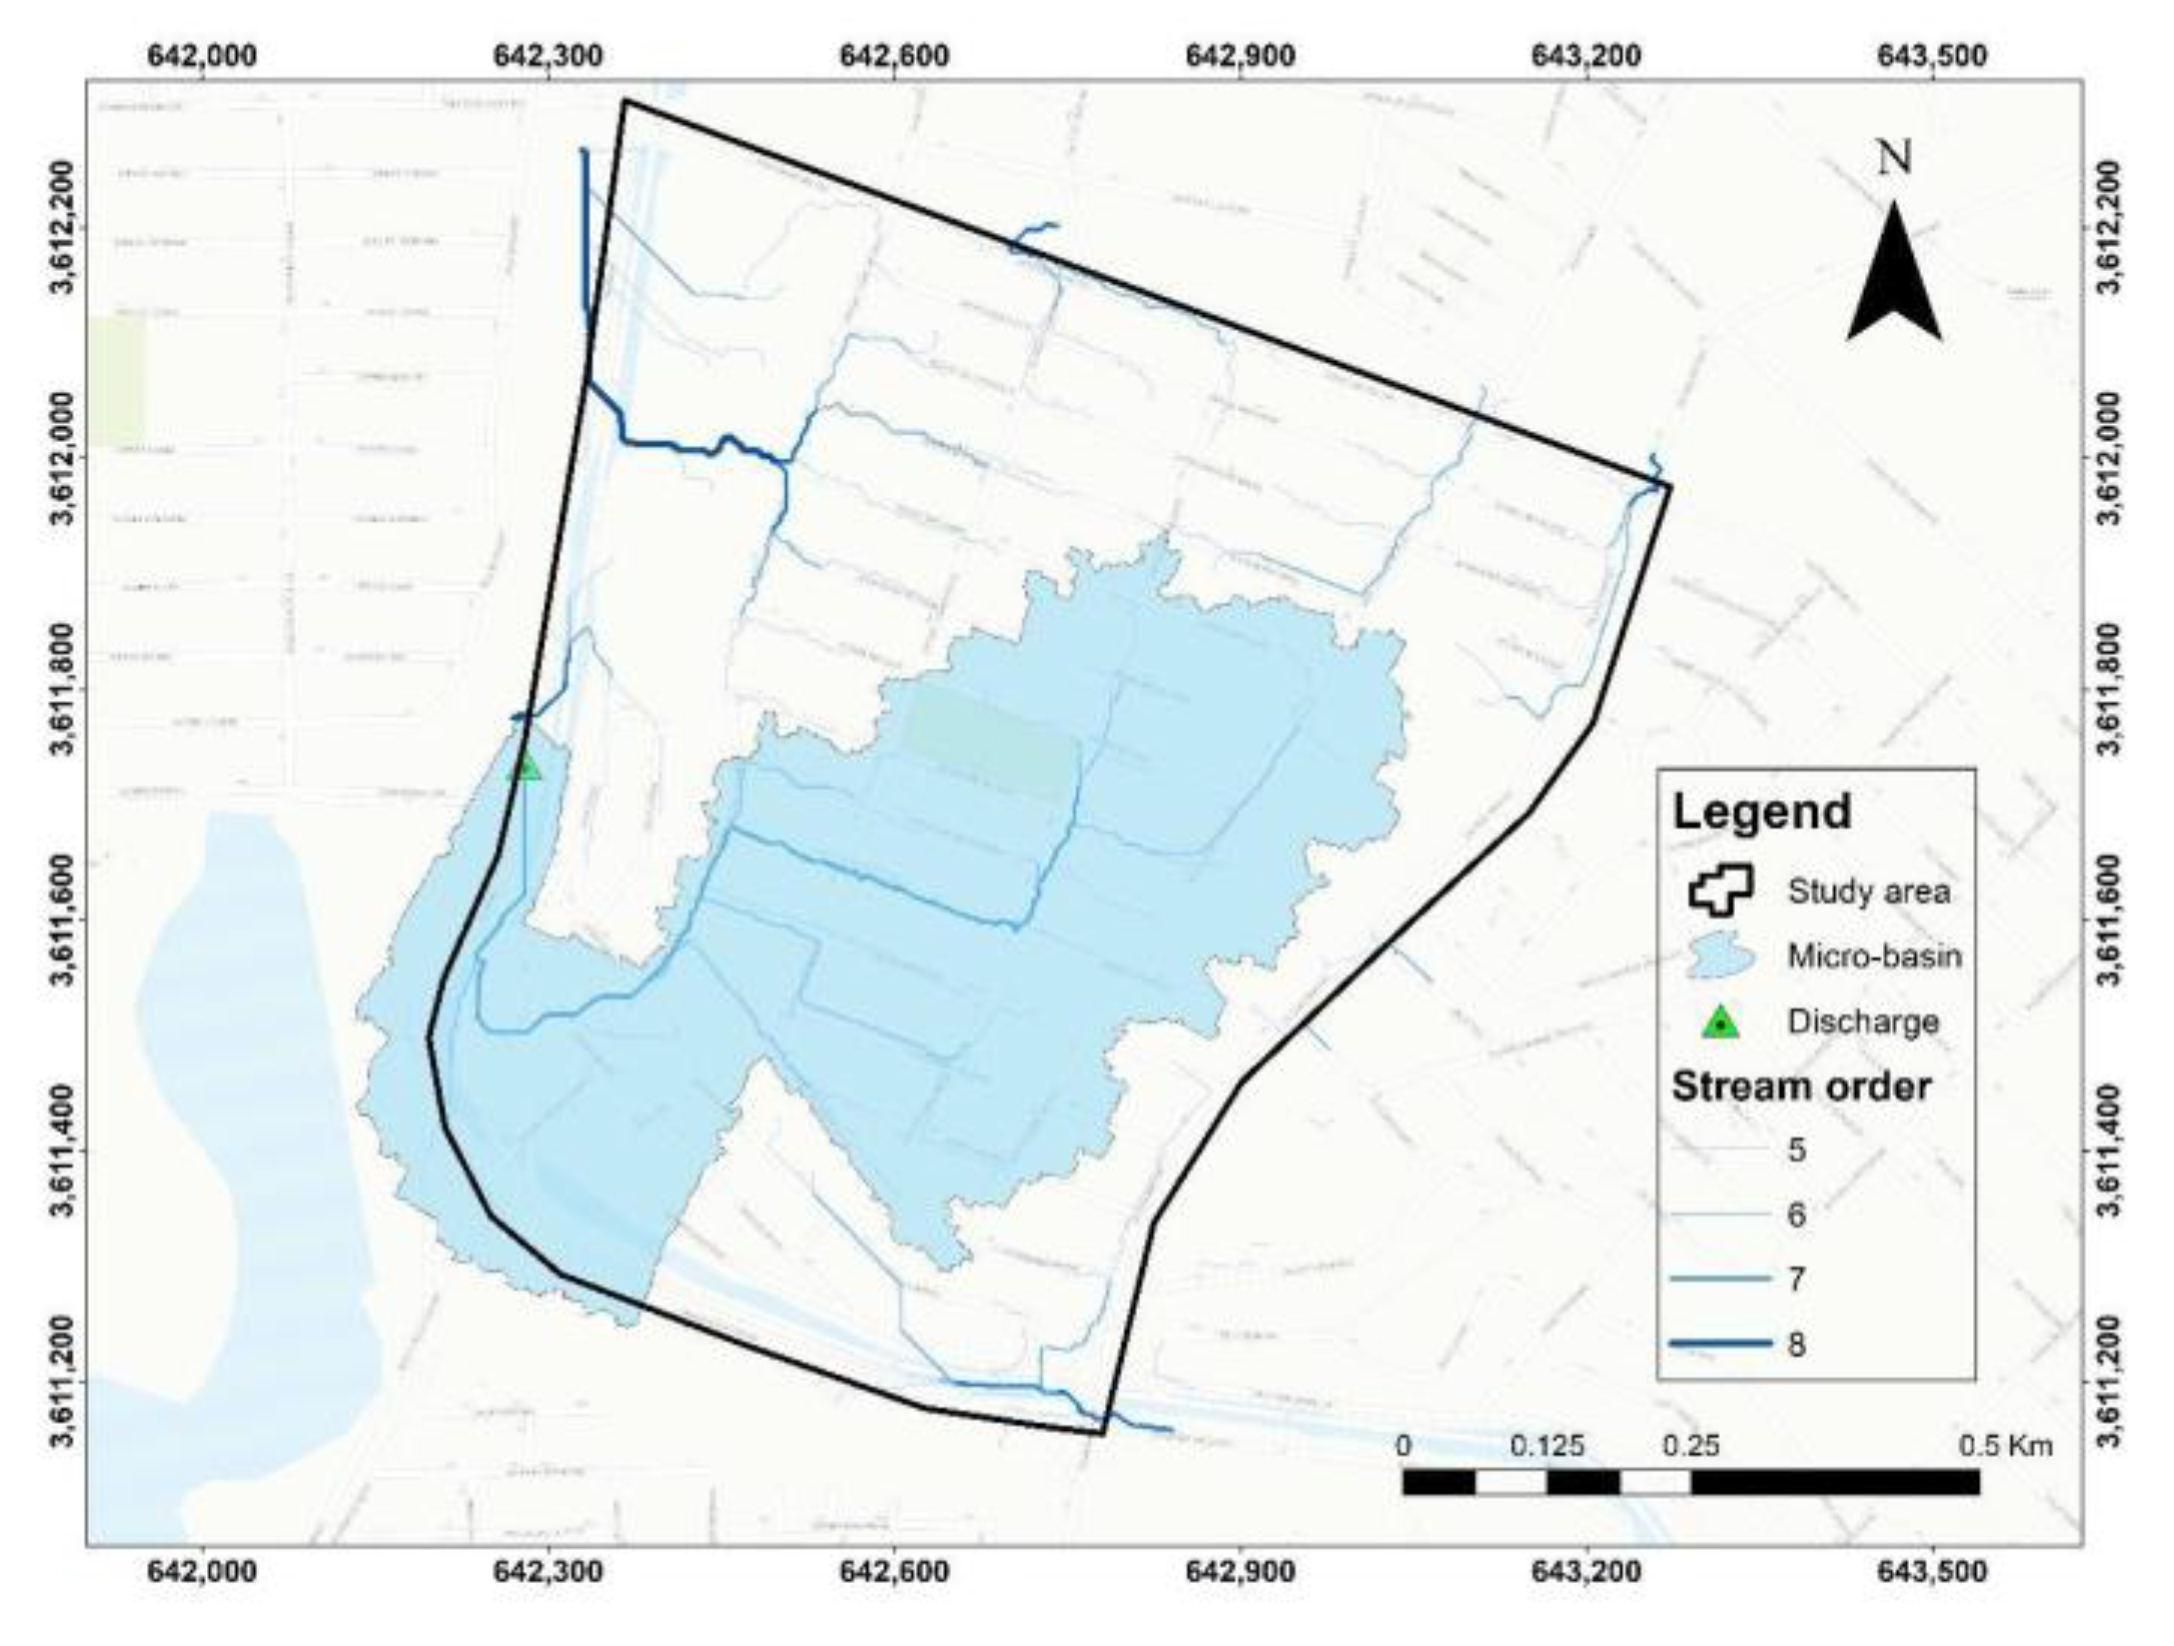
Figure 14.
Runoff and micro-basin generated by INEGI DEM and SAGA GIS software.
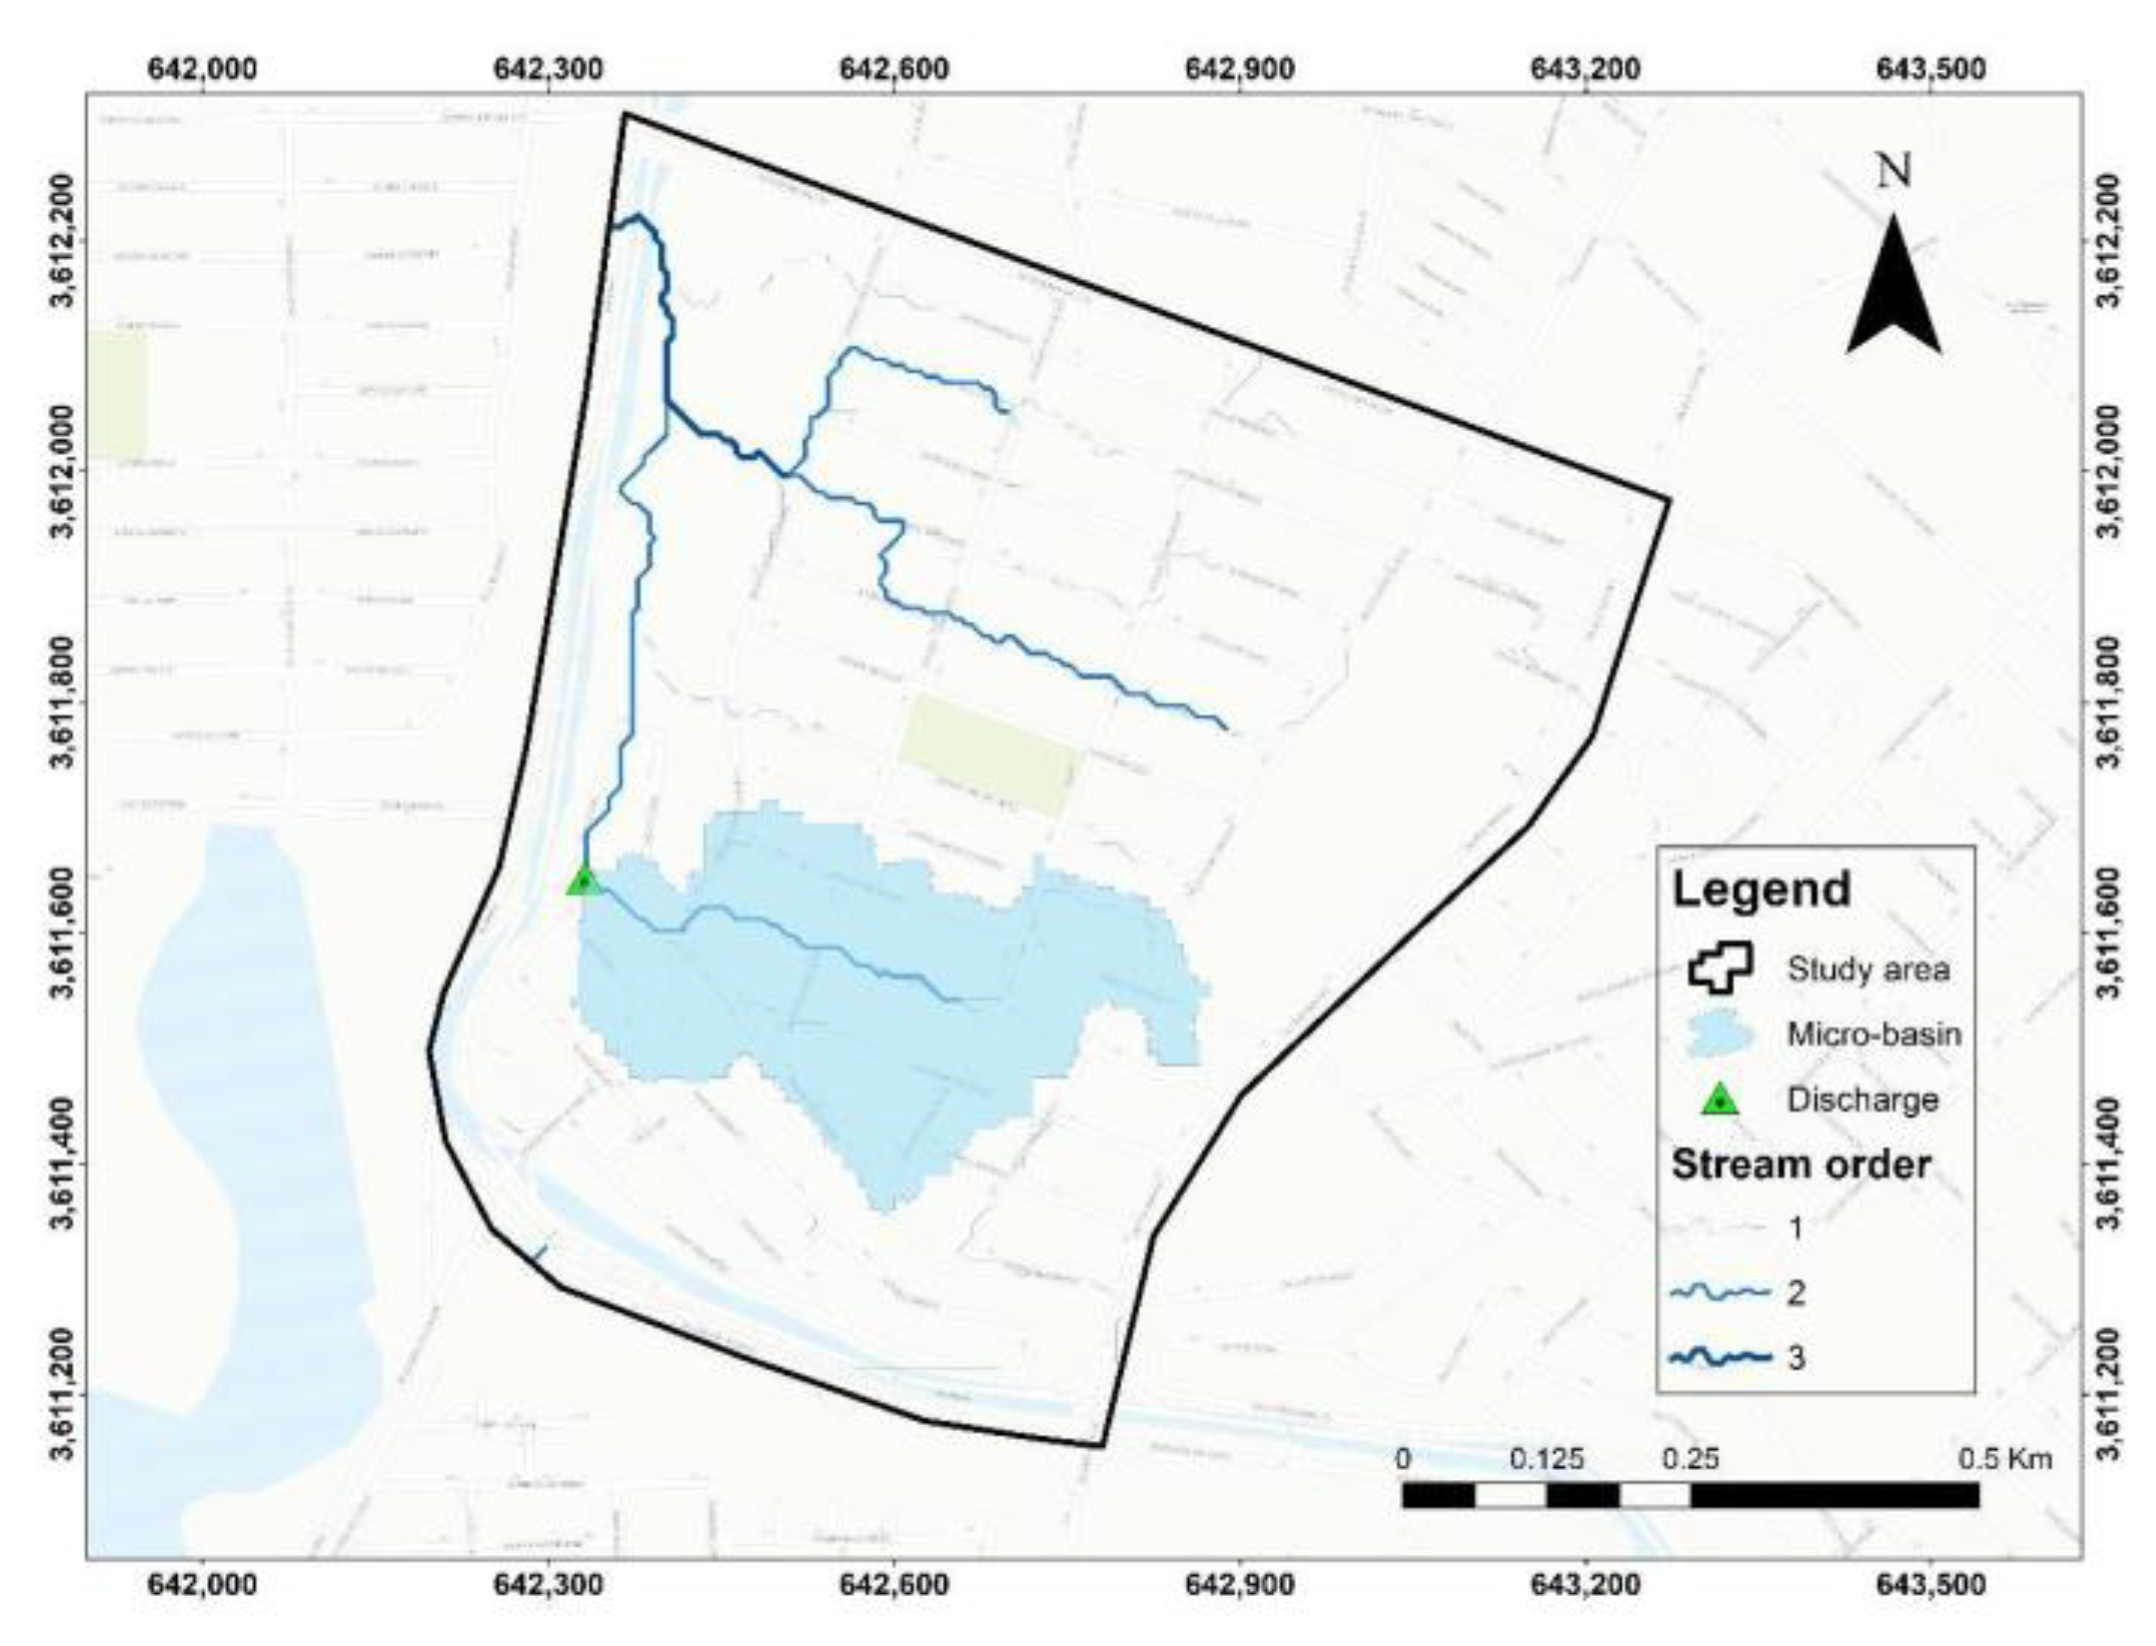
Table 1.
DEM sources, resolutions and reference sites.
| Source | Resolution | Consultation website |
|---|---|---|
| ASTER (Advanced Spaceborne Thermal Emission and Reflection Radiometer) | 15m | https://asterweb.jpl.nasa.gov/index.asp |
| STRM (Stands Shuttle Radar Topography Mission) | 30m | https://earthexplorer.usgs.gov |
| ALOS PALSAR | 30m | https://www.eorc.jaxa.jp/ALOS/a/en/index_e.htm |
| 3DEP | 1m | https://catalog.data.gov/dataset |
| Continuo de Elevaciones Mexicano (CEM)-INEGI | 15m | https://www.inegi.org.mx/app/geo2/elevacionesmex/ |
| Relieve continental-INEGI | 5m | https://www.inegi.org.mx/temas/relieve/continental/#Mapa |
Table 2.
Parameters associated with the shape of the basin and its hydrological behavior.
| Parameter | Equation or description |
|---|---|
| Stream order (Strahler) | Strahler’s method is a technique for the classification of streams in basins. Smaller, headwater-bearing streams with no tributaries are referred to as “first order”. When two first-order streams join to form a larger stream, they are called “second-order”, two second-order streams join to form a “third order”, and so on. Small incoming streams to a larger order stream do not change of higher order do not change their order number. |
| Time of concentration (Kirpich) | |
| Compactness coefficient (Gravelius) | |
| Form factor (Horton) | |
| Elongation ratio |
Table 3.
Runoffs and micro-basins generation results in the various software and DEM.
| Number of micro-basins generated | ||
|---|---|---|
| Software | UAV | DEM INEGI |
| ArcGIS | 2 | 2 |
| GlobalMapper | 1 | 2 |
| SAGA GIS | 1 | 1 |
Table 4.
Primary parameters of the micro-basins generated with GIS and UAV DEM softwares.
| Micro-basin | Area (km2) | Perimeter (Km) | Length of micro-basin (Km) | Length of main channel (Km) | Average slope of main channel (m/m) |
|---|---|---|---|---|---|
| Micro-basin 1 DEM UAV ArcGIS |
0.12 |
2.09 |
0.59 |
0.39 |
0.00304 |
| Micro-basin 2 DEM UAV ArcGIS |
0.25 |
3.87 |
1.02 |
1 |
0.00881 |
| Micro-basin 1 DEM UAV GlobalMapper |
0.02 |
2.63 |
0.24 |
0.24 |
0.00209 |
| Micro-basin 2 DEM UAV GlobalMapper |
|||||
| Micro-basin 1 DEM UAV SAGA GIS |
0.32 |
6.88 |
1.2 |
0.97 |
0.00972 |
| Micro-basin 2 DEM UAV SAGA GIS |
Table 5.
Primary parameters of the micro-basins generated with GIS and INEGI DEM software.
| Micro-basin | Area (km2) | Perimeter (Km) | Length of micro-basin (Km) | Length of main channel (Km) | Average slope of main channel (m/m) |
|---|---|---|---|---|---|
| Micro-basin 1 DEM UAV ArcGIS |
0.15 |
2.33 |
0.83 |
0.92 |
0.00776 |
| Micro-basin 2 DEM UAV ArcGIS |
0.09 |
1.86 |
0.52 |
0.41 |
0.01155 |
| Micro-basin 1 DEM UAV GlobalMapper |
0.15 |
2.79 |
0.73 |
0.39 |
0.00177 |
| Micro-basin 2 DEM UAV GlobalMapper |
0.09 |
2.21 |
0.48 |
0.34 |
0.01263 |
|
Micro-basin 1 DEM UAV SAGA GIS |
0.11 |
2.28 |
0.6 |
0.39 |
0.02035 |
| Micro-basin 2 DEM UAV SAGA GIS |
Disclaimer/Publisher’s Note: The statements, opinions and data contained in all publications are solely those of the individual author(s) and contributor(s) and not of MDPI and/or the editor(s). MDPI and/or the editor(s) disclaim responsibility for any injury to people or property resulting from any ideas, methods, instructions or products referred to in the content. |
© 2024 by the authors. Licensee MDPI, Basel, Switzerland. This article is an open access article distributed under the terms and conditions of the Creative Commons Attribution (CC BY) license (http://creativecommons.org/licenses/by/4.0/).
Copyright: This open access article is published under a Creative Commons CC BY 4.0 license, which permit the free download, distribution, and reuse, provided that the author and preprint are cited in any reuse.


