
Submitted:
12 October 2024
Posted:
14 October 2024
You are already at the latest version
Abstract
We lack a unified theory of aging that spans multiple scientific disciplines, including life history theory, evolution, cellular and molecular biology, and medicine. This gap has hindered both our ability to effectively target and treat age-related diseases in humans and our understanding of the vast variation in aging rates across species. This paper builds on the Blueprint Theory of Aging, which suggests that biological pathways can be ‘dis’-activated outside their intended context, leading to pathological pathways (patho-pathways) that drive cellular and tissue ‘dys’-function and age-related ‘dis’-eases, ultimately limiting both healthspan and lifespan. We propose that evolution operates through complex trade-offs within interconnected networks (network constraints), optimizing beneficial functions while minimizing the costs of misactivated patho-pathways. These optimizations are shaped by a species' environment and are driven by a central evolutionary dilemma: prioritize immediate reproduction or reduce current fecundity in favour of future reproductive success. Evolution adjusts network constraints along a continuum, balancing early-life reproduction with lifetime reproductive output. When environmental pressures result in lower juvenile survival than adult survival, the optimal strategy shifts toward maximizing total progeny over a lifetime. This strategy, in turn, determines the final trade-offs selected, the structure of network constraints, and ultimately, the rate of aging for that species. Understanding these evolutionary calculations not only explains species-specific aging patterns but also sheds light on the wide variability in aging rates across nature. Finally, we reveal hidden evolutionary connections between mechanisms such as Antagonistic Pleiotropy and Mutational Accumulation, deepening our insight into the evolutionary dynamics underlying aging.
Keywords:
aging
; antagonistic pleiotropy (AP)
; Blueprint synthesis
; dysactivity
; ecology
; extrinsic mortality
; evolution
; life history theory
; mutational accumulation (MP)
; nested doll principle
; network constraint
; patho-pathway
1. Introduction
Why do some species age rapidly while others, with similar traits, appear nearly ageless? Mice, for instance, live no more than three years, while squirrels can thrive for 25. Is this variation driven by distinct mechanisms of aging, or do shared mechanisms simply operate at different rates? Despite progress in aging research, no unified framework fully explains these differences—or their relevance to human aging. This gap limits our understanding of age-related degeneration and hinders the translation of findings from animal models to humans (Ayyadevara et al., 2008; Mattison et al., 2017).
Life-history theory, which examines how a species' survival and reproductive strategies are shaped by its environment, has laid the groundwork for evolutionary aging theories. Yet, existing frameworks have struggled to explain the diversity of aging across species. In this paper, we integrate concepts from life-history theory, evolutionary biology, molecular and cellular mechanisms, and medicine to introduce a novel framework based on the Blueprint Theory of Aging. The first two sections review life-history theory and aging mechanisms, reconciling key debates, before introducing our unified framework in sections 4 and 5.
2. Background: How the Environment Shapes Life History Strategy
Herbert Spencer’s phrase "survival of the fittest" simply and accurately describes natural selection. But defining "fitness" is not so simple, as it depends on the environment a species finds itself in. To describe fitness, we require ecological context—specifically, the interplay between population density and extrinsic mortality (external causes of death). The r/K-selection theory (MacArthur and Wilson, 1967) is one notable attempt to model this interplay.
3.1. r and K Selection: Density Dependence
r-selected species thrive (outcompete competitors) by rapidly increasing population size, unconstrained by density limits (r for population growth rate). In contrast, K-selected species stabilize near the environment’s carrying capacity (K from the German "Kapazitätsgrenzen," or capacity limits). Density-dependent factors, such as limited nutrient availability, regulate K-selected populations.
3.2. Extrinsic Mortality and Population Dynamics
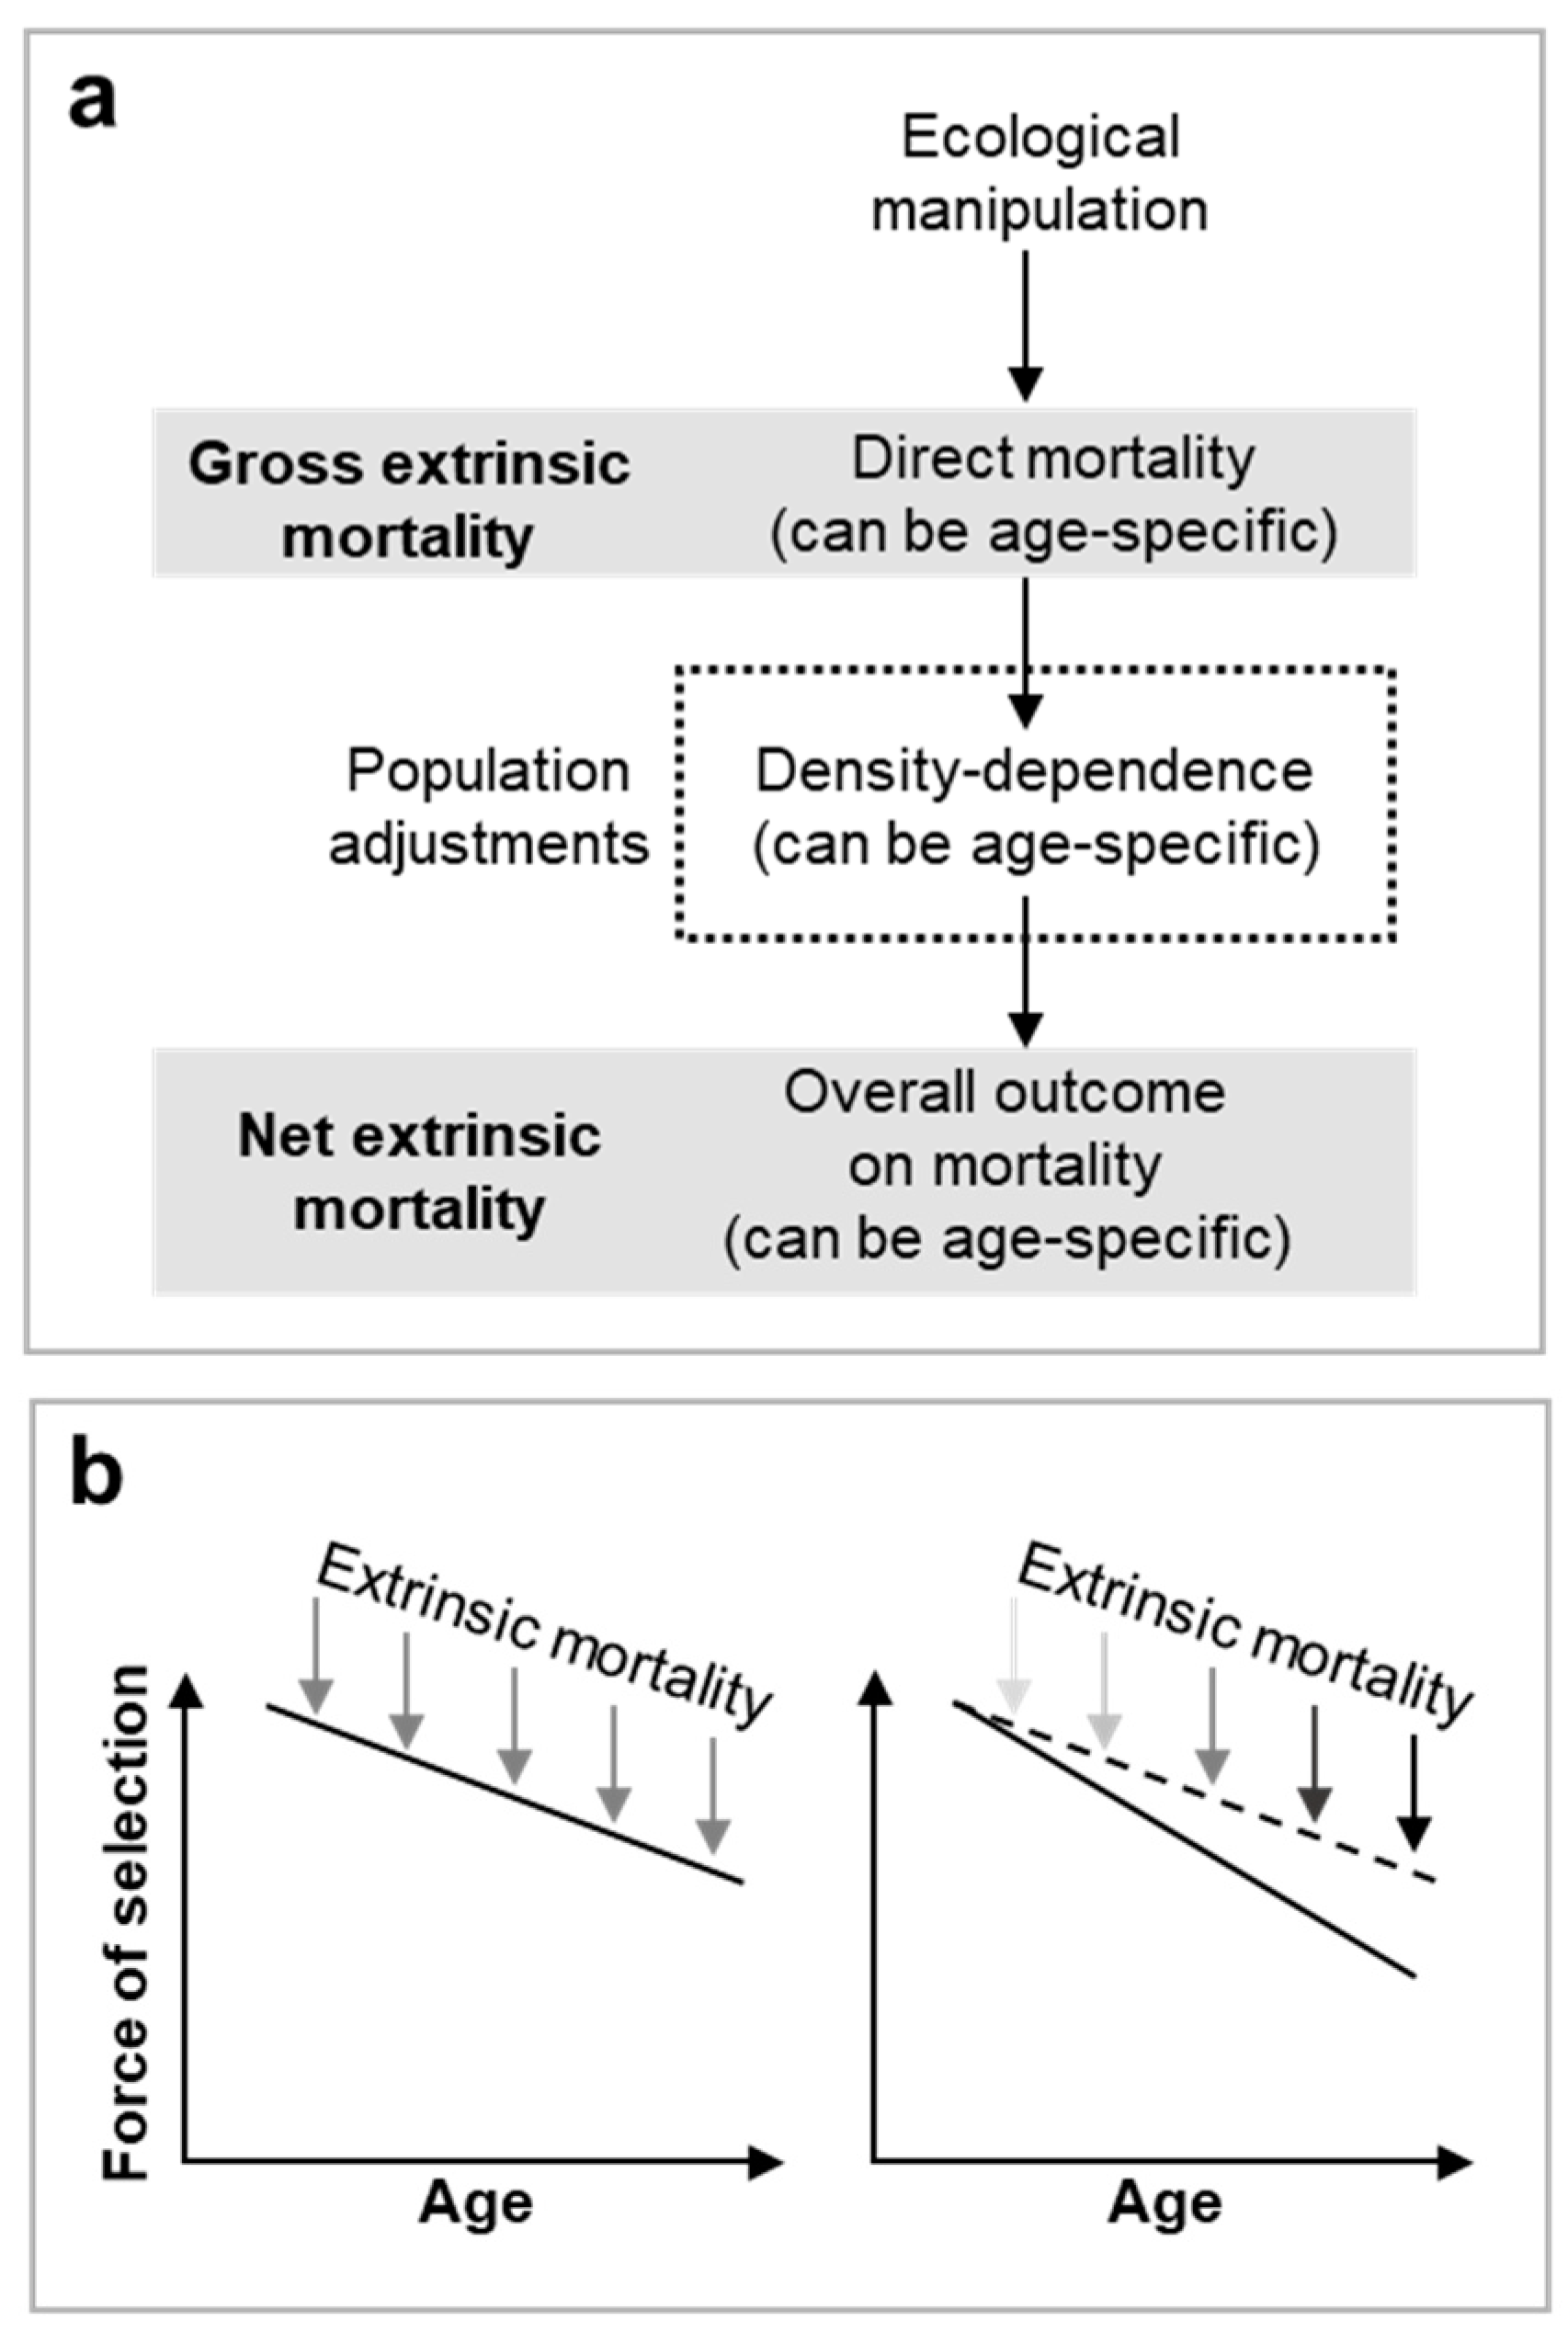
In recent times, different definitions of extrinsic mortality have complicated life-history discussions. Theoretical approaches focus on direct death from ecological stress (Dańko et al., 2018; Dańko et al., 2017; Day and Abrams, 2020), while observational studies consider both direct and indirect effects, including density-dependent adjustments (Moorad et al., 2020); death from ecological stress will weaken density dependence. To clarify, we propose new terms: gross extrinsic mortality as direct mortality, and net extrinsic mortality as the overall outcome, including density adjustments (Figure 1a). For example, in a deer population near its carrying capacity, introduction of infection that persistently kills 5% of individuals would be considered increased gross extrinsic mortality, but the population might quickly recover through density-dependent compensation, resulting in unchanged net mortality and so overall population size.
Figure 1.
Gross vs net extrinsic mortality. a, Overview of the interactions between density dependence and ecological manipulations that affect population extrinsic mortality. Broadly, two different definitions of extrinsic mortality exist in the literature (Dańko et al., 2018; Dańko et al., 2017; Day and Abrams, 2020; Moorad et al., 2020). For clarity we recommend use of gross extrinsic mortality when considering the direct effects of an ecological manipulation on individual survival within a population and net extrinsic mortality when considering overall population survival effects once compensated for by density-dependent adjustments. b, Extrinsic mortality only increases the rate of aging—through effects on the decline in section—when net effects of extrinsic mortality are higher at older ages, i.e. the effects of net extrinsic mortality are unequal across all age groups and greater reductions in survival are at older ages. .
In the following discussion, we will refer only to gross extrinsic mortality and analyse density dependence separately, allowing for a clearer understanding of the interplay between mortality and population dynamics. Typically increasing gross extrinsic mortality weakens density dependence to favour r-selection, e.g. squirrels that can evade predators by climbing trees face less extrinsic mortality and so face more density-dependent regulation.
3.4. The r/K Model: Past and Present
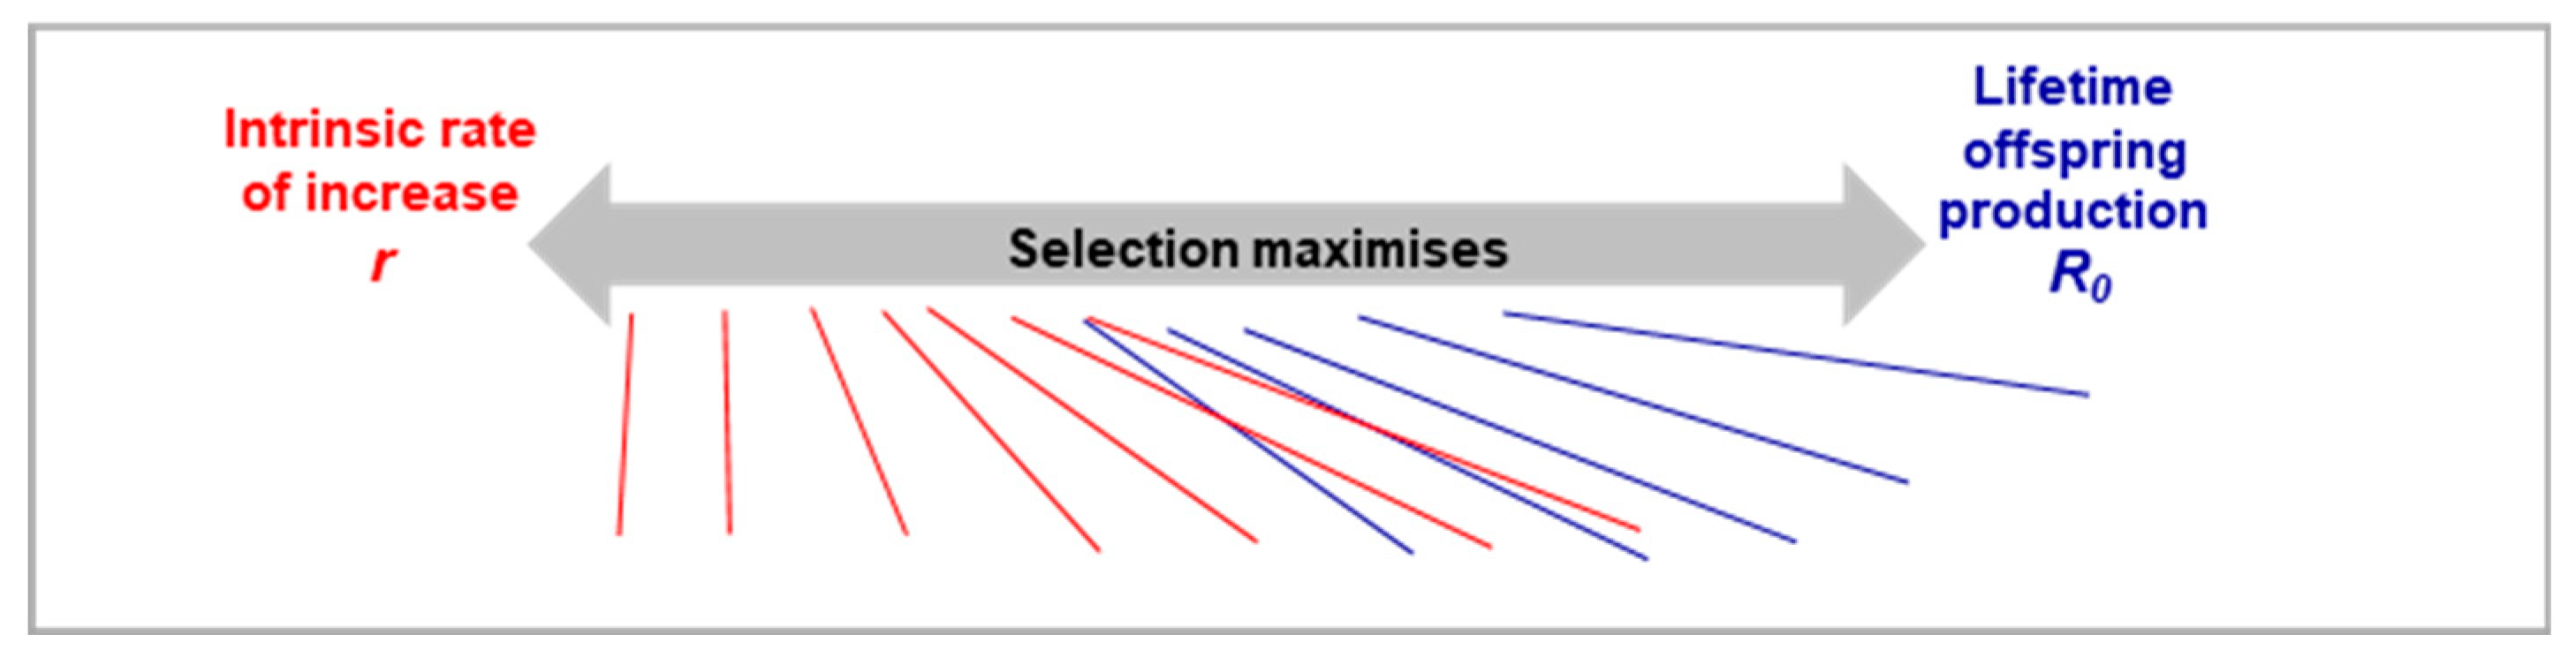
In r-selected populations, fitness is best described as maximizing population growth, favouring traits like early reproduction and rapid development (Stearns, 1977). Microorganisms are a prime example, where high extrinsic mortality keeps populations in constant growth (Dańko et al., 2018). Fitness is best measured by the intrinsic rate of population increase or Malthusian parameter (r; simply put, it represents the rate of change in population size relative to the current population size).
The r/K model lost favour in the 1970s when K-selected traits were mischaracterized as simply the inverse of r-selected traits. In fact, K-selected species may maximize either r or lifetime reproductive success (R0) through traits like delayed maturity and larger size (Dańko et al., 2017). Larger animals often typically have higher over fecundity and have reduced predation risk. R0, typical of most birds and mammals (Dańko et al., 2017), is calculated by multiplying female survival by their average offspring production.
Whether a K-selected species optimizes r or R0 depends on its strategy for reproduction: investing heavily in current offspring versus delaying reproduction for greater future benefits. This choice hinges on juvenile survival relative to adult survival; if offspring don't survive long enough to reproduce, maximizing current output is futile. If extrinsic mortality affects all age groups equally, maximizing r is ideal. However, if juveniles face higher mortality—either directly or through age-specific density effects—the species tends to favour R0. For instance, in Soay sheep on Hirta (St. Kilda, Scotland), lamb survival decreased with population density, while prime-age adults (2-6 years) remained unaffected (Coulson et al., 2001).
Ultimately, r and R0 represent extremes on a continuum of reproductive strategies, with most species positioned somewhere in between (Dańko et al., 2017). As discussed in the next section, a species’ position on the r-R0 continuum influences its rate of aging.
3. Background: Evolutionary Theory and the Blueprint Theory of Aging
3.1. Evolution Theories of Ageing in the Context of Life History Theory
A key principle in evolutionary theory is that the force of selection decreases with age, creating a "selection shadow" in later life (Hamilton, 1966; Medawar, 1952). Genes that have negative effects only later in life are less likely to be eliminated, as they can be passed on from one generation to the next before causing harm. Such genes can be purely harmful mutations that cause aging (Mutation Accumulation [MA] Theory) (Medawar, 1952), or normal (wild-type) genes with beneficial traits are unavoidably coupled to trade-off “costs” which cause aging (Antagonistic Pleiotropy [AP] Theory; i.e. genes are pleiotropic, with opposing/antagonistic effects) (Williams, 1957). While AP is well-supported, the role of MA remains debated (Hughes and Reynolds, 2005; Moorad and Promislow, 2009).
3.2. Life History Strategy and the Evolution of Aging
Efforts to link evolutionary theories of aging with life history strategies focus on how these strategies influence the decline in selection pressure with age. In r-maximizing organisms, favouring earlier reproduction over future reproduction results in an earlier selection shadow, and hence earlier aging. Recent calculations of selection gradients based on r or R₀ in environments with varying extrinsic mortality support this trend (Dańko et al., 2018).
The ongoing debate about whether higher age-independent extrinsic mortality accelerates aging or not (Day and Abrams, 2020; Moorad et al., 2019; Moorad et al., 2020) does not undermine this framework. The debate hinges on definitions of gross (direct) versus net extrinsic mortality (including density-dependent effects). If net extrinsic mortality affects all age groups equally, the selection gradient’s decline remains unchanged; equal effects across a slope do not affect the gradient of the slope. For the gradient to change, effects must vary by age group (Figure 1b). However, age-independent increase in gross extrinsic mortality may accelerate aging by weakening age-specific density dependence. For instance, in the St. Kilda example, if half the sheep are randomly killed by alteration in weather (i.e. age-independent gross extrinsic mortality), net extrinsic mortality could disproportionately impact prime-aged adults and so accelerate aging.
3.3. An Incomplete Framework: Theoretical Gaps
This life history framework demonstrates how ecological factors shape the decline in selection with age through different reproductive strategies (r vs R₀ maximization). While it explains aging patterns linked to MA, where harmful alleles persist due to weak late-life selection, it inadequately captures AP. In AP, both the timing and magnitude of costs and benefits matter—late-life costs face weaker selection, while early-life benefits strengthen it. Sometimes, costs and benefits arise simultaneously. Key questions include: What calculations does evolution make when weighing gains against losses? How do life history strategies shape these trade-offs? What factors determine if costs occur all at once or are delayed?
This gap in understanding is further highlighted by a key reason why r/K theory fell out of favour: it fails to explain the many outliers in animal life histories. The theory struggles to account for species that don’t fit neatly on the r/K continuum (Reznick et al., 2002), and replacing it with an r-R₀ continuum does not solve the problem. For example, sea turtles lay many eggs without parental care (r traits) but are also large and long-lived as adults (R₀ traits). These complexities underscore the limitations of the current life history framework.
Additionally, the current framework does not account for intrinsic causes of mortality. How can we consider these without falling into circular reasoning? Intrinsic constraints may drive aging by limiting the production or expression of certain traits, and they are likely tied to AP, often forcing trade-offs between traits (Acerenza, 2016). By affecting juvenile and adult survival, these constraints can influence whether a species prioritizes r or R₀. For example, orthodontic constraints can lead to starvation and early death in African elephants(Finch, 1990). It’s a classic chicken-and-egg scenario: Do intrinsic constraints shape r vs R₀, or vice versa?
To create a unified framework addressing these challenges, we must first understand the mechanisms behind aging. What are the AP trade-off costs that drive aging, and why can’t evolution separate benefits from costs to maximize fitness? If intrinsic constraints are involved, what is the nature of these constraints?
3.4. Blueprint Theory of Aging
The Antagonistic Pleiotropy (AP) theory explains how aging evolves through beneficial genes that come with trade-off costs to fitness. However, it lacks details on the biological mechanisms driving aging, such as the nature of these trade-offs and why costs cannot be uncoupled from benefits. The Blueprint Theory of Aging addresses this by proposing that aging results from the improper activation of biological pathways, termed pathological pathways or patho-pathways, triggered in the wrong context (time and/or place). Triggers—including external factors like infections and injuries and internal constraints—lead to harmful cellular and tissue activity (dysactivity; too much or the wrong activity) in later life, often resulting in cascades of pathology, as patho-pathways can trigger one another (Kern et al., 2024a).
Patho-pathways align with AP as they involve trade-offs: beneficial biological functions are selected for at the risk that they can be triggered out of context. This risk arises due to network constraints, an organism's inability to optimize all structures and functions simultaneously, especially across environments. The strength of the Blueprint Theory lies in its ability to explain various multifactorial diseases. For example, infections can trigger patho-pathways that drive rheumatoid arthritis at any life stage, while diseases like osteoporosis emerge later due to intrinsic constraints, such as hormonal changes during menopause (Kern et al., 2024a). Specifically, in rheumatoid arthritis, growth patho-pathways in synovial tissue lead to pannus formation, while in osteoporosis patho-pathways dysactivate osteoclast to the point where they actively destroy bone tissue (Kern et al., 2024a). The theory's utility is further demonstrated by its recent success in identifying a novel drug class (Kern et al., 2024b).
The Blueprint Theory upgrades AP in two key ways. First, it proposes that all genes, not just a limited subset as Williams originally suggested, can be implicated in AP. All wild-type genes have the potential to be inappropriately triggered, leading to pathology via patho-pathways. For example, in metastatic breast cancer, all genes and molecules that support cellular function become pathogenic- all exhibit AP (Kern et al., 2024a). Second, it clarifies that the costs of AP can arise at without a change in gene expression at the time the cost manifests. Costs can arise from interactions at higher biological levels, e.g. mRNA or protein level, as seen in diseases like atherosclerosis (Kern et al., 2024a).
The next section introduces a new framework that incorporates Blueprint Theory into life history evolution, providing a unified model. This approach uncovers the hidden cost-benefit calculations evolution uses to optimise AP trade-offs, balancing patho-pathway risk, intrinsic constraints, and environmental pressures.
4. A New Unified Framework on the Evolution of Aging
4.1. Trade-off Models
To explore the relationship between patho-pathway risk, intrinsic constraints, and environmental pressures, optimization theory-based trade-off models are employed. The general approach in these models involves three key steps:
- Map out trade-off options: Identify the various benefits a species can adopt and the corresponding trade-off costs.
- Assign fitness pay-offs: Evaluate how each trade-off strategy influences overall fitness, defined by the Malthusian parameter (r).
- Identify the optimal strategy: Select the trade-off that maximizes the Malthusian parameter (r).
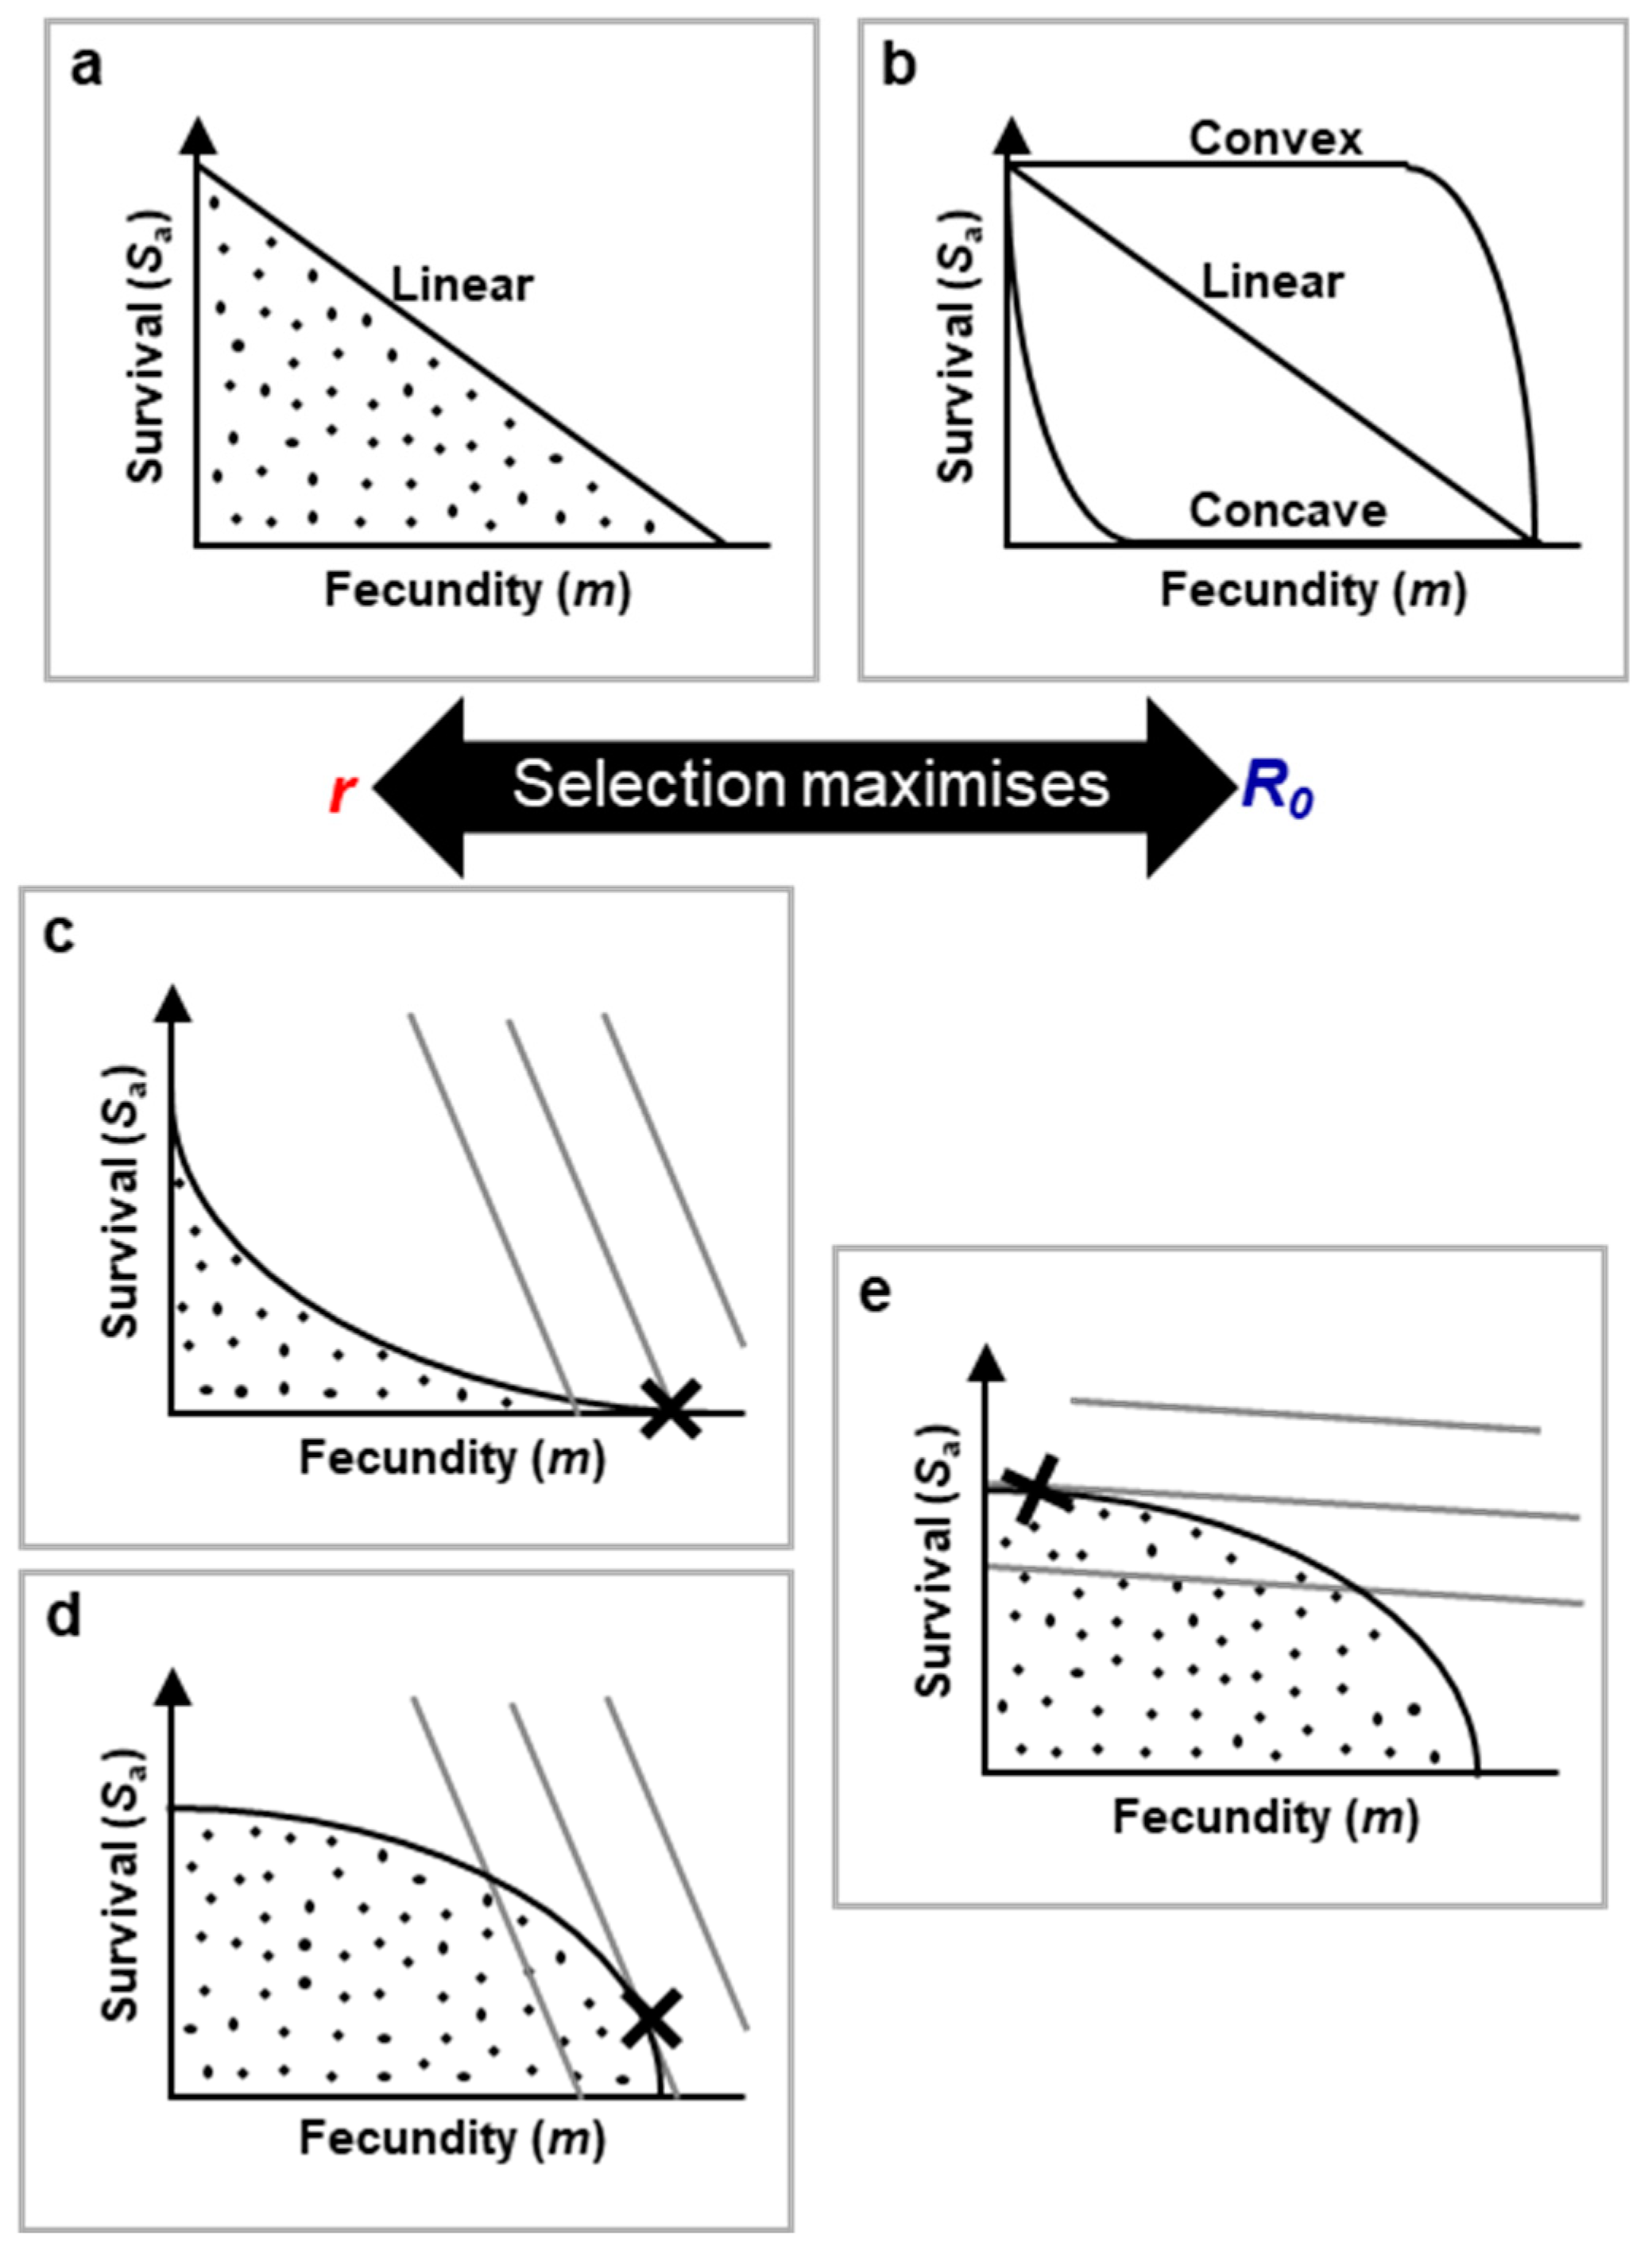
These models visualize trade-offs between traits, like survival and reproduction, through mathematical functions on 2D graphs. For example, adult survival (Sa) can be plotted on the Y-axis (dependent variable), while fecundity (m) is plotted on the X-axis. The reduction in adult survival represents the "cost" of higher fecundity, illustrating how favouring one trait comes at the expense of the other (see Figure 3a). This approach illustrates how evolution must balance the selection for traits to maximize fitness.
Figure 2.
Examples of patho-pathways arising from network constraint from (Kern et al., 2024a). a, Patho-pathways involve in endometrial hyperplasia. Patho-pathways induce pathology via dysactivity. Triggers of patho-pathways include environmental factors as well as genetic, accumulative and evolutionary. Patho-pathways are the futile activation of molecular pathways at the wrong time and/or wrong place; patho-pathways are not confined to wrong execution of genetic programmes but can arise from higher levels of organisation (e.g. mRNA, protein). Dysactivity is unwanted activity by cells, tissues and/or whole systems. Once triggered, one patho-pathway can trigger others, resulting in cascades of patho-pathways. Patho-pathways may directly induce pathology or converge to induce pathology. In endometrial hyperplasia, any trigger that offsets the balance of oestrogen and progesterone can trigger patho-pathways of cell hyperplasia that goes on to risk uterine cancer. b, An example of a cascade of patho-pathways as seen in inflammaging and other disorders that trigger systemic inflammation such as obesity. Vit-D: vitamin D, PTH: parathyroid hormone, FFA: free fatty acids, GLP-1: glucagon-like peptide-1, Ca2+: calcium.
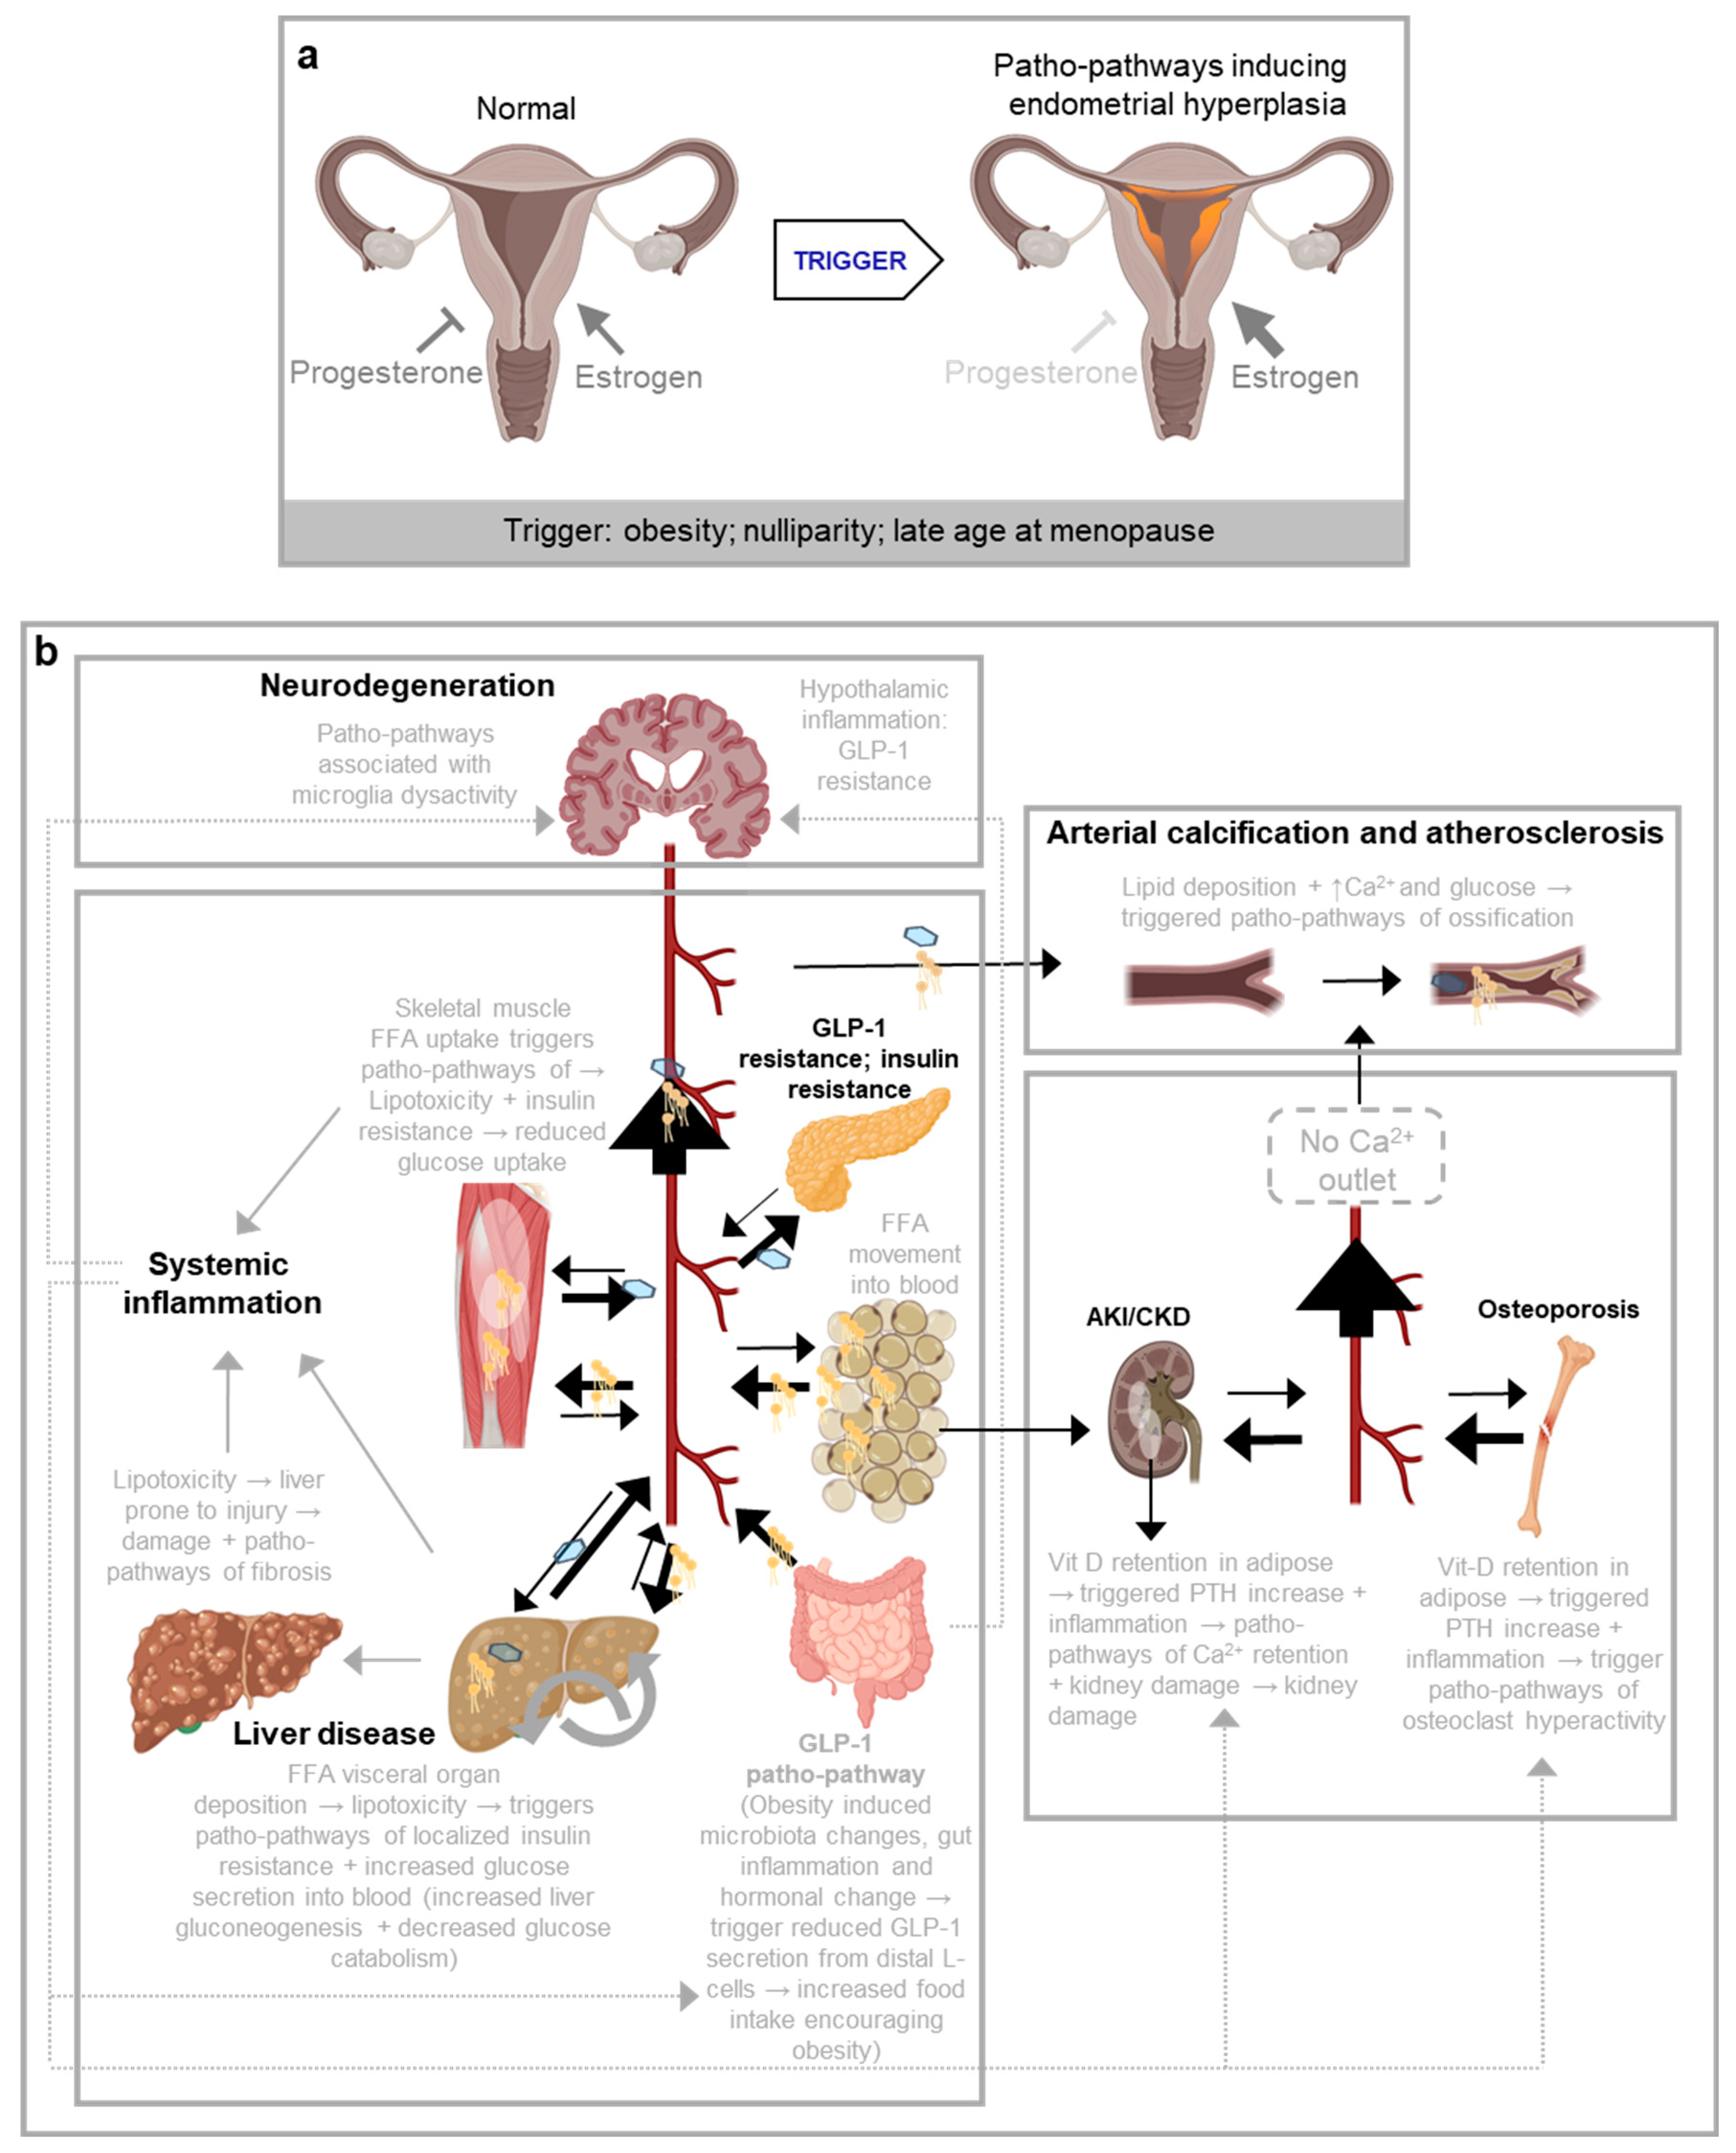
Figure 3.
Superimposing r-R0 maximisation and life history onto network constraint via use of trade-off functions. a, Linear trade-off function. Dots mark the option sets of all possible combinations of trade-off costs vs gain possible for the organism. The sloped line is the linear set of possible optimal trade-offs outcomes. Moving down the slope is a transition from low cost, low gain to high cost, high gain trade-offs. Sa: adult survival % (top of y axis representing 100% survival and bottom 0% survival); m: fecundity that increases as one moves along the x axis. b, Trade-off function shape can vary, from highly concave to highly convex. More complex trade-off function shapes are possible, e.g. with various curvatures and waves in lines. Where trade-off functions are concave, even low fecundity leads to high cost; where convex, high fecundity is possible with little cost. c-e, The trade-off that maximises fitness is that which intersects with the highest value fitness contour, marked X. Fitness contours link option sets of equal r or R0 based on the species life history strategy, i.e. fitness. Broadly, high juvenile survival (relative to adult survival) steepens the fitness contour slope (c.f. Figure 7). Also broadly, network constraint (via OTP interactions with secondary constraint) typically lead to more concave trade-offs in r-maximising species. .
At the molecular scale, this model can be adapted by plotting desirable biological activity on the X-axis and reciprocal patho-pathway activity on the Y-axis, illustrating how trade-offs manifest in specific biological processes. At the evolutionary scale, we retain the survival vs fecundity model, where patho-pathways often impose survival costs, while evolutionary benefits focus on maximizing reproduction. Costs to organismal function or reproduction are reflected along the X-axis.
In trade-off function plots (like Figure 3a), the shaded area indicates feasible survival and reproduction options open to the species. The line itself represents optimal trade-offs, where natural selection favours outcomes closest to the line; points below the line indicate higher costs for the same benefits.
Figure 3a illustrates a simple linear 1:1 trade-off between fecundity and survival, but different shapes, such as concave or convex curves, indicate varying trade-off dynamics. A concave curve implies even small increases in fecundity come with significant survival costs, while a convex curve suggests that substantial costs only appear with very high fecundity. In reality, trade-off shapes can vary widely (Figure 3b).
3.5. Network Constraint Determines Trade-off Function Shape
What determines the shape of the trade-off function, particularly regarding patho-pathways? According to the Blueprint Theory, the answer lies in network constraints arising from an organism's inability to simultaneously optimize all biological structures and functions, either within the same environment or across diverse ones. This results in intertwined traits that influence or constrain one another (Figure 4a,b).
More specifically, we can categorize network constraints into two types: primary and secondary. Primary constraints are the foundational links driving the trade-off, while secondary constraints affect the fitness-cost relationship. For example, when cycling on flat terrain, pedalling requires energy (x) for a given movement (y)—a trade-off caused by the primary constraint of pedalling being linked to movement. If you carry a heavy backpack, the need for a sturdier bike increases energy expenditure (x) to achieve the same movement (y), demonstrating how secondary constraints modify the trade-off relationship (Figure 4b).
In the context of patho-pathways, the primary constraint is the presence of a trigger. For instance, in conditions like osteoporosis and rheumatoid arthritis, osteoclasts—bone-remodelling cells are regulated by hormone and proinflammatory cytokines—can become dysregulated. External factors (like pathogens) or internal factors (such as menopause) that alter hormone and/or cytokine levels can trigger osteoclast dysactivity, leading to bone destruction(Kern et al., 2024a). This creates a trade-off: while cytokine/hormone-regulated osteoclast activity is beneficial, it heightens the risk of bone erosion and fractures when certain triggers are present.
Secondary constraints, such as those affecting bone density, further shape this trade-off. Bones must remain light enough for movement, limiting their density. If bone density were unrestricted, osteoclast dysactivity would cause minimal damage.
Variations in secondary constraints across species can lead to different cost-benefit relationships. For example, in birds, osteoporosis severity is influenced by calcium depletion from egg production and the need for light bones for flight—issues compounded in poultry bred for high egg production, and where risk of osteoporosis is high (Tompkins et al., 2023)
Ultimately, both primary and secondary constraints depend on the specific trade-off being examined. They are extensions of the network constraint concept, with secondary constraints often linked to their own trade-offs. Evolution navigates this intricate web of constraints and trade-offs to optimize fitness (Figure 4c).
4.2. Assigning Fitness Pay-offs and Identifying Optimal Strategy through Fitness Contour Mapping
How do reproductive strategies and the r-R₀ continuum fit into the equation—literally? The relative value of adult survival (vs juvenile survival), determine a species’ position on the r-R₀ continuum. This position helps define fitness in the context of “survival of the fittest” for that species. Fitness contour lines, which connect points of equal fitness based on this position—much like elevation lines on a map—can be superimposed onto the trade-off function, deriving the values of Sa (adult survival) and m (fecundity) from the corresponding r or R₀. The intersection of the highest fitness contour with the trade-off function marks the maximum achievable fitness or optimal trade-off point (OTP) (point X in Figure 3c-e; c.f. Figure 5 and Figure 6).
Figure 5.
Blueprint synthesis: the evolution of aging through trade-offs, patho-pathways, network constraint and life history strategy (r- vs R0 maximisation), hypothetical model. When the environment results in a scenario where juvenile survival is low (relative to adult survival), even at the limits of what evolution can mould network constraint, then R₀ as a strategy is preferable. Life limiting direct trade-offs are only observed at the extremes of the r-R₀ continuum. Patho-pathways predominantly drive aging in other species. Various continuums are linked to one another in this model. We can extend this to continuums that are observed in nature as detailed by (Finch, 1990), such as of rate of senescence and morality rate doubling time (MRDT) with age.
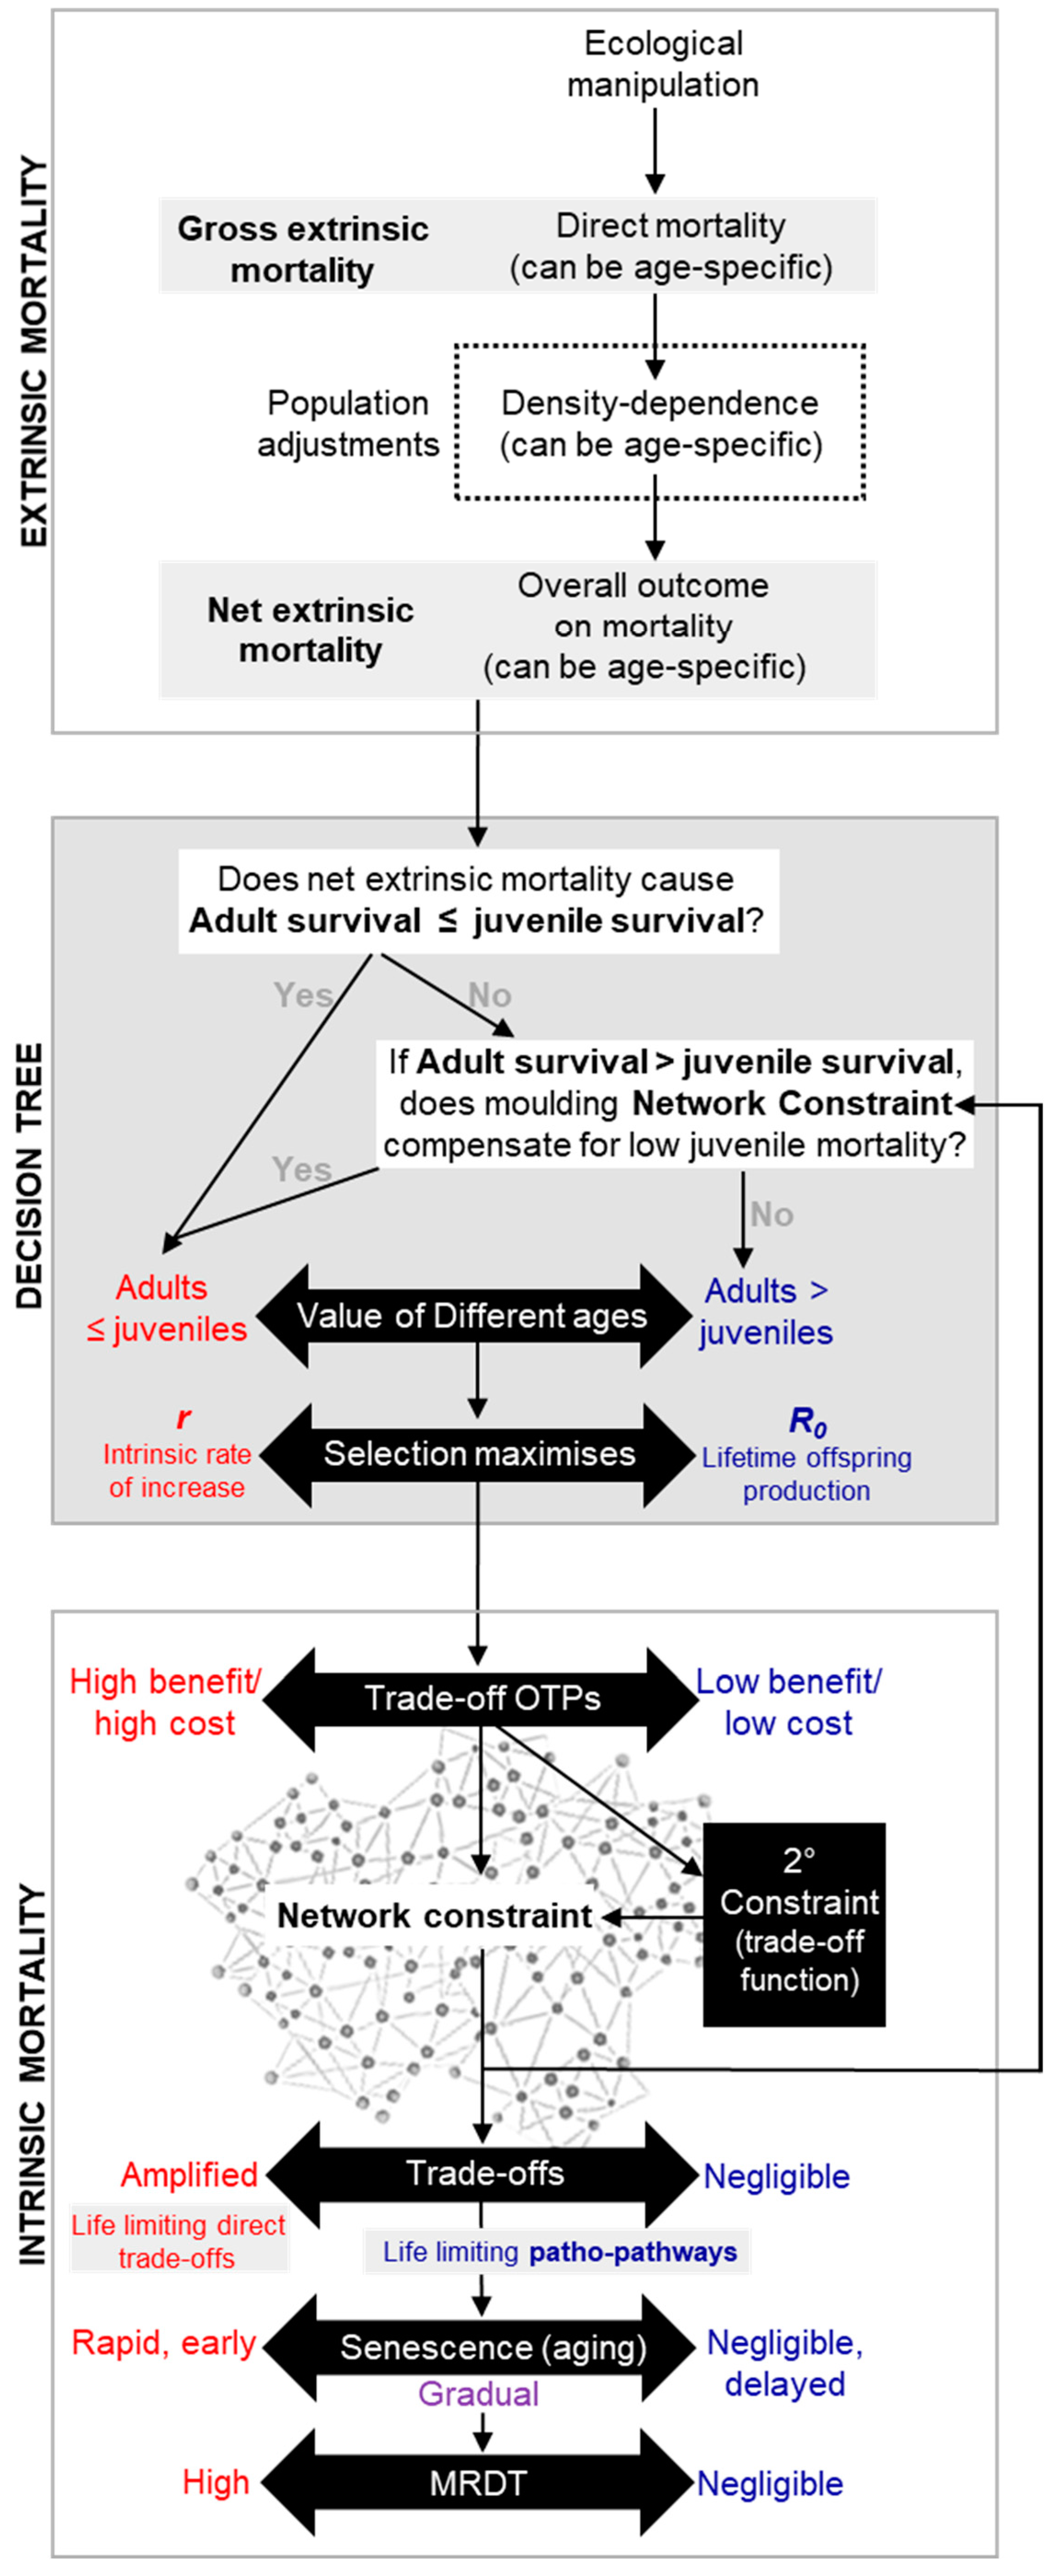
Figure 6.
Continuum of fitness contours based on an animal’s position on the r-R0 continuum. In theory, there is a point of intersection on this continuum, where either r or R0 can be used and give the same value.
Figure 6.
Continuum of fitness contours based on an animal’s position on the r-R0 continuum. In theory, there is a point of intersection on this continuum, where either r or R0 can be used and give the same value.
Previous research on fitness contours (Partridge and Sibly, 1991; Sibly and Calow, 1983) erroneously employed the Malthusian parameter (r) as the sole measure of fitness. This view is based on the misconception that r-maximisation is optimal strategy even in in density-dependent populations because it is “equivalent to maximizing the carrying capacity of the environment”(Sibly and Calow, 1983). However, it neglects scenarios where extrinsic mortality disproportionately lowers juvenile survival; as well as scenarios where density-dependence is age-specific, favouring adult survival over juvenile survival, as seen in Soay sheep. Additionally, use of fitness contours were primarily restricted to explaining the extreme reproductive mode of semelparity, where organisms have a single, life-limiting reproductive episode, like Pacific salmon–rather than capturing wider patterns of aging in nature. Our new framework aims to provide a more universal model for understanding aging across and within species.
Regarding the chicken-and-egg dilemma, adjusting the OTP for one trade-off (e.g., trade-off A) can affect the cost-benefit relationships of other trade-offs (e.g., trade-offs B and C) due to secondary network constraints. Here, trade-off A acts as a secondary constraint on B and C. Natural selection likely shapes these trade-offs by adjusting network constraints—mainly through OTP positioning and considering extrinsic mortality and density-dependent factors. As a simple summary of the overall calculation evolution likely makes: when the environment results in a scenario where juvenile survival is low (relative to adult survival), even at the limits of what evolution can mould network constraint, then R₀ as a strategy is preferable. As such, all AP trade-off OTPs are adjusted (while minimising sever concave trade-offs) to produce a final outcome that defines the species position on the r-R₀ continuum.
In short, the chicken and the egg co-evolved (Figure 5).
Traditional r/K theory has largely been dismissed for its inability to account for the diverse life histories observed in nature, like the sea turtle example. Sea turtles exhibit r traits, such as laying many eggs without parental care, yet possess R₀ traits, with large, long-lived adults. They don’t fit neatly along a single r/K, or r-R₀, continuum. Our model offers an explanation for mixed traits: it places sea turtles closer to the r end of the r-R₀ continuum and posits a lack of severe concave trade-offs (due to limited network constraint) that would limit longevity, allowing for continued growth that will further increase reproductive output.
An important insight from incorporating network constraints into the model is the need to be careful when distinguishing between r and R₀-selected traits. In all cases, selection favours rapid maturity, development, and reproduction, along with maximizing lifetime offspring, delayed aging, and larger size (to evade predation). The key differences arise from trade-offs: r-selected species prioritize traits that enable early and large reproduction, even at the cost of future function or survival, which explains their smaller overall size (Figure 4c).
Although a reductionist approach to understanding the complexity of life histories in nature, our model has depth of explanatory power. For instance, plasticity of strategy will likely arise where multiple OTPs exist for the same trade-off. In cases where single extreme concave trade-offs exist and cause a significant competitive disadvantage, evolution may uncouple trade-off costs from benefits by elevating them to higher organizational levels, such as the reproductive versus foraging trade-offs seen in eusocial species like bees; queens reproduce, workers are short lived and forage.
5. Adding a Temporal Dimension: Chronology of Aging Mechanism Presentation
5.1. Incorporating the Axis of Time to Our New Unified Framework
The final axis to incorporate into our model is time, particularly for understanding trade-offs with a lag between costs and benefits. How do delayed trade-off costs influence a species' position on the r-R₀ continuum, and associated fitness contours? What determines the duration of the lag in AP trade-offs?
The answer to the first question lies in when costs manifest in the life history and their impact on adult versus juvenile survival and reproductive potential. Delayed costs resemble age-dependent extrinsic mortality in adults: they minimally affect species near the r-end of the continuum, while pushing R₀ species closer to the r-end.
To answer the second question, the Blueprint Theory shows that the timing of pathology costs via patho-pathways is determined by when the trigger occurs. In some cases, multiple triggers are involved—some don’t cause immediate damage but prime tissues, so that when a second trigger appears, it initiates destruction (Figure 7). This is analogous to a fire, where both fuel (the priming trigger) and a spark (the spark trigger) are required. For example, in chronic obstructive pulmonary disease (COPD), inflammageing disrupts neutrophil migration capabilities through patho-pathways associated with phosphoinositide 3-kinase (PI3K) signalling. This priming induces minimal harm until an infection occurs, acting as a ‘spark trigger’, and causing neutrophil dysactivity, where neutrophils aggressively digest and destroy healthy lung tissue (Kern et al., 2024a).
Figure 7.
Timing of aging presentation. Disease onset may be dependent on the convergence of multiple patho-pathway triggers. Some triggers may not directly induce pathology, and rather only prime cells, tissue and systems. Other triggers then act to kick-start destruction once the tissue is primed. As an analogy, for a fire you need both the spark, i.e. kick-starting trigger, and fuel, i.e. priming.
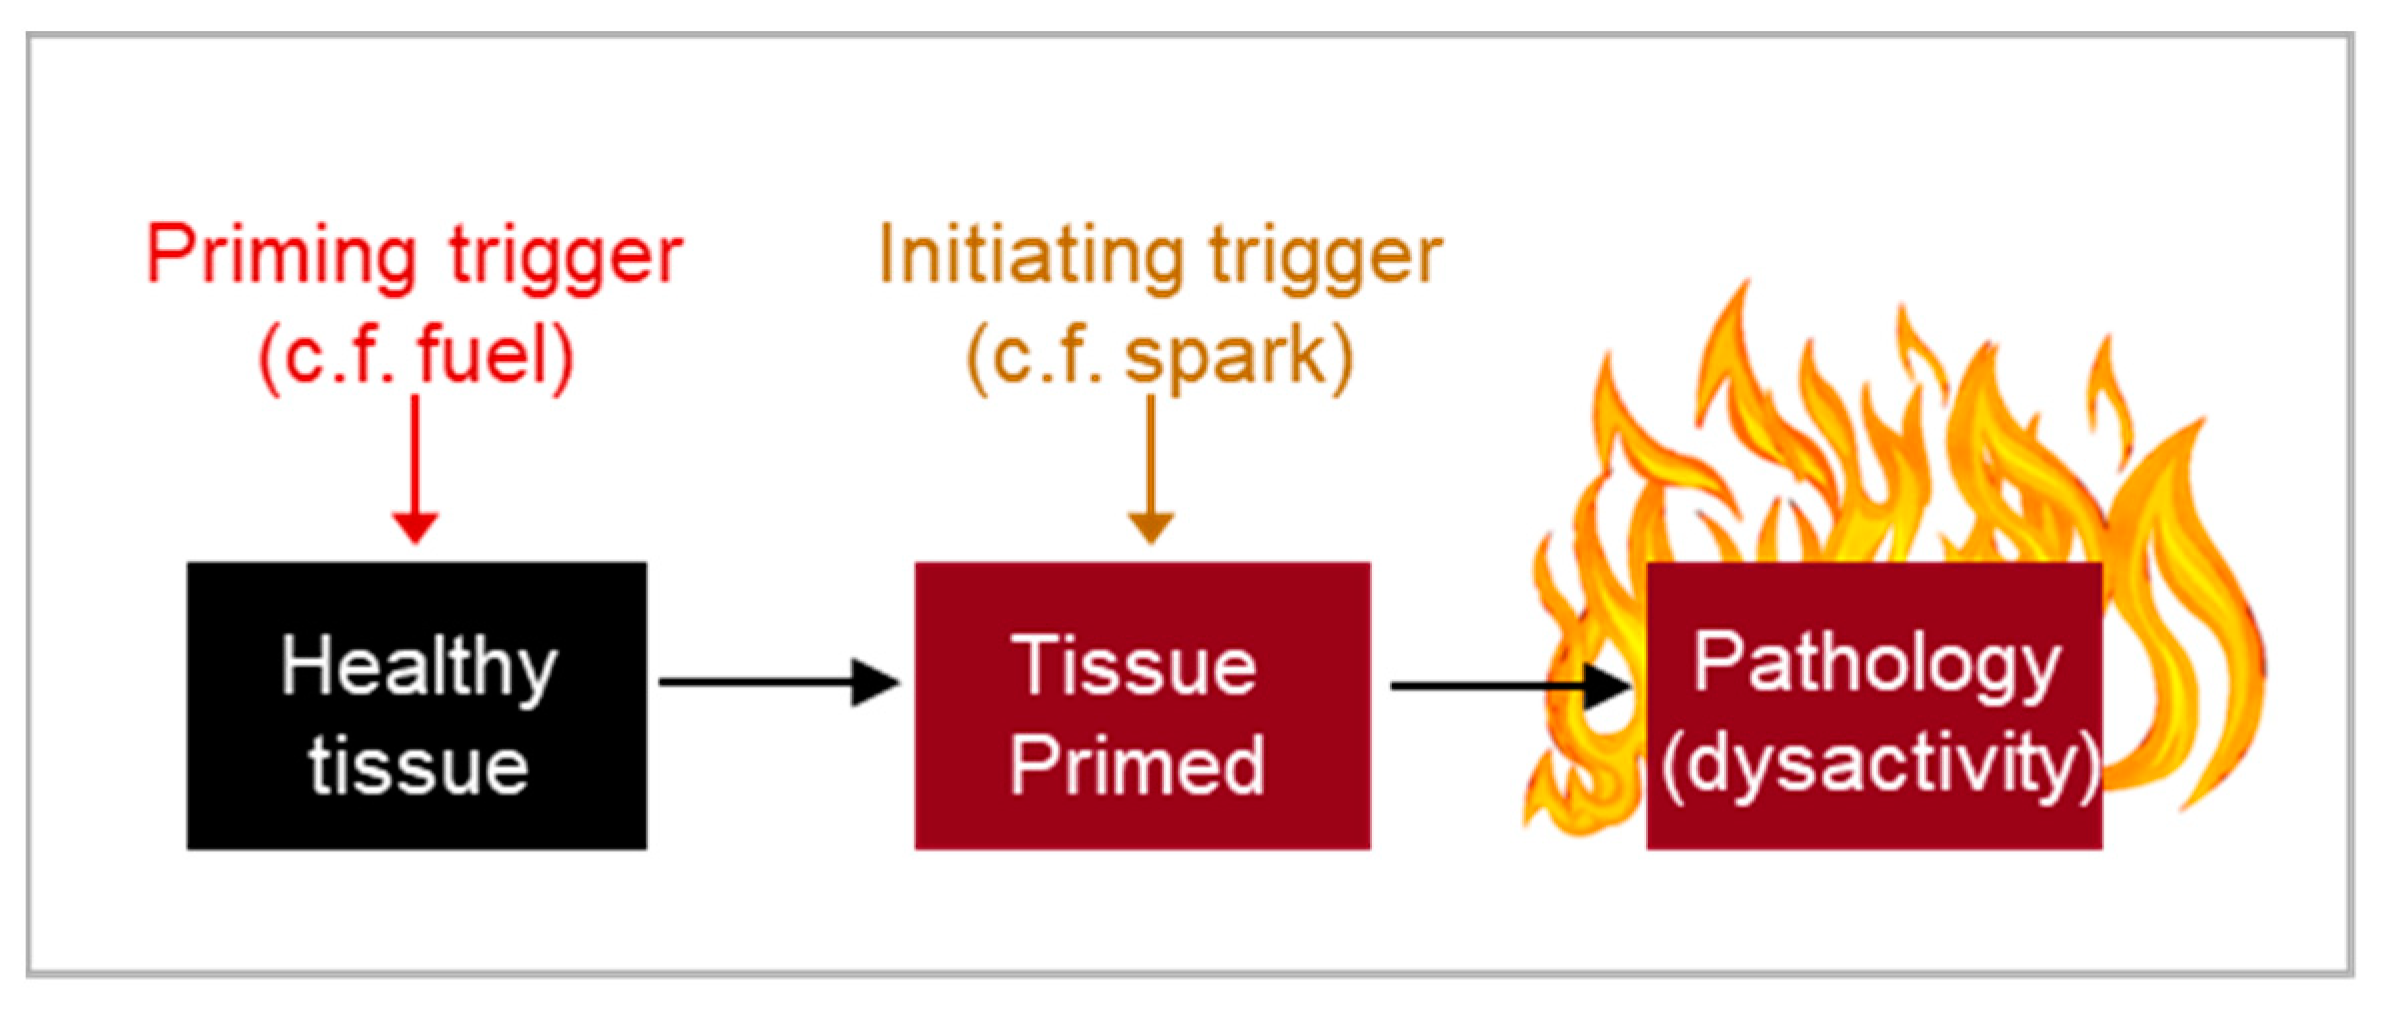
This demonstrates that delayed costs can result from the requirement of multiple triggers to drive pathology, where the initial trigger serves as the primary constraint and priming triggers act as secondary constraints that shape the trade-off function. Without secondary constraints, a species could achieve close to maximum benefits with minimal costs.
Thus, the timing of cost emergence is shaped by both primary and secondary constraints, with certain patho-pathway triggers only emerging at specific life stages. To give a flavour of the complexity at hand, changing the optimal trade-off point (OTP) can affect not only the magnitude of trade-off costs (both directly and indirectly, as one trade-off can act as a secondary constraint on another), but also when they arise. For example, upregulating growth pathways like Insulin/IGF-1 signalling (IIS) or mechanistic Target of Rapamycin (mTOR) can accelerate growth but may also increase the risk of earlier onset of related patho-pathways by lowering the number of triggers needed to initiate the cost. This goes towards explaining the earlier aging observed in progeroid conditions like acromegaly (Kern et al., 2024a) and the plasticity of aging seen in certain simpler laboratory models, but not in larger animals, when growth pathways are inhibited (Ayyadevara et al., 2008; Mattison et al., 2017).
Why should some patho-pathway triggers only emerging alter in life, especially intrinsic triggers? There are three possible evolutionary explanations for this delay(Kern et al., 2024a). These are often difficult to distinguish, but the menopause serves as an illustrative case:
- AP Trade-Off: Menopause may have evolved due to selective advantages, such as the "grandmother hypothesis." Evolution would then have worked on network constraints to balance the timing of benefits vs costs.
- Constraint: This could be independent of trade-offs, where it’s biologically impossible to produce traits like an indefinite reproductive span (Acerenza, 2016), so evolution works to push it as far out into the life history as possible.
- Evolutionary Artefact: This might occur when one trait like increased human lifespan changes with evolution, but there has not been enough time for selection pressure to have a reciprocal effect on other traits like reproductive span; or the purely deleterious trait (here menopause) appears during a "selection shadow," when natural selection is weak (cf. MA theory).
This framework helps explain how the timing of aging mechanisms, including pathology costs, can be shaped by evolutionary pressures and network constraints.
5.2. Evolutionary Matryoshka (Nested Doll): Interconnected Mechanisms of Aging, AP and MA
Broadly, two types of antagonistic pleiotropy (AP) trade-offs can be identified. First, direct trade-offs between traits, such as Pacific salmon using up energy reserves like muscle to swim upstream for spawning (Acerenza, 2016; Partridge & Sibly, 1991). These trade-offs arise early in life and are more pronounced and life limiting as one nears the r-end of the r-R0 continuum. In large animals, life-limiting direct trade-offs is more the exception than the norm. For example, in Pacific salmon (unlike Atlantic salmon), it is the unique need to swim upstream that drives the trade-off: the energy cost of swimming upstream to spawn is so high that laying even a single egg is extremely costly, while additional eggs come at a much lower cost, resulting in a steep concave trade-off. Extreme ecological pressures may also force direct trade-offs, e.g. sickle cell anaemia is the consequence of such a trade-off between the ability of red blood cells to transport oxygen vs be infected by malaria causing Plasmodium.
Second, in species falling outside the extreme r-end of the r-R0 continuum, like humans, patho-pathway AP trade-offs are more likely to drive aging, as evidenced by numerous human age-related diseases (Kern et al., 2024a).
Two evolutionary links likely exist between direct trade-offs and patho-pathway trade-offs (Figure 8): (i) Links via network constraint. Even in R0-maximising species, milder costs of direct trade-offs between traits may act as secondary constraints of patho-pathway trade-offs; (ii) Direct trade-offs between traits, as intrinsic causes of mortality, influence adult and juvenile survival and so reproductive strategy.
Moving to other mechanisms, all AP trade-offs, by acting as intrinsic causes of mortality will casting an earlier selection shadow (directly and via affecting reproductive strategy). This promotes the evolution of other aging mechanisms, such as MA, that emerge as a consequence of attenuated late life selection pressures (Figure 8).
6. Delving Further into Constraint: “Aging” Stems from a Restriction of the Phenotype Space
One notable attempt to categorize biological constraints is that of Luis Acerenza in 2016, building on Richard Lewontin’s concept of genotype and phenotype maps that link genotypes to phenotypes (Acerenza, 2016). The average genotype of a population can be viewed as a point in the space of all possible genotypes (G space), and the average phenotype of the same population as a corresponding point in the space of all possible phenotypes (P space). From this, two main forms of constraints emerge:
- (i)
- Organisational constraints limit the P space by preventing the production of certain phenotypes.
- (ii)
- Selection constraints, on the other hand, do not limit the P space (i.e. do not affect which phenotypes are accessible). Selection constraints only limit the presentation of phenotypes within the accessible P space by eliminating certain phenotypes due to selection pressures. As an example, males of the Central American túngara frog Engystomops pustulosus croak to attract females, but doing this is restricted as croaking also attracts a predator, the fringe-lipped bat Trachops cirrhosis (Tuttle and Ryan, 1981).
This is a binary scheme: either the P space is limited or not; mixed models are not feasible. Acerenza further divides organizational constraints into interconnection constraints, where traits are biologically interconnected, and impossibility constraints (Figure 9a), where a phenotype is simply unachievable. An example of interconnection constraint, consider interlinked traits supporting lactation as discussed earlier. Here calcium is transferred from bone to milk, weakening the bones; at face value, it is not possible to produce the simultaneous phenotypes of calcium rich milk and strong bone during lactation due to the interconnected nature of traits. An example of an impossibility constraint is the absence of an enzyme that can catalyze the synthesis of n-butanol from ethanol, despite the reaction being energy-efficient. This is likely because the limited biological mechanisms available for enzyme catalysis make such a conversion evolutionarily unfeasible (i.e. we lack the evolutionary toolbox to do this (Acerenza, 2016)).
Network constraint encompasses all forms of constraints, but which predominates in driving aging? Our new model revises Acerenza’s framework, particularly regarding interconnection constraint. Our new concept of secondary constraint suggests that trade-off functions are shaped, less so by the inability to produce a phenotype, but by selection pressures that influence the expression of phenotypes, i.e. the P space is not necessarily limited. It is only the expression of phenotypes within that accessible space that is restricted. In fact, interconnection constraints are often a type of selection constraint (Figure 9a).
This can even be seen in the example of lactational pathways and patho-pathways surrounding bone loss. Viewed in isolation to other traits and without the context of network constraint, the trade-off between producing calcium-rich milk and maintaining strong bones seems like an organizational constraint. However, when considering the broader evolution of traits, all phenotypes are theoretically attainable—if the secondary constraint of maintaining thin bones for locomotion was removed. Yet removing the secondary constraint would come at the cost of reduced mobility, leading to higher predation risk and diminished ability to mate, forage, and/or hunt (Figure 4, 9b). As detailed earlier, this same secondary constraint of thin bones for locomotion is at play in bone loss disorders seen in later life when other constraints in the form of patho-pathway triggers are present. For example, inflammation triggers patho-pathways of osteoclast dysactivity that cause pathological bone resorption and fracture risk; bone loss during osteoporosis and rheumatoid arthritis would be less deleterious if bones were thicker. Here, interconnection constraint of the selection type (not organisational type) prevents the expression of certain phenotypes due to the intertwined nature of traits and the presence of secondary constraints (e.g., as shaped by the r-R0 continuum). In other words, ageing, through costs of trade-offs (especially via patho-pathways), in many cases is a feature of restricted phenotype expression (not a limited P space). And as such opportunity for intervention into aging using therapeutics is attainable in many causes by simply working within the already accessible phenotype space.
7. Conclusions
A central goal of biogerontology is to integrate life history strategy, and evolutionary and mechanistic causes of aging into a cohesive framework. A unified theory would elucidate aging within and across species. The recently proposed Blueprint Theory (Kern et al., 2024a) emphasizes that the absence of such a theory has hindered our understanding and treatment of age-related diseases. This theory, supported by empirical evidence and testable hypotheses, has already led to the identification of a potential new class of drugs (Kern et al., 2024b). Here, we position Blueprint Theory within the broader context of life history theory to create a comprehensive understanding of aging: the Blueprint Synthesis.
Network constraint—stemming from the complex interactions of biological pathways within organisms—gives rise to antagonistic pleiotropy (AP) trade-offs, where the cost is unavoidable out of context triggering of biological pathways, termed patho-pathways. Patho-pathways induce unwanted cellular activity (dysactivity) and consequently age-related pathology. Triggers of patho-pathways include both extrinsic factors, like infections, damage and injury, and intrinsic constraints. Based on the environment a species finds itself in, evolution works simultaneously on network constraint and reproductive strategy to optimise the level and timing of trade-off benefits that is selected for (and so what reciprocal cost the organism has to contend with), based on the dilemma of maximizing current reproduction versus investing in future success. This strategy exists along a continuum from r to R0. When adult survival exceeds juvenile survival, even at the limits of the various options evolution has to alter network constraint, R0 becomes the optimal strategy, enabling species to outcompete its rivals.
Previous models, like the r/K model, faltered because they couldn't account for the diversity of life histories. By combining network constraints with reproductive strategies, we demonstrate how contrasting traits can evolve and how variations in aging mechanisms may stem from differences in magnitude or prevalence of mechanisms. Ultimately, our framework underscores the complexity of the calculations at the heart of evolution, revealing even how seemingly unrelated aging mechanisms, such as AP and mutation accumulation (MA), may share deeper evolutionary connections, akin to a nested Russian doll model.
References
- Acerenza, L. Constraints, Trade-offs and the Currency of Fitness. J Mol Evol 2016, 82, 117–127. [Google Scholar] [CrossRef] [PubMed]
- Ayyadevara, S., Alla, R., Thaden, J.J. and Shmookler Reis, R.J. Remarkable longevity and stress resistance of nematode PI3K-null mutants. Aging Cell. 2008, 7, 13–22. [Google Scholar] [CrossRef] [PubMed]
- Coulson, T., Catchpole, E.A., Albon, S.D., Morgan, B.J., Pemberton, J.M., Clutton-Brock, T.H., Crawley, M.J. and Grenfell, B.T. Age, sex, density, winter weather, and population crashes in Soay sheep. Science 2001, 292, 1528–1531. [Google Scholar] [CrossRef] [PubMed]
- Dańko, M.J., Burger, O., Argasiński, K. and Kozłowski, J. Extrinsic mortality can shape life-history traits, including senescence. Evol. Biol. 2018, 45, 395–404. [Google Scholar] [CrossRef] [PubMed]
- Dańko, M.J., Burger, O. and Kozłowski, J. Density-dependence interacts with extrinsic mortality in shaping life histories. PLoS ONE 2017, 12, e0186661. [Google Scholar] [CrossRef] [PubMed]
- Day, T. and Abrams, P.A. Density dependence, senescence, and Williams’ hypothesis. Trends in ecology & evolution 2020, 35, 300–302. [Google Scholar]
- Finch, C.E., 1990. Longevity, Senescence and the Genome, University of Chicago Press, Chicago and London.
- Hamilton, W.D. The moulding of senescence by natural selection. J Theor Biol. 1966, 12, 12–45. [Google Scholar] [CrossRef] [PubMed]
- Hughes, K.A. and Reynolds, R.M. Evolutionary and mechanistic theories of aging. Annu Rev Entomol. 2005, 50, 421–45. [Google Scholar] [CrossRef] [PubMed]
- Kern, C., Faragher, R., Bonventre, J., Woods, T., Jenkins, A. and Stebbing, J., 2024a. Uncovering the Blueprint of Ageing: The Aetiology of Age-Related Disease, Preprints. Preprints.
- Kern, C.C., Justin, A.W., Davis, B., Faragher, R., Peterson, J., Roch, A., Anstett, V., Denney, S., Grzesiak, N., Winfield, I., Cronk, D., Winfield, N., Brandenberg, N., Stebbing, J. and Bonventre, J., 2024b. Anti-necrosis agents as a new class of drugs. In preperation.
- MacArthur, R.H. and Wilson, E.O., 1967. Monographs in Population Biology. vol. 1. Princeton University Press. The theory of island biogeography.
- Mattison, J.A., Colman, R.J., Beasley, T.M., Allison, D.B., Kemnitz, J.W., Roth, G.S., Ingram, D.K., Weindruch, R., de Cabo, R. and Anderson, R.M. Caloric restriction improves health and survival of rhesus monkeys. Nat Commun 2017, 8, 14063. [Google Scholar] [CrossRef] [PubMed]
- Medawar, P.B., 1952. An unsolved problem of biology.
- Moorad, J., Promislow, D. and Silvertown, J. Evolutionary Ecology of Senescence and a Reassessment of Williams' 'Extrinsic Mortality' Hypothesis. Trends in ecology & evolution 2019, 34, 519–530. [Google Scholar]
- Moorad, J., Promislow, D. and Silvertown, J., 2020. George C. Williams’ Problematic Model of Selection and Senescence: Time to Move on. Trends in Ecology & Evolution. 35, 303-305.
- Moorad, J.A. and Promislow, D.E. What can genetic variation tell us about the evolution of senescence. Proc Biol Sci. 2009, 276, 2271–2278. [Google Scholar]
- Partridge, L. and Sibly, R. Constraints in the evolution of life histories. Phil. Trans. Roy. Soc. Lond. B. 1991, 332, 3–13. [Google Scholar] [CrossRef]
- Reznick, D., Bryant, M.J. and Bashey, F. r- and K-selection revisited: the role of population regulation in life-history evolution. Ecology 2002, 83, 1509–1520. [Google Scholar] [CrossRef]
- Sibly, R. and Calow, P. An integrated approach to life-cycle evolution using selective landscapes. Journal of Theoretical Biology 1983, 102, 527–547. [Google Scholar] [CrossRef]
- Stearns, S.C. The evolution of life history traits: a critique of the theory and a review of the data. Annual review of ecology and systematics 1977, 8, 145–171. [Google Scholar] [CrossRef]
- Tompkins, Y.H., Choi, J., Teng, P.Y., Yamada, M., Sugiyama, T. and Kim, W.K. Reduced bone formation and increased bone resorption drive bone loss in Eimeria infected broilers. Sci Rep. 2023, 13, 616. [Google Scholar] [CrossRef] [PubMed]
- Tuttle, M.D. and Ryan, M.J. Bat predation and the evolution of frog vocalizations in the neotropics. Science 1981, 214, 677–678. [Google Scholar] [CrossRef] [PubMed]
- Williams, G.C. Pleiotropy, natural selection and the evolution of senescence. Evolution 1957, 11, 398–411. [Google Scholar] [CrossRef]
Figure 4.
Network constraint and its influence on trade-offs cost-benefit relationships and r- vs R0 traits. a, Various relationships are feasible in terms of how different traits are linked to one another. This is visualised by illustrating up to 4 traits that are linked to one another. Regarding network constraint, the number of interacting traits is anticipated to be significantly large and complex, which in turn gives rise to complex trade-off functions. b, Primary and secondary constraint. The definitions of primary and secondary constraint are dependent on the trade-off in question being examined. Secondary constraints affect the trade-off function shape, and are often associated with their own trade-offs. c, r- vs R0 maximisation influences Optimal Trade-off Points (OTPs) (c.f. fitness contours in Figure 2 and Figure 5), which in turn affects trade-off function shape through secondary constraint. The interaction between life r- vs R0 maximisation strategy and network constraint is ultimately what defines the traits characteristic of a particular species. .
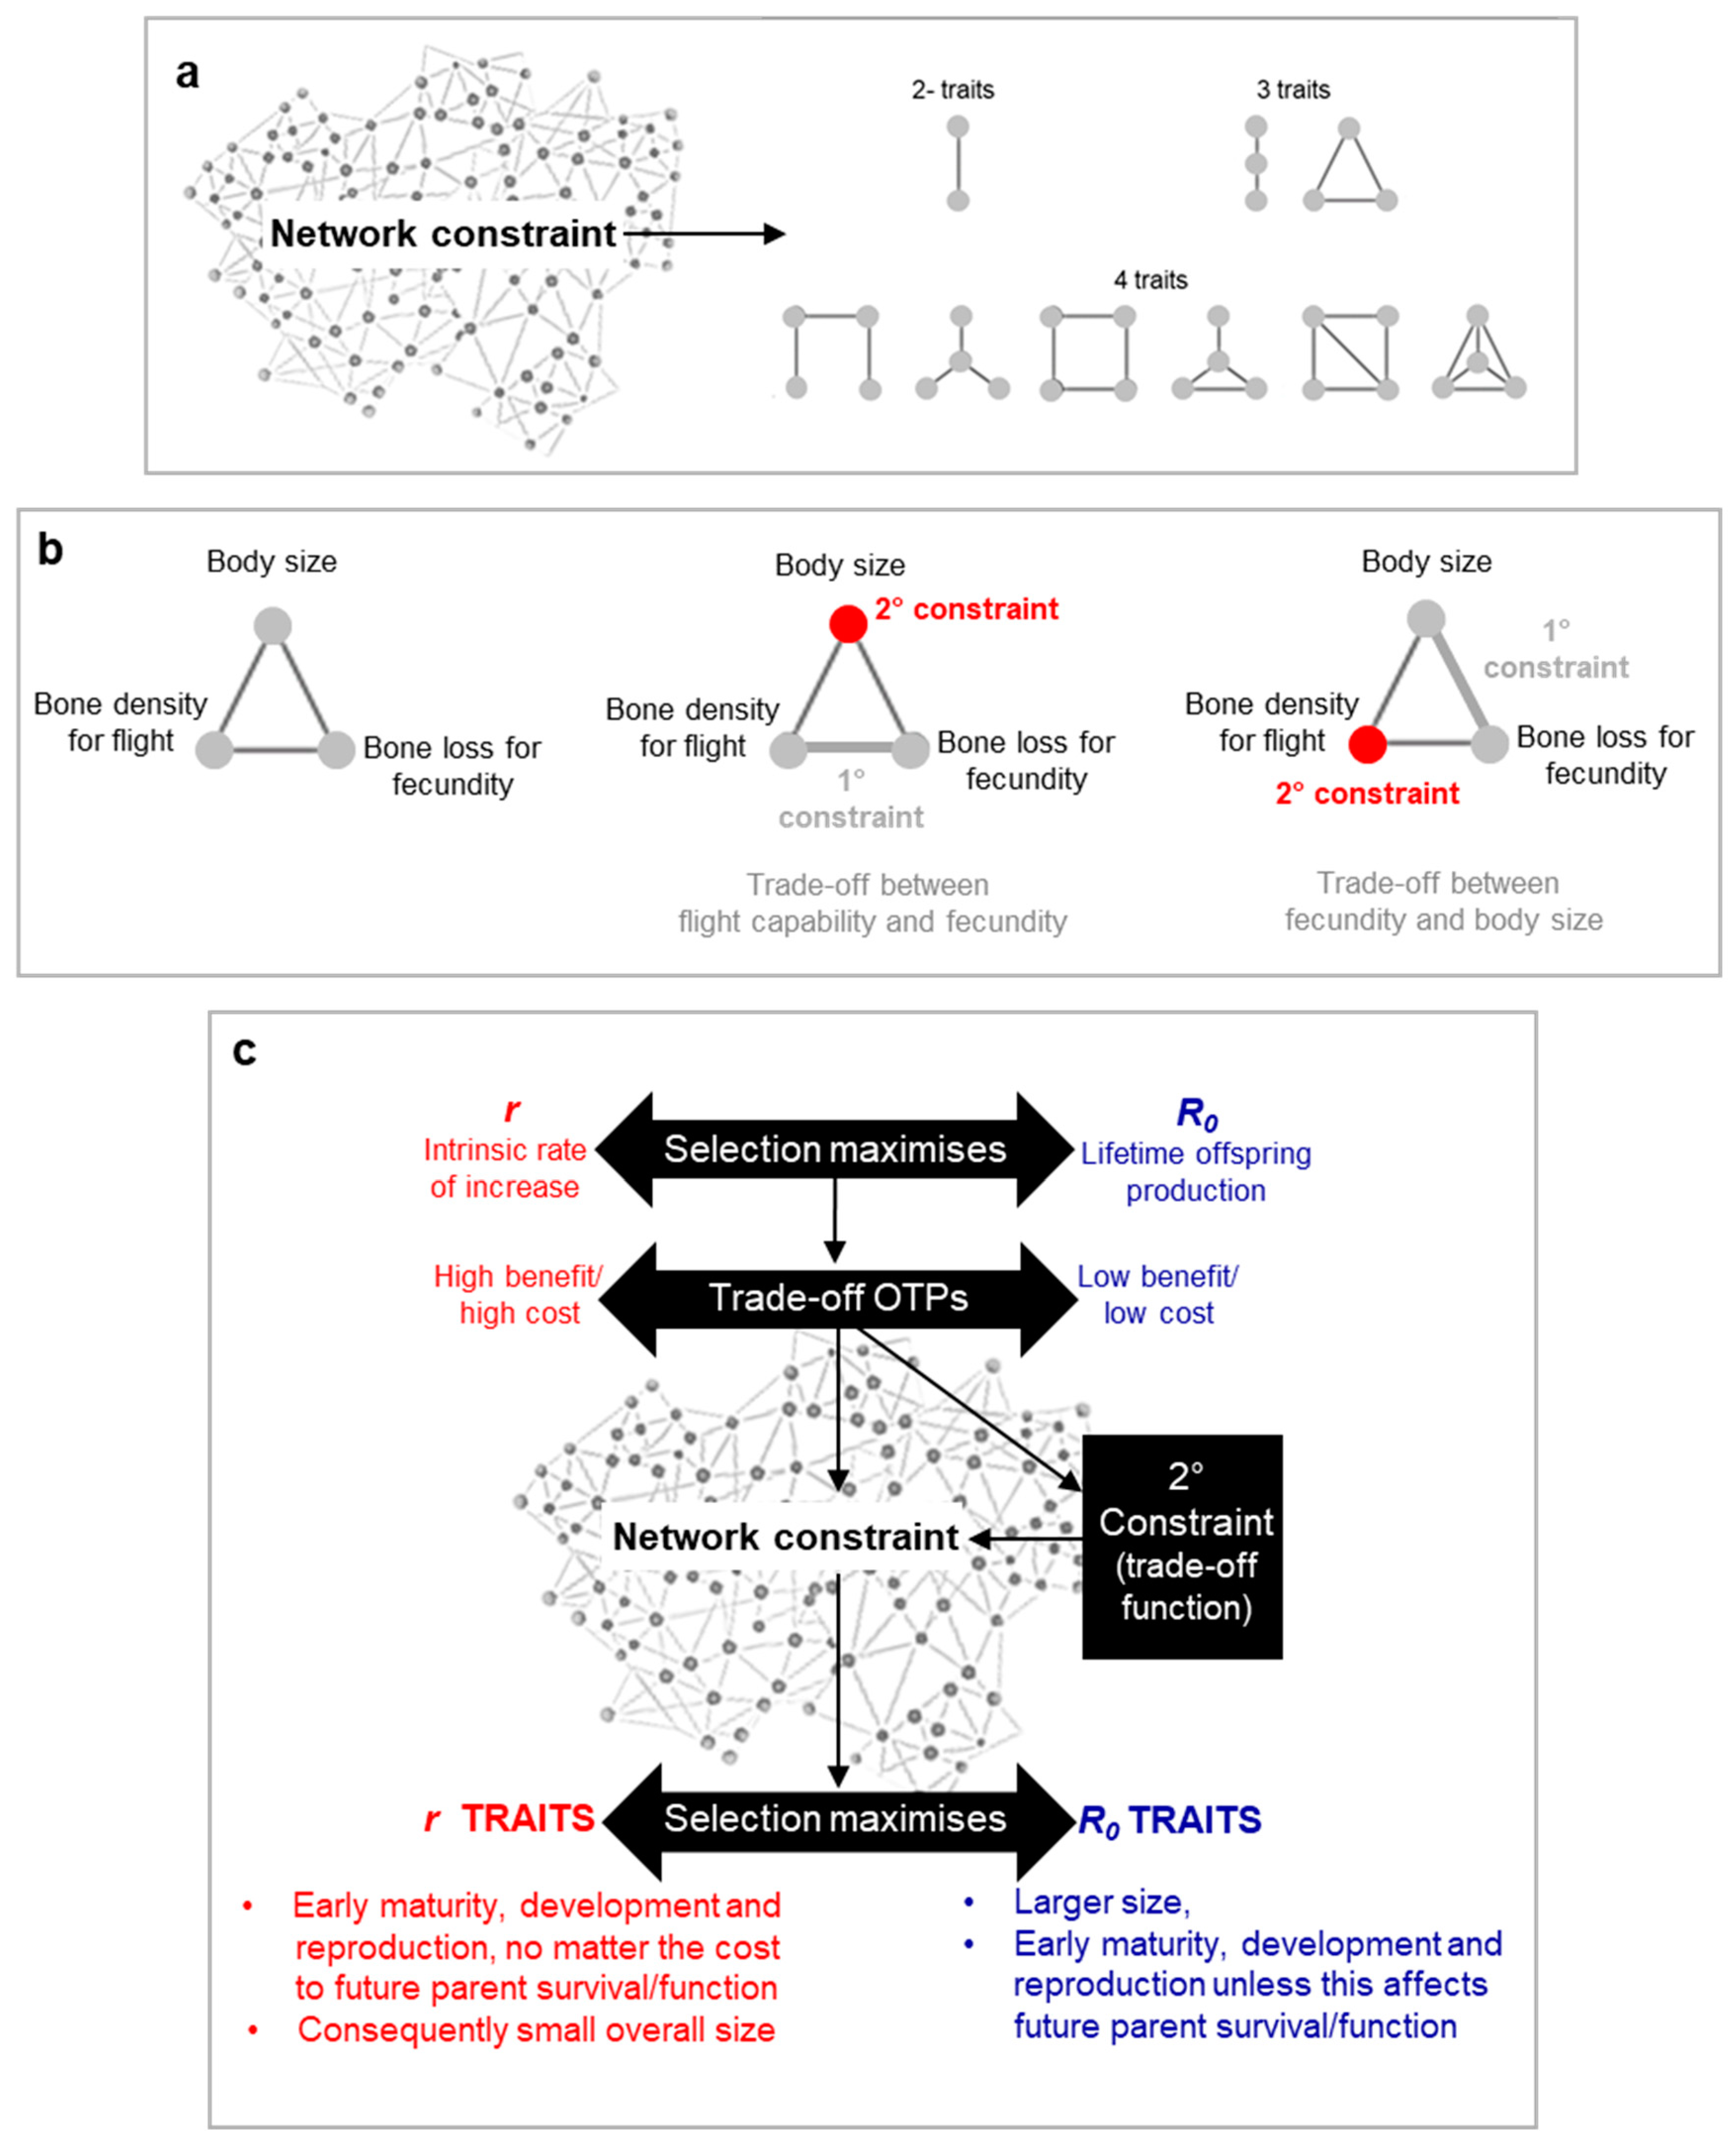
Figure 8.
Evolutionary Matryoshka (Nested Doll): Interconnected mechanisms of aging. Order in which various mechanisms work to influence ageing and one another through effects on the force of selection. Earlier arising mechanisms arise due to network constraint that forces trade-offs between traits. The costs of these trade-offs is aging. In the extremes of r-maximising species (such as those that undergo reproductive death) direct trade-offs between traits is typically life limiting (or in extreme environments, c.f. sickle cell anaemia example). In other species, patho-pathways and cascades of patho-pathways likely drives aging. Notably, senescent mechanisms, by affecting function and/or survival of adults (either directly or via increasing susceptibility to extrinsic mortality) will deepen the decline in selection (c.f. Figure 1) and so increase early presentation of mechanisms of aging dependent on this decline. Additionally, earlier senescent mechanisms may act as triggers or secondary constraints of later acting patho-pathways. For example, sickle cell increases risk of earlier kidney disease via triggering earlier patho-pathways associated fibrosis and a pro-inflammatory infiltrate amongst others (Kern et al., 2024a).
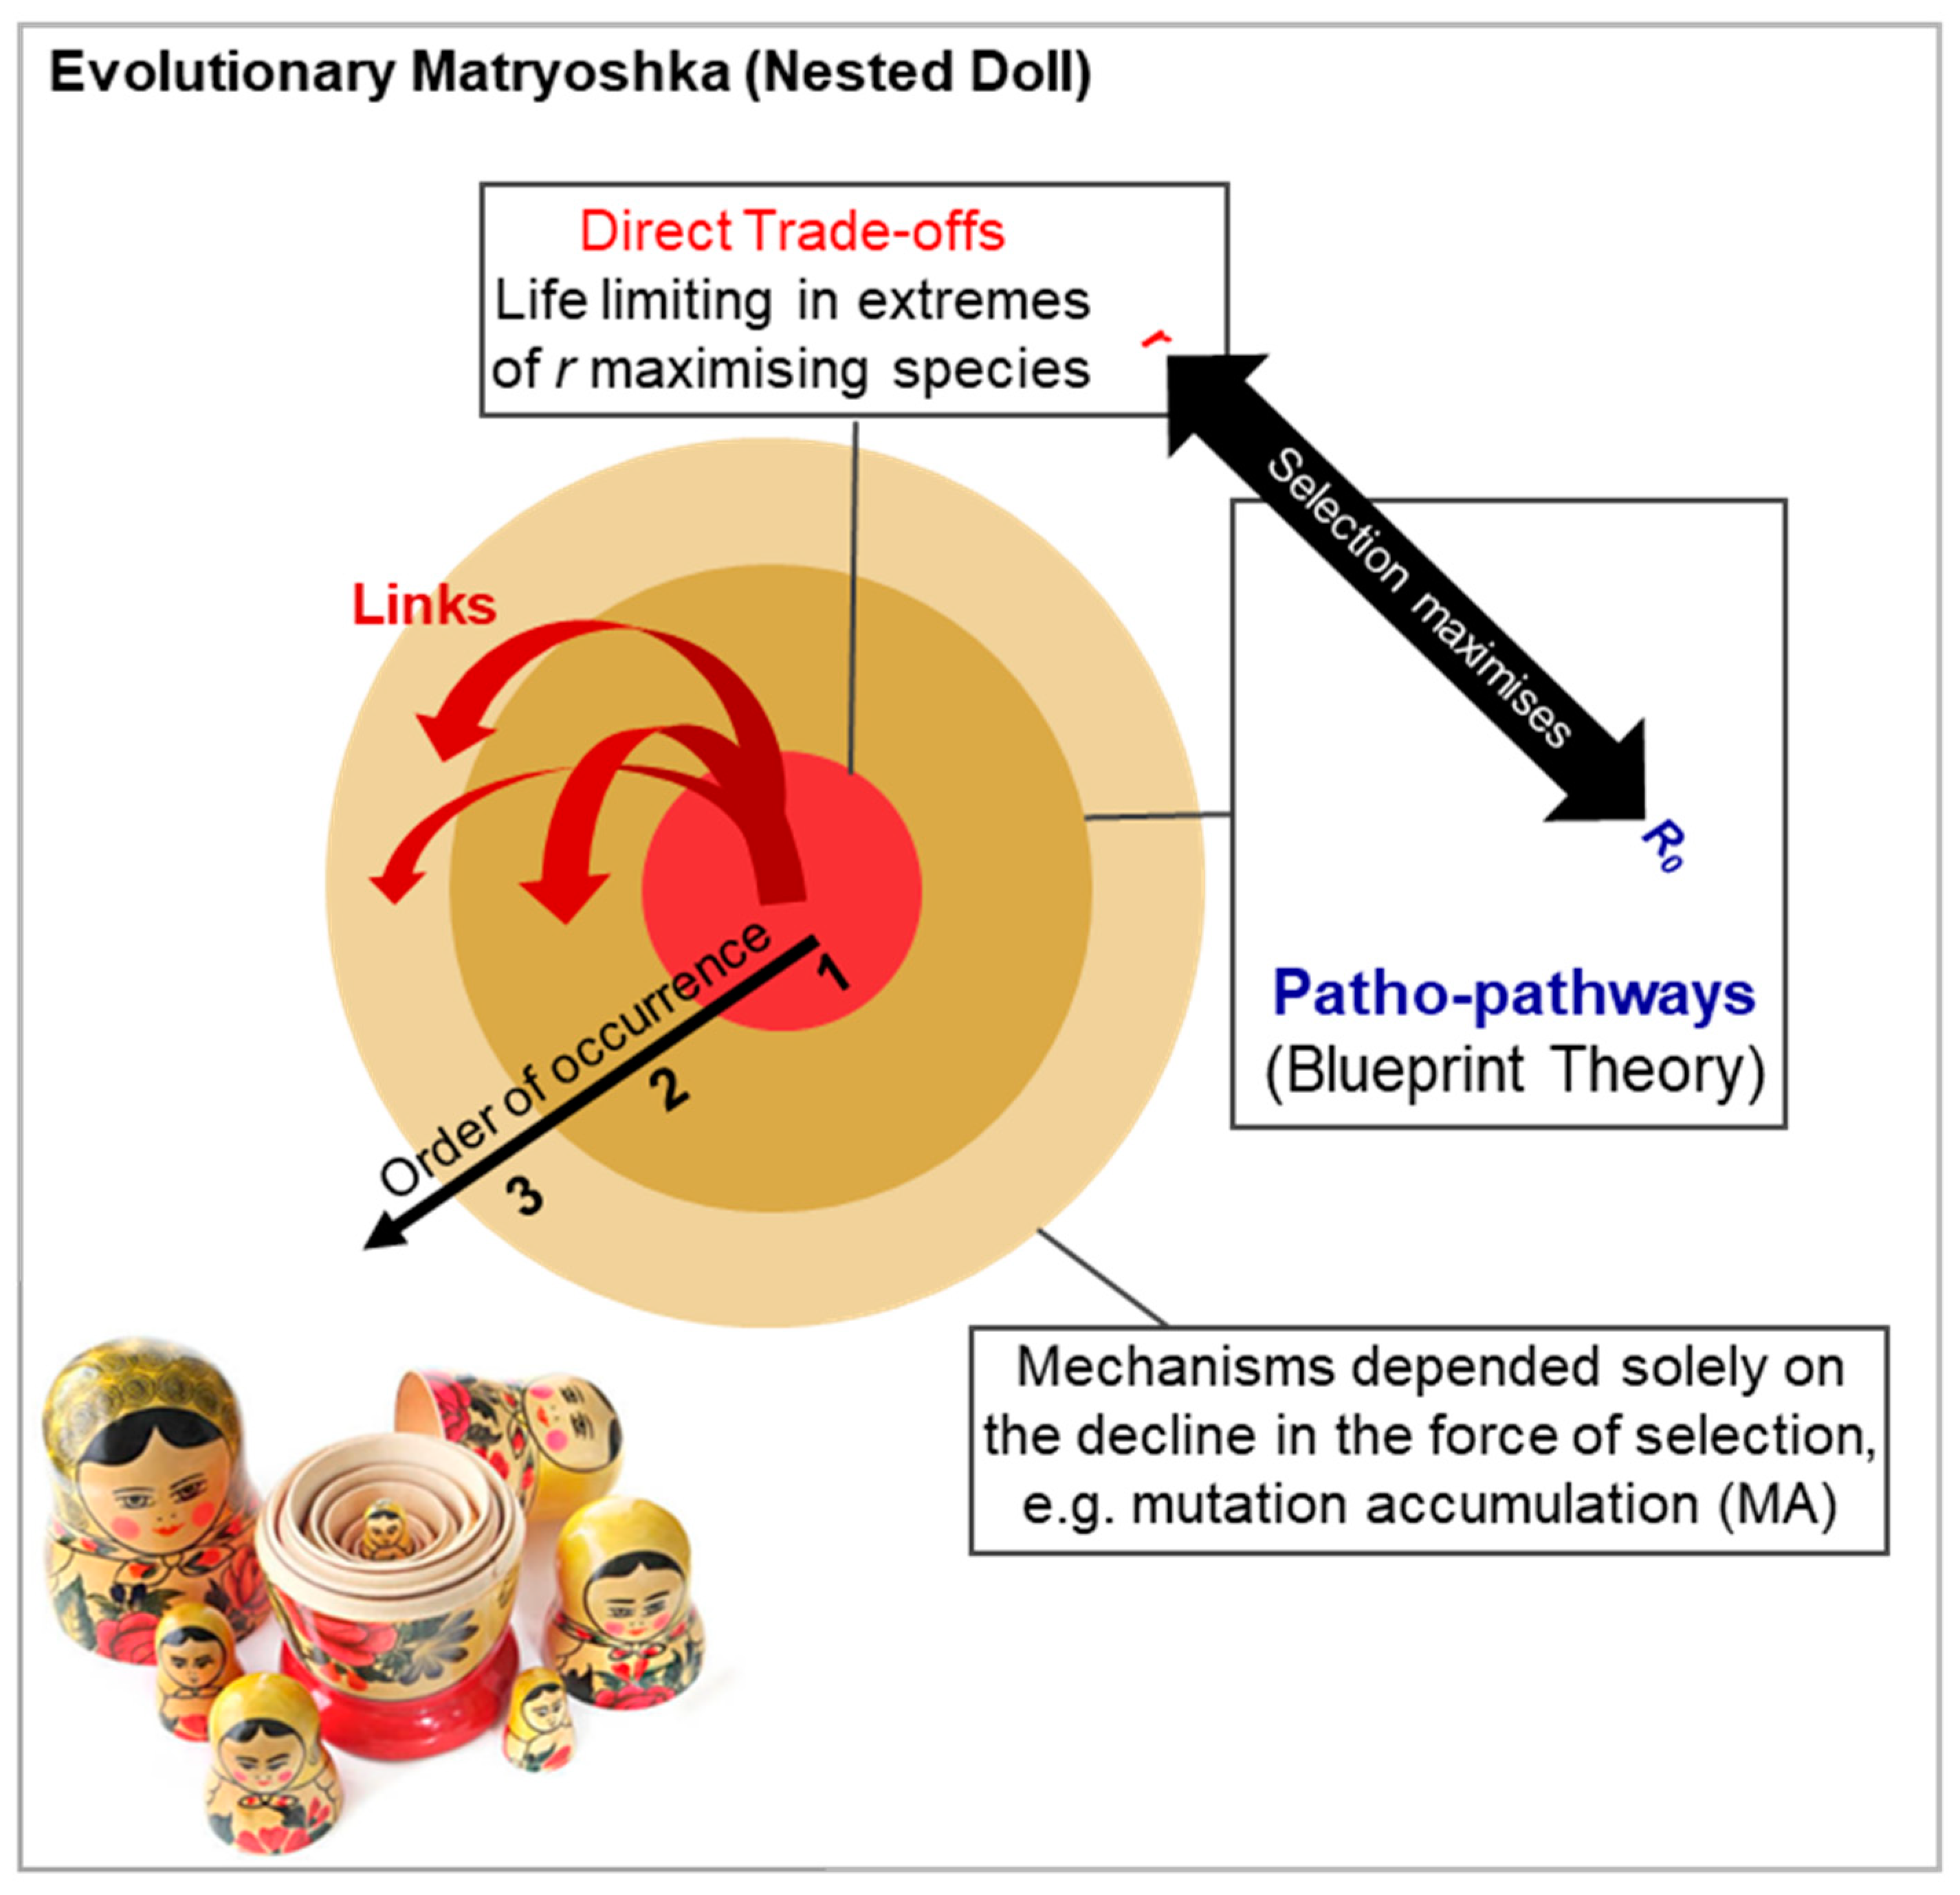
Figure 9.
Delving further into constraint: “aging” stems from a restriction of the phenotype space. There is immense utility in the binary categorisation of traits as selection vs organisational, with the former being inacessable phenotypes and the latter being acessable phenotypes that are not favoured due to selection pressures. a, Here we recommend a revision of the scheme presented in (Acerenza, 2016). It is useful to consider this scheme when detailing secondary constraint; primary constraint si merely the fact that some relationship exists between traits and exactly what the nature of that relationship is, including whether it exists at all (c.f. OTP in Figure 9b where trade-off is uncoupled)) will be determined by secondary constrant. b, Example of secondary constraints inducing restriction of the “acessable” phenotype space in a population, i.e. many secondary constraints are selecetion and not organisational. Indivudial specific differences in the genotype and/or phenotype within a population will result in differences in ageing via differences in secondary constraint and so level of trade-off cost. Due to network architecture, traits at the hub of a networks are more constrained by their numerous connections, evolving more slowly, while peripheral genes, with fewer connections, are likley under less selection constraint and can adapt more quickly when selection pressures change.
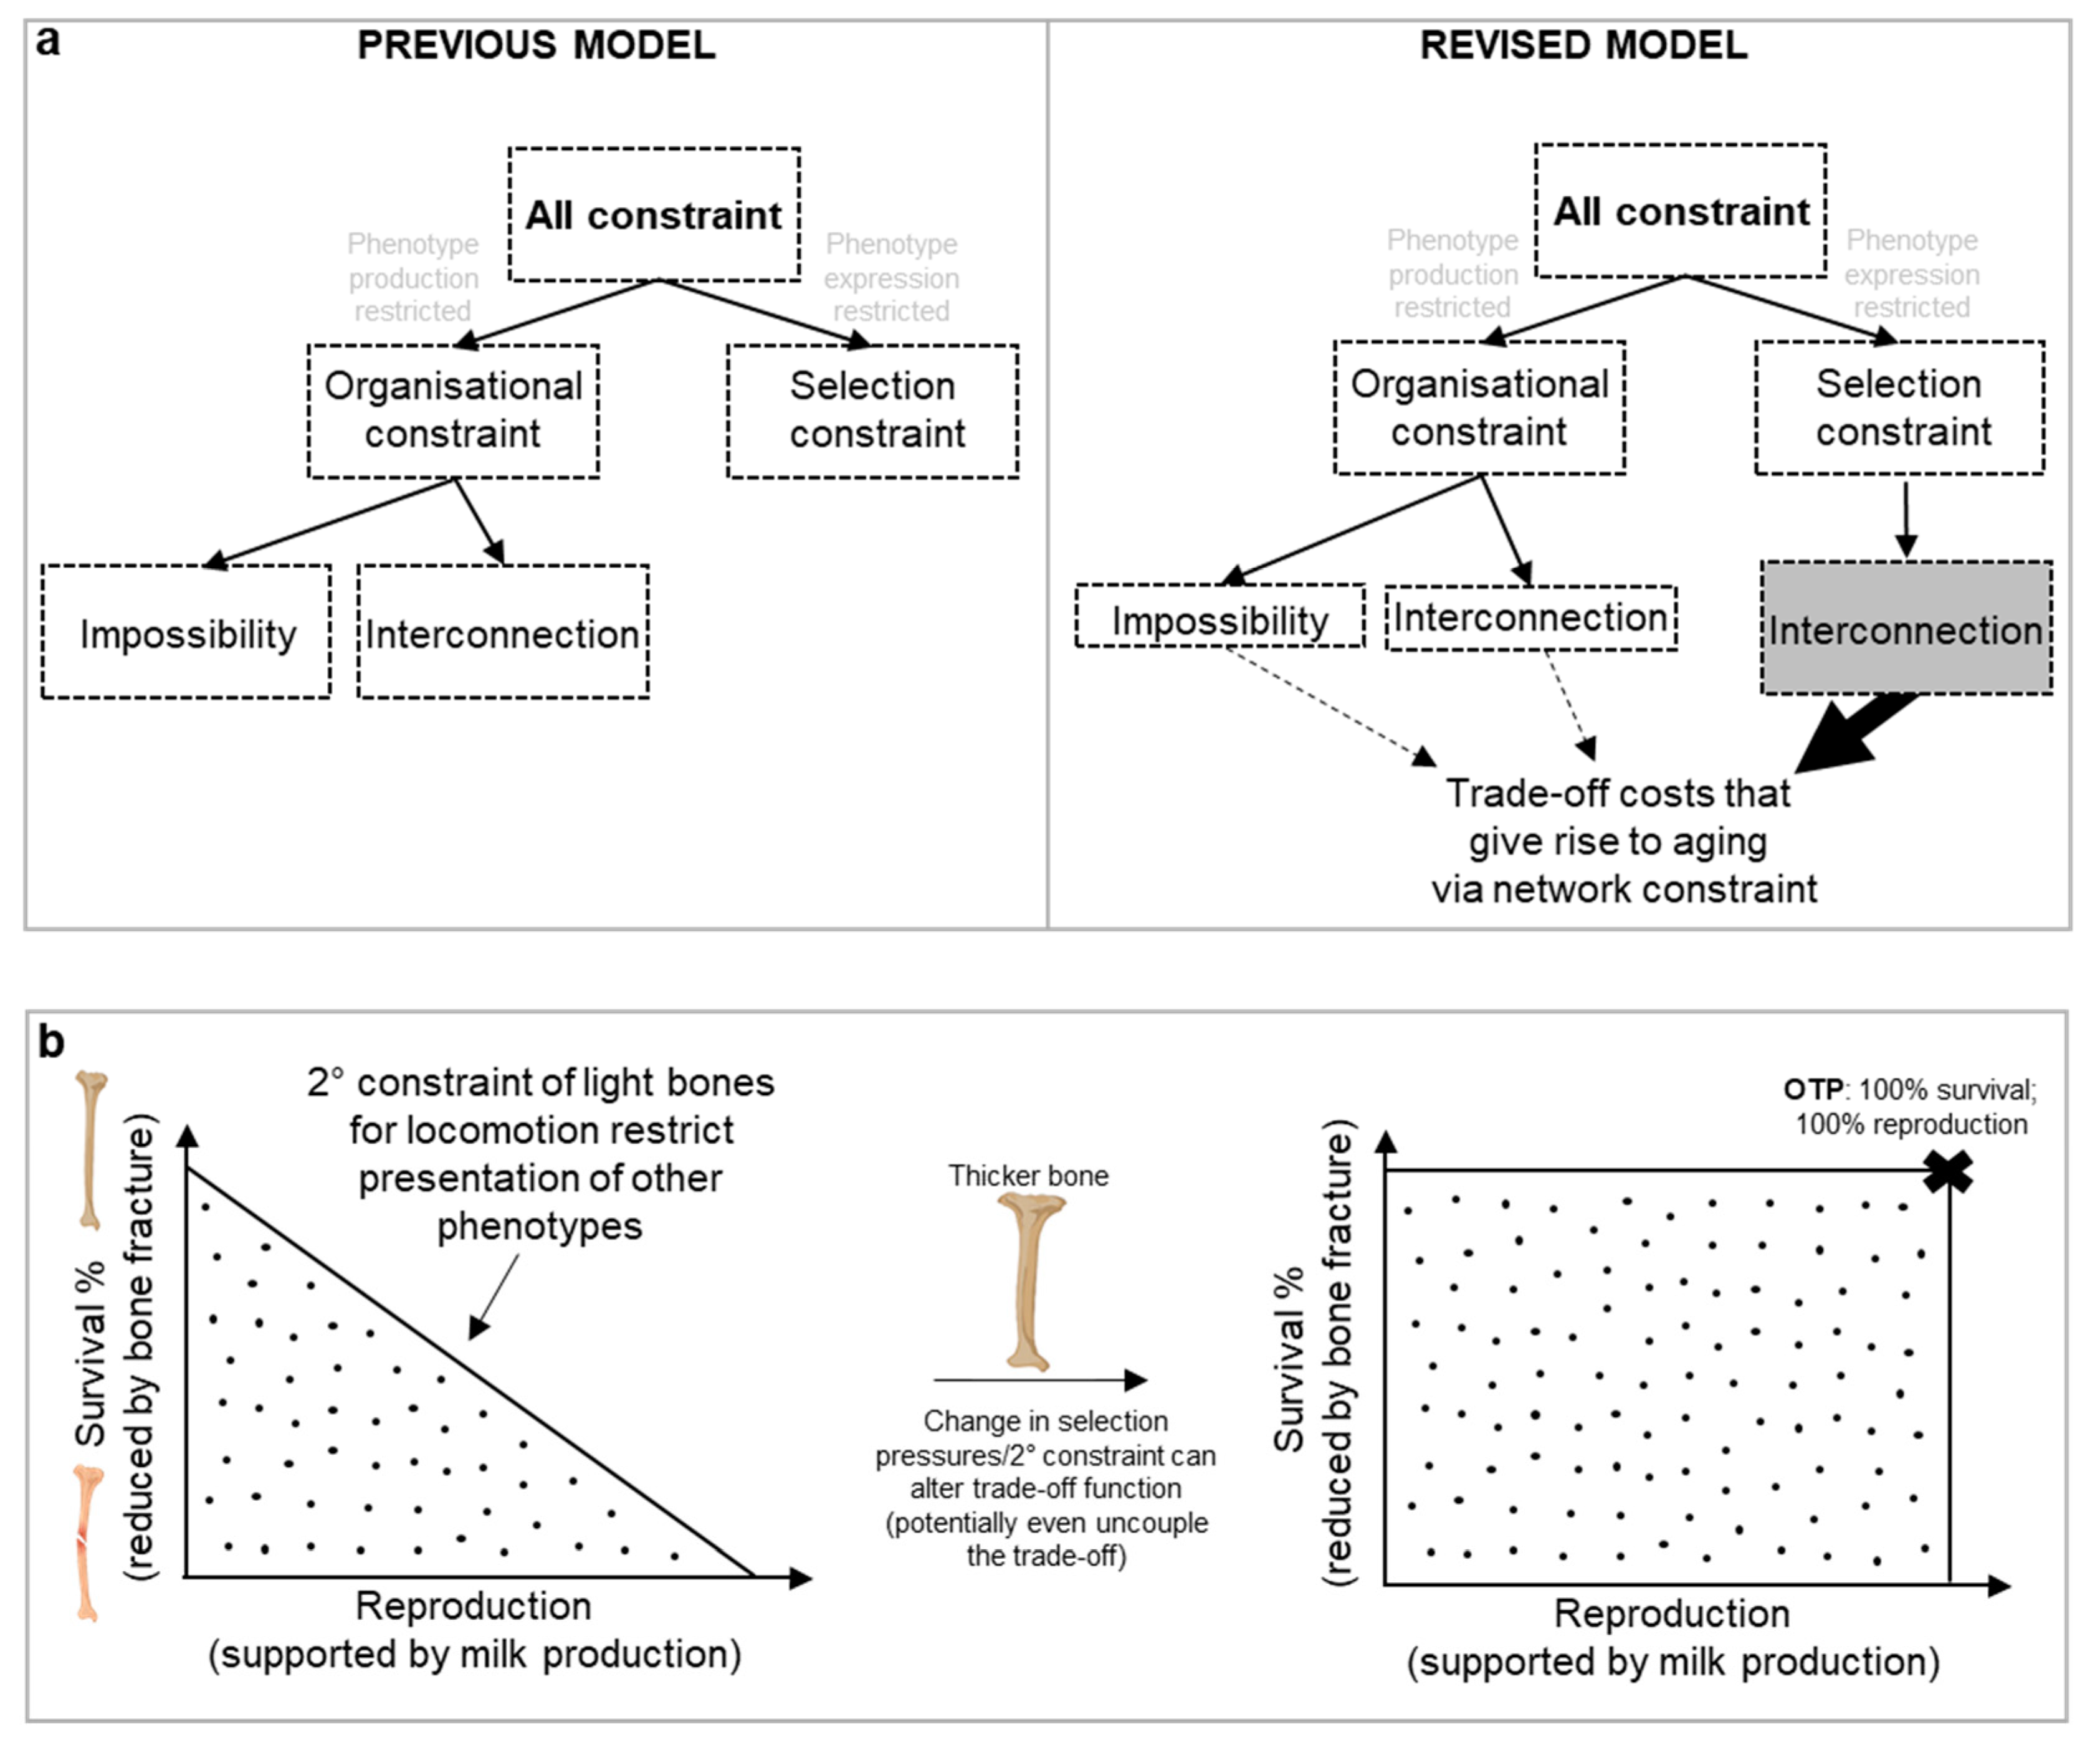

Table 1.
Glossary of key terms.
| Aging (senescence) | The overall process of deterioration with age or the resulting pathological condition (not to be confused with cellular senescence, which is a particular form of cell cycle arrest affecting some vertebrate cell types). |
|
Antagonistic pleiotropy (AP) (Williams, 1957) |
Where action of a given gene is both beneficial and detrimental to fitness. If the latter occurs later in life and is therefore subject to weaker selection, such a gene may be favoured by natural selection, and promote ageing |
|
Blueprint Synthesis (New term but one that builds on the Blueprint theory of aging (Kern et al., 2024a)) |
Broad evolutionary-mechanistic account of how various factors (ecology, life history, network constraint) determine the evolution of ageing, and give rise to specific mechanisms of ageing (primarily patho-pathways). |
| Biological constraint | A property of organisms and/or their ecology that prevents the evolution of traits that would increase fitness. |
|
Dysactivity (Kern et al., 2024a) |
Out of context abnormal or faulty cell, tissue, organ or system activity. Notably, this can include not only an increase in normal function such that it is above optimal for health, but also cells and tissues taking on new, unwanted activities, e.g. pathological cellular transdifferentiation. Dysactivity is typically induced by patho-pathways. (Note: Loss of function that is induced by damage causes loss of activity rather than dysactivity). |
| Extrinsic mortality | Loss of survival through ecological manipulations (not intrinsic factors), e.g. predation. c.f. gross vs net extrinsic mortality. |
|
Nested Doll Principle (New term) |
This proposes that intrinsic causes of mortality can influence one another either directly or through effects on the decline in eth force of selection. |
|
Net extrinsic mortality (New term) |
The direct and indirect (e.g. through effects on density-dependant regulation) consequences of an external (ecological) manipulation on survival in a population. Definition seldom used in this article as its key utility is in describing changes from an observer’s point of view in the wild. |
| Network constraint (Kern et al., 2024a) | Where a given molecule acts in diverse contexts (cell and tissue types, genotypes, phenotypes, and environmental conditions) across signalling networks within an organism, such that optimisation of function in all contexts is not possible. (This is a type of biological constraint, c.f. biological constraint). |
|
Gross extrinsic mortality (New term) |
The direct consequences of an external (ecological) manipulation on survival in a population. Unless otherwise stated, this article only uses this definition of extrinsic mortality due to greater explanatory power when describing the evolution of aging from first principles. |
|
Optimal trade-off point (OTP) (New term) |
Given the trade-off trait fitness-cost relationship and the position of a species on the r-R0 continuum, the optimal trade-off that maximises fitness. |
| Reproductive death | Life-limiting reproductive effort found in some semelparous species (e.g. Pacific salmon, monocarpic plants). |
| Parity | Number of reproductive episodes. One reproductive episode constitutes semelparity, and more than one iteroparity. |
|
Patho-pathway (Kern et al., 2024a) |
Triggered out of context and pathological activity of a biological pathway (pathway is initiated in the wrong place and/or at the wrong time). Pathological-pathway, short form: patho-pathway |
|
Patho-pathway cascade (Kern et al., 2024a) |
A causal chain of patho-pathways, in which each triggers the next in the chain (c.f. multi-stage patho-pathway cascade and discrete patho-pathway cascade). |
| Primary constraint (New term) | The constraint underlying a given trade-off, i.e. the constraint that causes the trade-off to arise in the first place. |
| Secondary constraint (New term) | Constraints that influence the shape of the trade-off function, i.e. define the fitness-cost relationship. c.f. primary constraint. Secondary constraints are frequently associated with their own trade-offs (c.f. network constraint). The distinction between primary and secondary constraints is specific to the trade-off being considered. |
| Wild-type | Genes maintained in the population, i.e. non atypical mutant. |
Disclaimer/Publisher’s Note: The statements, opinions and data contained in all publications are solely those of the individual author(s) and contributor(s) and not of MDPI and/or the editor(s). MDPI and/or the editor(s) disclaim responsibility for any injury to people or property resulting from any ideas, methods, instructions or products referred to in the content. |
© 2024 by the authors. Licensee MDPI, Basel, Switzerland. This article is an open access article distributed under the terms and conditions of the Creative Commons Attribution (CC BY) license (http://creativecommons.org/licenses/by/4.0/).
Copyright: This open access article is published under a Creative Commons CC BY 4.0 license, which permit the free download, distribution, and reuse, provided that the author and preprint are cited in any reuse.


