
Submitted:
11 October 2024
Posted:
15 October 2024
You are already at the latest version
Abstract
Increasingly frequent weather extremes induce changes in the quantity and quality of surface waters, which significantly complicates their use and management of their resources. The above problems concern in particular dam reservoirs, created to ensure good quality water for numerous recipients. Impact of extreme drought in lowland eutrophic reservoir-river system is still poorly understood. Our studies were focused on average and high water levels in the reservoir and outflowing river. These studies conducted during three extreme drought periods showed the dominance of toxic cyanobacteria in the phytoplankton of the reservoir and its outflow. During the drought periods, a change in the dominant cyanobacteria was observed from Planktothrix agardhii to Microcystis spp., which resulted in a change in oligopeptides profile, including toxic microcystins. The negative pressure of the strongly eutrophic reservoir on downstream river, due to release of a large biomass of cyanobacteria, was positively correlated with reservoir outflow.
Keywords:
drought
; cyanobacteria
; dammed river
; secondary metabolites
; microcystins
1. Introduction
Cyanobacteria dominance in plankton of the freshwater, estuarine, and marine ecosystems is a clear symptom of their eutrophication [1,2,3]. Mass development of these microorganisms drastically deteriorate the quality of both natural and artificial surface water bodies, excluding or significantly restricting their use for recreational and economic purposes [4,5,6]. The spread of the blooms is especially favored by interconnected systems, such as fresh-brackish [3] and river-reservoir waters [7]. Cyanobacteria as a rich source of bioactive secondary metabolites significantly affect the quality and functioning of water and land organisms, including humans [8]. Jones and co-authors [9] listed 2010 cyanoproducts synthesized by these microorganisms based on 850 peer-reviewed articles published between 1967 and 2020. Majority of the research articles on cyanometabolites focuses on toxic compounds [10], especially microcystins [11,12]. These cyclic heptapeptides belong to the most numerous (above 300 variants), widely distributed and most frequently studied cyanobacteria secondary metabolites [9,13]. They have well-documented negative effects on living organisms [11,14,15,16]. Cyanotoxins are frequently synthesized with other classes of cyanopeptides such as cyanopeptolins, microginins, aeruginosins, and anabaenopeptins [17,18,19]. The toxicity to aquatic plants and invertebrates is determined not only by cyjanotoxins but also by the other secondary metabolites of cyanobacteria [15,20,21,22]. Therefore, the reliable assessment of bathing and drinking water quality should include qualitative and quantitative analyses of phytoplankton assemblages, with special references to potentially toxic cyanobacteria, and cyanotoxins [6,23].
Global climate changes result in an increase in the frequency of extreme events such as droughts and floods [24,25] to which phytoplankton respond very quickly [26,27,28,29]. The large shift in the limno- and potamoplankton community composition and biomass occurs in relations to clear changes of meteorological and hydrological parameters [30,31]. Drought duration and intensity is positively correlated with a decrease in the amount of precipitation, a reduction in the water level and discharge, and an increase in temperature and stability of the water column [28,32,33,34,35]. These conditions often result in the appearance of both non-toxic and/or toxic cyanobacteria or strengthening their position towards more toxic species [10,36,37,38,39]. This generates a whole range of unfavorable effects on numerous freshwater ecosystems, especially dam reservoirs created in order to provide a safe source of water to numerous users [35,40,41,42,43]. Therefore, there is a need to assess the response of freshwater phytoplankton to these weather extremes. To gain better knowledge how the functioning of lowland dam and outflowing river can be affected by the changing conditions, the studies in the strongly eutrophic lowland Siemianówka dam Reservoir and outflowing Narew River during extreme drought periods were performed. We hypothesized that the negative impact of the reservoir on the river, manifested by the dominance of toxic cyanobacteria in the potamoplankton over a long distance below the dam [44], will be much stronger during drought compared to the flood periods. The tasks of the study included: (1) comparison of limnoplankton and potamoplankton communities’ structure, with respect to cyanobacteria; (2) determination and comparison of the cyanometabolite profiles, including toxins, as indicators of the changes in cyanobacteria community structure; (3) assessment of the impact of reservoir on potamoplankton during draughts.
2. Materials and Methods
2.1. Study Area
The lowland multifunctional polymictic Siemianówka dam reservoir (SDR) is located on the Upper Narew River in the north-east part of Poland (52°55’N, 23°50’E) [40,44] (Figure 1). One of the main objectives of the reservoir is to increase the low flow during the summer season in the Narew River valley and to reduce the high flow in the spring floods. The long-term observation well documented that flow of the Narew River precisely follows the precipitation pattern [34].
Extremely drought in the reservoir-riverine system were recorded especially in the summer and autumn period of 2015, when low rainfall (Supplementary Table S1)[45] was accompanied by a sharp drop in water level (Figure 2a). On November 8, the absolute minimum level (83 cm) in the history of the reservoir was observed [46].
In 2015 and 2018, the studies were limited to two months, August and September, respectively, when one of the lowest annual water levels in the SDR were recorded. In these months the outflow from the SDR and discharge in the downstream NR were also exceptionally low. In 2020, in SDR water samples were collected twice a month from July to September (Table 1). During this period, in outflowing river, sampling was performed once a month. Data concerning water levels in the reservoir (No. 1) and water levels and discharge in the river (gauge stations No. 3 - 25.5 km from dam and No. 5 - 88.2 km from dam) were provided by the Institute of Meteorology and Water Management National Research Institute [47] and documented with pictures of the river. The background for these studies were the results from periods of the heaviest flooding in 2010 (Figure 2b). The water samples were collected, from the SDR and the outflowing Narew River (NR) using a Limnos sampler (5 L). At the first station, located near dam, both surface (No. 1S) (0.1-0.5 m) and bottom (No. 1B) (5-6 m) samples were taken. These sampling depths correspond to the levels at which water is discharge from the reservoir [48]. In the NR, six stations (No 2-7) situated between 9.1 and 136.6 km downstream from the dam, were chosen. The last three river stations are located in the Narew National Park (NNP) (Figure 1). The samples were taken at the midstream (0.1-0.5 m) from bridges at river stations.
2.2. Water Chemistry
At each station, water temperature, pH, dissolved oxygen (DO, DO%) and conductivity (EC) were measured with HQ40D Multi Meter (Hach-Lange GmbH). Additionally, total chlorophyll a concentration (chl a) was measured in situ by the submersible spectrofluorometer FluoroProbe (bbe-Moldaenke). Hydrochemical laboratory analyses were made directly after sampling. Ion concentrations were determined via Dionex ICS 1100 ion chromatography. The concentration of dissolved nutrient forms (orthophosphate SRP, ammonium N-NH4+, nitrate N-NO3-, and nitrite N-NO2-) were determined in the laboratory using Dionex ICS 1100 ion chromatography. Dissolved organic carbon (DOC) and total nitrogen (TN) were determined by the method of high temperature catalytic combustion using a Shimadzu TOC-5050A analyzer. Total phosphorus (TP) analyses were conducted according to the standard photocolorimetric method [49]. Statistical analyses were performed with STATISTICA version 13.
2.3. Phytoplankton and Secondary Metabolites
Water samples for microscopic analysis were preserved with Utermöhl solution. Algae biomass will be determined according to the Utermöhl method using an inverted microscope (Olympus CX 41). The detailed methodology has been described previously [50].
Material collected on filters was extracted to 75% methanol in water by sonication (15 min, ultrasonic bath) and vortexing (15 min). After centrifugation, the supernatants were analyzed with LC-MS/MS system equipped in liquid chromatograph (Agilent Technologies, Boeblingen, Germany) and tandem mass spectrometer (QTRAP5500, Applied Biosystems, Sciex, Concorde, ON, Canada). For chromatographic separation, a Jupiter Proteo C12 column (150 × 4.6 mm, 4 µm, 90 Å) (Phenomenex, Aschaffenburg, Germany), and a gradient elution (0.6 mL/min) with 5% acetonitrile in water (A) and 100% acetonitrile, both with 0.1% formic acid were used. The MS system with turbo ion spray, operated in positive mode under the following conditions: ion source voltage 5.5 kV, temperature 550°C, nebulizer gas pressure 60 psi, curtain gas pressure 20 psi. Compounds were detected using non-target information-dependent acquisition (IDA) in the m/z range 500-1000, at collision energy 55 eV and dwell time 100 msec.
3. Results
3.1. Hydrological Conditions
The study period coincided with the period of low water levels in the reservoir and the river, which was observed at the turn of summer and autumn. The lowest water level in SDR, except short period from September to October in 2015, was noted in 2020 (Figure 3a). The highest level was recorded in the SDR through the whole 2018, with the minimum in October and it was statistically different from the other two years (Kruskal-Wallis nonparametric test: H = 8,08, p = 0,018). Additionally, in 2020, there were also the lowest outflows from the reservoir (Figure 3b) and discharge in river (Figure 3cd). The outflow not exceeding 1.6 m3 s-1 (Figure 3b), while the lowest average monthly discharge at two constantly monitored river station No. 3 and No. 5 were noted in August reached 2.10 m3 s-1 and 2.56 m3 s-1, respectively (Figure 3cd). The outflows and discharges recorded on the sampling days were close to the monthly averages, with the exception of the flow at station No. 5 in August 2015 (4.8 m3 s-1 and 14.54 m3 s-1, respectively).
3.2. Water Parameters
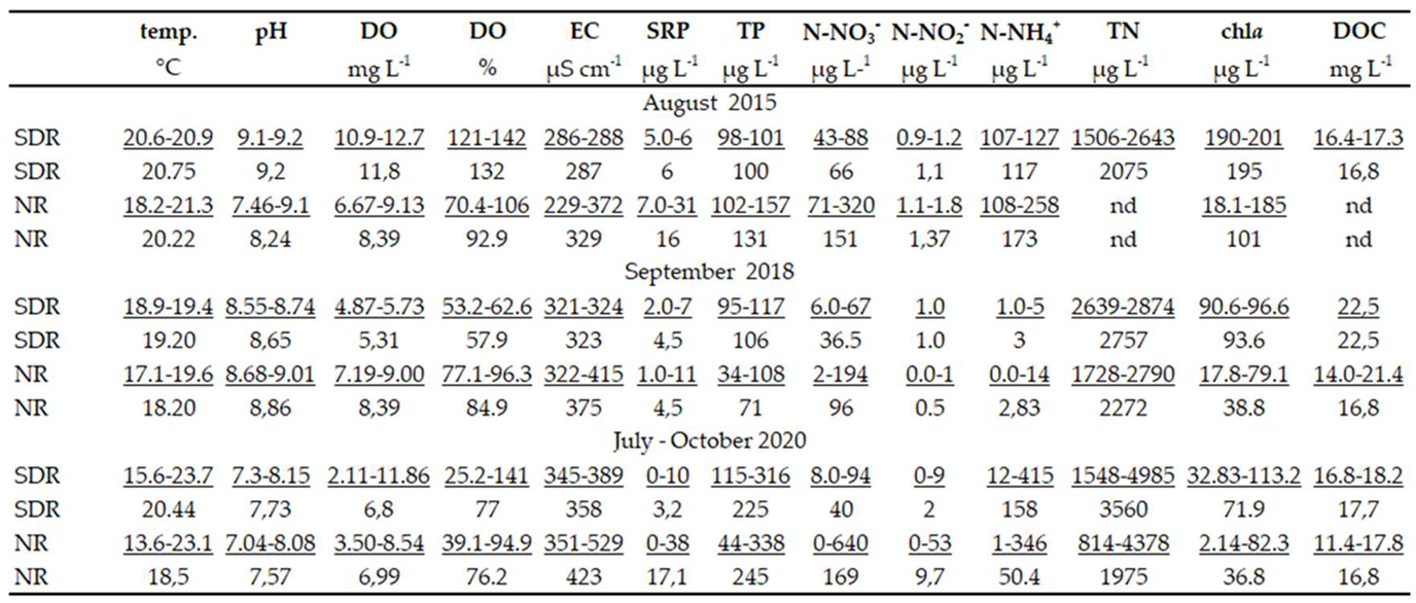
Water in the reservoir was characterized by alkaline pH, a high content of DOC (Table 1). In the SDR the highest pH, DO and chl a concentration was noted in 2015, while the highest water temperature, EC, and TP concentration were in 2020. In each season water temperature, chl a and TN concentrations in the reservoir were higher than in the river. An inverse relationship was found for EC.

Table 1.
Comparison of physicochemical and biological water parameters for the reservoir and river in 2015, 2018 and 2020.
Table 1.
Comparison of physicochemical and biological water parameters for the reservoir and river in 2015, 2018 and 2020.
 |
3.3. Phytoplankton Structure
Between subsequent seasons, the differences in phytoplankton assemblages in the SDR were noticed (Figure 4). In 2015 and 2018, Cyanobacteria strongly dominated over eukaryotic algae, while in 2020 they prevailed only in the second half of August and first half of September. Through the remaining part of 2020, diatoms (mainly Aulacoseira granulata (Ehrenberg) Simonsen 1979) and/or dinoflagellates (Ceratium furcoides (Levander) Langhans 1925) reached a higher biomass. The structure of river phytoplankton was strongly shaped by reservoir phytoplankton (Figure 5a-j). In August 2015 and September 2018, in reservoir and riverine stations, cyanobacteria were mainly represented by Oscillatoriales (Figure 5ad). Planktothrix agardhii (Gomont) Anagnostidis & Komárek was their main representative and reached minimum 86.4 % of total cyanobacteria biomass (TCB) in the reservoir and 62.5% of TCB at six riverine stations (Figure 5be). The species was accompanied by Limnothrix redekei (Goor) Meffert 1988, Pseudanabaena limnetica (Lemmermann) Komárek 1974 and Planktolyngbya spp. which occurred at lower biomass.
In 2015 the SDR cyanobacteria reached 93.1% of total phytoplankton biomass (TPB) in surface layer and even higher biomass at bottom layer (96.2% TPB). In the NR their strong dominance (54.5 % - 95.1% TPB) was noted till station No. 5, and then, it rapidly decreased (0.69% TPB) (Figure 5ab). Nostocales were represented mainly by Aphanizomenon spp. and Dolichospermum flos-aquae (Bornet & Flahault) (P.Wacklin, L.Hoffmann & Komárek 2009. In the SDR and at six riverine stations, these cyanobacteria reached approximately 10.9 % TPB and 10.8 % TPB, respectively. Share of Chroococcales (Woronichinia naegeliana (Unger) Elenkin 1933, Microcystis aeruginosa (Kützing) Kützing 1846) was negligible (Figure 5ab).
In 2018, the share of cyanobacteria in the TPB at dam station was similar to 2015 (respectively, 98.8% at surface and 94.7% at bottom), and even higher downstream (89.8% - 97.4%). This year, the Oscillatoriales still dominated phytoplankton at all stations increasing their predominance over Nostocales and Chroococcales (compared to 2015) (Figure 5de).
In 2020, the share of cyanobacteria in the TPB was from 18.1 % to 71.4% and the replacement of Oscillatoriales by Chroococcales was reported (Figure 5ghjkmn). Planktothrix agardhii was not recorded in limnoplankton from July to September. It was found sporadically at 2 river sites (at station No. 7 in July and at No. 3 in September) and the biomass of the species was very low (0.001-0.023 mg L-1). Other taxa from Oscillatoriales were sporadically observed and their total share did not exceed 2.2% TPB. Three species from Microcystis genus, M. aeruginosa, M. viridis (A.Braun) Lemmermann 1903 and M. wesenbergii (Komárek) Komárek ex Komárek 2006 were most numerously represented throughout the whole season. In July, the biomass of the three species was comparable and the lowest in the sampling season. At the beginning of August, the share of Chroococcales increased (Figure 4, Figure 5jk). simultaneously with the highest increase in the concentration of ammonium ions (from 14 µg L-1 to 415 µg L-1) and total nitrogen (from 3050 µg L-1 to 4895 µg L-1). Microcystis aeruginosa was the dominant among the representatives of the genus, reaching a maximum biomass (3.980 mg L-1), and then M. viridis prevailed, reaching its peak at the end of September (9.880 mg L-1). Additionally, in the SDR the highest share of Nostocales in 2020 was recorded in surface water layers between August 6 (max. 23.% TPB) and September 11 (11.0% TPB). At other dates it ranged from 0% to 1.95 % TPB. The highest biomass was reached by Dolichospermum planctonicum (Brunnthaler) Wacklin, L.Hoffmann & Komárek 2009, D. flos-aquae, Aphanizomenon spp. and Cuspidothrix issatschenkoi (Usachev) P.Rajaniemi, Komárek, R.Willame, P. Hrouzek, K.Kastovská, L.Hoffmann & K.Sivonen 2005.
3.4. Secondary Metabolites of Cyanobacteria
In the phytoplankton material collected from the SDR and outflowing NR, 34 cyanobacterial oligopeptides were detected (Table 2). On the basis of their m/z values and the ion fragmentation spectra, the compounds were assigned to a specific class of peptides. Among them, there were 11 aeruginosins (AERs), 6 cyanopeptolins (CPs), 8 microcystins (MCs), 5 anabaenopeptins (APs), and 2 microginins (MGs). In addition, one peptide classified to aeruginosamides (AERD) and planktocyclins (PL) metabolites were detected. Higher number of oligopeptides was recorded in the SDR (33) than in the NR (30). As many as 29 out of 33 oligopeptides from the reservoir were also present in the river, at least in sample from one of the stations. One AERs detected in the NR was not present in the reservoir. Whereas in the river there were no three metabolites (2 cyanopeptolins and 1 aeruginosins) that were found in the SDR. Microcystins, aeruginosamide and aeruginosins were constantly present in the SDR and NR. Planktoline and anabaenopeptins were detected there in 2015 and 2018. In contrast, 5 out of 6 cyanopeptolins were identified only in 2020.
Microcystins were among the most frequently detected oligopeptides at all stations (Table 2, Figure 5cfilo). In all samples 4 MC and 4 demethylated, Asp3-containing MC variants were detected with LC-MS/MS system (Table 2). Between subsequent seasons, the changes in the variants of MCs and their total concentrations were noticed. In all season only MC-RR and dmMC-LR were constantly present. Additionally, in 2015 4 demethylated variants, and in 2018 MC-YR and 2 demethylated MC variants were recorded. In 2020, from June to September, apart from MC-RR and dmMC-LR, MC-LR and MC-Prhcyst(O)R were identified in samples from surface layer of dam.
In 2015 the total concentration of MCs ranged from 9.44 µg L-1 (No. 1S) to 32.75 µg L-1 (No. 1B) and from 1.43 µg L-1 (No. 5) to 10.65 µg L-1 (No. 4), respectively in the reservoir and the outflow (Figure 5c). These were the highest values from the research period, with the exception of the station No. 5 (Figure 5). In 2018 the total concentration of MCs in the SDR was significantly lower than in 2015 and ranged from 2.61 µg L-1 (No. 1S) to 3.11 µg L-1 (No. 1B). In the NR the concentrations were twice lower than in the SDR, reached values from 0.99 µg L-1 (No. 4) to 2.05 µg L-1 (No. 2) (Figure 5f). In 2020, the permanent presence of toxins was recorded only in the surface layer of the reservoir (2.45 µg L-1 - 9.04 µg L-1) (Table 2, Figure ilo). Only at the beginning of July, toxins were found at all stations, and their concentrations were almost twice higher in the reservoir (4.83 µg L-1 - 5.00 µg L-1) than in the river ones (1.25 µg L-1 - 2.60 µg L-1). In the SDR the highest MCs concentration (Figure 5o) were detected during late September with M. viridis dominance.
In the SDR the highest total concentration of MCs (av. 21.10 µg L-1) was detected in 2015 when the total cyanobacteria biomass (TCB) was the highest (av. 33.33 mg L-1) and strongly dominated by P. agardhii (av. 83.7 %) (Figure 5a-c). In 2018, with an even higher predominance of P. agardhii (av. 95.0 %), there was a two-fold decrease in the biomass of cyanobacteria (av. 16.52 mg L-1) and an over seven-fold decrease in the concentration of toxins (av. 2.855 µg L-1) (Figure 5d-f). In 2020 in the SDR, replacement of Oscillatoriales by Chroococcales and no presence of P. agardhii, coincided with a change of microcystins variants (Table 2, Figure 5g-o) and their concentrations (av. 4.22 µg L-1). The highest concentration of MCs (9.04 µg L-1) was noted at surface layer on August 26 during at the highest (71.4 %) share of cyanobacteria in TPB (Figure 5j-l). At the time Chroococcales biomass was nearly twice higher than Nostocales.
At river stations, where the presence of the same cyanobacteria as in the reservoir was noted, only MC variants, detected in the reservoir, occurred (Table 2), and their concentrations were on average two times lower (Figure 5 cfilo). In the NR, the highest total MC concentration (10.65 µg L-1 st. No. 3) similar to the SDR ones, was recorded in 2015 (Figure 5c).
The relationships between total concentration of MCs and cyanobacterial biomass varied depending on the cyanobacterial dominants (Table 3). In 2015 and 2018, MCs were most strongly correlated with P. agardhii and Oscillatoriales biomass, while in 2020 with Chroococcales ones. In the case of Nostocales the relations were most similar in both periods.
In the NR the TCB and TPB were positively related with outflow from the SDR, especially in the case of stations closer to the dam (Figure 6a-c). The relationship became weaker with increasing distance from the dam.
4. Discussion
From the beginning of its existence, the shallow polyhumic SDR has been classified as eutrophic ecosystem characterized by the permanent presence of planktonic cyanobacteria, initially only in the summer period [51,52]. Over the years, cyanobacteria not only extended the period of occurrence by subsequent seasons, but also significantly increased their share in the limnoplankton biomass, which was shown by their dominance from spring to late autumn [51,52,53]. The presence of potentially toxic Cyanobacteria in SDR, directed our attention to microcystins. The first studies concerned only the reservoir [48,50,54,55]. Since 2008, the research has been extended to include its outflow [45,56], where cyanobacteria were found to be an important component of potamoplankton on over 130 km of the NR section below the dam [53]. The studies confirmed the presence of cyanobacteria secondary metabolites not only in the waters of the reservoir, but also in its outflow [45,56].
An increase in the frequency of extreme events such as droughts and floods threaten the functioning of aquatic ecosystems [25,57], especially damming rivers [34,43,58]. Understanding the response of aquatic ecosystems to the these phenomena is necessary in order to improve management strategies and reduce the risk of water quality deterioration [59]. This response may be different, depending on the characteristics of the water body and its catchment [60]. In our opinion, studies explaining the effect of weather extremes on water quality in dammed lowland rivers are very much needed. Previous research (2005-2012), conducted during periods of average or high-water levels in the reservoir and in the river, documented the production of MCs in the SDR and the NR mainly when the strong permanent dominance Oscillatoriales occurred (since 2006) [44,48,50,55,56]. The heavy floods were recorded especially in reservoir-river system in 2010, which were a consequence of the greatest rainfall in the Upper Narew River [33,34]. Then, the water level in the reservoir and outflow was significantly higher than during drought (230 cm - 259 cm and 3.24 m3 s-1 - 11.3 m3 s-1, respectively) (Figure 1ab). Similarly, the flows at the 2 monitored stations were definitely higher (st. No. 3: 5.23 m3 s-1 -19.4 m3 s-1 and st. No. 5: 9.0 m3 s-1 - 33.3 m3 s-1) than during drought periods (Figure 1cd). Current studies covered the three drought periods (2015, 2018, 2020) distinguished by the lowest rainfall in the growing season [Supplementary Table S1]. The present studies gave the opportunity to compare the limno- and potamoplankton community structure and to assess the reservoir impact on dammed lowland river during low water levels in reservoir, the lowest outflows and discharge in the NR.
Planktothrix agardhii, the permanent established dominant in limnoplankton of SDR in 2006-2012, show well-documented positive correlation between its biomass and total concentration of MCs [50,55]. Additionally, production of 3 microcystins ([Asp3 Mdha] MC-HtyR, [Asp3 Mdha] MC-YR, [Asp3 Mdha] MC-RR by 2 isolated strains has been proven [55]. During P. agardhii blooming in the SDR other 3 microcystins ([Asp3 Dha] MC-RR, [Asp3 Dha] MC-LR, MC-LR) were also present [48,55]. Additionally, from August to October in 1999 MC-YR was identified in cyanobacterial blooms formed by Planktothrix, Aphanizomenon, Dolichospermum and Microcystis [52,54].
In drought 2015 and 2018, P. agardhii still maintained its strong dominance in the reservoir, not only in the months of our research but throughout the summer-autumn period (data not shown). Among 27 detected oligopeptides there were 7 microcystins and 20 other metabolites. Up to 23 oligopeptides (5 MCs, 5 APs, 10 AERs, 2 CPs, 1 MGs) were earlier (2008-2012) detected [44,50,56] which indicates high stability of P. agardhii chemotypes in the reservoir-river system. In the drought periods 2015 and 2018, similarly to the floods, strong positive correlations between P. agardhii biomass and total microcystin concentration was noted (Table 3). This well-documented long-term presence of toxic subpopulations of P. agardhii does not exclude the co-presence of non-toxic ones. Detection of numerous oligopeptide variants in P. agardhii-dominated eutrophic and hypertrophic freshwaters and influence of abiotic factors e.g. nutrients, temperature, and light on the production of toxins and other metabolites has also been described by numerous authors [17,23,61,62,63].
The situation was completely different during the drought in 2020 when there was a major overhaul of limnoplankton and, consequently, potamoplankton. The period of the cyanobacteria dominance in the SDR was significantly shorter than drought in 2015 and 2018. It covered only the second half of August and September. Additionally, the cyanobacteria composition changed from species represented for many years by the Oscillatoriales order to the Chroococcales order. The absence of P. agardhii in the reservoir coincided with the strong dominance of the genus Microcystis. The structure of limnoplankton was similar to one observed at the beginning of the reservoir's existence, when there was a greater seasonal exchange of dominants representing three orders of cyanobacteria Chroococcales, Oscillatoriales, and Nostocales. The strong predominance of Chroococcales, was mainly observed from August to October [51,52,53]. In 2020 the lowest supply of NR with SDR waters was recorded, which translated into the lowest river discharges. Since mid-July, the upper outlets of SDR were closed, which additionally excluded the discharge of especially colonial cyanobacteria accumulated in the surface layer of the reservoir. The change in the cyanobacteria community structure resulted in a change in detected secondary metabolites, including only 4 microcystin variants.
In 2020, in the SDR the dominance of Microcystis genus coincided with the highest water temperature, and stability of water column resulting from the highest level of water impoundment and the lowest outflow during the study period. Moreover, in August and mid-September, the concentrations of ammonium and TN were significantly higher than in previous years. At the beginning of July 2020, the water temperature in the surface layer of the reservoir was 23.7 °C and was on average 3 °C higher than in 2015 and 2018. These conditions favor the development of Microcystis which grows faster when temperature reaches over 20 °C [64,65]. In addition, higher temperatures promoted greater stability of reservoir water, which enables Microcystis colonies formation contrary to trichomes of P. agardhii preferring turbulent mixing regimes [66]. The similar impact of temperature and TN on Planktothrix and Microcystis competition was well documented in many freshwaters [67,68,69].
Coexistence of potentially toxic M. aeruginosa, M. viridis, and non-toxic M. wessenbergii in the SDR is a phenomenon often observed in eutrophic freshwaters around the world [43,70,71,72,73]. The highest MC concentration in the SDR in 2020 coincided with the highest M. viridis biomass. M. viridis is considered to be a strong dominant in dry season and an effective producer of microcystins and many other oligopeptides [43,74].
Significant changes in the diversity of planktonic cyanobacteria and secondary metabolites synthesized in reservoir-river system in extreme events (droughts, flood-wet periods) were observed. In summer, peptide-producing cyanobacteria are permanently present in limno- and potamoplankton, regardless of weather extremes. During drought periods the total concentrations of MCs in the SDR (av. 6.94 µg L-1, max. 32.8 µg L-1 in 2015) were close to those of recorded during heavy floods in 2010 (av. 10.9 µg L-1, max. 23.1 µg L-1) [44]. In the outflowing river, however, the differences in both extremes were clear. During drought periods TCB and total concentration of MCs were higher (av. 2.19 µg L-1, max. 10.66 µg L-1) at all riverine stations, compare to heaviest flood in 2010 (av. 0.09 µg L-1, max. 1.22 µg L-1) when they were sporadically detected above 88 km from the dam (st. No. 4) [44]. Additionally, during drought periods, the situation in the river strongly correlated with the outflow from the SDR. In 2015, during the highest outflow, the highest increase of TCB and MCs concentration in river stations was observed. These high concentrations of MCs may be the result of a higher share of toxin-producing cyanobacteria or increased expression of genes responsible for toxin production. The increase gene expression which is necessary for Planktothrix or Microcystis maintenance under stressful conditions has been reported in other freshwaters [75,76]. Contrary in 2020, the lowest outflow resulted the later (from August) and slower increase and weaker dominance of cyanobacteria and lack or the lowest MCs concentration.
Our research shows that the effects of extreme droughts resulting in a decrease in the water level in a lowland reservoir and its runoff are more dangerous than in the case of floods. During droughts, the reservoir pressure increases because the large load of cyanobacteria released from the reservoir in conditions of low river discharge is not subject to dilution as it occurs during floods. In particular, the low flow periods can enhance phytoplankton mass growth, and cause water quality problems to the river.
5. Conclusions
Our results indicated the permanent presence of toxic cyanobacteria in the lowland reservoir-river system and, probably, high stability cyanobacteria chemotypes, especially during extreme drought periods in 2015 and 2018, as documented by similar profile of detected cyanometabolites.
In the third season, a significant change was noted in the limno-potamoplankton communities. P. agardhii (Oscillatoriales), a perennial long-term dominant, was replaced mainly by species of the genus Microcystis (Chroococcales). The period of summer dominance of cyanobacteria was also shortened. The type of secondary metabolites was closely correlated with the dominant cyanobacteria in the reservoir-river system. Although our results does not reflect in detail the relations between toxic and non-toxic cyanobacteria subpopulations, it documents very well changes in the composition of cyanobacteria.
The situation in the reservoir is more stable because during presence of cyanobacteria, their biomass and microcystins production are similarly high, regardless of diverse hydrological conditions (flood, drought). However, in the outflowing river, the cyanobacteria and microcystins fluctuations are much greater, strongly depending on the reservoir outflow and river discharge. We hope that these results helped the better understanding of influence extremes on functioning of eutrophic lowland reservoir-river system and improve reservoir management.
Supplementary Materials
The following supporting information can be downloaded at the website of this paper posted on Preprints.org. Table S1. Comparison of the sum of monthly and annual rainfall from periods of floods (2009, 2010) and drought (2015, 2018, 2020); data for the Białystok station located 60 km from the Siemianówka dam reservoir [46]
Author Contributions
M.G. designed the study, undertook field analyses and sampling, analyzed the phytoplankton, and wrote the manuscript; H.M.M. analyzed the secondary metabolites and revised the manuscript; A.W. participated in field and laboratory analyses of water chemistry, performed statistical analysis, and reviewed the manuscript. All authors have read and agreed to the published version of the manuscript.
Data Availability Statement
The original contributions presented in the study are included in the article and supplementary material. Further inquiries can be directed to the corresponding author.
Conflicts of Interest
The authors declare no conflicts of interest.
References
- O’Neil, J.M.; Davis, T.W.; Burford, M.A.; Gobler, C.J. The rise of harmful cyanobacteria blooms: The potential roles of eutrophication and climate change. Harmful Algae 2012, 14, 313–334. [Google Scholar] [CrossRef]
- Kobos, J.; Błaszczyk, A.; Hohlfeld, N.; Toruńska-Sitarz, A.; Krakowiak, A.; Hebel, A.; Sutryk, K.; Grabowska, M.; Toporowska, M.; Kokociński, M.; et al. Cyanobacteria and cyanotoxins in Polish freshwater bodies. Oceanol. Hydrobiol. Stud. 2013, 42, 358–378. [Google Scholar] [CrossRef]
- Overlingė, D.; Kataržytė, M.; Vaičiūtė, D.; Gyraitė, G.; Gečaitė, I.; Jonikaitė, E.; Mazur-Marzec, H. Are there concerns regarding cHAB in coastal bathing waters affected by freshwater-brackish continuum? Mar. Pollut. Bull. 2020, 159, 111500. [Google Scholar] [CrossRef] [PubMed]
- Walter, J.M.; Lopes, F.A.C.; Lopes-Ferreira, M.; Vidal, L.M.; Leomil, L.; Melo, F.; de Azevedo, G.S.; Oliveira, R.M.S.; Medeiros, A.J.; Melo, A.S.O.; et al. Occurrence of Harmful Cyanobacteria in Drinking Water from a Severely Drought-Impacted Semi-arid Region. Front. Microbiol. 2018, 9, 176. [Google Scholar] [CrossRef]
- Czyżewska, W.; Piontek, M.; Łuszczyńska, K. The Occurrence of Potential Harmful Cyanobacteria and Cyanotoxins in the Obrzyca River (Poland), a Source of Drinking Water. Toxins 2020, 12, 284. [Google Scholar] [CrossRef]
- Chorus, I.; Welker, M. Toxic cyanobacteria in water. A guide to their public health consequences, monitoring and management. 2nd ed.; CRC Press, Boca Raton (FL), on behalf of the World Health Organization: Geneva, Switzerland, 2021; 1–859.
- Rangel, L.M.; Soares, M.C.S.; Paiva, R.; Silva, L.H.S. Morphology-based functional groups as effective indicators of phytoplankton dynamics in a tropical cyanobacteria-dominated transitional river–reservoir system. Ecol. Indic. 2016, 64, 217–227. [Google Scholar] [CrossRef]
- Cegłowska, M.; Kwiecień, P.; Szubert, K.; Brzuzan, P.; Florczyk, M.; Edwards, C.; Kosakowska, A.; Mazur-Marzec, H. Biological activity and stability of aeruginosamides from cyanobacteria. Mar. Drugs 2022, 20, 93. [Google Scholar] [CrossRef]
- Jones, M.R.; Pinto, E.; Torres, M.A.; Dörr, F.; Mazur-Marzec, H.; Szubert, K.; Tartaglione, L.; Dell'Aversano, C.; Miles, C.O.; Beach, D.G.; et al. CyanoMetDB, a comprehensive public database of secondary metabolites from cyanobacteria. Water Res. 2021, 196, 117017. [Google Scholar] [CrossRef]
- Mantzouki, E.; Lürling, M.; Fastner, J.; De Senerpont Domis, L.; Wilk-Woźniak, E.; Koreivienė, J.; Seelen, L.; Teurlincx, S.; Verstijnen, Y.; Krztoń, W.; et al. Temperature Effects Explain Continental Scale Distribution of Cyanobacterial Toxins. Toxins 2018, 10, 156. [Google Scholar] [CrossRef]
- Breidenbach, J.D.; French, B.W.; Gordon, T.T.; Kleinhenz, A.L.; Khalaf, F.K.; Willey, J.C.; Hammersley, J.R.; Wooten, R.M.; Crawford, E.L.; Modyanov, N.N.; Malhotra, D.; Teeguarden, J.G.; Haller, S.T.; Kennedy, D.J. Microcystin-LR aerosol induces inflammatory responses in healthy human primary airway epithelium. Environ. Int. 2022, 169, 107531. [Google Scholar] [CrossRef]
- Roegner, A.F.; Corman, J.R.; Sitoki, L.M.; Kwena, Z.A.; Ogari, Z.; Miruka, J.B.; Xiong, A.; Weirich, C.; Aura, C.M.; Miller, T.R. Impacts of algal blooms and microcystins in fish on small-scale fishers in Winam Gulf, Lake Victoria: implications for health and livelihood. Ecol. Soc. 2023, 28. [Google Scholar] [CrossRef]
- Bouaïcha, N.; Miles, C.O.; Beach, D.G.; Labidi, Z.; Djabri, A.; Benayache, N.Y.; Nguyen-Quang, T. Structural Diversity, Characterization and Toxicology of Microcystins. Toxins 2019, 11, 714. [Google Scholar] [CrossRef] [PubMed]
- Chen, J.; Zhang, D.; Xie, P.; Wang, Q.; Ma, Z. Simultaneous determination of microcystin contaminations in various vertebrates (fish, turtle, duck and water bird) from a large eutrophic Chinese lake, Lake Taihu, with toxic Microcystis blooms. Sci. Total. Environ. 2009, 407, 3317–3322. [Google Scholar] [CrossRef] [PubMed]
- Pawlik-Skowrońska, B.; Toporowska, M.; Mazur-Marzec, H. Effects of secondary metabolites produced by different cyanobacterial populations on the freshwater zooplankters Brachionus calyciflorus and Daphnia pulex. Environ. Sci. Pollut. Res. 2019, 26, 11793–11804. [Google Scholar] [CrossRef] [PubMed]
- Zong, Z.; Dang, Y.; Zhang, Y.; Yu, L.; Liu, C.; Wang, J. Promotion effect on liver tumor progression of microcystin-LR at environmentally relevant levels in female krasV12 transgenic zebrafish. Aquat. Toxicol. 2022, 252, 106313. [Google Scholar] [CrossRef]
- Kurmayer, R.; Deng, L.; Entfellner, E. Role of toxic and bioactive secondary metabolites in colonization and bloom formation by filamentous cyanobacteria Planktothrix. Harmful Algae 2016, 54, 69–86. [Google Scholar] [CrossRef]
- Janssen, E.M.L. Cyanobacterial peptides beyond microcystins–A review on co-occurrence, toxicity, and challenges for risk assessment. Water Res. 2019, 151, 488–499. [Google Scholar] [CrossRef]
- Varriale, F.; Tartaglione, L.; Zervou, S.-K.; Miles, C.O.; Mazur-Marzec, H.; Triantis, T.M.; Kaloudis, T.; Hiskia, A.; Dell’aversano, C. Untargeted and targeted LC-MS and data processing workflow for the comprehensive analysis of oligopeptides from cyanobacteria. Chemosphere 2022, 311, 137012. [Google Scholar] [CrossRef]
- Overlingė, D.; Toruńska-Sitarz, A.; Cegłowska, M.; Błaszczyk, A.; Szubert, K.; Pilkaitytė, R.; Mazur-Marzec, H. Phytoplankton of the Curonian Lagoon as a New Interesting Source for Bioactive Natural Products. Special Impact on Cyanobacterial Metabolites. Biomolecules 2021, 11, 1139. [Google Scholar] [CrossRef]
- Zhang, Y.; Duy, S.V.; Munoz, G.; Sauvé, S. Phytotoxic effects of microcystins, anatoxin-a and cylindrospermopsin to aquatic plants: A meta-analysis. Sci. Total. Environ. 2022, 810, 152104. [Google Scholar] [CrossRef]
- Bownik, A.; Pawlik-Skowrońska, B.; Wlodkowic, D.; Mieczan, T. Interactive effects of cyanobacterial metabolites aeruginosin-98B, anabaenopeptin-B and cylindrospermopsin on physiological parameters and novel in vivo fluorescent indicators in Chironomus aprilinus larvae. Sci. Total. Environ. 2024, 914, 169846. [Google Scholar] [CrossRef] [PubMed]
- Yéprémian, C.; Gugger, M.F.; Briand, E.; Catherine, A.; Berger, C.; Quiblier, C.; Bernard, C. Microcystin ecotypes in a perennial Planktothrix agardhii bloom. Water Res. 2007, 41, 4446–4456. [Google Scholar] [CrossRef] [PubMed]
- Lake, P.S. Ecological effects of perturbation by drought in flowing waters. Freshw. Biol. 2003, 48, 1161–1172. [Google Scholar] [CrossRef]
- Havens, K.; Paerl, H.; Phlips, E.; Zhu, M.; Beaver, J.; Srifa, A. Extreme Weather Events and Climate Variability Provide a Lens to How Shallow Lakes May Respond to Climate Change. Water 2016, 8, 229. [Google Scholar] [CrossRef]
- Yuting, W.; Hongshan, Y.; Jian, S.; Jiuguo, Z. The effect of drought on the communities of plankton and benthos in reservoirs in spring. J. Ocean Univ. Qingdao 2002, 32, 32–36. [Google Scholar]
- Van Vliet, M.; Zwolsman, G. Impact of summer droughts on the water quality of the Meuse River. J. Hydrol. 2008, 353, 1–17. [Google Scholar] [CrossRef]
- Rojo, C.; Álvarez-Cobelas, M.; Benavent-Corai, J.; Barón-Rodríguez, M.M.; Rodrigo, M.A. Trade-offs in plankton species richness arising from drought: insights from long-term data of a National Park wetland (central Spain). Biodivers. Conserv. 2012, 21, 2453–2476. [Google Scholar] [CrossRef]
- Beaver, J.R.; Jensen, D.E.; Casamatta, D.A.; Tausz, C.E.; Scotese, K.C.; Buccier, K.M.; Teacher, C.E.; Rosati, T.C.; Minerovic, A.D.; Renicker, T.R. Response of phytoplankton and zooplankton communities in six reservoirs of the middle Missouri River (USA) to drought conditions and a major flood event. Hydrobiologia 2012, 705, 173–189. [Google Scholar] [CrossRef]
- Tornés, E.; Pérez, M.C.; Durán, C.; Sabater, C. Reservoirs override seasonal variability of phytoplankton communities in a regulated Mediterranean river Sci. Total Environ 2014, 475, 225–233. [Google Scholar] [CrossRef]
- Wood, S.A.; Borges, H.; Puddick, J.; Biessy, L.; Atalah, J.; Hawes, I.; Dietrich, D.R.; Hamilton, D.P. Contrasting cyanobacterial communities and microcystin concentrations in summers with extreme weather events: insights into potential effects of climate change. Hydrobiologia 2016, 785, 71–89. [Google Scholar] [CrossRef]
- Romo, S.; Soria, J.; Fernández, F.; Ouahid, Y.; Barón-Solá. Water residence time and the dynamics of toxic cyanobacteria. Freshw. Biol. 2012, 58, 513–522. [Google Scholar] [CrossRef]
- Zieliński, P.; Grabowska, M.; Jekatierynczuk-Rudczyk, E. Influence of changeable hydro-meteorological conditions on dissolved organic carbon and bacterioplankton abundance in a hypertrophic reservoir and downstream river. Ecohydrology 2015, 9, 382–395. [Google Scholar] [CrossRef]
- Marcinkowski, P.; Grygoruk, M. Long-Term Downstream Effects of a Dam on a Lowland River Flow Regime: Case Study of the Upper Narew. Water 2017, 9, 783. [Google Scholar] [CrossRef]
- Guo, C.; Zhu, G.; Paerl, H.W.; Zhu, M.; Yu, L.; Zhang, Y.; Liu, M.; Zhang, Y.; Qin, B. Extreme weather event may induce Microcystis blooms in the Qiantang River, Southeast China. Environ. Sci. Pollut. Res. 2018, 25, 22273–22284. [Google Scholar] [CrossRef]
- Ha, K.; Cho, E.-A.; Kim, H.-W.; Joo, G.-J. Microcystis bloom formation in the lower Nakdong River, South Korea: importance of hydrodynamics and nutrient loading. Mar. Freshw. Res. 1999, 50, 89–94. [Google Scholar] [CrossRef]
- Lei, L.; Li, C.; Peng, L.; Han, B.-P. Competition between toxic and non-toxic Microcystis aeruginosa and its ecological implication. Ecotoxicology 2015, 24, 1411–1418. [Google Scholar] [CrossRef]
- Budzyńska, A.; Rosińska, J.; Pełechata, A.; Toporowska, M.; Napiórkowska-Krzebietke, A.; Kozak, A.; Messyasz, B.; Pęczuła, W. Kokociński, M.; Szeląg-Wasielewska, E.; Grabowska, M.; Mądrecka, B.; Niedźwiecki, M.; Alcaraz-Parraga, P.; Pełechaty, M.; Karpowicz, M.; Pawlik-Skowrońska, B. Environmental factors driving the occurrence of the invasive cyanobacterium Sphaerospermopsis aphanizomenoides (Nostocales) in temperate lakes. Sci. Total Environ. 2019, 650, 1338–1347. [Google Scholar] [CrossRef] [PubMed]
- Paerl, H.W.; Havens, K.E.; Hall, N.S.; Otten, T.G.; Zhu, M.; Xu, H.; Zhu, G.; Qin, B. Mitigating a global expansion of toxic cyanobacterial blooms: confounding effects and challenges posed by climate change. Mar. Freshw. Res. 2020, 71, 579–592. [Google Scholar] [CrossRef]
- Górniak, A.; Zieliński, P.; Jekatierynczuk-Rudczyk, E.; Grabowska, M.; Suchowolec, T. The role of dissolved organic carbon in the shallow lowland reservoir ecosystem. Acta Hydroch. Hydrob. 2002, 30, 179–189. [Google Scholar] [CrossRef]
- Joung, S.-H.; Oh, H.-M.; You, K.-A. Dynamic variation of toxic and non-toxic Microcystis proportion in the eutrophic Daechung Reservoir in Korea. J. Microbiol. 2016, 54, 543–550. [Google Scholar] [CrossRef]
- Sidelev, S.; Zubishina, A.; Chernova, E. Distribution of microcystin-producing genes in Microcystis colonies from some Russian freshwaters: Is there any correlation with morphospecies and colony size? Toxicon 2020, 184, 136–142. [Google Scholar] [CrossRef]
- Krztoń, W.; Walusiak, E.; Wilk-Woźniak, E. Possible consequences of climate change on global water resources stored in dam reservoirs. Sci. Total. Environ. 2022, 830, 154646. [Google Scholar] [CrossRef] [PubMed]
- Grabowska, M.; Mazur-Marzec, H. The influence of hydrological conditions on phytoplankton community structure and cyanopeptide concentration in dammed lowland river. Environ. Monit. Assess. 2016, 188, 488. [Google Scholar] [CrossRef] [PubMed]
- Institute of Meteorology and Water Management National Research Institute. Available online: https://hydro.imgw.pl/#/station/hydro/152230120?
- TuTiempo.net. Climate Bialystok. http://en.tutiempo.net/climate/ws-122950.html. (accessed on 10 September 2024).
- Institute of Meteorology and Water Management National Research Institute? Available online: https://dane.imgw.pl/data/dane_pomiarowo_obserwacyjne/dane_hydrologiczne/miesieczne/?C=M;O=A (accessed on 8 December 2023).
- Grabowska, M.; Mazur-Marzec, H. Vertical distribution of cyanobacteria biomass and cyanotoxin production in polymictic Siemianówka Dam Reservoir. Arch. Pol. Fisheries 2014, 22, 41–51. [Google Scholar] [CrossRef]
- Neal, C.; Neal, M.; Wickham, H. Phosphate measurement in natural waters: two examples of analytical problems associated with silica interference using phosphomolybdic acid methodologies. Sci. Total. Environ. 2000, 251–252, 511–522. [Google Scholar] [CrossRef]
- Grabowska, M.; Kobos, J.; Toruńska-Sitarz, A.; Mazur-Marzec, H. Non-ribosomal peptides produced by Planktothrix agardhii from Siemianówka Dam Reservoir SDR (northeast Poland) Arch. Microbiol. 2014, 196, 697–707. [Google Scholar]
- Grabowska, M. Cyanoprokaryota blooms in the polyhumic Siemianówka dam reservoir in 1992-2003. Oceanol. Hydrobiol. Stud. 2005, 34, 73–85. [Google Scholar]
- Grabowska, M. Phytoplankton of Siemianówka dam reservoir. In Ecosystem of Siemianówka reservoir in 1990-2004 and its restoration, Ed. Górniak, A., Department of Hydrobiology University of Białystok, Białystok, Poland, 2006, 83–92 (in Polish).
- Grabowska, M. The role of a eutrophic lowland reservoir in shaping the composition of river phytoplankton. Ecohydrol. Hydrobiol. 2012, 12, 231–242. [Google Scholar] [CrossRef]
- Jurczak, T.; Tarczyńska, M.; Karlsson, K.; Meriluoto, J. Characterization and Diversity of Cyano- bacterial Hepatotoxins (Microcystins) in Blooms from Polish Freshwaters Identified by Liquid Chromatography-Electrospray Ionisation Mass Spectrometry. Chromatographia 2004, 59, 571–578. [Google Scholar] [CrossRef]
- Grabowska, M.; Pawlik-Skowrońska, B. Replacement of chroococcales and nostocales by oscillatoriales caused a significant increase in microcystin concentrations in a dam reservoir. Oceanol. Hydrobiol. Stud. 2008, 37, 23–33. [Google Scholar] [CrossRef]
- Grabowska, M.; Mazur-Marzec, H. The effect of cyanobacterial blooms in the Siemianówka Dam Reservoir on the phytoplankton structure in the Narew River. Oceanol. Hydrobiol. Stud. 2011, 40, 19–26. [Google Scholar] [CrossRef]
- Paerl, H.W.; Barnard, M.A. Mitigating the global expansion of harmful cyanobacterial blooms: Moving targets in a human- and climatically-altered world. Harmful Algae 2020, 96, 101845. [Google Scholar] [CrossRef] [PubMed]
- Diniz, L.P.; Petsch, D.K.; Mantovano, T.; Rodrigues, L.C.; Agostinho, A.A.; Bonecker, C.C. A prolonged drought period reduced temporal β diversity of zooplankton, phytoplankton, and fish metacommunities in a Neotropical floodplain. Hydrobiologia 2023, 850, 1073–1089. [Google Scholar] [CrossRef]
- Coffey, R.; Paul, M.J.; Stamp, J.; Hamilton, A.; Johnson, T. A Review of water quality responses to air temperature and precipitation changes 2: Nutrients, algal blooms, sediment, pathogens. JAWRA J. Am. Water Resour. Assoc. 2018, 55, 844–868. [Google Scholar] [CrossRef] [PubMed]
- Mosley, L.M. Drought impacts on the water quality of freshwater systems; review and integration. Earth-Science Rev. 2015, 140, 203–214. [Google Scholar] [CrossRef]
- Wilk-Woźniak, E.; Krztoń, W.; Budziak, M.; Walusiak, E.; Žutinič, P.; Udovič, M.G.; Koreivienė, J.; Karosienė, J.; Kasperovičienė, J.; Kobos, J.; et al. Harmful blooms across a longitudinal gradient in central Europe during heatwave: Cyanobacteria biomass, cyanotoxins, and nutrients. Ecol. Indic. 2024, 160, 111929. [Google Scholar] [CrossRef]
- Savadova-Ratkus, K.; Mazur-Marzec, H.; Karosienė, J.; Kasperovičienė, J.; Paškauskas, R.; Vitonytė, I.; Koreivienė, J. Interplay of Nutrients, Temperature, and Competition of Native and Alien Cyanobacteria Species Growth and Cyanotoxin Production in Temperate Lakes. Toxins 2021, 13, 23. [Google Scholar] [CrossRef]
- Chaffin, J.D.; Davis, T.W.; Smith, D.J.; Baer, M.M.; Dick, G.J. Interactions between nitrogen form, loading rate, and light intensity on Microcystis and Planktothrix growth and microcystin production. Harmful Algae 2018, 73, 84–97. [Google Scholar] [CrossRef]
- Jöhnk, K.D.; Huisman, J.; Sharples, J.; Sommeijer, B.; Visser, P.M.; Stroom, J.M. Summer heatwaves promote blooms of harmful cyanobacteria. Glob. Chang. Biol. 2007, 14, 495–512. [Google Scholar] [CrossRef]
- Paerl, H.W.; Paul, V.J. Climate change: Links to global expansion of harmful cyanobacteria. Water Res. 2012, 46, 1349–1363. [Google Scholar] [CrossRef]
- Huisman, J.; Codd, G.A.; Paerl, H.W.; Ibelings, B.W.; Verspagen, J.M.H.; Visser, P.M. Cyanobacterial blooms. Nat. Rev. Microbiol. 2018, 16, 471–483. [Google Scholar] [CrossRef] [PubMed]
- Gągała, I.; Izydorczyk, K.; Skowron, A.; Kamecka-Plaskota, D.; Stefaniak, K.; Kokociński, M.; Mankiewicz-Boczek, J. Appearance of toxigenic cyanobacteria in two Polish lakes dominated by Microcystis aeruginosa and Planktothrix agardhii and environmental factors influence. Ecohydrol. Hydrobiol. 2010, 10, 25–34. [Google Scholar] [CrossRef]
- Zhang, Z.; Fan, X.; Peijnenburg, W.; Zhang, M.; Sun, L.; Zhai, Y.; Yu, Q.; Wu, J.; Lu, T.; Qian, H. Alteration of dominant cyanobacteria in different bloom periods caused by abiotic factors and species interactions. J. Environ. Sci. 2020, 99, 1–9. [Google Scholar] [CrossRef] [PubMed]
- Monchamp, M.-E.; Pick, F.R.; Beisner, B.E.; Maranger, R. Nitrogen Forms Influence Microcystin Concentration and Composition via Changes in Cyanobacterial Community Structure. PLOS ONE 2014, 9, e85573. [Google Scholar] [CrossRef] [PubMed]
- Wu, N.; Schmalz, B.; Fohrer, N. Distribution of phytoplankton in a German lowland river in relation to environmental factors. J. Plankton Res. 2010, 33, 807–820. [Google Scholar] [CrossRef]
- Harke, M.J.; Steffen, M.M.; Gobler, C.J.; Otten, T.G.; Wilhelm, S.W.; Wood, S.A.; Paerl, H.W. A review of the global ecology, genomics, and biogeography of the toxic cyanobacterium, Microcystis spp. Harmful Algae 2016, 54, 4–20. [Google Scholar] [CrossRef]
- Liu, Y.; Chen, Y.; Fang, H.; Lu, H.; Wu, X.; Yu, G.; Nakano, S.-I.; Li, R. Relationship between morphospecies and microcystin-producing genotypes of Microcystis species in Chinese freshwaters. J. Oceanol. Limnol. 2021, 39, 1926–1937. [Google Scholar] [CrossRef]
- Suominen, S.; Brauer, V.S.; Rantala-Ylinen, A.; Sivonen, K.; Hiltunen, T. Competition between a toxic and a non-toxic Microcystis strain under constant and pulsed nitrogen and phosphorus supply. Aquat. Ecol. 2016, 51, 117–130. [Google Scholar] [CrossRef]
- Chan, W.S.; Recknagel, F.; Cao, H.; Park, H.-D. Elucidation and short-term forecasting of microcystin concentrations in Lake Suwa (Japan) by means of artificial neural networks and evolutionary algorithms. Water Res. 2007, 41, 2247–2255. [Google Scholar] [CrossRef]
- Gągała, I.; Izydorczyk, K.; Jurczak, T.; Pawełczyk, J.; Dziadek, J.; Wojtal-Frankiewicz, A.; Jóźwik, A.; Jaskulska, A.; Mankiewicz-Boczek, J. Role of Environmental Factors and Toxic Genotypes in the Regulation of Microcystins-Producing Cyanobacterial Blooms. Microb. Ecol. 2013, 67, 465–479. [Google Scholar] [CrossRef]
- Duan, X.; Zhang, C.; Struewing, I.; Li, X.; Allen, J.; Lu, J. Cyanotoxin-encoding genes as powerful predictors of cyanotoxin production during harmful cyanobacterial blooms in an inland freshwater lake: Evaluating a novel early-warning system. Sci. Total. Environ. 2022, 830, 154568. [Google Scholar] [CrossRef] [PubMed]
Figure 1.
Map of the study area with the location of the sampling stations.
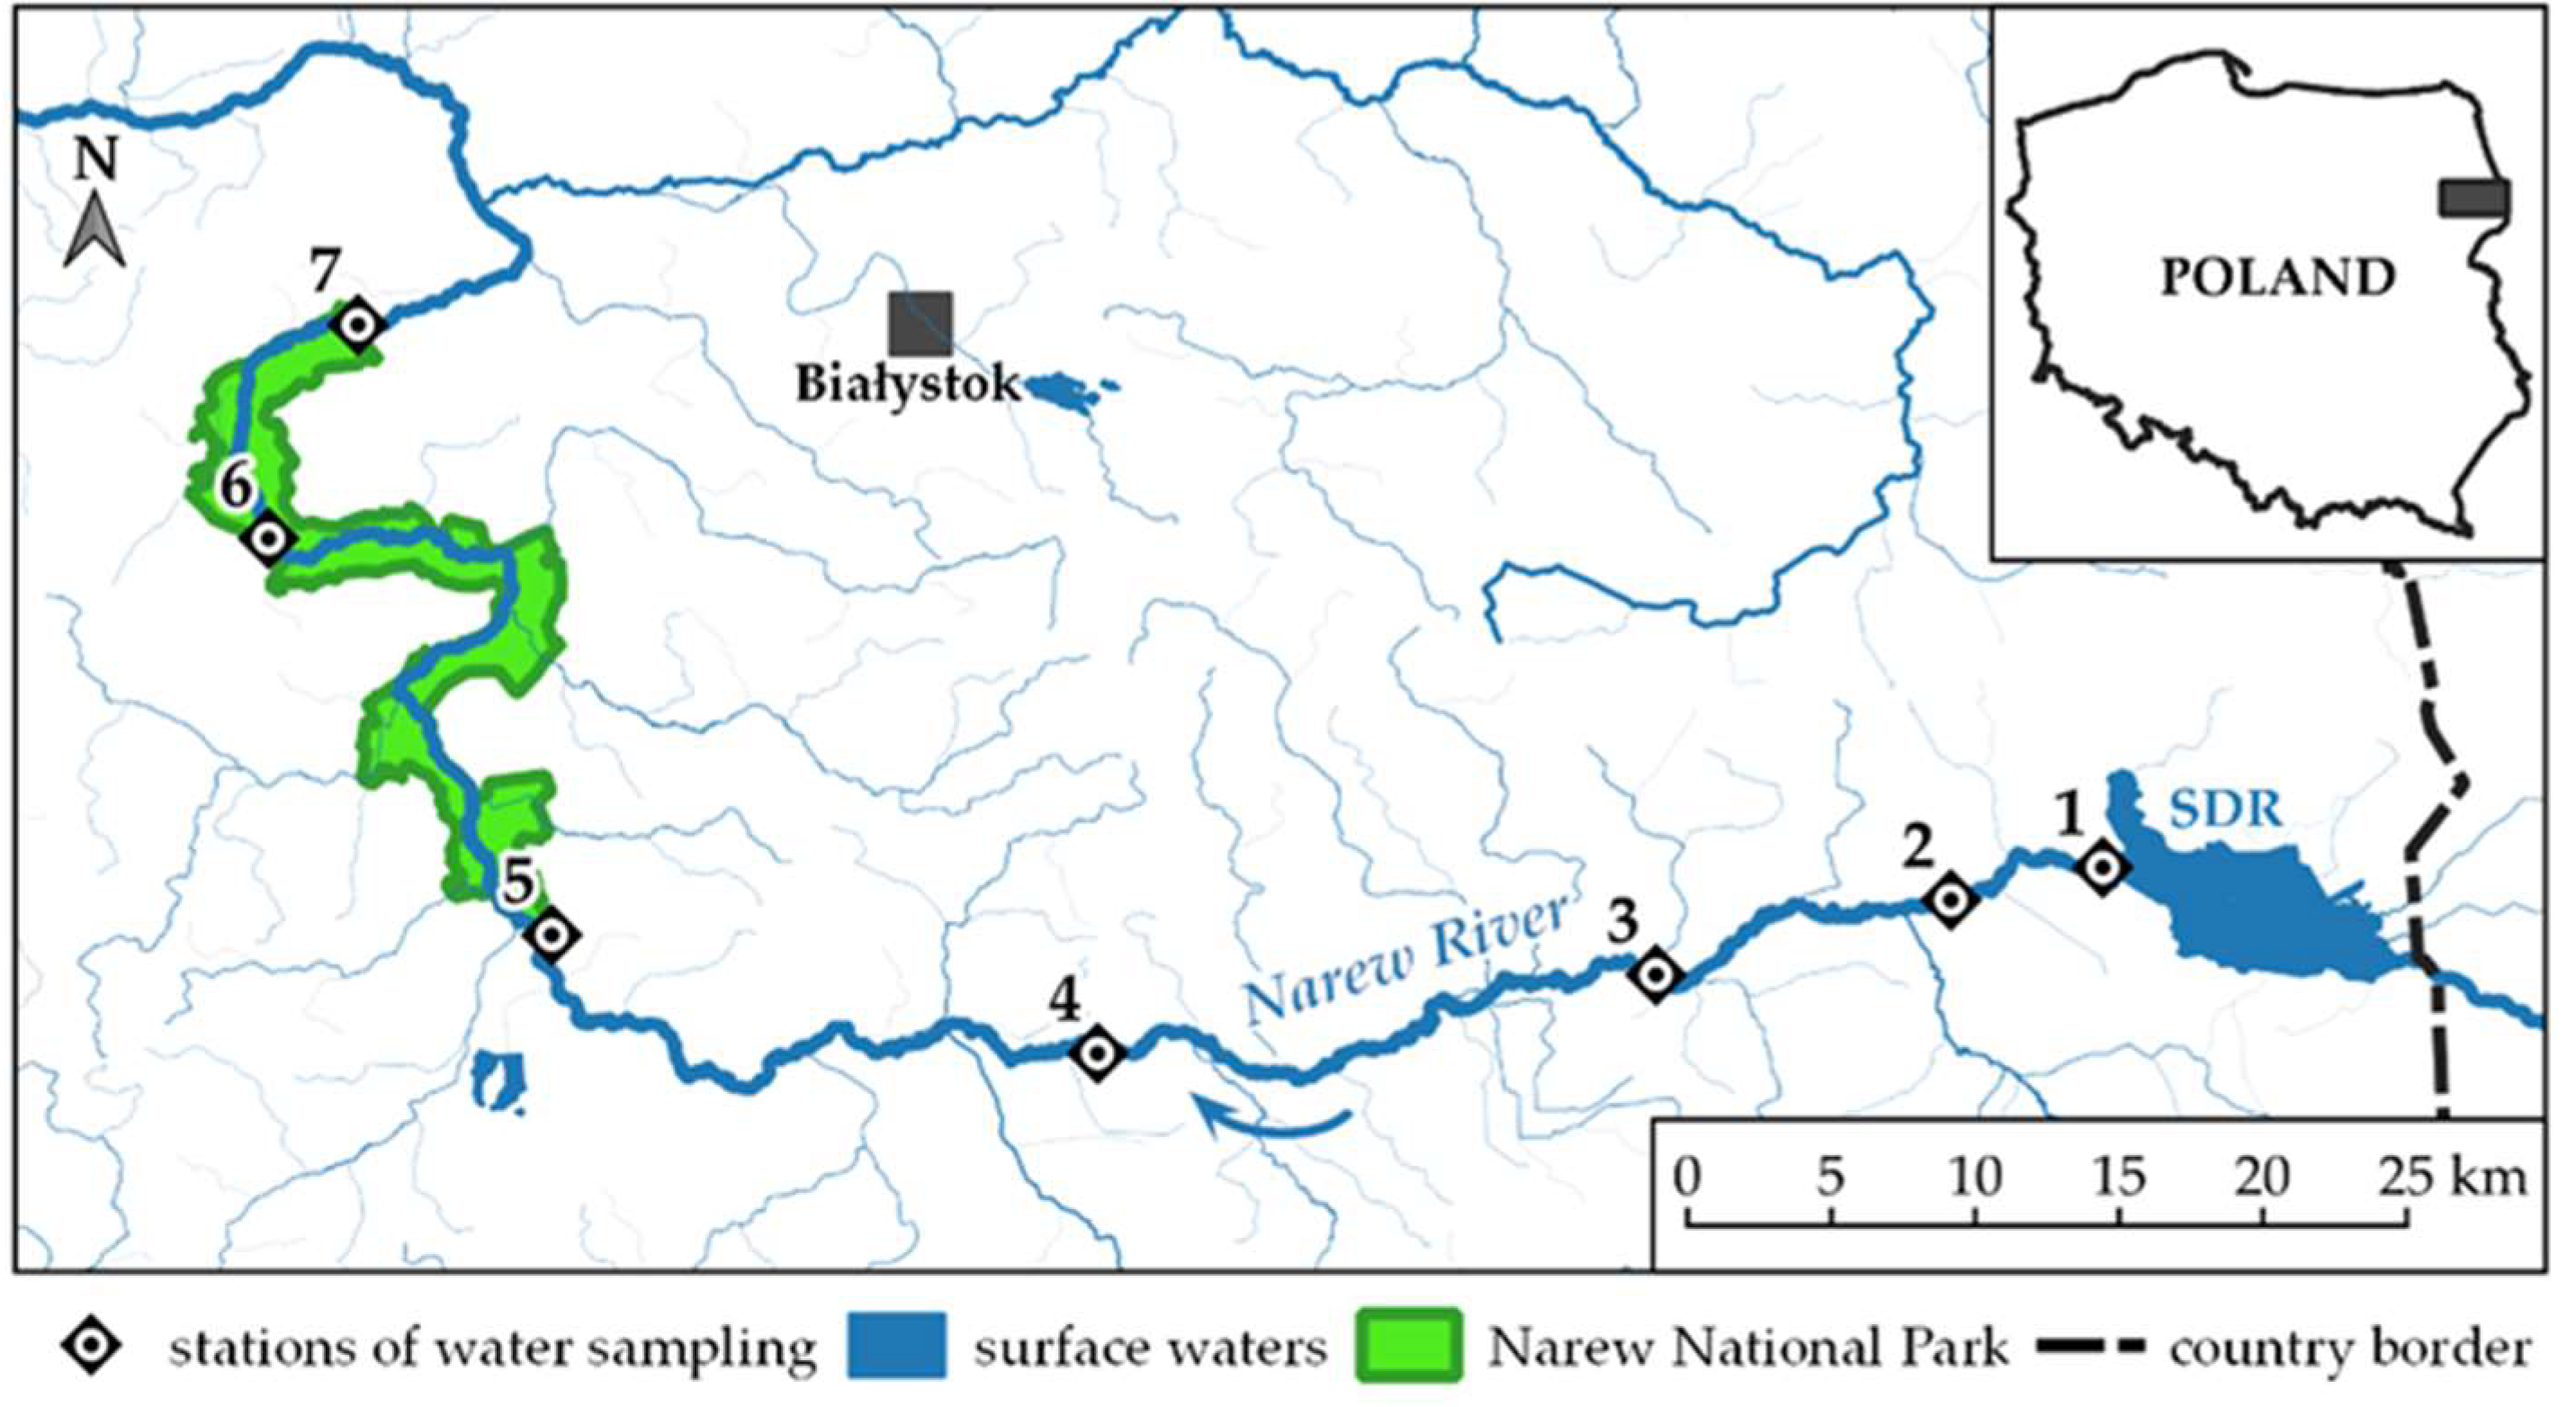
Figure 2.
River bed at station No. 6 during weather extremes: drought in August 2015 (a) and floods in October 2010 (b).
Figure 2.
River bed at station No. 6 during weather extremes: drought in August 2015 (a) and floods in October 2010 (b).
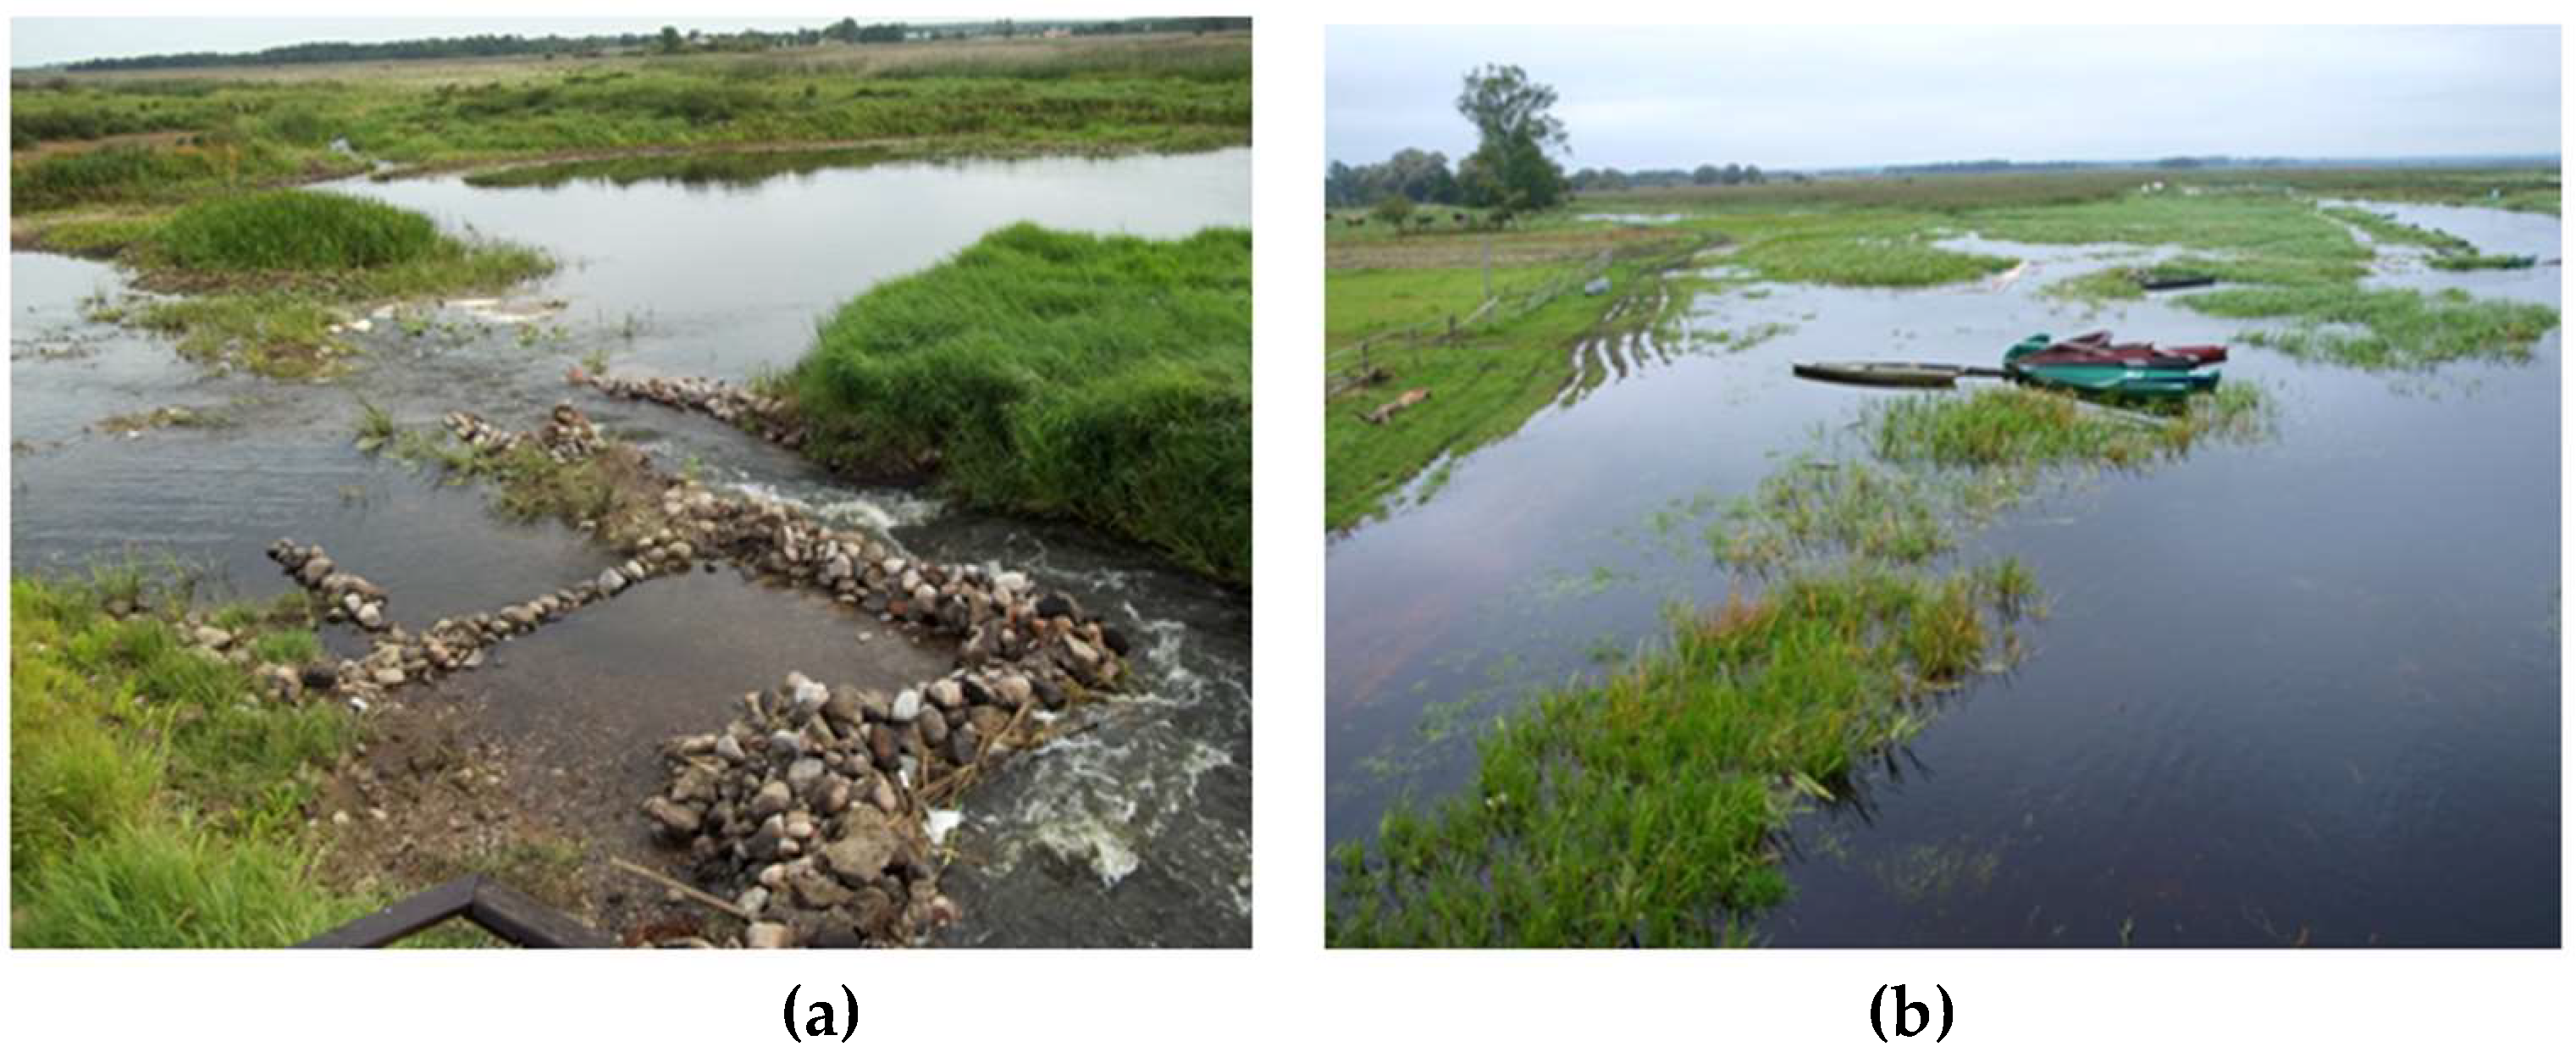
Figure 3.
Changes of water level in the SDR (a), outflow from SDR (b) and discharge in the Narew River at station No. 3 (c), and No. 5 (d) in 2015, 2018 and 2020; monthly averages with indication of daily averages from the date of sampling; AWL - average water level, ALQ - average low discharge.
Figure 3.
Changes of water level in the SDR (a), outflow from SDR (b) and discharge in the Narew River at station No. 3 (c), and No. 5 (d) in 2015, 2018 and 2020; monthly averages with indication of daily averages from the date of sampling; AWL - average water level, ALQ - average low discharge.
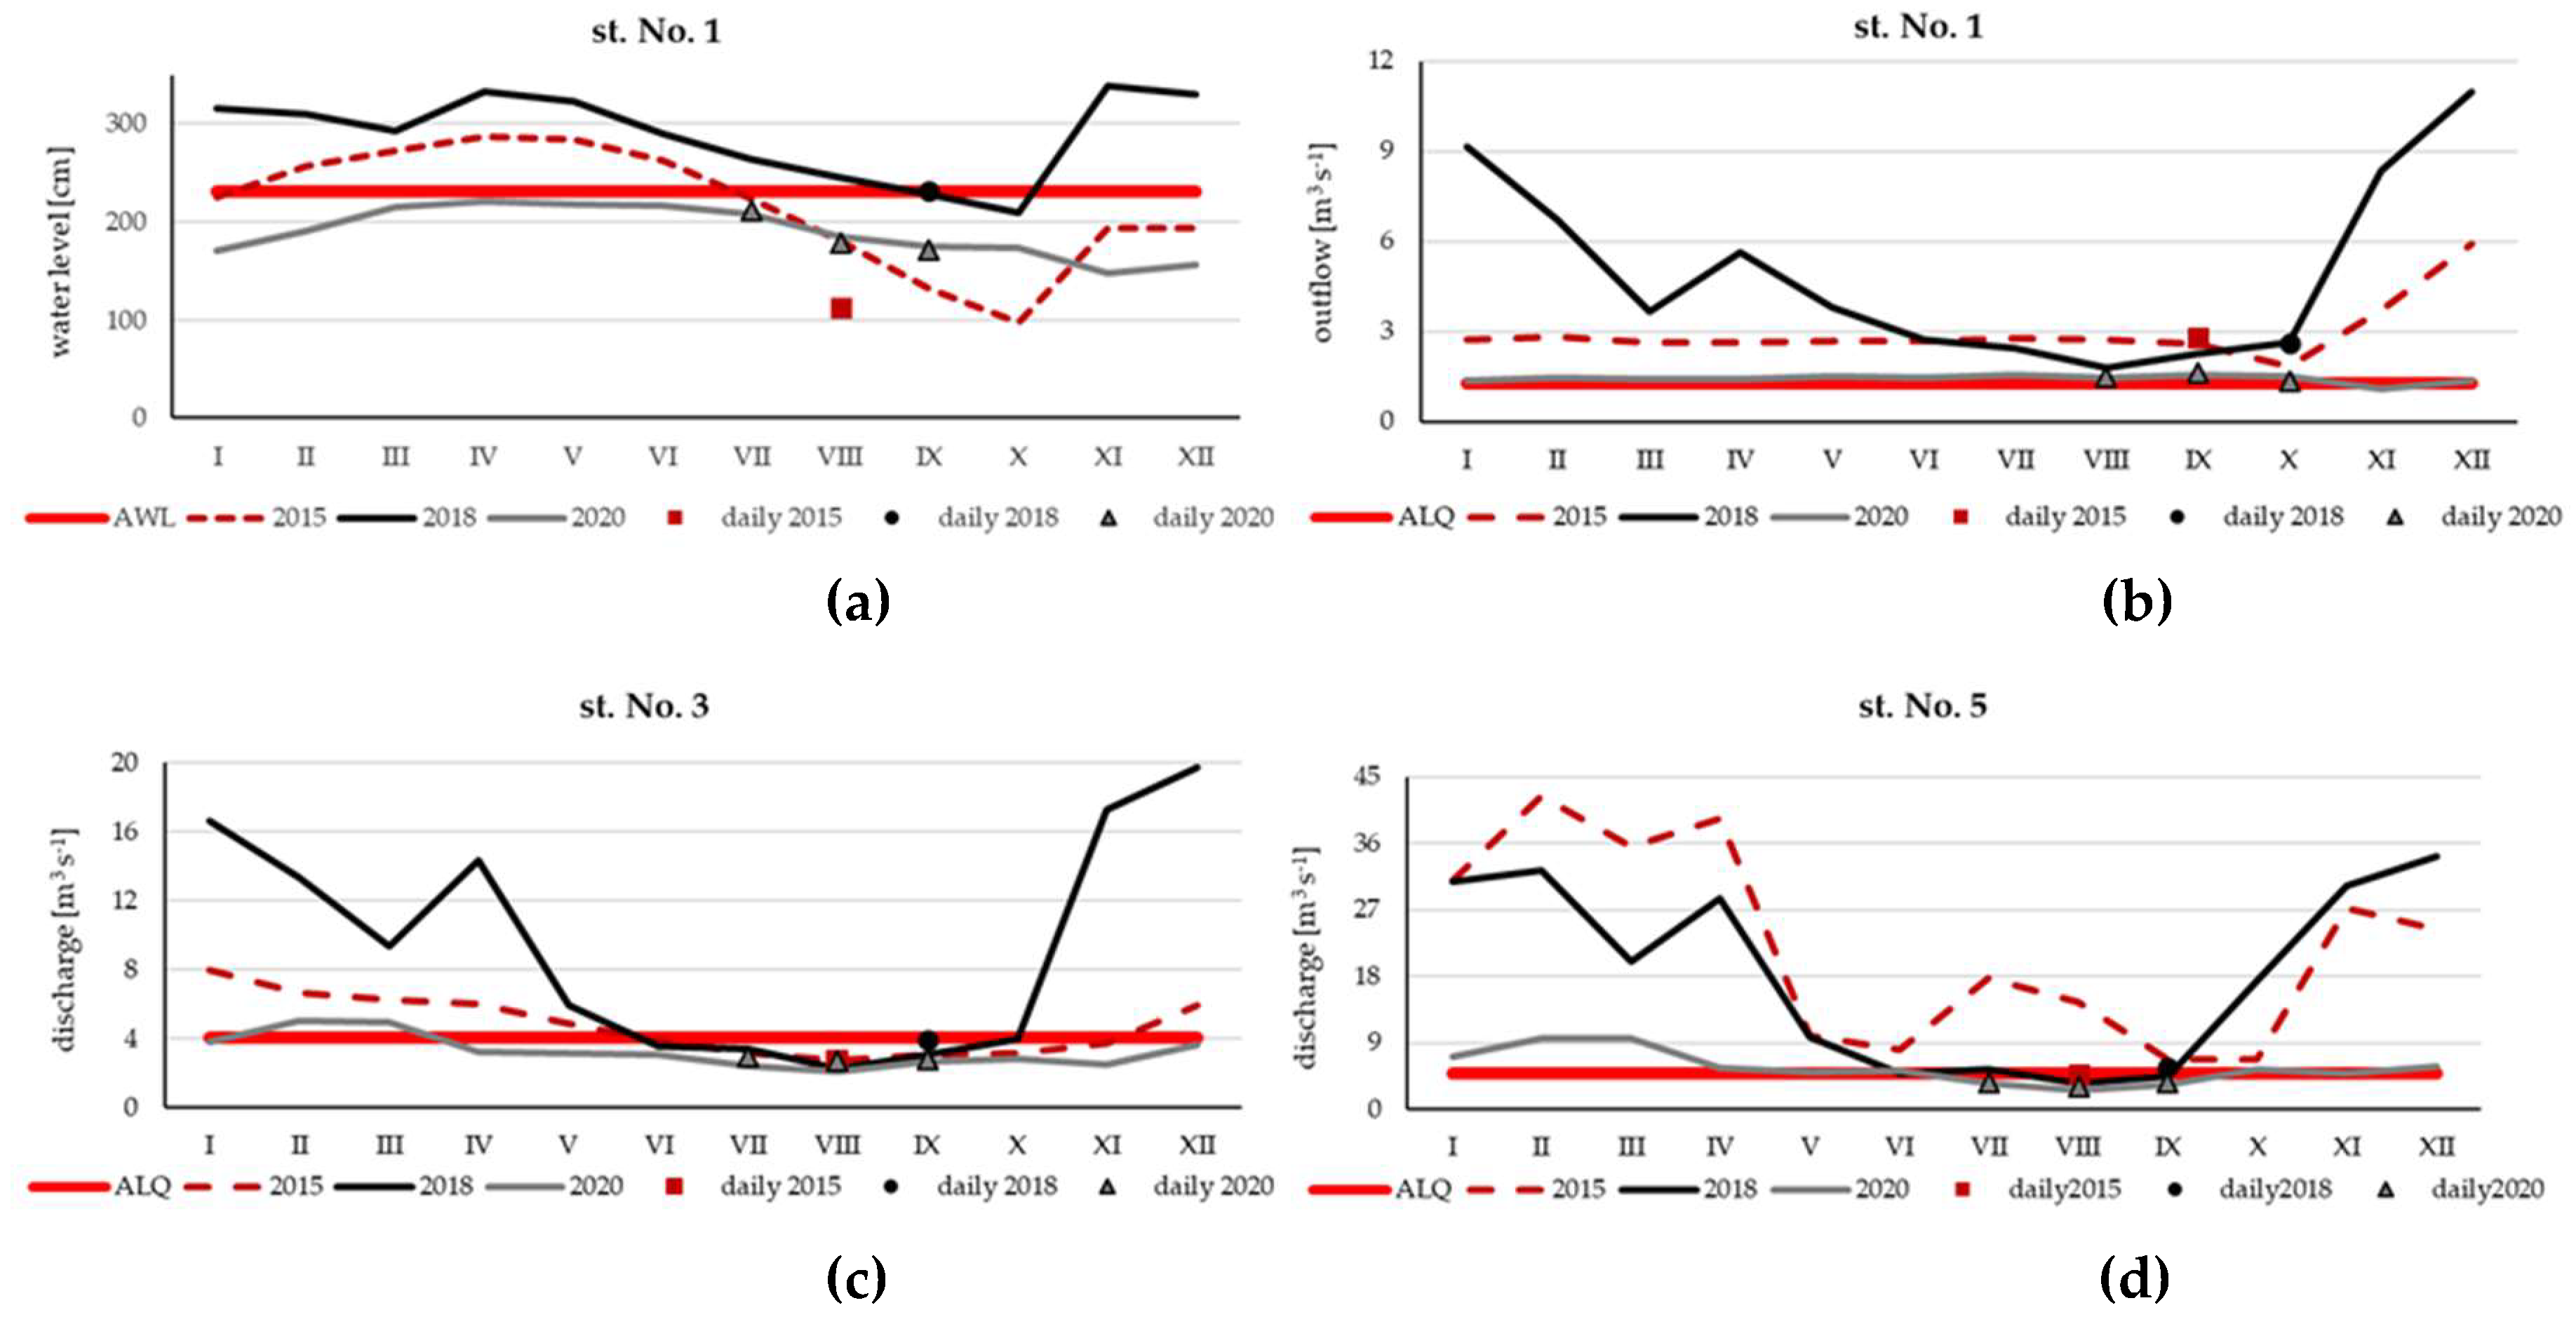
Figure 4.
Comparison of phytoplankton community structure in the surface layer in SDR (st. No. 1S) in 2015, 2018 and 2020; Cyano. - Cyanobacteria, Dino. - Dinophyceae, Bacill.- Bacillariophyceae.
Figure 4.
Comparison of phytoplankton community structure in the surface layer in SDR (st. No. 1S) in 2015, 2018 and 2020; Cyano. - Cyanobacteria, Dino. - Dinophyceae, Bacill.- Bacillariophyceae.
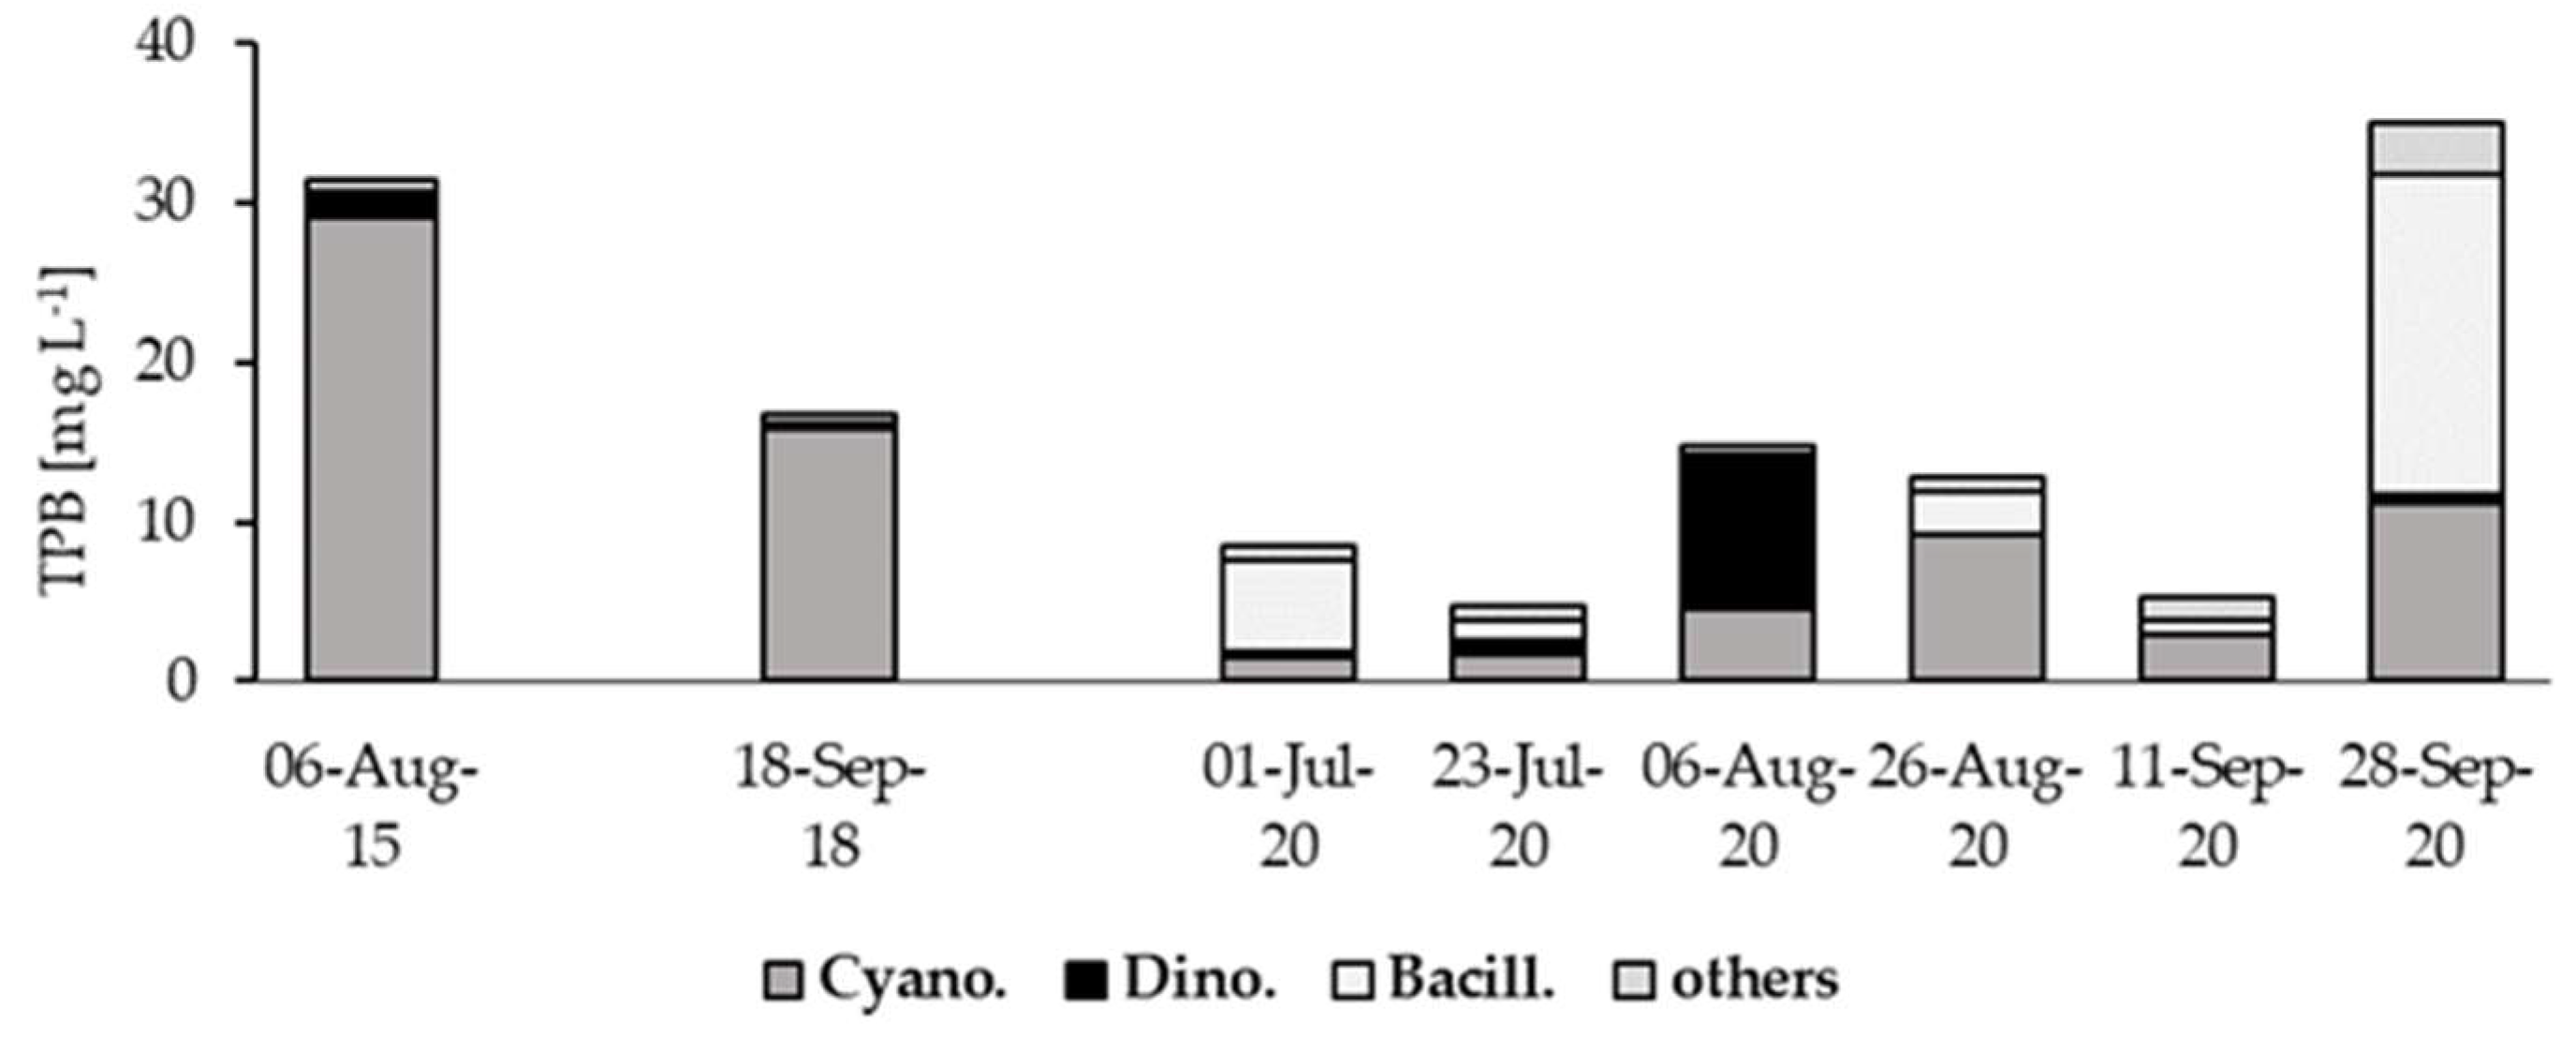
Figure 5.
Phytoplankton composition, total concentration of microcystins and their individual variants in: August 2015 (a-c), September 2018 (d-f), July 2020 (g-i), August 2020 (j-l) and September 2020 (m-o).
Figure 5.
Phytoplankton composition, total concentration of microcystins and their individual variants in: August 2015 (a-c), September 2018 (d-f), July 2020 (g-i), August 2020 (j-l) and September 2020 (m-o).
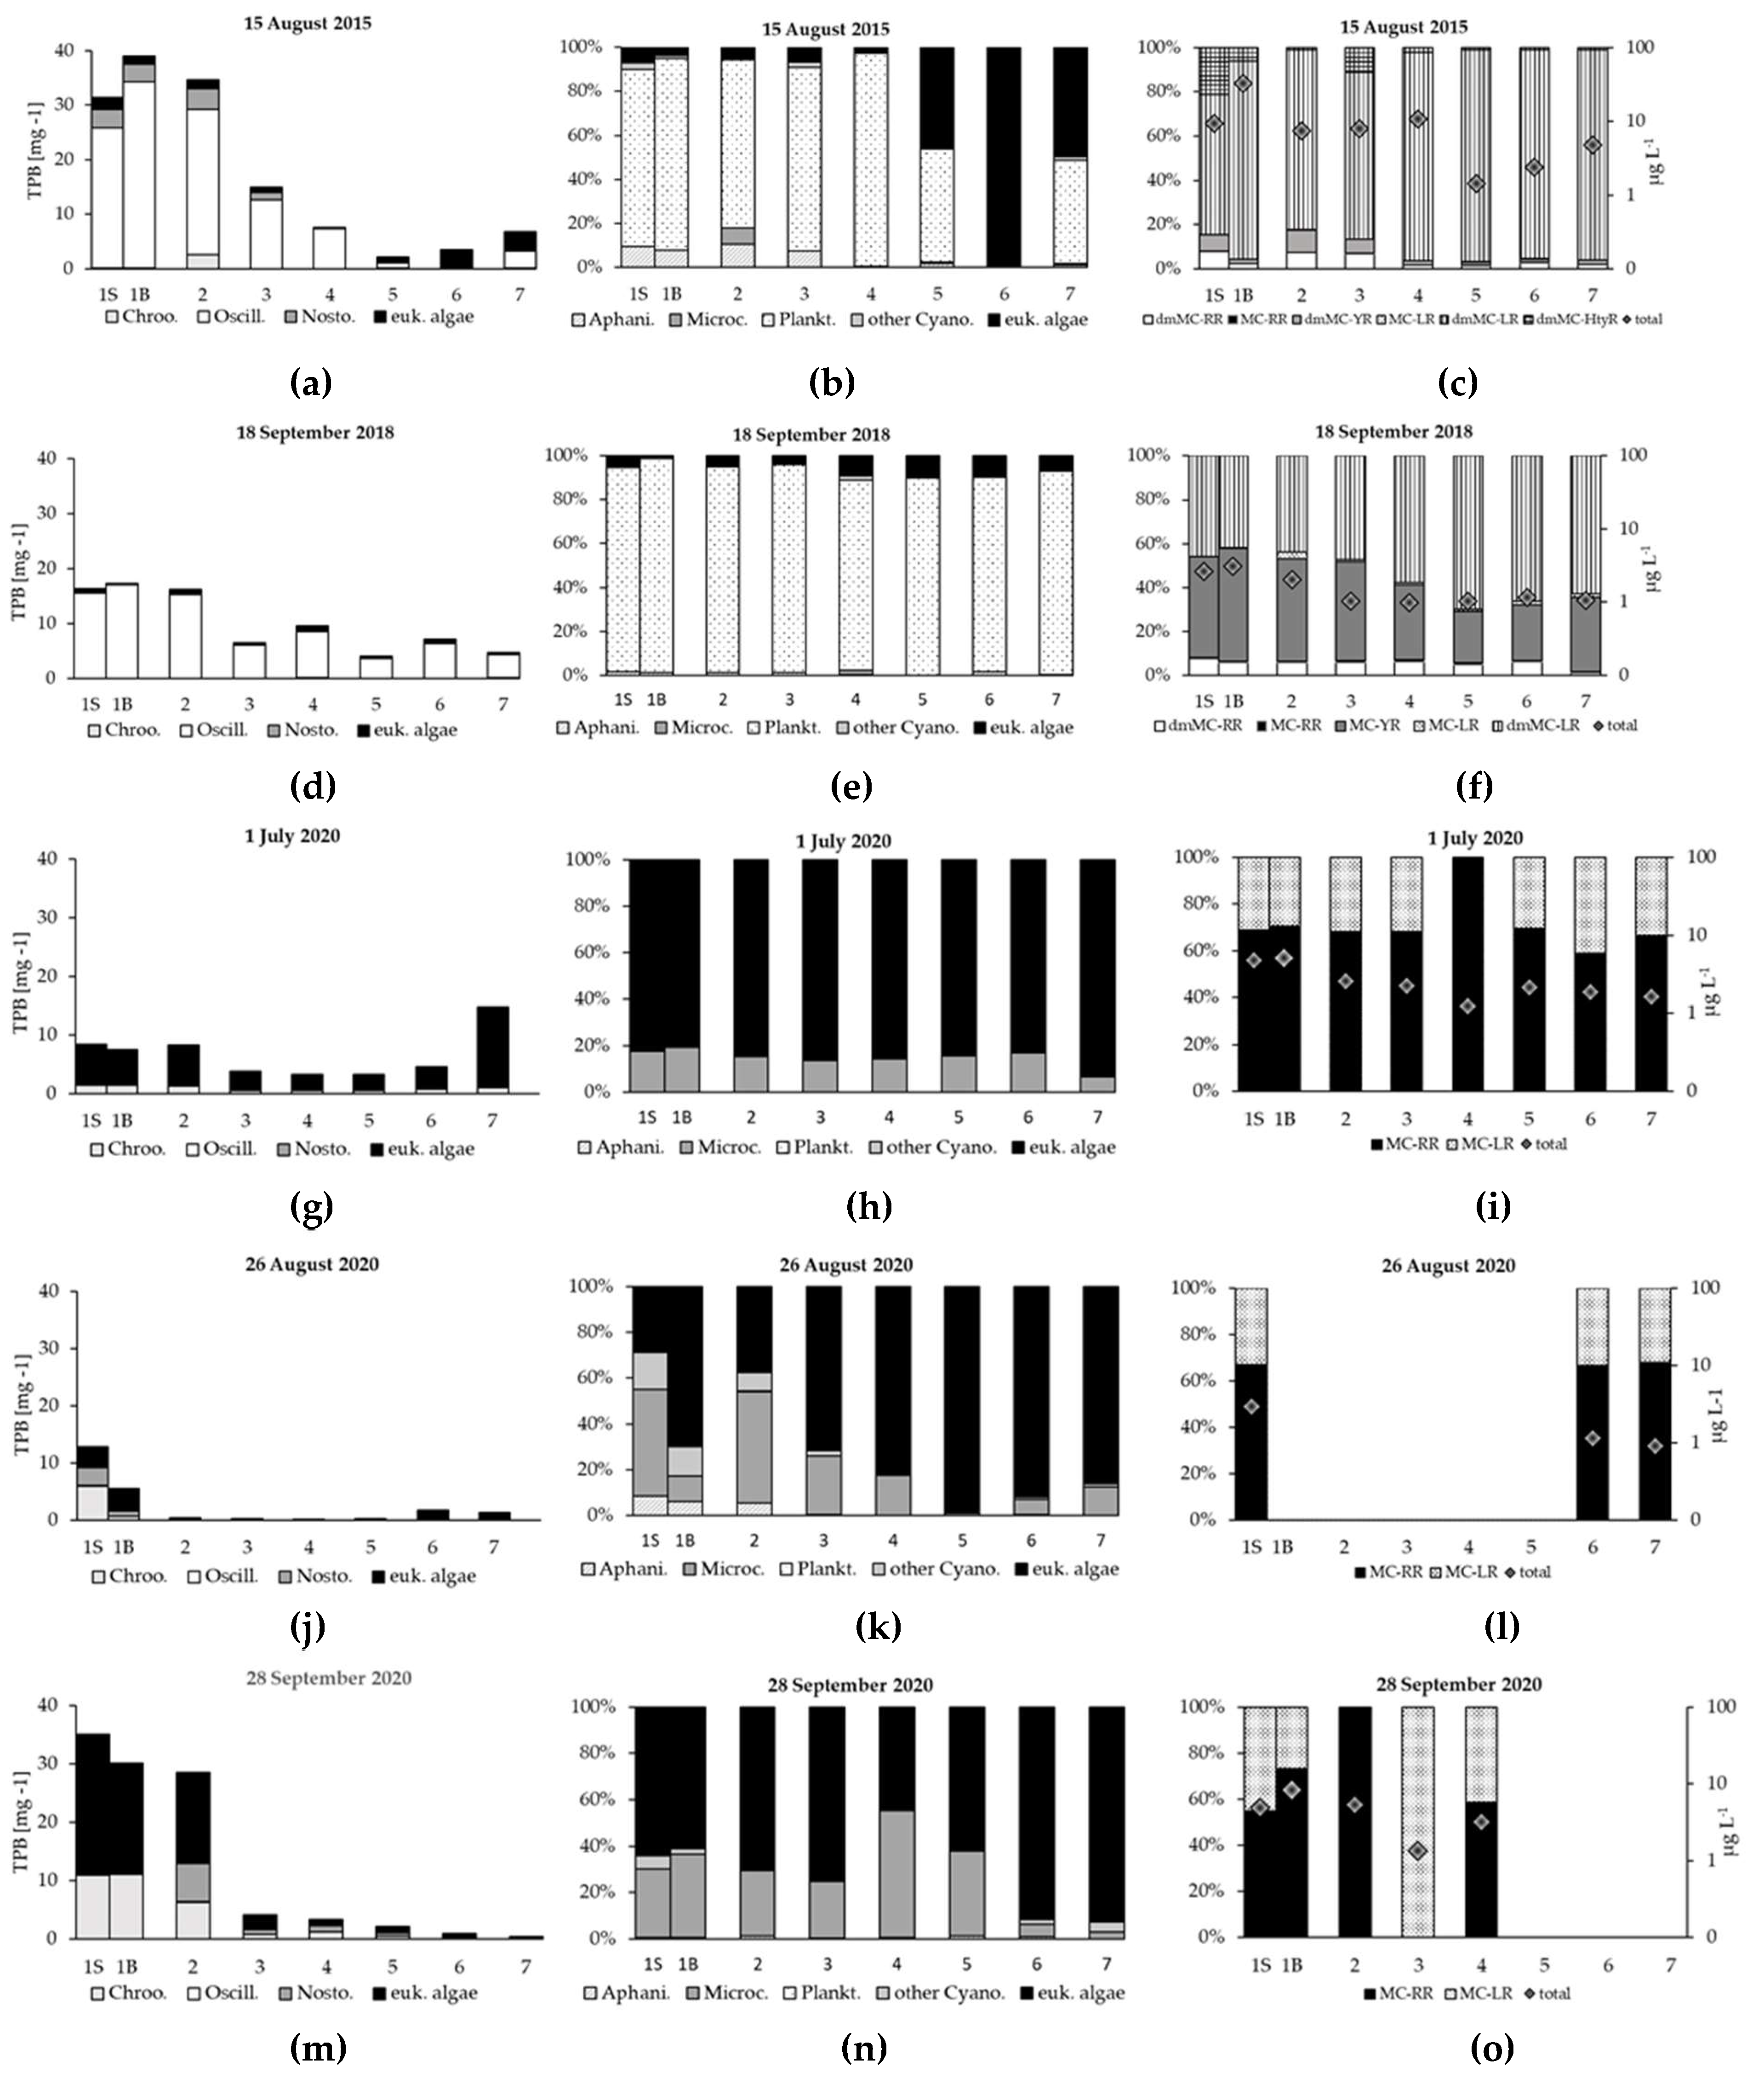
Figure 6.
Changes in total phytoplankton biomass (TPB), cyanobacteria biomass (TCB) at riverine station No. 3 (a), No. 4 (b) and No. 5 (c) in relations to reservoir outflow.
Figure 6.
Changes in total phytoplankton biomass (TPB), cyanobacteria biomass (TCB) at riverine station No. 3 (a), No. 4 (b) and No. 5 (c) in relations to reservoir outflow.
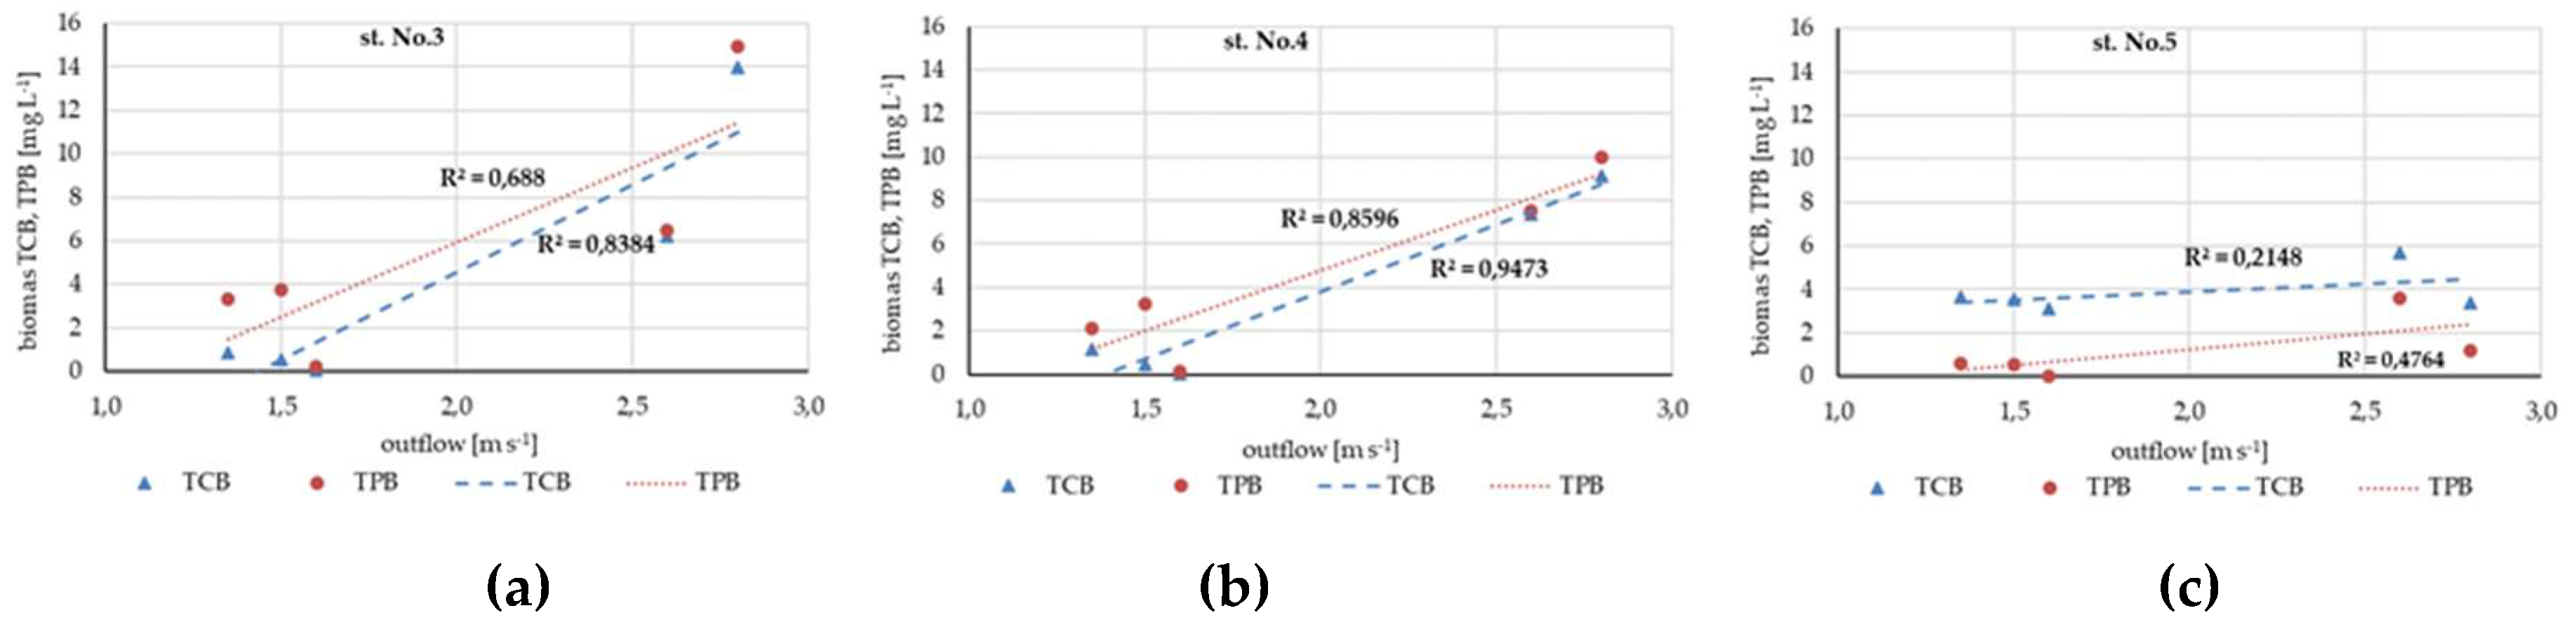
Table 2.
Oligopeptide profile in the reservoir and outflowing river; reservoir station: No. 1S - surface of reservoir, No. 1B - bottom of reservoir; river stations with distance from reservoir: No. 2 (9.1 km), No. 3 (25.5 km), No. 4 (56.0 km), No. 5 (88.2 km), No. 6 (118.2 km), No. 7 (132.6 km);.
Table 2.
Oligopeptide profile in the reservoir and outflowing river; reservoir station: No. 1S - surface of reservoir, No. 1B - bottom of reservoir; river stations with distance from reservoir: No. 2 (9.1 km), No. 3 (25.5 km), No. 4 (56.0 km), No. 5 (88.2 km), No. 6 (118.2 km), No. 7 (132.6 km);.
| No | m/z | Class | Name of oligopeptide | 2015 | 2018 | 2020 | |
|---|---|---|---|---|---|---|---|
| 1 | 1057 | MC | MC-Prhcyst(O)R | dam | 1S | ||
| river | |||||||
| 2 | 1045 | MC | [Asp3]MC-HtyR | dam | 1S, 1B | ||
| river | 2-7 | ||||||
| 3 | 1038 | MC | MC-RR | dam | 1S, 1B | 1S, 1B | 1S, 1B |
| river | 2-7 | 2-7 | 2-7 | ||||
| 4 | 1031 | MC | [Asp3]MC-YR | dam | 1S, 1B | ||
| river | 2-7 | ||||||
| 5 | 1024 | MC | [Asp3]MC-RR | dam | 1S, 1B | 1S, 1B | |
| river | 2-7 | 2-7 | |||||
| 6 | 995 | MC | MC-LR | dam | 1S, 1B | 1S, 1B | |
| river | 2, 5-6 | 2-7 | 2-7 | ||||
| 7 | 981 | MC | [Asp3]MC-LR | dam | 1S, 1B | 1S, 1B | 1S, 1B |
| river | 2-7 | 2-7 | |||||
| 8 | 1045 | MC | MC-YR | dam | 1S, 1B | ||
| river | 2-7 | ||||||
| 9 | 1015 | CP | X-X-[Thr-Arg-Ahp-Phe-MeTyr-Val] | dam | 1S | ||
| river | 4 | ||||||
| 10 | 973 | CP | Hex-Gln-[Thr-Lys-Ahp-Leu-MeTyr- | dam | 1S | ||
| river | |||||||
| 11 | 917 | CP | X-X-[Thr-X-Ahp-Phe-MeTyr-X] | dam | 1S | ||
| river | 4 | ||||||
| 12 | 905 | CP | X-X-[Thr-X-Ahp-Phe-MeTyr-X] | dam | 1S, 1B | ||
| river | |||||||
| 13 | 887 | CP | X-X-[Thr-X-Ahp-Phe-MeTyr-Ile] | dam | 1S, 1B | ||
| river | 3-7 | ||||||
| 14 | 858 | CP | [Phe-MeAla-HTyr-Ile-Lys]CO-Tyr | dam | 1S, 1B | 1B | |
| river | 2-5, 7 | 2, 4-7 | |||||
| 15 | 916 | AP | [Ile-MeHty-HTyr-Val-Lys]CO-Tyr | dam | 1S, 1B | 1B | |
| river | 2-4, 6- | 2, 4-5, 7 | |||||
| 16 | 910 | AP G | [Tyr-MeLeu-HTyr-Ile-Lys]CO-Arg | dam | 1S, 1B | 1B | |
| river | 2-4, 6-7 | 2, 5-7 | |||||
| 17 | 851 | AP F | [Phe-MeAla-HTyr-Ile-Lys]CO-Arg | dam | 1S, 1B | 1B | |
| river | 2-4, 6-7 | 2, 4-7 | |||||
| 18 | 844 | AP A | [Phe-MeAla-HTyr-Val-Lys]CO-Tyr | dam | 1S, 1B | 1B | |
| river | 2-7 | 2, 4-7 | |||||
| 19 | 837 | AP B | [Phe-MeAla-HTyr-Val-Lys]CO-Arg | dam | 1S, 1B | 1B | |
| river | 2-7 | 2, 4-7 | |||||
| 20 | 801 | PL | [Leu-Val-Met-Phe-Arg-154] | dam | 1B | 1B | |
| river | 2-4 | 5-6 | |||||
| 21 | 765 | AER | Cl-Hpla-Leu-(Xyl)Choi-Aeap | dam | 1S, 1B | ||
| river | 2-4 | ||||||
| 22 | 749 | Cl-AER | Cl-Pla-Leu-(Xyl)Choi-Aeap | dam | 1S, 1B | ||
| river | 2-4 | ||||||
| 23 | 715 | AER | Pla-Leu-(Xyl)Choi-Aeap | dam | 1S, 1B | 1B | |
| river | 2-4 | 2, 4-7 | |||||
| 24 | 707 | AER | Hpla-Leu-(Xyl)Choi-Agm | dam | 1S, 1B | ||
| river | 2-3 | ||||||
| 25 | 691 | AER | Pla-Leu-(Xyl)Choi-Agm | dam | 1S, 1B | 1B | |
| river | 2-4 | 2, 4-7 | |||||
| 26 | 653 | AER | Hpla-Tyr-Choi-Argal | dam | |||
| river | 4-5 | ||||||
| 27 | 643 | AER | Cl2-Hpla-Tyr-Choi-Agm | dam | 1S, 1B | ||
| river | |||||||
| 28 | 637 | AER | Cl-Hpla-Leu-Choi-Argal | dam | 1S | 1B | |
| river | 2-4, 7 | 2, 6-7 | 3, 5 | ||||
| 29 | 625 | MG | ClAhda-Tyr-MeLeu-Pro | dam | 1B | ||
| river | 2, 4-7 | ||||||
| 30 | 621 | AER | X-Leu-Choi-Agm | dam | 1S, 1B | 1B | |
| river | 2-5, 7 | 2, 4-7 | |||||
| 31 | 609 | AER | Cl-Hpla-Leu-Choi-Agm | dam | 1B | 1B | |
| river | 2-3 | 2, 4, 6-7 | |||||
| 32 | 587 | AER | X-Leu-Choi-Agm | dam | 1S, 1B | 1B | |
| river | 2-4, 7 | 2, 5 - 7 | |||||
| 33 | 593 | MG | ClAhda-Tyr-MeLeu-Pro | dam | 1S | 1B | |
| river | 2, 4 - 7 | ||||||
| 34 | 561 | AERD | (Pren)2Ile-Val-Pro-methiazole | dam | 1S, 1B | 1B | 1S, 1B |
| river | 2-7 | 2-6 |
AER - aeruginosin, AP - anabaenopeptin, CP - cyanopeptolin, MC - microcystin, MG - microginin, PL- planktocyclin, AERD - aeruginosamide, X - unidentified residue of the peptide.
Table 3.
Correlation between cyanobacteria biomass and total microcystins concentration during Oscillatoriales (2015 and 2018) and Chroococcales (2020) dominance; 2015&2018: SDR n = 4, NR n= 12; SDR& NR n= 16; 2020: SDR n = 9, NR n= 18; SDR&NR n= 27.
Table 3.
Correlation between cyanobacteria biomass and total microcystins concentration during Oscillatoriales (2015 and 2018) and Chroococcales (2020) dominance; 2015&2018: SDR n = 4, NR n= 12; SDR& NR n= 16; 2020: SDR n = 9, NR n= 18; SDR&NR n= 27.
| Species/order | season | SDR | NR | SDR&NR |
|---|---|---|---|---|
| P. agardhii | 2015 &2018 | 0.953 | 0.478 | 0.725 |
| p=0.047 | p=0.116 | p=0.001 | ||
| Oscillatoriales | 2015 & 2018 | 0.947 | 0.482 | 0.725 |
| p=0.054 | p=0.113 | p=0.001 | ||
| Chroococcales | 2015 & 2018 | 0.132 | 0.409 | 0.070 |
| p=0.868 | p=0.186 | p=0.796 | ||
| Nostocales | 2015 & 2018 | 0.724 | 0.591 | 0.693 |
| p=0.276 | p=0.043 | p=0.003 | ||
| Cyanobacteria | 2015 & 2018 | 0.921 | 0.501 | 0.717 |
| p=0.079 | p=0.097 | p=0.002 | ||
| P. agardhii | 2020 | n.d. | 0.046 | -0.075 |
| p=0.860 | p=0.708 | |||
| Oscillatoriales | 2020 | 0.252 | 0.161 | 0.539 |
| p=0.513 | p=0.524 | p=0.004 | ||
| Chroococcales | 2020 | 0.631 | 0.751 | 0.779 |
| p=0.069 | p=0.000 | p=0.000 | ||
| Nostocales | 2020 | 0.378 | 0.663 | 0.953 |
| p=0.315 | p=0.003 | p=0.047 | ||
| Cyanobacteria | 2020 | 0.691 | 0.839 | 0.779 |
| p=0.039 | p=0.000 | p=0.000 |
Disclaimer/Publisher’s Note: The statements, opinions and data contained in all publications are solely those of the individual author(s) and contributor(s) and not of MDPI and/or the editor(s). MDPI and/or the editor(s) disclaim responsibility for any injury to people or property resulting from any ideas, methods, instructions or products referred to in the content. |
© 2024 by the authors. Licensee MDPI, Basel, Switzerland. This article is an open access article distributed under the terms and conditions of the Creative Commons Attribution (CC BY) license (http://creativecommons.org/licenses/by/4.0/).
Copyright: This open access article is published under a Creative Commons CC BY 4.0 license, which permit the free download, distribution, and reuse, provided that the author and preprint are cited in any reuse.


