
Submitted:
10 October 2024
Posted:
12 October 2024
You are already at the latest version
Abstract
Numerous Epidemiologic studies have used remote sensing to quantify the contribution of greenness, air pollution, and wildfire smoke to asthma and other respiration outcomes. This is the first review paper to evaluate the influence of remote sensing exposures to specific outcome severity and risk factors in different ecologic settings. Literature searches utilizing PubMed and Google Scholar identified 61 unique studies published between 2009-2023, with 198 specific outcomes. Respiration specific outcomes were lower in greenness, and higher in air pollution, and in wildfire ecologic settings. Aerosol optical depth (AOD)-PM2.5 readings and specific outcomes were higher in economically developing than in economically developed countries. Prospective studies found prenatal and infant exposure to higher ambient AOD-PM2.5 concentration level readings contributed to higher childhood asthma incidence. Lung function was higher in greenness, and lower in the other two ecologic settings. Age, environment, gender, other, and total risk factors showed significant differences between health outcomes and ecologic settings. Published studies utilized physiologic mechanisms of immune, inflammation, and oxidative stress to describe obtained results. Individual and total physiologic mechanisms differed between ecologic settings. Study results were used to develop a descriptive physiologic asthma model and then use it to propose updated population-based asthma intervention program guidelines.
Keywords:
ambient gases
; asthma
; ecologic setting
; particulate matter
; physiologic mechanisms
; remote sensing
; respiration specific outcomes
; risk factors
1. Introduction
Remote sensing of ambient air pollution asthma and other respiration specific outcome publications have used two methods to establish an asthma diagnosis of study participants. The gold standard continues to be an asthma medical diagnosis with an assigned International Classification of Diseases, Ninth Revision, Clinical Modification (ICD-9-CM) code of 493 or an International Classification of Diseases, Tenth Revision, Clinical Modification (ICD-10-CM) code of J45 [1,2]. For wheeze, the ICD-9-CM code is 786.07, and the ICD-10-CM code is R06.2 [1,2]. An alternative procedure to confirm an asthma, wheeze, and another respiration specific outcome diagnosis is to use a questionnaire [3,4]. Two types of questionnaires have been used. The first one includes establishing by self-report if the study participants were previously assigned an asthma diagnosis or another respiration specific outcome by a medical doctor or another trained health care provider [5,6,7]. The second one includes asking questions about asthma, wheeze, and other respiration symptoms [7,8]. If the study participants are children a biological parent or adult caretaker answers questions for the children. Previous studies have established the reliability and validity of the use of questionnaires as proxies for an asthma medical diagnosis rendered by a medical doctor or another trained health care provider [3,9]. If an asthma diagnosis represents the homogeneous grouping of study participants who demonstrate the same (or similar) cluster of respiration symptoms under the control of the same (or similar) physiologic mechanisms of immune, inflammation, or oxidative stress, then the same (or similar) outcome should occur when the study participants who have been assigned the same respiration chronic disease diagnosis are exposed to the same (or similar) remote sensing ambient air pollution concentration level readings.
The use of remote sensing technology to quantify ambient air pollution concentration level readings within a specific temporal window of one hour, day, week, month, or year, and a spatial resolution that is <10 km2 anywhere on the Earth’s surface makes it possible to assess asthma and other respiration specific outcomes in study participants who demonstrate diverse physiologic, epidemiologic, and psychologic risk factors than was previously possible with only on-the-ground ambient air pollution monitors. In the United States, and in other countries, the risk factors of asthma and other respiration specific outcomes in study participants who live in rural areas and farther away from ambient air pollution monitors could be different than the risk factors of asthma and other respiration specific outcomes in study participants who reside in urban areas and live closer to ambient air pollution monitors, i.e., <20 km [10,11]. In the United States there are more ambient air pollution monitors in urban areas with higher population density, higher percentage of minorities, lower educational attainment, fewer economic resources, but with more health care providers, clinics, and hospitals, than in rural areas [11]. It is also possible that the risk factors of asthma and other respiration specific outcomes of study participants living in economically developing countries are different from the risk factors of asthma and other respiration specific outcomes of study participants who reside in economically developed countries [12,13,14]. To summarize, the risk factors demonstrated by asthma and other respiration specific outcomes of study participants may be different in diverse ecologic settings and in economically developing countries versus in economically developed countries.
Remote sensing of ambient air pollution utilizes a unitless reading of AOD to quantify the amount of light reflected from ambient particulates and ambient gases (aerosols) inside the optical recording column that extends from the light detecting sensors onboard the orbiting satellite to the surface of the Earth [11,15]. By utilizing previously computed statistical constants to capture the relationship between the ambient AOD unitless readings and the on-the-ground ambient air pollution monitor measurements, it is possible to transform the unitless ambient AOD concentration level readings to equivalent ambient air monitor measurements in micrograms per meter cube (µg/m3) for particulates and parts per billion (ppb) for ambient gases [10,11,15,16]. Thus far remote sensing of ambient air pollution, asthma, and other respiration specific outcome publications have used ambient AOD concentration level readings for particulate matter of different sizes (PM10, PM≤10 µ/m3; PM2.5, PM≤2.5 µ/m3; PM1, PM≤1 µ/m3; PM2.5-10, between PM2.5 and PM10; PM1-2.5, between PM1 and PM2.5) and ambient gases (CO, carbon monoxide; NO2, nitrogen dioxide; O3, ozone; SO2, sulfur dioxide). O3 is formed during the warm season, and NO2 and SO2 are proxies for vehicular traffic air pollution, resulting from the incomplete combustion of diesel fuel in trucks and gasoline in automobiles, and released in the atmosphere [10,17,18,19].
Epidemiologic studies utilizing remote sensing of ambient air pollution, asthma, and other respiration specific outcomes have also identified risk factors. Risk factors refer to the occurrence of an exaggerated response (i.e., statistically significant increase) after exposure to elevated ambient AOD-air pollution concentration level readings, or lower response (i.e., statistically significant decrease) to the same (or similar) ambient AOD-air pollution concentration level readings. Two study designs can be utilized to identify risk factors that represent aversive (higher), or protective (lower) health outcome responses to ambient AOD-air pollution concentration level readings. The first one involves the use of treatment effects to identify risk factors and the other utilizes effect modifiers – variables that change the relationship between the exposure level and the outcome severity [20]. The contribution of an independent variable to asthma and another respiration specific outcome represents the first type of risk factor. One example of an independent variable risk factor is the fact that prenatal and infant ambient AOD-air pollution concentration level reading exposure can result in the subsequent diagnosis of asthma in early childhood [4,5,6,8,9,17,21,22,23,24]. Children who develop asthma can also demonstrate decreased lung function [25]. Other publications have also reported decreased lung function as a result of exposure to elevated ambient AOD-air pollution concentration level readings [26,27,28,29]. An effect modifier risk factor identifies a variable that changes the relationship between the ambient AOD-air pollution concentration level reading, the exposure independent variable, and asthma or another respiration specific outcome dependent variable. One example of this type of risk factor is that children and older study participants show greater adverse asthma outcomes after exposure to the same (or similar) ambient AOD-air pollution concentration level reading than is demonstrated by middle-age study participants [15,30,31]. Being able to identify new risk factors in different ecologic settings should contribute to the accurate characterization of homogeneous asthma and other respiration specific outcome subgroups.
Recent publications have suggested that an asthma diagnosis can include children and adults who demonstrate differences in the way they respond to similar asthma treatment regimens [32,33,34,35,36]. In brief, these publications interpret the differential effectiveness of the same or similar treatment intervention protocols with some asthmatics, and their failure with other asthma patients, as support for the view that asthma is a heterogeneous chronic respiratory disease. That is, embedded within an asthma diagnosis there should be at least two distinct homogeneous subgroups of asthma patients. The presumption that asthma is a heterogeneous chronic respiratory disease suggests that there could be two homogenous asthma subgroups that should resemble each other on some risk factors and differ from each other on other risk factors. Another embedded assumption is that the physiologic mechanisms of immune, inflammation, and oxidative stress should be similar within a homogeneous asthma subgroup.
Ecologic settings can differ in ambient AOD-air pollution concentration level readings and ambient AOD-air pollution constituents. Ambient AOD-air pollution constituents can include dust, organic matter, metals, minerals, ammonia, nitrates, and sulfates [24,37,38]. The physiologic, epidemiologic, and psychologic risk factors of study participants and of the biological parents or adult caretakers can also differ as a function of ecologic setting. One broad difference in ecologic setting includes variations between economically developing and economically developed countries [12,13,14], as stated above. Another difference between ecologic settings can result from the type of exposure that is present. In this review paper the three different ecologic settings are identified as greenness, air pollution, and wildfire. In the greenness ecologic setting remote sensing is used to quantify the size and density of living vegetation, i.e., anything the contains chlorophyl [39]. The second ecologic setting involves the use of remote sensing to assess the effects of ambient AOD-air pollution concentration level readings on specific outcomes such as asthma and other respiration specific outcome emergency department visits and inpatient hospitalizations [11,15]. The third type of ecologic setting involves wildfires, and the adverse effects of wildfire smoke on asthma and other respiration specific outcome study participants [40].
The contribution of psychologic risk factors to an asthma diagnosis should not be underestimated [41,42,43]. There are aversive psychologic consequences related to the reoccurrence of loss of control in study participants who are unable to breathe because of the higher ambient AOD-air pollution concentration level reading produced constriction of the airways as is the case with higher ambient AOD-ozone concentration level readings during the warm season. The higher ambient AOD-air pollution concentration level reading produced aversiveness of an asthma exacerbation is compounded when it occurs in children with chronic asthma who experience stress because of this medical emergency and when this challenging childhood medical emergency increases the stress level experienced by the children’s biological parent(s) or adult caretakers. Higher stress levels experienced by asthma study participants can lead to elevated sympathetic activation, which results in even more constriction of the bronchial tubes. Biological parents or adult caretakers who also show psychologic risk factors of stress, anxiety, and depression as well as other epidemiologic risk factors of minority group membership, lower educational attainment, and fewer economic resources may not be able to immediately seek medical care for the asthma study participants who are experiencing asthma exacerbations [44,45,46]. It is possible, therefore, that higher stress levels in asthma study participants and in their biological parents or adult caretakers could make the asthma study participants more responsive to the adverse effects of the higher ambient AOD-air pollution concentration level readings such that these multi-faceted outcomes could include the occurrence of asthma exacerbations, increased use of asthma rescue medication, more visits to a hospital emergency room, and in the case of the continued occurrence of uncontrolled asthma exacerbations, admission to a hospital as an inpatient, after an emergency department visit.
The purpose of this review paper is to identify and evaluate all suitable publications that have used remote sensing to quantify the contribution of living vegetation on the Earth’s surface, different ambient AOD-air pollutants, that include particulate matter, ambient gases, air pollution constituents, and wildfire smoke, on asthma and other respiration specific outcomes, referred to as greenness, air pollution and wildfire ecologic settings, respectively. Study results from these remote sensing concentration level reading exposures and asthma and other respiration specific outcomes included in publications that meet the inclusion criteria of this review paper will be assessed using robust descriptive and inferential statistical procedures to simultaneously quantify exposure level and outcome severity, as well as risk factors, and mentioned physiologic mechanisms of immune, inflammation, and oxidative stress occurring in different ecologic settings [47]. This review paper will attempt to answer three scientific questions and accomplish two additional objectives: 1) Do the ecologic settings of greenness, air pollution, and wildfire differ from each other on the contribution of exposure level to outcome severity? 2) Do health outcomes (asthma, other respiration) and ecologic settings (greenness, air pollution, wildfire) and the interaction between health outcomes and ecologic settings differ on the same risk factors? 3) Do health outcomes and ecologic settings differ on the physiologic mechanisms of immune, inflammation, and oxidative stress? Finally, the first objective will 4) utilize the findings from the reviewed publications to develop a descriptive physiologic asthma and other respiration specific outcome model, and then 5) use the descriptive physiologic model to propose updated population-based asthma and other respiration specific outcome intervention guidelines [48].
2. Methods
2.1. Literature Search
The purpose of the literature search was to find published articles that utilized remote sensing technology to quantify the contribution of living vegetation, ambient AOD-PM2.5 concentration level readings without and with wildfire smoke to asthma and other respiration specific outcomes in the greenness, air pollution, and wildfire ecologic settings, respectively. The National Library of Medicine PubMed scientific literature database was used to conduct the primary literature search [49]. Google Scholar was utilized to identify recently published studies that were not in the PubMed literature search results [50].
Because remote sensing is a newer methodology that may lack familiar search terms, different literature search strategies were evaluated to retrieve published remote sensing air pollution asthma and other respiration specific outcome studies that met the search selection criteria of this review paper [47,51]. The approach that successfully identified more published articles was to search for familiar search terms contained in titles and abstracts of published studies included in the PubMed electronic literature database. Search words and short phrases were used to form conceptual search clusters: 1) Remote sensing was the first conceptual search cluster that contained these search words and phrases: “satellite”, “remote sensing”, “aerosol optical depth”, and “AOD”. 2) Ambient particulate matter was the second conceptual search cluster, with “particulate matter”, “PM”, “coarse PM”, “PM10”, “PM≤10”, “fine PM”, PM2.5”, “PM≤2.5“, PM1”, and “PM≤1”, as the search terms. 3) Ambient gases: “carbon monoxide”, “CO”, “nitrogen dioxide”, ”NO2”, “ozone”, “O3”, “sulfur dioxide”, and “SO2”; 4) Asthma: “asthma”,
and “asthma exacerbation”; 5) Other respiration specific outcomes: “allergic rhinitis”, “bronchitis”, “cough”, “phlegm”, “rescue medication”, and “wheeze”; 6) Other: “lung function”; 7) Greenness: “greenness”; 8) Wildfire: “wildfire”; 9) Psychologic risk factors: “anhedonia”, “anxiety”, “depression”, “psychology”, “psychopathology”, and “stress”. Two logical operators (OR, AND) were used to combine the nine conceptual search clusters into hierarchical conceptual search clusters. The “OR” operator was used to identify all of the search terms included in each conceptual search cluster. The remote sensing particulate matter hierarchical conceptual search cluster (remote sensing of particulate matter) was formed by using the “AND” operator to combine the 1st and 2nd conceptual search clusters. The remote sensing ambient gases hierarchical conceptual search cluster (remote sensing of ambient gases) was formed by using the “AND” operator to combine the 1st and 3rd conceptual search clusters. Next, the “OR” operator was used to combine each of the two remote sensing hierarchical conceptual search clusters (remote sensing of particulate matter, remote sensing of ambient gases) with each of the other six conceptual search clusters (asthma, other respiration, other, greenness, wildfire, and psychologic), by utilizing the “AND” operator. The PubMed literature search strategy was implemented for all available publication years.
Fewer search terms and years were utilized to complete the Google Scholar literature search. The implemented search terms were identified based on the results obtained with the PubMed literature search. The primary focus of the Google Scholar literature search was to identify remote sensing ambient AOD-air pollution asthma and other respiration specific outcome publications that were not in the PubMed literature electronic file literature search results. The secondary objective was to search for ambient AOD-air pollution and other remote sensing (greenness, wildfires) asthma and other respiration specific outcome publications. The Google Scholar literature search starting and ending dates were from January 2020 through December 2023. The Google Scholar literature search strategy utilized these search words and phrases: 1) “aerosol optical depth” AND “air pollution” AND “asthma”; 2) “aerosol optical depth” AND “air pollution” AND “cough”; 3) “aerosol optical depth” AND “air pollution” AND “wheeze”; 4) aerosol optical depth” AND “air pollution” AND “ anxiety”; 5) “aerosol optical depth” AND “air pollution” AND “depression”; 6) “aerosol optical depth” AND “air pollution” AND “psychologic.”
The titles and abstracts of all retrieved PubMed and Google Scholar publications were read to select those studies that met the review paper’s objectives. Analytic research articles that utilized remote sensing to evaluate living vegetation, ambient air pollution (ambient particulate matter and/or ambient gases), wildfire attributes such as wildfire smoke and asthma and other respiration specific outcomes were retained. Next, duplicate publications were removed. The text of the 107 identified publications (as well as accompanying supplemental files) were read to limit the final selection of analytic research studies to those that utilized both descriptive and inferential statistical procedures to evaluate the contribution of ambient remote sensing exposures to the occurrence of asthma and other respiration specific outcomes in the three ecologic settings. The selected articles were not limited to where the investigations were undertaken (i.e., country), or the language (other than English) used by the journal that published the study. There were 61 unique publications that satisfied all literature review inclusion criteria. These were the studies that were analyzed in this review paper. Risk factors were not included in the PubMed and in the Google Scholar literature searches. Risk factor information was obtained from the results reported in the selected unique publications.
2.2. Remote Sensing Measurements
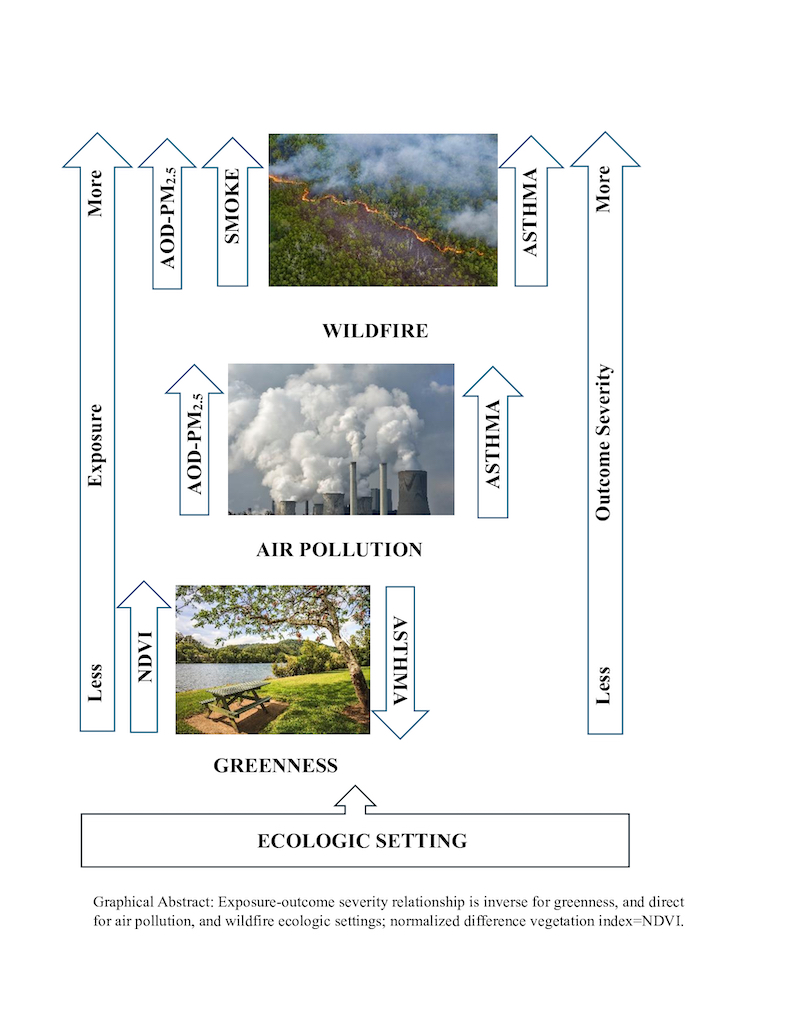
In less than two decades, remote sensing has changed how environmental epidemiology analyzes the contribution of exposure level to asthma and other respiration specific outcome severity in greenness, air pollution, and wildfire ecologic settings anywhere on the Earth’s surface. This computationally intense methodology has decreased the emphasis on using on-the-ground ambient air pollution monitor measurements and has shifted the focus to the increased reliance on remote sensing of environmental exposure variables. Remote sensing technology can also evaluate environmental epidemiologic measures of live vegetation and wildfire attributes besides wildfire smoke, which cannot be quantified by some on-the-ground ambient air pollution monitors. The three remote sensing methods, summarized in Figure 1 below, were utilized in the reviewed publications to determine the contribution of the normative difference vegetative index (NDVI), AOD-PM2.5 without and with wildfire smoke, and other AOD-air pollution measures, to provide factual support for the assertion that asthma and other respiration specific outcomes are less severe in the greenness ecologic setting and worse in the other two ecologic settings, air pollution and wildfire. The addition of wildfire smoke to AOD-air pollution in the wildfire ecologic setting, should result in worse asthma and other respiration specific outcomes in the wildfire ecologic setting than in the air pollution ecologic setting.
Figure 1. Utilization of Remote Sensing to Assess the Contribution of Live Vegetation, Ambient Air pollution, Wildfire Smoke, and Other Attributes to Asthma and Other Respiration Specific Outcomes.
Remote Sensing: Earth orbiting satellites utilize different methodologies to record images of the Earth’s surface and to measure aerosols within a recording column and to store the Sunlight reflected information in electronic pixels. Native pixel spatial resolution varies from m to km. Pixels contain stored electronic measurements of unique combinations of reflected nonvisible and visible light frequencies and their amplitudes made from various angles, from different surfaces such as chlorophyl in live vegetation, aerosols in the atmosphere, and wildfire changes to forests and to the built environment, including ambient smoke. Remote sensing images of the Earth’s surface are used to determine the abundance of live vegetation and the size of wildfires. Images of scattered light from aerosols in a recording column are used to measure aerosol abundance. Algorithms take the electronic information stored in pixels and transform it to unitless ordinal scale readings that represent live vegetation density, AOD abundance, and wildfire characteristics. More information about the three remote sensing measurement types in the greenness, air pollution, and wildfire ecologic settings are provided below.
Greenness: Algorithm-extracted electronic information in pixels that make up remote sensing images of live vegetation is used to construct a unitless ordinal scale referred to as NDVI. NDVI readings have values >0 and ≤1, with higher positive values representing more live vegetation abundance. Dadvand and associates [52] conducted a validation analysis of NDVI readings. NDVI readings were significantly higher in buffers of 100 m, 250 m, 500 m, and 1,000 m that included study participants’ residences located ≤300 m from a park or a forest compared to the location of study participants’ homes in the same four circular buffer sizes that were >300 m from a park or a forest.
AOD-Air pollution: Algorithms utilize scattered light characteristics (i.e., angle, frequency, and amplitude) of aerosols in a recording column to develop a unitless ordinal scale that measures AOD abundance. Higher unitless values represent greater AOD density. Different statistical procedures are utilized to transform AOD unitless values to AOD-particulate, AOD-particulate constituent, and ambient readings of AOD-gases. The statistical method used most often is land use regression [16]. AOD readings with other independent variables are used in regression analyses to predict on-the-ground monitor measurements of ambient PM2.5. Validation of the ambient AOD-PM2.5 concentration level readings have shared variance percentages of 81.2% (95% confidence interval, 95% CI=79.0%-83.3%), as summarized in Table 2 below. Validation analyses of Hierarchical Bayesian models that combine Kriged AOD values with monitor PM2.5 measurements have found shared variance percentages of 62.1% [11]. The global 3D atmospheric chemistry (GEOS-Chem) model has been used to convert AOD values to AOD-PM2.5 readings and to quantify the presence of different AOD-PM2.5 constituents [24,38].
Wildfire Attributes: The location and size of wildfires as well as wildfire smoke can be determined using remote sensing images of the Earth’s surface and to utilize ambient AOD-PM10 or ambient AOD-PM2.5 concentration level readings + smoke [53,54,55,56,57,58,59]. By analyzing a series of remote sensing images of wildfires it is possible to temporally describe changes in the size and movement of wildfires. Ambient AOD-PM2.5 concentration level readings made during wildfires represent the presence of both ambient air pollution and wildfire smoke, AOD-PM2.5+smoke [40,54,55,57,59,60,61]. Differences between ambient AOD-PM2.5 concentration level readings and ambient AOD-PM2.5+smoke concentration level readings can be used to quantify the unique contribution of wildfire smoke to ambient AOD-PM2.5 concentration level readings.
Two satellites, which are part of the National Aeronautics and Space Administration’s (NASA) Earth Orbiting System (EOS) program, Terra and Acqua, were launched on December 18, 1999, and May 4, 2002, respectively, and are expected to continue making light extinction readings in their aerosol columns through 2026 [51]. The Terra satellite’s orbit is from north to south and crosses the equator at 10:30 a.m. local time. The Acqua satellite’s orbit is from south to north and crosses the equator at 1:30 p.m. local time. Each satellite circles the Earth at an altitude of 705 km and makes one complete Earth orbit every 98.8 minutes. These two satellites have the same Moderate Resolution Imaging Spectroradiometer (MODIS) instrument. MODIS passively records light rays from the Sun that are either reflected or absorbed by different particles (aerosols) within the AOD recording column that is contained within a swath that is 2,330 km wide. MODIS can make a complete image of the Earth every 1-2 days. The three MODIS data products relevant to this review are the quantification of greenness (NDVI; enhanced vegetative index, EVI), aerosols (AOD readings of ambient particulates and gases), aerosol constituents [62], and wildfire attributes (smoke, wildfire boundary detection, wildfire emitted heat) [63]. Other instruments on the Terra and Acqua satellites (or on other satellites) in the NASA EOS remote sensing program can attain finer spatial-temporal resolution of ambient aerosols, greenness, and wildfire readings, but require more time to complete more detailed images of the Earth’s surface.
2.3. Statistical Analyses
The data analysis protocol followed in this literature review was based on the literature review procedure developed by Braggio [47] to complete another published literature review on the adverse effects of ambient AOD-PM1, ambient AOD-PM2.5, and ambient AOD-PM10 concentration level readings on cardiovascular outcomes. For the current literature review a dedicated data dictionary was developed to evaluate specific categorical and continuous variables included in the identified publications. Next, all of the variables in the literature review data dictionary were used to format an Excel literature review data file. The categorical and continuous data variable values extracted from the reviewed publications were entered in the literature review Excel data file. Entered values were checked to ensure the accuracy of the entered information.
In all analyses the independent variables included the two health outcomes (asthma, other respiration), three ecologic settings (greenness, air pollution, wildfire), and selected dependent variables that were defined as discrete or continuous specific outcomes. Although there were 61 unique publications, each study provided one or more specific outcomes.
All descriptive (means, counts, percentages, 95% CI) and inferential (95% CI, Chi-Square, correlation, analysis of variance) statistical analyses were computed using the SAS Studio online software [64]. Descriptive statistics were computed using the SAS MEANS Procedure [65]. The SAS/STAT procedure was used to analyze discrete count values with the Chi-Square test (Proc FREQ, with an exact probability estimate when the expected cell total was <5), and continuous values were analyzed using correlation (Proc CORR) [65] and analysis of variance (Proc GLM) [66]. For all inferential statistical analyses alpha was set at p≤0.05. Use of the word “significant” in this review paper conveys the meaning that the computed probability value from a statistical test was either p≤0.05 or p≤0.01.
3. Results
3.1. Unique Publications, Exposures, and Specific Outcomes
The categorical and continuous attributes of the 61 unique publications, and the categorical and continuous 198 asthma and other respiration specific outcomes in the greenness (n=13) [39,52,67,68,69,70,71,72,73,74,75,76,77], air pollution (n=37) [3,4,5,6,7,8,9,10,11,15,17,18,19,21,22,23,24,25,38,78,79,80,81,82,83,84,85,86,87,88,89,90,91,92,93,94,95], and wildfire (n=11) [40,53,54,55,56,57,58,59,60,61,96] ecologic settings are summarized in Table 1. The first column includes variables obtained from the 61 unique publications. The second column shows totals (percentages) for all of the unique publications. The third column displays totals (percentages) for the 198 specific outcomes. Totals (percentages) for the specific outcomes in the three ecologic settings of greenness, air pollution, and wildfire are displayed in the last three columns. There were 2,821,393 study participants in the 61 publications, and 13,725,971 study participants in the 198 specific outcomes. Columns 4-6 include study participants in the greenness (n=46,089), air pollution (n=13, 237,790), and wildfire (n=442,092) ecologic settings. There were significantly more studies in the air pollution ecologic setting (n=37, 60.7%), than in the greenness (n=13, 21.3%), and in the wildfire (n=11, 18.0%) ecologic settings. Significantly more unique studies were published between 2017-2023 (n=48, 78.7%) than were published between 2009-2016 (n=13, 21.3%). The number of studies published by the different countries was significantly different, with 24 (39.3%) completed in the United States, eight (13.1%) in China, six (9.8%) in Canada, and five (8.2%) in Italy. There was also a significant difference in the country variable for specific outcomes, with the United States contributing 63 (31.8%), Italy 49 (24.8%), China 29 (14.6%), and Canada 21 (10.6%). For the type of surveillance utilized in the unique publications, prevalence (n=43, 70.5%) was used significantly more often than incidence (n=18, 29.5%). With regards to determining the diagnosis of study participants, a questionnaire was utilized in 26 (42.6%) of the unique publications, and a medical diagnosis was used in 31 (50.8%) of the 61 unique publications (both statistical comparisons were significant). Among the 198 specific outcomes, there were significantly more asthma (n=124, 62.6%) than other respiration (n=74, 37.4%) specific outcomes. As expected, there were significantly more specific outcomes that utilized AOD (n=175, 88.4%) versus the other specific outcomes that did not utilize AOD (n=23, 11.6%).
3.2. AOD-Air Pollution
Table 2 displays the AOD concentration level readings for ambient particulates and ambient gases. All of the 108 specific outcome exposure values had ambient AOD-air pollution concentration level readings that were >0 (both, first column, left side). The square of the correlation coefficient percent (PGR2PER) values were >0 when the AODVAL variable had a value of “Yes”. Based on the United States Environmental Protection Agency (US EPA) [97] maximum exposure thresholds for the different ambient air pollutants that include NO2 (53 ppb, annual mean), PM10 (150 µg/m3, 24 hours), and PM2.5 (15.0 µg/m3, annual mean), only the ambient AOD-PM2.5 concentration level reading mean shown in the first row in Table 2 exceeded the US EPA established exposure threshold which, when surpassed can result in acute and chronic adverse health outcomes in the exposed study participants.

Table 2.
Means and 95% Confidence Intervals for AOD-PM2.5, AOD-PM10, AOD-NO2, and PGR2PER.
| AOD group1 | Outcome total2 |
AOD-Air pollution | PGR2PER | ||
| Mean3-4 | 95% CI3 | Mean3-4 | 95% CI3 | ||
| PM2.5: Both | 74 | 25.6 | 20.8-30.4 | . | . |
| No | 21 | 21.7 | 13.5-29.9 | . | . |
| Yes | 53 | 27.2 | 21.1-33.2 | 81.2 | 79.0-83.3 |
| PM10: Yes | 19 | 48.7 | 35.6-61.8 | 79.4 | 76.1-82.7 |
| NO2: Both | 15 | 10.4 | 6.5-14.2 | . | . |
| No | 1 | 0.8 | . | . | . |
| Yes | 14 | 11.0 | 7.2-14.9 | 73.0 | 66.4-79.7 |
1AOD-PM2.5, AOD-PM10, AOD-NO2, and PGR2PER are stratified on the AODVAL variable in the first column, next to the left margin: The “NO” row represents AOD-air pollution values > 0 and associated PGR2PER values = 0. The “Yes” row includes AOD-air pollution values > 0 and PGR2PER values > 0. The “Both” row combines the values in the “No” and ‘Yes” rows. 2The second column shows the total number of specific outcomes for each AOD-air pollution row. 3Means and 95% CIs for ambient AOD-air pollution concentration level readings (middle two columns) and for GPR2PER in the last two columns. 4Measurement units are µg/m3 for AOD-PM2.5 and AOD-PM10, and ppb for AOD-NO2.
Table 2 also includes the PGR2PER concordance statistic for the three ambient AOD-air pollutants. The PGR2PER represents the square of the correlation expressed as a percentage between the ambient AOD-air pollution concentration level readings and the on-the-ground ambient air monitor measurements. Perfect agreement between the AOD-air pollution concentration level readings and the ambient air pollution monitor measurements is represented by a PGR2PER value of 100.0%, and no association is represented by a PGR2PER value of 0.0%. For this review paper, the minimum acceptable PGR2PER value threshold was set at 75.0% or higher. Among the three criteria air pollutants, the mean PGR2PER value was at least 75.0% for AOD-PM10 (79.4%), and AOD-PM2.5 (81.2%), and below this minimum threshold for AOD-NO2 (73.0%). Note, however, some of the ambient AOD-NO2 concentration level readings satisfied the minimum PGR2PER 75.0% threshold value because the ambient AOD-NO2 mean’s 95% CI upper limit exceeded 75.0%, it was 79.7%.
3.3. Risk Factors and Significant Outcome Group
The 198 specific outcomes were evaluated statistically and reported as not significant (NS), significantly lower (SL), and significantly higher (SH) in Table 3. Five variables were evaluated first in Table 3, followed by the risk factors, and the single and multiple physiologic mechanisms of immune, inflammation, and oxidative stress were assessed last. The interactions for the respiration group (asthma, other respiration) and publication year with the significant outcome group were not significant. But the interactions for the ecologic setting and country with the significant outcome group were significant. With regards to ecologic setting, greenness included 41 (20.7%) of the 198 specific outcomes, air pollution included 125 (63.1%), and wildfire contained the remaining 32 (16.2%). The greenness ecologic setting had the highest number of SL outcomes (n=18, 9.1%), while the air pollution ecologic setting had the highest number SH higher outcomes (n=72, 36.4%). The wildfire ecologic setting had the second-highest total of SH outcomes (n=21, 10.6%). The country by significant outcome group was also significant, with the United States having the most specific outcomes in the SH group (n=33, 16.7%), followed by Italy (n=19, 9.6%), China (n=16, 8.1%), Canada (n=7, 3.5%), and Australia (=7, 3.5%). The highest number of SL outcomes occurred for the United States and Italy, with each country reporting 9 (4.6%), followed by China with 5 (2.5%), Canada with 2 (1.0%), and Spain with 1 (0.5%).
In addition to the significant country by outcome group interaction there was another country-related assessment of the stratification of countries on their mean ambient AOD-PM2.5 concentration level readings and 95% CI, the AOD-PM2.5 three-category group (PM25GRP3) independent variable. This AOD-fine PM statistic assigns countries to one of three ordinal categories formed by utilizing the 95% CI lower limit, and upper limit values as category cutoff thresholds. The ambient AOD-PM2.5 concentration level reading mean and 95% CI for the 74 specific outcomes were 25.6 µg/m3 and 20.8-30.4 µg/m3, respectively, as shown at the top of Table 2, above. Countries with ambient AOD-PM2.5 concentration level reading means below 20.8 µg/m3 were assigned to the lower PM25GRP3 group. Countries with AOD-PM2.5 concentration level reading means ≥20.8 µg/m3 and ≤30.4 µg/m3 were assigned to the within group. Remaining countries with ambient AOD-PM2.5 concentration level reading means >30.4 µg/m3 are placed in the higher PM25GRP3 group. The PM25GRP3 by significant outcome group analysis was significant, with 15 (20.3%) countries in the higher group of both PM25GRP3 and the significant outcome group, and five (6.8%) countries in the lower group of both PM25GRP3 and the significant outcome group.
The middle section of Table 3 displays the interactions between the eight risk factors (age, education/income, ethnicity/race, environmental, gender, geographic, psychologic, and other) with the significant outcome group. Except for education/income, the other seven risk factors were significant. In descending order of total “Yes” outcomes, the environmental risk factor had the most with 134, followed by age (n=30), gender (n=29), other (n=24), geographic (n=16), ethnicity/race (n=10), and psychologic (n=9). In addition, the environmental risk factor had the highest number of specific outcomes in the SH group (n=98, 49.5%) and in the SL group (n=24, 12.1%).
The bottom of Table 3 displays the results for the interaction between the single and multiple physiologic mechanisms of immune (IM), inflammation (IN), oxidative stress (OS), and other (OT) by the significant outcome group. The interactions between the single and multiple physiologic mechanisms with the significant outcome group were both significant. For the single physiologic mechanism, the OT was mentioned most often (n=70, 63.6%), followed by IN (n=24, 21.8%), IM (n=9, 8.1%), and OS (n=7, 6.3%) was last. The other physiologic mechanism also had the highest totals in the SL (n=9, 8.2%) and the SH (n=33, 30.0%) significant outcome groups. For the multiple physiologic mechanisms, immune-inflammation-oxidative stress (IMINOS, n=47, 53.5%) had the highest number of mentions, followed by immune-inflammation (IMIN, n=24, 27.3%), and inflammation-oxidative stress (INOS, n=17, 19.3%) was last. IMIN and IMINOS each had the same number for the most mentions (n=5, 5.7%) in the SL category, and IMINOS (n=26, 29.6%) had the most mentions in the SH category.
3.4. Exposure-Outcome Severity and Country Differences
Results in Table 3 above showed a significant difference between PM25GRP3 and the significant outcome group. The significant outcome group evaluates country specific outcome differences, while the PM25GRP3 variable quantifies country exposure differences. Of the 24 country specific outcomes with AOD-PM2.5 means, China had the highest total (percent) with 13 (17.6%), the United States was second with 6 (8.1%), while Indonesia and Taiwan were tied for the third position with 2 (2.7%) each. Of the 45 PM25GRP3 country specific outcomes in the lower group, the United States had the most with 24 (32.4%), Italy was second with 11 (14.9%), and Canada was third with 8 (10.8%). These results suggest that countries were significantly different from each other on both exposure (PM25GRP3) and specific outcomes (significant outcome group).
3.5. Risk Factors, Health Outcomes, and Ecologic Settings
Risk factor results are summarized in Table 4. Analysis of variance was utilized to determine the contribution of each risk factor and the total for all risk factors to health outcome, ecologic setting, and the interaction between health outcome and ecologic setting. The health outcome main effect was significant for the age, environmental, other, and total risk factors. For each risk factor the asthma mean was significantly higher than the other respiration mean. The ecologic setting main effect was significant for age, gender, other, and total risk factors. For the age, gender, and total risk factors, the wildfire mean was significantly higher than the greenness and air pollution means. But, for the other risk factor, the greenness mean was significantly higher than the wildfire mean. The health outcome by ecologic setting interaction was significant for the age, and other risk factors only. For the age risk factor, the asthma-greenness mean was significantly lower than the asthma-wildfire mean, and the respiration-greenness mean was significantly lower than the respiration-wildfire mean. The asthma-wildfire mean was significantly higher than the asthma-greenness mean, and the asthma-air pollution mean. The respiration-wildfire mean was significantly higher than the asthma-air pollution mean, and the respiration-air pollution mean. For the other risk factor, the asthma-greenness mean was significantly higher than the other five means. These results support the conclusion that the contribution of the same risk factors differs for different health outcomes and ecologic settings.
3.6. Individual and Total Physiologic Mechanisms
Table 5 summarizes the analysis of variance results for the means of the individual and the total physiologic mechanisms of immune, inflammation, oxidative stress, and other by health outcome, ecologic setting, and the interaction between health outcome and ecologic setting. Only the ecologic setting main effect was significant for both the individual and total physiologic mechanisms. For the individual physiologic mechanism ecologic setting means, only the air pollution mean of 1.85 was significantly higher than the greenness mean of 1.43. Because the interaction terms were not significant, significant differences between the six interaction means may not be interpretable. Tables S8 shows additional results for the individual and multiple physiologic mechanism counts (percentages) by health outcome and ecologic setting. Of the identified physiologic mechanisms, IN occurred more often (n=24, 12.1%) than either IM (n=9, 4.6%) and OS (n=7, 3.5%). Overall, the other physiologic mechanism besides the three identified, occurred most often (n=70, 35.4%), as shown in Table S8. In summary, the results in Table 5 above suggest that which physiologic mechanism is used to describe the obtained results in the unique publications differs as a function of ecologic setting.
3.7. Ecologic Setting-Specific Asthma, and Physiologic Outcomes
The contribution of exposure type to outcome severity differs as a function of ecologic setting, as shown above, in Table 4. Exposure to greenness should result in a protective effect for asthma, and this statement is supported by improvements in physiologic measures of immune, inflammation, and lung function. Within the air pollution and wildfire ecologic settings, asthma incidence and prevalence should increase, and the same physiologic measures should demonstrate the occurrence of decreased lung function and increased lung inflammation. The wildfire ecologic setting should have higher ambient AOD-PM2.5 concentration level readings with wildfire smoke than is found for the air pollution ecologic setting which does not include ambient AOD-PM2.5 wildfire smoke. Additional evidence from remote sensing results in greenness, air pollution, and wildfire ecologic settings will be presented below in narrative form. The purpose of this summary is to emphasize individual study results from several publications.
3.7.1. Greenness
- NDVI, Immune, and Inflammation. Results from four published studies that evaluated the contribution of NDVI to asthma outcomes, suggest that, while the relationship is complex, higher NDVI values contribute to improved asthma outcomes [39,68,71,75]. Chen and colleagues [39] found lower FeNO values, indicative of decreased airway inflammation, and more glucocorticoid receptors cells (CD4), suggesting the occurrence of improved immune function, with higher NDVI values within 250 m buffers that included study participants’ residences and improved family relationships between parents and asthma study participants. Another publication by Squillacioti and collaborators [75] found an inverse association between higher NDVI readings and decreased asthma risk, as well as improved lung function in 10-13 year-old children. The Cilluffo and associates [68] publication also found an inverse association between lower NDVI values and higher risk for uncontrolled asthma in 5-16 year-old children. Exposure to passive smoke during the mothers’ pregnancy and higher crowding were aversive risk factors for uncontrolled asthma. The uncontrolled asthma group had lower lung function than the controlled asthma group, i.e., lower FEV1, FEF25%-75%, and FEV1/FVC measurements. Hartley and collaborators [71] completed a prospective study to evaluate the contribution of NDVI to asthma incidence and lung function by age of seven years. Children sensitized to common allergens developed asthma if they were exposed to higher NDVI values compared to children who were not sensitized to common allergens. In all children, however, those with asthma and other children without asthma, the results showed that higher NDVI values contributed to increased lung function, measured as percent of forced expiratory flow in one second (%FEV1, and percent of forced vital capacity (%FVC).
- Remote Sensing Greenness, Asthma, and Psychologic Risk Factors. Ihlebaek and colleagues [74] assessed the contribution of remote sensing greenness to asthma, and self-reported psychologic disorders in adult study participants residing in Oslo, Norway. Results showed no association with asthma, but higher greenness levels were associated with fewer self-reported mental disorders.
3.7.2. Air Pollution
- Preexposure and Asthma Incidence. Nine studies [4,5,6,8,9,22,23,24,86] in the air pollution ecologic setting showed that prenatal and infant exposure to ambient AOD-PM2.5 concentration level readings resulted in increased asthma [5,6,9,22,24], wheeze [4,8,9,23,24], and allergic rhinitis [86] incidence in early childhood. Some publications reported minimum ambient AOD-PM2.5 concentration level reading thresholds, while other studies identified risk factors: Prenatal values were 93 µg/m3 [22], and 64.7 µg/m3 [24], and infant values were 73 µg/m3 [22], and 61.8 µg/m3 [24]. Prenatal exposures to ambient AOD-PM2.5 constituents of black carbon, organic matter, nitrate, ammonium, and sulfate resulted in higher asthma and wheeze incidence [24]. Follow-up results from the initial ambient AOD-PM2.5 concentration level reading exposure until the subsequent occurrence of increases in asthma, wheeze and allergic rhinitis incidence in early childhood provided the necessary information to investigators to evaluate the contribution of exposure to outcome severity by utilizing distributed lag statistical models [5,6,22]. Critical exposure windows were defined as the occurrence of significant increases in childhood asthma, wheeze, and allergic rhinitis incidence resulting from prior exposure to ambient AOD-PM2.5 concentration level readings within a discrete temporal window before and after birth [4,5,6,22,23]. The prenatal and infant lower-upper critical exposure window boundaries were 6-22 weeks [22], 16-25 weeks [5], 19-23 weeks [6], 1st trimester [4], 6-22 weeks prenatally, and 9-46 weeks [22], and 5.5-11 moths [9] in infancy. Additional analyses also identified risk factors. Risk factors included gender [5,6,24], breastfeeding duration less than six months [9], race [8], limited economic resources, less than 12 years of education [8], lower antioxidant dietary intake [8], exposure to environmental tobacco smoke [23], and maternal stress [4,6]. These ambient AOD-air pollution preexposure publications also concluded that inferred changes in the physiologic mechanisms of immune, inflammation, and oxidative stress contributed to delays in lung development, including irreversible anatomical changes to the lungs [4,5,6,9,22,23]. It is possible that persons who developed asthma because of prenatal and infant exposure to higher ambient AOD-PM2.5 concentration level readings and exposure to ambient AOD-PM2.5 constituents could manifest a type of asthma in early childhood that is more severe, harder to manage, and treat.
- Air Pollution, Asthma and Lung Function. Knibbs and colleagues [25] evaluated the contribution of ambient AOD-NO2 concentration level readings to asthma prevalence and lung function. Ambient AOD-NO2 concentration level readings were proxies for vehicular traffic volume in 12 Australian cities. Higher ambient AOD-NO2 concentration level readings contributed to higher asthma prevalence risk. Higher ambient AOD-NO2 concentration level readings also contributed to decreased lung function, measured as lower FEV1, FVC, and increased inflammation, evaluated as higher FeNO measurements. Another study undertaken by Rice and colleagues [19] evaluated the contribution of ambient AOD-PM2.5 concentration level readings to decreased lung function. Living <100 m from highways contributed to increased asthma risk in adults. Compared to adults living >400 m from highways, those study participants that lived <100 m of highways had decreased lung function, measured as lower FEV1 and FVC values. Study participants who were former smokers showed an annual FEV1 decrease of 4.9 ml. Xing and collaborators [7] evaluated the contribution of ambient AOD-air pollution concentration level readings to asthma prevalence in adults living at higher altitudes in China. Higher ambient AOD-PM2.5 and ambient AOD-PM10 concentration level readings contributed to the occurrence of increased asthma risk. Only higher ambient AOD-PM2.5 concentration level readings, but not higher ambient AOD-PM10 concentration level readings, also contributed to decreased lung function, which was measured as a decrease in FEV1, FEV50%, and FEV75%. Older age, defined as persons who were at least 65 years old, and the presence of mold (and by implication higher moisture levels and humidity) in the homes of study participants were risk factors for higher asthma prevalence risk.
- Maternal Depression, Asthma and Wheeze. Alcala and collaborators [78] utilized a longitudinal study design to evaluate the contribution of maternal depression to the occurrence of asthma and wheeze in children. Mothers who had postpartum and recurrent depression had children who developed asthma and current wheeze by their fourth birthday. The contribution of maternal depression to asthma and wheeze was stronger in female children than in male children.
3.7.3. Wildfires
- Ambient AOD-PM2.5 Without and With Wildfire Smoke. The Delfino and associates [55] publication results demonstrated higher ambient AOD-PM2.5+smoke concentration level readings during wildfires compared to ambient AOD-PM2.5 concentration level readings before and after wildfires. The mean ambient AOD-PM2.5+smoke concentration level reading during wildfires was 70 µg/m3 higher than the before wildfire condition. There were also 34% more asthma admissions during the wildfire compared to the before wildfire condition. Persons in the 65-99 age group showed the highest increase in asthma admissions compared to other age groups. Under the wildfire condition there was also an increase in acute bronchitis admissions.
- Wildfire-Smoke, Asthma and Lung Function. Lipner and co-workers [40] evaluated the contribution of wildfire smoke to asthma control and lung function in 4-21 year-old study participants. This study utilized National Oceanic and Atmospheric Administration’s Hazard Mapping System and on-the-ground ambient monitor PM2.5 measurements. In 12-21 year-old children, results showed no association with asthma control, but higher ambient PM2.5 monitor measurements were inversely associated with decreased lung function, which was measured as FEV1 values, on the next day. FEV1 measurements increased on the second day. The improvement in lung function on the second day was due to the use of asthma rescue medication. In 4-11 year-old children there were no significant outcome due to higher ambient monitor PM2.5 measurements. Risk factors were White race, and male gender. There was also worse asthma control in Black children, and among study participants of lower social-economic status.
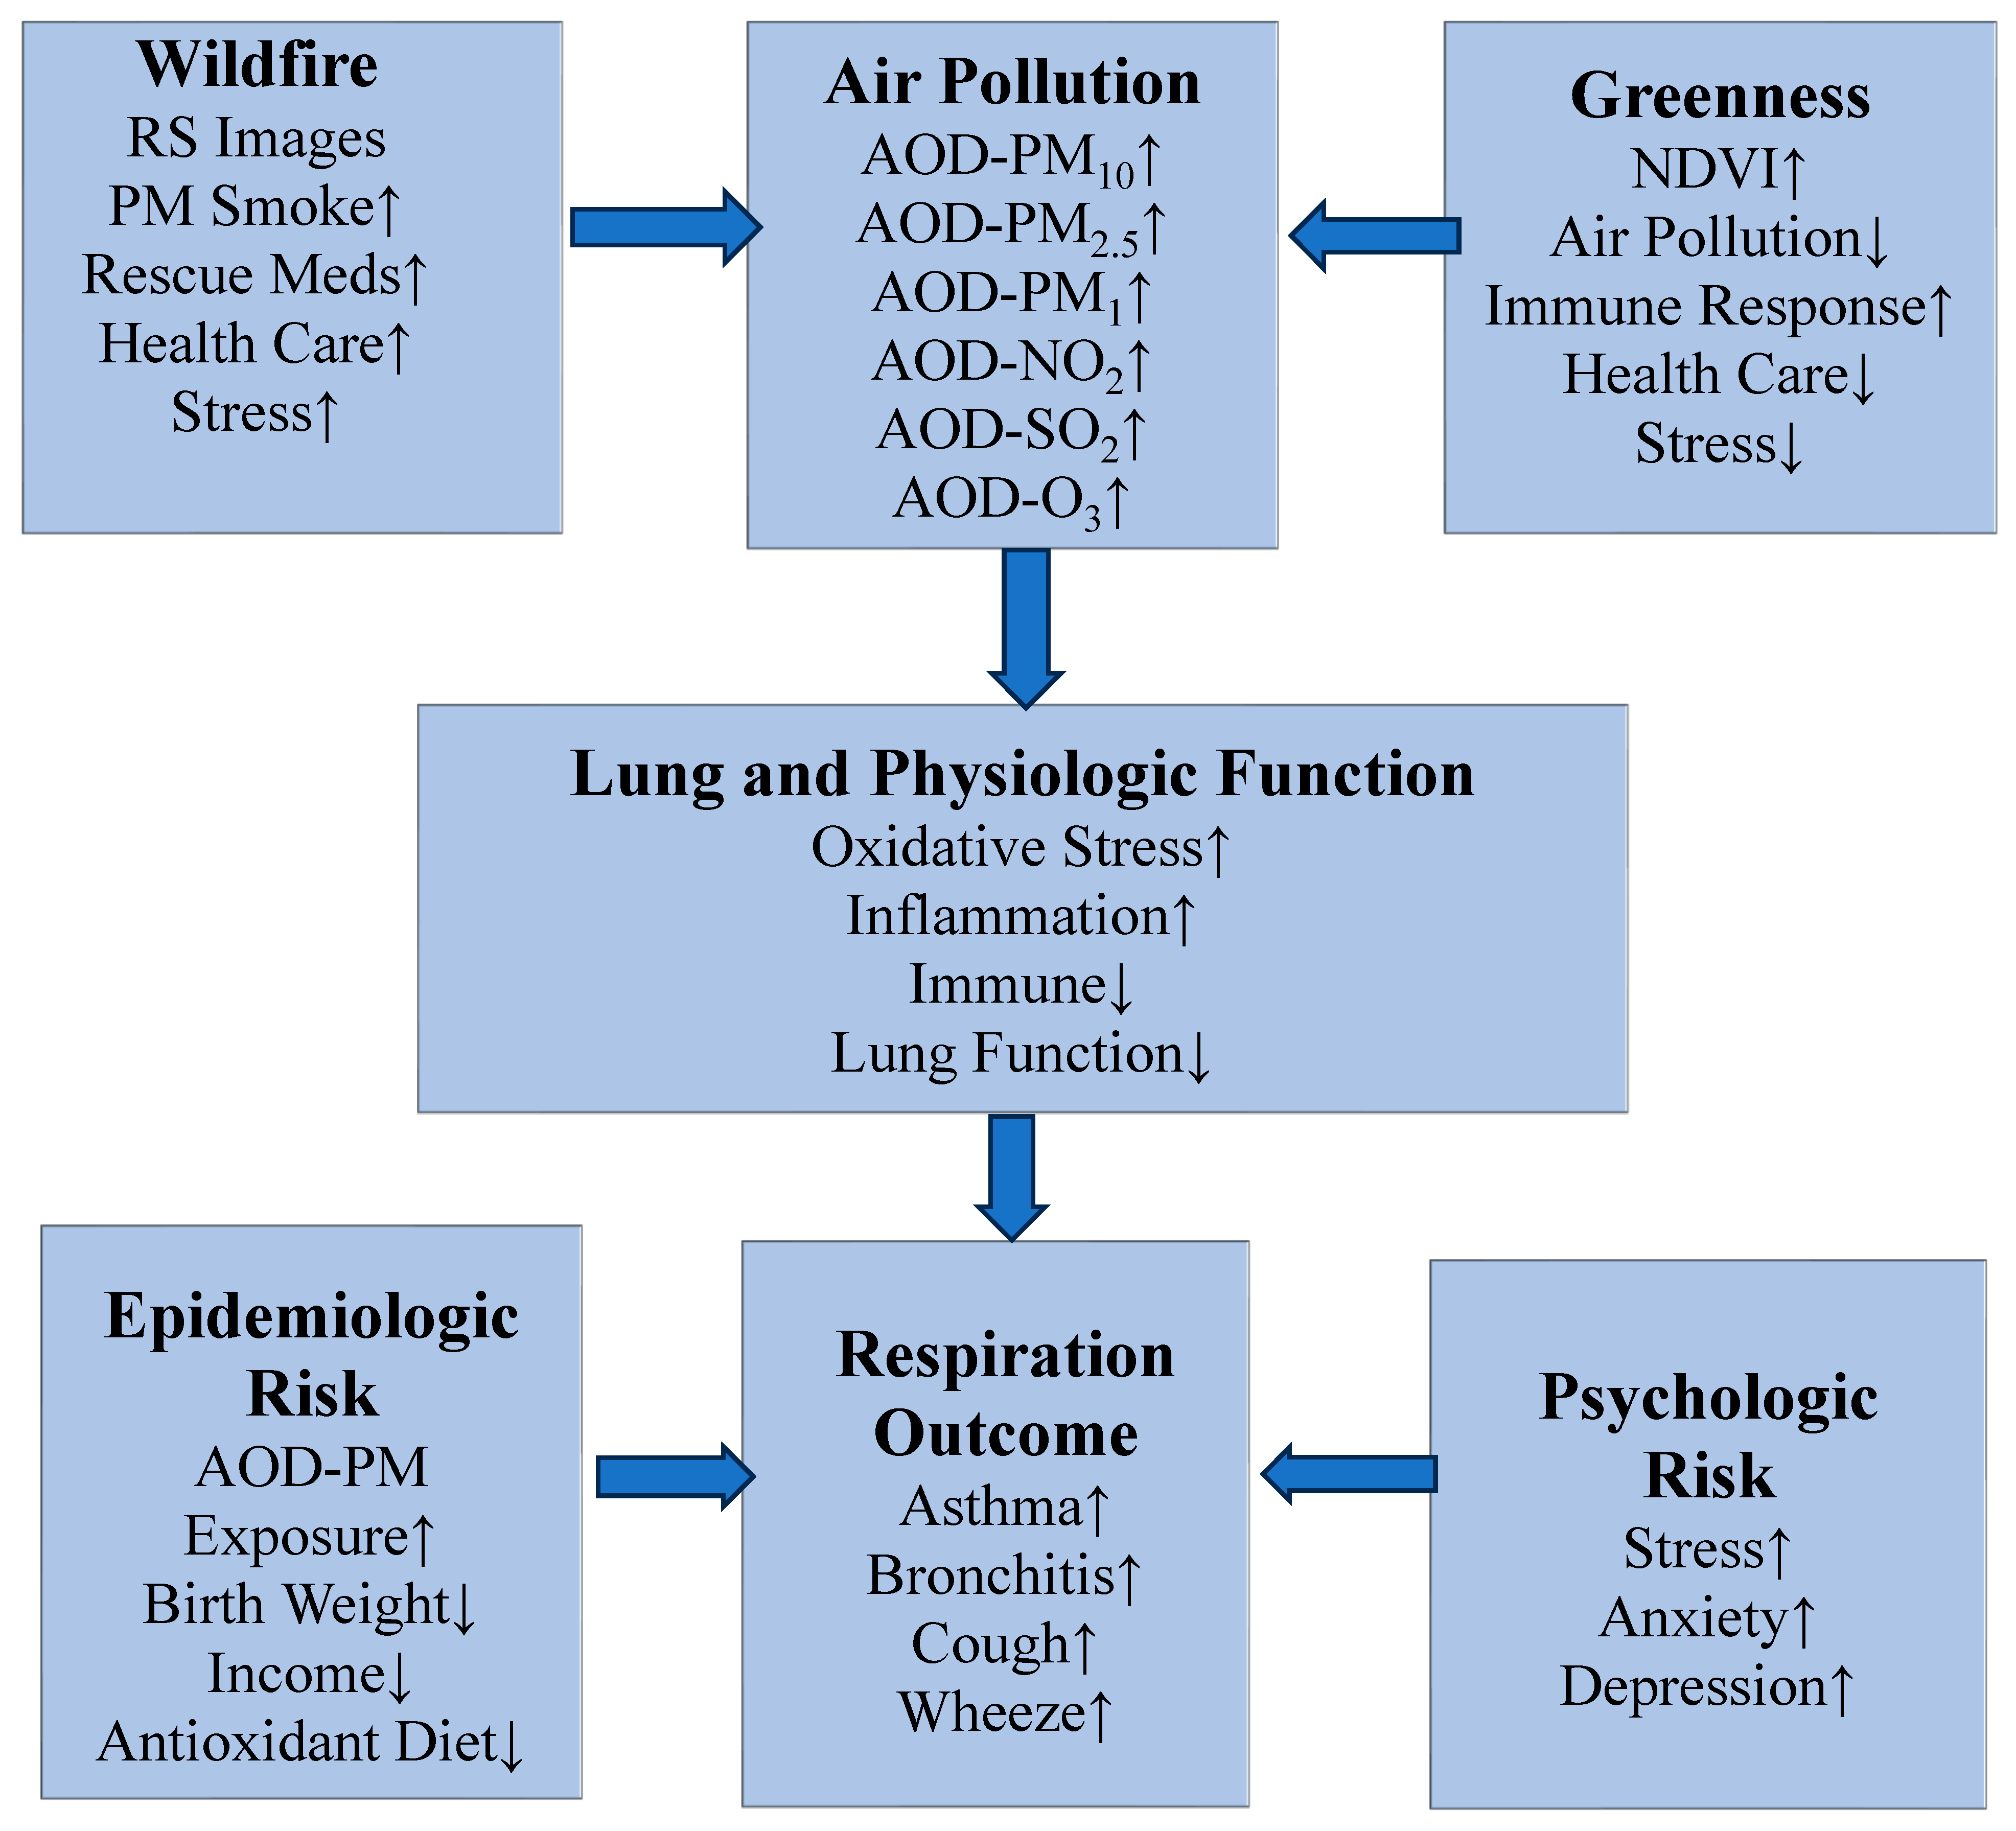
3.8. Descriptive Physiologic Asthma and Other Respiration Model
There was enough factual information in the 61 reviewed publications to develop a descriptive physiologic asthma and other respiration model. The model is summarized in Figure 2. The higher ambient AOD-air pollution concentration level reading effects on asthma and other respiration specific outcomes are less in the greenness ecologic setting (top row, right side) than in the wildfire ecologic setting (top row, left side). The adverse effects of higher ambient AOD-air pollution concentration level readings on asthma and another respiration specific outcome are modified by lung function and changes in the physiologic mechanisms of immune, inflammation, and oxidative stress, as shown in the middle row, above, in Figure 2. There are anatomic changes in the developing lungs that result from prenatal and infant exposure to the breathing of higher ambient AOD-air pollution concentration level readings of particulates, especially AOD-PM2.5. Prenatal and infant exposure to higher ambient AOD-PM2.5 concentration level readings are accompanied by delays in lung development and decreased lung function. It is possible that these prenatal and infant changes to delayed lung development and function could become irreversible in childhood and adulthood. Currently available scientific evidence suggests that the greatest delay in lung tissue development occurs prenatally and during infancy, and results from breathing higher ambient AOD-PM2.5 concentration level readings and constituents. The manifestation of a chronic respiratory disease such as asthma and other respiration specific outcomes such as wheeze can be influenced by the synergistic effects of epidemiologic (bottom row, left) and psychologic (bottom row, right) risk factors, as shown in Figure 2. Under some ecologic settings, the adverse effects of higher ambient AOD-air pollution concentration level readings on the subsequent occurrence of asthma and another respiration specific outcome depends on the unique interaction of physiologic, epidemiologic, and psychologic risk factors in different ecologic settings. The descriptive physiologic asthma and other respiratory specific outcome model shown in Figure 2 can be used to suggest what experimental conditions can result in the manifestation of homogeneous asthma subgroups that could differ in the occurrence of respiration outcome severity and treatment resistance. This descriptive physiologic asthma and other respiration specific outcome model can be used to design population-based asthma and other respiration specific outcome intervention programs.
Figure 2.
The synergistic contribution of ecologic setting exposures (top row, from left side to right side, wildfire, air pollution, and greenness, respectively) to lung and physiologic function (middle row), and respiration outcome onset, as modified by epidemiologic and psychologic risk factors (bottom row, left side and right side, respectively). Abbreviation: remote sensing, RS.
3.9. Asthma and Other Respiration Population-Based Intervention Programs
Currently available remote sensing air pollution methodology makes it possible to evaluate the physiologic, epidemiologic, and psychologic risk factors demonstrated by asthma and other respiration specific outcomes. Reviewed studies identified critical air pollution exposure windows that occurred prenatally and during infancy [5,6,8,9,22]. Biological mothers’ risk factors included Black race, lower educational attainment, and insufficient economic resources necessary to successfully deal with the additional challenges of being a new parent. Compared to epidemiologic risk factors, psychologic risk factors could be viewed as less important in their contribution to childhood asthma and other respiration specific outcomes. This review paper showed that psychologic risk factors contribute to both the prevalence and the incidence of asthma cases and to asthma severity, initially through increased stress experienced by the biological mothers, and later by the manifestation of generalized anxiety and clinical depression in the biological mothers [4,6,39,78]. A limitation, however, in the reviewed studies, was the use of questionnaires to establish the presence of asthma as a chronic respiratory disease, and the evaluation of psychologic risk factors in the biological mothers who gave birth to children who later developed childhood asthma. The major limitation of establishing the presence of a chronic respiratory disease on a foundation of self-reported symptoms is recall bias [20]. Whenever possible, population-based asthma intervention studies should gravitate to the use of a medical diagnosis for asthma and another respiration specific outcome such as wheeze. The contribution of environmental risk factors should be considered in the design of a population-based asthma and other respiration specific outcome intervention program. The contribution of a risk factor to a health outcome also varies by ecologic setting, as was shown in the reviewed publications. The reviewed analytical studies found decreased cortisol and an increase in cortisone [98], and decreased asthma risk [72] in persons evaluated in the greenness ecologic setting. The aversiveness of the wildfire ecologic setting, because of increased ambient smoke particulate matter pollution (and wildfire produced constituents such as arsenic, a known carcinogen, and increased exposure to CO) on asthma study participants should not be discounted. The wildfire remote sensing studies found increased health care access during and after wildfires as well as higher use of asthma rescue medication [40,55,59,96]. While the role of psychologic risk factors were not included in the wildfire remote sensing studies, it is likely that persons who have asthma and another respiration specific outcome are also experiencing all of the life-threating consequences that occur during a wildfire. For this reason, asthma study participants in the wildfire ecologic setting should have higher stress levels. The higher stress levels could be evaluated as physiologic and psychologic risk factors.
Oxidative stress and inflammation were physiologic mechanisms that were mentioned often in the Introduction and Discussion sections of the reviewed remote sensing greenness and ambient air pollution studies. Higher ambient AOD-air pollution concentration level readings increase oxidative stress, and this altered physiologic state is subsequently followed by inflammation in the lungs [7,19,25]. Avoiding ecologic settings with increased ambient air pollution is the most effective way to minimize the subsequent occurrence of asthma exacerbations and the need to utilize a nebulizer to control asthma exacerbations or to see a health care professional. An emerging research area suggests that eating foods high in antioxidants [8,99,100] can mitigate some of the adverse effects of oxidative stress and its contribution to decreased lung function. Black mothers who had a lower dietary intake of antioxidants showed critical air pollution windows during pregnancy that resulted in the birth of infants who subsequently developed asthma in early childhood [8]. In contrast, Black mothers with a higher dietary intake of antioxidants did not show a significant critical air pollution window during pregnancy and were more likely to give birth to infants who did not develop asthma in early childhood [8]. Future investigations should evaluate the utility of using dietary intake of antioxidants as a way to mitigate the adverse effects that result from exposure to higher ambient AOD-air pollution concentration level readings in persons who have many of the risk factors identified in this review.
4. Discussion of Review Paper’s Objectives
The first scientific question concerned demonstrating that the three ecologic settings differed on the contribution of exposure to outcome severity. In the greenness ecologic setting, higher NDVI values contributed to lower asthma and wheeze prevalence and higher lung function. Other physiologic measures showed decreased lung inflammation in the greenness ecologic setting. For the air pollution and wildfire ecologic settings, higher ambient AOD-air pollution concentration level readings contributed to increased asthma and other respiration specific outcome prevalence, decreased lung function, and higher lung inflammation. Ambient AOD-PM2.5 concentration level readings are more toxic in the wildfire ecologic setting than in the air pollution ecologic setting because the former also had wildfire smoke in addition to higher ambient AOD-PM2.5 concentration level readings. Pre- and post-wildfire results suggest that there are higher ambient AOD-PM2.5 concentration level readings plus wildfire smoke during wildfires than before and after the occurrence of wildfire events, higher use of asthma rescue medication, more visits to the emergency room and inpatient hospitalizations, decreased lung function, and increased lung inflammation.
With regards to the second scientific question, there were risk factor differences among the two health outcomes, three ecologic settings, and the six combinations for the health outcome and ecologic setting interaction. Age, environmental, gender, other, and total risk factors differed based on health outcomes, ecologic setting, and the interaction of these two main effects. Age and other risk factors differed among the six health outcome and ecologic setting conditions. The environmental risk factor differentiated asthma from the other respiration study participants in the health outcome group. The gender risk factor showed a higher wildfire risk factor mean than the gender means for air pollution and greenness. It is possible that prenatal and infant exposure to higher ambient AOD-PM2.5 concentration level readings in the most vulnerable prenatal and infant study participants could eventually produce irreversible increases in asthma in early childhood that could be accompanied by delays in lung development. For these reasons, the identified risk factors could describe, for the first time, a homogenous asthma subgroup that may not respond as well to some intervention protocols.
For the third scientific question, the authors of the 61 reviewed unique publications used the individual immune, inflammation, and oxidative stress physiologic mechanisms descriptively in ways that differed between the three ecologic settings. As shown in Table S8, immune and oxidative stress were used most often in the greenness ecologic setting, and inflammation and other were used most often in the air pollution ecologic setting, Table S9 shows the distribution for the physiologic mechanisms when they occurred individually, as reported in Table S8, and also when the total of the individual physiologic mechanisms also included their occurrence as components in the multiple combinations, as displayed at the bottom of Table S9. With regards to the more inclusive tally of individual physiologic mechanisms that is shown in Table S9, the largest totals occurred for the asthma (n=197, 59.2%) health outcome and the air pollution (n=229, 68.8%) ecologic setting.
5. Conclusions
This is the first review paper to evaluate the use of remote sensing exposures and their contributions to asthma and other respiration specific outcomes within the three ecologic settings of greenness, air pollution, and wildfires. A temporal analysis of publication year showed significant increases between 2017-2023 compared to 2009-2016, 13 (21.3%) versus 48 (78.7%), respectively. With continued familiarity with remote sensing methodology and the availability of computer programs that make it easier to complete these labor-intensive analyses, the number of publications in this area of environmental epidemiology should continue to increase. This is also the first review paper to demonstrate the importance of ecologic setting as a powerful determinant of the differential contribution of exposure to outcome severity. Compared to the air pollution ecologic setting, there were decreases in asthma prevalence, improvement in lung function, and decreases in lung inflammation under the greenness ecologic setting. Under the wildfire ecologic setting, wildfire smoke contributed to increases in ambient AOD-PM2.5 and ambient AOD-PM10 concentration level readings, and worse asthma outcomes. This is also the first review paper to demonstrate that the contribution of risk factors to asthma and other respiration specific outcomes differs as a function of ecologic setting. Prenatal and infant exposure to higher ambient AOD-PM2.5 concentration level readings resulted in elevated asthma incidence in early childhood, which was accompanied by delays in lung development. These two adverse outcomes suggest that the early exposure to elevated ambient AOD-PM2.5 concentration level readings could result in an irreversible asthma outcome that could be more resistant to treatment intervention and should require additional efforts to avoid the occurrence of asthma exacerbations. Consideration of risk factors and their origin is especially important in the design, implementation, and evaluation of asthma and other respiration specific outcome population-based intervention programs. Population-based asthma and other respiration specific outcome intervention programs should also consider the information contained in the descriptive physiologic asthma and other respiration specific outcome model. This model shows the interrelationship between ecologic setting, physiologic mechanisms, health outcomes, and risk factors to the onset of asthma and other respiration specific outcomes in different ecologic settings.
6. Future Directions
Multi-year publication trends documented in this review suggest even in this decade more environmental epidemiology publications will include remote sensing technology to evaluate the contribution of different types of exposures (NDVI and EVI greenness, ambient AOD-PM concentration level readings without and with wildfire smoke) to asthma and other respiration specific outcomes. One limitation of this review was the availability of only descriptive published studies [47]. Another shortcoming was the absence of publications that a priori designed and implemented studies to explain how descriptive physiologic mechanisms contributed to the obtained results. Several proposed changes in the way future publications evaluate the utility of remote sensing exposures to asthma and other respiration specific outcomes may increase our understanding of chronic respiratory diseases in general and asthma in particular.
Results summarized in Table 2 showed that 53 of the 74 specific respiration outcomes reported the concordance statistic (PGR2PER) for ambient AOD-PM2.5 concentration level readings and on-the-ground ambient PM2.5 monitor measurements. When possible, future publications should report some type of concordance statistic that quantifies the accuracy of the utilized ambient AOD-PM2.5 concentration level readings. Some type of concordance statistic should be reported for other remote sensing concentration level readings, which could include NDVI and EVI in the greenness ecologic setting, and ambient AOD-PM2.5 plus wildfire smoke in the wildfire ecologic setting. The use of the concordance statistic for ambient AOD-PM10 and ambient AOD-NO2 concentration level readings were also included in Table 2. All 19 ambient AOD-PM10 and 14 of the 15 ambient AOD-NO2 concentration level readings utilized the PGR2PER statistic. Ambient AOD-PM10 would be appropriate to evaluate the contribution of wildfire smoke to asthma and other respiration specific outcomes in the wildfire ecologic setting [55], and ambient AOD-NO2 could be utilized as a proxy for automobile and commercial vehicle produced air pollution in economically developing and economically developed countries [10]. Future publications should include the PGR2PER statistic to evaluate the accuracy of utilized remote sensing exposures besides ambient AOD-PM2.5, ambient AOD-PM10, or ambient AOD-NO2 concentration level readings, i.e., ambient AOD-PM1 concentration level readings.
Future publications should also consider the increased utility of designing and implementing studies that explain how remote sensing ambient air pollution and other exposures influence asthma and other respiration specific outcomes. The results provided by an hypothesis testing study are more informative and generalizable since the scientific method is utilized to evaluate the investigator’s hypothesis, expressed in the form of a scientific question, and the statistical analyses are used to objectively evaluate the reported outcomes. We know that exposure to higher ambient AOD-PM2.5 concentration level readings results in inflammation in the lungs of asthma and other respiration study participants and worse epidemiologic and psychologic outcomes [4,5,6,9,22,23]. We also know lung inflammation is lower and epidemiologic and psychologic outcomes improve in study participants who reside closer to a park or forest [52,68,71,74]. The contribution of higher ambient AOD-PM2.5 concentration level readings to the subsequent occurrence of lung inflammation in different study participants, those with asthma, another respiration specific outcome, or in normal controls, can be assessed as a physiologic risk factor through the measurement FeNO in exhaled breath [25,39].
Subsequent investigations should evaluate both physiologic mechanisms of immune, inflammation, oxidative stress, and risk factors, along with epidemiologic, and when appropriate, psychologic risk factors. Results from this review showed that study participants’ age contributes to differences in risk factor means of health outcomes (asthma, other respiration), ecologic setting (greenness, air pollution, wildfire), and the interaction between health outcome and ecologic setting, as summarized in Table 4. The highest age risk factor means were found for asthma study participants in the wildfire ecologic setting. Other health outcome and ecologic setting differences were found for the environmental (asthma), gender (wildfire), other (asthma, greenness, asthma-greenness), and total (asthma, wildfire) risk factor means, as shown in Table 4. Psychologic risk factors did not make significant contributions to health outcomes, ecologic settings, and the six interaction means for these two main effects, as shown in Table 4. It would be informative if future studies were able to include physiologic, epidemiologic, and psychologic risk factors of asthma and other respiration specific outcomes in planned investigations undertaken in different ecologic settings, and in urban and rural areas within economically developing and economically developed countries.
Supplementary Materials
The following supporting information can be downloaded at the website of this paper posted on Preprints.org, Table S1: Associations Between Selected Variables and Risk Factors with the Significant Outcome Group: Respiration Group of Asthma and Ecologic Setting of Greenness; Table S2: Associations Between Selected Variables and Risk Factors with the Significant Outcome Group: Respiration Group of Asthma and Ecologic Setting of Air Pollution; Table S3: Associations Between Selected Variables and Risk Factors with the Significant Outcome Group: Respiration Group of Asthma and Ecologic Setting of Wildfire; Table S4: Associations Between Selected Variables and Risk Factors with the Significant Outcome Group: Respiration Group of Other Respiration and Ecologic Setting of Greenness; Table S5: Associations Between Selected Variables and Risk Factors with the Significant Outcome Group: Respiration Group of Other Respiration and Ecologic Setting of Air Pollution; Table S6: Associations Between Selected Variables and Risk Factors with the Significant Outcome Group: Respiration Group of Other Respiration and Ecologic Setting of Wildfire; Table S7: AOD-PM2.5, AOD-PM10, and AOD-NO2 Means by Health Outcome, Ecologic Setting, and the Health Outcome by Ecologic Setting Interaction; Table S8: Analysis of Individual and Multiple Physiologic Mechanisms of Immune, Inflammation, and Oxidative Stress by Health Outcome and Ecologic Setting Main Effects; Table S9: Analysis of Individual Physiologic Mechanisms of Immune, Inflammation, and Oxidative Stress by Health Outcome and Ecologic Setting.
Author Contributions
Conceptualization; methodology; validation; formal analysis; investigation; resources; data curation; writing, original draft preparation; writing, review, and editing; visualization; project administration. The author read and approved the submitted manuscript.
Funding
This research received no external funding.
Institutional Review Board Statement
Not applicable.
Informed Consent Statement
Not applicable.
Data Availability Statement
Not applicable.
Acknowledgements
Montasar Mansour Mahmoud, fourth year medical student, Faculty of Medicine, Al-Azhar University, Assiut, Egypt, contributed to the literature review, and the writing of multiple sections of this manuscript. Sherryll M. Braggio, B.A., M.Ed., Vice President and Director of Human Resources, Diablo Analytical Institute, Walnut Creek, CA, USA, reviewed the manuscript.
Conflicts of Interest
The author declares he has no conflict of interest.
References
- CDC-NCHS. International Classification of Diseases, Ninth Revision, Clinical Modification (ICD-9-CM) Secondary International Classification of Diseases, Ninth Revision, Clinical Modification (ICD-9-CM) 2024. https://www.cdc.gov/nchs/icd/icd9cm.htm.
- CDC-NCHS. International Classification of Diseases, Tenth Revision, Clinical Modification (ICD-10-CM). Secondary International Classification of Diseases, Tenth Revision, Clinical Modification (ICD-10-CM) 2024. https://www.cdc.gov/nchs/icd/icd-10-cm.htm.
- Anderson HR, Butland BK, van Donkelaar A, et al. Satellite-based estimates of ambient air pollution and global variations in childhood asthma prevalence. Environmental health perspectives 2012;120(9):1333-9. [CrossRef]
- Rosa MJ, Just AC, Kloog I, et al. Prenatal particulate matter exposure and wheeze in Mexican children: Effect modification by prenatal psychosocial stress. Ann Allergy Asthma Immunol 2017;119(3):232-37.e1. [CrossRef]
- Hsu HH, Chiu YH, Coull BA, et al. Prenatal Particulate Air Pollution and Asthma Onset in Urban Children. Identifying Sensitive Windows and Sex Differences. American journal of respiratory and critical care medicine 2015;192(9):1052-9. [CrossRef]
- Lee A, Leon Hsu HH, Mathilda Chiu YH, et al. Prenatal fine particulate exposure and early childhood asthma: Effect of maternal stress and fetal sex. The Journal of allergy and clinical immunology 2018;141(5):1880-86. [CrossRef]
- Xing Z, Yang T, Shi S, et al. Ambient particulate matter associates with asthma in high altitude region: A population-based study. World Allergy Organization Journal 2023;16(5):100774.
- Chiu YM, Carroll KN, Coull BA, Kannan S, Wilson A, Wright RJ. Prenatal Fine Particulate Matter, Maternal Micronutrient Antioxidant Intake, and Early Childhood Repeated Wheeze: Effect Modification by Race/Ethnicity and Sex. Antioxidants (Basel) 2022;11(2). [CrossRef]
- Chen T, Shi S, Li X, et al. Improved ambient air quality is associated with decreased prevalence of childhood asthma and infancy shortly after weaning is a sensitive exposure window. Allergy 2023. [CrossRef]
- Anenberg SC, Mohegh A, Goldberg DL, et al. Long-term trends in urban NO(2) concentrations and associated paediatric asthma incidence: estimates from global datasets. Lancet Planet Health 2022;6(1):e49-e58. [CrossRef]
- Braggio JT, Hall ES, Weber SA, Huff AK. Contribution of Satellite-Derived Aerosol Optical Depth PM(2.5) Bayesian Concentration Surfaces to Respiratory-Cardiovascular Chronic Disease Hospitalizations in Baltimore, Maryland. Atmosphere (Basel) 2020;11(2):209. [CrossRef]
- Boll LM, Khamirchi R, Alonso L, et al. Prenatal greenspace exposure and cord blood cortisol levels: A cross-sectional study in a middle-income country. Environment international 2020;144:106047. [CrossRef]
- Ibrahim MF, Hod R, Nawi AM, Sahani M. Association between ambient air pollution and childhood respiratory diseases in low- and middle-income Asian countries: A systematic review. Atmospheric Environment 2021;256:118422.
- Soto-Martínez ME, Soto-Quiros ME, Custovic A. Childhood Asthma: Low and Middle-Income Countries Perspective. Acta Med Acad 2020;49(2):181-90. [CrossRef]
- Weber SA, Insaf TZ, Hall ES, Talbot TO, Huff AK. Assessing the impact of fine particulate matter (PM(2.5)) on respiratory-cardiovascular chronic diseases in the New York City Metropolitan area using Hierarchical Bayesian Model estimates. Environ Res 2016;151:399-409. [CrossRef]
- Kloog I, Koutrakis P, Coull BA, Lee HJ, Schwartz J. Assessing temporally and spatially resolved PM2.5 exposures for epidemiological studies using satellite aerosol optical depth measurements. Atmospheric Environment 2011;45(35):6267-75.
- To T, Zhu J, Stieb D, et al. Early life exposure to air pollution and incidence of childhood asthma, allergic rhinitis and eczema. Eur Respir J 2020;55(2). [CrossRef]
- PE, Qian ZM, McMillin SE, et al. Relationships between Long-Term Ozone Exposure and Allergic Rhinitis and Bronchitic Symptoms in Chinese Children. Toxics 2021;9(9). [CrossRef]
- Rice MB, Ljungman PL, Wilker EH, et al. Long-term exposure to traffic emissions and fine particulate matter and lung function decline in the Framingham heart study. American journal of respiratory and critical care medicine 2015;191(6):656-64. [CrossRef]
- Last, J. A Dictionary of Epidemiology. 3rd ed. New York: Oxford University Press, 1995.
- Khalili R, Bartell SM, Hu X, et al. Early-life exposure to PM(2.5) and risk of acute asthma clinical encounters among children in Massachusetts: a case-crossover analysis. Environmental health : a global access science source 2018;17(1):20. [CrossRef]
- Jung CR, Chen WT, Tang YH, Hwang BF. Fine particulate matter exposure during pregnancy and infancy and incident asthma. The Journal of allergy and clinical immunology 2019;143(6):2254-62.e5. [CrossRef]
- Rivera Rivera NY, Tamayo-Ortiz M, Mercado García A, et al. Prenatal and early life exposure to particulate matter, environmental tobacco smoke and respiratory symptoms in Mexican children. Environ Res 2021;192:110365. [CrossRef]
- Zhang Y, Yin Z, P, et al. Early-life exposure to PM(2.5) constituents and childhood asthma and wheezing: Findings from China, Children, Homes, Health study. Environment international 2022;165:107297. [CrossRef]
- Knibbs LD, Cortés de Waterman AM, Toelle BG, et al. The Australian Child Health and Air Pollution Study (ACHAPS): A national population-based cross-sectional study of long-term exposure to outdoor air pollution, asthma, and lung function. Environment international 2018;120:394-403. [CrossRef]
- Chau K, Franklin M, Gauderman WJ. Satellite-derived PM2. 5 composition and its differential effect on children’s lung function. Remote Sensing 2020;12(6):1028.
- Guo C, Hoek G, Chang L-y, et al. Long-term exposure to ambient fine particulate matter (PM 2.5) and lung function in children, adolescents, and young adults: a longitudinal cohort study. Environmental health perspectives 2019;127(12):127008.
- Fuertes E, Markevych I, Thomas R, et al. Residential greenspace and lung function up to 24 years of age: The ALSPAC birth cohort. Environment international 2020;140:105749. [CrossRef]
- Rosa MJ, Lamadrid-Figueroa H, Alcala C, et al. Associations between early-life exposure to PM(2.5) and reductions in childhood lung function in two North American longitudinal pregnancy cohort studies. Environ Epidemiol 2023;7(1):e234. [CrossRef]
- Fan J, Li S, Fan C, Bai Z, Yang K. The impact of PM2.5 on asthma emergency department visits: a systematic review and meta-analysis. Environmental science and pollution research international 2016;23(1):843-50. [CrossRef]
- Zheng XY, Ding H, Jiang LN, et al. Association between Air Pollutants and Asthma Emergency Room Visits and Hospital Admissions in Time Series Studies: A Systematic Review and Meta-Analysis. PLoS One 2015;10(9):e0138146. [CrossRef]
- Foppiano F, Schaub B. Childhood asthma phenotypes and endotypes: a glance into the mosaic. Mol Cell Pediatr 2023;10(1):9. [CrossRef]
- Freitas PD, Xavier RF, McDonald VM, et al. Identification of asthma phenotypes based on extrapulmonary treatable traits. Eur Respir J 2021;57(1). [CrossRef]
- Pijnenburg MW, Frey U, De Jongste JC, Saglani S. Childhood asthma: pathogenesis and phenotypes. Eur Respir J 2022;59(6). [CrossRef]
- McLoughlin RF, McDonald VM. The Management of Extrapulmonary Comorbidities and Treatable Traits; Obesity, Physical Inactivity, Anxiety, and Depression, in Adults With Asthma. Front Allergy 2021;2:735030. [CrossRef]
- Pavord ID, Barnes PJ, Lemière C, Gibson PG. Diagnosis and Assessment of the Asthmas. J Allergy Clin Immunol Pract 2023;11(1):1-8. [CrossRef]
- Ho YN, Cheng FJ, Tsai MT, Tsai CM, Chuang PC, Cheng CY. Fine particulate matter constituents associated with emergency room visits for pediatric asthma: a time-stratified case-crossover study in an urban area. BMC public health 2021;21(1):1593. [CrossRef]
- Wang X, Guo Y, Cai M, et al. Constituents of fine particulate matter and asthma in 6 low- and middle-income countries. The Journal of allergy and clinical immunology 2022;150(1):214-22.e5. [CrossRef]
- Chen E, Miller GE, Shalowitz MU, et al. Difficult Family Relationships, Residential Greenspace, and Childhood Asthma. Pediatrics 2017;139(4). [CrossRef]
- Lipner EM, O'Dell K, Brey SJ, et al. The Associations Between Clinical Respiratory Outcomes and Ambient Wildfire Smoke Exposure Among Pediatric Asthma Patients at National Jewish Health, 2012-Geohealth 2019;3(6):146-59. [CrossRef]
- Exley D, Norman A, Hyland M. Adverse childhood experience and asthma onset: a systematic review. Eur Respir Rev 2015;24(136):299-305. [CrossRef]
- Rosa MJ, Lee AG, Wright RJ. Evidence establishing a link between prenatal and early-life stress and asthma development. Curr Opin Allergy Clin Immunol 2018;18(2):148-58. [CrossRef]
- Shankardass K, McConnell R, Jerrett M, Milam J, Richardson J, Berhane K. Parental stress increases the effect of traffic-related air pollution on childhood asthma incidence. Proceedings of the National Academy of Sciences of the United States of America 2009;106(30):12406-11. [CrossRef]
- Hahn J, Gold DR, Coull BA, et al. Air pollution, neonatal immune responses, and potential joint effects of maternal depression. International journal of environmental research and public health 2021;18(10):5062.
- Sheffield PE, Speranza R, Chiu YM, et al. Association between particulate air pollution exposure during pregnancy and postpartum maternal psychological functioning. PLoS One 2018;13(4):e0195267. [CrossRef]
- Zhao W, Zhao Y, Wang P, et al. PM2.5 exposure associated with prenatal anxiety and depression in pregnant women. Ecotoxicology and environmental safety 2022;248:114284.
- Braggio, J. Inflammation Describes and Explains the Adverse Effects of Aerosol Optical Depth-Particulate Matter on Cardiovascular Outcomes: A Literature Review Since Medical Research Archives 2023;11(8). [CrossRef]
- Paciência I, Cavaleiro Rufo J, Moreira A. Environmental inequality: Air pollution and asthma in children. Pediatr Allergy Immunol 2022;33(6). [CrossRef]
- NIH. PubMed. Secondary PubMed 2024. https://www.ncbi.nlm.nih.gov/pubmed/.
- Google. Scholar. Secondary Scholar 2024. https://scholar.google.com/intl/en-US/scholar/about.html.
- NASA. Earth Orbiting System (EOS). Secondary Earth Orbiting System (EOS) 2024. https://eospso.nasa.gov/mission-category/3.
- Dadvand P, Villanueva CM, Font-Ribera L, et al. Risks and benefits of green spaces for children: a cross-sectional study of associations with sedentary behavior, obesity, asthma, and allergy. Environmental health perspectives 2014;122(12):1329-35. [CrossRef]
- Elliott CT, Henderson SB, Wan V. Time series analysis of fine particulate matter and asthma reliever dispensations in populations affected by forest fires. Environmental health : a global access science source 2013;12:11. [CrossRef]
- Magzamen S, Gan RW, Liu J, et al. Differential Cardiopulmonary Health Impacts of Local and Long-Range Transport of Wildfire Smoke. Geohealth 2021;5(3):e2020GH000330. [CrossRef]
- Delfino RJ, Brummel S, Wu J, et al. The relationship of respiratory and cardiovascular hospital admissions to the southern California wildfires of 2003. Occup Environ Med 2009;66(3):189-97. [CrossRef]
- Gan RW, Ford B, Lassman W, et al. Comparison of wildfire smoke estimation methods and associations with cardiopulmonary-related hospital admissions. Geohealth 2017;1(3):122-36. [CrossRef]
- Hahn MB, Kuiper G, O'Dell K, Fischer EV, Magzamen S. Wildfire Smoke Is Associated With an Increased Risk of Cardiorespiratory Emergency Department Visits in Alaska. Geohealth 2021;5(5):e2020GH000349. [CrossRef]
- Pennington AF, Vaidyanathan A, Ahmed FS, et al. Large-scale agricultural burning and cardiorespiratory emergency department visits in the U.S. state of Kansas. J Expo Sci Environ Epidemiol 2023. [CrossRef]
- Stowell JD, Geng G, Saikawa E, et al. Associations of wildfire smoke PM(2.5) exposure with cardiorespiratory events in Colorado 2011-2014. Environment international 2019;133(Pt A):105151. [CrossRef]
- Gan RW, Liu J, Ford B, et al. The association between wildfire smoke exposure and asthma-specific medical care utilization in Oregon during the 2013 wildfire season. J Expo Sci Environ Epidemiol 2020;30(4):618-28. [CrossRef]
- Rappold AG, Stone SL, Cascio WE, et al. Peat bog wildfire smoke exposure in rural North Carolina is associated with cardiopulmonary emergency department visits assessed through syndromic surveillance. Environmental health perspectives 2011;119(10):1415-20. [CrossRef]
- NASA. MODIS Vegetation Index Products (NDVI and EVI). Secondary MODIS Vegetation Index Products (NDVI and EVI) 2024. https://modis.gsfc.nasa.gov/data/dataprod/mod13.php.
- NASA. MODIS Thermal Anomalies/Fire. Secondary MODIS Thermal Anomalies/Fire 2024. https://modis.gsfc.nasa.gov/data/dataprod/mod14.php.
- SAS. SAS Studio 3.8: User's Guide. Cary, NC: SAS Institute Inc., 2018.
- SAS. Base SAS 9.4 Procedures Guide, Seventh Edition. Cary, NC: SAS Institute Inc., 2017.
- SAS. SAS/STAT 15.3 User's Guide. Cary, NC: SAS Institute Inc., 2023.
- Andrusaityte S, Grazuleviciene R, Kudzyte J, Bernotiene A, Dedele A, Nieuwenhuijsen MJ. Associations between neighbourhood greenness and asthma in preschool children in Kaunas, Lithuania: a case-control study. BMJ Open 2016;6(4):e010341. [CrossRef]
- Cilluffo G, Ferrante G, Fasola S, et al. Association between asthma control and exposure to greenness and other outdoor and indoor environmental factors: a longitudinal study on a cohort of asthmatic children. International journal of environmental research and public health 2022;19(1):512.
- De Roos AJ, Kenyon CC, Yen YT, et al. Does Living near Trees and Other Vegetation Affect the Contemporaneous Odds of Asthma Exacerbation among Pediatric Asthma Patients? J Urban Health 2022;99(3):533-48. [CrossRef]
- Eldeirawi K, Kunzweiler C, Zenk S, et al. Associations of urban greenness with asthma and respiratory symptoms in Mexican American children. Ann Allergy Asthma Immunol 2019;122(3):289-95. [CrossRef]
- Hartley K, Ryan PH, Gillespie GL, et al. Residential greenness, asthma, and lung function among children at high risk of allergic sensitization: a prospective cohort study. Environmental Health 2022;21(1):1-11.
- Hu Y, Chen Y, Liu S, et al. Higher greenspace exposure is associated with a decreased risk of childhood asthma in Shanghai - A megacity in China. Ecotoxicology and environmental safety 2023;256:114868. [CrossRef]
- Hu Y, Chen Y, Liu S, et al. Residential greenspace and childhood asthma: An intra-city study. The Science of the total environment 2023;857(Pt 3):159792. [CrossRef]
- Ihlebæk C, Aamodt G, Aradi R, Claussen B, Thorén KH. Association between urban green space and self-reported lifestyle-related disorders in Oslo, Norway. Scand J Public Health 2018;46(6):589-96. [CrossRef]
- Squillacioti G, Bellisario V, Levra S, Piccioni P, Bono R. Greenness Availability and Respiratory Health in a Population of Urbanised Children in North-Western Italy. International journal of environmental research and public health 2019;17(1). [CrossRef]
- Thien F, Beggs PJ, Csutoros D, et al. The Melbourne epidemic thunderstorm asthma event 2016: an investigation of environmental triggers, effect on health services, and patient risk factors. Lancet Planet Health 2018;2(6):e255-e63. [CrossRef]
- Tischer C, Gascon M, Fernández-Somoano A, et al. Urban green and grey space in relation to respiratory health in children. Eur Respir J 2017;49(6). [CrossRef]
- Alcala CS, Orozco Scott P, Tamayo-Ortiz M, et al. Longitudinal assessment of maternal depression and early childhood asthma and wheeze: Effect modification by child sex. Pediatric Pulmonology 2023;58(1):98-106.
- Castillo MD, Kinney PL, Southerland V, et al. Estimating Intra-Urban Inequities in PM(2.5)-Attributable Health Impacts: A Case Study for Washington, DC. Geohealth 2021;5(11):e2021GH000431. [CrossRef]
- Chang HH, Pan A, Lary DJ, et al. Time-series analysis of satellite-derived fine particulate matter pollution and asthma morbidity in Jackson, MS. Environ Monit Assess 2019;191(Suppl 2):280. [CrossRef]
- Davila Cordova JE, Tapia Aguirre V, Vasquez Apestegui V, et al. Association of PM(2.5) concentration with health center outpatient visits for respiratory diseases of children under 5 years old in Lima, Peru. Environmental health : a global access science source 2020;19(1):7. [CrossRef]
- Fasola S, Maio S, Baldacci S, et al. Effects of particulate matter on the incidence of respiratory diseases in the pisan longitudinal study. International journal of environmental research and public health 2020;17(7):2540.
- Lai VWY, Bowatte G, Knibbs LD, et al. Residential NO(2) exposure is associated with urgent healthcare use in a thunderstorm asthma cohort. Asia Pac Allergy 2018;8(4):e33. [CrossRef]
- Lavigne É, Talarico R, van Donkelaar A, et al. Fine particulate matter concentration and composition and the incidence of childhood asthma. Environment international 2021;152:106486. [CrossRef]
- Li S, Wei J, Hu Y, et al. Long-term effect of intermediate particulate matter (PM(1)(-)(2.5)) on incident asthma among middle-aged and elderly adults: A national population-based longitudinal study. The Science of the total environment 2023;859(Pt 1):160204. [CrossRef]
- Lin YT, Shih H, Jung CR, et al. Effect of exposure to fine particulate matter during pregnancy and infancy on paediatric allergic rhinitis. Thorax 2021;76(6):568-74. [CrossRef]
- Maio S, Fasola S, Marcon A, et al. Relationship of long-term air pollution exposure with asthma and rhinitis in Italy: an innovative multipollutant approach. Environmental Research 2023;224:115455.
- Renzi M, Scortichini M, Forastiere F, et al. A nationwide study of air pollution from particulate matter and daily hospitalizations for respiratory diseases in Italy. The Science of the total environment 2022;807(Pt 3):151034. [CrossRef]
- Schreibman A, Xie S, Hubbard RA, Himes BE. Linking Ambient NO2 Pollution Measures with Electronic Health Record Data to Study Asthma Exacerbations. AMIA Jt Summits Transl Sci Proc 2023;2023:467-76 [published Online First: 20230616].
- Strickland MJ, Hao H, Hu X, Chang HH, Darrow LA, Liu Y. Pediatric Emergency Visits and Short-Term Changes in PM2.5 Concentrations in the U.S. State of Georgia. Environmental health perspectives 2016;124(5):690-6. [CrossRef]
- Tétreault LF, Doucet M, Gamache P, et al. Severe and Moderate Asthma Exacerbations in Asthmatic Children and Exposure to Ambient Air Pollutants. International journal of environmental research and public health 2016;13(8). [CrossRef]
- Tétreault LF, Doucet M, Gamache P, et al. Childhood Exposure to Ambient Air Pollutants and the Onset of Asthma: An Administrative Cohort Study in Québec. Environmental health perspectives 2016;124(8):1276-82. [CrossRef]
- To T, Zhu J, Villeneuve PJ, et al. Chronic disease prevalence in women and air pollution--A 30-year longitudinal cohort study. Environment international 2015;80:26-32. [CrossRef]
- Vu BN, Tapia V, Ebelt S, Gonzales GF, Liu Y, Steenland K. The association between asthma emergency department visits and satellite-derived PM(2.5) in Lima, Peru. Environ Res 2021;199:111226. [CrossRef]
- Yan M, Ge H, Zhang L, et al. Long-term PM(2.5) exposure in association with chronic respiratory diseases morbidity: A cohort study in Northern China. Ecotoxicology and environmental safety 2022;244:114025. [CrossRef]
- Hein L, Spadaro JV, Ostro B, et al. The health impacts of Indonesian peatland fires. Environmental health : a global access science source 2022;21(1):62. [CrossRef]
- EPA (U.S. Environmental Protection Agency). NAAQS (National Ambient Air Quality Standards) Table. Secondary NAAQS (National Ambient Air Quality Standards) Table 2024. https://www.epa.gov/criteria-air-pollutants/naaqs-table.
- Wang J, Chen G, Hou J, et al. Associations of residential greenness, ambient air pollution, biological sex, and glucocorticoids levels in rural China. Ecotoxicology and environmental safety 2022;242:113945.
- Dreher, ML. Whole Fruits and Fruit Fiber Emerging Health Effects. Nutrients 2018;10(12). [CrossRef]
- Michaeloudes C, Abubakar-Waziri H, Lakhdar R, et al. Molecular mechanisms of oxidative stress in asthma. Mol Aspects Med 2022;85:101026. [CrossRef]
Table 1.
Remote Sensing of Asthma and Other Respiration Specific Outcomes by Ecologic Setting.
| VARIABLES1 | STUDIES2 | SPECIFIC OUTCOMES3 |
ECOLOGIC SETTING | ||
| Greenness | Air Pollution |
Wildfires | |||
| Participants | 2,821,393 | 13,725,971 | 46,089 | 13,237,790 | 442,092 |
| Studiesd,d,b | 61 | 61 | 13 (21.3) | 37 (60.7) | 11 (18.0) |
| Specific Outcomesd,d,b | 61 | 198 | 41 (20.7) | 125 (63.1) | 32 (16.2) |
| Publication Yearb,b,c | |||||
| 2009-2016 | 13 (21.3) | 31 (15.7) | 3 (1.5) | 21 (10.6) | 7 (3.5) |
| 2017-2023 | 48 (78.7) | 167 (84.3) | 38 (19.2) | 104 (52.5) | 25 (12.6) |
| Countryb,b,b | |||||
| 2+ Countries | 3 (4.9) | 5 (2.5) | 0 (0.0) | 5 (2.5) | 0 (0.0) |
| Australia | 3 (4.9) | 12 (6.1) | 1 (0.5) | 11 (5.6) | 0 (0.0) |
| Canada | 6 (9.8) | 21 (10.6) | 0 (0.0) | 20 (10.1) | 1 (0.5) |
| China | 8 (13.1) | 29 (14.6) | 2 (1.0) | 27 (13.6) | 0 (0.0) |
| Indonesia | 1 (1.6) | 2 (1.0) | 0 (0.0) | 0 (0.0) | 2 (1.0) |
| Italy | 5 (8.2) | 49 (24.8) | 15 (7.6) | 34 (17.2) | 0 (0.0) |
| Lithuania | 1 (1.6) | 1 (0.5) | 1 (0.5) | 0 (0.0) | 0 (0.0) |
| Mexico | 3 (4.9) | 4 (2.0) | 0 (0.0) | 4 (2.0) | 0 (0.0) |
| Norway | 1 (1.6) | 2 (1.0) | 2 (1.0) | 0 (0.0) | 0 (0.0) |
| Peru | 2 (3.3) | 2 (1.0) | 0 (0.0) | 2 (1.0) | 0 (0.0) |
| Spain | 2 (3.3) | 6 (3.0) | 6 (3.0) | 0 (0.0) | 0 (0.0) |
| Taiwan | 2 (3.3) | 2 (1.0) | 0 (0.0) | 2 (1.0) | 0 (0.0) |
| United States | 24 (39.3) | 63 (31.8) | 14 (7.1) | 20 (10.1) | 29 (14.6) |
| Study Designb,b b | |||||
| Case Control | 11 (18.0) | 28 (14.1) | 4 (2.0) | 7 (3.5) | 17 (8.6) |
| Cross Sectional | 23 (37.7) | 100 (50.5) | 24 (12.1) | 64 (32.3) | 12 (6.1) |
| Panel | 1 (1.6) | 1 (0.5) | 0 (0.0) | 1 (0.5) | 0 (0.0) |
| Prospective Cohort | 11 (18.0) | 37 (18.7) | 13 (6.6) | 24 (12.1) | 0 (0.0) |
| Retrospective Cohort | 9 (14.8) | 21 (10.6) | 0 (0.0) | 21 (10.6) | 0 (0.0) |
| Time Series | 6 (9.8) | 11 (5.6) | 0 (0.0) | 8 (4.0) | 3 (1.5) |
| Surveillanceb,b,b | |||||
| Incidence | 18 (29.5) | 53 (26.8) | 9 (4.6) | 44 (22.2) | 0 (0.0) |
| Prevalence | 43 (70.5) | 144 (72.7) | 31 (15.7) | 81 (40.9) | 32 (16.2) |
| Other | . | 1 (0.5) | 1 (0.5) | 0 (0.0) | 0 (0.0) |
| ICD-CMb,b,b | |||||
| 9 | 21 (34.4) | 51 (25.8) | 10 (5.1) | 22 (11.1) | 19 (9.6) |
| 10 | 10 (16.4) | 27 (13.6) | 0 (0.0) | 21 (10.6) | 6 (3.0) |
| Other | 30 (49.2) | 120 (60.6) | 31 (15.7) | 82 (41.4) | 7 (3.5) |
| Questionnaire Dxb,b,b | |||||
| No | 34 (55.7) | 97 (49.0) | 20 (10.1) | 46 (23.2) | 31 (15.7) |
| Yes | 26 (42.6) | 100 (50.5) | 21 (10.6) | 78 (39.4) | 1 (0.5) |
| Other | 1 (1.6) | 1 (0.5) | 0 (0.0) | 1 (0.5) | 0 (0.0) |
| Medical Dxb,b,b | |||||
| No | 27 (44.3) | 106 (53.5) | 31 (15.7) | 68 (34.3) | 7 (3.5) |
| Yes | 31 (50.8) | 78 (39.4) | 10 (5.1) | 43 (21.7) | 25 (12.6) |
| Other | 3 (4.9) | 14 (7.1) | 0 (0.0) | 14 (7.1) | 0 (0.0) |
| Health Outcome b,b,c | |||||
| Asthma | 54 (88.5) | 124 (62.6) | 31 (15.7) | 75 (37.9) | 18 (9.1) |
| Other Respiration | 7 (11.5) | 74 (37.4) | 10 (5.1) | 50 (25.2) | 14 (7.1) |
| Specific Outcomeb,b,b | |||||
| Allergic Rhinitis | 2 (3.3) | 15 (7.6) | 2 (1.0) | 13 (6.6) | 0 (0.0) |
| Asthma | 46 (75.4) | 69 (34.8) | 11 (5.6) | 46 (23.2) | 12 (6.1) |
| Asthma Attacks | 4 (6.6) | 14 (7.1) | 4 (2.0) | 9 (4.6) | 1 (0.5) |
| Bronchitis | . | 10 (5.1) | 2 (1.0) | 2 (1.0) | 6 (3.0) |
| Cough | . | 5 (2.5) | 2 (1.0) | 3 (1.5) | 0 (0.0) |
| Eczema | . | 5 (2.5) | 0 (0.0) | 5 (2.5) | 0 (0.0) |
| FEF25% | . | 1 (0.5) | 1 (0.5) | 0 (0.0) | 0 (0.0) |
| FEF25%-75% | . | 2 (1.0) | 2 (1.0) | 0 (0.0) | 0 (0.0) |
| FEF50% | . | 2 (1.0) | 0 (0.0) | 2 (1.0) | 0 (0.0) |
| FEF75% | . | 2 (1.0) | 0 (0.0) | 2 (1.0) | 0 (0.0) |
| FeNO | . | 2 (1.0) | 1 (0.5) | 1 (0.5) | 0 (0.0) |
| FEV1 | 2 (3.3) | 8 (4.0) | 3 (1.5) | 4 (2.0) | 1 (0.5) |
| FEV1/FVC | . | 8 (4.0) | 3 (1.5) | 4 (2.0) | 1 (0.5) |
| FVC | . | 8 (4.0) | 3 (1.5) | 4 (2.0) | 1 (0.5) |
| Other | . | 1 (0.5) | 1 (0.5) | 0 (0.0) | 0 (0.0) |
| Phlegm | . | 4 (2.0) | 1 (0.5) | 3 (1.5) | 0 (0.0) |
| Psychologic | 1 (1.6) | 4 (2.0) | 2 (1.0) | 2 (1.0) | 0 (0.0) |
| Rescue Medication | 1 (1.6) | 11 (5.6) | 0 (0.0) | 9 (4.6) | 2 (1.0) |
| Respiration | . | 11 (5.6) | 0 (0.0) | 3 (1.5) | 8 (4.0) |
| Wheeze | 5 (8.2) | 16 (8.1) | 3 (1.5) | 13 (6.6) | 0 (0.0) |
| Preexposure Studiesb,b,b | |||||
| No | 52 (85.2) | 183 (92.4) | 41 (20.7) | 110 (55.6) | 32 (16.2) |
| Yes | 9 (14.8) | 15 (7.6) | 0 (0.0) | 15 (7.6) | 0 (0.0) |
| Lung Studiesb,b,b | |||||
| No | 59 (96.7) | 165 (83.3) | 28 (14.1) | 108 (54.6) | 29 (14.6) |
| Yes | 2 (3.3) | 33 (16.7) | 13 (6.6) | 17 (8.6) | 3 (1.5) |
| Psychologic Studiesb,b,c | |||||
| No | 57 (93.4) | 191 (96.5) | 38 (19.2) | 121 (61.1) | 32 (16.2) |
| Yes | 4 (6.6) | 7 (3.5) | 3 (1.5) | 4 (2.0) | 0 (0.0) |
| Monitorsb, b, b | |||||
| No | 12 (19.7) | 43 (21.7) | 40 (20.2) | 3 (1.5) | 0 (0.0) |
| Yes | 49 (80.3) | 155 (78.3) | 1 (0.5) | 122 (61.6) | 32 (16.2) |
| AODd,b,b | |||||
| No | . | 23 (11.6) | 0 (0.0) | 23 (11.6) | 0 (0.0) |
| Yes | 61 (100.0) | 175 (88.4) | 41 (20.7) | 102 (51.5) | 32 (16.2) |
| AODVALb,b,b | |||||
| No AOD | . | 23 (15.6) | 0 (0.0) | 23 (15.6) | 0 (0.0) |
| No | 13 (28.9) | 22 (15.0) | 0 (0.0) | 15 (10.2) | 7 (4.8) |
| Yes | 29 (64.4) | 93 (63.3) | 1 (0.7) | 84 (57.1) | 8 (5.4) |
| Other | 3 (6.7) | 9 (6.1) | 0 (0.0) | 0 (0.0) | 9 (6.1) |
| AOD-Air Pollution | |||||
| NO2 | 7.4 | 10.4 | . | 10.4 | . |
| O3 | 89.2 | 89.2 | . | 89.2 | . |
| PM1 | 27.8 | 27.8 | 27.8 | . | . |
| PM1-2.5 | 16.6 | 16.6 | . | 16.6 | . |
| PM2.5 | 23.6 | 25.6 | . | 23.5 | 34.0 |
| PM2.5-10 | . | 51.7 | . | 51.7 | . |
| PM10 | 30.1 | 48.7 | . | 48.7 | . |
1Abbreviations: aerosol optical depth value, AODVAL; medical diagnosis (Dx); forced expiratory flow 25% (FEF25%); forced expiratory flow at 25% to 75% of forced vital capacity (FEF25%-75%); forced expiratory flow at 50% of forced vital capacity (FEF50%); forced expiratory flow at 75% of forced vital capacity (FEF75%); fractional exhaled nitric oxide (FeNO); forced expiratory volume in one second (FEV1); forced vital capacity (FVC); forced expiratory volume in one second to forced vital capacity (FEV1/FVC). Significance evaluated with the Chi-Square test, p: a, ≤0.05; b, ≤0.01; c, >0.05; bold superscript identifies the use of exact estimate; d, significance not evaluated. First superscript is for the studies column, the second is for the specific outcomes column, and the third is for the three levels of the ecologic setting independent variable. 2The studies column includes totals (percentages) for the 61 unique publications. Entries in other columns are also totals (percentages). 3Specific outcomes are represented by the dependent measures identified in the first column. .
Table 3.
Association Between Selected Variables, Risk Factors, and Physiologic Mechanisms of Immune, Inflammation, and Oxidative Stress with the Significant Outcome Group.
Table 3.
Association Between Selected Variables, Risk Factors, and Physiologic Mechanisms of Immune, Inflammation, and Oxidative Stress with the Significant Outcome Group.
| Variables | SIGNIFICANT OUTCOME GROUP1 | COMMENTS | ||
| NS | SL | SH | ||
| Respiration Groupc | Respiration group was not significant. | |||
| Asthma | 39 (19.7) | 18 (9.1) | 67 (33.8) | |
| Other Respiration | 31 (15.7) | 9 (4.6) | 34 (17.2) | |
| Ecologic Settingb | Ecologic setting was significant, with more greenness specific outcomes (n=18) in the SL group. | |||
| Greenness | 15 (7.6) | 18 (9.1) | 8 (4.0) | |
| Air Pollution | 45 (22.7) | 8 (4.0) | 72 (36.4) | |
| Wildfire | 10 (5.1) | 1 (0.5) | 21 (10.6) | |
| Publication Yearc | Publication year was not significant. | |||
| 2009-2016 | 12 (6.1) | 2 (1.0) | 17 (8.6) | |
| 2017-2023 | 58 (29.3) | 25 (12.6) | 84 (42.2) | |
| Countryb | Country was significant. Studies completed in Italy and in the United States had the highest number of SL specific outcomes, 21 (10.6%) each; this total was higher than the total for other countries. In descending order of total specific outcomes, the United States (n=33, 16.7%) had the most, Italy (n=19, 9.6%) was second, and China (n=16, 8.1%) third. | |||
| 2+ Countries | 3 (1.5) | 0 (0.0) | 2 (1.0) | |
| Australia | 5 (2.5) | 0 (0.0) | 7 (3.5) | |
| Canada | 7 (3.5) | 2 (1.0) | 7 (3.5) | |
| China | 8 (4.0) | 5 (2.5) | 16 (8.1) | |
| Indonesia | 0 (0.0) | 0 (0.0) | 2 (1.0) | |
| Italy | 21 (10.6) | 9 (4.6) | 19 (9.6) | |
| Lithuania | 0 (0.0) | 0 (0.0) | 1 (0.5) | |
| Mexico | 0 (0.0) | 0 (0.0) | 4 (2.0) | |
| Norway | 1 (0.5) | 1 (0.5) | 0 (0.0) | |
| Peru | 0 (0.0) | 0 (0.0) | 2 (1.0) | |
| Spain | 4 (2.0) | 1 (0.5) | 1 (0.5) | |
| Tiwan | 0 (0.0) | 0 (0.0) | 2 (1.0) | |
| United States | 21 (10.6) | 9 (4.6) | 33 (16.7) | |
| PM25GRP3b | PM25GP3 was significant, with 15 specific outcomes in the higher category of both predictors. | |||
| Lower | 13 (17.6) | 5 (6.8) | 27 (36.5) | |
| Within | 0 (0.0) | 0 (0.0) | 5 (6.8) | |
| Higher | 5 (6.8) | 4 (5.4) | 15 (20.3) | |
| Ageb | Age (yes) risk factor was significant, with most (n=22) in the SH group. | |||
| No | 67 (33.8) | 22 (11.1) | 79 (39.9) | |
| Yes | 3 (1.5) | 5 (2.5) | 22 (11.1) | |
| Education/Incomec | Education/income risk factor was not significant. | |||
| No | 70 (35.4) | 26 (13.1) | 98 (49.5) | |
| Yes | 0 (0.0) | 1 (0.5) | 3 (1.5) | |
| Ethnicity/Racea | Ethnicity/race (yes) risk factor was significant. | |||
| No | 68 (34.3) | 25 (12.6) | 95 (48.0) | |
| Yes | 2 (1.0) | 2 (1.0) | 6 (3.0) | |
| Environmentalb | Environmental risk factor was significant, with 98 specific outcomes in the SH group. | |||
| No | 58 (29.3) | 3 (1.5) | 3 (1.5) | |
| Yes | 12 (6.1) | 24 (12.1) | 98 (49.5) | |
| Genderb | Gender risk factor was significant, with 22 specific outcomes in the SH group. | |||
| No | 68 (34.3) | 22 (11.1) | 79 (39.9) | |
| Yes | 2 (1.0) | 5 (2.5) | 22 (11.1) | |
| Geographica | Geographic risk factor was significant, with 11 specific outcomes in the SH group. | |||
| No | 69 (34.8) | 23 (11.6) | 90 (45.4) | |
| Yes | 1 (0.5) | 4 (2.0) | 11 (5.6) | |
| Psychologicb | Psychologic risk factor was significant, with 5 specific outcomes in the SH group. | |||
| No | 70 (35.4) | 23 (11.6) | 96 (48.5) | |
| Yes | 0 (0.0) | 4 (2.0) | 5 (2.5) | |
| Otherb | Other risk factor was significant, with 14 specific outcomes in the SH group. | |||
| No | 67 (33.8) | 20 (10.1) | 87 (43.9) | |
| Yes | 3 (1.5) | 7 (3.5) | 14 (7.1) | |
| Single Mechanismsb | Single physiologic mechanisms variable was significant, with more IN and OT mentions in the SH group, and more IM and OS mentions in the SL group. | |||
| IM | 6 (5.4) | 2 (1.8) | 1 (0.9) | |
| IN | 6 (5.4) | 0 (0.0) | 18 (16.4) | |
| OS | 2 (1.8) | 3 (2.7) | 2 (1.8) | |
| OT | 28 (25.4) | 9 (8.2) | 33 (30.0) | |
| Multiple Mechanismsb | Multiple physiologic mechanisms variable was also significant, with most mentions in the SH group. | |||
| IMIN | 6 (6.8) | 5 (5.7) | 13 (14.8) | |
| INOS | 6 (6.8) | 3 (3.4) | 8 (9.1) | |
| IMINOS | 16 (18.2) | 5 (5.7) | 26 (29.6) | |
1Each outcome includes totals (percentages). AOD-PM2.5 95% CI significant outcome categories for PM25GRP3: <95% CI lower limit, lower; ≥95% CI lower limit and ≤95% CI upper limit, within; >95% CI upper limit, higher. Significance was evaluated with the Chi-Square test, p: a, ≤0.05; b, ≤0.01; bold superscript identifies the use of the exact estimate; c, >0.05.
Table 4.
Analysis of Risk Factors by Health Outcome, Ecologic Setting, and the Health Outcome by Ecologic Setting Interaction.
Table 4.
Analysis of Risk Factors by Health Outcome, Ecologic Setting, and the Health Outcome by Ecologic Setting Interaction.
| Risk factors1 | Health outcome | Ecologic setting | Health outcome by Ecologic setting interaction | ||||||||
| Asthma | Respiration | Greenness | Air Pollution | Wildfire | Asthma- Greenness | Asthma- Air Pollution |
Asthma- Wildfire | Respiration-Greenness | Respiration- Air Pollution |
Respiration-Wildfire | |
| Ageb,b,a | 0.38a | 0.19a | 0.06a | 0.08b | 0.72ab | 0.13a | 0.08b | 0.94ab | 0.00c | 0.08d | 0.50bcd |
| Education/ Incomec,c,c |
0.03 | 0.00 | 0.02 | 0.03 | 0.00 | 0.03 | 0.07 | 0.00 | 0.00 | 0.00 | 0.00 |
| Ethnicity/Racec,c,c | 0.09 | 0.03 | 0.03 | 0.03 | 0.12 | 0.06 | 0.04 | 0.17 | 0.00 | 0.02 | 0.07 |
| Environmentala,c,c | 1.06a | 0.65a | 0.75 | 0.94 | 0.88 | 1.00 | 1.05 | 1.11 | 0.50 | 0.82 | 0.64 |
| Genderc,b,c | 0.33 | 0.22 | 0.06a | 0.10b | 0.68ab | 0.13a | 0.09b | 0.78abc | 0.00cd | 0.10ce | 0.57abde |
| Geographicc,c,c | 0.08 | 0.09 | 0.10 | 0.07 | 0.10 | 0.10 | 0.09 | 0.06 | 0.10 | 0.04 | 0.14 |
| Psychologicc,c,c | 0.07 | 0.01 | 0.10 | 0.03 | 0.00 | 0.19a | 0.03a | 0.00 | 0.00 | 0.04 | 0.00 |
| Othera,a,b | 0.19a | 0.04a | 0.24a | 0.11 | 0.00a | 0.48a | 0.09a | 0.00a | 0.00a | 0.12a | 0.00a |
| Totalb,b,c | 2.24a | 1.25a | 1.36a | 1.38b | 2.49ab | 2.13 | 1.55a | 3.06ab | 0.60b | 1.22b | 1.93 |
1Risk factor means by health outcome, ecologic setting, and the interaction between health outcome by ecologic setting. Significance of risk factors: the first superscript is for health outcome, the second is for ecologic setting, and third is for the interaction. Significant outcomes, p: a, p≤0.05; b, p≤0.01, c, p>0.05. The same superscript between two treatment means indicates that the means are significantly different from each other, only when the main effect was also significant with p≤0.05.
Table 5.
Analysis of Individual and Total Physiologic Mechanism Means by Health Outcome, Ecologic Setting, and the Interaction of Health Outcome by Ecologic Setting.
Table 5.
Analysis of Individual and Total Physiologic Mechanism Means by Health Outcome, Ecologic Setting, and the Interaction of Health Outcome by Ecologic Setting.
| PHYSIOLOGIC MECHANISMS1 | Health outcome | Ecologic setting | Health outcome by Ecologic setting interaction | ||||||||
| Asthma | Respiration | Greenness | Air Pollution | Wildfire | Asthma-Greenness | Asthma-Air Pollution | Asthma-Wildfire | Respiration-Greenness | Respiration-Air Pollution | Respiration-Wildfire | |
| Individualc,b c | 1.46 | 1.72 | 1.43a | 1.85a | 1.50 | 1.36a | 1.76 | 1.28b | 1.50 | 1.94ab | 1.71 |
| Totalc,a,c | 1.79 | 2.22 | 1.85 | 2.37 | 1.79 | 1.71 | 2.21 | 1.44a | 2.00 | 2.52a | 2.14 |
1Individual and total physiologic mechanism means analyzed with analysis of variance (SAS Proc GLM) for the main effects of health outcome, ecologic setting, and the interaction between health outcome by ecologic setting. Significance of physiologic mechanisms main effects: first subscript is for health outcome, the second is for ecologic setting, and the third is for the health outcome by ecologic setting interaction. Significance, p: a, p≤0.05; b, p≤0.01; c, p>0.05. For the six interaction term means, the same superscript letter between two means indicates that the means are significantly different from each other with p≤0.05, only when the main effect was significant.
Disclaimer/Publisher’s Note: The statements, opinions and data contained in all publications are solely those of the individual author(s) and contributor(s) and not of MDPI and/or the editor(s). MDPI and/or the editor(s) disclaim responsibility for any injury to people or property resulting from any ideas, methods, instructions or products referred to in the content. |
© 2024 by the authors. Licensee MDPI, Basel, Switzerland. This article is an open access article distributed under the terms and conditions of the Creative Commons Attribution (CC BY) license (http://creativecommons.org/licenses/by/4.0/).
Copyright: This open access article is published under a Creative Commons CC BY 4.0 license, which permit the free download, distribution, and reuse, provided that the author and preprint are cited in any reuse.


