
Submitted:
09 October 2024
Posted:
10 October 2024
You are already at the latest version
Abstract
Green Infrastructure (GI) is increasingly prioritised in landscape policy and planning, due to its potential to benefit ecosystems and enhance wildlife conservation. However, due to the uneven distribution of protected areas (PAs) and the fragmentation of habitats more generally, multi-level policy strategies are needed to create an integrated GI network bridging national, regional and local scales. To help address this challenge, we present proposals to integrate GI elements for the province of Almeria, southeast Spain. We delimit and define key GI elements, and apply GIS-based connectivity tools to generate ecological corridors connecting the province’s 35 PAs. Currently, the PAs are threatened by the advance of intensive greenhouse agriculture and tourism-related urban growth of the municipalities to which they belong. Common patterns in the location of the most suitable areas for the development of GI can be identified. New GI networks would be located along the coast, specifically in the western part of the study area. They would also occupy the valleys of the main rivers of the province. Around 50% of the area occupied by the proposed corridors would be located in places of medium and high suitability for the movement of species between core areas.
Keywords:
Green Infrastructure
; GIS
; multi-criteria assessment
; ecological connectivity
; Almeria
; Spain
1. Introduction
In recent decades, climate change (CC) has emerged as one of the greatest challenges to humanity and the environment [1,2]. Apart from well-documented impacts on land use and human activities generally [3,4], CC and climate variability have negatively impacted protected areas (PAs) [5,6]. Because PAs play a fundamental role in biodiversity conservation and ecosystems conservation, they have become an important focus of current environmental strategies and policies [7,8,9].
Spain was an international pioneer in biodiversity conservation legislation adopting the National Parks Law in 1916 [10]. This first law was an important step forward [11], although, in line with the ideas of the day, it focused on nature protection from a landscape perspective, seeking to preserve an idealised vision of pristine nature in isolated areas, from which traditional rural activities and ordinary people were excluded [12,13].
After the constitution of the Institute for the Conservation of Nature (ICONA) in 1971, the Spanish State passed Law 15/1975 on Protected Natural Spaces, which recovered the prominence lost in the 1957 Law on Forestry [11]. The new law made some clear steps forward. Along with the interest in conserving spaces for their scenic beauty, its motivation was to contribute to nature conservation by granting special protection regimes to areas that required it due to the singularity and interest in their natural values. However, it was not until the early 1990s that there was a real increase in policies that prioritised environmental conservation, an occurrence that was at least partly due to the 2nd United Nations Earth Summit in Rio de Janeiro in 1992 [14].
Within this framework, the European Union began to design policies focused on the protection and planning of two elements: landscape and biodiversity [15]. In 1992, it launched an ambitious bid called the Natura 2000 Network [16,17], to ensure the long-term persistence of Europe's most valuable and threatened species and habitats, listed in both the Birds Directive (79/409/EEC, amended as 2009/147/EC) and the Habitats Directive (92/43/EEC). In 2000, it launched the European Landscape Convention [18].
In Spain, following the transfer of powers to the Autonomous Communities (self-governing regions), new environmental planning and management instruments were promoted, such as Law 4/1989 of 27 March 1989 on the Conservation of Natural Spaces and Wild Flora and Fauna. This Act established the Natural Resources Management Plans (PORN), the Master Plans for Use and Management (PRUG) and the National Parks Master Plan (Modification of Act 41/1997). These regulatory figures incorporate a more technical planning perspective [11,19].
Andalusia was one of the first Spanish regions to develop specific planning instruments for natural areas protection. At the end of the 1980s, it had adopted the Physical Environment Protection Plans (PEPMF) and the Law 2/1989 Inventory of Protected Natural Spaces of Andalusia (1989), which declared 60 new spaces occupying 17% of Andalusian territory. Later, in 1994, it approved almost all the PORN and PRUG of its natural parks. In 1997 it declared the Network of Protected Natural Areas of Andalusia, RENPA [20]. This is defined as a set of high-value protected areas characterised by the conservation and regeneration of their natural resources, sustainable development and their compatibility with the environment [21]. Since its creation, it has increased its surface area to such an extent that it is now considered one of the most important regional networks of PAs in terms of number and surface area in the European Union. It currently contains 249 PAs1 that occupy 33% of the Andalusian territory [22].
In summary, these new regulations and instruments have evolved beyond the conservation of isolated spaces to advocate a more holistic and integrated vision. Under this new paradigm, PAs are key to maintaining and enhancing the ecological structure of the territory. This vision builds on concepts and approaches that have emerged since the late 1990s such as landscape ecology [23], ecosystem services [24], ecological corridors [25] or green infrastructure, GI [26]. GI, which is the focus of this piece, can be defined as an interconnected network of green spaces that conserves natural values and ecosystem functions by providing associated benefits to human populations [27].
In the field of EU environmental planning, GI has gained prominence following the adoption of the Communication on Green Infrastructure: enhancing Europe's Natural Capital [28]. In it, member states are urged to develop their own GI strategies. In Spain, these EU policy provisions are reflected in the National Strategy for Green Infrastructure and Ecological Connectivity and Restoration, the strategic planning document that regulates the implementation and development of green infrastructure in Spain [29].
At the same time several studies have highlighted the relevance of Geographical Information Systems (GIS) in making proposals for green infrastructures in the territory [30,31]. Among others, Aguilera et al. [32] and Velázquez & Rodríguez [33], combined GIS and multi-criteria evaluation (MCE) techniques that allow the integration of different landscape attributes and policy options. Gallardo & Martínez-Vega [34] and Mironova [35], have delimited green infrastructure with GIS through analyses of spatial fragmentation. Caparrós et al. [36] delimited GI using cluster analysis based on a series of previously defined indicators. In addition to these works, there are methodologies and guides with different purposes, e.g. (i) to establish the scientific-technical bases for the definition and delimitation of a Spanish green infrastructure strategy [37] and the planning of regional networks of ecological corridors [38], or (ii) for the identification of the elements that a green infrastructure should contain [29].
In the province of Almería, object of this study, the RENPA network comprises 35 different PAs with different levels of protection according to the IUCN [39]. There are different degrees of stringency (nature reserve, category I or national park, category II), as well as protected areas with multiple-uses (category IV, natural parks or category VI, Natura 2000 Network areas). In addition to these 35 formally registered PAs, the province is home to a diverse range of complementary natural, semi-natural and agricultural habitats [34,40,41]. We hypothesise that, in the absence of protection, the latter could be seriously threatened in the future.
The main objective of this study is to design, using GIS tools, an integrated green infrastructure network for the province of Almería that connects the PAs belonging to the RENPA scheme, considering semi-natural and agricultural habitats and linear corridors (watercourses and livestock trails). To achieve this general objective, we set out the following specific objectives:
- Design a methodology to facilitate the delimitation of GI.
- Identify and map the current PAs which, due to their characteristics and high ecological values, will be integrated as a priority into existing GI.
- Locate and assess those areas, currently unprotected, which could be added to the existing GI resource, due to their characteristics and values.
- Assess the current connectivity between the different PAs of the RENPA and determine the barriers that may hinder or interrupt the flow of species.
- Assess the possible repercussions of GI on territorial planning.
2. Materials and Methods
2.1. Study Area
We chose the province of Almeria as our case study, on account of the clear and growing threats to the integrity of its natural areas and the urgent need to effectively connect disparate elements of the RENPA scheme. Located in the southeast of the Iberian Peninsula, Almeria is one of the eight Spanish provinces that form part of the region of Andalusia. It has an area of 8,774 km² and is located between the provinces of Granada to the west, Murcia to the east and the Mediterranean Sea to the south (Figure 1). Geographically it is very diverse. The high Betic and Penibetic mountain ranges (>2,600 masl) alternate with the Mediterranean coastal plains. The mountain ranges act as a barrier to the humid westerly winds from the Atlantic. It is therefore considered the driest area in Europe with an average annual rainfall of 300 mm [42]. However, the climate of the region is currently transitioning from the continental hemiboreal Mediterranean climate of Sierra Nevada (Dsb, according to the Köppen-Geiger climate classification) and the Mediterranean climates with dry and mild summers (Csb) and with dry and hot summers (Csa), in the Betic Cordilleras, to the semi-arid (Bsk and Bsh) and arid (Bwh and Bwk) climates, typical of the southeast of Almeria.
The province has undergone a profound evolution in recent decades, especially linked to the growth of greenhouses and the proliferation of mass tourism in the coastal area. The lack of other more profitable options to compete with intensive irrigation and the increased interest in the Almeria coast tourism brand meant that land use planning was unable to halt the increase in the area covered by greenhouses [43] and the growth of tourist developments in the province [44,45]. The commitment to this productive binomial has generated numerous territorial tensions to satisfy the demand for these land uses. These pressures take on greater importance in a province that contains 13.86% of the surface area of the entire RENPA and whose PAs occupy 45.81% of the provincial surface area. The magnitude of biodiversity in the province is evidenced by the presence of more than 2,800 taxa of endemic flora and the existence of Habitats of Community Interest (HCIs) in more than 2,900 km2 of its territory [46].
2.2. Temporal dimension
We used 1984 (t1) as the initial reference year and 2007 (t2) as the final year, taking advantage of the fact that the cartographic service of Andalusia has available, at a scale of 1:25,000, its own land use map series, the land use and vegetation cover map of Andalusia (MUCVA, by its Spanish acronym). The end date of the period analysed is important for assessing the connectivity of the PAs and the GI because it is a time of high spatial fragmentation. Land planners were unable to effectively govern the land demands of the main economic activities (intensive agriculture under plastic and tourist activity) that experienced a strong expansion during that period [44].
2.3. Data and Methods
Figure 2 shows the data and sources used to develop our methodological proposal. We chose to work at a scale of 1:25,000 due to the availability of the MUCVA land use and vegetation cover mapping at this scale. Data preprocessing was undertaken in TerrSet 2020 software, which necessitated transformation of the vector data to raster format with a pixel size of 25 metres, coinciding with the spatial resolution of the Digital Elevation Model (DEM). We established three distinct phases in the methodology to identify both the network and the ecological corridors.
2.3.1. Green Infrastructure Components and Approach
The starting point for the development of new Green Infrastructure is the identification of coherent functional areas of priority importance for biodiversity conservation [47]. In this sense, a wide variety of elements can be included within a GI, from PAs to parks, gardens and other green areas in urban environments. Taking into account the provincial scale of our analysis, and based on the selection made by Valladares, et al. [37], we considered the following components:
- Core areas: the conservation of fauna and flora is a priority in these areas due to their level of governmental protection. Core areas include the PAs themselves, HCIs and other ecosystems of high ecological value (wetlands, gallery forests, forest areas, coastal plains, etc.).
- Ecological corridors: These seek to maintain the interconnection between core areas through links that guarantee the conditions for the movement and development of species. Linear corridors include rivers, gallery forests and livestock trails.
- Buffers areas: we define these as areas of influence of 5 km around the core areas. We consider them as transition areas to safeguard the ecological network. They allow land uses compatible with biodiversity conservation.
- Other multifunctional elements: mainly composed of agricultural land that is managed sustainably.
We used the Morphological Spatial Pattern Analysis (MSPA) approach incorporated within the free Guidos ToolBox (GTB) application [48] to locate ecological corridors. This approach is frequently used in disciplines such as Landscape Ecology [49], Climate Change [50], Hydrological Modelling [51,52], Biology [53], among others. We follow the methodology adopted by Wickham et al. [54] to detect and assess green infrastructure fragmentation. GTB requires an input raster with two classes of data: ''background'' (class 1) and ''foreground'' (class 2). When running MSPA, we divide the ''foreground'' area into seven classes: Core (i), Islets (ii), Perforations (iii), Edges (iv), Loops (v), Bridges (vi) and Branches (vii). The background zone is divided into Background (viii), CoreOpen (ix) and BorderOpen (x). In this phase of the study, we focused on the ''Bridge'' category to detect ecological corridors; taking as reference linear corridors such as rivers and cattle trails, we located those that interconnect two core areas, determining class 1 as the background and class 2 (foreground) as the set of rivers and cattle trails in our area.
For the delineation of green infrastructure, we used Multi-Criteria Evaluation, MCE [55], a well-known decision support method consisting of a set of processes and statistical analysis tools. Its objective is to define and evaluate alternatives that solve the proposed problem. In our study, we adopt what Gómez & Barredo [56] have referred to as the normative or prescriptive orientation, as opposed to the positive or descriptive approach. We selected the factors that favour the presence of GI based on a combination of ''intuitively justifiable assumptions'' [57] and comparison with case studies in similar Mediterranean areas [58,59]. After defining the predominant approach, we constructed the assessment criteria and divided them into factors and constraints.
2.3.1.1. Criteria and Factor Configuration
Criteria and factors determine the "implementation capacity" [56] of a specific variable compared to the pre-established objective. First, we adopted Saaty's Analytic Hierarchy Process (AHP), which helps solve a decision problem by decomposing it into a hierarchy that captures its essential elements [60]. Secondly, we defined the key factors relevant (Figure 3) to the development of green infrastructure and ecological connectivity taking into account biophysical, socio-economic and social criteria.
2.3.1.1.1. Biophysical Criteria:
- Slopes (S) and Aspects (A): gentle slopes and north- and west-facing sites tend to have lower exposure to direct sunlight, which affects soil stability and reduces the likelihood of landslides.
- Proximity to forest areas (PFA): forest environments are suitable for GI, among other reasons, because of the ecosystem services they provide, they are less fragmented and because of the biological diversity they harbour.
2.3.1.1.2. Social criteria:
- Road safety (RS): the passage of wildlife crossing roads severely compromises their safety in their movements between core areas. For this reason, we give greater priority to those infrastructures that support lower traffic densities and, therefore, entail less risk of accidents for the species.
- Habitats of Community Interest (HCIs) and proximity to Linear Corridors (PLC): HCIs, rivers and livestock trails are fundamental elements in the GI as links between core areas, so we prioritise proximity to these areas.
2.3.1.1.3. Economic criteria:
- Accessibility from urban areas (AUA): the very definition of GI advocates that it should be accessible for the cultural enjoyment of the surrounding population. However, we consider that the proximity of densely populated urban centres may interfere with its protection. For this reason, we promote proximity to small population centres.
- Land use and land cover fragmentation (LULCF): less fragmented territories are more likely to form stable ecosystems that facilitate wildlife conservation. Therefore, we prioritise those land use-land cover (LULC) changes that contribute positively to the expansion of GI in our territory. First, we apply the reclassification of the MUCVA 1:25000 scale map series developed by the DUSPANAC project [61,62] to two maps from different time periods, 1984 and 2007. Secondly, we used this reclassification to prepare a fragmentation map following the cross-tabulation methodology (Figure 4) presented by Rodríguez-Rodríguez et al. [63]. From highest to lowest priority, we established four categories: non-fragmented categories, with positive impact for GI (positive); fragmented natural or semi-natural categories (fragmented positive), categories with neutral impact (neutral) and categories with negative impact (negative).
Then, in a GIS environment, we applied a series of standard GIS analysis and processing operations to the source data to create and standardise the factors. In addition, we performed a correlation analysis between the factors to determine whether any were highly dependent on others.
We then assigned weights to each factor using the AHP method [60]. This involved distributing the relative importance of the components of each hierarchy using the pairwise comparison method, adding the weights to the hierarchy levels and applying the ordered weighted averaging (OWA) method [64] from the TerrSet software to make the green infrastructure land suitability map (Table 1).
2.3.1.2. Configuration of Restrictions
Next, we drew up a map of restrictions, considering those land covers that are not suitable for inclusion in green infrastructure. The map of restrictions included urban and industrial centres, roads and railway lines, greenhouses, solar plants and wind farms. We draw a buffer of 500 metres around the polygons of these last two classes.
2.3.2. Ecological Connectivity Assessment
Well-structured ecological networks that ensure connectivity between PAs must be carefully planned [32,65,66,67]. This is necessary for the identification of critical areas between them and other territorial elements such as road infrastructures and urban centres, which can compromise the survival of species transiting between core areas.
To assess the ecological connectivity between the PAs of the province of Almería, we used the Linkage Mapper tool of Arcmap 10.8.1 (ESRI Inc.), tested in previous studies [68,69,70]. Linkage Mapper requires a vector layer of the core areas of the habitats to be analysed and a resistance map to detect and draw connections between these areas of interest. It identifies core areas that are contiguous with each other and generates maps of routes with lower obstacles between these areas [71].
We applied the Linkage Pathways function to generate a map of connections between the core areas of the territory. The algorithm indicates which are the least-cost distances between two nodes, cell by cell. Thus, we were able to know the approximate value of connectivity that each pixel would have and identify which corridors favour movement between the core areas. The map of connection corridors generated in this way was then overlain onto the reclassified suitability map. This last step enabled us to calculate the surface area in each suitability class (constraint, none, low, medium, high) intersected by the connection corridors.
2.3.3. Assessment of the Impact of Land Use-Land Cover Changes on Green Infrastructure
3. Results
3.1. Analysis of Changes Over Time
Between 1984 and 2007, LULC changes in the province of Almería were driven by the expansion of intensive agriculture and urban growth (Table 2). The area devoted to greenhouses under plastic grew substantially (+58.39%), due to their high profitability, which led to a loss of natural areas such as scrubland (-4.57%).
The rise in greenhouse cultivation not only altered the province's landscape. It also influenced the availability of water resources, the demand for which increased substantially. On the other hand, woody crops, such as olive groves and vineyards, expanded both under irrigated (+89.28%) and non-irrigated (+98.10%) cultivation, following Spain's entry into the EU and the implementation of the Common Agricultural Policy (CAP).
During this period, protection and conservation policies also left their mark on the landscape. Reafforestation of pine forests was carried out in the Sierra Nevada Natural Park and other PAs in the province (+64.10%), as a measure to mitigate the loss of forest mass. This contributed to slowing down agricultural expansion in certain areas, favouring the recovery of natural spaces and, consequently, local biodiversity.
Urban growth (+63.84%) was another crucial factor in the transformation of the territory. Since the 1980s, with the development of tourism, the growth of industrial land (+209.67%) and the improvement and expansion of infrastructures (+134.86%), many areas of the province, especially along the coastal strip, experienced a notable increase in urban development, especially housing. This urban growth remained constant well into the new century, transforming land uses and fragmenting the landscape of coastal municipalities. The expansion of infrastructures and new real estate developments was directly proportional to the increase in population, generating a notable impact on both the landscape and natural areas.
However, the annual growth of surface area dedicated to greenhouse crops slowed in 2007 as a consequence of the economic crisis. The same was true for the supply of hotel beds (Table 3). Despite this change, these two activities continue to be the main drivers of the provincial economy.
3.2. Analysis of the Multi-Criteria Evaluation Factors
The correlation coefficients (r) between the selected factors showed very low correlations (Table 4). Only accessibility from urban areas (aUA) and proximity to forest areas (pFA) have a moderately high correlation (>0.5). This is perhaps due to the growing preference for new secondary residential developments in or around forest areas. The latter attract the former because of their scenic landscape quality, air quality and ecosystem services [75,76]. Similarly, PAs attract new urban areas to their surroundings [77].
Analysis of the MCE model biophysical criteria shows firstly that slopes of less than 5% occupy almost 41% of the total surface area of Almería, demonstrating the flat nature of the province. The plains are located in the coastal areas and the basins of the rivers Antas, Almanzora and Adra. Secondly, the most suitable orientations for the GI (north and west) occupy 1,721 km2, almost 20% of the provincial surface. Due to their low elevation and lower exposure to sunlight, these areas facilitate the movement of species between core areas. However, at the same time, these are areas with strong anthropogenic disturbances. Thirdly, the most natural LULCs occupy 6% of the study area, while artificial LULCs occupy just over 15% of the total. Natural vegetation has been limited by the growth of artificial soil on flat and fertile land, related to the expansion of intensive agricultural areas and tourism and urban development.
Turning to the social criteria in the MCE model, the greatest danger linked to road safety occurs in areas close to motorways and railway lines. About the presence of HCIs, 51% of the provincial surface contains areas classified as suitable for natural habitats. Those with the highest level of suitability, considered to be of priority interest, occupy around 17%. Finally, the areas located less than 100 metres from the corridors account for only 7.93% of our study area.
For the economic criteria, the most natural categories are those that remain unchanged in the analysis of LULC changes and fragmentation and therefore have the highest suitability. The second highest level of suitability is obtained by categories whose change over the period favours the development of GI. These are the LULC changes that we call ''Abandonment of activity'', ''Abandonment of irrigated crops'', ''Abandonment of rainfed crops'', ''Exchange between tree species'', ''Exchange between wetlands'' and ''Forest restoration''. Finally, since proximity to small population centres is considered positive, since it enables public access to green space, areas located close to roads have higher suitability than those further away.
3.3. Analysis of the constraints
Figure 5 shows the spatial distribution of the areas that we consider unsuitable to support the province's GI. On the central coast, the urbanised area of the provincial capital and its port, in the centre of the Gulf of Almeria, stands out. On both sides, the large areas occupied by the vast greenhouses of Adra and El Ejido, to the west, and Nijar and Campohermoso, to the east, stand out. Inland, another gap stands out, corresponding to the large marble quarries of Macael. Finally, on the north-east coast, the large developments of second homes and golf courses in Vera, Mar de Pulpí and San Juan de los Terreros are not conducive to the implementation of GI either.
3.4. Land Suitability for Green Infrastructure
Figure 6 shows those areas that are highly suitable for integration into the GI proposal. They occupy 6.89% of the provincial surface. These mainly extend along the Almanzora and Adra river basin, and in the surroundings of the Sierra Nevada Natural Park, the Desierto de Tabernas Natural Park and the Special Area of Conservation (SAC) Calares de Sierra de los Filabres.
The rest of the provincial surface area belongs to the suitability categories "Medium" (36.04%), "Low" (49.43%), "Constraint" (6.19%) and "Null" (1.45%).
3.5. Definition of ecological corridors
We generated a total of 45 ecological corridors. Out of these, we selected the 15 longest corridors or the overlay analysis (Figure 7). It is true that the distribution of the southern PAs, from west to east, from the Sierra Nevada National Park (no. 34 in Figure 1) to the Sierra de Cabrera-Bédar SAC (no. 28), already comprises an ecological network connecting the core areas.
Among the main features of the proposed GI in the eastern half of the province, we highlight the connection of the Natural Parks of Sierra María-Los Vélez (no. 32 in Figure 1) and Sabina Albar (no. 25) with the SACs of the Sierra del Alto de Almagro (no. 30), Sierra de Almagrera, Los Pinos and El Aguilán (no. 35), and Sierra de Cabrera-Bédar (no. 28). Also, the four new corridors that would communicate, to the west, the Calares de la Sierra de los Filabres SAC (no. 5) with the Natural Monuments of Piedra Lobera (no. 18), Encina de la Peana (no. 10) and Encina del Marchal (no. 11), and the other areas mentioned above. Another transversal corridor follows the river Almanzora, from west to east, linking the Calares de la Sierra de los Filabres SAC (no. 5) with the Sierra del Alto Almagro SAC (no. 30).
The map of landscape suitability also highlights the isolation of some PAs, such as the Albufera de Adra Nature Reserve (no. 1), the Site of Community Importance (SCI) of Artos de El Ejido (no. 3) or the Punta Entinas Sabinar Natural Site (no. 19) and its homonymous Nature Reserve (NR) (no. 20). The situation of the latter two protected areas, surrounded and nestled between the coastline and the ''plastic sea'' [78], makes their connectivity with the rest of the PAs impossible. This is of course most serious in the case of the NR which enjoys the highest degree of protection available under national law, on account of its well preserved dune systems and salt marsh ecosystems.
Results of the intersection between ecological corridors generated by the connectivity analysis and the suitability map (Table 5, Figure 8) show that suitability for GI is acceptable in most cases. In 11 out of 15 ecological corridors, >10% of the surface area was classed as having “High” suitability (Table 5, Figure 8), with 7 of these exceeding >20% surface area of “High” suitability. In 13 out of 15 ecological corridors >40% of the surface area was classed as having “High” or “Medium” suitability (Figure 8), and in 8 of these >50% of the surface area was classed as having “High” or “Medium” suitability (Figure 8). On the other hand, in 7 of the 15 ecological corridors analysed >50% of the surface area was classed as having “Null” or “Low” suitability (Figure 8). This suggests that closer examination of some of the proposed corridors is needed to try to reduce the area of fragmented or degraded lands in the proposed GI network.
3.6. Protected areas connectivity assessment
Table 6 shows the evolution over time (1984-2007) of the different categories of landscape fragmentation in each area analysed, whether they are PAs, their surroundings, or candidate areas for GI. There are notable differences between the different zones according to their protection stringency. The National Park and the Nature Reserve have very low fragmentation values, as a result of the strict limitations on land use within these areas. . In the National Park, the Habitat Fragmentation Index (HFI) score has actually increased, as a result of the reforestation programme initiated in the Nacimiento river basin in the early 1970s, as well as its subsequent designation as a ''National Park'' in 1999 [79].
At least on the basis of these quantitative landscape indices the Natural Parks and Natural Sites have undergone few changes. However, areas of ecological value have disappeared due to the construction and development of new infrastructures and urban areas. These include the construction of the A-7 motorway through the Karst in Yesos de Sorbas, and the A-92 through the Sierra Nevada and the Tabernas Desert.
The candidate areas for GI had an HFI index of 1.79 in 1984, which increased to 1.82 in 2007. The improvement is due to the tendency for candidate areas to be located in forest areas restored after 1984, which have become less fragmented over time as a result. However, the GI candidate areas also include agricultural and semi-natural areas that are much more dynamic, and suffer more frequently from fragmentation and changes to their character, considerably reducing their HFI value.
The areas of greatest concern are to be found in and around the Natura 2000 Network. SPAs and SCIs are the most fragmented. The lack of an effective management plan in these enclaves causes an increase in the number of perforations. These openings in the core areas are related to the pressure exerted by greenhouses in their surroundings, even expanding into the interior of the SACs of the Ramblas de Gérgal, Tabernas and the south of the Sierra de Alhamilla, according to the 2007 MUCVA. The impact of the new communication routes in these areas is also perceptible, as mentioned above.
Finally, the buffer zones show the highest degree of fragmentation (HFI of 1.72). Fragmentation has even increased between the two dates analysed in the PA buffer zones located near the coast of Almeria, which has seen the largest share of the physical and economic transformation of the province in recent decades.
Despite the great richness of the natural heritage of the province of Almería, there are still unprotected areas with species whose conservation is crucial if a high degree of diversity is to be maintained, according to Mendoza-Fernández et al. [80]. These authors propose a network of micro-reserves, complementary to the RENPA PAs, which would help to protect the areas of highest botanical value.
4. Discussion
Previous research has shown that the most significant LULC changes in the province of Almería since 1984 were directly related to the impacts of tourism and intensive agriculture. After the appearance of the first greenhouses at the end of the 1960s, the IRYDA (National Institute for Agrarian Reform and Development) progressively abandoned traditional models of agricultural development, opting for expansion of irrigated crops under plastic. This technique rapidly became consolidated [81], and has continued to the present day.. This process of expansion of irrigated arable and woody crops has been documented not only in the province of Almería, but also in the Guadalquivir Valley, and the Region of Murcia [82]. At the same time, the designation of the ‘Centres of National Tourist Interest’, the attractiveness of the Mediterranean climate, and the economic boom of the early 1980s, led to a rapid and sustained increase in tourism [7] that continues to the present day.
More generally, our results are influenced by the dispersed distribution of habitats and the concentration of the forest landscape in the western half of the province. Both aspects condition the distribution and nature of ecological corridors [83,84,85]. We found less resistance to species movement in highly forested areas. In contrast, corridors through low-lying land areas were very challenging for ecological connectivity, including due to the density of agricultural and urban spaces and linear infrastructures [86]. This phenomenon is most pronounced along the coastal strip [87].
On the other hand, the MCE suitability map (Figure 5) tends to favour factors in specific locations that are widely known to have positive impacts on wildlife conservation.. This is the case for the factors “proximity to forest areas”, “presence of HCIs” and “proximity to linear corridors”. These findings support the results of previous studies, for example, Mironova [35], Osewe et al., [50] and Dindaroglu [59], among others.
Further, we found that some of the proposed ecological corridors are located in semi-natural ecosystems. Nevertheless, these are important for conservation because they favour the dispersal of species [88]. Just over 50% of the area occupied by the proposed corridors has an acceptable suitability for the movement of species between core areas.
The results of the analysis carried out using MSPA tools showed that GI candidate areas and buffer zones reached HFI values close to 2, demonstrating their capacity to favour the conservation of fauna and flora. It is true that, as the level of protection decreases, the HFI decreases, with buffer areas being the most fragmented in the region. Fundamentally, this is due to the commitment to intensive agriculture [89], which has led to a massive proliferation of greenhouses in Campos de Dalías [80] and Níjar [90], located on the peripheries of the Sierra de Cabo Gata-Níjar Natural Park, the SAC of the Sierra de Gádor and Enix, Punta Entinas Sabinar Nature Reserve, Los Artos de El Ejido SCI [91] and Albufera de Adra SAC, among others. In addition, there has been considerable expansion of residential area and facilities for related to tourism development of coastal municipalities [92,93].
A number of points of discussion emerged that offer interesting directions for future work. Firstly, some of the factors included in the MCE model deal with generic aspects of the concept of green infrastructure, and as a result the role they play in determining suitability in this particular model is somewhat unclear. One way to resolve this question would be to apply a simple regression model to test the significance of the chosen factors in predicting suitable habitat. It may be that some of the chosen factors are not very significant and need not be included in a future model.
Another interesting topic for future work would be to explore the impact of complex variables related to the ecosystem services provided by GI: water availability, carbon sequestration, air quality, soil organic matter [58,59] on suitability. Economic variables related to land-use planning could also be included, to observe which areas would be available, in the future, for the growth of certain land uses and what impacts these would have on GI [94].
Thirdly, we suggest carrying out individualised analyses of the buffer zones of each protected area in Almería [34]. In this way, we could check which areas are under pressure and threatened by land use fragmentation. This would support our argument that coastal PAs and other areas of natural interest are disconnected, an idea that has become evident in the delimitation of ecological corridors. We have not delineated corridors in them because of the numerous restrictions in their surroundings.
Our research also has certain limitations that must be considered. Firstly, the most recent LULC map used (MUCVA) corresponds to 2007, because no more recent maps are available in that cartographic series. For a more recent appreciation of the situation, other land cover databases would be needed. The possibilities include SIOSE [95,96], which maintains our scale of analysis 1:25,000; the Forest Map of Spain, MFE [97] and CORINE Land Cover [98,99], at 1:50,000 and 1:100,000 scales respectively. Second, our suitability raster was constructed without empirical data on species distribution. Field measurements, if they could be obtained in future research, would improve the accuracy of our results. Third, our analysis has been conducted considering wildlife as a whole, rather than any specific species. However, other authors, e.g. Doko et al. [100] or Ghoddousi et al. [101] analyse the behaviour and possible distribution of ecological corridors for specific species. Finally, it should be noted that not all of the data used for the suitability map belong to the same time period. To minimise the problem, we took care to choose datasets from the closest available year to 2007.
5. Conclusions
The preservation of habitats in the province of Almería depends on the conservation strategies adopted in its PAs. Our study shows that, despite the intense degree of humanisation of the landscape, there are opportunities to ensure ecological connectivity between the PAs. In some cases, PAs have several possible corridors connecting them to their neighbours, offering planners some flexibility in implementing GI based on particular cases.
Most of the links we identified are located in the central area of the province of Almería, specifically in the Almanzora river basin. Due to its remoteness from the coast and its particular climatic conditions, it has been less attractive for intensive agriculture and urban development related to tourism, the main drivers of transformation and fragmentation of traditional land uses. Consequently, its ability to maintain a continuous and integrated ecological network, where faunal and floral communities can develop and move, is greater.
However, other corridors are located in areas that are highly resistant to the movement of species, close to the coastline, communication routes and highly artificialised zones that limit the capacity for the implementation of green infrastructure. In these cases, the corridors tend to follow river courses and livestock trails with lower degrees of alteration. It is precisely these elements that are the most critical for the survival of the corridor itself and should be considered areas of maximum priority for its future survival.
The scarcity of available suitable land, continued population growth and new economic demands are leading to a progressive increase in land areas that are intensively modified by human activity, resulting in considerable pressure on forest and semi-natural areas. Conserving the transitional routes of wildlife communities in environments so dominated by economic activity is a major challenge. Connectivity analysis and mapping of ecological corridors, as attempted here, is an effective tool to guide future conservation decisions.
Finally, we highlight the continuing relevance of GIS and MCE techniques in assessing ecological landscape suitability and vulnerability to degradation and fragmentation from specific sources. GIS is nowadays fully integrated into environmental management workflows at every level, and MCE techniques are well documented in the scientific literature. When combined into a spatial multi-criteria decision model (MCDM), as here they become extremely powerful tools for strategic planning of conservation areas. In this case, we have proposed a new green infrastructure network in the province of Almeria from a dual perspective: on the one hand we have identified the most suitable areas for green infrastructure from an ecological point of view (Figure 6), and on the other the most critical areas (river courses and livestock trails in severely degraded semi-artificial lands) for maintaining connectivity between core areas of high nature value. Close attention should be paid to these “critical pressure points” in order to preserve the character of the protected areas, their surroundings and the links between them.
Author Contributions
Conceptualization, A.N., J.M.-V and R.J.H.; methodology, A.N., J.M.-V and R.J.H..; formal analysis, A.N.; investigation, A.N., J.M.-V and R.J.H.; writing—original draft preparation, A.N.; writing—review and editing, A.N., R.J.H. and J.M.-V.; visualization, A.N.; supervision, J.M.-V and R.J.H.. All authors have read and agreed to the published version of the manuscript.
Funding
This research received no external funding.
Conflicts of Interest
The authors declare no conflicts of interest.
| 1 | The RENPA currently contains 311 Protected Natural Spaces. However, because two or more protected areas overlap in the same territory (two or more figures of protection concur), the term ‘protected area’ has been coined to designate the largest continuous geographical area over which one or more protection figures are established. Considering this interpretation, there are 249 protected areas in Andalusia. |
References
- Sarkodie, S.A.; Strezov, V. Economic, social and governance adaptation readiness for mitigation of climate change vulnerability: Evidence from 192 countries. Science of The Total Environment 2019, 656, 150-164. [CrossRef]
- Alves, F.; Leal Filho, W.; Casaleiro, P.; Nagy, G.J.; Diaz, H.; Al-Amin, A.Q.; de Andrade Guerra, J.B.; Hurlbert, M.; Farooq, H.; Klavins, M; Saroar, M.; Lorencova, E.K.; Jain, S.; Soares, A.; Morgado, F.; O’Hare, P.; Wolf, F.; Azeiteiro, U.M. Climate change policies and agendas: Facing implementation challenges and guiding responses. Environmental Science & Policy, 2020, 104, 190-198. [CrossRef]
- Burrell, A.L.; Evans, J.P.; De Kauwe, M.G. Anthropogenic climate change has driven over 5 million km2 of drylands towards desertification. Nat Commun 2020, 11, 3853. [CrossRef]
- Malhi, G.S.; Kaur, M.; Kaushik, P. Impact of Climate Change on Agriculture and Its Mitigation Strategies: A Review. Sustainability 2021, 13, 1318. [CrossRef]
- Barr, S.L.; Lemieux, C.J. Assessing organizational readiness to adapt to climate change in a regional protected areas context: lessons learned from Canada. Mitig Adapt Strateg Glob Change 2021, 26, 34. [CrossRef]
- Coldrey, KM; Turpie, JK. The future representativeness of Madagascar's protected area network in the face of climate change. Afr J Ecol. 2021, 59, 253–263. [CrossRef]
- García, F.J. Planeamiento urbanístico y cambio climático: la infraestructura verde como estrategia de adaptación. Cuadernos de Investigación Urbanística. 2019, 122, 1-101. [CrossRef]
- UNEP-WCMC and IUCN. Protected Planet Report 2016, UNEP-WCMC and IUCN, Cambridge, UK and Gland, Switzerland. 2016; 84 p.
- He, M.; Cliquet, A. Challenges for Protected Areas Management in China. Sustainability 2020, 12, 5879. [CrossRef]
- Gaceta de Madrid. Ley de 7 de diciembre de 1916, de Parques Nacionales de España. 1916. Gaceta de Madrid. 1916, 343, 575- 575. Available online: https://www.boe.es/buscar/doc.php?id=BOE-A-1916-5866 (accessed on 22 July 2024).
- Mollá, M. Las políticas de parques nacionales en España. Ería 2015, 97, 157-171. [CrossRef]
- Hewitt, R., Martínez, F. J. E., & Pera, F. (2016). Cambios recientes en la ocupación del suelo de los parques nacionales españoles y su entorno. Cuadernos geográficos de la Universidad de Granada, 55(2), 46-84.
- Ojeda-Rivera, J. F. (1987). Desarrollo económico, transformación de paisajes y protección de la naturaleza en Andalucía. Cuadernos geográficos de la Universidad de Granada, (16), 47-56.
- Tolón, A.; Lastra, X. Los Espacios Naturales Protegidos. Concepto, evolución y situación actual en España. M+A. Revista Electrónica de Medioambiente. 2008, 5, 1-25. https://www.ucm.es/data/cont/media/www/pag-41228/ART%20A.TOLON%20X.%20LASTRA.pdf.
- Elorrieta-Sanz, B.; Olcina-Cantos, J. Infraestructura verde y ordenación del territorio en España. CYTET, I. 2021, 207(3), 23-46. [CrossRef]
- Bishop, K.; Phillips, A.; Warren, L. Protected for ever?: Factors shaping the future of protected areas policy. Land Use Policy, 1995, 12, 291-305. [CrossRef]
- Beaufoy, G. The EU Habitats Directive in Spain: can it contribute effectively to the conservation of extensive agro- ecosystems? Journal of Applied Ecology, 1998, 35, 974-978.
- de la Fuente, B.; Mateo-Sánchez, M.C.; Rodríguez, G.; Gastón, A.; de Ayala, R.P.; Colomina-Pérez, D.; Saura, S. Natura 2000 sites, public forests and riparian corridors: The connectivity backbone of forest green infrastructure. Land Use Pol. 2018, 75, 429-441. [CrossRef]
- Troitiño, M.A.; de Marcos, F.J.; Hernández, M.G.; del Río, M.I.; Carpio, J.; de la Calle, M.; Abad, L.D. Los espacios protegidos en España: significación e incidencia socio territorial. Bol. Asoc. Geogr. Esp. 2005, 39, 227–266. https://bage.age-geografia.es/ojs/index.php/bage/article/view/505.
- Martínez-Fernández,E. et al. Lo natural es político. Las áreas protegidas y la construcción del medioambiente como objeto de gobierno en Andalucía (1978-1989). Investigaciones Regionales 2023, 1(55), 39-55.
- Junta de Andalucía. Informe Medio Ambiente en Andalucía. Consejería de Medio Ambiente: Sevilla, Spain, 1997. Available online: https://www.juntadeandalucia.es/medioambiente/portal/acceso-rediam/informe-medio-ambiente/los-25-primeros-informes-de-medio-ambiente-en-andalucia-1987-2011 (accessed on 6 August 2024).
- Junta de Andalucía. Áreas protegidas de la RENPA. Available online: https://www.juntadeandalucia.es/medioambiente/portal/landing-page-%C3%ADndice/-/asset_publisher/zX2ouZa4r1Rf/content/mapa-actualizado-de-la-renpa/20151 (accessed on 16 August 2024).
- Farina, A. et al. Principles and methods in landscape ecology, Chapman & Hall: London, UK, 1998.
- Costanza, R., d'Arge, R., de Groot, R. et al. The value of the world's ecosystem services and natural capital. Nature 1997, 387, 253–260. [CrossRef]
- Lindenmayer, D.B.; Nix, H.A. Ecological Principles for the Design of Wildlife Corridors. Conservation Biology 1993, 7(3), 627–30. http://www.jstor.org/stable/2386693. [CrossRef]
- Rodríguez, V.; Aguilera, F. ¿Infraestructuras verdes en la planificación territorial española? CYTET, I. 2016, 48(189), 399-418. https://recyt.fecyt.es/index.php/CyTET/article/view/76490.
- Benedict, M.A.; McMahon, E.T. Green infrastructure: smart conservation for the 21st century. Renew. Resour. J. 2002, 20(3), 12-17. [CrossRef]
- European Commission. Green Infrastructure (GI) — Enhancing Europe’s Natural Capital. Communication from the Commission to the European Parliament, the Council, the European Economic and Social Commitee and the Committee of the Regions; Brussels, Belgium, 2013. Available online: https://eur-lex.europa.eu/resource.html?uri=cellar:d41348f2-01d5-4abe-b817-4c73e6f1b2df.0008.03/DOC_1&format=PDF (accessed on 6 August 2024).
- MITECO, Ministerio de Agricultura y Pesca, Alimentación y Medio Ambiente. Estrategia Nacional de Infraestructura Verde y de la Conectividad y Restauración Ecológicas, MITECO, Madrid, Spain, 2021. Available online: https://www.miteco.gob.es/es/biodiversidad/temas/ecosistemas-y-conectividad/infraestructura-verde/infr_verde.html (accessed on 6 August 2024).
- Chang, Q., Li, X., Huang, X., Wu, J. A GIS-based Green Infrastructure Planning for Sustainable Urban Land Use and Spatial Development. Procedia Environmental Sciences 2012, 12, 491-498. [CrossRef]
- Firehock, K.E., Walker, R.A. Green infrastructure: map and plan the natural world with GIS, Esri Press, 2019, 282 pp.
- Aguilera, F.; Rodríguez, V.M.; Gómez, M. Definición de infraestructuras verdes: una propuesta metodológica integrada mediante análisis espacial. Doc. Anal. Geogr. 2018, 64(2), 313–337. [CrossRef]
- Velázquez, J.C.; Rodríguez, V.M. Identification and assessment of green infrastructure in the Community of Madrid. Landsc. Res. 2023, 48, 297–312. [CrossRef]
- Gallardo, M.; Martínez-Vega, J. Modeling land-use scenarios in protected areas of an urban region in Spain. In Geomatic Approaches for Modeling Land Change Scenarios; Camacho, M.T., Paegelow, M., Mas, J.F., Escobar, F., Eds.; Springer: Berlin, Germany, 2018; pp. 307-328. [CrossRef]
- Mironova, E.E. GIS modeling of green infrastructure of mediterranean cities for the management of urbanized ecosystems. Arid Ecosyst. 2021, 11(2), 149-155. https://link.springer.com/article/10.1134/S2079096121020116. [CrossRef]
- Caparrós, J.L.; Milán, J.; Rueda, N.; de Pablo, J. Mapping green infrastructure and socioeconomic indicators as a public management tool: the case of the municipalities of Andalusia (Spain). Environ. Sci. Eur. 2020, 32, 1-17. [CrossRef]
- Valladares, F.; Gil, P.; Forner, A. (Coords.) Bases científico-técnicas para la Estrategia estatal de infraestructura verde y de la conectividad y restauración ecológicas. Ministerio de Agricultura y Pesca, Alimentación y Medio Ambiente, Madrid, Spain, 2017. https://www.miteco.gob.es/es/biodiversidad/temas/ecosistemas-y-conectividad/infraestructura-verde/infr_verde.html.
- Comunidad de Madrid. Planificación de la red de corredores ecológicos de la Comunidad de Madrid: identificación de oportunidades para el bienestar social y la conservación del patrimonio natural. Consejería de Medio Ambiente, Vivienda y Ordenación del Territorio, Madrid, Spain, 2010. https://www.madrid.org/cartografia/planea/planeamiento/html/web/corredores.htm.
- Dudley, N. (Ed.), Guidelines for Applying Protected Area Management Categories. IUCN: Gland, Switzerland, 2008.
- Duflot, R.; Aviron, S.; Ernoult, A. et al. Reconsidering the role of ‘semi-natural habitat’ in agricultural landscape biodiversity: a case study. Ecol Res 2015, 30, 75–83. [CrossRef]
- Liu, J.; Jin, X.; Song, J.; Zhu,W.; Zhou, Y. Semi-natural habitats: A comparative research between the European Union and China in agricultural landscapes. Land Use Pol. 2024, 141, 107115. [CrossRef]
- Armas, C.; Rodríguez-Echeverría, S.; Pugnaire, F.I. A field test of the stress-gradient hypothesis along an aridity gradient. Journal of Vegetation Science 2011, 22: 818-827. [CrossRef]
- Mendoza-Fernández, A.J.; Peña-Fernández, A.; Molina, L.; Aguilera, P.A. The Role of Technology in Greenhouse Agriculture: Towards a Sustainable Intensification in Campo de Dalías (Almería, Spain). Agronomy 2021, 11, 101. [CrossRef]
- Sánchez, L.M. Modelo territorial innovador y articulación urbana en el poniente almeriense. Investig. Geogr. 2013, 59, 57–74. [CrossRef]
- Górgolas, P. El urbanismo en el litoral andaluz tras la última burbuja inmobiliaria. Cambio de ciclo o reincidencia; Tirant Humanidades: Valencia, Spain, 2020; pp. 215.
- Diputación de Almería. Agenda 21 provincia de Almería. Diputación de Almería: Almería, Spain 2009. Available online: https://www.dipalme.org/Servicios/Anexos/Anexos.nsf/58C0DDAA24FEE3E3C1257650003A80FC/$file/Documento%20de%20diagnostico%20volumen%20I.pdf (accessed on 6 August 2024).
- Junta de Andalucía. Plan Director para la Mejora de la Conectividad Ecológica en Andalucía, una estrategia de infraestructura verde. Consejería Medio Ambiente y Ordenación del Territorio, Sevilla, Spain, 2018. Available online: https://www.juntadeandalucia.es/sites/default/files/2021-06/PDMCEA_areas_estrategicas_2018.pdf (accessed on 6 August 2024).
- Vogt, P. User guide of guidos toolbox; JRC: Brussels, Belgium, 2017. Available online: https://forest.jrc.ec.europa.eu/en/activities/lpa/gtb/ (accessed on 6 August 2024).
- Wickham, J.; Riitters, K.; Vogt, P.; Costanza, J.; Neale, A. An inventory of continental US terrestrial candidate ecological restoration areas based on landscape context. Restor. Ecol. 2017, 25, 894–902. [CrossRef]
- Osewe, E.O.; Niţă, M.D.; Abrudan, I.V. Assessing the Fragmentation, Canopy Loss and Spatial Distribution of Forest Cover in Kakamega National Forest Reserve, Western Kenya. Forests 2022, 13(12), 2127. [CrossRef]
- Clerici, N.; Vogt, P. Ranking European regions as providers of structural riparian corridors for conservation and management purposes. Int. J. Appl. Earth Obs. Geoinf. 2013, 21, 477-483. [CrossRef]
- Rincón, V.; Velázquez, J.; Pascual, Á. et al. Connectivity of Natura 2000 potential natural riparian habitats under climate change in the Northwest Iberian Peninsula: implications for their conservation. Biodivers Conserv 2022, 31, 585–612. [CrossRef]
- Schmid, M.S.; Aubry, C.; Grigor, J.; Fortier, L. The LOKI underwater imaging system and an automatic identification model for the detection of zooplankton taxa in the Arctic Ocean. Limnol. Oceanogr. Methods. 2016, 15, 129–160. [CrossRef]
- Wickham, J.D.; Riitters, K.H.; Wade, T.G.; Vogt, P. A national assessment of green infrastructure and change for the conterminous United States using morphological image processing. Landsc. Urban Plan. 2010, 94, 186–195. [CrossRef]
- Carver, S. J. Integrating multi-criteria evaluation with geographical information systems. International Journal of Geographical Information Systems 1991, 5(3), 321–339. [CrossRef]
- Gómez, M.; Barredo, J.I. Sistemas de Información Geográfica y evaluación multicriterio; Ra-Ma: Madrid, Spain, 2005; pp. 304.
- Romero, C. Teoría de la decisión multicriterio: conceptos, técnicas y aplicaciones, Alianza Universidad-Textos: Madrid, Spain, 1993; pp. 195.
- Cunha, N.S.; Magalhães, M.R. Methodology for mapping the national ecological network to mainland Portugal: A planning tool towards a green infrastructure. Ecol. Indic. 2019, 104, 802-818. [CrossRef]
- Dindaroglu, T. Determination of ecological networks for vegetation connectivity using GIS & AHP technique in the Mediterranean degraded karst ecosystems. J. Arid Environ. 2021, 188, 104385. [CrossRef]
- Saaty, T.L. The Analytic Hierarchy Process, McGraw-Hill: New York, USA, 1980; pp. 343.
- Escobar, F.; Hewitt, R.; Hernández, V. Usos del suelo en los parques nacionales españoles. Evolución y modelado participativo. In Proyectos de Investigación en Parques Nacionales. P. Amengual, B. Asensio, Eds.; Organismo Autónomo de Parques Nacionales: Madrid, Spain, 2015; pp. 175-211.
- Hewitt, R.; Van Delden, H.; Escobar, F. Participatory land use modelling, pathways to an integrated approach. Environmental Modelling & Software, 2014, 52, 149-165.
- Rodríguez-Rodríguez, D.; Martínez-Vega, J.; Echavarría, P. A twenty-year GIS-based assessment of environmental sustainability of land use changes in and around protected areas of a fast developing country: Spain. Int. J. Appl. Earth Obs. Geoinf. 2019, 74, 169-179. [CrossRef]
- Malczewski, J.; Chapman, T.; Flegel, C.; Walters, D.; Shrubsole, D.; Healy, M. A. GIS–multicriteria evaluation with ordered weighted averaging (OWA): case study of developing watershed management strategies. Environment and Planning A, 2003, 35(10), 1769-1784.
- Boitani, L.; Falcucci, A.; Maiorano, L.; Rondinini, C. Ecological Networks as Conceptual Frameworks or Operational Tools in Conservation. Conservation Biology 2007, 21, 6, 1414-1422. [CrossRef]
- Gurrutxaga, M.; Lozano, P.J.; del Barrio, G. GIS-based approach for incorporating the connectivity of ecological networks into regional planning. J. Nat. Conserv. 2010, 18(4), 318-326. [CrossRef]
- Baguette, M.; Blanchet, S.; Legrand, D.; Stevens, V.M.; Turlure, C. Individual dispersal, landscape connectivity and ecological networks. Biol Rev, 2013, 88, 310-326. [CrossRef]
- Troy, A.; Wilson, M.A. Mapping ecosystem services: practical challenges and opportunities in linking GIS and value transfer. Ecol. Econ. 2006, 60, 435–449. [CrossRef]
- Cao, Y.; Yang, R.; Carver, S. Linking wilderness mapping and connectivity modelling: A methodological framework for wildland network planning. Biol. Conserv. 2020, 251, 108679. [CrossRef]
- Cole, J.R.; Koen, E.L.; Pedersen, E.J.; Gallo, J.A.; Kross, A.; Jaeger, J.A. Impacts of anthropogenic land transformation on species-specific habitat amount, fragmentation, and connectivity in the Adirondack-to-Laurentians (A2L) transboundary wildlife linkage between 2000 and 2015: Implications for conservation and ecological restoration. Landsc. Ecol. 2023, 38(10), 1-31. [CrossRef]
- Gallo, J.A.; Butts, E.C.; Miewald, T.A.; Foster, K.A. Comparing and Combining Omniscape and Linkage Mapper Connectivity Analyses in Western Washington, Conservation Biology Institute, Corvallis, OR, 2019. [CrossRef]
- Soille, P.; Vogt, P. Morphological segmentation of binary patterns. Pattern Recognit. Lett., 2009, 30(4), 456–459. [CrossRef]
- Chuvieco, E.; Martínez, S.; Román, M.V.; Hantson, S.; Pettinari, M.L. Integration of ecological and socio-economic factors to assess global vulnerability to wildfire. Glob. Ecol. Biogeogr., 2014, 23(2), 245-258. [CrossRef]
- IECA. Encuesta de Ocupación Hotelera. Instituto de Estadística y Cartografía de Andalucía: Sevilla, Spain, 2003-2017. Available online: https://www.juntadeandalucia.es/institutodeestadisticaycartografia/eoh/index-eoh.htm (accessed on 6 August 2024).
- Hörnsten, L.; Fredman, P. On the distance to recreational forests in Sweden. Landscape and Urban Planning 2000, 51(1), 1-10. [CrossRef]
- Zhang, J.; Cheng, Y.; Zhao, B. Assessing the inequities in access to peri-urban parks at the regional level: A case study in China’s largest urban agglomeration. Urban Forestry & Urban Greening 2021, 65, 127334, ttps://doi.org/10.1016/j.ufug.2021.127334.
- Rodríguez-Rodríguez, D.; Martínez-Vega, J. Protected area effectiveness against land development in Spain. J. Environ. Manage. 2018, 215, 345-357. [CrossRef]
- Serrano, P. Y. It is what it is: Local Resistances and Life-Sustaining Strategies in Western Almeria's Agro-Industrial Plastic Sea; The University of Manchester: Manchester, United Kingdom, 2022.
- Araque, E. Las adquisiciones de montes en la provincia de Almería (1940-1992). Los ejemplos de las cuencas del Andarax y Almanzora. Nimbus. Rev. Climat., Meteorol. Paisaje. 2012, 29, 61–79. http://hdl.handle.net/10835/2994.
- Mendoza-Fernández, A.; Martínez-Hernández, F.; Garrido-Becerra, J. A.; Pérez-García, F. J.; Medina-Cazorla, J. M.; de Giles, J. P.; Mota, J. F. Is the endangered flora of the Iberian southeast adequately protected? Gaps in the Network of Protected Natural Areas of Andalusia (RENPA): the case of the province of Almería. Acta Bot. Gall. 2009, 156(4), 637–648. [CrossRef]
- Muñoz, A.; Requejo, J. Recursos naturales y crecimiento económico en el Campo de Dalías, Agencia de Medio Ambiente, Sevilla, Spain, 1991, Monografías de Economía y Medio Ambiente (2), 256 pp.
- Martínez-Vega. J. Mili, S., Gallardo, M. Modelling Land Use and Land Cover Changes in the Mediterranean Agricultural Ecosystems. In: Modeling for Sustainable Management in Agriculture, Food and the Environment, G. Vlontzos, Y. Ampatzidis, B. Manos, P.M. Pardalos, Eds.; Routledge-CRC Press, 2022, pp. 40-73.
- Collinge, S.K.. Spatial arrangement of habitat patches and corridors: clues from ecological field experiments. Landsc. Urban Plan. 1998, 42(2–4), 157-168. [CrossRef]
- Salviano, I.R.; Gardon, F.R.; dos Santos, R.F. Ecological corridors and landscape planning: a model to select priority areas for connectivity maintenance. Landscape Ecol 2021, 36, 3311–3328. [CrossRef]
- Zhou, D.; Song, W. Identifying Ecological Corridors and Networks in Mountainous Areas. Int. J. Environ. Res. Public Health 2021, 18, 4797. [CrossRef]
- Martín, B.; Ortega, E.; de Isidro, A.; Iglesias-Merchan, C. Improvements in high-speed rail network environmental evaluation and planning: An assessment of accessibility gains and landscape connectivity costs in Spain. Land Use Pol. 2021, 103, 105301. [CrossRef]
- Alados, C.L.; Puigdefábregas, J.; Martínez-Fernández, J. Ecological and socio-economical thresholds of land and plant-community degradation in semi-arid Mediterranean areas of southeastern Spain. J. Arid Environ. 2011, 75(12), 1368-1376. [CrossRef]
- Fonseca, A.; Zina, V.; Duarte, G.; Aguiar, F.C.; Rodríguez-González, P.M.; Ferreira, M.T.; Fernandes, M.R. Riparian Ecological Infrastructures: Potential for Biodiversity-Related Ecosystem Services in Mediterranean Human-Dominated Landscapes. Sustainability 2021, 13, 10508. [CrossRef]
- Egea, F.J.; Glass, R. Almeria: a model for sustainable intensive production. In Proceedings of the Aspects of Applied Biology, Rothamsted Research, Harpenden, UK, 28-30 November 2017, No.136, 233-236.
- Aznar-Sánchez, J.A.; Belmonte-Ureña, L.J.; Velasco-Muñoz, J.F.; Valera, D.L. Aquifer Sustainability and the Use of Desalinated Seawater for Greenhouse Irrigation in the Campo de Níjar, Southeast Spain. Int. J. Environ. Res. Public Health 2019, 16, 898. [CrossRef]
- Entrena-Duran, F. Expansion of Greenhouse Farming in the Area of El Ejido: A Case Study on the Environmental and Social Consequences of Agroindustry in Southeast Spain. In: Food production and eating habits from around the world: a multidisciplinary approach. Entrena-Duran, F., Nova Science Publishers, New York, USA, 2015. Chapter 3, pp. 29-44.
- Sarrión-Gavilán, M.D.; Benítez-Márquez, M.D.; Mora-Rangel, E.O. Spatial distribution of tourism supply in Andalusia. Tourism Management Perspectives 2015, 15, 29-45. [CrossRef]
- Díez-Garretas, B.; Comino, O.; Pereña, J.; Asensi, A. Spatio-temporal changes (1956-2013) of coastal ecosystems in Southern Iberian Peninsula (Spain). Mediterranean Botany 2019, 40(1), 111-119.
- Yacamán, C.; Ferrer, D.; Mata, R. Green infrastructure planning in metropolitan regions to improve the connectivity of agricultural landscapes and food security. Land 2020, 9, 414. [CrossRef]
- García-Álvarez, D. The Influence of Scale in LULC Modeling. A Comparison Between Two Different LULC Maps (SIOSE and CORINE). In: Geomatic Approaches for Modeling Land Change Scenarios; Camacho Olmedo, M., Paegelow, M., Mas, JF., Escobar, F. Eds.; Lecture Notes in Geoinformation and Cartography. Springer, Cham, 2018; pp. 187-213. [CrossRef]
- Zaragozí, B.; Rodríguez-Sala, J.J.; Trilles, S.; Ramón-Morte, A. Integration of New Data Layers to Support the Land Cover and Use Information System of Spain (SIOSE): An Approach from Object-Oriented Modelling. In: Geographical Information Systems Theory, Applications and Management. GISTAM 2020. Communications in Computer and Information Science; Grueau, C., Laurini, R., Ragia, L., Eds.; Springer, Cham, 2021; Volume 1411, pp. 85-101. [CrossRef]
- MITECO, 2024. Mapa Forestal de España a escala 1:50.000 (MFE50). Available on: https://www.miteco.gob.es/es/biodiversidad/temas/inventarios-nacionales/mapa-forestal-espana/mfe_50.html (accessed on 29 August 2024).
- Büttner, G. CORINE Land Cover and Land Cover Change Products. In: Land Use and Land Cover Mapping in Europe. Remote Sensing and Digital Image Processing; Manakos, I., Braun, M. Eds.; Springer, Dordrecht, 2014; vol 18, pp. 55-74. [CrossRef]
- Feranec, J.; Soukup, T.; Hazeu, G.; Jaffrain, G. (Eds.) European landscape dynamics: CORINE land cover data, CRC Press, Boca Raton, USA, 2016.
- Doko, T.; Fukui, H.; Kooiman, A.; Toxopeus, A.G.; Ichinose, T.; Chen, W.; Skidmore, A.K. Identifying habitat patches and potential ecological corridors for remnant Asiatic black bear (Ursus thibetanus japonicus) populations in Japan. Ecol. Model. 2011, 222(3), 748-761. [CrossRef]
- Ghoddousi, A.; Bleyhl, B.; Sichau, C.; Ashayeri, D.; Moghadas, P.; Sepahvand, P.; Hamidi, A.K.; Soofi, M.; Kuemmerle, T. Mapping connectivity and conflict risk to identify safe corridors for the Persian leopard. Landsc. Ecol. 2020, 35, 1809-1825. [CrossRef]
- CNIG. Centro de Descargas. Centro Nacional de Información Geográfica: Madrid, Spain, 2024. Available online: https://centrodedescargas.cnig.es/CentroDescargas/index.jsp (accessed on 6 August 2024).
- REDIAM. Descarga de Información Ambiental. Red de Información Ambiental de Andalucía: Sevilla, Spain, 2024. Available online: https://portalrediam.cica.es/descargas (accessed on 6 August 2024).
Figure 1.
Location of the province of Almeria. Distribution and categorisation of its protected areas, comprising the RENPA network. SAC=Special Area of Conservation SCI=Site of Community Importance
Figure 1.
Location of the province of Almeria. Distribution and categorisation of its protected areas, comprising the RENPA network. SAC=Special Area of Conservation SCI=Site of Community Importance
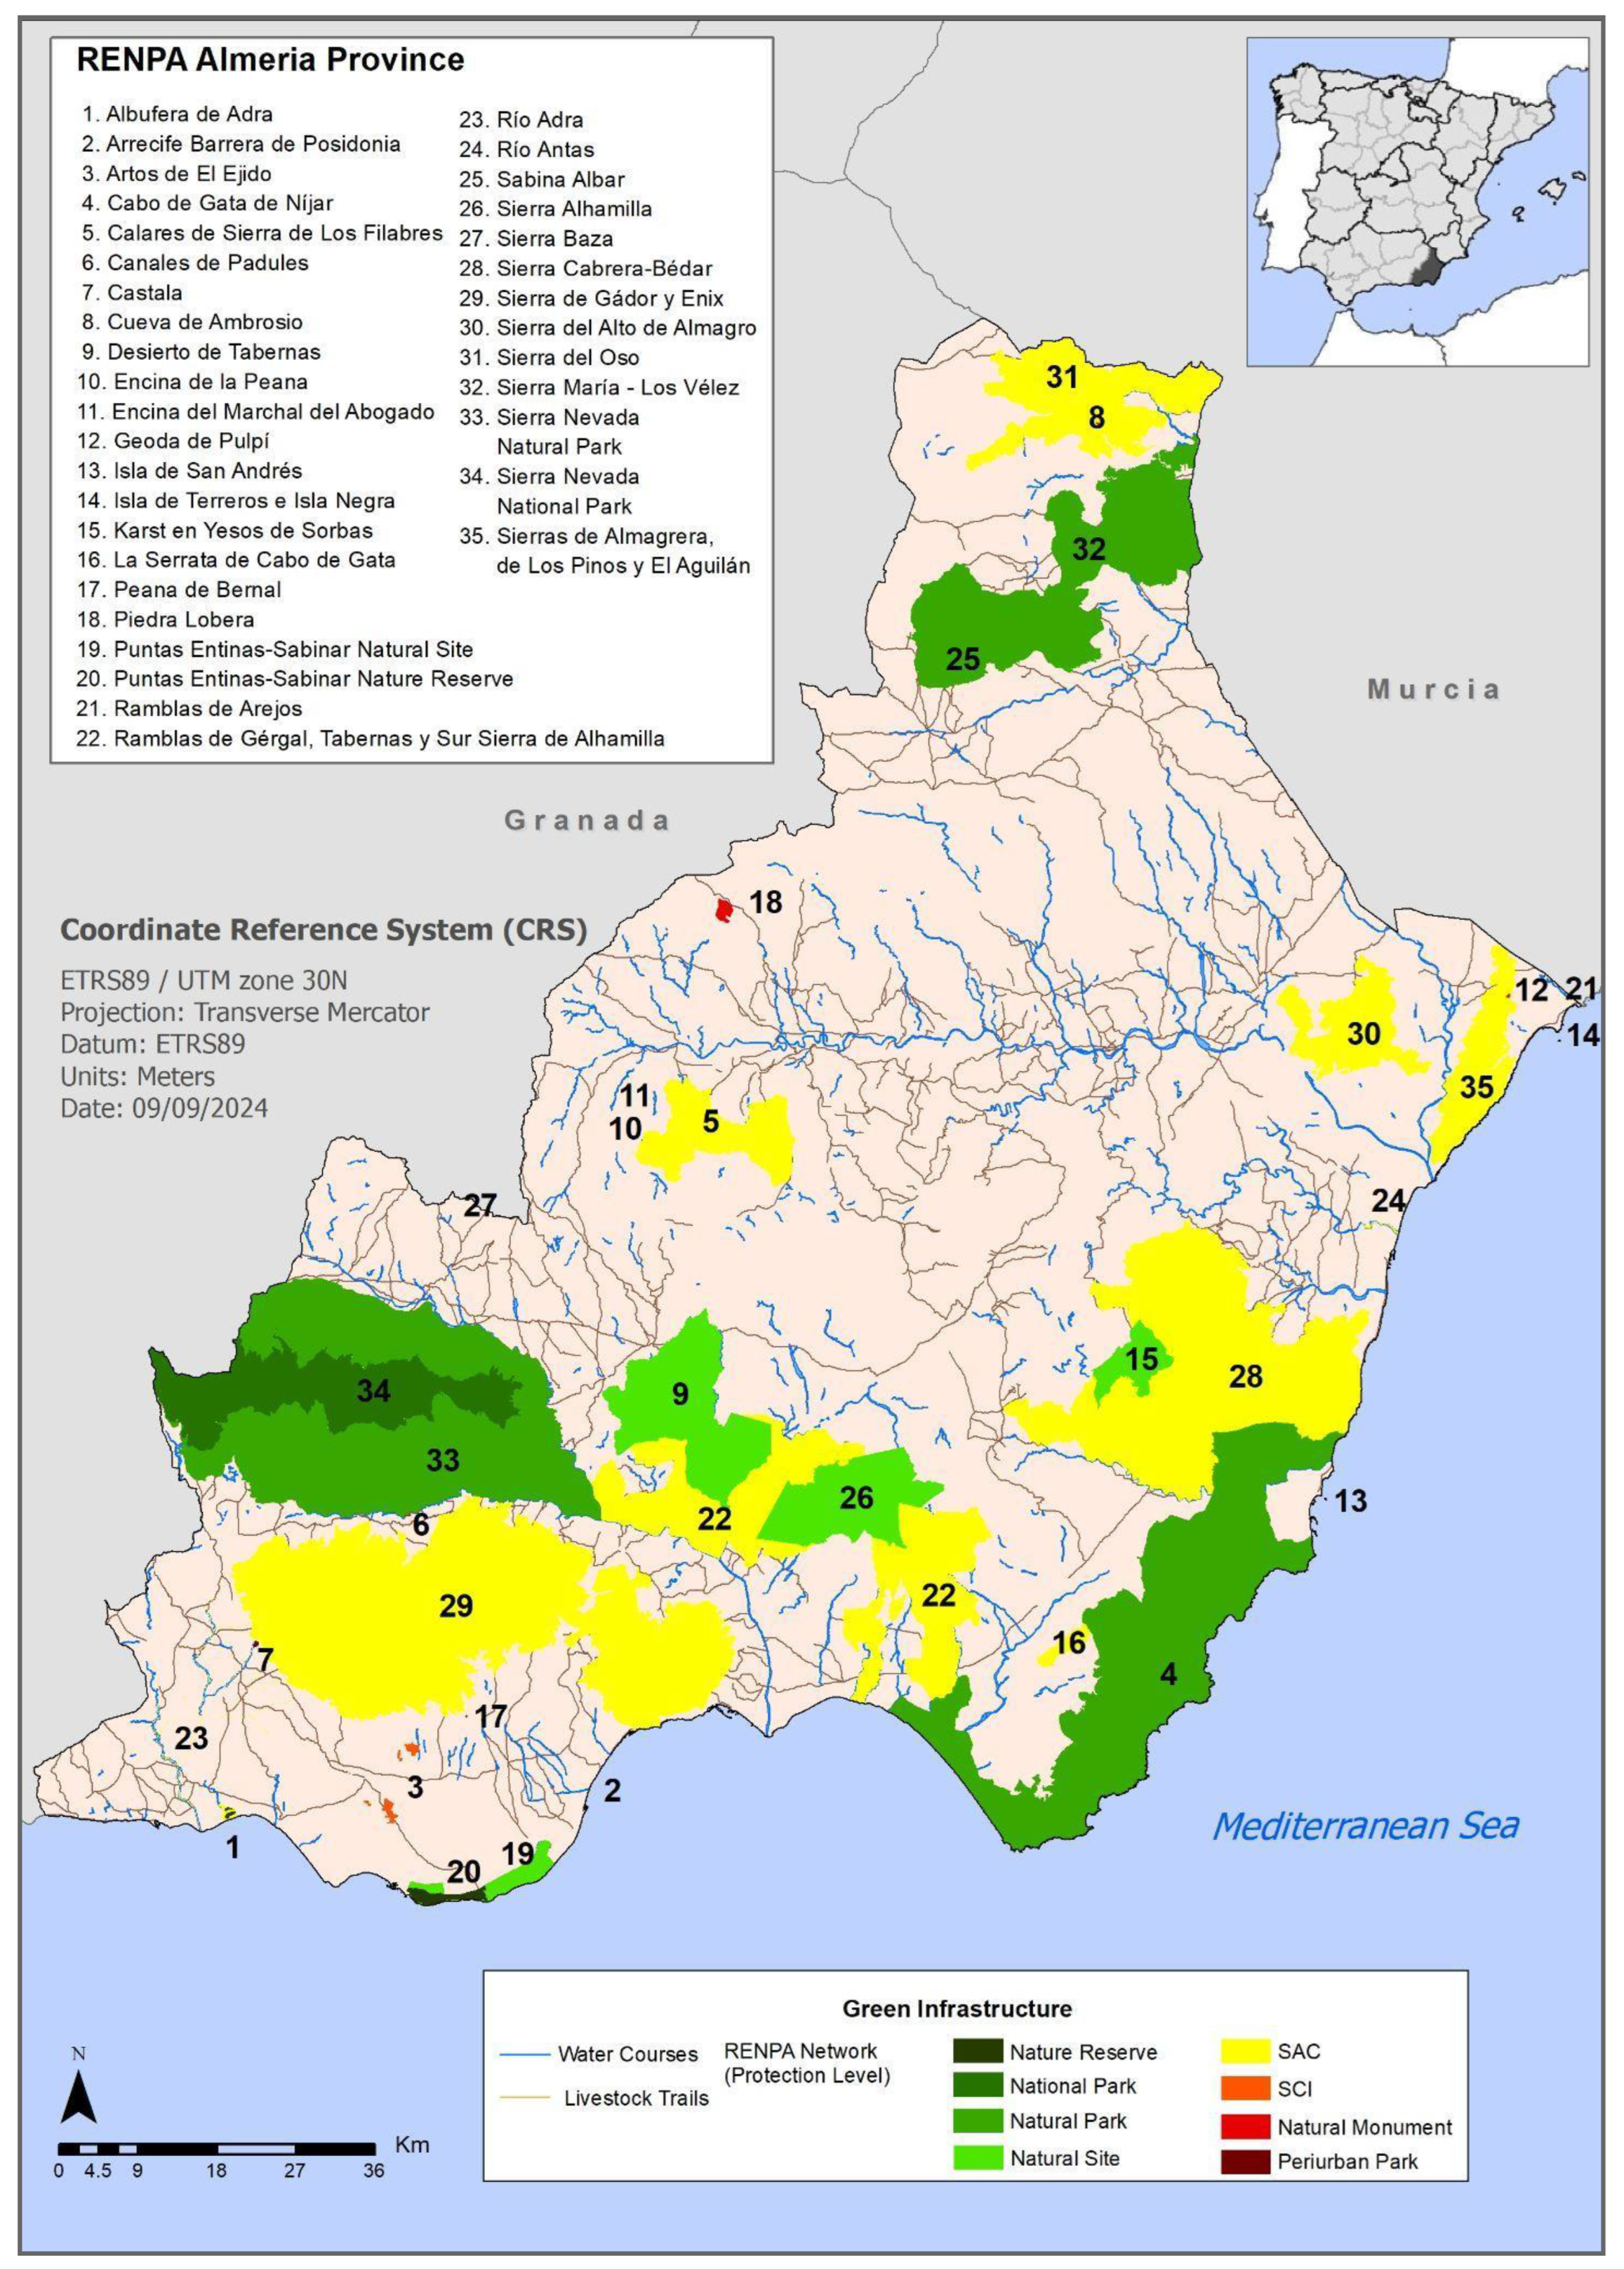
Figure 2.
Research methods workflow.

Figure 3.
Factor maps: a) Slope; b) Aspect; c) Proximity to forest areas; d) Road Safety; e) Habitats of Community Interest; f) Proximity to Linear Corridors; g) Accessibility from urban areas; h) Land use and land cover fragmentation.
Figure 3.
Factor maps: a) Slope; b) Aspect; c) Proximity to forest areas; d) Road Safety; e) Habitats of Community Interest; f) Proximity to Linear Corridors; g) Accessibility from urban areas; h) Land use and land cover fragmentation.
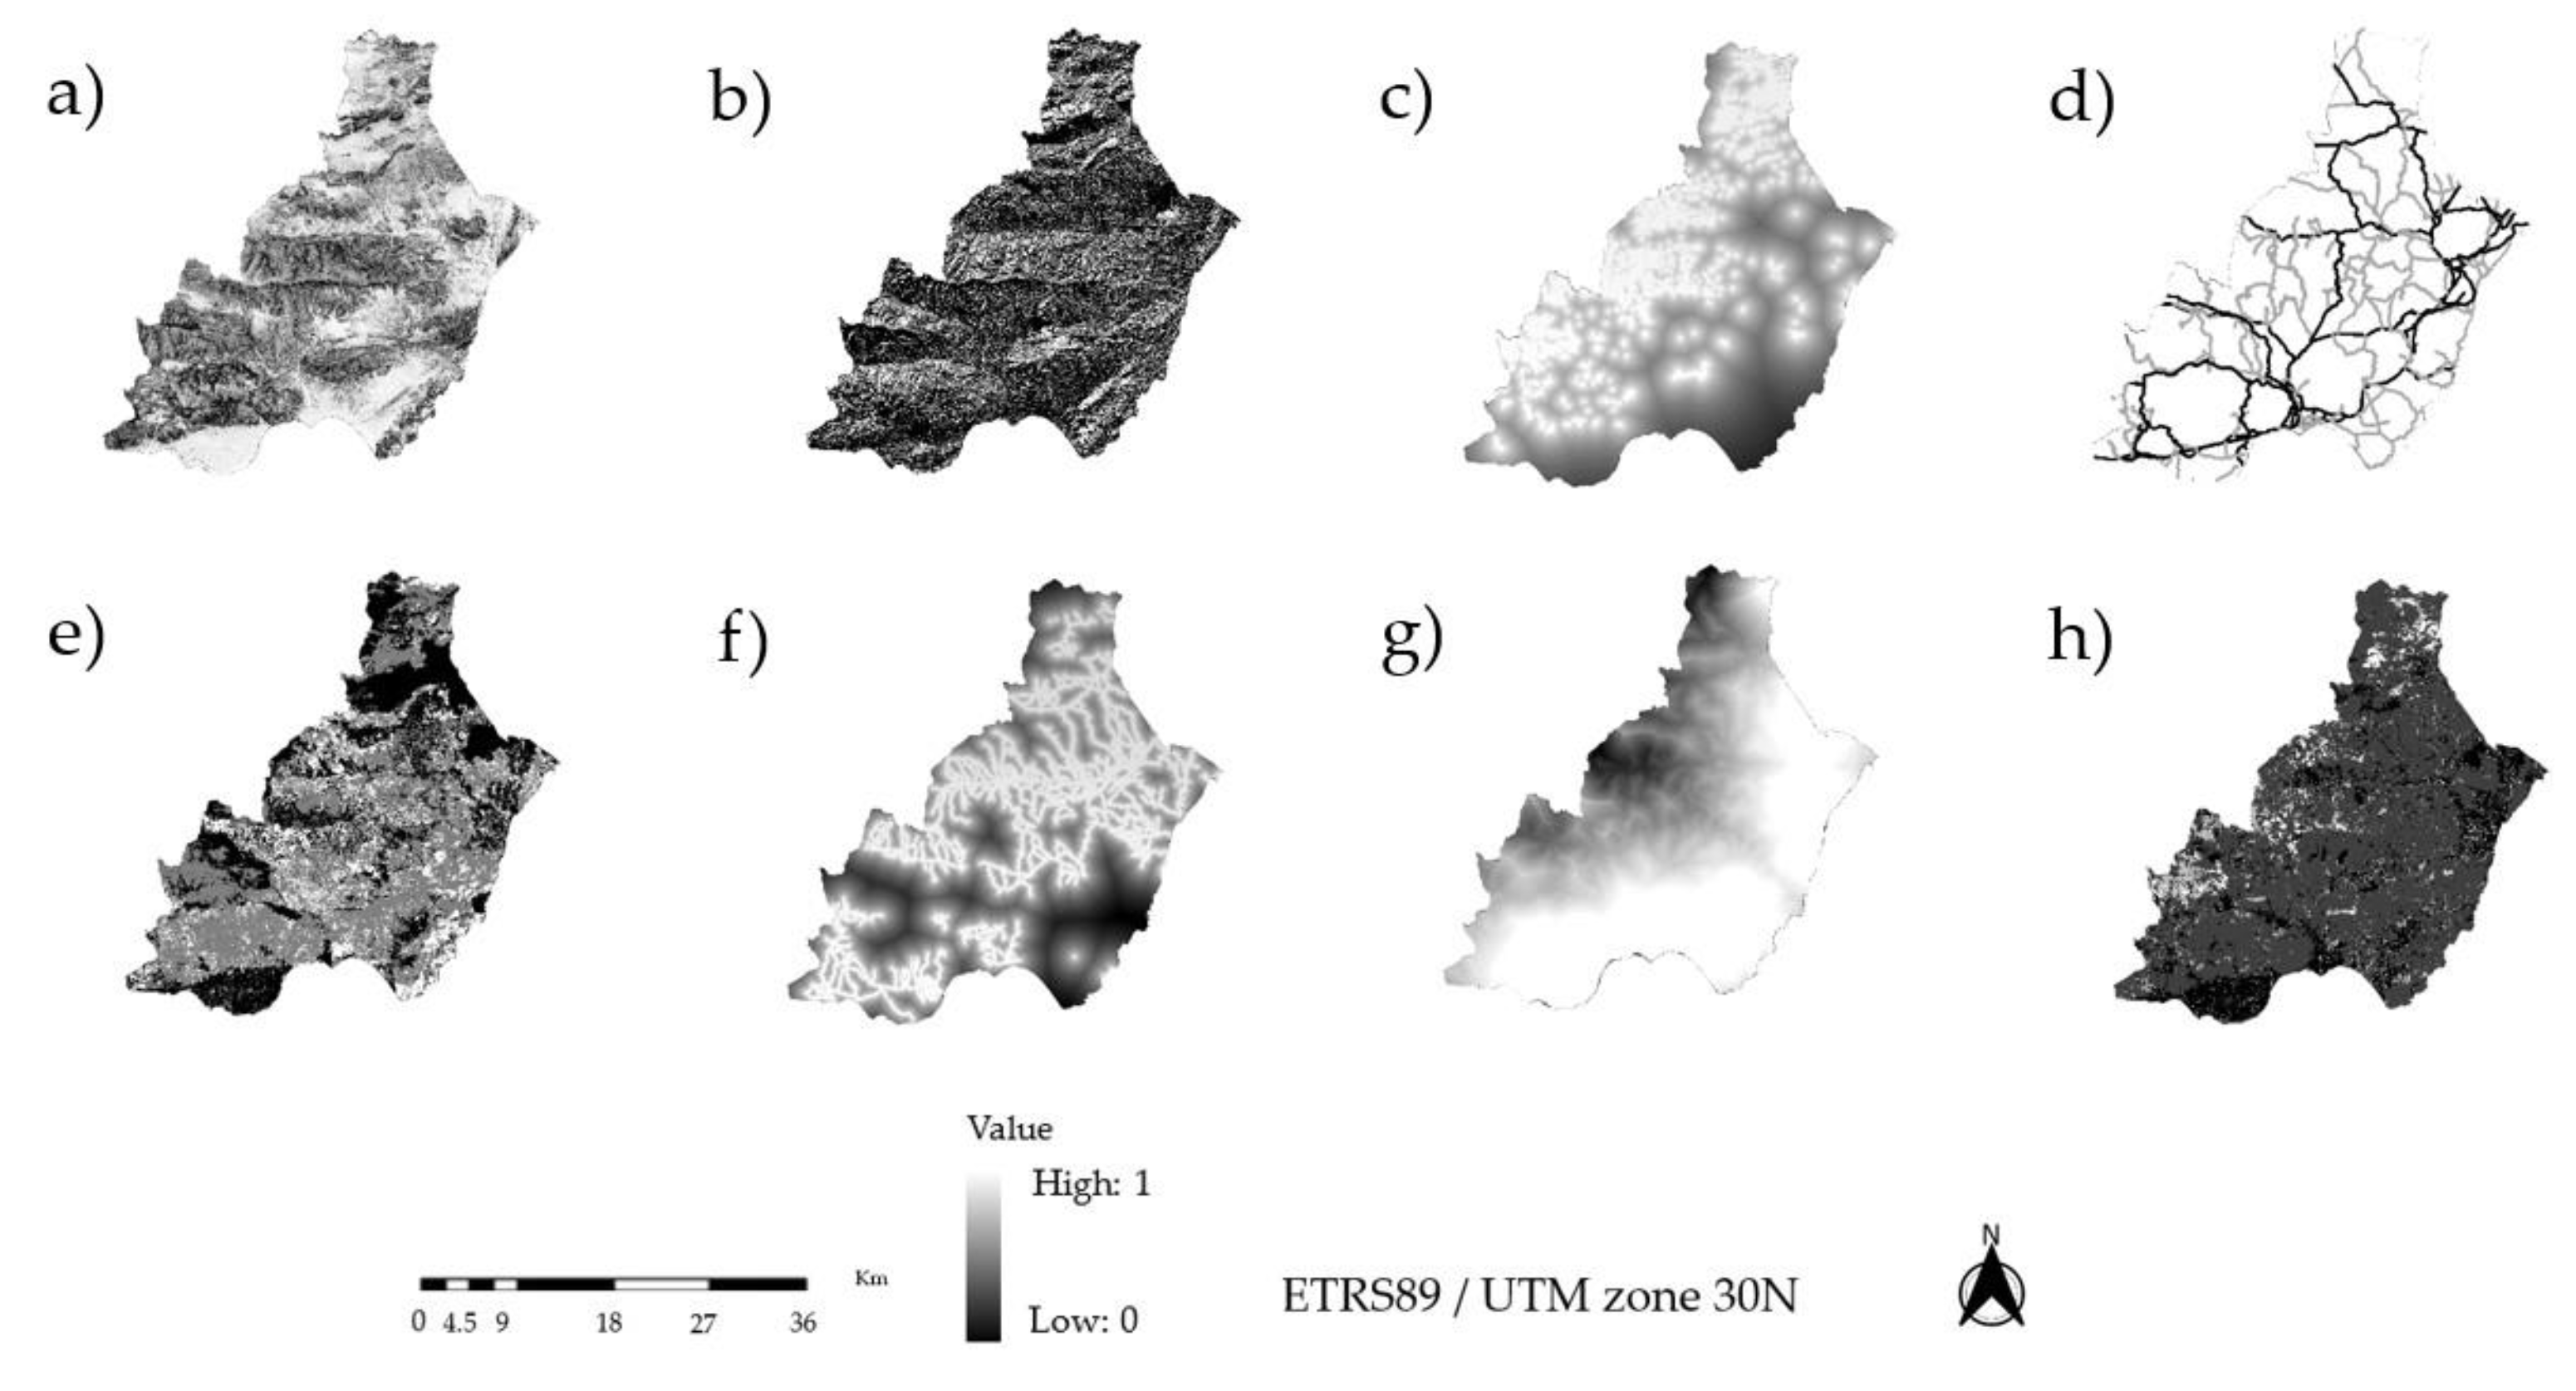
Figure 4.
Cross tabulation matrix between the reclassified land use-land cover classes 1984 (in rows) and 2007 (in columns). The main processes of change are indicated by alphabetical and colour coding. Source: From the authors based on Rodríguez-Rodríguez et al., (2019). LAND USE-LAND COVER CLASSES: URB: Urban; IND: Industrial; INFRR: Road, rail, air, air, port and other technical infrastructure; INFWATER: Water infrastructure, salt works and aquaculture; MINCON: Mining, landfill and construction sites; ALTER: Altered, eroded and felled; RICE: Rice; PLASTIC: Intensive crops under plastic; REGLEN: Intensive crops: irrigated woody crops; REGOT: Intensive crops: other irrigated crops; SECOT: Rainfed crops: other rainfed crops; VINOL: Rainfed crops: olive groves and vineyards; EUCAL: Eucalyptus plantations; PINAR: Pine forests; OTFOR: Other woodland or mixed woodland; PAST: Pasture; MAT: Scrubland; RIOS: Rivers and natural watercourses; LAG: Natural lagoons; LITORAL: Natural coastal system; MNM: Non-tidal marshland; MN: Tidal marshland; MAR: Sea and tidal areas. LAND USE-LAND COVER CHANGES: AA: Abandonment of activity; ACR: Abandonment of irrigated crops; ACS: Abandonment of rainfed crops; AV: Road extension; CC: Climate change; CE: Construction of reservoir water; CVH: Colonisation of vegetation on wetlands; ENRH: Expansion of non-irrigated land on wetlands; ERH: Expansion of irrigated land on wetlands; IA: Exchange of tree species; IIR: Intensification of irrigated land; IIS: Intensification of rainfed land; IMP: Improbable; IND: Industrialisation; IZH: Interchange of wetlands; P: Permanent; RC: Conversion to cultivation; RF: Forest restoration; RGF: Forest regression; RZI: Conversion to industrial areas RH: Restoration of wetlands, RZI: Conversion to industrial areas; URB1: Urbanisation of other artificial areas; URB2: Urbanisation of agricultural areas; URB3: Urbanisation of forest and natural areas; URB4: Urbanisation of wetlands and water bodies. LAND USE-LAND COVER FRAGMENTATION CATEGORIES (LULCF), ACCORDING TO THEIR IMPACTS ON GREEN INFRASTRUCTURES. 1: Categories with a permanent positive impact on GI: EUCAL, PINAR, OTFOR, RIOS, LAG; 2: Fragmented natural or semi-natural categories with positive impact: AA, ACR, ACS, IA, IZH, RF; 3: Categories with neutral impact: SECOT, VINOL, PAST, MAT, LITORAL, MNM, MN, MAR; 4: Categories with negative impact: URB, IND, INFRR, INFWATER, MINCON, ALTER, RICE, PLASTIC, REGLEN, REGOT, AV, CC, CVH, CE, ENRH, ERH, IMP, IND, IIR, IIS, RC, RGF, RZI, URB1, URB2, URB3, URB4
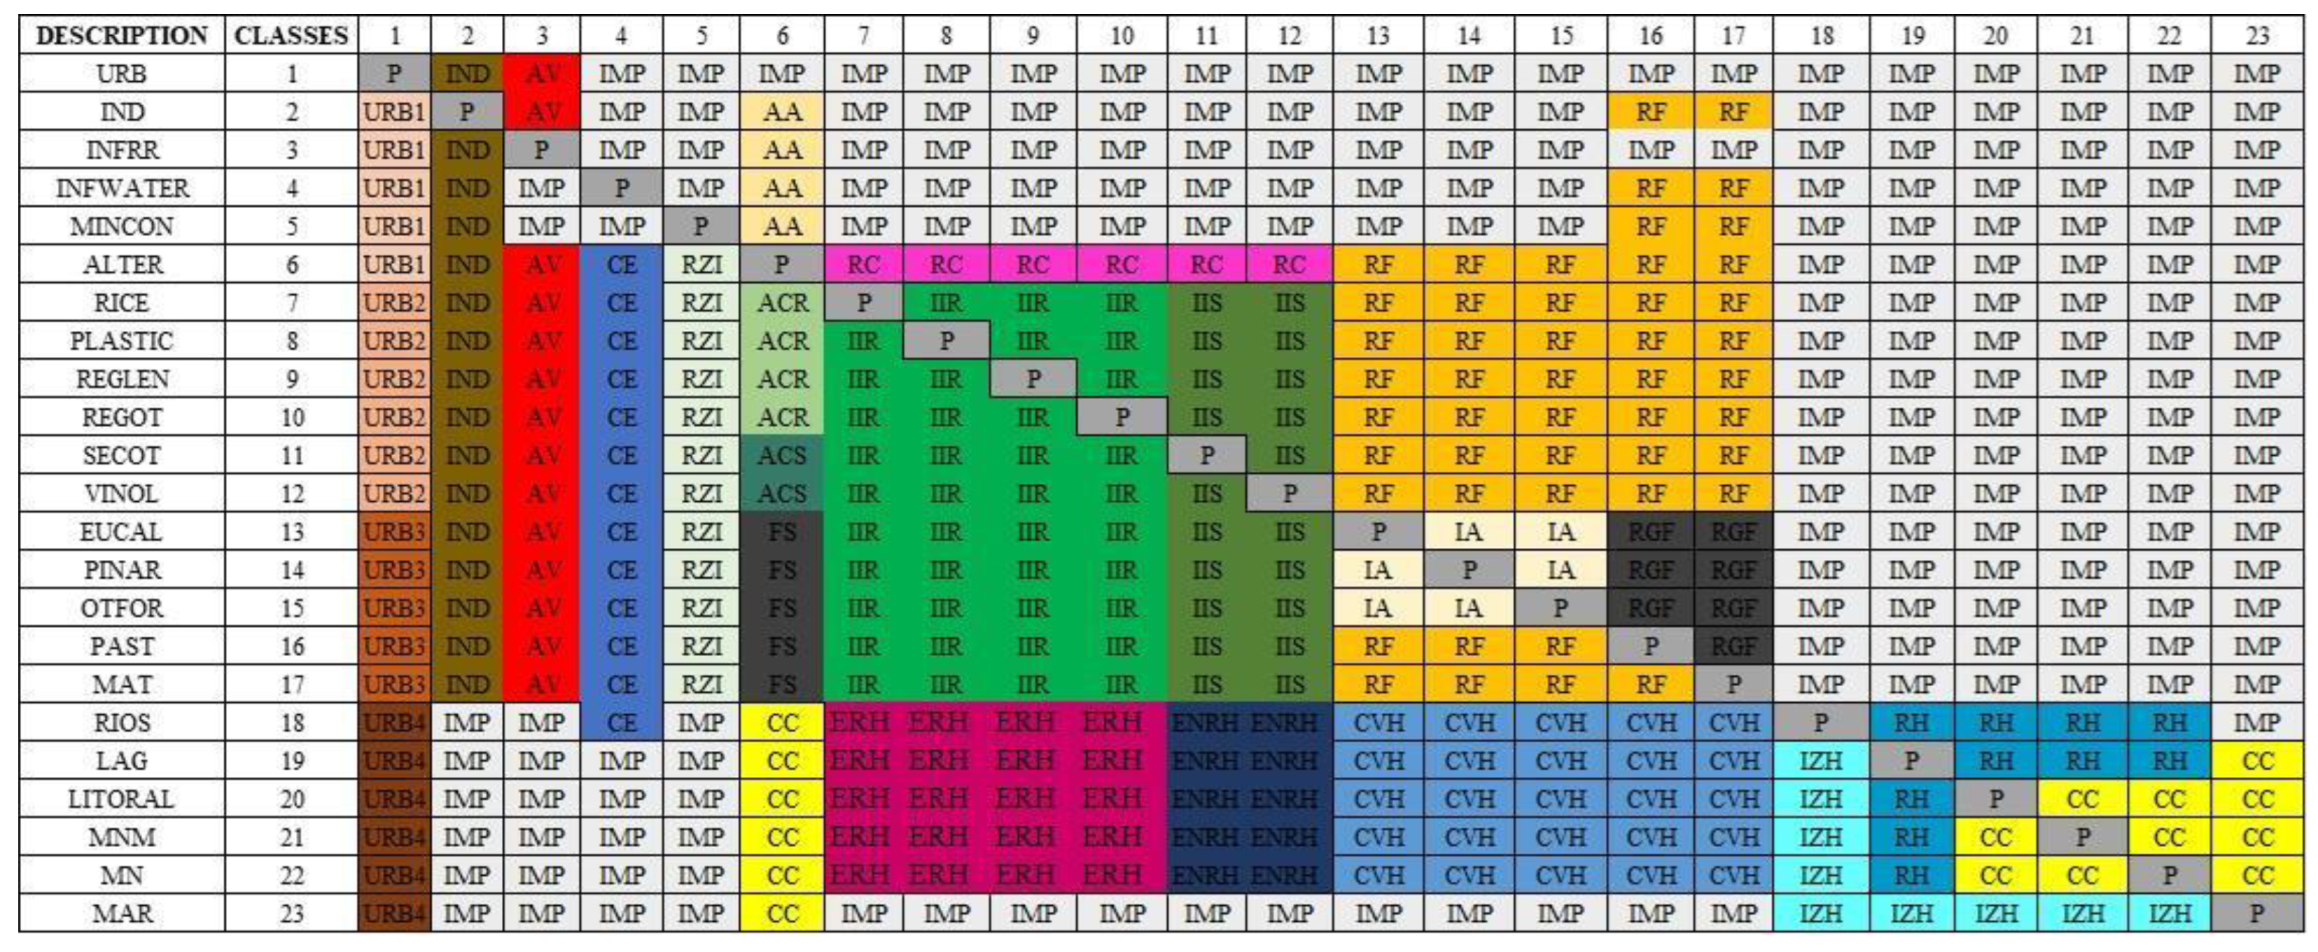
Figure 5.
Green Infrastructure Restricted Areas Map.
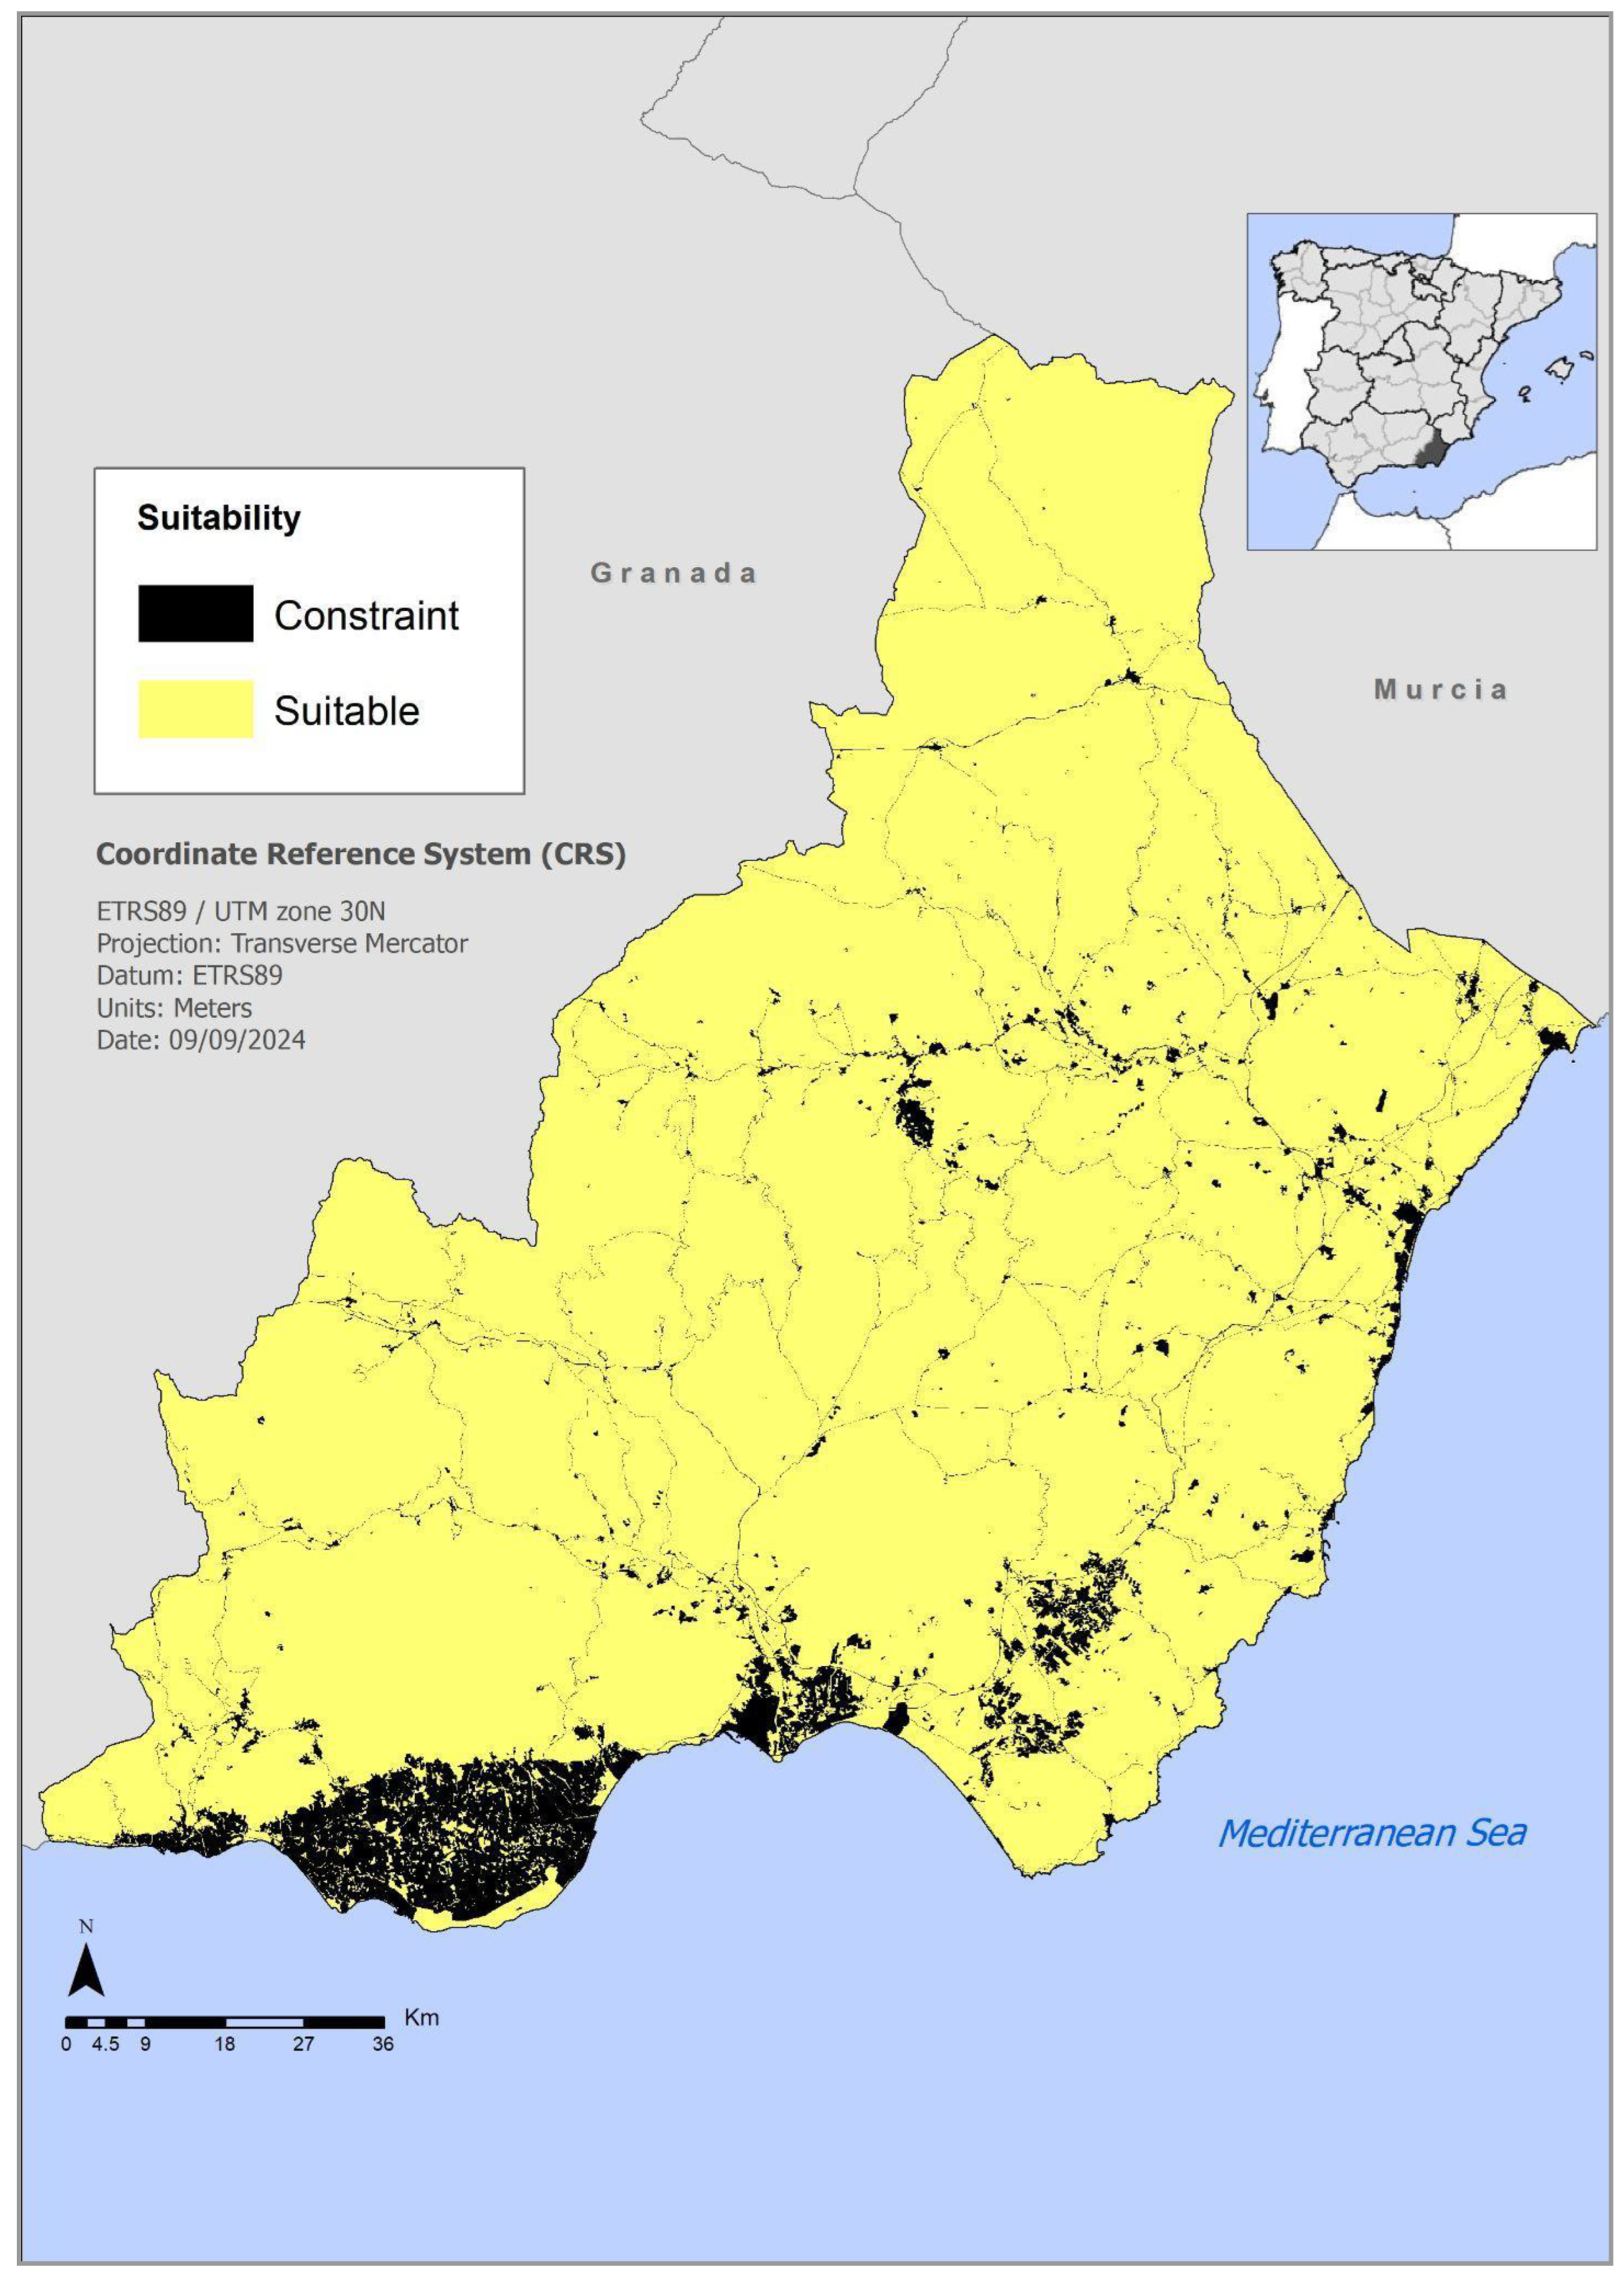
Figure 6.
Suitability map for Green Infrastructure in the province of Almería.
Figure 7.
Proposal for ecological corridors in the province of Almeria.
Figure 8.
Results of overlay analysis between ecological corridors and suitability for GI. Each bar corresponds to an ecological corridor identified in the connectivity analysis, ordered by surface area from left to right along the x-axis from largest to smallest. .
Figure 8.
Results of overlay analysis between ecological corridors and suitability for GI. Each bar corresponds to an ecological corridor identified in the connectivity analysis, ordered by surface area from left to right along the x-axis from largest to smallest. .

Table 1.
Weight of factors using the AHP method.
| Criteria (columns) | OWA | |||
|---|---|---|---|---|
| Factors (rows) | Biophysical | Social | Economic | Score |
| Weighting | 0.1047 | 0.637 | 0.2583 | – |
| Slope | 0.15 | 0.015705 | ||
| Aspect | 0.15 | 0.015705 | ||
| Proximity to forest areas | 0.7 | 0.07329 | ||
| Road Safety | 0.1 | 0.0637 | ||
| Presence of HCIs | 0.3 | 0.1911 | ||
| Proximity to linear corridors | 0.6 | 0.3822 | ||
| Land Use fragmentation | 0.6 | 0.15498 | ||
| Population Accessibility | 0.4 | 0.10332 | ||
Table 2.
Changes in land use-land cover between 1984 and 2007.
| Land Use-Land Cover | Surface area in 1984 (km2) | Surface area in 2007 (km2) | 1984-2007 difference (km2) | Growth 1984-2007 (index in base 100)2 |
|---|---|---|---|---|
| Urban | 72.89 | 119.42 | 46.53 | 63.89 |
| Industrial | 8.18 | 25.34 | 17.16 | 209.67 |
| Road, rail, air, port and other technical infrastructure | 16.80 | 39.46 | 22.66 | 134.86 |
| Water infrastructure, salt works and aquaculture | 11.95 | 17.64 | 5.69 | 47.59 |
| Mining, landfill and construction sites | 29.01 | 85.29 | 56.27 | 193.96 |
| Altered, eroded and felled | 204.99 | 113.63 | -91.36 | -44.57 |
| Intensive crops under plastic | 224.96 | 356.33 | 131.36 | 58.39 |
| Intensive crops: irrigated woody crops | 71.70 | 135.71 | 64.01 | 89.28 |
| Intensive crops: other irrigated crops | 531.30 | 424.85 | -106.45 | -20.04 |
| Rainfed crops: other rainfed crops | 1,964.20 | 1,783.31 | -180.89 | -9.21 |
| Rainfed crops: olive groves and vineyards | 31.99 | 63.37 | 31.38 | 98.10 |
| Eucalyptus plantations | 0.77 | 0.75 | -0.01 | -1.57 |
| Pine forests | 238.84 | 391.94 | 153.10 | 64.10 |
| Other woodland or mixed woodland | 30.90 | 42.48 | 11.58 | 37.48 |
| Pasture | 154.88 | 226.36 | 71.48 | 46.15 |
| Scrubland | 5,070.73 | 4,838.83 | -231.89 | -4.57 |
| Rivers and natural watercourses | 92.34 | 90.02 | -2.32 | -2.51 |
| Natural lagoons | 0.01 | 1.30 | 1.29 | 11,727.27 |
| Natural coastal system | 10.74 | 11.73 | 0.98 | 9.16 |
| Non-tidal marshland | 1.21 | 1.22 | 0.01 | 0.41 |
| Tidal marshland | 0.34 | 0.09 | -0.25 | -74.03 |
| Sea and tidal areas | 0.40 | 0.07 | -0.33 | -82.29 |
2 Index expressing the growth of each LULC class between the initial and final years, expressed in base 100 (1984). Source: Own elaboration based on data extracted from MUCVA (1984 and 2007).
Table 3.
Interannual growth of greenhouse area and hotel beds in the province of Almeria (2003-2017).
Table 3.
Interannual growth of greenhouse area and hotel beds in the province of Almeria (2003-2017).
| Total values | 2003 | 2007 | 2009 | 2011 | 2014 | 2017 |
|---|---|---|---|---|---|---|
| Greenhouse area (ha) | 32,671.20 | 35,632.60 | 31,475.17 | 31,418.20 | 31,811.39 | 30,055.40 |
| Hotel rooms (no.) | 24,258 | 33,301 | 28,858 | 29,290 | 28,498 | 29,465 |
| Interannual growth (%) | 2003-2007 | 2007-2009 | 2009-2011 | 2011-2014 | 2014-2017 | |
| Greenhouse area | 9.06 | -11,67 | -0.18 | 1.25 | -5.52 | |
| Hotel rooms | 37.28 | -13.34 | 1.50 | -2.70 | 3.39 |
Source: Own elaboration based on data extracted from MUCVA (2003 and 2007), SIOSE (2009 - 2017) and IECA, 2024 [74].
Table 4.
Correlation analysis between the multicriteria evaluation factors.
| S | A | pFA | RS | HCI | dLC | LUF | aUA | |
|---|---|---|---|---|---|---|---|---|
| S | -0.070 | -0.257 | -0.179 | -0.266 | 0.085 | 0.142 | -0.082 | |
| A | -0.070 | 0.059 | 0.038 | 0.023 | -0.022 | 0.067 | 0.037 | |
| pFA | -0.257 | 0.059 | 0.094 | -0.019 | 0.241 | 0.259 | 0.569 | |
| RS | -0.179 | 0.038 | 0.094 | 0.099 | -0.158 | 0.118 | 0.061 | |
| HCI | -0.266 | 0.023 | -0.019 | 0.099 | -0.105 | 0.169 | -0.079 | |
| dLC | 0.085 | -0.022 | 0.241 | -0.158 | -0.105 | -0.097 | 0.182 | |
| LUF | 0.142 | 0.067 | 0.259 | 0.118 | 0.169 | -0.097 | 0.181 | |
| aUA | -0.082 | 0.037 | 0.569 | 0.061 | -0.079 | 0.182 | 0.181 |
S=Slope; A=Aspect; pFA=Proximity to Forest Areas; RS=Road Safety; HCIs=Habitats of Community interest; dLC=distance to Linear Corridors; LUF=Land Uses Fragmentation; aUA=Accessibility from Urban Areas.
Table 5.
Connectivity analysis: ecological corridors.
| ID | Area (km2) | Landscape suitability | |||
|---|---|---|---|---|---|
| High (%) | Medium (%) | Low (%) | Null (%) | ||
| 1 | 63.88 | 26.40 | 15.46 | 56.83 | 1.31 |
| 2 | 50.64 | 25.79 | 18.13 | 53.69 | 2.39 |
| 3 | 43.32 | 1.54 | 47.62 | 42.59 | 8.25 |
| 4 | 36.21 | 10.93 | 49.35 | 15.41 | 24.31 |
| 5 | 35.33 | 25.91 | 40.85 | 32.41 | 0.82 |
| 6 | 34.75 | 22.14 | 21.76 | 52.99 | 3.12 |
| 7 | 21.64 | 35.90 | 38.90 | 12.41 | 12.80 |
| 8 | 20.78 | 18.61 | 10.90 | 70.50 | 0.00 |
| 9 | 19.61 | 9.07 | 6.00 | 84.93 | 0.00 |
| 10 | 18.14 | 31.26 | 24.21 | 35.04 | 9.49 |
| 11 | 14.76 | 17.76 | 38.00 | 19.39 | 24.85 |
| 12 | 14.24 | 7.24 | 37.24 | 55.52 | 0.00 |
| 13 | 13.21 | 20.04 | 36.58 | 43.38 | 0.00 |
| 14 | 7.71 | 0.05 | 96.96 | 0.44 | 2.55 |
| 15 | 5.59 | 13.68 | 46.27 | 15.72 | 24.32 |
Source: created by the authors.
Table 6.
Temporal evolution of landscape fragmentation in the territory occupied by protected areas, their surroundings and by green infrastructure candidate areas, data from the MSPA tool.
Table 6.
Temporal evolution of landscape fragmentation in the territory occupied by protected areas, their surroundings and by green infrastructure candidate areas, data from the MSPA tool.
| MUCVA1984 | |||||||||||||||||||
|---|---|---|---|---|---|---|---|---|---|---|---|---|---|---|---|---|---|---|---|
| Core | Background | Branch | Edge | Perforation | Islet | Bridge | Loop | Total | HFI | ||||||||||
| Nature Reserve | 5.59 | 0.18 | 0.01 | 0.11 | 0.14 | 0.00 | 0.00 | 0.00 | 6.02 | 1.94 | |||||||||
| National Park | 137.41 | 6.16 | 0.10 | 0.03 | 3.66 | 0.00 | 0.01 | 0.27 | 147.63 | 1.94 | |||||||||
| Natural Park | 887.28 | 68.70 | 1.54 | 1.09 | 20.63 | 0.10 | 0.41 | 0.64 | 980.39 | 1.91 | |||||||||
| Natural Site | 219.29 | 13.78 | 0.25 | 0.34 | 4.44 | 0.02 | 0.09 | 0.15 | 238.36 | 1.93 | |||||||||
| SAC | 1,326.78 | 42.15 | 1.50 | 1.30 | 17.25 | 0.04 | 0.64 | 0.84 | 1,390.50 | 1.96 | |||||||||
| Candidate GI | 468.05 | 109.88 | 2.15 | 3.62 | 19.00 | 0.20 | 0.57 | 0.79 | 604.25 | 1.79 | |||||||||
| Other PAs | 4.25 | 0.67 | 0.02 | 0.17 | 0.27 | 0.01 | 0.00 | 0.01 | 5.39 | 1.81 | |||||||||
| Buffer 5km | 2,712.75 | 767.22 | 14.01 | 27.86 | 115.45 | 2.03 | 5.34 | 3.69 | 3,648.35 | 1.76 | |||||||||
| MUCVA 2007 | |||||||||||||||||||
| Core | Background | Branch | Edge | Perforation | Islet | Bridge | Loop | Total | HFI | ||||||||||
| Nature Reserve | 5.56 | 0.18 | 0.01 | 0.12 | 0.15 | 0.00 | 0.00 | 0.00 | 6.02 | 1.94 | |||||||||
| National Park | 140.11 | 3.76 | 0.05 | 0.01 | 3.42 | 0.00 | 0.00 | 0.28 | 147.63 | 1.96 | |||||||||
| Natural Park | 885.03 | 69.55 | 1.64 | 1.50 | 21.08 | 0.10 | 0.63 | 0.86 | 980.39 | 1.91 | |||||||||
| Natural Site | 221.58 | 11.59 | 0.19 | 0.13 | 4.68 | 0.01 | 0.03 | 0.15 | 238.36 | 1.94 | |||||||||
| SAC | 1,314.32 | 49.64 | 1.60 | 2.51 | 20.51 | 0.06 | 0.80 | 1.07 | 1,390.50 | 1.95 | |||||||||
| Candidate GI | 488.74 | 86.32 | 2.06 | 6.30 | 18.66 | 0.27 | 0.81 | 1.10 | 604.25 | 1.82 | |||||||||
| Other PAs | 3.95 | 0.91 | 0.02 | 0.36 | 0.12 | 0.01 | 0.01 | 0.01 | 5.39 | 1.76 | |||||||||
| Buffer 5km | 2,582.43 | 879.06 | 16.79 | 49.95 | 106.28 | 2.18 | 7.21 | 4.46 | 3,648.35 | 1.72 | |||||||||
Source: created by the authors based on Gallardo & Martínez-Vega [34]. Values in km2.
Disclaimer/Publisher’s Note: The statements, opinions and data contained in all publications are solely those of the individual author(s) and contributor(s) and not of MDPI and/or the editor(s). MDPI and/or the editor(s) disclaim responsibility for any injury to people or property resulting from any ideas, methods, instructions or products referred to in the content. |
© 2024 by the authors. Licensee MDPI, Basel, Switzerland. This article is an open access article distributed under the terms and conditions of the Creative Commons Attribution (CC BY) license (http://creativecommons.org/licenses/by/4.0/).
Copyright: This open access article is published under a Creative Commons CC BY 4.0 license, which permit the free download, distribution, and reuse, provided that the author and preprint are cited in any reuse.


