Submitted:
09 October 2024
Posted:
09 October 2024
You are already at the latest version
Abstract
Trueperella pyogenes is a widely distributed opportunistic pathogenic bacterium which can infect livestock, wildlife, community animals, and humans, resulting in suppurative infection of tissue and organ mucosa, including pneumonia, liver abscessation, mastitis, metritis, endocarditis, and osteoarthritis. TP1804 and TP1808 were isolated from the uterine lavage fluid of cows with endometritis. Several virulence factors are significant contributors to the pathogenicity expressed by T. pyogenes, including purulent pyolysin (PLO), fimbriae (Fim), neuraminidase (NanH and NanP), and collagen-binding protein (CbpA). These virulence factors are contributed to promote adhesion, including fimbriae, extracellular matrix-binding proteins, and neuraminidases. This study analyzed the prokaryotic transcriptomics and proteomics of two strains of T. pyogenes with similar growth curves but different cytotoxicity. Studying the metabolic mechanisms of these differentially expressed genes and proteins can greatly promote the discovery of new biomarkers and improve the accuracy of biomarker identification, which is of great value for molecular mechanisms, biomarkers, early diagnosis of diseases, molecular typing, prognosis, and clinical diagnosis.
Keywords:
Trueperella pyogenes
; virulence
; transcriptome
; proteomic
; genomic analysis
1. Introduction
Trueperella pyogenes is a widely distributed opportunistic pathogenic bacterium which can infect livestock, wildlife, community animals, and humans, resulting in suppurative infection of tissue and organ mucosa, including pneumonia, liver abscessation, mastitis, metritis, endocarditis, and osteoarthritis [1-3]. It was formerly classified in the Actinomycetaceae family and was known as Arcanobacterium pyogenes but was reclassified as T. pyogenes according to the 16S rRNA sequence based on phylogenetic and chemotaxonomic observations [1, 2]. T. pyogenes have been isolated from edible animals in many countries around the world [3]. The infection of T. pyogenes can cause serious economic losses, and even lead to the elimination of infected animals, mainly in breeding cattle and pigs [3, 4].
Several virulence factors are significant contributors to the pathogenicity expressed by T. pyogenes, including purulent pyolysin (PLO), fimbriae (Fim), neuraminidase (NanH and NanP), and collagen-binding protein (CbpA) [5, 6]. The most important and primary virulence factor has been known as PLO encoded by plo gene [7, 8], which is associated with cell lysis and hemolysis [2, 9, 10]. Other virulence factors are related to adherence, colonization, and pathogenesis [8, 11]. Curiously, the in vitro study of Ibrahim et al. [12] exhibited significant differences in the expression of eight known virulence genes in T. pyogenes isolated from cows of different health states. This indicates the importance of the regulatory mechanisms of the virulence gene expression in the development of infection [8, 13]. Liu et al. [3] also reported significant differences in the cell lysis ability of T. pyogenes isolated from cow uterine lavage fluid. All these evidences demonstrate that the infection and pathogenicity of T. pyogenes may be attributed to other unknown bacterial factors.
Measuring the expression of RNA and proteins in pathogenic bacteria is fundamental for understanding bacterial pathogenicity and pathogenic mechanisms. This study may be the first to explore the pathogenicity and pathogenic mechanism of T. pyogenes through the combined analysis of proteins levels with transcript levels. These investigations could complement transcriptomic studies and supplies insights into post-transcriptional regulatory mechanisms [14], as well as into bacterial pathogenicity and pathogenic mechanisms.
This study analyzed the prokaryotic transcriptomics and proteomics of two strains of T. pyogenes with similar growth curves but different cytotoxicity. Our research findings emphasize the importance of comparing transcriptomic and proteomic analyses for bacterial pathogenicity and drug resistance. Our research further elucidates the differences in bacterial pathogenicity and drug resistance, providing a theoretical basis for clinical prevention of pyogenic occult bacterial infections.
2. Results
2.1. Bacterial Growth Characteristics and Toxicity
The growth curves of TP1804 and TP1808 were measured from 1 h to 24 h (Figure 1A). The growth curve can reflect the growth condition of bacteria and the time of bacteria to reach the logarithmic phase, which is of great significance. TP1804 and TP1804 both passed their mid-log phase at 11 h with similar growth curves.
Quantitative measurement of lactate dehydrogenase method was used to determine the cell mortality after 3 h, 6 h, and 9 h of challenge of TP1804 and TP1808 (Figure 1B). Comparing 3 h, 6 h, and 9 h, the cell death rates infected by TP1804 were a particularly higher than those of TP1808.
There was no significant difference between TP1804 and TP1808 at 3 h. Starting from 6 h, the cytotoxicity of TP1804 obviously increased and showed significant differences compared to TP1808 (P < 0.01).
2.2. Sample Correlation and Gene Expression Distribution
The correlation between gene expression levels among samples is an important indicator for testing the reliability of experiments and the rationality of sample selection (Figure 2A). The closer the correlation coefficient is to 1, the higher the similarity of expression patterns between samples [15].The correlation coefficients between groups and within group samples were calculated based on the fragments per kilobase million (FPKM) values of all genes in each sample and a heatmap was drawn to visually display the differences between group samples and the duplication of within group samples. The higher the correlation coefficient between samples, the closer their expression patterns are. It can be seen that the genes of the samples within the group are very close, while there are differences in the genes of the samples between groups.
Due to the influence of sequencing depth and gene length, RNA-seq gene expression values are generally not represented by read count, but by FPKM, which corrects sequencing depth and gene length in sequence. After calculating the expression values (FPKM) of all genes in each sample, the distribution of gene expression levels in different samples through a box plot was displayed (Figure 2B). The box plots for each region show five statistical measures (maximum upper quartile, median, lower quartile, and minimum).
2.3. Differential Gene Analysis
The volcano map visually displays the distribution of differentially expressed genes for each comparison combination, as shown in Figure 3A. The horizontal axis represents the expression fold change of genes in the treatment and control groups denoted by log2 (Fold Change) and the vertical axis represents the significance level of gene expression differences between the treatment and the control groups denoted by -log10 (paj) or - log10 (P-value). Upregulated genes are 607 and downregulated genes are 587.
Cluster analysis of differential gene is set for two or more experiments (Figure 3B). Group genes with similar expression patterns together, which may have common functions or participate in common metabolic and signaling pathways. The mainstream hierarchical clustering was used to cluster gene expression values and normalize the rows of expression data. Genes or samples with similar expression patterns in the heatmap will be clustered together. The colors in each square do not reflect the gene expression values, but the values obtained by normalizing the rows of expression data. Therefore, the colors in the heatmap can only be compared horizontally (the expression of the same gene in different samples), while cannot be compared vertically (the expression of different genes in the same sample). When comparing horizontally, red color indicates high gene expression and green color indicates low gene expression.
2.4. Enrichment Analysis
ClusterProfiler software was used to perform GO functional enrichment analysis and KEGG pathway enrichment analysis on differential gene sets. In Figure 4, it shows the enrichment analysis results of all significantly different genes for all combinations. The differential gene set is obtained from significant difference analysis and annotated to GO or KEGG databases, while the background gene set is of all genes subjected to significant difference analysis and annotated to GO or KEGG databases. The enrichment analysis results enrich all sets of differentially expressed genes, up-regulated differentially expressed genes, and downregulated differentially expressed genes for each differential comparison combination.
The most significant 30 terms from the GO enrichment analysis results were selected (Figure 4A). The horizontal axis represents GO Term and the vertical axis represents the significance level of GO Term enrichment. The higher the value, the more significant it is. Different colors represent the three GO subclasses biological process (BP), cellular component (CC), and molecular function (MF), respectively. The most 20 significant KEGG pathways from the KEGG enrichment results were select and a scatter plot was drawn (Figure 4B). The horizontal axis represents the ratio of the number of differentially expressed genes annotated onto the KEGG pathway to the total number of differentially expressed genes and the vertical axis represents the KEGG pathway. The size of the dots represents the number of genes annotated onto the KEGG pathway, and the color from red to purple represents the significance of enrichment.
2.5. Principal Component Analysis (PCA)
PCA is the process of dimensionality reduction of multiple variables into a few independent variables (Figure 5). In proteomic analysis, PCA reduces the large amount of protein expression information contained in the sample into a few independent principal components for comparison between groups, facilitating the identification of outlier samples and discrimination of sample clusters with high similarity. PCA was conducted on the abundance of proteins in different groups, reducing the dimensionality of sample grouping features and selecting two principal components to describe the specific expression of proteins in different groups. In Figure 5, the results show that samples within group gather together, while samples between group separate.
2.6. Pearson Correlation Analysis and Clustering Analysis
In order to reflect the correlation of protein expression between samples, this study calculated the Pearson correlation coefficient of all quantitative protein expression levels between every two samples (Figure 6A). The upper right triangle represents the Pearson correlation values between samples in color, as shown in the bar graph on the right. The lower left triangle represents the correlation coefficient value. The higher the value, the higher the degree of similarity is (maximum value is 1).
The heat map was used to express that proteins with similar patterns usually have functional correlations (Figure 6B). Using Euclidean distance as a matrix calculation formula, hierarchical clustering was performed on both the expressed proteins and samples simultaneously. The upper color bar represents a sample group for each color. The gradient from blue to red in the color bar on the right represents the level of expression, with darker blue indicating lower expression levels and darker red indicating higher expression levels. The protein expression within groups is similar, while there are differences in protein expression between groups.
2.7. Differential Expression Protein Analysis
For sample analysis with biological replicates, DESeq2 based on negative binomial distribution was conducted (Figure 7A). By comparing each sample group pairwise, identify the proteins with differential expression in different groups. The scattered dots in the figure represent proteins. Gray dots represent proteins with no significant differences. Red dots represent significantly upregulated differential proteins. Green dots represent significantly downregulated differential proteins. By delving deeper, we can identify the most distinct proteins for subsequent analysis. Figure 7B shows the ratio of the number of proteins to the total number at this difference multiple. In theory, the vast majority of proteins have no significant differences, so the peak position of FC should be around 0 and show a normal distribution.
2.8. Differential Protein Functional Enrichment Analysis
Based on the identification of all differentially expressed proteins, we conducted enrichment analysis using GO and KEGG, with the aim of detecting whether differentially expressed proteins have significant enrichment trends in certain functional types. GO functional significance enrichment analysis provides significantly enriched GO functional entries in differentially expressed proteins compared to all identified protein backgrounds, thereby indicating which biological functions are significantly correlated with differentially expressed proteins. GO is divided into three parts: molecular function, cellular component, and biological process. GO significance analysis can determine the main biological functions of differentially expressed proteins. The differential protein GO enrichment results are shown in Table 1 and the Candidate protein GO enrichment analysis is shown in Figure 8A. The figure shows the top 20 sub functions with highly significant corrected P-values.
In organisms, different genes coordinate with each other to perform their biological functions, and significant enrichment through pathways can determine the most important biochemical metabolic pathways and signal transduction pathways involved in candidate proteins. KEGG pathway enrichment analysis results of candidate proteins are shown in Table 2. The KEGG enrichment scatter plot of candidate proteins is a graphical display of KEGG enrichment analysis results (Figure 8B). The degree of KEGG enrichment is measured by Gene Ratio, p.adjust, and the number of genes enriched in this pathway. The gene ratio refers to the ratio of the number of genes located in the pathway entry among differentially expressed genes to the total number of genes located in the pathway entry among all annotated genes. The larger the rich factor, the greater the degree of enrichment is.
3. Discussion
T. pyogenes is a gram-positive organism characterized by hemolytic activity on blood agar [8]. It is often isolated from different parts or tissues of a variety of animals [1, 16]. Although T. pyogenes has been especially associated with bovine mastitis and endometritis, it is a well-known pathogenic bacterium of diverse clinical presentations among domestic ruminants, pigs, companion animals and gray slender lorises [2, 17]. Abscess caused by T. pyogenes in various tissues are among the most common infectious diseases in cattle, contributing to a large impact on milk production, fertility performance, livestock health and animal elimination from the herd [18], causing serious economic losses. T. pyogenes can also co-infect the host with other pathogenic bacteria, such as Escherichia coli, Streptococcus dysgalactiae, and Fusobacterium ssp., which could enhance the pathogenicity and antimicrobial resistance of T. pyogenes [5, 19].
This co-infection induced by T. pyogenes and other causative agents have been emphasized in other studies as the main challenges in infectious diseases of domestic animals [19]. However, surprisingly, the process and mechanism of co-infection have been rarely studied [5]. The presence and expression of adhesion and colonization factors encoding genes increase the virulence of T. pyogenes isolates in different tissues [19]. The virulence and intracellular viability of T. pyogenes in host infections are closely related to the synergistic effect of this pathogen in co-infection with other causative agents [20]. Some research reported that the expression levels of some virulence genes were increased in T. pyogenes in response to co-culture with F. necrophorum and E. coli [19, 21].
Our previous studies have shown that both TP1804 and TP1808 express genes of plo, nanP, cbpA, fimA, fimC, and fimE [3]. These virulence factors are contributed to promote adhesion, including fimbriae, extracellular matrix-binding proteins, and neuraminidases [1]. Fimbriae, including FimA, FimB, FimC, FimE, and FimG, involve in adhesion and the colonization of host tissue [22]. The collagen-binding protein A (CbpA) is also expressed by T. pyogenes to associate with adhesion and improve colonization by binding to extracellular matrix compounds on the surface of mammalian cells [23]. The expression leves of virulence genes are of importance to the pathogenicity of T. pyogenes [24]. However, the establishment and development of the T. pyogenes infection may not only originate from these known factors, but also from other unknown virulence factors [3, 8]. It is frustrating that these unknown virulence factors have been rarely studied in depth.
Soto, et al. reported that bacteria obtain resistance may be associated with the virulence and acquirement of resistance which may stimulate an increase or decrease of virulence [25, 26]. The synergistic effect and co-evolution of virulence and resistance genes may help T. pyogenes evade the threat of host immunity and antibiotics. Virulence and resistance genes may be carried in the same mobile genetic unit, allowing them to be transferred between the same or different strains [27]. However, more research is needed to understand the specific mechanisms of the genetic process of these genes.
In the current study, we conducted prokaryotic transcriptomics and proteomics to explore the genetic characteristics between different T. pyogenes. In future research, we will continue to explore potential key genes and differentially expressed proteins with significant differences and identify target genes and proteins. Studying the metabolic mechanisms of these differentially expressed genes and proteins can greatly promote the discovery of new biomarkers and improve the accuracy of biomarker identification, which is of great value for molecular mechanisms, biomarkers, early diagnosis of diseases, molecular typing, prognosis, and clinical diagnosis.
4. Materials and Methods
2.1. Strain and Culture Medium
The strains of T. pyogenes TP1804 and TP1808 used in this study were isolated from dairy cow uterine lavage fluid and stored in 25% glycerol at -80 ℃. Sheep blood culture medium and Brain-Heart Infusion (BHI) Broth were used for bacterial isolation and activation. The growth conditions of the two strains of bacteria are completely identical.
2.2. Bacterial Growth Curves
To examine different growth rates of T. pyogenes, bacterial growth curves were measured for TP1804 and TP1808 with Turbidity meter (BioMérieux, Durham, NC, United States). Sterilized turbidity tubes (Solarbio, Beijing, China) were added with 1 mL BHI broth and bacterial solution was dropped until its turbidity is 0.2 Mcfarland Standard (MCF). Each T. pyogenes was repeated three times. The plate was placed in the microplate reader (Tecan, Switzerland) at 37 ℃ and measured OD600 every hour for a continuously 24 h measurement.
2.3. Lactate Dehydrogenase (LDH) Assay
The cytotoxicity was evaluated with LDH Cytotoxicity Assay (Beyotime, Beijing, China) following the instructions of manufacturer. The release of LDH into supernatant from control cells (Medium alone) and cells challenged by TP1804 and TP1808 (1 106 CFU/well) for 9 h was measured. A maximum-lysis control was used for uninfected cells. Cells were washed with PBS for three times and incubated with 100 μL Trypsin-EDTA (0.25%, Gibico, Waltham, MA, USA) for 4 min after the supernatant collected for LDH measurement and bacteria counting. F-12 medium (1:1, 900 μL) was added into each well and pipetted completely for cell counting. The results cytotoxicity or mortality (%) were calculated by the following formula: % cytotoxicity = (infected LDH - control LDH)/(max lysis LDH - correction volume LDH - control LDH + background LDH) × 100%.
2.4. RNA Extraction and Transcriptomic Analysis
Total RNA was extracted with a RNAprep Pure Cell/Bacterial Kit (TIangen Biotech Co., LTD, Beijing, China) following the manufacturer’s instruction [28]. The purity and integrity of total RNA were analyzed by agarose gel electrophoresis, Nanodrop (OD 260/280 ratio), Qubit 2.0, and Agilent 2100. A TruSeqTM Stranded Total RNA Libraay Prep Kit was used to generate sequencing libraries. Sequencing was carried out by Wekemo Tech Co., Ltd. (Shenzhen China) on the Illumina (Miseq/Hiseq) platform. The quality control on the raw sequencing data of each sample was used FastP software to perform and clean data were obtained for downstream analysis.
For organisms with high gene density such as bacteria, Bowtie2 software was used to perform genomic localization analysis on the filtered sequences [29]. If the reference genome selection is appropriate and there is no contamination in the relevant experiments, the proportion of sequencing reads successfully aligned to the genome generated by the experiment will be higher than 70% (Total Mapped Reads or Fragments), with the percentage of sequencing sequences with multiple loci (Multiple Mapped Reads or Fragments) usually not exceeding 10% of the total. ClusterProfiler (https://bioconductor.org/packages/clusterProfiler/) was used to perform Gene Ontology (GO) functional enrichment analysis and the Kyoto Encyclopedia of Genes and Genomes (KEGG) pathway enrichment analysis on differential gene sets. The differential gene set is obtained from significant difference analysis and annotated to GO or KEGG databases, while the background gene set is of all genes subjected to significant difference analysis and annotated to GO or KEGG databases. The enrichment analysis results enrich all sets of differentially expressed genes, up-regulated differentially expressed genes and downregulated differentially expressed genes, for each differential comparison combination. After the quantification of gene expression is completed, statistical analysis of its expression data is required to screen for genes with significant differences in expression levels in different states of the sample.
2.5. Proteomic Analysis
Protein was extracted as pervious described [28]. Briefly, each sample was washed for three times with sterilized PBS and 1 mL of radio-immunoprecipitation assay (RIPA, Solarbio, Beijing, China) buffer containing 1% phenylmethylsulfonyl fluoride (PMSF, Solarbio, Beijing, China) was added in each sample and grind for 5 min at 4 ℃. The mixture was centrifugation at 12,000 × g for 15 min at 4 ℃ after incubating with rotation at 4 ℃ for 10 min. The nano LC-MS/MS analysis of peptides were performed by Wekemo Tech Co., Ltd. (Shenzhen China). Based on the identification of all differentially expressed proteins, enrichment analyses were conducted through GO and KEGG to detect whether differentially expressed proteins have significant enrichment trends in certain functional types. The experiment was repeated three times.
2.6. Statistical Analysis
All experiments were repeated three times and data were exhibits as mean value with standard deviation. The screening criteria for significantly differentially expressed genes are FDR < 0.05, and with the additional criterial of |log2 (fold change) |>1. The differentially expressed proteins were screened by the criteria of fold change > 1.2 (over 1.2-fold upregulation) or < 0.83 (down-regulation) and P < 0.05 were considered statistically significant [30].
5. Conclusions
TP1804 and TP1808 were isolated from the uterine lavage fluid of cows with endometritis. They were demonstrated as T. pyogenes strains through colony morphology, 16S rRNA gene sequence, and whole genome comparison. This study conducted a deep comparison between two strains of T. pyogenes strains with significant differences in virulence through prokaryotic transcriptomics and proteomics to explain the genetic characteristics of T. pyogenes. Future research will conduct confirmatory exploration of significantly differentially expressed genes.
Author Contributions
Conceptualization, N.L. and Q.S.; methodology, N.L. and Q.L.; software, N.L.; validation, N.L. and Q.S.; formal analysis, N.L.; investigation, N.L.; resources, N.L. and Q.S.; data curation, N.L.; writing—original draft preparation, N.L.; writing—review and editing, N.L. and Q.S.; visualization, N.L.; supervision, Q.S.; project administration, N.L.; funding acquisition, N.L. All authors have read and agreed to the published version of the manuscript.
Funding
This research was funded by the National Key R&D program of China (Grant No. 2023YFD1801100) and the program for Postdoctoral of Heilongjiang Province (project No. LBH-Z23085).
Data Availability Statement
All experimental data are included in this article.
Acknowledgments
Thank Professor Zhu and professor Wang for providing experimental materials to support this project.
Conflicts of Interest
The authors declare no conflicts of interest.
References
- Zhang, Z.; Liang, Y.; Yu, L.; Chen, M.; Guo, Y.; Kang, Z.; Qu, C.; Tian, C.; Zhang, D. .Liu, M. TatD DNases Contribute to Biofilm Formation and Virulence in Trueperella pyogenes. Front Microbiol. 2021, 12, 758465. [Google Scholar]
- Qin, L.; Meng, F.; He, H.; Yang, Y.B.; Wang, G.; Tang, Y.D.; Sun, M.; Zhang, W.; Cai, X. .Wang, S. A Virulent Trueperella pyogenes Isolate, Which Causes Severe Bronchoconstriction in Porcine Precision-Cut Lung Slices. Front Vet Sci. 2021, 8, 824349. [Google Scholar] [CrossRef] [PubMed]
- Liu, N.; Shan, Q.; Wu, X.; Xu, L.; Li, Y.; Wang, J.; Wang, X. .Zhu, Y. Phenotypic Characteristics, Antimicrobial Susceptibility and Virulence Genotype Features of Trueperella pyogenes Associated with Endometritis of Dairy Cows. Int J Mol Sci. 2024, 25. [Google Scholar]
- Risseti, R.M.; Zastempowska, E.; Twaruzek, M.; Lassa, H.; Pantoja, J.C.F.; de Vargas, A.P.C.; Guerra, S.T.; Bolanos, C.A.D.; de Paula, C.L.; Alves, A.C. , et al. Virulence markers associated with Trueperella pyogenes infections in livestock and companion animals. Lett Appl Microbiol. 2017, 65, 125–132. [Google Scholar] [CrossRef]
- Ashrafi Tamai, I.; Mohammadzadeh, A.; Zahraei Salehi, T. .Mahmoodi, P. Genomic characterisation, detection of genes encoding virulence factors and evaluation of antibiotic resistance of Trueperella pyogenes isolated from cattle with clinical metritis. Antonie Van Leeuwenhoek. 2018, 111, 2441–2453. [Google Scholar] [CrossRef]
- Shan, Q.; Ma, W.; Li, B.; Li, Q.; Wang, X.; Li, Y.; Wang, J.; Zhu, Y. .Liu, N. Revealing the Mechanism of NLRP3 Inflammatory Pathway Activation through K(+) Efflux Induced by PLO via Signal Point Mutations. Int J Mol Sci. 2024, 25. [Google Scholar] [CrossRef]
- Tamai, I.A.; Mohammadzadeh, A.; Mahmoodi, P.; Pakbin, B. .Salehi, T.Z. Antimicrobial susceptibility, virulence genes and genomic characterization of Trueperella pyogenes isolated from abscesses in dairy cattle. Res Vet Sci. 2023, 154, 29–36. [Google Scholar] [CrossRef]
- Rzewuska, M.; Kwiecien, E.; Chrobak-Chmiel, D.; Kizerwetter-Swida, M.; Stefanska, I. .Gierynska, M. Pathogenicity and Virulence of Trueperella pyogenes: A Review. Int J Mol Sci. 2019, 20. [Google Scholar] [CrossRef]
- Zhao, K.; Liu, M.; Zhang, X.; Wang, H. .Yue, B. In vitro and in vivo expression of virulence genes in Trueperella pyogenes based on a mouse model. Vet Microbiol. 2013, 163, 344–350. [Google Scholar] [CrossRef]
- Jost, B.H. .Billington, S.J. Arcanobacterium pyogenes: molecular pathogenesis of an animal opportunist. Antonie Van Leeuwenhoek. 2005, 88, 87–102. [Google Scholar] [CrossRef]
- Ashrafi Tamai, I.; Mohammadzadeh, A.; Zahraei Salehi, T.; Mahmoodi, P. .Pakbin, B. Investigation of antimicrobial susceptibility and virulence factor genes in Trueperella pyogenes isolated from clinical mastitis cases of dairy cows. Food Sci Nutr. 2021, 9, 4529–4538. [Google Scholar] [CrossRef] [PubMed]
- Ibrahim, M.; Peter, S.; Wagener, K.; Drillich, M.; Ehling-Schulz, M.; Einspanier, R. .Gabler, C. Bovine Endometrial Epithelial Cells Scale Their Pro-inflammatory Response In vitro to Pathogenic Trueperella pyogenes Isolated from the Bovine Uterus in a Strain-Specific Manner. Front Cell Infect Microbiol. 2017, 7, 264. [Google Scholar] [CrossRef] [PubMed]
- Rudnick, S.T.; Jost, B.H. .Billington, S.J. Transcriptional regulation of pyolysin production in the animal pathogen, Arcanobacterium pyogenes. Vet Microbiol. 2008, 132, 96–104. [Google Scholar] [CrossRef] [PubMed]
- Jiang, L.; Wang, M.; Lin, S.; Jian, R.; Li, X.; Chan, J.; Dong, G.; Fang, H.; Robinson, A.E.; Consortium, G.T. .Snyder, M.P. A Quantitative Proteome Map of the Human Body. Cell. 2020, 183, 269–283 e219. [Google Scholar] [CrossRef] [PubMed]
- Patro, R.; Mount, S.M. .Kingsford, C. Sailfish enables alignment-free isoform quantification from RNA-seq reads using lightweight algorithms. Nat Biotechnol. 2014, 32, 462–464. [Google Scholar] [CrossRef]
- Galan-Relano, A.; Gomez-Gascon, L.; Barrero-Dominguez, B.; Luque, I.; Jurado-Martos, F.; Vela, A.I.; Sanz-Tejero, C. .Tarradas, C. Antimicrobial susceptibility of Trueperella pyogenes isolated from food-producing ruminants. Vet Microbiol. 2020, 242, 108593. [Google Scholar] [CrossRef]
- Ribeiro, M.G.; Risseti, R.M.; Bolanos, C.A.; Caffaro, K.A.; de Morais, A.C.; Lara, G.H.; Zamprogna, T.O.; Paes, A.C.; Listoni, F.J. .Franco, M.M. Trueperella pyogenes multispecies infections in domestic animals: a retrospective study of 144 cases (2002 to 2012). Vet Q. 2015, 35, 82–87. [Google Scholar] [CrossRef]
- Dore, E.; Fecteau, G.; Helie, P. .Francoz, D. Liver abscesses in Holstein dairy cattle: 18 cases (1992-2003). J Vet Intern Med. 2007, 21, 853–856. [Google Scholar] [CrossRef]
- Tamai, I.A.; Mohammadzadeh, A.; Salehi, T.Z.; Mahmoodi, P. .Pakbin, B. Expression of virulence factor genes in co-infections with Trueperella pyogenes isolates and other bacterial pathogens; an in vivo study. Microb Pathog. 2022, 164, 105435. [Google Scholar] [CrossRef]
- Santos, T.M.; Caixeta, L.S.; Machado, V.S.; Rauf, A.K.; Gilbert, R.O. .Bicalho, R.C. Antimicrobial resistance and presence of virulence factor genes in Arcanobacterium pyogenes isolated from the uterus of postpartum dairy cows. Vet Microbiol. 2010, 145, 84–89. [Google Scholar] [CrossRef]
- Verhaegh, S.J.; Flores, A.R.; van Belkum, A.; Musser, J.M. .Hays, J.P. Differential virulence gene expression of group A Streptococcus serotype M3 in response to co-culture with Moraxella catarrhalis. PLoS One. 2013, 8, e62549. [Google Scholar] [CrossRef] [PubMed]
- Liu, M.; Wang, B.; Liang, H.; Ma, B.; Wang, J. .Zhang, W. Determination of the expression of three fimbrial subunit proteins in cultured Trueperella pyogenes. Acta Vet Scand. 2018, 60, 53. [Google Scholar] [CrossRef] [PubMed]
- Pietrocola, G.; Valtulina, V.; Rindi, S.; Jost, B.H. .Speziale, P. Functional and structural properties of CbpA, a collagen-binding protein from Arcanobacterium pyogenes. Microbiology (Reading). 2007, 153, 3380–3389. [Google Scholar] [CrossRef] [PubMed]
- Alkasir, R.; Wang, J.; Gao, J.; Ali, T.; Zhang, L.; Szenci, O.; Bajcsy, A.C. .Han, B. Properties and antimicrobial susceptibility of Trueperella pyogenes isolated from bovine mastitis in China. Acta Vet Hung. 2016, 64, 1–12. [Google Scholar] [CrossRef] [PubMed]
- Cepas, V. .Soto, S.M. Relationship between Virulence and Resistance among Gram-Negative Bacteria. Antibiotics (Basel). 2020, 9. [Google Scholar]
- Dong, W.L.; Liu, L.; Odah, K.A.; Atiah, L.A.; Gao, Y.H.; Kong, L.C. .Ma, H.X. Antimicrobial resistance and presence of virulence factor genes in Trueperella pyogenes isolated from pig lungs with pneumonia. Trop Anim Health Prod. 2019, 51, 2099–2103. [Google Scholar] [CrossRef]
- Schroeder, M.; Brooks, B.D. .Brooks, A.E. The Complex Relationship between Virulence and Antibiotic Resistance. Genes (Basel). 2017, 8. [Google Scholar] [CrossRef]
- Zhao, Y.; Min, H.; Luo, K.; Zhang, R.; Chen, Q. .Chen, Z. Transcriptomics and proteomics revealed the psychrotolerant and antibiotic-resistant mechanisms of strain Pseudomonas psychrophila RNC-1 capable of assimilatory nitrate reduction and aerobic denitrification. Sci Total Environ. 2022, 820, 153169. [Google Scholar] [CrossRef]
- Langmead, B. Salzberg, S.L. Fast gapped-read alignment with Bowtie 2. Nat Methods. 2012, 9, 357–359.
- Liu, S.; Liu, Y. .Zhang, J. Proteomic mechanisms for the regulation of growth, photosynthetic activity and nitrogen fixation in Nostoc sp. PCC 7120 exposed to three antibiotic contaminants. Ecotoxicol Environ Saf. 2021, 225, 112753. [Google Scholar] [CrossRef]
Figure 1.
Growth curves (A) and cytotoxicity (B). (A) Bacterial growth curves of TP1804 and TP1808 for 24 h. (B) Cytotoxicity of TP1804 and TP 1808 for 3 h, 6 h, and 9 h. The mean ± SEM of data is shown from three independent repeats (**P < 0.01, ***P < 0.001).
Figure 1.
Growth curves (A) and cytotoxicity (B). (A) Bacterial growth curves of TP1804 and TP1808 for 24 h. (B) Cytotoxicity of TP1804 and TP 1808 for 3 h, 6 h, and 9 h. The mean ± SEM of data is shown from three independent repeats (**P < 0.01, ***P < 0.001).
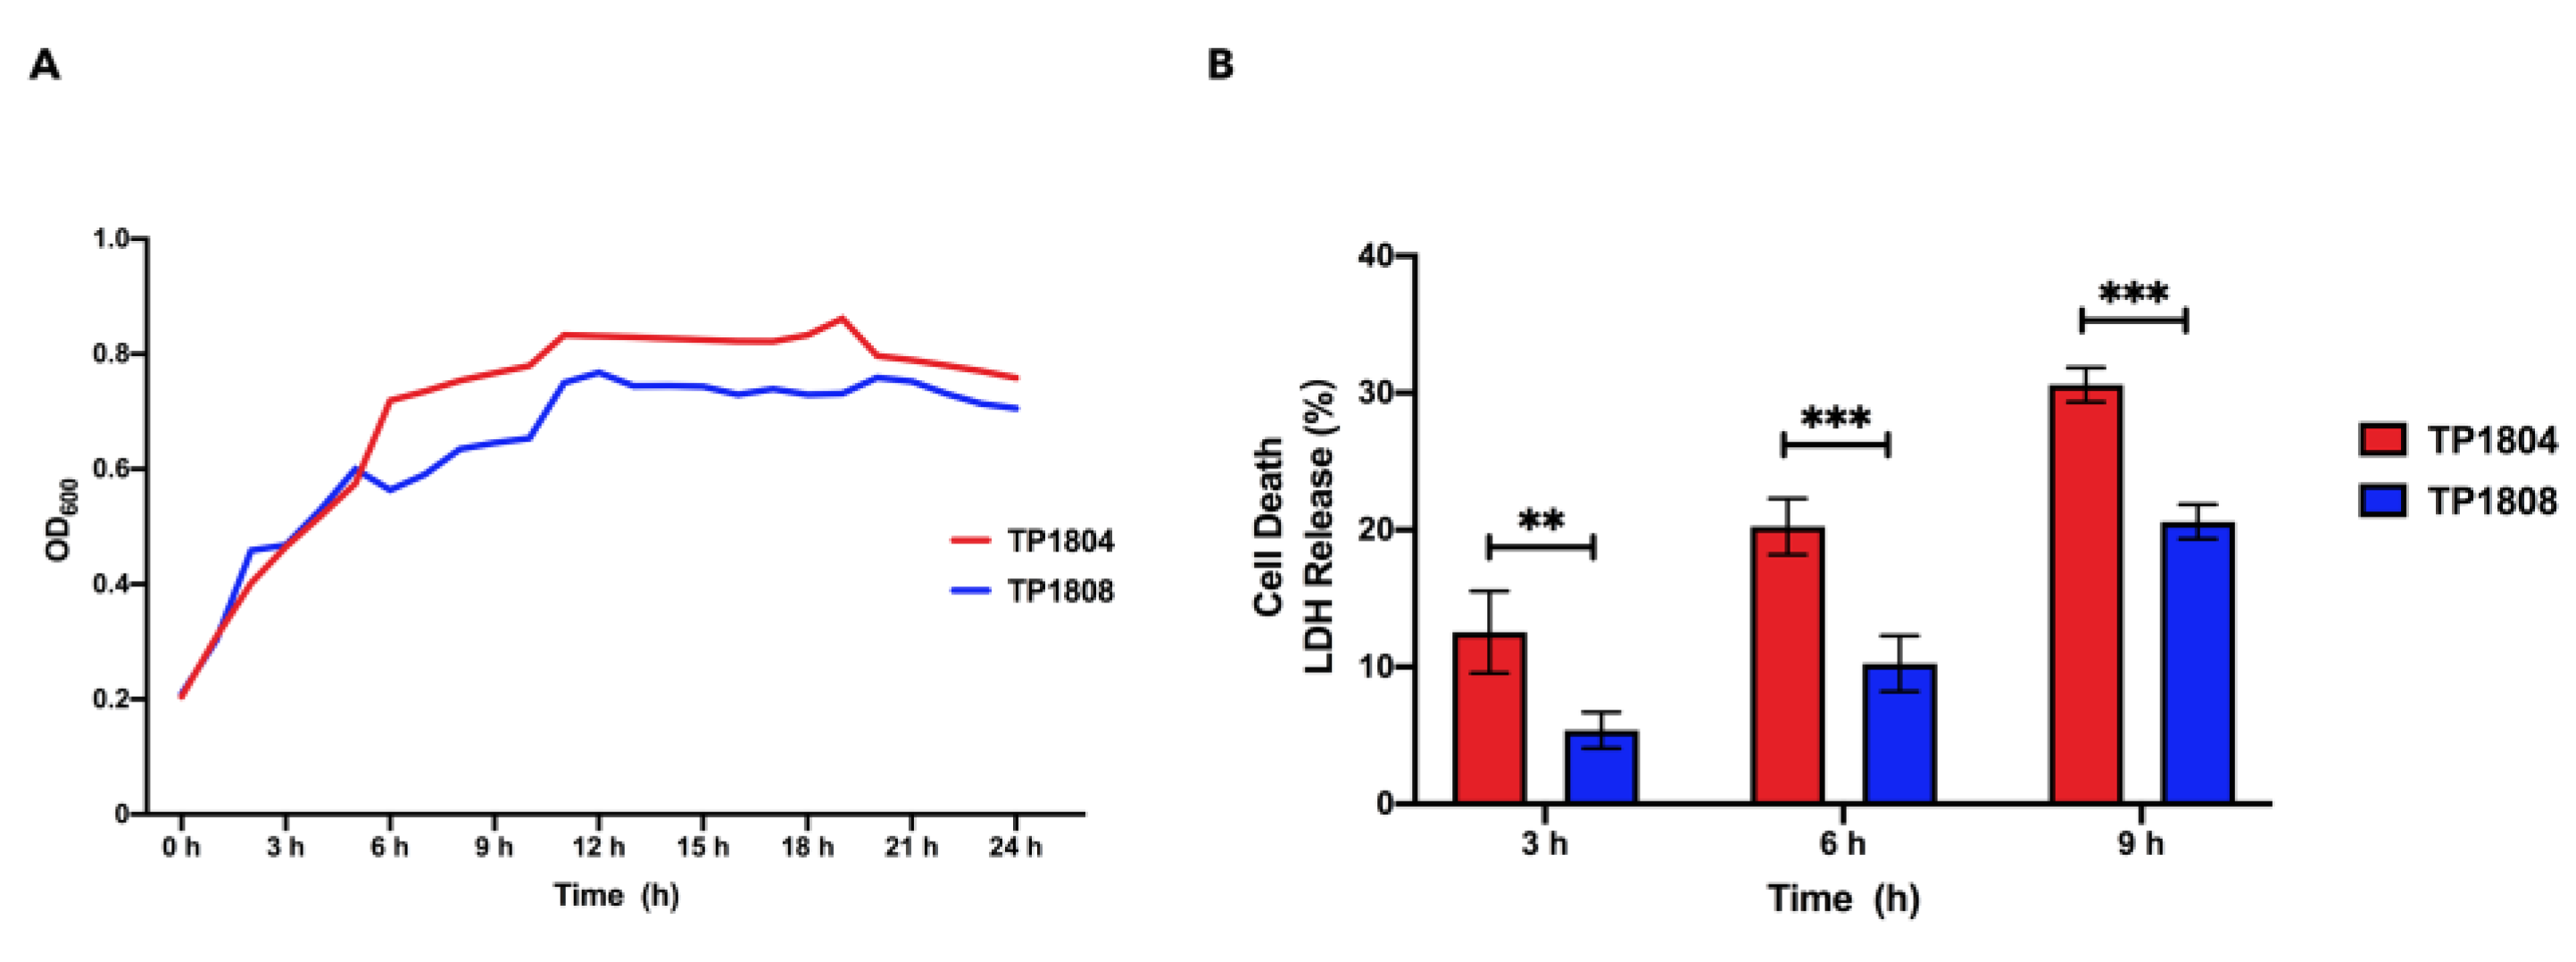
Figure 2.
Gene expression correlation (A) and gene expression box plot (B). (A) The horizontal and vertical axes represent the squared correlation coefficients of each sample; (B) The horizontal axis represents the sample name and the vertical axis represents log2 (FPKM+1).
Figure 2.
Gene expression correlation (A) and gene expression box plot (B). (A) The horizontal and vertical axes represent the squared correlation coefficients of each sample; (B) The horizontal axis represents the sample name and the vertical axis represents log2 (FPKM+1).
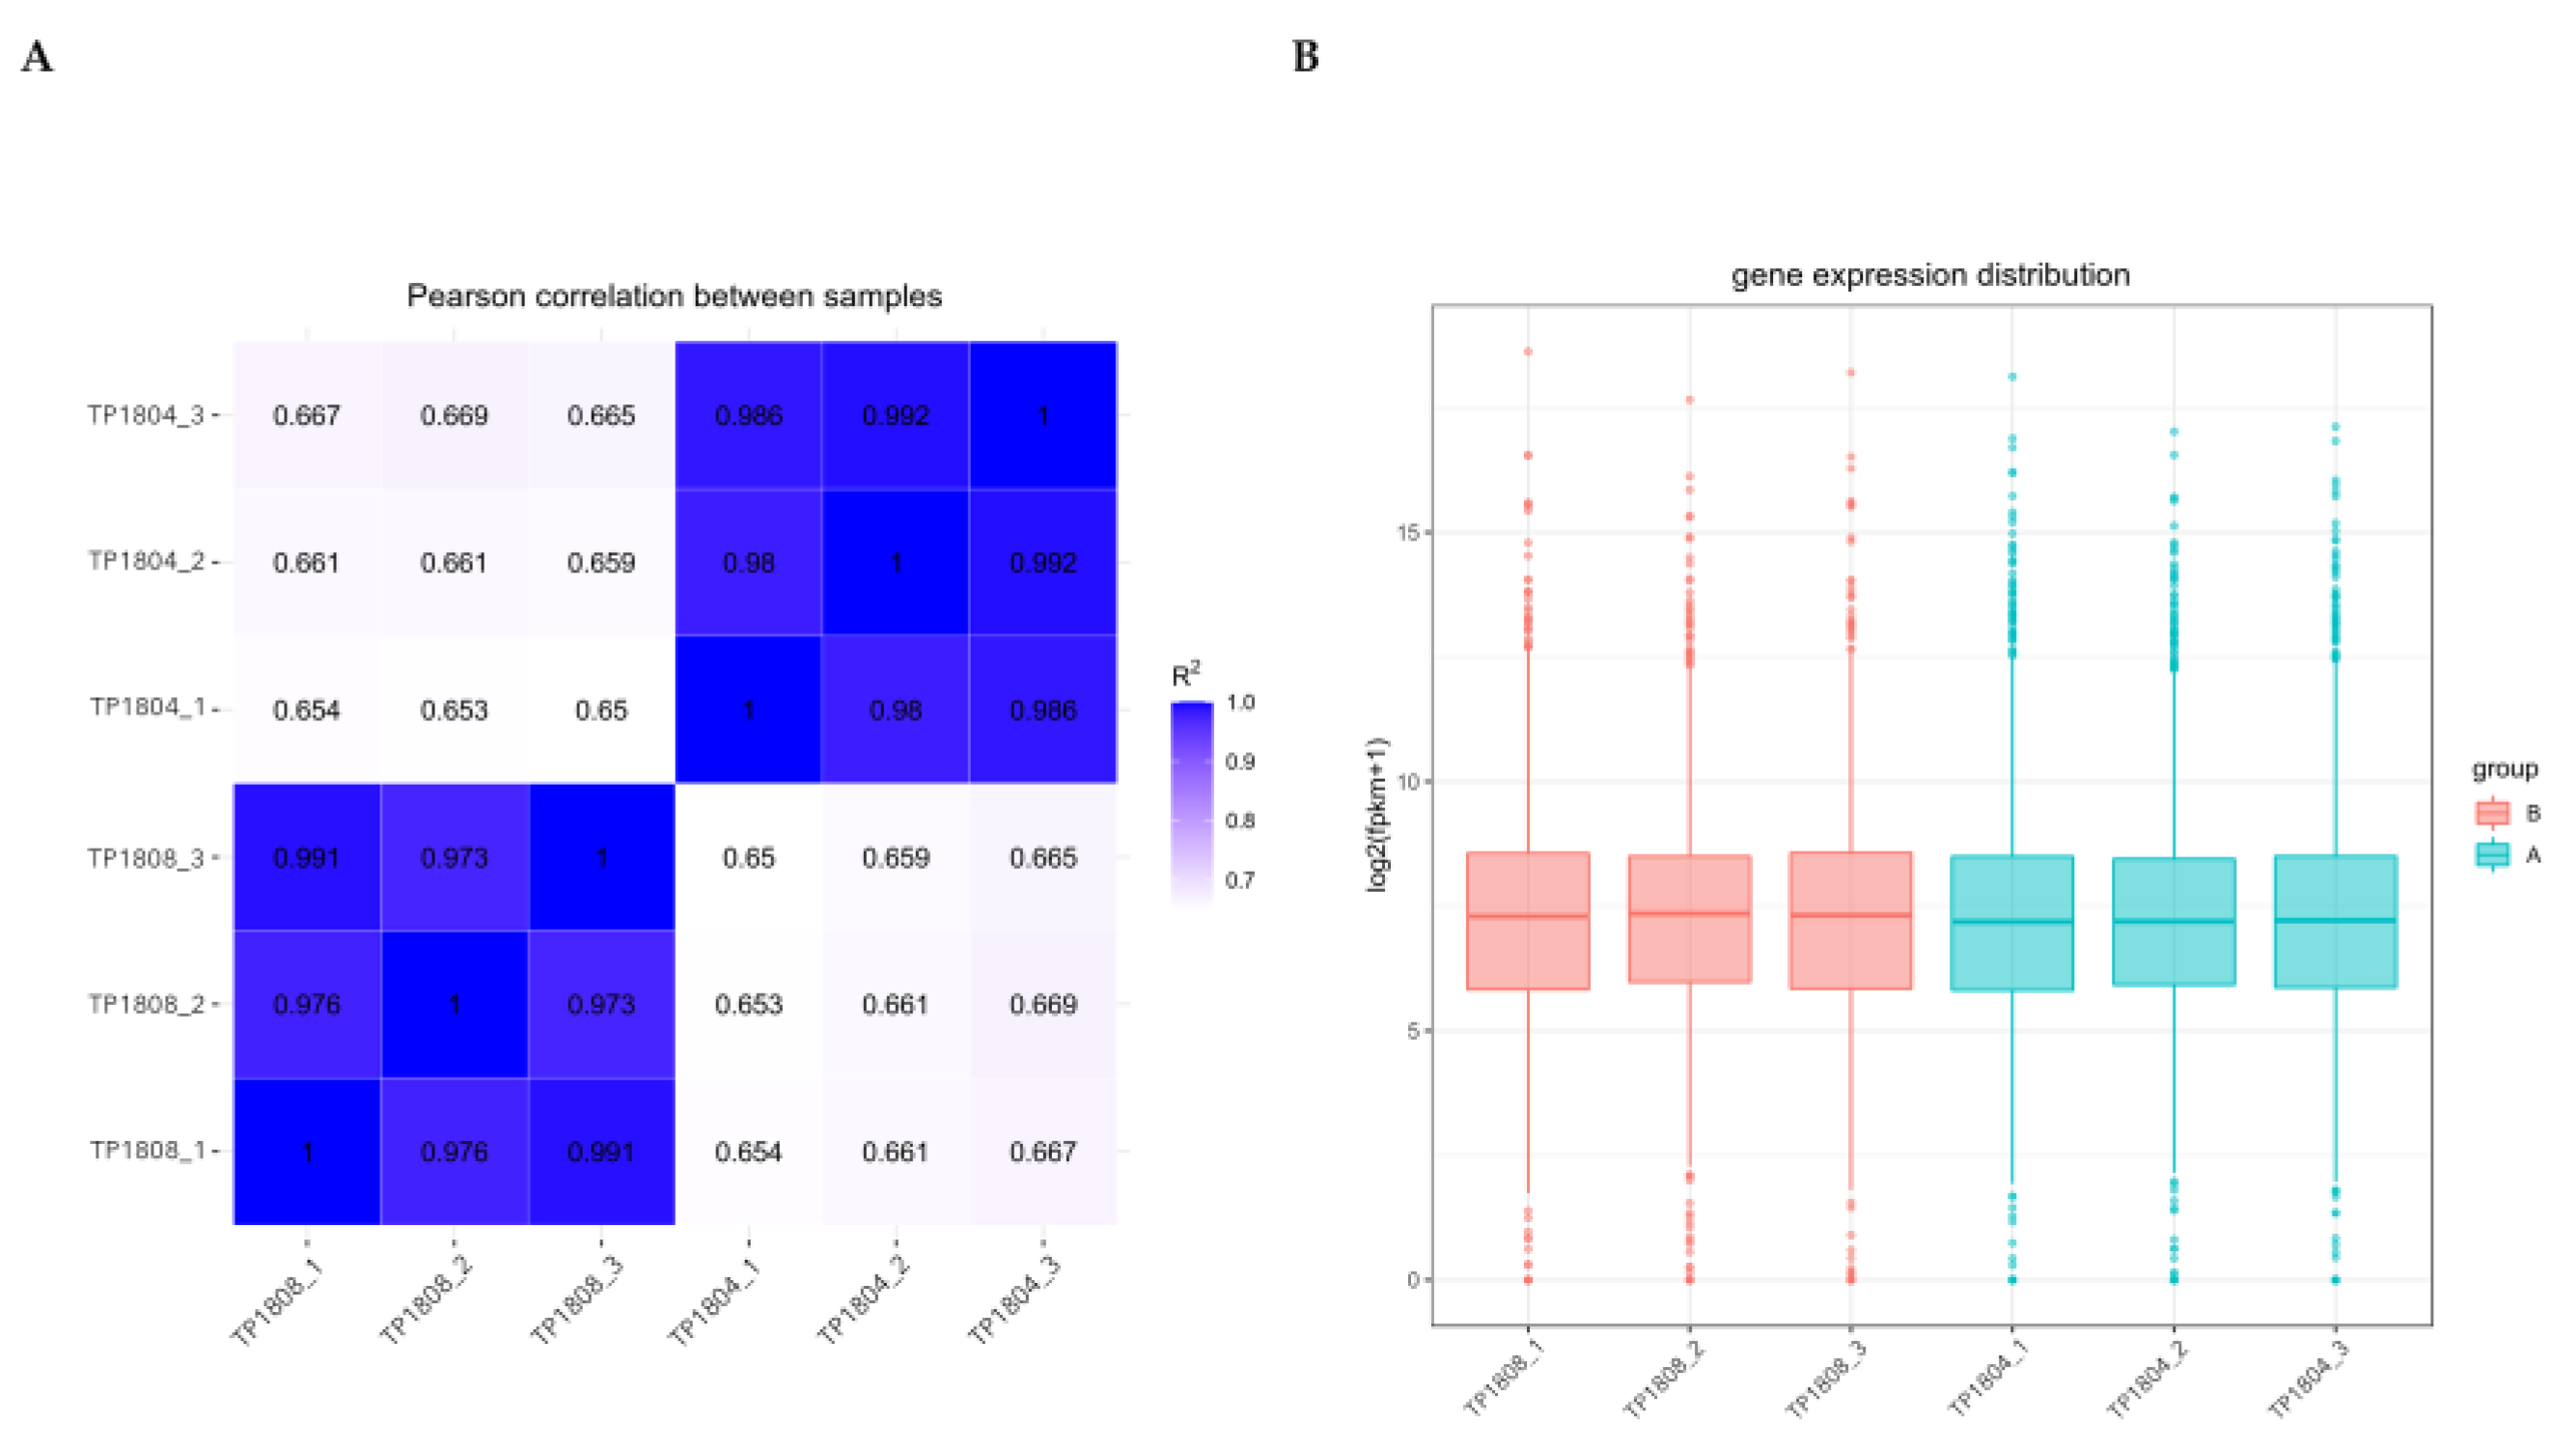
Figure 3.
Volcano map of differential gene analysis (A) and Differential gene clustering heatmap (B). (A) The horizontal axis presents the log2 (Fold Change) and the vertical axis represents -log10 (paj) or -log10 (P-value); upregulated genes are represented by red dots, while downregulated genes are represented by green dots; (B) The horizontal axis represents the sample name and the vertical axis represents the normalized value of the differential gene FPKM.
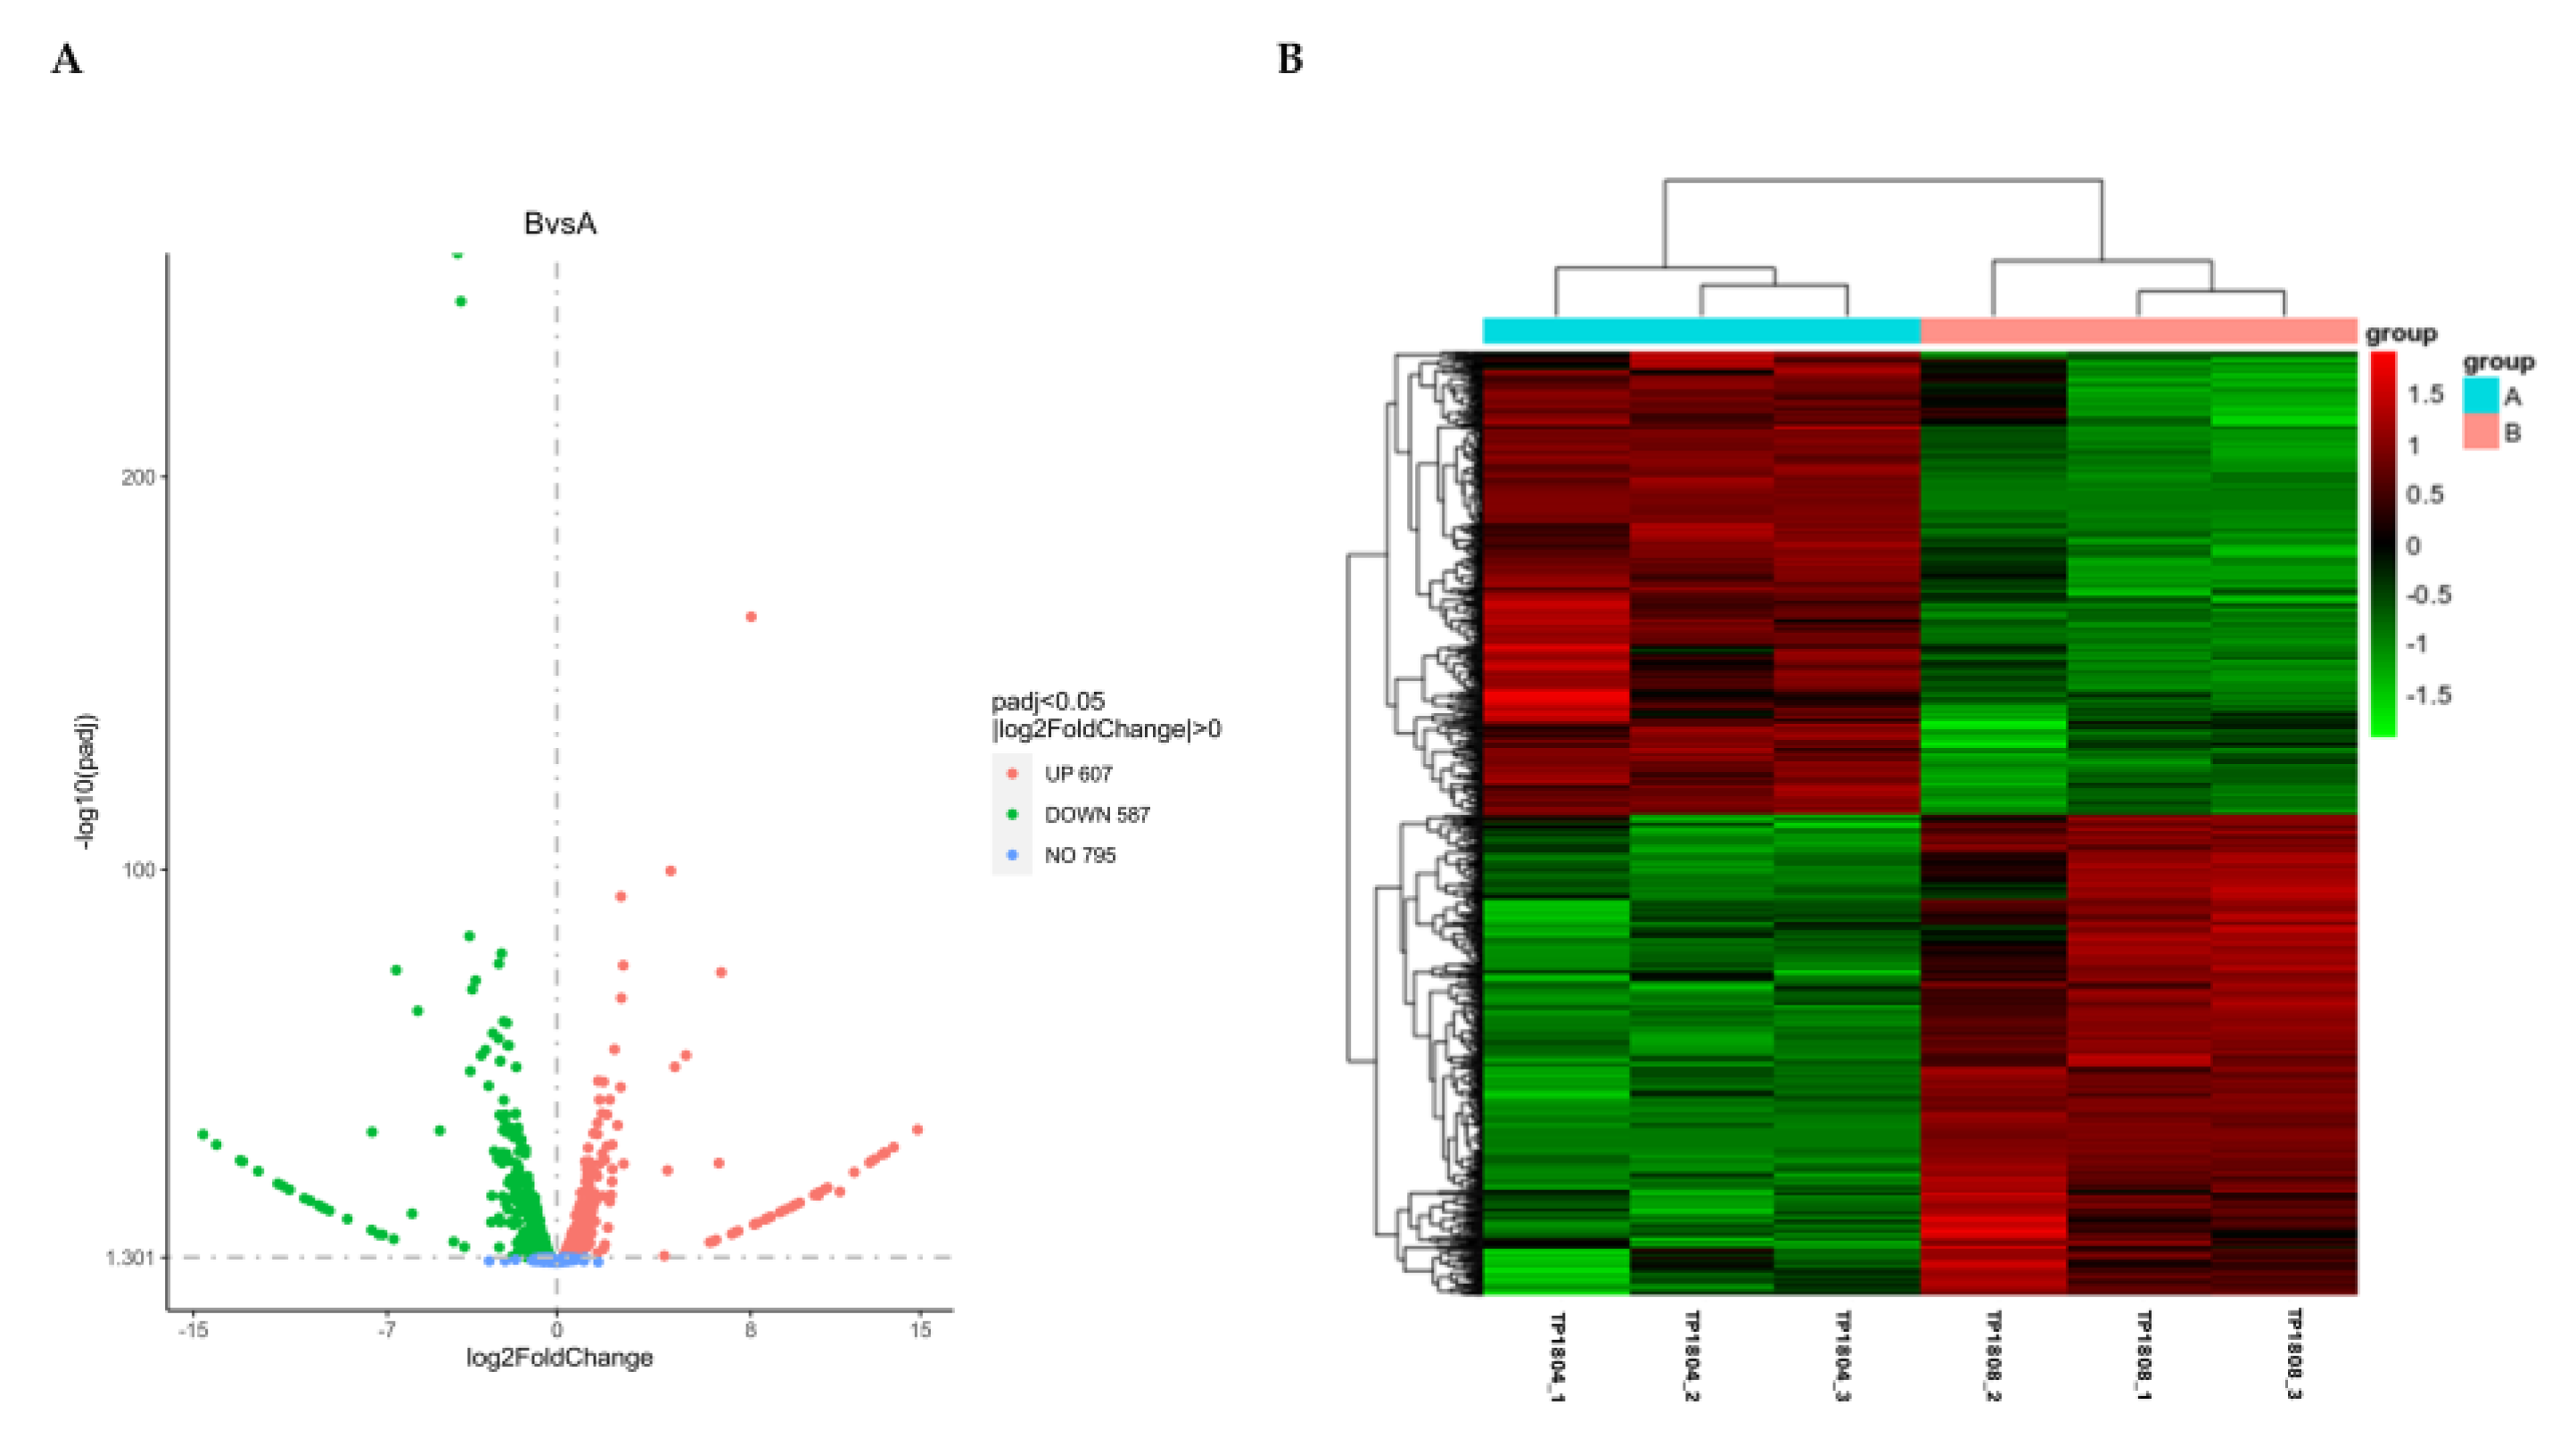
Figure 4.
GO function enrichment analysis (A) and KEGG pathway enrichment analysis (B). (A) The horizontal axis represents GO Term and the vertical axis represents the significance level of GO Term enrichment, denoted by - log10 (padj). Different colors indicate different functional classifications. The most significant 30 terms from the GO enrichment analysis results were selected and a bar chart for display was drawn. If there are less than 30 terms, draw a bar chart for all terms, classified by biological processes, cellular components, and molecular functions, as well as differentially expressed genes; (B) The horizontal axis represents the ratio of the number of differentially expressed genes annotated onto the KEGG pathway to the total number of differentially expressed genes, while the vertical axis represents the KEGG pathway.
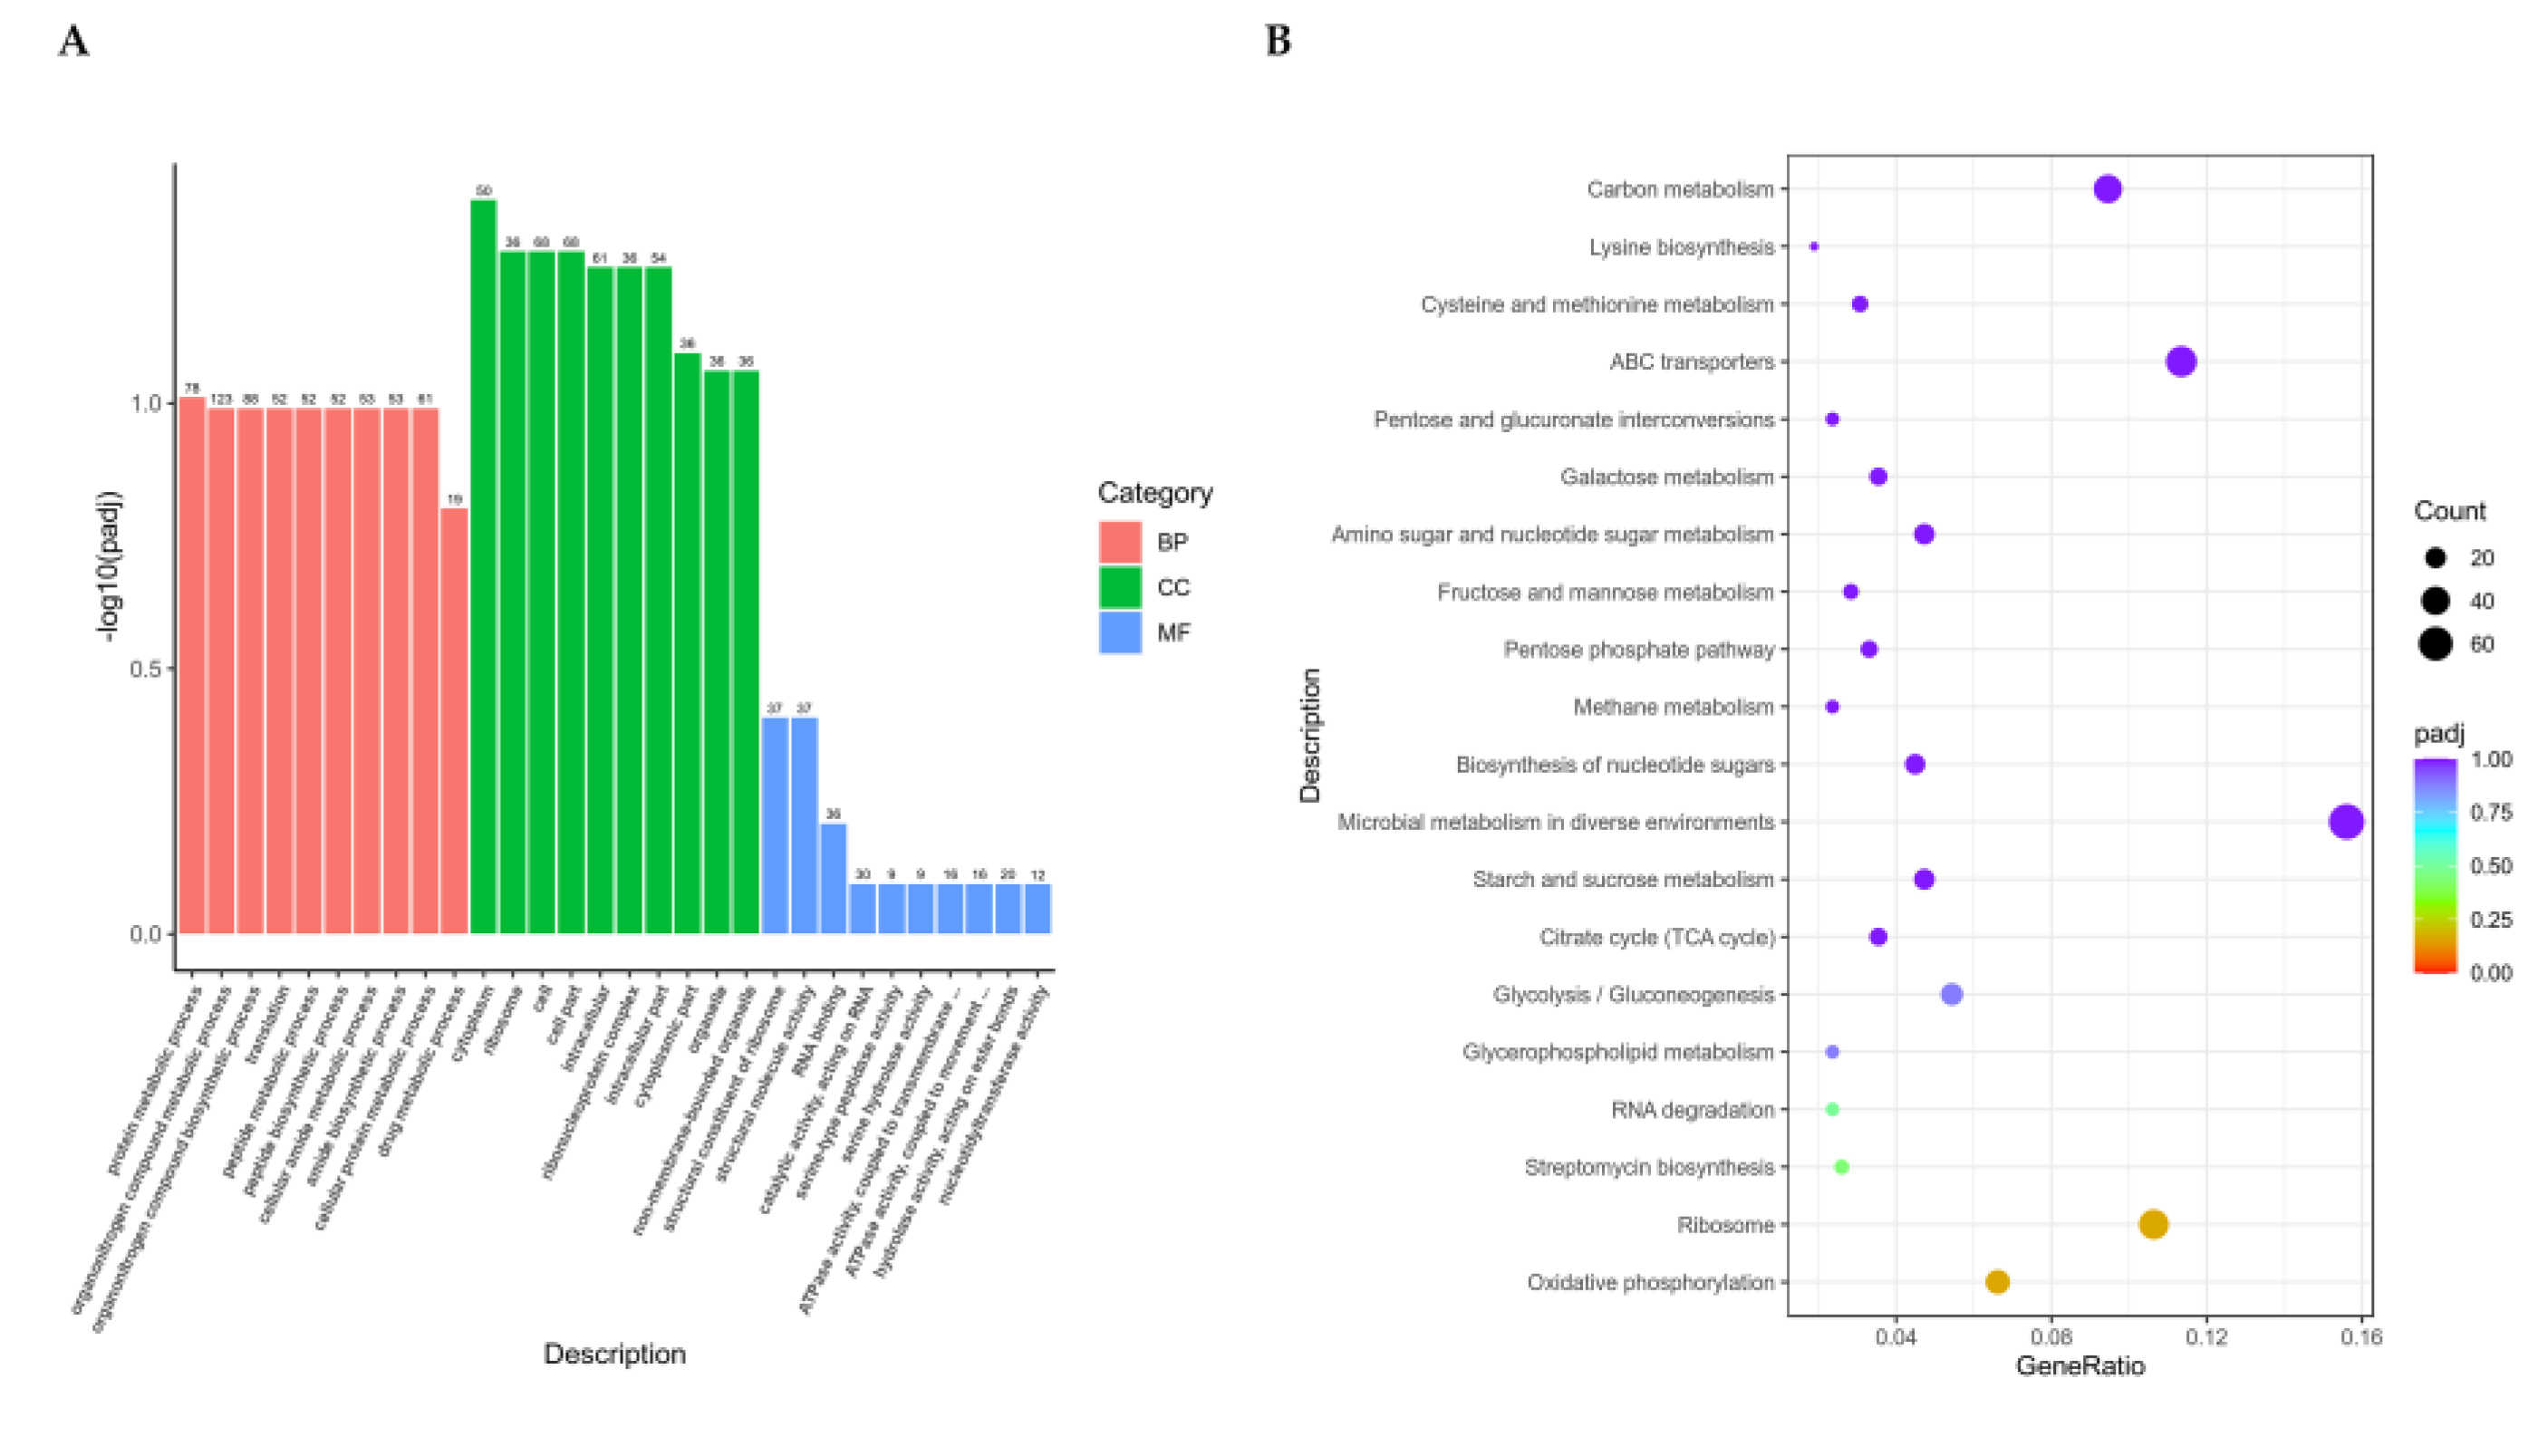
Figure 5.
Sample grouping PCA analysis (A) and Top ten contribution sample of PCA (Scale and no scale) (B).
Figure 5.
Sample grouping PCA analysis (A) and Top ten contribution sample of PCA (Scale and no scale) (B).
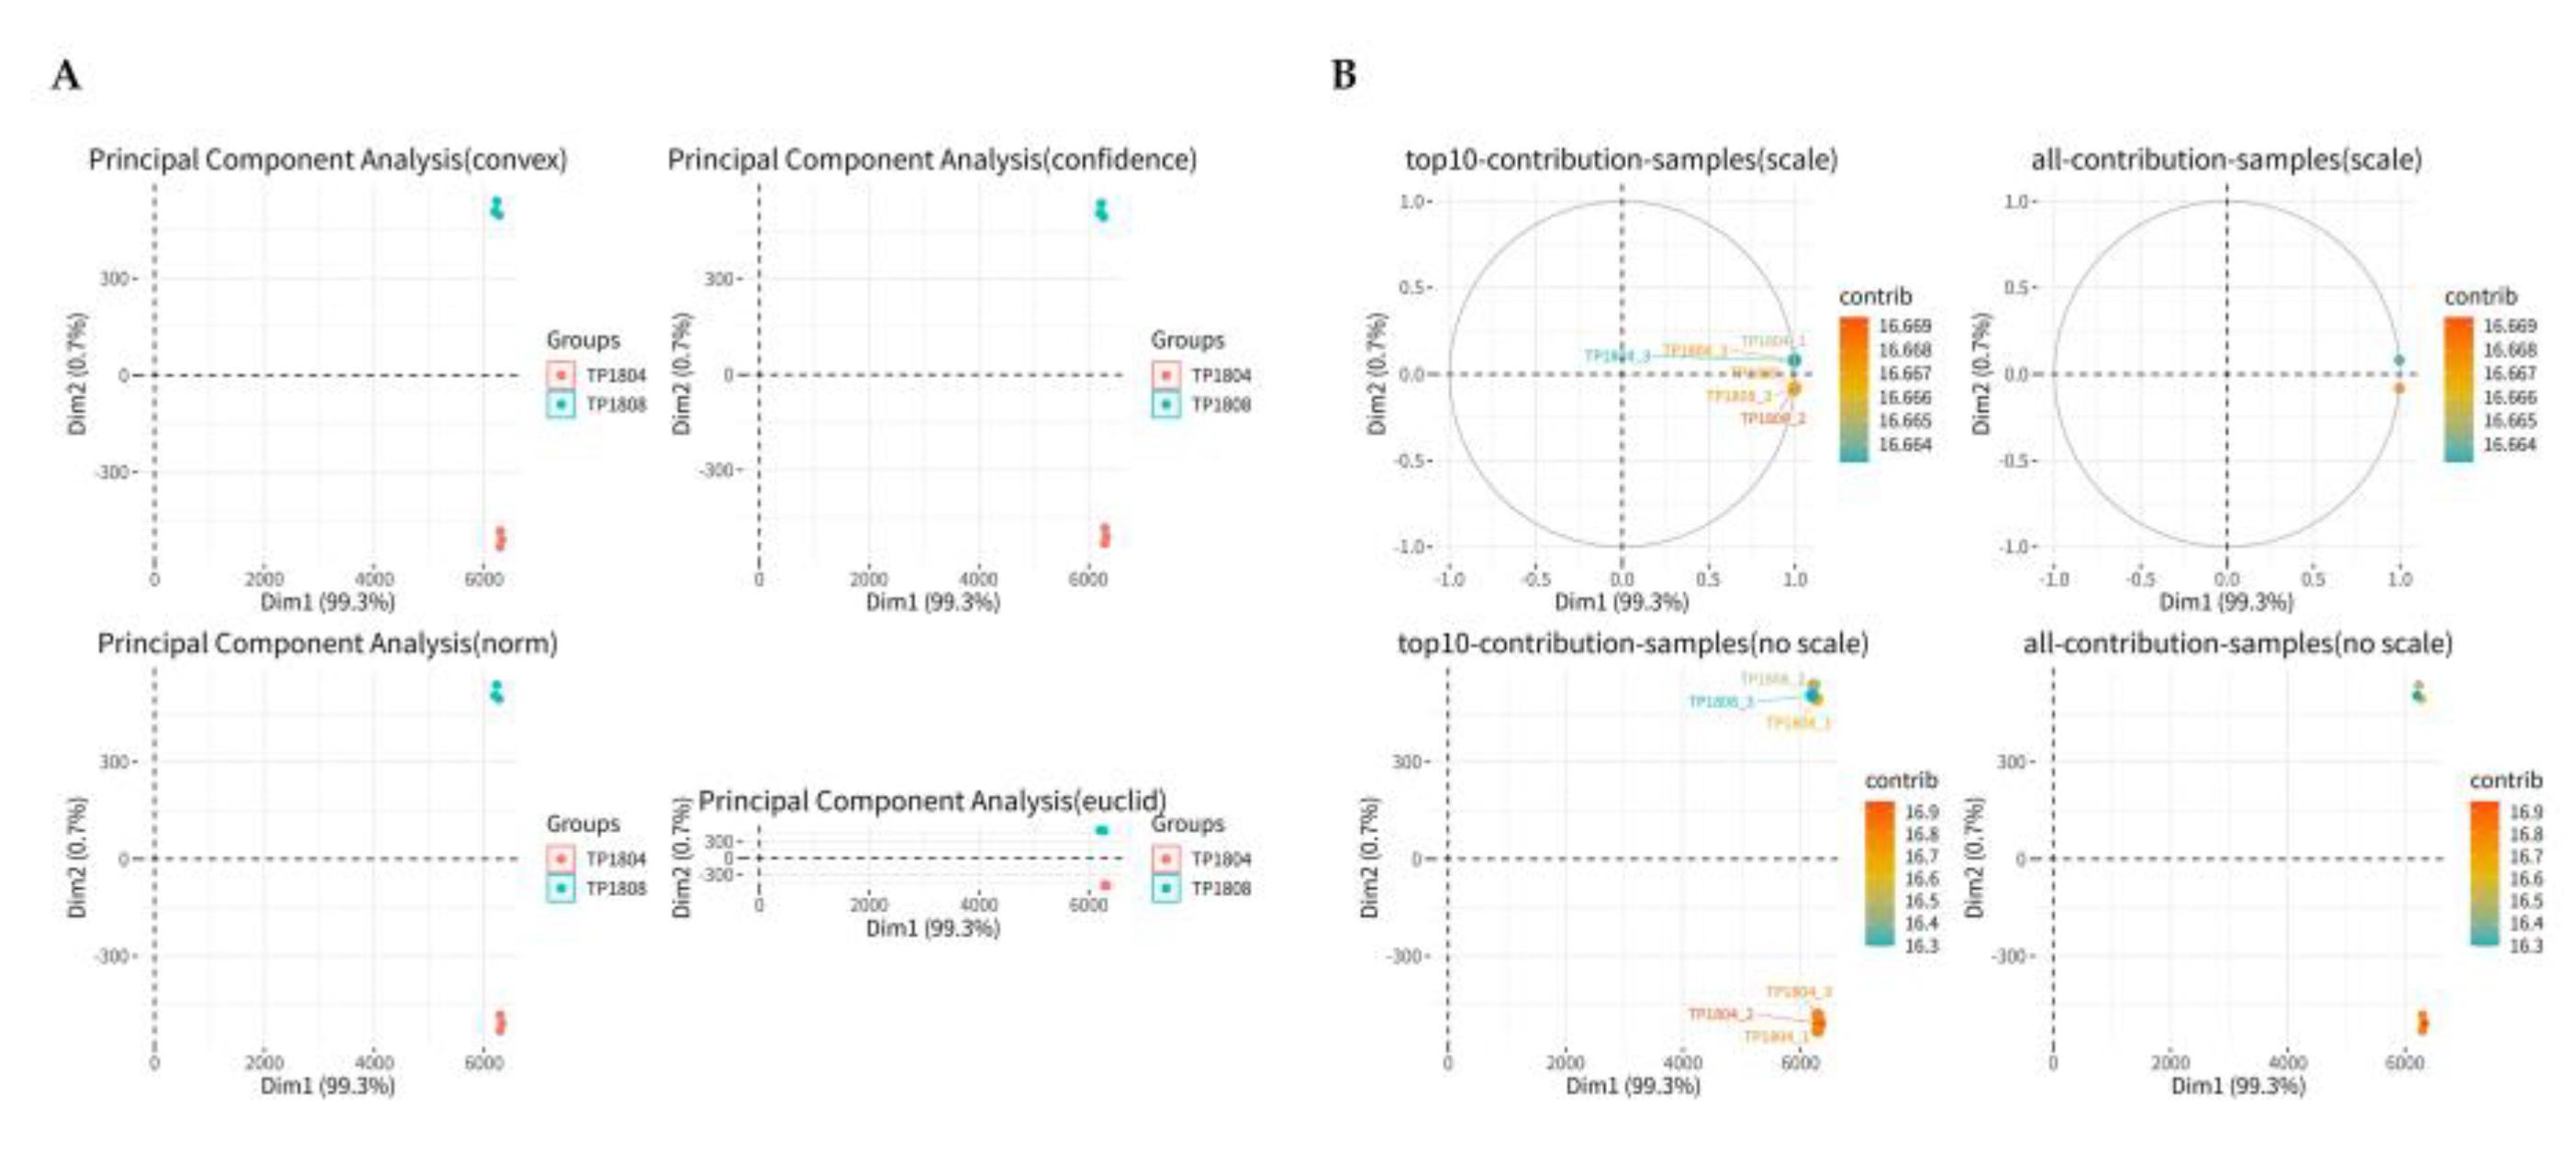
Figure 6.
Pearson correlation (A) and Hierarchical clustering of protein expression levels (B). (A) X- and Y-axis represent each sample. Color represents correlation coefficient (The blue color represents the positive correlation and the red color represents the negative correlation); (B) Each coordinate on the x-axis represents one sample. The x-axis ruler below represents the sample name. The color bar annotation is on the right.
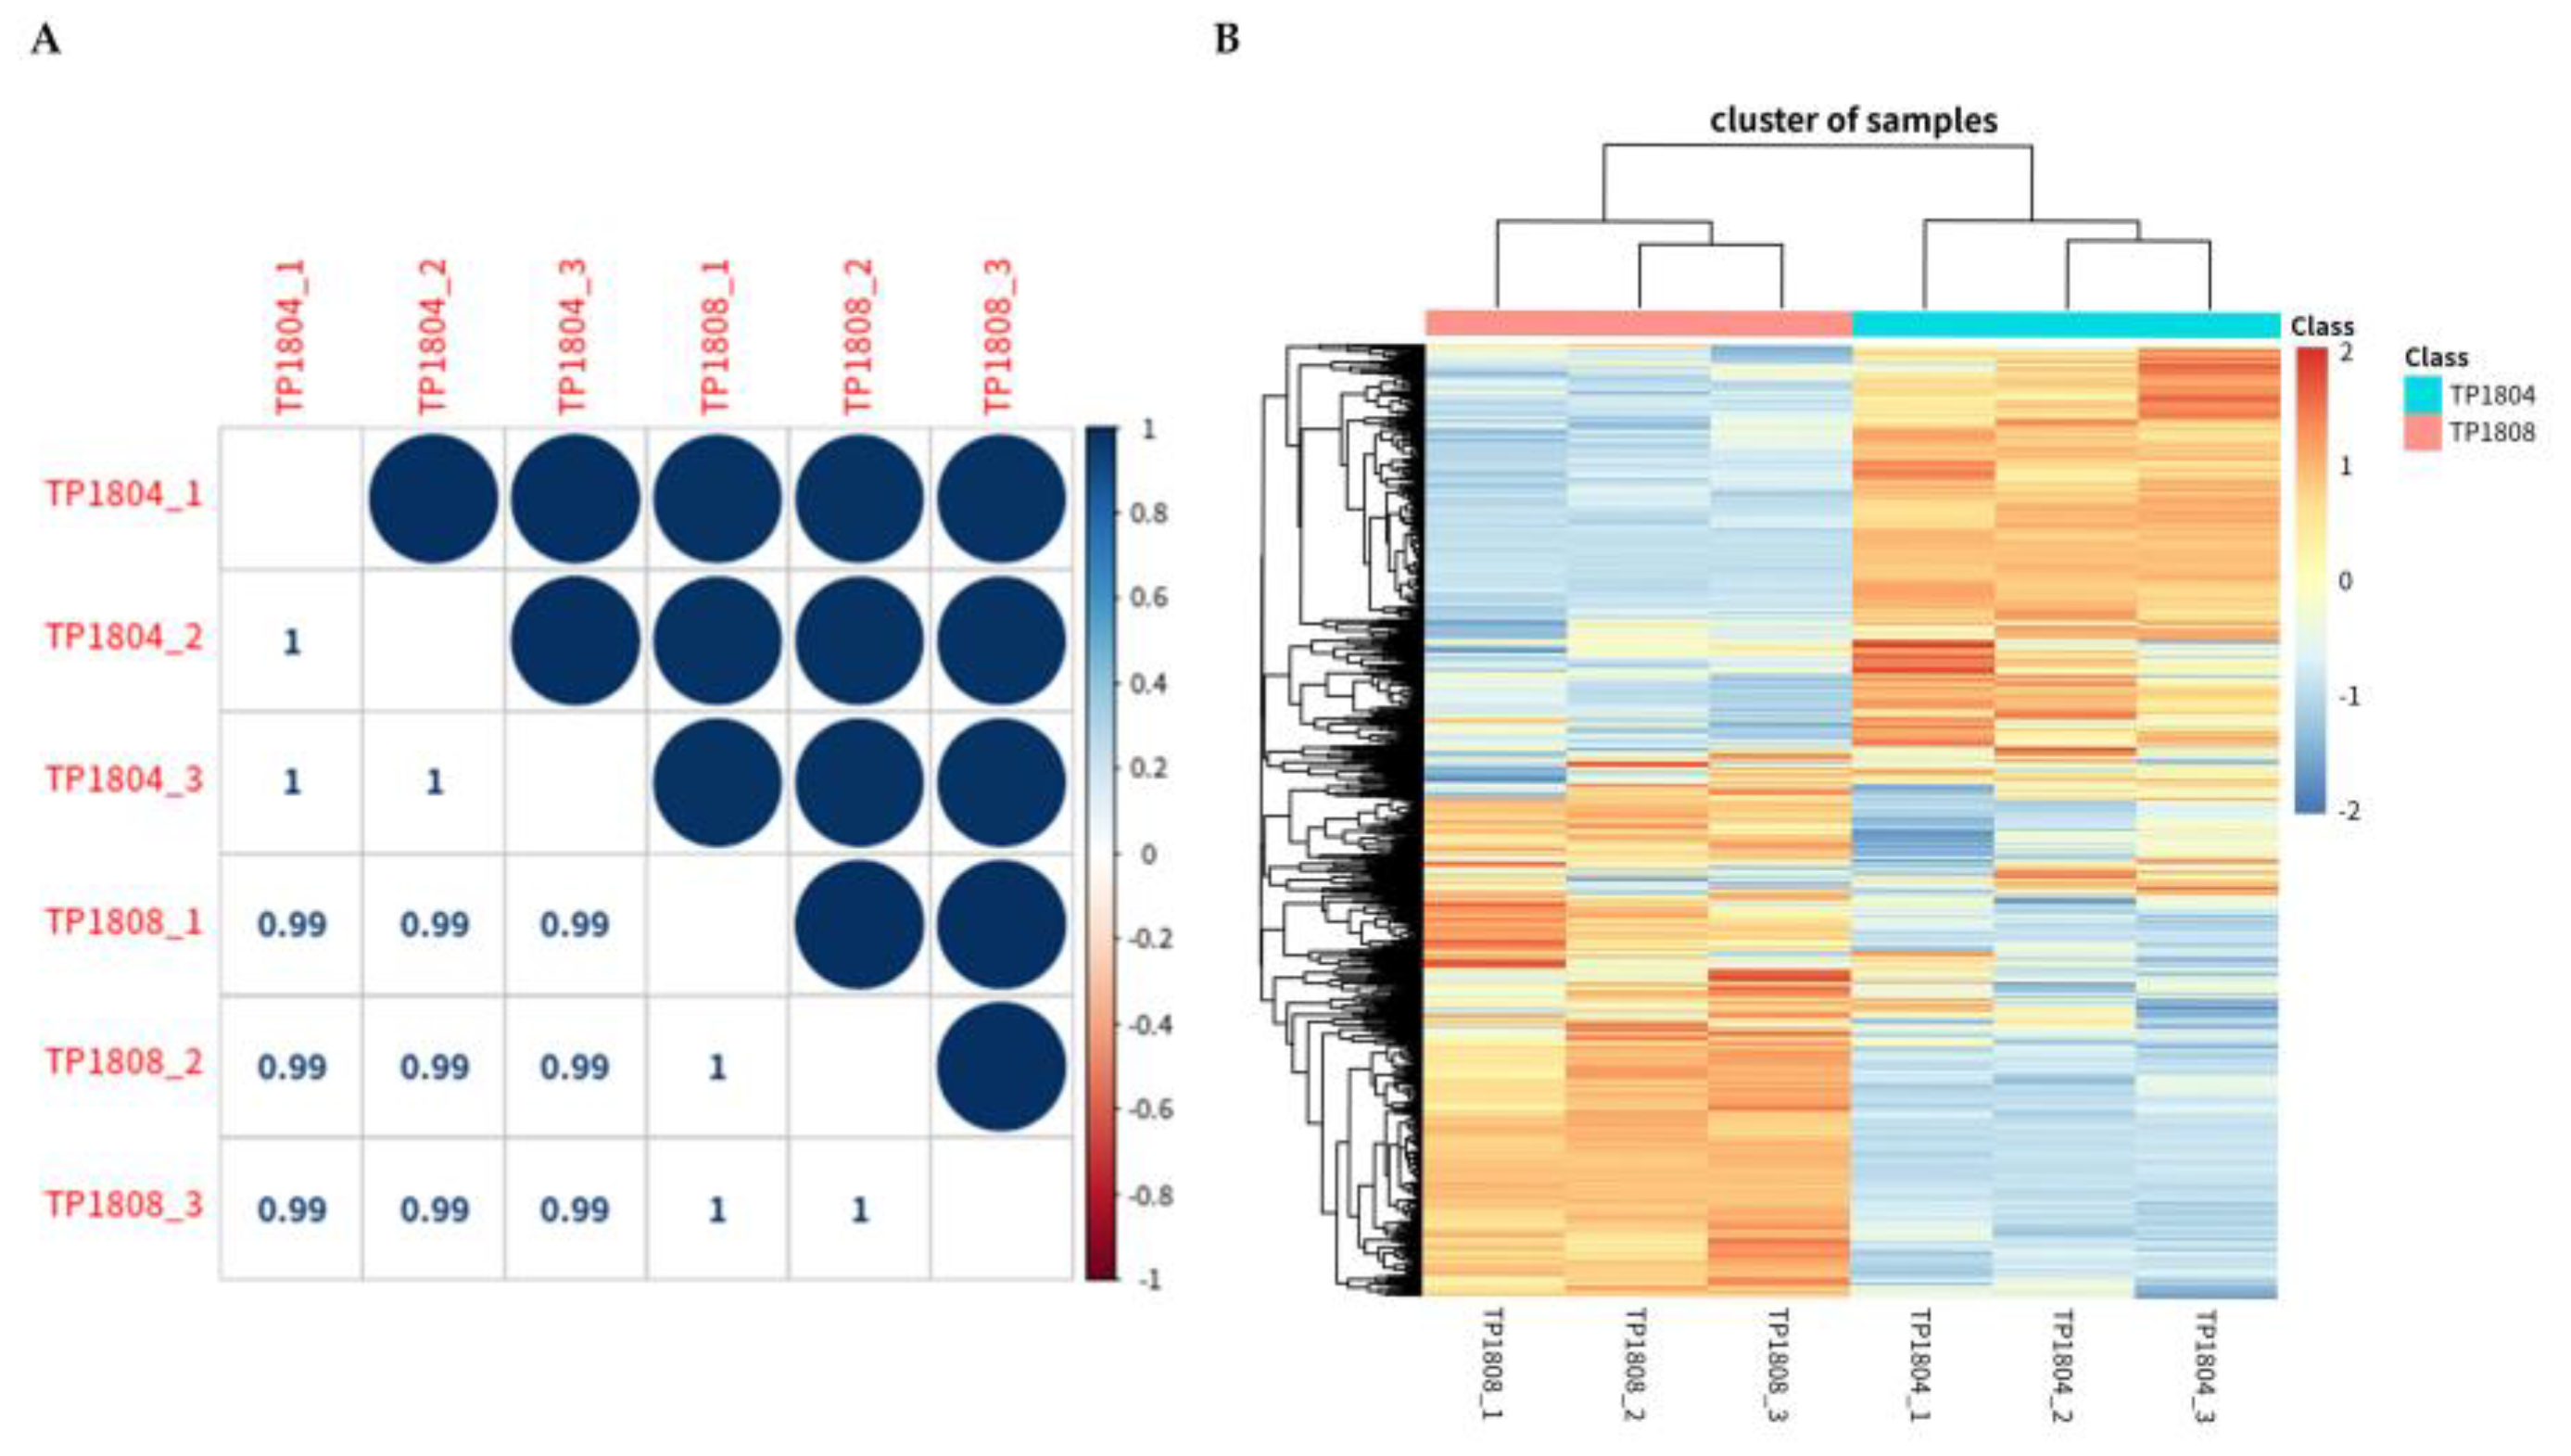
Figure 7.
Differential protein volcano diagram (A) and Differential multiple density plot (B). (A) The horizontal axis represents the expression fold changes of proteins in different experimental groups/samples, and the vertical axis represents the statistical significance of changes in protein expression levels; (B) The X-axis represents log2 (FC) and the Y-axis represents the fold density of proteins between groups.
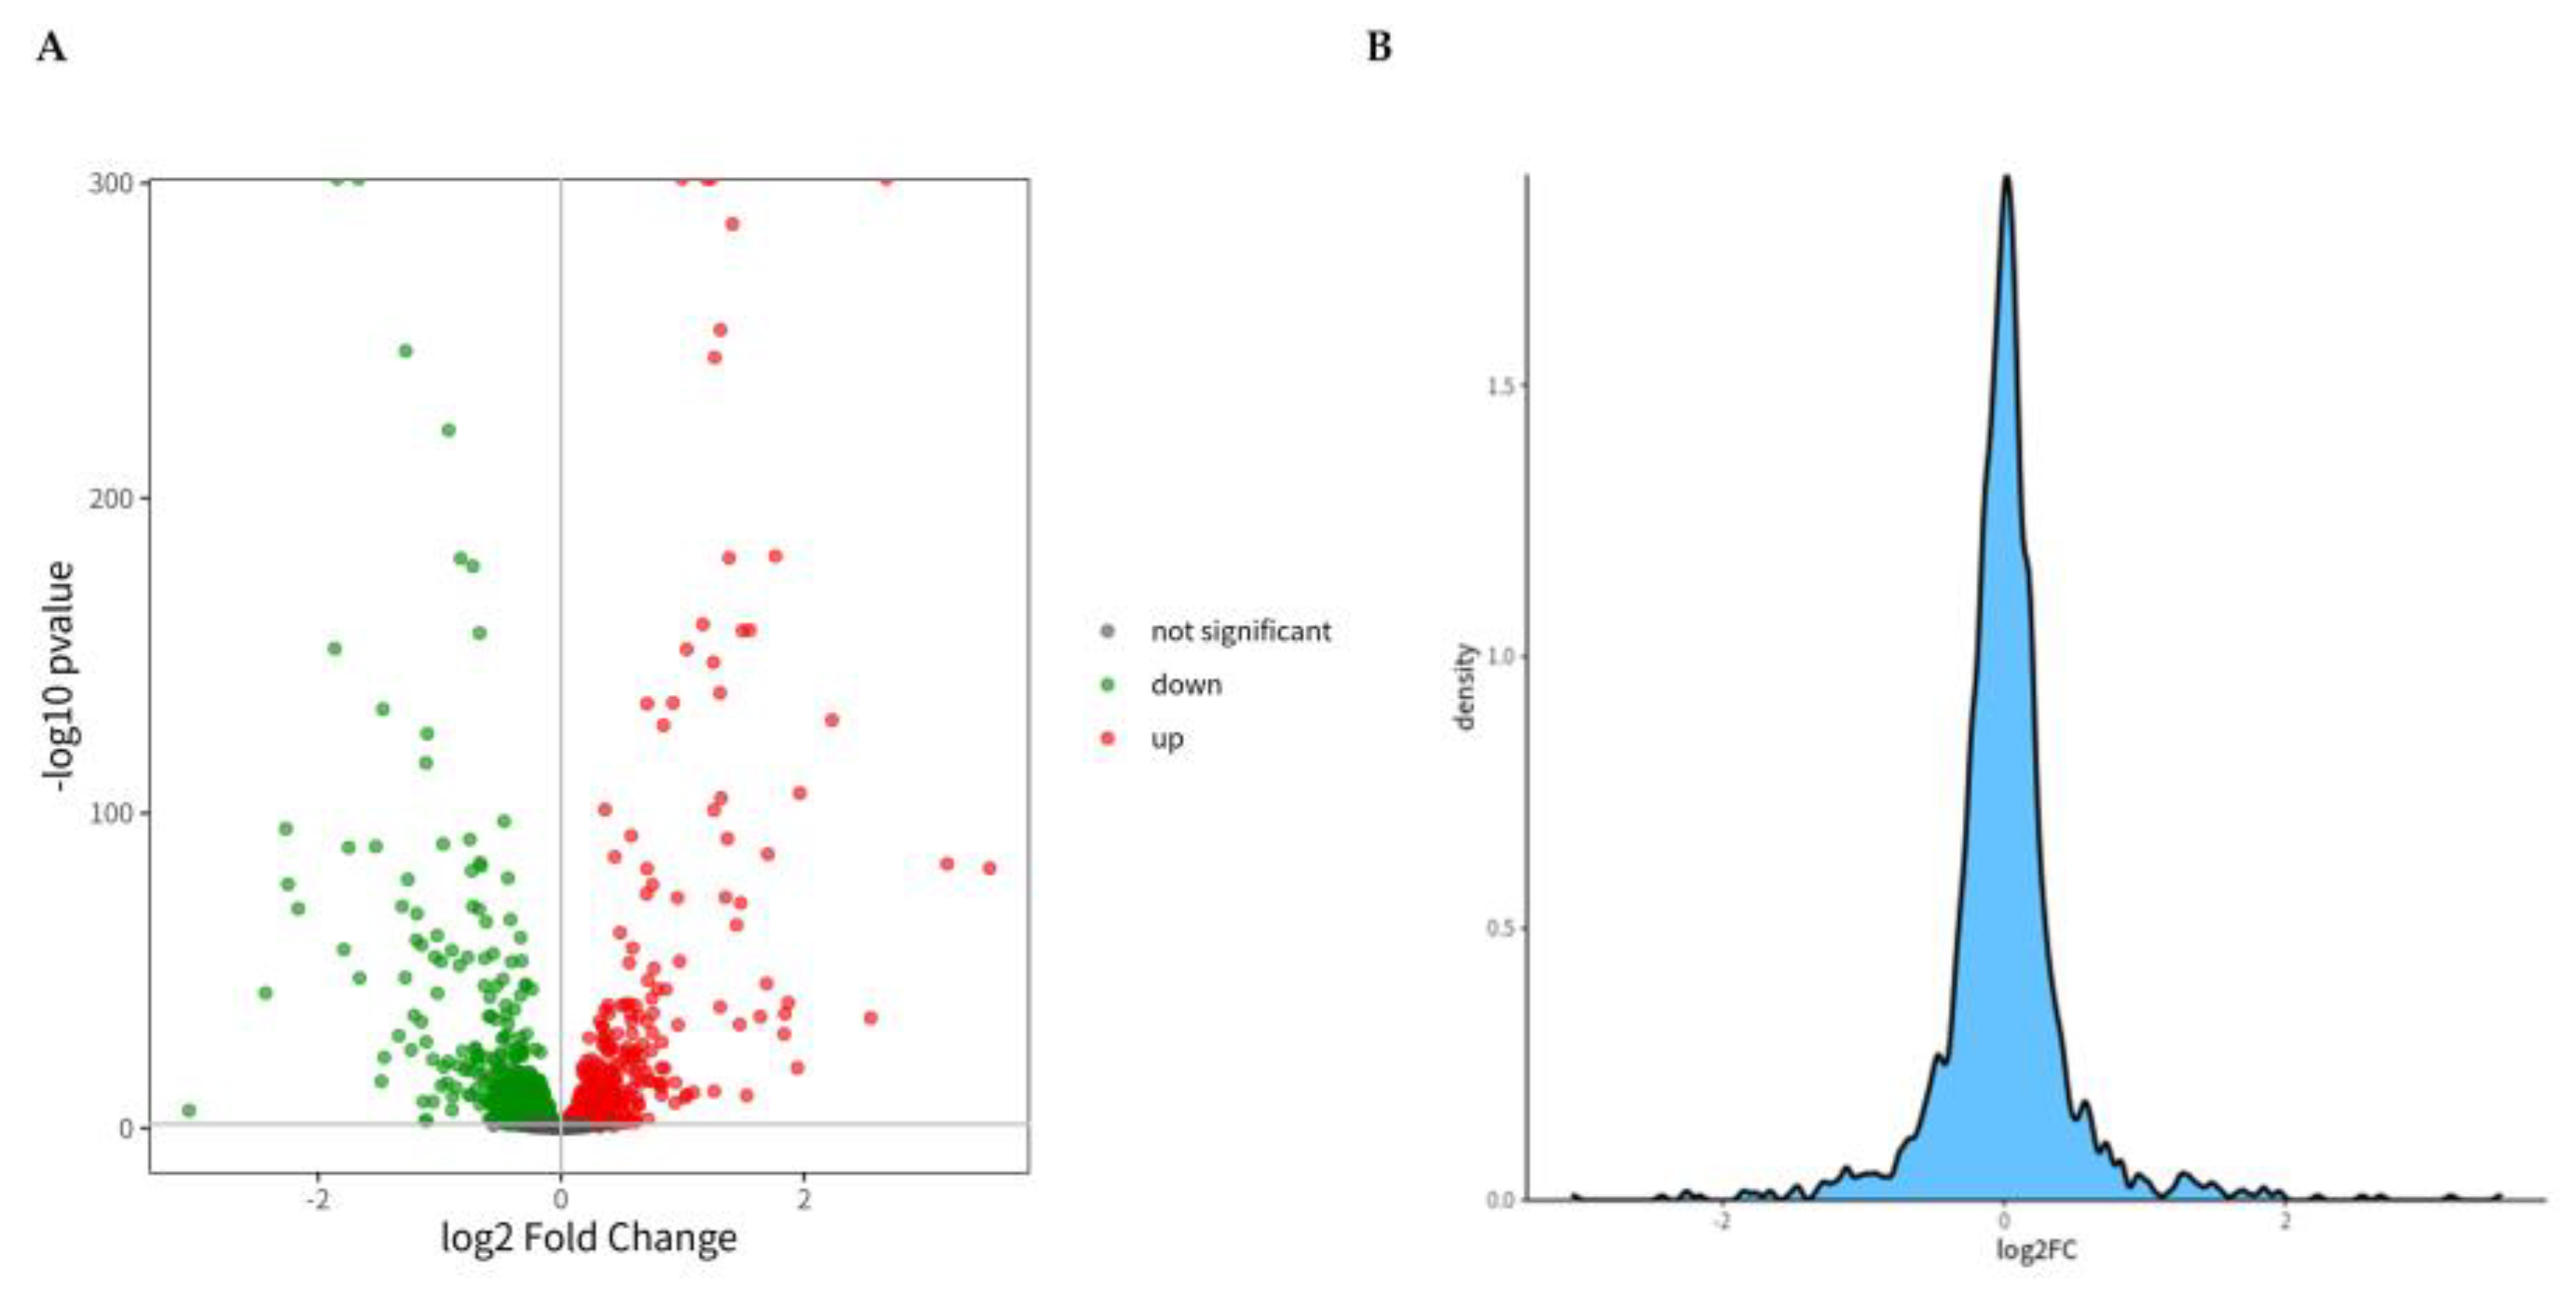
Figure 8.
Candidate protein GO function enrichment analysis (A) and KEGG pathway enrichment analysis (B). (A) The vertical axis represents the GO term at the next level of the three major categories and the horizontal axis represents the number of candidate proteins annotated under that term (including its sub terms); (B) The top 20 enriched pathway entries were selected to display in Figure 8B. If there are less than 20 enriched pathway entries, they will all be displayed. P-Value is the corrected P-Value.
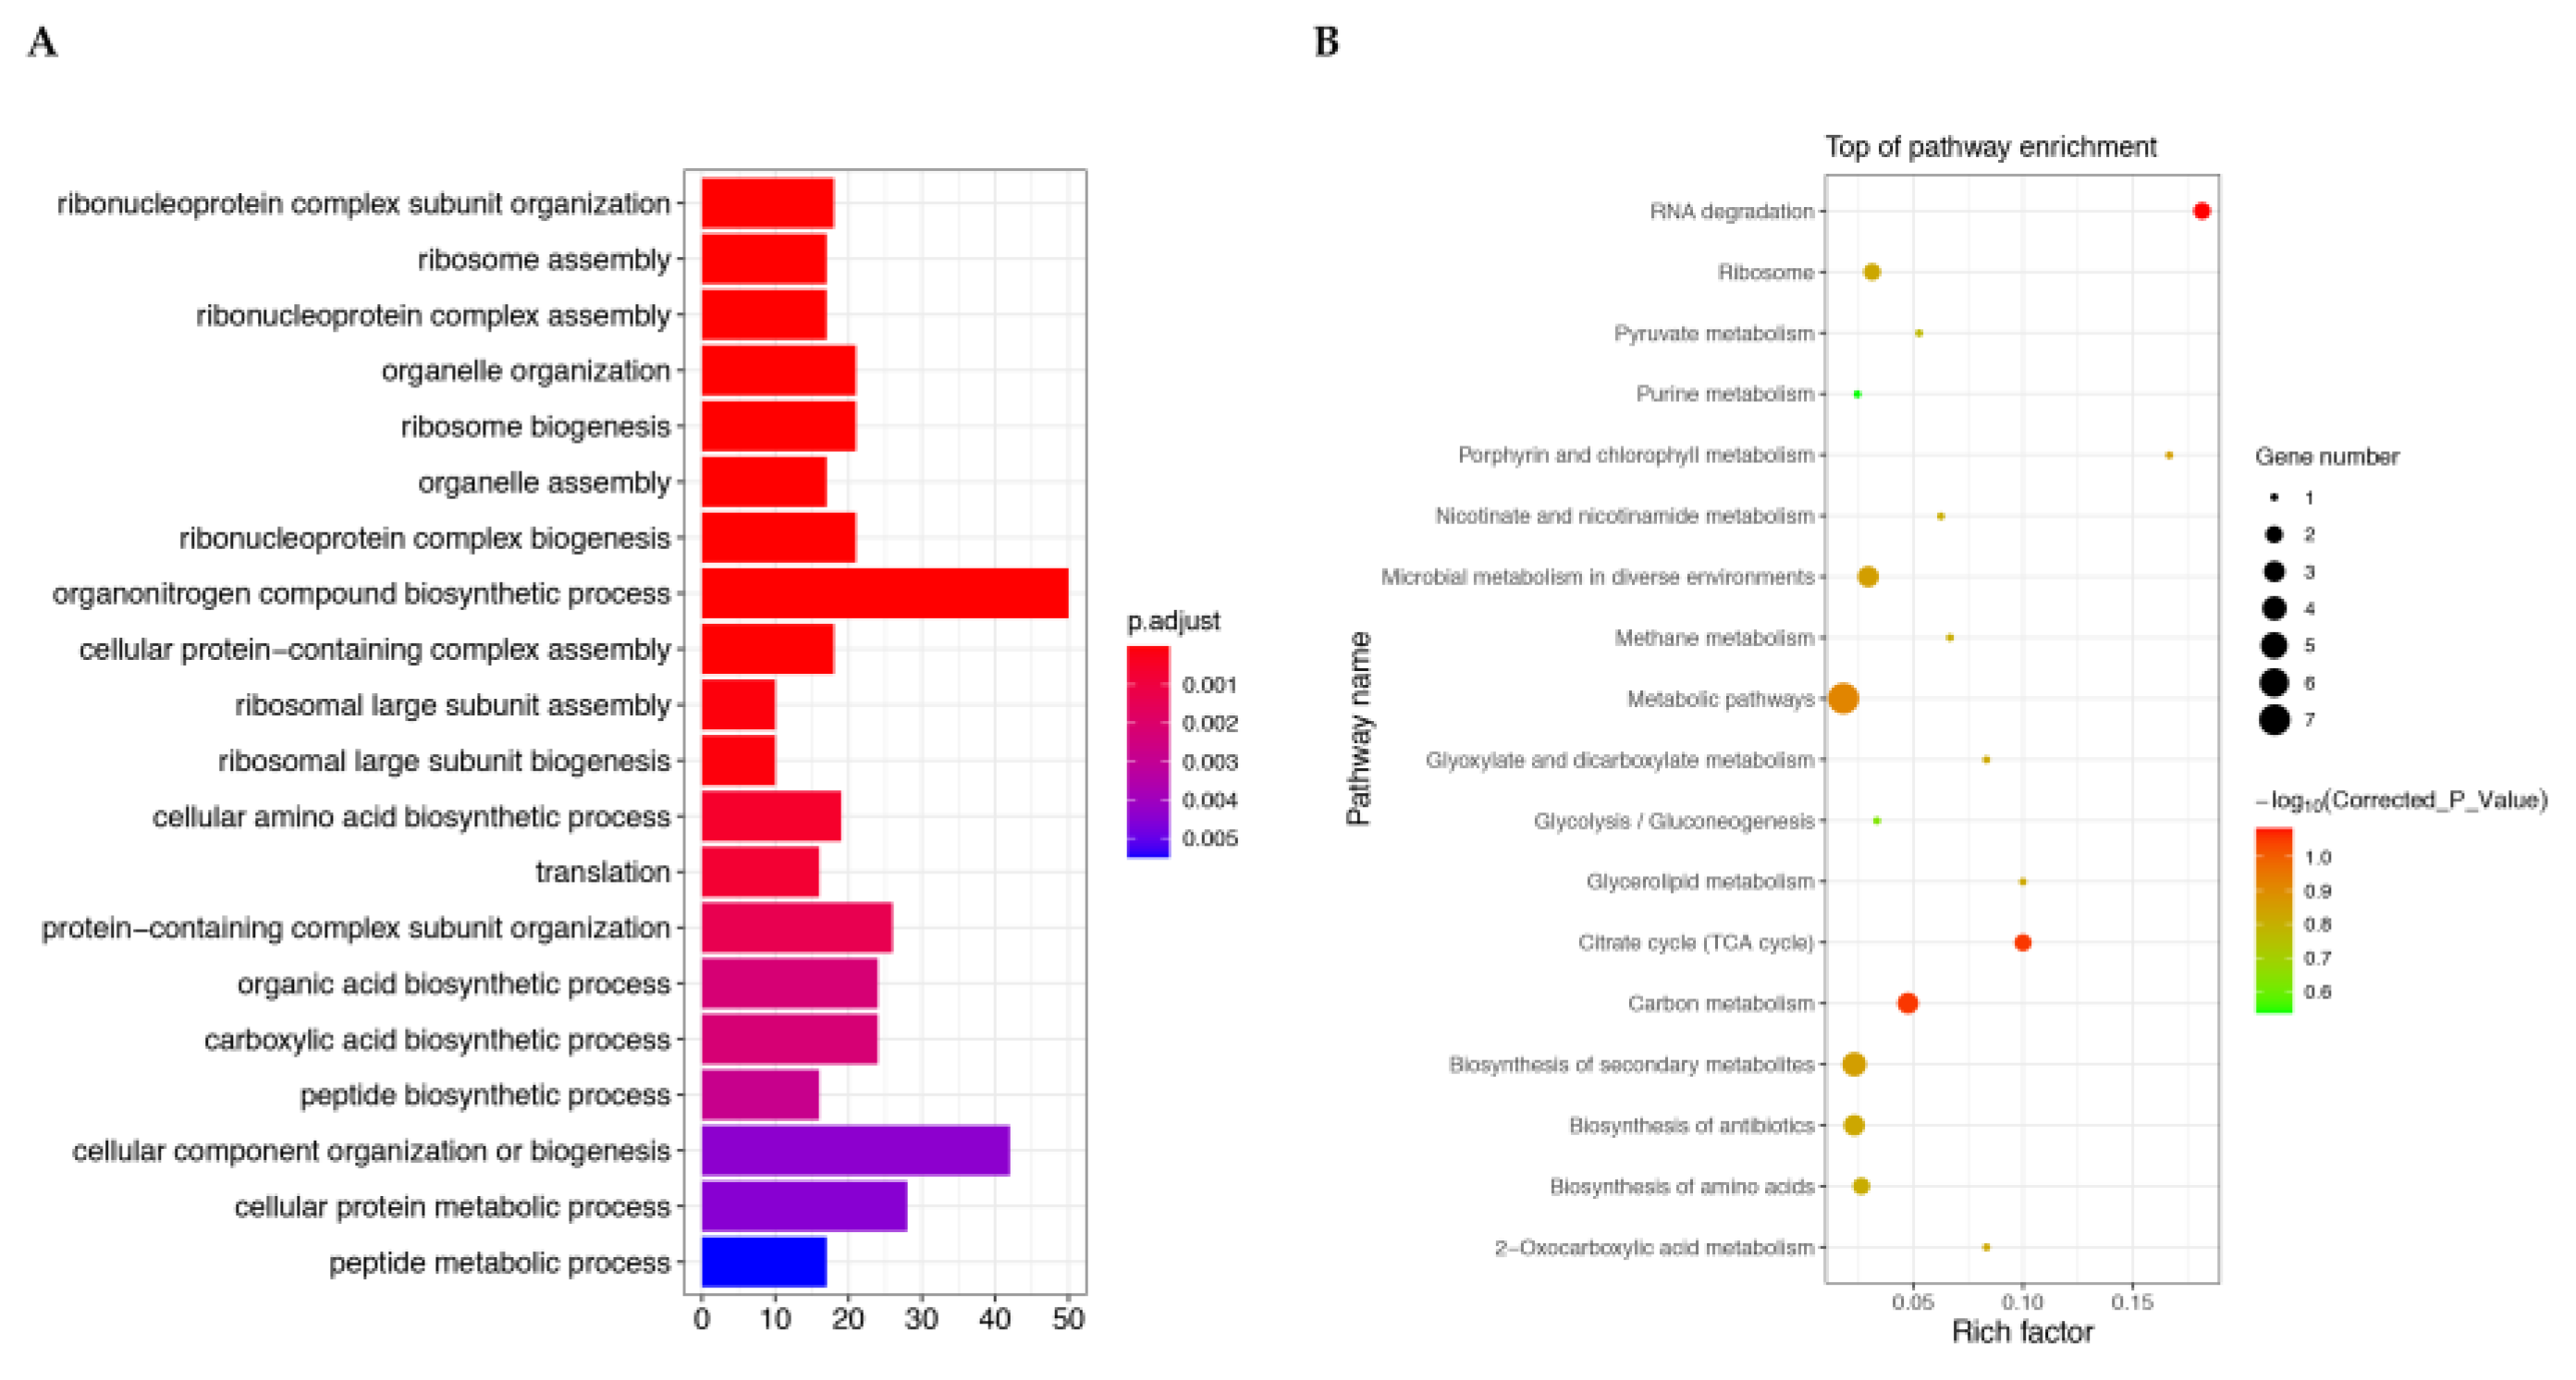

Table 1.
GO enrichment analysis results table of differential proteins (Top 10).
| ID | Ontology | Description | GeneRatio | BgRatio | Count |
|---|---|---|---|---|---|
| GO:0071826 | BP | Ribonucleoprotein complex subunit organization | 18/163 | 54/2754 | 18 |
| GO:0042255 | BP | Ribosome assembly | 17/163 | 51/2754 | 17 |
| GO:0022618 | BP | Ribonucleoprotein complex assembly | 17/163 | 52/2754 | 17 |
| GO:0006996 | BP | Organelle organization | 21/163 | 87/2754 | 21 |
| GO:0042254 | BP | Ribosome biogenesis | 21/163 | 91/2754 | 21 |
| GO:0070925 | BP | Organelle assembly | 17/163 | 61/2754 | 17 |
| GO:0022613 | BP | Ribonucleoprotein complex biogenesis | 21/163 | 92/2754 | 21 |
| GO:1901566 | BP | Organonitrogen compound biosynthetic process | 50/163 | 403/2754 | 50 |
| GO:0034622 | BP | Cellular protein-containing complex assembly | 18/163 | 74/2754 | 18 |
| GO:0000027 | BP | Ribosomal large subunit assembly | 10/163 | 28/2754 | 10 |
1 GO ID: Unique label information in Gene Ontology database; 2 Description: Description of Gene Ontology functionality; 3 GeneRatio: The ratio of the number of genes related to the term in the differentially expressed genes to the total number of differentially expressed genes; 4 BgReaction: The ratio of the number of genes related to this term in the background (all) genes to all genes; 5 Count: The number of genes related to this term among the differentially expressed genes.
Table 2.
KEGG pathway enrichment analysis results of candidate proteins (Top 10).
| Term | ID | Input No. | Background No. | P-value | Corrected P-value |
|---|---|---|---|---|---|
| RNA degradation | tpy03018 | 2 | 11 | 0.004571281 | 0.082283062 |
| Citrate cycle | tpy00020 | 2 | 20 | 0.012970066 | 0.088377752 |
| Carbon metabolism | tpy01200 | 3 | 63 | 0.014729625 | 0.088377752 |
| Metabolic pathways | tpy01100 | 7 | 388 | 0.027180171 | 0.122310771 |
| Biosynthesis of secondary metabolites | tpy01110 | 4 | 174 | 0.049567014 | 0.14248783 |
| Microbial metabolism in diverse environments | tpy01120 | 3 | 102 | 0.049597122 | 0.14248783 |
| Porphyrin and chlorophyll metabolism | tpy00860 | 1 | 6 | 0.055411934 | 0.14248783 |
| Glycerolipid metabolism | tpy00561 | 1 | 10 | 0.085764836 | 0.150892112 |
| Biosynthesis of antibiotics | tpy01130 | 3 | 131 | 0.089676542 | 0.150892112 |
| ribosome | tpy03010 | 2 | 64 | 0.09782459 | 0.150892112 |
1 ID: Unique identifier information for pathways in the KEGG database; 2 Term: Description of Gene Ontology features; 3 Input number: The number of genes related to this term in the differentially expressed genes; 4 Background number: The number of genes associated with this ID among all genes; 5 P-value: enrichment analysis at the statistical significance level. Generally, P-value < 0.05 is considered an enrichment term; 6 Corrected P-Value.
Disclaimer/Publisher’s Note: The statements, opinions and data contained in all publications are solely those of the individual author(s) and contributor(s) and not of MDPI and/or the editor(s). MDPI and/or the editor(s) disclaim responsibility for any injury to people or property resulting from any ideas, methods, instructions or products referred to in the content. |
© 2024 by the authors. Licensee MDPI, Basel, Switzerland. This article is an open access article distributed under the terms and conditions of the Creative Commons Attribution (CC BY) license (http://creativecommons.org/licenses/by/4.0/).
Copyright: This open access article is published under a Creative Commons CC BY 4.0 license, which permit the free download, distribution, and reuse, provided that the author and preprint are cited in any reuse.


