
Submitted:
08 October 2024
Posted:
10 October 2024
You are already at the latest version
Abstract
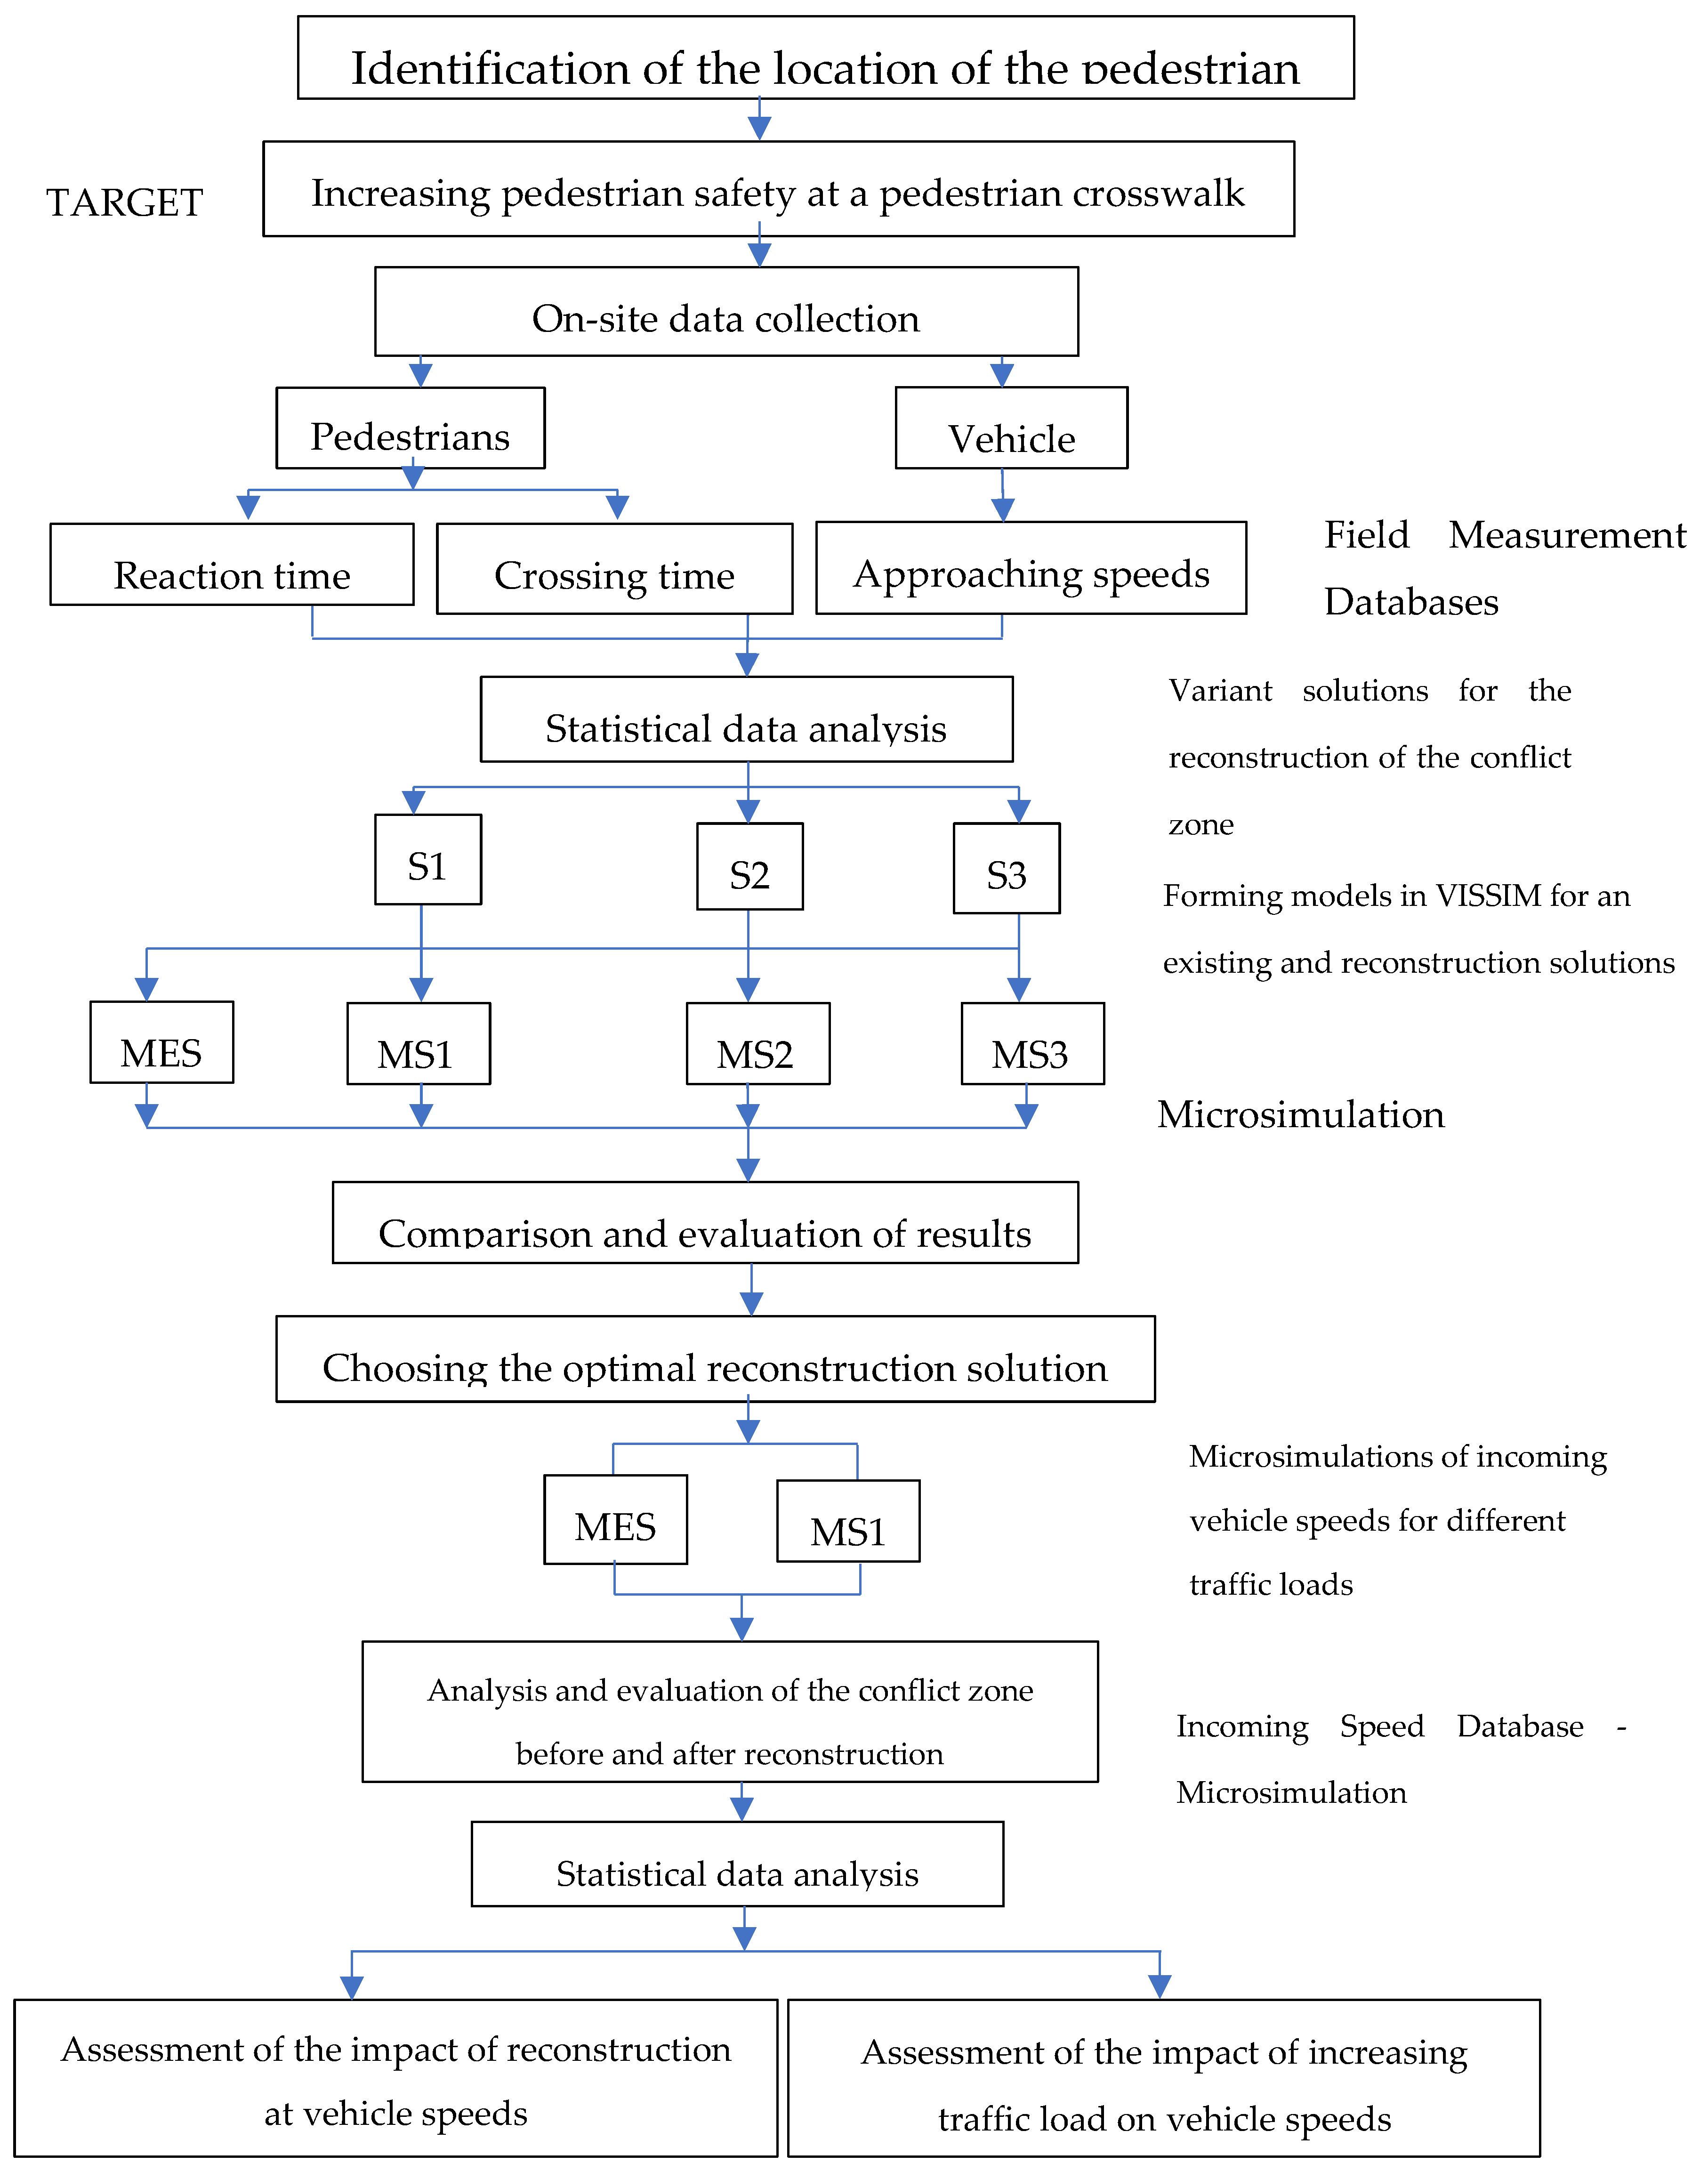
According to statistics from the World Health Organization traffic accidents are one of the leading causes of death among children and young people, and the statistical indicators are even worse for the population of elderly pedestrians. Preventive measures and a significant increase in pedestrian safety require a comprehensive approach that includes analysis of traffic infrastructure and regulations, as well as the behavior and interaction between road users. In this paper, a methodology based on traffic microsimulations was developed for selecting the optimal reconstruction solution of urban traffic infrastructure from the aspect of traffic safety. Comprehensive analyses of local traffic conditions at the location – infrastructural and those related to traffic users was proposed. Developed methodology was applied and tested at a selected unsignalized pedestrian crosswalk in the urban traffic network of the city of Osijek, Croatia. It enabled analyzes of possible solutions for improving the traffic safety for vulnerable pedestrian groups, taking into account the specificities of the chosen location in the residential area and traffic participants behavior measured at the filed. Through database analysis, parameters influencing the reaction time and crossing time of children and elderly pedestrians in conflict zones were identified. Using microsimulation traffic modeling (VISSIM) and statistical tools, an analysis was conducted on the incoming vehicle speeds for both the existing and reconstructed conflict zone solutions under different traffic conditions. The developed methodology allowed the selection of the optimal solution from the perspective of traffic safety, considering the actual and future traffic conditions of the location for all traffic users.
Keywords:
1. Introduction and Overview of Existing Research
2. Materials and Methods
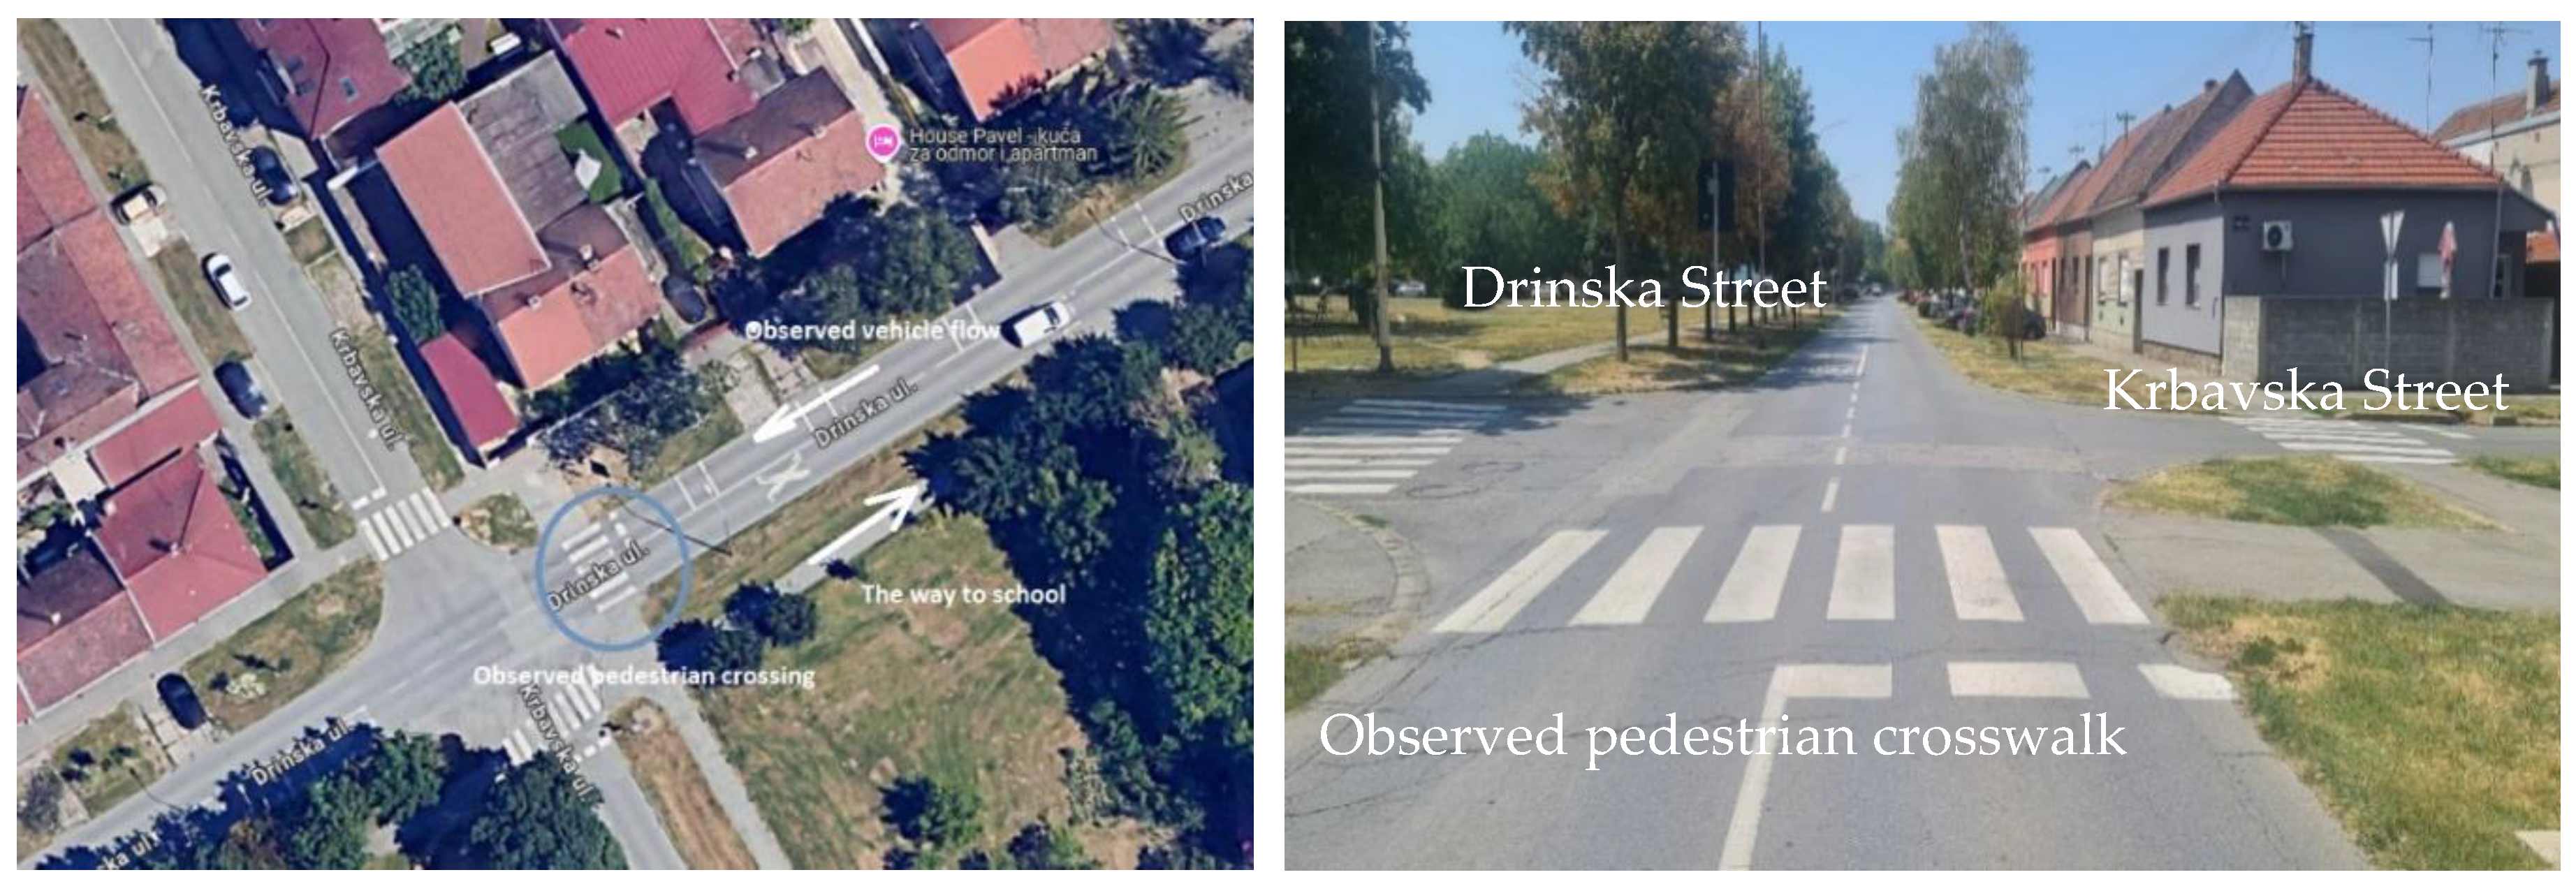
2.1. Case Study Location Description
2.2. Database Formation
2.2.1. Database – Pedestrians
2.2.2. Database of Measured Traffic Load and Vehicle Speed Data
2.2.3. Database of Incoming Speeds Obtained Using Microsimulations
3. Basic Traffic Analyses
3.1. Speed and Traffic Analyses
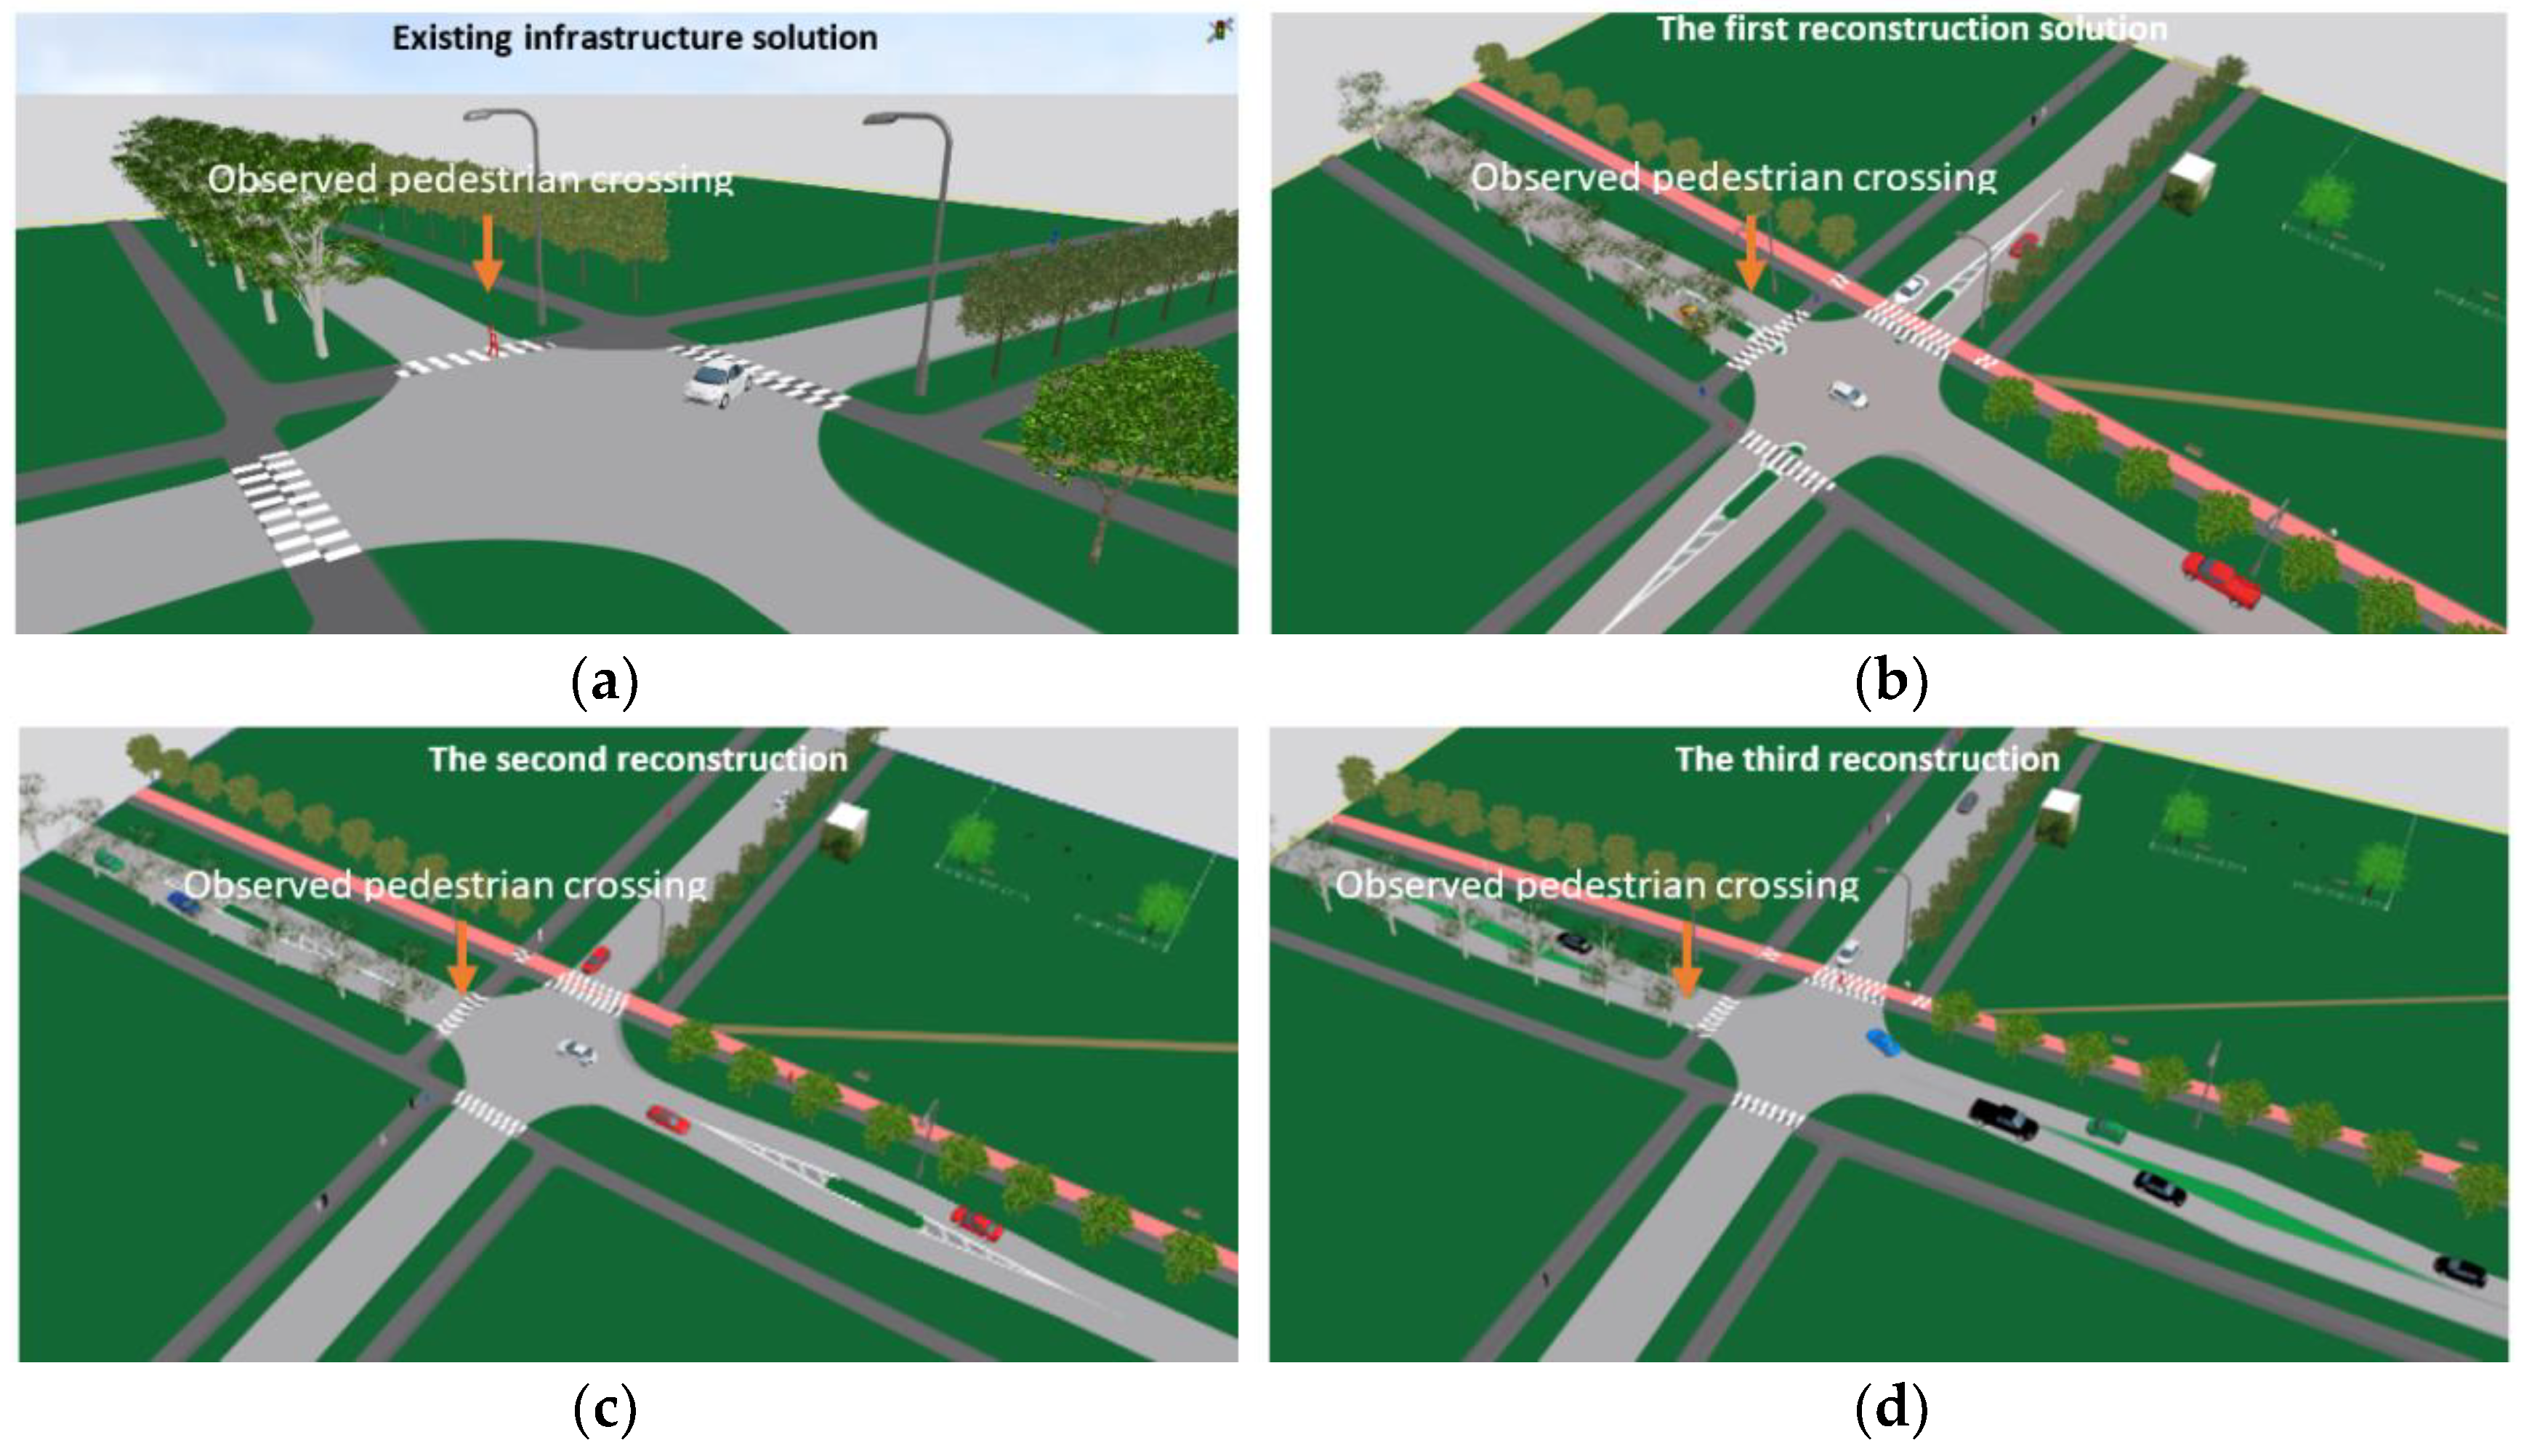
3.2. Comparison of Traffic Parameters for Conflict Zone Reconstruction Solutions
4. Results and Discussion
4.1. Statistical Analysis of the Database – Pedestrians
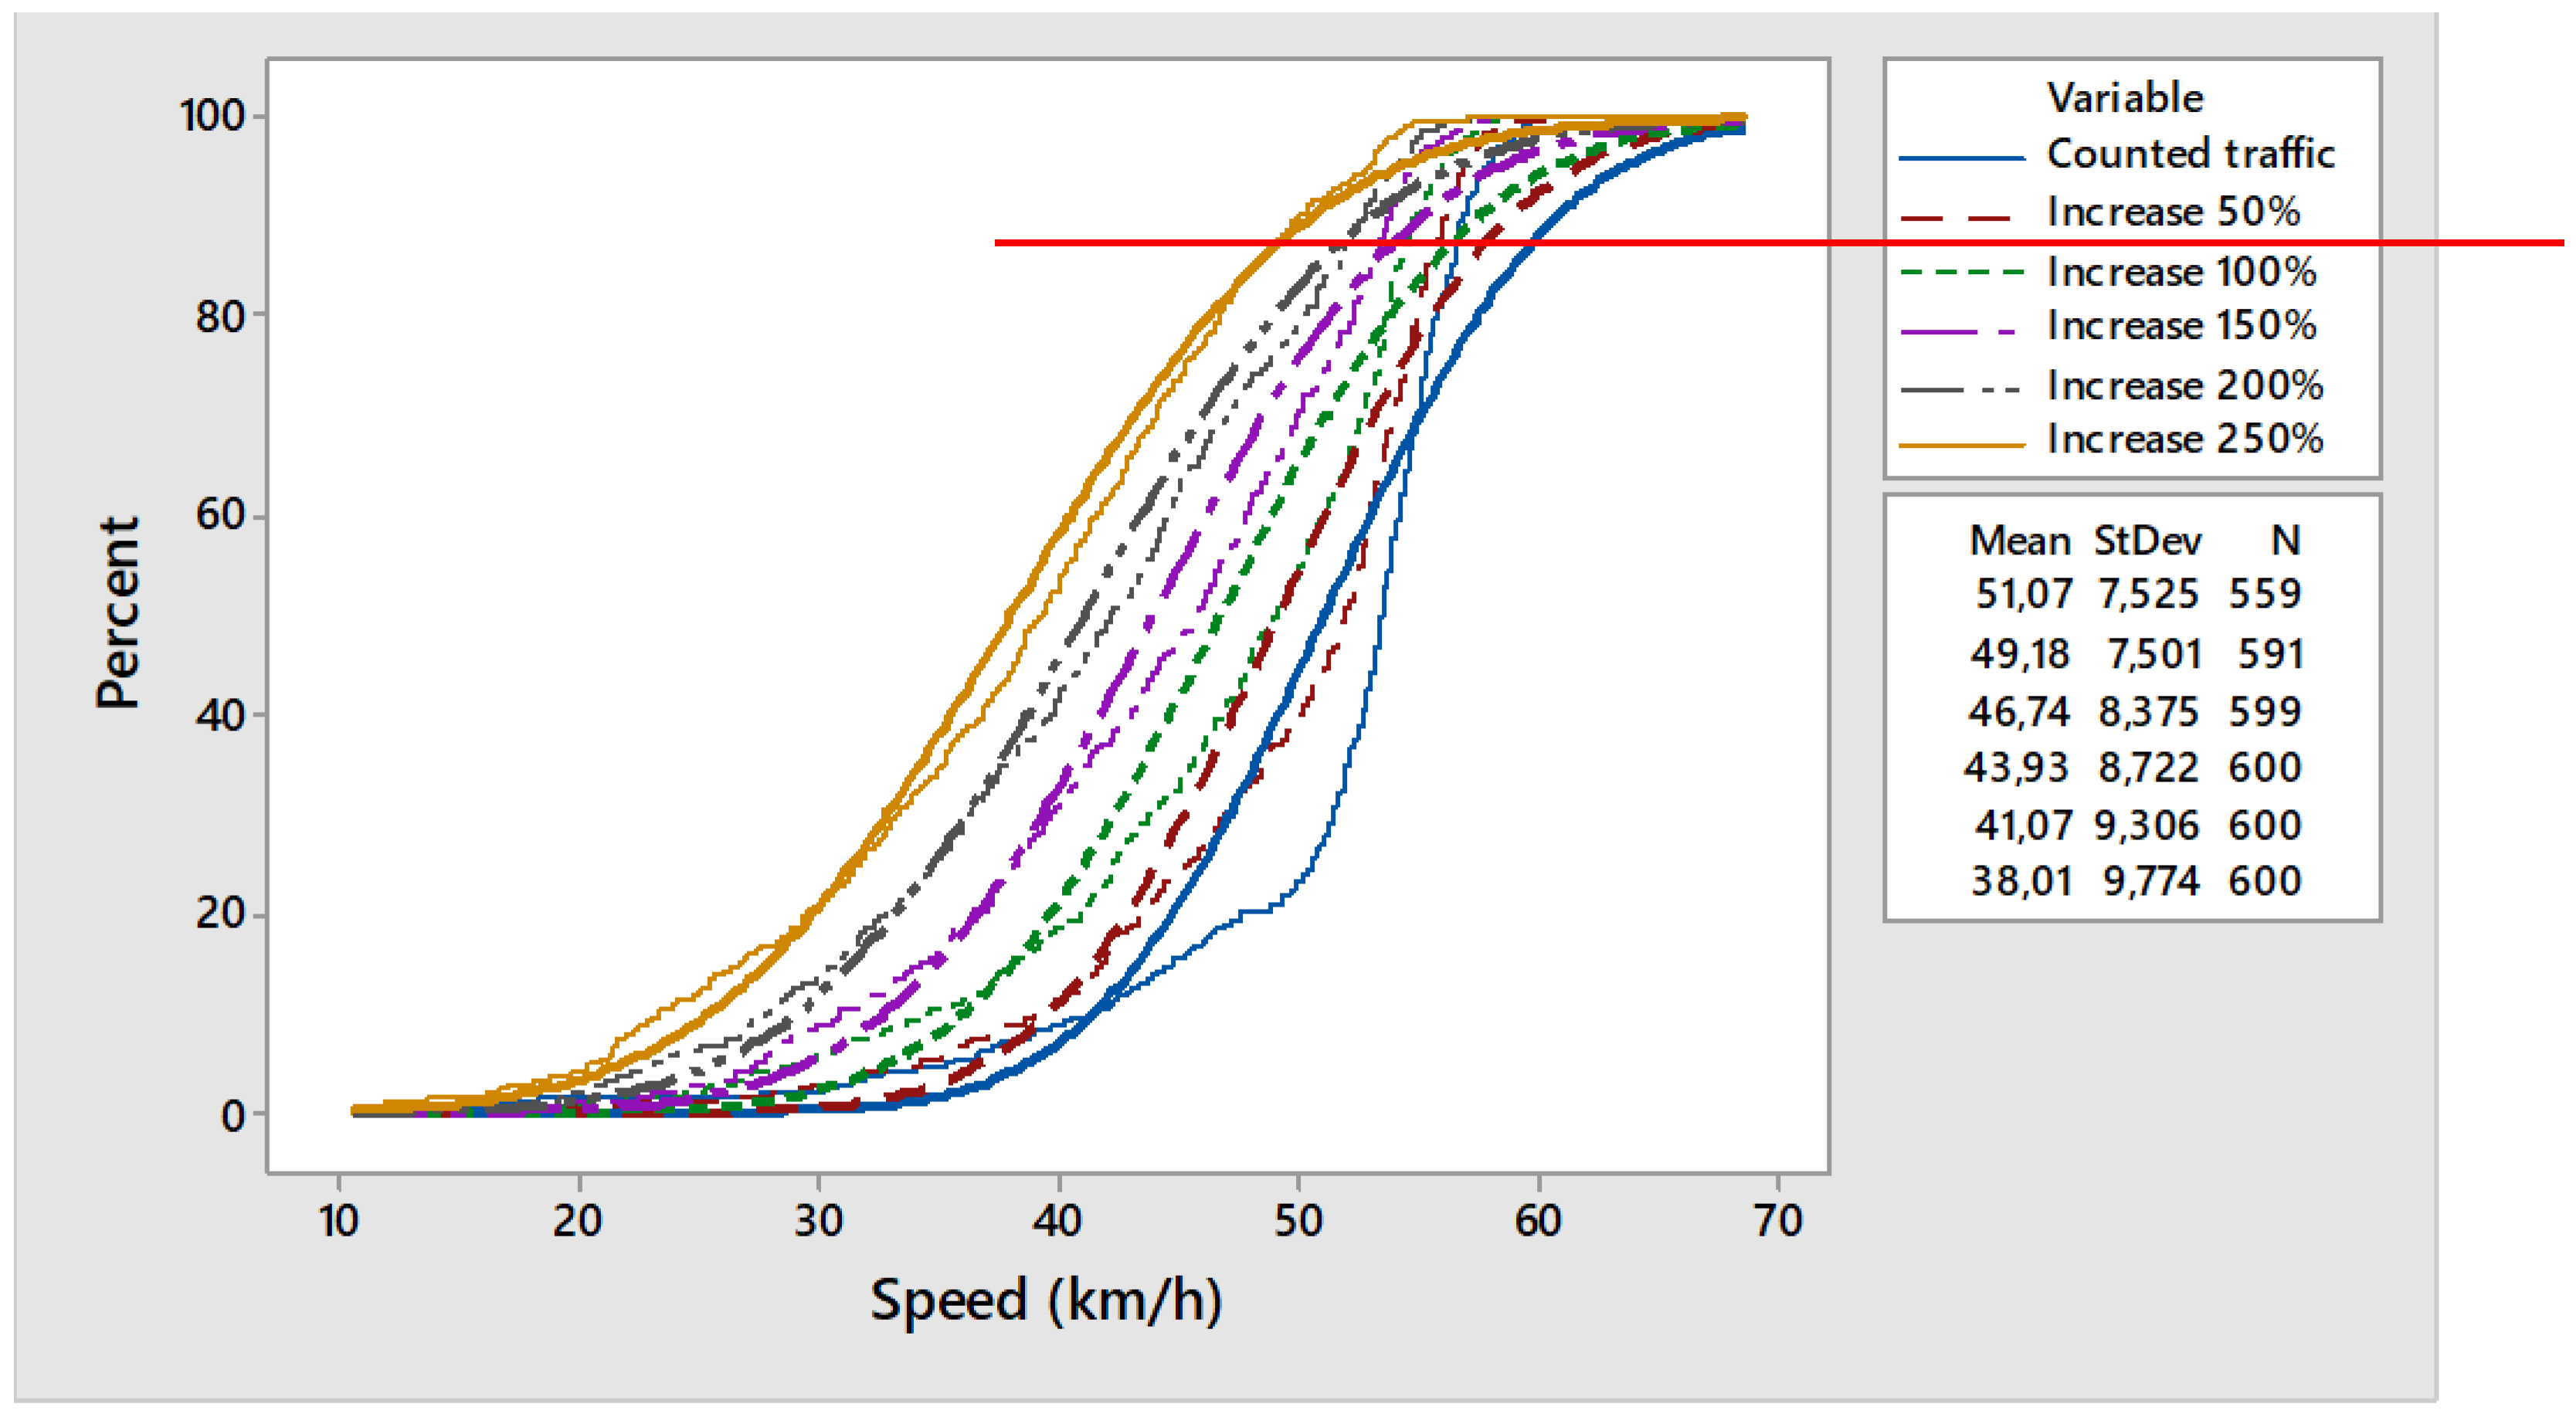
4.2. Statistical Analysis of the Database of Incoming Vehicle Speeds Obtained by Microsimulation
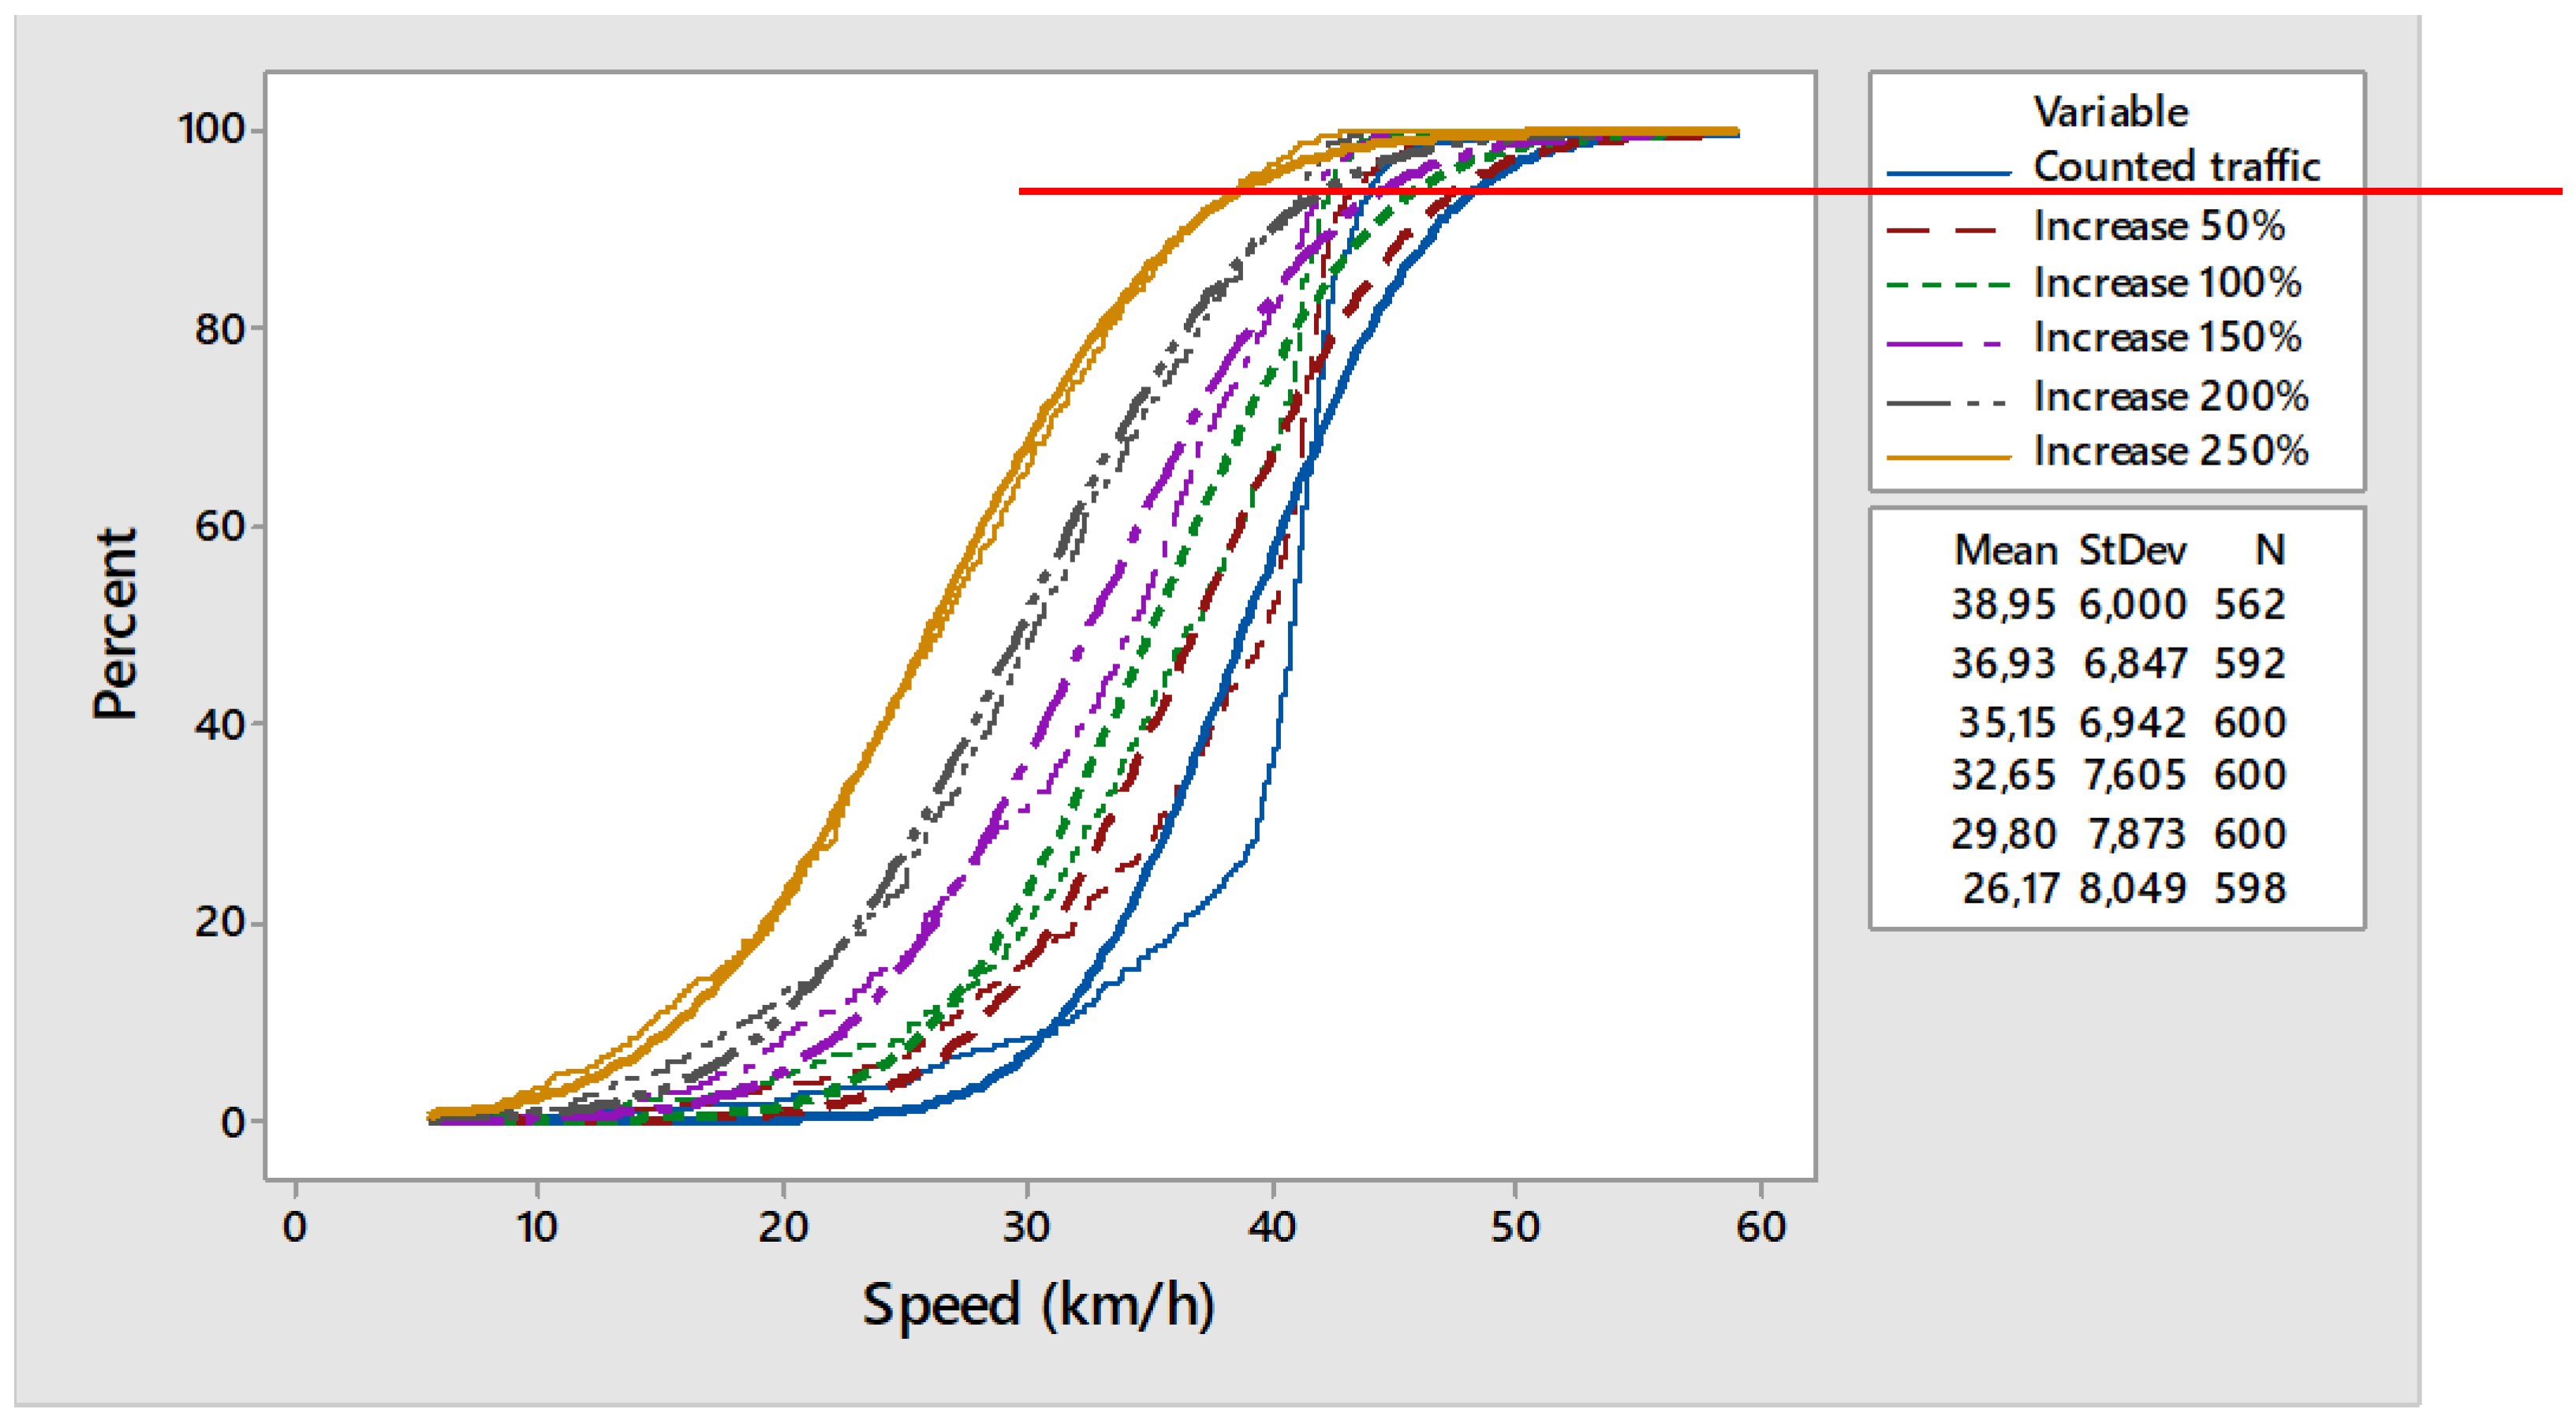
4.2.1. Analysis of the Impact of Traffic Load Increase on Traffic Conditions and Incoming Vehicle Speed
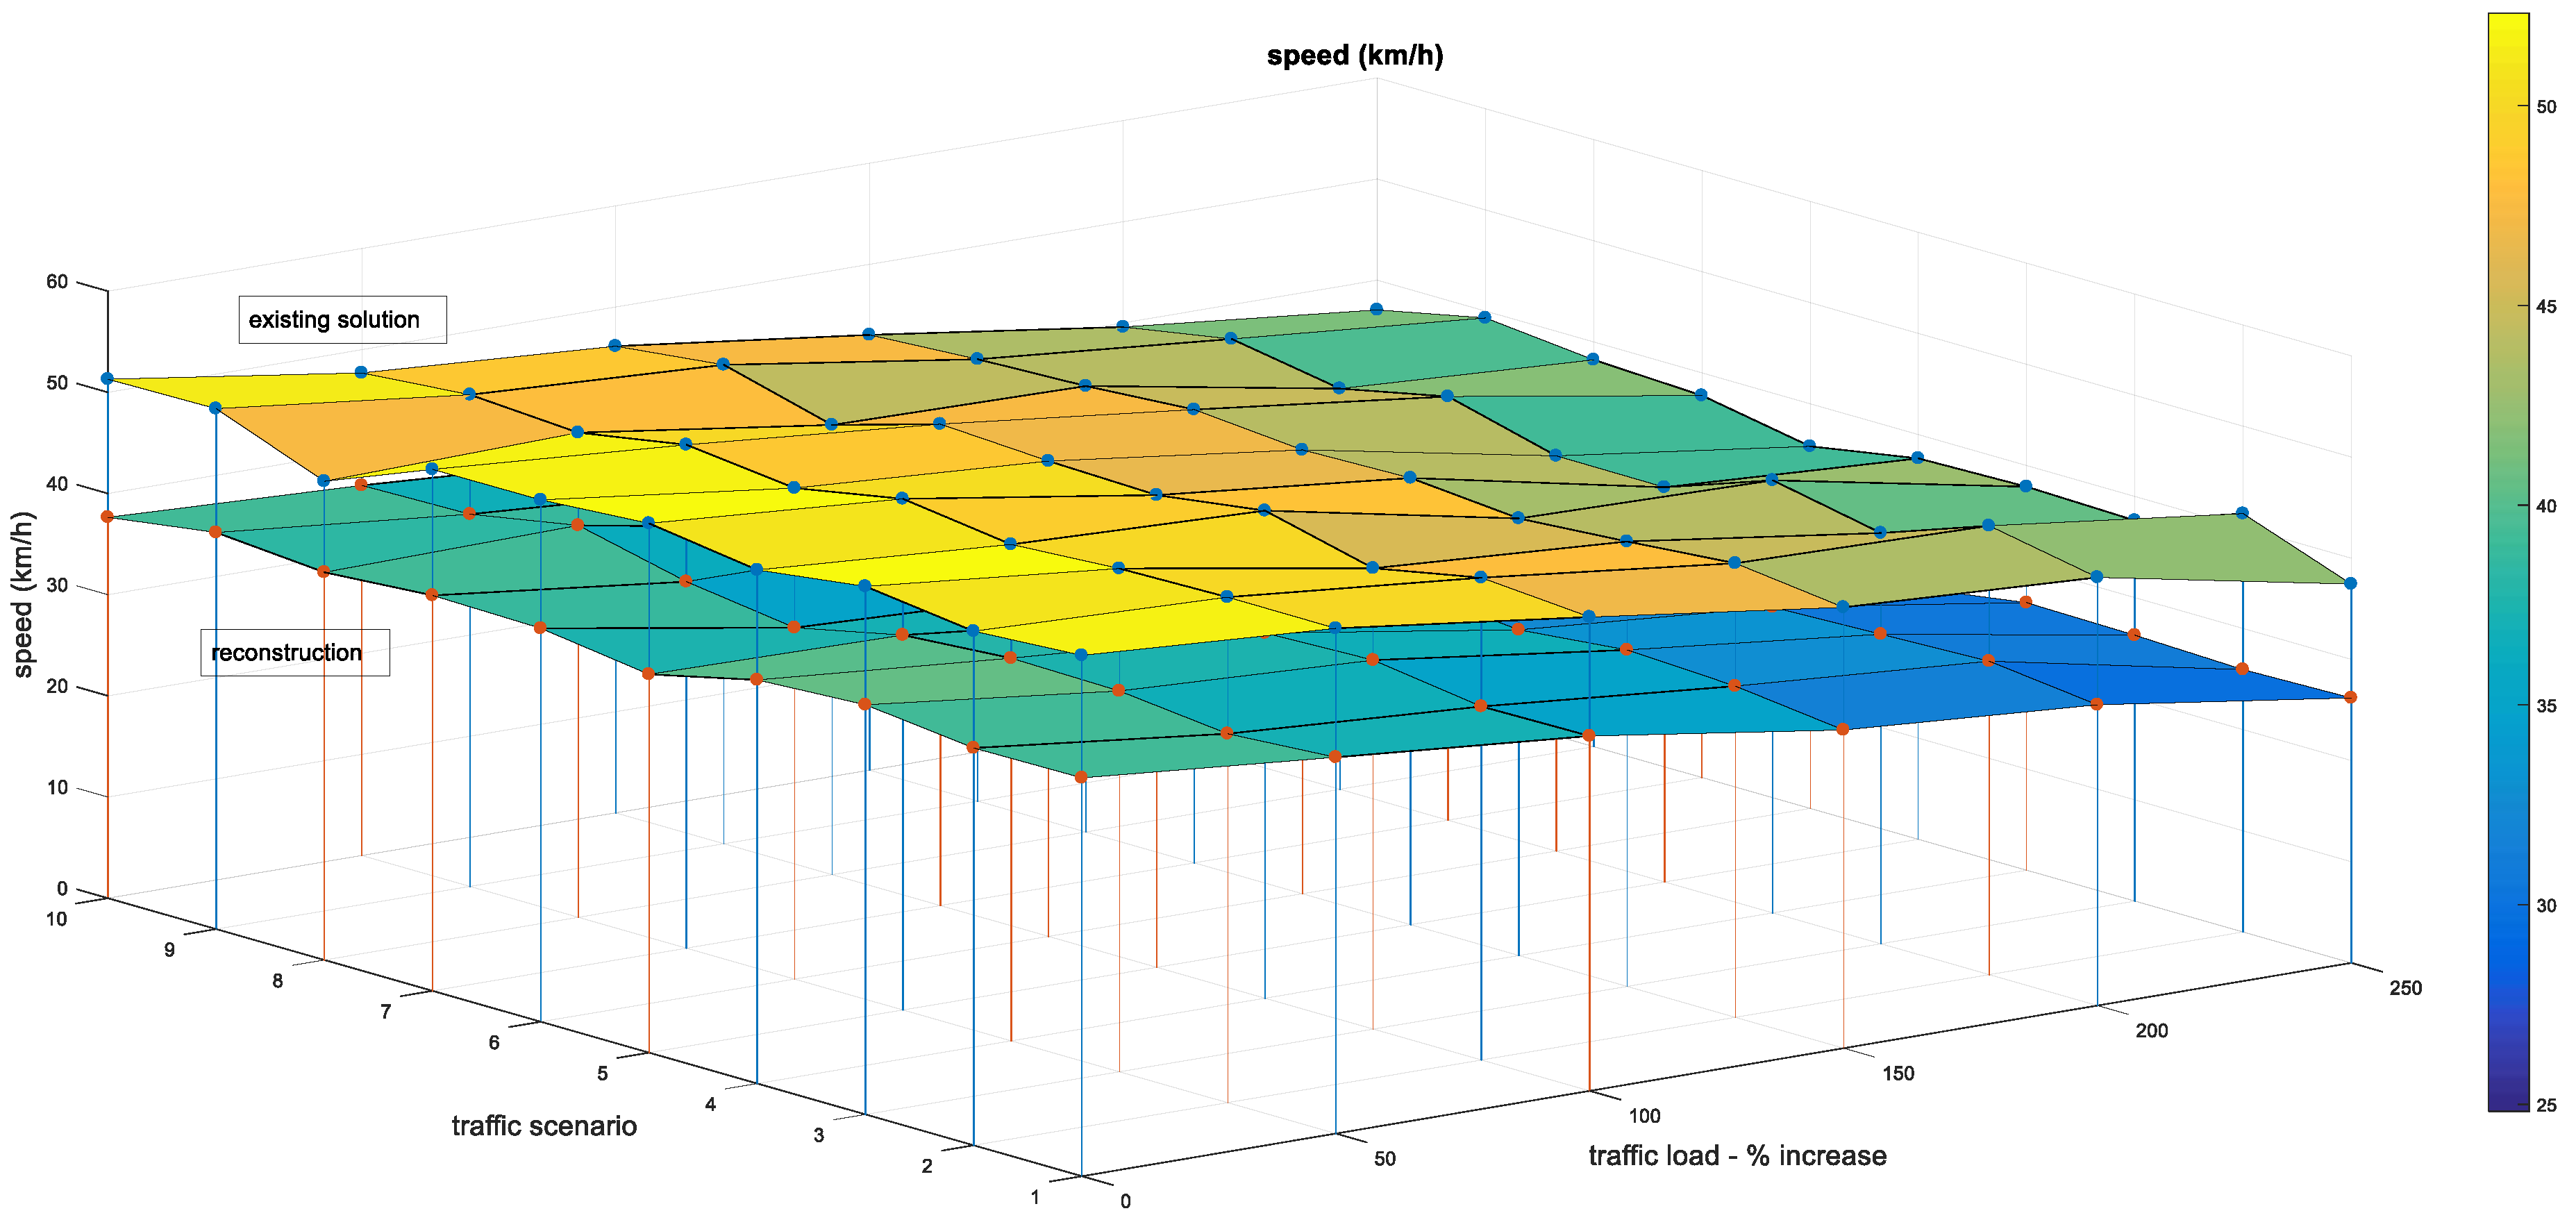
4.2.2. Analysis of the Impact of Reconstruction on Incoming Vehicle Speeds
5. Discussion of Results and Conclusions
Author Contributions
Funding
Data Availability Statement
Acknowledgments
Conflicts of Interest
References
- Road safety statistics 2023 in more detail https://transport.ec.europa.eu/background/road-safety-statistics-2023_en.
- Bulletin on Road Traffic Safety in the Republic of Croatia from 2023 https://mup.gov.hr/UserDocsImages/statistika/2024/6/Bilten_o_sigurnosti_cestovnog_prometa_2023.pdf.
- Rosen, E.; Stigson, H.; Sander, U. Literature review of pedestrian fatality risk as a function of car impact speed. Accid. Anal. Prev., 2011., 43(1), 25-33. [CrossRef]
- Cuerden, R.; Richards, D.; Hill, J. Pedestrians and their survivability at different impact speeds. In Proceedings of the 20th International Technical Conference on the Enhanced Safety of Vehicles, Lyon, France, Paper No. 07-0440, (June, 2007.).
- Hussain, Q.; Feng, H.; Grzebieta, R.; Brijs, T.; Olivier, J. The relationship between impact speed and the probability of pedestrian fatality during a vehicle-pedestrian crash: A systematic review and meta-analysis. Accid. Anal. Prev., 2019., 129, 241-249.. [CrossRef]
- Thakur, S.; Biswas, S. Assessment of pedestrian-vehicle interaction on urban roads: a critical review. Arch. Transp, 2019. 51(3), 49-63. [CrossRef]
- Pérez-Acebo, H.; Otxoa-Muñoz, X.; Marquina-Llaguno, M.; Gonzalo-Orden, H. Evaluation of the Efficiency of Traffic Lights Turning Red in Case of Exceeding Speed Limit with Previous Panels Indicating the Speed. Transp. Res. Procedia, 2021, Vol.58, pp. 45-52. [CrossRef]
- Pérez-Acebo, H.; Ziolkowski, R.; Gonzalo-Orden, H. Evaluation of the Radar Speed Cameras and Panels Indicating the Vehicles’ Speed as Traffic Calming Measures (TCM) in Short Length Urban Areas Located along Rural Roads. Energies, 2021, 14, 8146. [CrossRef]
- Kattan, L.; Tay, R.; Acharjee, S. Managing speed at school and playground zones. Accid. Anal. Prev., 2011., 43(5), 1887-1891. [CrossRef]
- Gonzalo-Orden, H.; Pérez-Acebo, H.; Unamunzaga, A. L.; Rojo Arce, M. Effects of traffic calming measures in different urban areas, Transp. Res. Procedia, 2018, Vol. 33, pp. 83-90. [CrossRef]
- Vadeby, A.; Forsman, Å. Traffic safety effects of new speed limits in Sweden. Accid. Anal. Prev., 2018., 114, 34-39.. [CrossRef]
- Barón, L.; Otila da Costa, J.; Soares, F.; Faria, S.; Prudêncio Jacques, M. A.; Fraga de Freitas, E. Effect of built environment factors on pedestrian safety in Portuguese urban areas. Appl. syst. innov, 2021, 4(2), 28.. [CrossRef]
- Tanishita, M.; Sekiguchi, Y.; Sunaga, D. Impact analysis of road infrastructure and traffic control on severity of pedestrian–vehicle crashes at intersections and non-intersections using bias-reduced logistic regression, IATSS Res, 2023, V. 47 (2), pp. 233-239. [CrossRef]
- Sadrayi, A.; Boroujerdian, A. M. Assessment of Pedestrian Refuge Islands on Vehicle Speed Changes and Pedestrian Safety: Case Study in Tehran, J. traffic logist. eng. ,2016, Vol. 4, No. 1. [CrossRef]
- Makó, E.; Szakonyi, P. Evaluation of human behaviour at pedestrian crossings, Transp. Res. Procedia, 2016, Vol. 14, pp. 2121-2128. [CrossRef]
- Vignali, V.; Pazzini, M.; Ghasemi, N.; Lantieri, C.; Simone, A.; Dondi, G. The safety and conspicuity of pedestrian crossing at roundabouts: The effect of median refuge island and zebra markings, TRANSPORT RES F-TRAF, 2020, Vol. 68, pp. 94-104. [CrossRef]
- Karwand, Z.; Mokhtar, S.; Suzuki, K.; Oloruntobi, O.; Shah, M.Z.; Misnan, S.H. Impact of Splitter-Island on Pedestrian Safety at Roundabout Using Surrogate Safety Measures: A Comparative Study. Sustainability, 2023, 15, 5359. [CrossRef]
- Sołowczuk, A.; Kacprzak, D. Identification of Determinants of the Speed-Reducing Effect of Pedestrian Refuges in Villages Located on a Chosen Regional Road. Symmetry, 2019, 11, 597. [CrossRef]
- Kruszyna, M.; Matczuk-Pisarek, M. The Effectiveness of Selected Devices to Reduce the Speed of Vehicles on Pedestrian Crossings. Sustainability, 2021, 13, 9678. [CrossRef]
- Saleh, W.; Grigorova, M.; Elattar, S. Pedestrian Road Crossing at Uncontrolled Mid-Block Locations: Does the Refuge Island Increase Risk? Sustainability, 2020, 12, 4891. [CrossRef]
- Majer, S.; Sołowczuk, A. Traffic Calming Measures and Their Slowing Effect on the Pedestrian Refuge Approach Sections. Sustainability, 2023, 15, 15265. [CrossRef]
- Gates, T. J.; Noyce, D. A.; Bill, A. R.; Van Ee, N. Recommended Walking Speeds for Pedestrian Clearance Timing Based on Pedestrian Characteristics, Transp. Res. Procedia, 2006, Paper No. 06-1826, TRB 2006 Annual Meeting. https://files.topslab.wisc.edu/publications/2006/noyce_2006_1826.pdf.
- Dommes, A.; Merlhiot, G.; Lobjois, R.; Dang, N.-T.; Vienne, F.; Boulo, J.; Oliver, A.-H.; Crétual, A.; Cavallo, V. Young and older adult pedestrians’ behavior when crossing a street in front of conventional and self-driving cars, Accid. Anal. Prev., 2021, Vol. 159, 106256. [CrossRef]
- Chai, C.; Shi, X.; Wong, Y. D.; Er, M. J.; Gwee, E. T. M. Fuzzy logic based observation and evaluation of pedestrians’ behavioral patterns by age and gender. TRANSPORT RES F-TRAF, 2016, 40, 104 118. [CrossRef]
- Ma, J.; Shen, Z.; Wang, N.; Xiao, X.; Zhang, J. Developmental differences in children’s adaptation to vehicle distance and speed in street-crossing decision-making, J Safety Res, 2024, Vol. 88, pp. 261-274. [CrossRef]
- Ferenchak, N. N. Pedestrian age and gender in relation to crossing behavior at midblock crossings in India. J. Traffic Transp. Eng, 2016, 3(4), 345-351. [CrossRef]
- Ištoka Otković, I. A Model to Predict Children’s Reaction Time at Signalized Intersections. Safety, 2020, 6, 22. [CrossRef]
- Gruden, C.; Ištoka Otković, I.; Šraml, M. Pedestrian safety at roundabouts: Their crossing and glance behavior in the interaction with vehicular traffic. Accid. Anal. Prev., 2021, 159 , 106290, 11. [CrossRef]
- Gruden, C.; Ištoka Otković, I.; Šraml, M. Safety Analysis of Young Pedestrian Behavior at Signalized Intersections: An Eye-Tracking Study. Sustainability 2021, 13, 4419. [CrossRef]
- Campisi, T.; Ištoka Otković, I.; Šurdonja, S.; Deluka-Tibljaš, A. Impact Of Social and Technological Distraction on Pedestrian Crossing Behaviour: A Case Study in Enna, Sicily. Transp. Res. Procedia, 2022, Vol.60, pp. 100-107. [CrossRef]
- Deluka-Tibljaš, A.; Ištoka Otković, I.; Campisi, T.; Šurdonja, S. Comparative Analyses of Parameters Influencing Children Pedestrian Behavior in Conflict Zones of Urban Intersections. Safety 2021, 7, 5. [CrossRef]
- Deluka-Tibljaš, A.; Šurdonja, S.; Ištoka Otković, I.; Campisi, T. Child-Pedestrian Traffic Safety at Crosswalks—Literature Review. Sustainability 2022, 14, 1142. [CrossRef]
- Ištoka Otković, I.; Deluka-Tibljaš, A.; Šurdonja, S. Non-signalized crosswalks design influence on children pedestrian behavior // XXVIIth World Road Congress - Prague 2023, 02.10.2023-06.10.2023.
- Gądek-Hawlena, T.; Michalski, K. Behavior and awareness of road traffic hazards among pedestrians in Poland under 18 and over 65 years of age. J. Mod. Sci, 2024, 56(2), 416-436. [CrossRef]
- Liu, Y. C.; Tung, Y. C. Risk analysis of pedestrians’ road-crossing decisions: Effects of age, time gap, time of day, and vehicle speed. Saf Sci, 2014, 63, 77-82. [CrossRef]
- Flötteröd, G.; Chen, Y.; Nagel, K. Behavioral calibration and analysis of a large-scale travel microsimulation. Netw. Spat. Econ. 2012, 12, 481–502. [CrossRef]
- Shahdah, U.; Saccomanno, F. Persaud, B. Application of traffic microsimulation for evaluating safety performance of urban signalized intersections, Transp. Res. Part C Emerg. Technol, 2015, Vol. 60, pp. 96-104. [CrossRef]
- Mahmud, S.M. S.; Ferreira, L.; Hoque, Md. S.; Tavassoli, A. Micro-simulation modelling for traffic safety: A review and potential application to heterogeneous traffic environment, IATSS Res, 2019, 43 (1), pp. 27-36. [CrossRef]
- Zečević, Đ. Analysis of the effects of reconstruction of the vehicle-pedestrian conflict zone according to traffic safety criteria, master thesis, Faculty of Civil Engineering and Architecture Osijek, Josip Juraj Strossmayer University of Osijek, 2022. https://urn.nsk.hr/urn:nbn:hr:133:470433.
- Rovetta A. Raiders of the Lost Correlation: A Guide on Using Pearson and Spearman Coefficients to Detect Hidden Correlations in Medical Sciences. Cureus, 2020, 12(11): e11794. [CrossRef]
- Schober, P.; Boer, C.; Schwarte. L.A. Correlation Coefficients: Appropriate Use and Interpretation. Anesth Analg. 2018, 126(5):1763-1768. PMID: 29481436. [CrossRef]
- Ištoka Otković, I.; Deluka-Tibljaš, A.; Šurdonja, S.; Campisi, T. Development of Models for Children—Pedestrian Crossing Speed at Signalized Crosswalks. Sustainability 2021, 13, 777. [CrossRef]
- Campisi, T., Šurdonja, S., Deluka Tibljaš, A., Ištoka Otković, I. Monitoring speed variation and pedestrian crossing distraction in Enna (Sicily) during different pandemic phases. Transp. Res. Procedia, 2023, Vol.69, pp. 647-654. [CrossRef]
- Wang, H.; Schwebel, D.C.; Tan, D.; Shi, L.; Miao, L. Gender differences in children's pedestrian behaviors: Developmental effects. J Safety Res. 2018, Dec;67:127-133. [CrossRef]
- Yao, B.; Chen, C.; Cao, Q.; Jin, L.; Zhang, M.; Zhu, H.; Yu, B. Short-Term Traffic Speed Prediction for an Urban Corridor. COMPUT-AIDED CIV INF, 2017, 32: 154-169.. [CrossRef]
- Miao, C.; Liu, H.; Zhu, G. G.; Chen, H. Connectivity-based optimization of vehicle route and speed for improved fuel economy, Transp Res Part C Emerg Technol, 2018, Vol. 91, pp. 353-368. [CrossRef]

| Variables | Data type | Description | Type of variable | |
|---|---|---|---|---|
| 1. | Age group | number | Pedestrian are divided into age groups according to criteria 1= < 6y; 2 = 7 -10y; 3 = 11-14y; 4 = 15-18 y; 5 =19-24 y; 6 = 25-40 y; 7= 41-65 y; 8= >65y |
categorical |
| 2. | Gender | 0/1 | Gender of the pedestrian girl →0, boys →1 |
categorical |
| 3. | Supervision | 0/1 | Adult supervision for children NO→0, YES→1 |
categorical |
| 4. | Special need | 0/1 | A pedestrian with difficulties (e.g., motor or visual) NO→0, YES→1 | categorical |
| 5. | Group-number | number | Movement of pedestrian in a group; number of pedestrians in the group; if the pedestrian moves individually, the number is 1 | categorical |
| 6. | Mobile talk/listening music | 0/1 | Using a mobile phone without disturbing visual attention NO→0, YES→1 |
categorical |
| 7. | Mobile sms/Internet | 0/1 | Mobile phone use with visual distraction NO→0, YES→1 |
categorical |
| 8. | Crossing outside crosswalk | 0/1 | Crossing the road outside the pedestrian crosswalk NO→0, YES→1 |
categorical |
| 9. | Running | 0/1 | Crossing the road by running over NO→0, YES→1 |
categorical |
| 10. | Checking left | 0/1 | Checking the traffic situation before crossing the road (left side) NO→0, YES→1 |
categorical |
| 11. | Checking right | 0/1 | Checking the traffic situation before crossing the road (right side) NO→0, YES→1 |
categorical |
| 12. | Vehicle arrives left | 0/1 | The arrival of a vehicle towards a pedestrian from the left side of the pedestrian NO→0, YES→1 |
categorical |
| 13. | Vehicle arrives right | 0/1 | The arrival of a vehicle towards a pedestrian from the right side of the pedestrian NO→0, YES→1 |
categorical |
| 14. | Vehicle stopping left | -1/0/1 | The vehicle coming from the left has stopped in front of the pedestrian crosswalk -1 the vehicle does not approach; 0 the vehicle did not stop; 1 vehicle stopped |
categorical |
| 15. | Vehicle stopping right | -1/0/1 | The vehicle coming from the right has stopped in front of the pedestrian crosswalk -1 the vehicle does not approach; 0 the vehicle did not stop; 1 vehicle stopped |
categorical |
| 16. | Vehicle breaking left | -1/0/1 | The vehicle coming from the left slowed down/braked in front of the pedestrian crosswalk -1 the vehicle does not approach; 0 the vehicle did not slow down/braked; 1 vehicle slow down/braked |
categorical |
| 17. | Vehicle breaking right | -1/0/1 | The vehicle coming from the right slowed down/braked in front of the pedestrian crosswalk -1 the vehicle does not approach; 0 the vehicle did not slow down/braked; 1 vehicle slow down/braked |
categorical |
| 18. | Total number of children at crosswalk | number | The total number of children at the crosswalk at the time of observation, who may or may not be moving in a common group | continuous |
| 19. | Total number of pedestrians at crosswalk | number | The total number of pedestrians at the crosswalk at the time of observation, together with child pedestrians | continuous |
| 20. | Number of cyclists at crosswalk | number | Number of cyclists crossing the road using the observed pedestrian crosswalk | continuous |
| 21. | V85 | km/h | 85th percentile speed of incoming traffic flow | continuous |
| 23. | Vmax | km/h | The maximum recorded vehicle speed in the observed hour in the observed conflict zone | continuous |
| 24. | Vexc | % | The percentage of vehicles that drive faster than the speed limit | continuous |
| 25. | Vehicle traffic load | veh/h | Vehicle traffic load in the observed hour expressed through the number of vehicles per hour | continuous |
| 26. | Pedestrian traffic load | ped/h | Pedestrian traffic load at the observed pedestrian crosswalk in the observed hour expressed in terms of the number of pedestrians per hour | continuous |
| 27. | % of freight vehicles | % | Within the traffic structure, the percentage of freight vehicles in the observed hour | continuous |
| 28. | % of buses | % | Within the traffic structure, the percentage of buses in the observed hour | continuous |
| 29. | % of heavy goods vehicles | % | Within the traffic structure, the percentage of heavy goods vehicles in the observed hour | continuous |
| 30. | % of bicycles and motorbikes | % | Within the framework of the traffic structure, the percentage of bicycles and motorcycles in the observed hour | continuous |
| 31. | The length of the pedestrian crosswalk | m | The length of the observed pedestrian crosswalk | continuous |
| 32. | The width of the pedestrian crosswalk | m | The width of the observed pedestrian crosswalk | continuous |
| 33. | Pedestrian island | 0/1 | The existence of a pedestrian island at the observed pedestrian crosswalk NO→0, YES→1 |
categorical |
| 34. | Horizontal speed retarders | 0/1 | The existence of horizontal discontinuities as vehicle speed decelerators, shortly before or at the observed pedestrian crosswalk NO→0, YES→1 |
categorical |
| 35. | Vertical speed retarders | 0/1 | The existence of vertical discontinuities as vehicle speed decelerators, shortly before or at the observed pedestrian crosswalk NO→0, YES→1 |
categorical |
| 36. | Pedestrian crosswalk at the intersection | 0/1 | The observed pedestrian crosswalk is located at the intersection NO→0, YES→1 |
categorical |
| Drinska - main street | Krbavska - side street | |||
|---|---|---|---|---|
| east-west | west-east | north-south | south-north | |
| Vehicles [veh/h] | 195 | 164 | 38 | 63 |
| Pedestrians [ped/h] | 107 | - | 17 | 72 |
| N | Mean | StDev | Min | Max | |
| Measured speed [km/h] | 195 | 51,50 | 11,09 | 21,00 | 76,00 |
| Counted traffic | Increase 100% | Increase 150% | Increase 200% | |||||
| QLenmax | VehDelay | QLenmax | VehDelay | QLenmax | VehDelay | QLenmax | VehDelay | |
| Existing Inters. | 10,38 | 1,59 | 28,28 | 3,85 | 35,95 | 4,56 | 38,5 | 11,97 |
| solution 1 | 13,79 | 1,85 | 36,29 | 5,13 | 41,57 | 7,59 | 42,4 | 15,71 |
| solution 2 | 22,63 | 2,06 | 38,44 | 4,31 | 39,84 | 11,17 | 43,62 | 20,41 |
| Counted traffic | Increase 100% | Increase 150% | Increase 200% | ||
| Existing Intersec. | East | 51,07 | 46,75 | 43,93 | 41,07 |
| West | 50,15 | 45,43 | 43,55 | 40,67 | |
| solution 1 | East | 38,95 | 35,15 | 32,65 | 29,80 |
| West | 27,88 | 28,56 | 30,52 | 21,20 | |
| solution 2 | East | 33,39 | 35,19 | 33,99 | 29,27 |
| West | 26,95 | 29,03 | 26,94 | 28,85 | |
| solution 3 | East | 38,5 | 36,1 | 33,66 | 30,49 |
| West | 28,87 | 29,8 | 28,08 | 28,93 | |
| N | Mean | StDev | Min | Max | Median | A-D | p | |
| Children - crossing time | 89 | 4,53 | 0,67 | 2,96 | 6,78 | 4,53 | 0,701 | 0,065 |
| Children - reaction time | 89 | 0,76 | 0,91 | 0,00 | 3,94 | 0,43 | 5,75 | 0,000 |
| Adults - crossing time | 19 | 4,77 | 1,40 | 1,85 | 8,41 | 4,66 | 0,42 | 0,294 |
| Adults - reaction time | 19 | 1,24 | 1,80 | 0,00 | 7,61 | 0,87 | 1,84 | 0,000 |
| Variables | children and teenagers | adult pedestrians | |||||||
| crossing | reaction | crossing | reaction | ||||||
| SR | p | SR | p | SR | p | SR | p | ||
| 1. | Age group | 0,63 | 0,02 | -0,51 | 0,04 | 0,48 | 0,03 | 0,63 | 0,02 |
| 2. | Gender | 0,05 | 0,63 | 0,02 | 0,89 | -0,52 | 0,03 | 0,48 | 0,05 |
| 3. | Supervision | * | * | * | * | * | * | * | * |
| 4. | Special need | * | * | * | * | 0,49 | 0,04 | 0,35 | 0,09 |
| 5. | Group-number | -0,52 | 0,04 | -0,17 | 0,12 | 0,47 | 0,04 | -0,39 | 0,10 |
| 6. | Mobile talk/listening music | * | * | * | * | * | * | * | * |
| 7. | Mobile sms/Internet | 0,11 | 0,29 | 0,61 | 0,02 | * | * | * | * |
| 8. | Cross outside crossing | -0,05 | 0,62 | 0,10 | 0,37 | -0,39 | 0,11 | 0,05 | 0,83 |
| 9. | Running | -0,61 | 0,02 | 0,45 | 0,05 | * | * | * | * |
| 10. | Checking left | 0,50 | 0,01 | 0,82 | 0,00 | 0,06 | 0,81 | 0,89 | 0,00 |
| 11. | Checking right | 0,48 | 0,01 | 0,78 | 0,00 | -0,06 | 0,81 | 0,86 | 0,00 |
| 12. | Veh arrives left | -0,03 | 0,76 | -0,01 | 0,90 | 0,02 | 0,90 | -0,33 | 0,15 |
| 13. | Veh arrives right | -0,48 | 0,00 | -0,01 | 0,90 | 0,07 | 0,75 | -0,19 | 0,42 |
| 14. | Veh stopping left | 0,55 | 0,00 | 0,06 | 0,60 | 0,00 | 1,00 | 0,39 | 0,15 |
| 15. | Veh stopping right | 0,47 | 0,00 | 0,06 | 0,59 | -0,01 | 0,90 | 0,11 | 0,65 |
| 16. | Veh breaking left | 0,01 | 0,93 | 0,04 | 0,72 | 0,00 | 1,00 | 0,34 | 0,15 |
| 17. | Veh breaking right | 0,45 | 0,00 | 0,03 | 0,77 | 0,08 | 0,75 | 0,19 | 0,42 |
| 18. | Total number of children at ped crosswalk | -0,33 | 0,01 | -0,39 | 0,01 | 0,11 | 0,67 | -0,63 | 0,04 |
| 19. | Total number of pedestrians at ped crosswalk | -0,88 | 0,00 | -0,12 | 0,25 | 0,68 | 0,04 | -0,59 | 0,04 |
| 20. | Number of cyclists at ped crosswalk | 0,09 | 0,38 | 0,07 | 0,55 | * | * | * | * |
| N | Mean | StDev | Min | Max | Median | Varianc | A-D | p | |
| Counted traffic | 559 | 51,07 | 7,53 | 12,5 | 59,87 | 53,42 | 56,63 | 44,7 | 0,000 |
| Increase 50% | 591 | 49,18 | 7,51 | 14,9 | 60,07 | 51,92 | 56,27 | 24,1 | 0,000 |
| Increase 100% | 599 | 46,75 | 8,38 | 12,4 | 58,30 | 49,07 | 70,14 | 18,5 | 0,000 |
| Increase 150% | 600 | 43,93 | 8,72 | 14,48 | 57,79 | 45,83 | 76,07 | 8,9 | 0,000 |
| Increase 200% | 600 | 41,07 | 9,31 | 13,4 | 57,29 | 42,22 | 86,61 | 4,7 | 0,000 |
| Increase 250% | 600 | 38,02 | 9,77 | 10,64 | 57,02 | 39,30 | 95,53 | 3,7 | 0,000 |
| N | Mean | StDev | Min | Max | Median | Varianc | A-D | p | |
| Counted traffic | 562 | 38,95 | 6,00 | 7,9 | 59,08 | 40,85 | 36,00 | 46,7 | 0,000 |
| Increase 50% | 592 | 36,93 | 6,85 | 7,7 | 48,12 | 39,81 | 46,88 | 30,0 | 0,000 |
| Increase 100% | 600 | 35,15 | 6,94 | 7,8 | 48,87 | 36,77 | 48,19 | 17,2 | 0,000 |
| Increase 150% | 600 | 32,65 | 7,61 | 8,9 | 45,45 | 34,30 | 57,84 | 9,6 | 0,000 |
| Increase 200% | 600 | 29,80 | 7,87 | 7,6 | 43,72 | 30,43 | 61,99 | 3,0 | 0,000 |
| Increase 250% | 598 | 26,17 | 8,05 | 5,6 | 42,87 | 26,52 | 64,79 | 1,2 | 0,000 |
| Counted/ Incr. 50% |
Counted/ Incr.100 |
Count/ Incr.150 |
Incr.50/ Incr.100 |
Incr.100/ Incr.150 |
Incr.150/ Incr.200 |
Incr.200/ Incr.250 |
|
| σ1 /σ2 | 1,00 | 0,90 | 0,86 | 0,90 | 0,96 | 0,94 | 0,95 |
| V1/V2 | 1,01 | 0,81 | 0,74 | 0,80 | 0,92 | 0,88 | 0,91 |
| Bonett | -* | -* | -* | -* | -* | 2,77 | 1,72 |
| p | 0,97 | 0,13 | 0,02 | 0,06 | 0,40 | 0,10 | 0,19 |
| Levene | 6,2 | 25,6 | 52,8 | 7,52 | 4,52 | 3,05 | 0,61 |
| p | 0,13 | 0,00 | 0,00 | 0,01 | 0,03 | 0,08 | 0,44 |
| Counted/ Incr. 50% |
Counted/ Incr.100 |
Count/ Incr.150 |
Incr.50/ Incr.100 |
Incr.100/ Incr.150 |
Incr.150/ Incr.200 |
Incr.200/ Incr.250 |
|
| σ1 /σ2 | 0,88 | 0,86 | 0,79 | 0,99 | 0,91 | 0,96 | 0,98 |
| V1/V2 | 0,77 | 0,75 | 0,62 | 0,97 | 0,83 | 0,93 | 0,96 |
| Bonett | -* | -* | -* | -* | 3,76 | 0,76 | - |
| p | 0,07 | 0,03 | 0,00 | 0,81 | 0,05 | 0,38 | 0,55 |
| Levene | 18,92 | 39,7 | 73,10 | 2,27 | 6,37 | 0,90 | 0,79 |
| p | 0,00 | 0,00 | 0,00 | 0,13 | 0,01 | 0,34 | 0,37 |
| Counted | Increase 50% | Increase 100% | Increase 150% | Increase 200% | Increase 250% | |||||||
| Exist | Recon | Exist | Recon | Exist | Recon | Exist | Recon | Exist | Recon | Exist. | Recon | |
| Vmean | 51,07 | 38,95 | 49,18 | 36,93 | 46,75 | 35,15 | 43,93 | 32,65 | 41,07 | 29,80 | 38,02 | 26,17 |
| σ | 7,33 | 6,00 | 7,51 | 6,85 | 8,38 | 6,94 | 8,72 | 7,61 | 9,31 | 7,87 | 9,77 | 8,05 |
| Varian | 56,63 | 36,00 | 56,27 | 46,88 | 70,14 | 48,19 | 76,07 | 57,84 | 86,61 | 6,99 | 95,53 | 64,79 |
| Bonett | - | - | - | 10,74 | 19,24 | - | ||||||
| p | 0,014 | 0,054 | 0,001 | 0,001 | 0,000 | 0,000 | ||||||
| Levene | 7,95 | 9,35 | 10,42 | 11,27 | 19,10 | 17,93 | ||||||
| p | 0,005 | 0,003 | 0,001 | 0,001 | 0,000 | 0,000 | ||||||
Disclaimer/Publisher’s Note: The statements, opinions and data contained in all publications are solely those of the individual author(s) and contributor(s) and not of MDPI and/or the editor(s). MDPI and/or the editor(s) disclaim responsibility for any injury to people or property resulting from any ideas, methods, instructions or products referred to in the content. |
© 2024 by the authors. Licensee MDPI, Basel, Switzerland. This article is an open access article distributed under the terms and conditions of the Creative Commons Attribution (CC BY) license (http://creativecommons.org/licenses/by/4.0/).


