
Submitted:
08 October 2024
Posted:
09 October 2024
You are already at the latest version
Abstract
The aim of this study is to explore the influence of Environmental, Social, and Governance (ESG) factor on business failure in Brazil by employing advanced machine learning techniques. We collected data from 235 companies and conducted Principal Component Analysis (PCA) on 40 variables already used in the bankruptcy failure literature, resulting in the formation of 7 variables that predict business failure. The results indicate that ESG factor significantly predict business failure in Brazil. This study has implications for investors, policymakers, and business leaders, offering a more precise tool for risk assessment and strategic decision-making.
Keywords:
Environmental
; Social
; and Governance (ESG)
; Business Failure in Brazil
; Principal Component Analysis (PCA)
; Machine Learning Techniques
; Confusion Matrix
; Precision Score
Introduction
Prediction of business failure is an issue of paramount importance to ensure economic stability in developing economies such as Brazil. The success in predicting corporate failure is essential for investment protection and economic stability. Over time researchers have developed a resilient framework for ensuring financial stability with distinct obstacles presented to developing nations (Michela, 2023). This justifies the need for a more accurate, geographically localized model to look at the different distinct economic obstacles (Habib, 2023). According to Michalkova et al., (2018), the power of prediction of business failure has the potential to evaluate the well-being of a company and make informed decisions while avoiding the risk of economic downturn.
It is important to understand how local factors lead to bankruptcy and establish efficient tools of forecasting that could enhance financial planning and sustainability of businesses (Klutse, 2022). The ability to accurately predict the bankruptcy is essential for managing risks effectively and communicating information that helps stakeholders to understand the factors that are necessary for sustainable economic development. Condon (2022) highlights the increasing occurrence of bankruptcies in emerging markets, indicating a need for new models tailored to such environments. The dynamic nature of Brazil’s economy makes predicting bankruptcy crucial for stakeholders to assess companies’ financial health, enabling informed investment decisions and preemptive actions to prevent economic downturns. According to Bateni & Asghari, (2016), the models of bankruptcy prediction are important in identifying early signs of financial crisis; hence, this allows for early intervention that could prevent failures. This, as argued by (Neumeyer & Perri, 2005), (Furman & Stiglitz, 1998), and (Sachs et al., 1996) would subsequently enhance the accuracy of the predictions, which is an essential requirement to hold onto in unpredictable emerging markets to stabilize the economy. Integrating Environmental, Social, and Governance (ESG) factor into models of bankruptcy prediction augments traditional financial analysis by adding off-the-beaten-path metrics. ESG factors are emerging as key indicators for the financial soundness and sustainability in the long run of a firm.
Researches have indicated that the relationship between ESG transparency and firm value is positive, whereas ESG play a major role in the support of the investment decisions processes. Additional evidence comes from T. Lim (2024) and Helminen (2023) regarding the importance of ESG , specifically ESG further improve the accuracy of risk appraisal and predictive modeling performance. As a result, the integration of ESG would be expected to enhance the bankruptcy prediction models, providing a more comprehensive evaluation of company performance across critical operational, social, and environmental dimensions, which are very essential for making informed decisions and improve the prediction of financial distress. Effective use of the ESG criteria significantly influences the ability to determine the financial stability of a non-financial firms in Brazil.
Following ESG principles helps a company build a good reputation through ongoing transparency, which in turn attracts more investments from its stakeholders (Alsayegh et al., 2020).Neglecting the ESG risks signals indifference to the broader societal and environmental issues; it can result in financial materialization (Liu & Lin, 2022). In the same breath, Chouaibi et al. (2022) affirmed a strong relationship between firm commitment to corporate social responsibility (CSR) and financial strength, hence bringing out the role ESG efforts play in financial positioning. Research also finds that, along with "higher ESG score" companies, there are "lower financial distress risks"; it thus underlines ESG metrics’ value for precursors to financial instabilities (Friede et al., 2015).
The inclusion of ESG considerations in predictive frameworks aligns very well with the need to promote resilient and sustainable business practices among Brazil’s non-financial firms (Ahmad et al., 2021). Studies also pointed out that ESG performance can reduce financial risks, enhance corporate financial performance, and improve firm value (Kim & Li, 2021; Zhao et al., 2018; Aydoğmuş et al., 2022). Also, gradually there is the rising popularity of ESG criteria to increase and incorporate them within the boundaries of regulatory control mechanisms to improve the stability of financial institutions (Capelli et al., 2021). All in all, this change toward the integration of ESG factors within risk management strategies and financial models reflects a larger trend in sustainable and responsible business practices. Basically, with the use of ESG information, firms can at least mitigate their risks and at the same time improve financial performance that, at some point, may attract socially aware investors. In the latter half of this century, with the rise of machine learning techniques, they have been applied to the field of bankruptcy prediction, allowing a gain in precision and stability of the predictive model.
Indeed, promising results of machine learning (ML Models) approaches instigated researchers like Olatunji Akinrinola et al. (2024), Le et al. (2019), and Jadhav et al. (2018) to investigate various ML models and methodologies that herald the bright future of these techniques in revolutionizing the landscape of bankruptcy prediction. Indeed, studies focusing on the accuracy in predicting bankruptcy reveal better results for the models vis-à-vis conventional statistical methods, such as Shekar et al., 2022. Additionally, the study of imbalanced learning methods and the use of artificial neural networks by Ansari et al. (2020) suggest a growing trend in the use of advanced computational technologies in financial analysis. Thus, integrating with the ESG scores as proposed by Elklawy, (2024) stands the convergence of cutting-edge analytics with sustainability considerations, aiming at a most accurate and comprehensive prediction of financial distress.
Despite the progress made in bankruptcy prediction models and their techniques, there still remains a gap to be filled by the full integration of ESG into the models, particularly in light of the special economic environment ESG disclosure has in Brazil. This research seeks to close this gap by putting together a predictive model that uses a combination of financial and accounting ratios and ESG scores in seeking a more accurate and all-encompassing forecast of business failures within the Brazilian economy.
The number of the research questions are raised in this study, ranging from how far ESG scores can improve precision in bankruptcy models; in addition to this, they raise the question of how machine learning techniques apply to integrate ESG scores into financial forecasting in an effective way. The contribution of this study is to develop a comprehensive model predicting corporate insolvency, based on substantial financial and accounting ratios beside ESG score of every firm, examining the application of diverse machine learning methodologies.
This study thus pursues two twin objectives: first, to single out the key factors that best predict the risk of corporate failure in the Brazilian market from a wide array of financial metrics and ESG (Environmental, Social, and Governance) scores; second, to come up with a prediction model that incorporates the elements above with a view to improving the precision of the forecast. The study basically aims to ensure that these objectives are met through the exposure of the usefulness of ESG score, high level of financial and accounting ratios and machine learning methodologies in predicting bankruptcies. This would contribute in developing economic stability, as well as sustainable business practices.
The importance of the study is beyond scholarly contributions but will contribute to the advanced tool of policymakers, investors, and business leaders in evaluating the financial well-being and making improved decisions of the concerned entity. Moreover, the integration of ESG considerations brings the study within the domain of international trends in progressive and ethical conduct of business: supporting an approach that is ecologically sensitive and socially accountable, facilitating economic development.
2. A Review of Machine Learning Techniques for Business Failure Prediction
In the pursuit of these objectives, the study adopts an elaborate suite of eleven major machine learning algorithms, each chosen for its ability to facilitate the predictability of company failure that might entail the diverse data dimensions and, therefore, predicted as complex. Details of the review of these methodologies are provided herein. Machine learning is the leading-edge innovation of artificial intelligence, which possesses power in the analysis and forecasting of complex datasets. In this line of thinking, one can put it that for higher accuracy and reliability in prediction associated with bankruptcy prediction in non-financial companies within the Brazilian environment, a couple of models from the machine learning algorithm palette need to be deployed. This paper discusses a few key methodologies and then elaborate on their use, strengths, and limitations in the realm of financial stability analysis.
2.1. Logistic Regression
Logistic regression is one of the most rudimentary tools used in binary classification tasks. More specifically, logistic regression predicts bankruptcy. The simplicity and clarity in the interpretation of the model used represents the probability of an event by fitting data to a logistic curve (Bapat & Nagale, 2014). This model evaluates the chances of bankruptcy using several financial ratios and indicators, therefore emerging as a clear evaluation of the risk (Ogachi et al., 2020). Nonetheless, its effectiveness is mitigated to the extent that the relationship between the independent variables and the log-odds of the dependent variable is nonlinear since it imposes a check on the extremely complex dynamics associated with financial distress (Youn & Gu, 2010).
Studies have found logistic regression useful in the prediction of bankruptcies because it can be used to measure exactly how much every single variable contributes to the classification (G. Zhang et al., 1999). Logistic regression models are considered one of the most common in bankruptcy prediction models. However, on multiple occasions, logistic regression is outranked by neural networks in terms of prediction accuracy and classification rate (Kristanti et al., 2019). However, logistic regression has been found to have more discriminating power and better predictiveness than the discriminant models when used in a corporate financial distress situation (Uğurlu & Aksoy, 2006). Logistic regression has been used relatively favorably in comparison to the discriminant models in the bankruptcy prediction world.
Logistic regression had also been used in predicting financial distress across some sectors, clearly indicating its flexibility and practicality in diverse industries (Hamzah et al., 2021). In carrying out a prediction of bankruptcy on non-financial corporations, logistic regression has also been used and proved to be an effective method of assessing financial risks (Zizi et al., 2021).
2.2. K-Nearest Neighbors (KNN)
The K-Nearest Neighbors (KNN) algorithm is a classification algorithm for classifying entities to classes, depending on the characteristics of the nearest neighbors of a point in the dataset. Meanwhile, KNN, by its simplicity and flexibility in usage, stands to be the most appropriate method used in capturing a complex and varied, nonlinear relationship of points between features across the system, without a predefined model (Gaber et al., 2016). However, it depends on the value of the parameter "k" and the way of defining the dissimilarity metric (W. Zhang et al., 2020). Secondly, this curse of dimensionality causes a drop in accuracy, another computational challenge when working with large datasets in KNN (Hjaltason & Samet, 1999). Therefore, the challenge is to develop a KNN model that will be more accurate and robust.
The K-Nearest Neighbors (KNN) algorithm is one of the most commonly used simple algorithms with wide applications across the board, including machine learning, disease risk prediction, and traffic prediction (Kuang et al., 2019; Sun et al., 2018; Nguyen, 2021; Sarker et al., 2020). KNN works by computing the minimum distance between the test data and that of its K-neighbor within the given training data (Paramita et al., 2022).
2.3. Decision Trees
Decision Trees are a valuable tool in predictive modeling due to their ability to represent decisions and outcomes in a structured tree format. The good thing with decision trees is that they are good at predictive modeling, showing the purity in decisions and outcomes represented in a tree format. They are well-suited for purely numerical data and categorically distributed data. However, the most common challenges of decision trees include overfitting data, leading to bad generalization over unseen data. In overfitting, pruning techniques or ensemble methods like bagging, boosting, or random forest can be applied to evade overfitting and underfitting, respectively (Rokach, 2016).
In Bankruptcy Prediction, Decision Trees have been very widely used. This idea has also been noted in one such study that has taken Bankruptcy Prediction using Decision Trees (Aoki & Hosonuma, 2004). This rationalizes the reasons for simplicity and clear interpretability decision trees have been applied in models of bankruptcy prediction (Jacobs, Jr, 2024). Moreover, among various prediction models, Decision Trees have shown promising results as compared to other methods, such as Support Vector Machines (SVMs), for the prediction of bankruptcy (Masanobu et al., 2019). Some research has shown that the application of the decision tree in bankruptcy prediction surpasses some other methods applied, therefore evidently revealing its efficiency in the field (Baranyi et al., 2018).
2.4. Support Vector Machine (Linear Kernel)
One of the popularly known ways of doing supervised learning in classification tasks, bankruptcy prediction among them, uses the method of Support Vector Machine (SVM) with a linear kernel. If the kernel function of the SVM is linear, then it draws a linear boundary to determine several different classes of data (Min & Lee, 2005). The effectiveness of the approach could be witnessed in various applications, for example, the study at hand: financial distress prediction in real estate (Ayuni et al., 2022). SVM is very effective in carrying out both classification and regression exercises, hence well known in the machine learning field as a supervised learning model (Karatzoglou et al., 2004).
Research has shown that in the domain of bankruptcy prediction, SVMs can be applicative measures whose accuracy proves to be higher than that of traditional tools (Min & Lee, 2005). Still, in various sectors of the industry where these applicative measures were gauged, the financial area came on stage with SVMs being applied to forecast the financial condition of a company (Ding et al., 2008). Furthermore, the support vector machines perform better than many other classification models, which include logistic regression and decision trees (Rainarli, 2019). Researchers have also combined SVMs with feature selection techniques to improve their accuracy in predicting bankruptcy, especially during financial crises (Dellepiane et al., 2015). SVMs have, in fact, been investigated also in combination with other methods, such as Gaussian Processes, for their use in probabilistic modeling in bankruptcy prediction scenarios (Antunes et al., 2017).
The linear kernel SVMs specifically have shown a powerful performance in binary classifications, so much so that some of the highest accuracy results of this model, varying between 77.8% and 91.2%, have been reported in different scenarios (Chui & Lytras, 2019). Additionally, SVMs have been applied in multiclass sentiment analysis that can effectively deal with both linearly and non-linearly separable datasets, but the latter requires the former to be transformed into higher dimensions for this purpose (Mukarramah et al., 2021).
2.5. Support Vector Machine (Non-Linear Kernel)
Non-linear kernelized Support Vector Machines (SVM) particularly have an advantage when it comes to datasets that are not extremely huge. These rely on non-linear classification, usually with an embedded gamma hyperparameter to improve their predictive ability (Kalaiarasi & Maheswari, 2021). The prediction of bankruptcy, SVMs, in fact, have many applications and have found common usage in prediction models due to their easy interpretability of analysis, data-driven, and free nature of distribution characteristics when compared with traditional statistical methods (Muñoz-Izquierdo et al., 2019). Optimization is one of the fundamentals in SVM, linked with Gaussian Kernel parameters (gamma) and Penalty factor (Min & Lee, 2005). Research has discovered that Support Vector Machines (SVMs), particularly with the right set of optimized kernel function parameters, offer high effectiveness when applied in the bankruptcy prediction task (M. Wang et al., 2017).
SVMs have been humanly construed as the most popular classifier because of its capability to obtain the best solution in the world and show high generalization performance (M. Wang et al., 2017). Furthermore, SVM has further been applied to some other domains with great success in addition to bankruptcy prediction, such as the analysis of landslide hazard and wind energy forecasting (Moreno et al., 2020; He & Li, 2021). Further comparisons between SVM and other artificial neural network classification methods indicate that, in some situations, SVM is better than other methods (Kalantar et al. 2018; Byvatov et al. 2003). Consequently, SVMs have become the objects of extensive studies in the field of bankruptcy prediction, covering different areas—from feature selection and ensemble learning to the application of fuzzy SVMs (Smiti and Soui, 2020; Lin et al., 2018; Chaudhuri & De, 2011).
The overall view on linear SVMs with non-linear kernels vis-à-vis bankruptcy prediction, in fact, is based on their powerful and reliable characteristics in the context of their flexible behavior when dealing with complex decision surfaces.
2.6. Artificial Neural Networks (ANN)
The Deep Learning variation of ANN, in actuality, is currently at the forefront of all other non-linear and complicated relationship models. Thereby, it becomes very effective in catching the intricate patterns present in big and diverse data sets. ANN models have also revealed success in the area of bankruptcy prediction, since they can generalize, learn, and define patterns in financial data (ÖZPARLAK & ÖZDEMİR DİLİDÜZGÜN, 2022). But though it is highly effective, the main problem with ANNs is that it has been often criticized as being somewhat a ’black box’ system that requires a greater number of training data sets and is, in fact, computationally too costly to be considered (Ansari et al., 2020).
The artificial neural networks (ANN) application is one of the areas where evidence from some of the studies noted that they are very effective in bankruptcy prediction. Some of the strategies that have been suggested for enhancing the efficacy of ANNs in bankruptcy prediction are neuro-genetic approaches, hybrid metaheuristic methods, and differential evolution-based pruning models (Gaytan et al., 2022; Tang et al., 2019). They are all meant to train ANNs in the most proper way, to increase their accuracy in financial distress prediction.
In addition, the use of ANNs in financial applications has been attracting the attention of scholars over the years. Many researchers have been using ANNs for their applications in finance to deal with wide-ranging problems, including but not limited to financial crisis prediction (Shin & Lee, 2004), capital structure analysis (S. H. Lim & Nam, 2006). These flexible inherent characteristics of ANNs make them adaptable to a broad spectrum of financial scenarios, and their use can even be extrapolated into some nonstandard cases to gain valuable insight into complex economic phenomena.
2.7 Random Forest
Random Forest is a flexible model that is applied for the solution of regression and classification tasks due to its outstanding performance of solutions and simplicity of structures (DeSalvo & Mohri, 2016). As an ensemble method, this kind of method proposed by Xu et al. (2023) incorporates the bagging approach with the random subspace method (DeSalvo & Mohri, 2016). One such multi-purpose model is Random Forest, which can be used for both classification and regression tasks. Random Forest is also known for its high-classification performance, bagging, feature selection, and quick training and classification speeds it has (Mishina et al., 2015). Random Forest can be a useful tool in the prediction of bankruptcy.
This model is a combination of very many classification trees, and variables that have greater scores of importance play a bigger role in the classification decision (Prusak, 2018). Furthermore, in comparison with an estimate feature importance problem, Random Forest handles this with more sophistication through better handling of the curse of dimensionality and obtaining accurate estimates of feature importance without costly model training in an iterative manner, which needs cross-validation (Ahsan et al., 2022). In the field of bankruptcy prediction, machine learning models like Random Forest are quickly moving to even be more preferred than conventional methods, including artificial neural networks. There is a shift in the use of machine-learning models, like Random Forest, away from it being a leading model for the prediction of bankruptcy, with support vector machines, bagging, boosting, and attention to Random Forest itself (Kovacova & Kliestikova, 2017).
2.8. Gradient Boosting
Gradient Boosting is a machine learning technique for building an additive model in a forward stage-wise manner. In this kind, as referred by Friedman in the year 2001 (Cheng et al., 2018), this means new prediction models are trained, in most cases concerning the errors of the model ensemble that have been generated in the previous iteration (Pérez et al., 2020). Gradient Boosting Decision Tree (GBDT) is the classical type of boosting-based model that minimizes the loss of prediction through regression-like training S(Feng et al., 2020).
The usefulness of XGBoost is outstanding in the context of bankruptcy prediction. Studies by Yotsawat et al., (2023) and Smiti et al., (2022) have evidenced the successful application of XGBoost in banking as the best method to solve the problem of imbalanced data both in bankruptcy prediction and credit risk assessment. In addition, XGBoost has also demonstrated good or excellent performance in a variety of fields, including credit-scoring (Yotsawat et al., 2021).
Most importantly, the gradient boosting algorithm is one of the best machine learning techniques applied in the prediction of tasks. It has been applied in diverse fields, such as price prediction of agriculture commodities (Hegde et al., 2023), slope stability prediction in mining (Saadaari et al., 2020), and even in the development of models for prediction of soil moisture (Tesyon Korjo Hwase & Abdul Joseph Fofanah, 2021)s. The algorithm can learn functional mapping, and for this reason, it has been noted in several research findings to have very high prediction accuracy (Vanhaeren et al., 2020). It is, therefore, a very useful tool for predictive modeling.
2.9. XGBoost Classifier
The reasons XGBoost has become so popular include the fact that it is a highly optimized version of the gradient-boosting algorithm used in many fields and its tendency to control overfitting better than traditional gradient-boosted methods (Chen & Guestrin, 2016). Indeed, XGBoost has been used with great success in a series of problems, such as healthcare, urban classification, fault diagnosis, and financial risk assessment Torlay et al., 2017, Georganos et al., 2018, Abdi, 2020, Deif et al., 2021. Research findings suggest that XGBoost performs better in point of accuracy and performance than other classifiers, to name a few: the classical support vector machine, random forests, and neural networks (Jafarzadeh et al., 2021; Ramdani & Furqon, 2022; sAsselman et al., 2023; Sahin, 2020). For example, a study on the classification of urban forests found that XGBoost could do even better than the rest of the models at this task, with a lower root mean square error (Ramdani & Furqon, 2022).
Moreover, the prediction of bankruptcy has applied XGBoost and proved how flexible this great tool can be in financial applications (Smiti et al., 2022). XGBoost can help researchers improve their prediction models’ accuracy regarding bankruptcy (Smiti et al., 2022). In this case, XGBoost becomes one of the ensemble classifiers, combining the weak learners using boosting to come up with a strong classifier, ensuring accuracy in prediction scenarios.
Moreover, XGBoost can achieve high computational efficiency and accuracy in, for example, the recognition of indoor activities and monitoring the pattern of breathing with a minimum of computation used (Purnomo et al., 2021). This may be the main reason for choosing it in machine learning applications, as the machine can process data quickly and its accuracy is high. Other studies further show that the model XGBoost is optimizable with additional methods such as the artificial bee colony algorithm to elevate its classification accuracy (N. Wang et al., 2022).
2.10. AdaBoost Classifier
The AdaBoost Classifier comes under the class of iterative ensemble methods, where the objective is to sum several weak classifiers in a boosted classifier (Kadkhodaei et al., 2020; Kumar et al., 2021). On the contrary, the boost-by-majority classifier adds weak hypotheses by summing their probabilistic predictions (Ganatra & Kosta, 2010). It is a linear combination of weak classifiers; each of the weak classifiers focuses on the classification of different input features (Hu et al., 2018). The approach maximizes the strengths contributed by the weak classifiers in a way that each makes better than random predictions (Ferreira & Figueiredo, 2012; Wyner et al., 2017).
The bankruptcy prediction for Brazilian firms has been based on AdaBoost, and, in fact, this same technique has been used in the prediction of bankruptcies for firms belonging to another industry, specifically for Korean construction companies (Aljawazneh, 2021; Barboza et al., 2022). Research has indicated that further improvement in performance can be achieved from the ensemble combination of AdaBoost and SMOTE in financial bankruptcy prediction (J. Sun et al., 2014; Faris et al., 2020). Additionally, AdaBoost has been used in the fault diagnosis method of aviation cable F. Wang et al., (2022) and structural health monitoring framework methods, respectively, indicating their potential applications across different domains (Buckley et al., 2023).
2.11. Catboost Classifier
CatBoost is a powerful gradient boosting algorithm known for its ability to deal with categorical data directly, without doing some lengthy preprocessing to make the dataset usable. The particular case has to do with bankruptcy prediction since its data contains, more often than not, not only numerical but also categorical variables. Efficiency, together with its advanced regularization abilities, puts the algorithm in an excellent position for predictive tasks in such contexts (Prokhorenkova et al., 2018).
Classifiers, like CatBoost, used in predicting business failure have been well covered in the literature. Recently, CatBoost—an ML algorithm—has been applied for anticipating business failure, machine learning algorithms such as CatBoost have been utilized in the development of models for the prediction of financial insolvency risk (Zou et al., 2022), fraudulent financial reporting (Arshad et al., 2015), and long-term business failure of construction companies (Choi et al., 2017). Moreover, business success and failure have been found to make up important profitability, debt-related factors, and liquidity-related factors in predicting business failure and financial distress. Other predictors of success and failure in small businesses include the age of the business and first-year sales (Marom & Lussier, 2014).
3. Data and Methodology
3.1. Data and Variables
In this study, we have started working with 40 variables which are till today used in the predicting the business failure in the wide range of the literature across non-financial firms in Brazil, including financial and accounting ratios as well as ESG scores. We categorized these firms into two groups based on their financial status: 235 companies were identified as either financially troubled or financially stable.
3.2. Data Screening Process
We began the data analysis process from feature screening by conducting a thorough evaluation of multicollinearity, which is crucial for ensuring the accuracy and dependability of our prediction model. At first, we eliminated redundant characteristics. In order to address the issue of multicollinearity, which is characterized by strong correlations between independent variables and makes it difficult to analyze their individual effects by raising the variability of model coefficients, we utilized the Variance Inflation Factor (VIF). We primarily focused on and eliminated variable pairings that exhibited a correlation coefficient of 0.9 or above, regardless of whether the correlation was positive or negative. By excluding 12 attributes, the procedure enhanced the model’s interpretability and predicted accuracy.
The removal of these characteristics also simplified the feature set, which is crucial for improving bankruptcy prediction capabilities by highlighting key indicators of financial stability in Brazilian firms. This step emphasized the importance of critical feature selection and multicollinearity reduction in complex predictive models used for financial assessments.
To further streamline the dataset and improve its manageability, we employed Principal Component Analysis (PCA) on the remaining 28 variables. This technique reduces dataset complexity by minimizing the number of variables, focusing on those that capture the most significant portion of the data’s variance. Such reduction is vital not only for easing model development and analysis but also for curtailing computation demands and enhancing the efficiency of subsequent machine learning applications. After implementing PCA, our analysis concentrated on 7 variables that captured nearly 60% of the total variance, which were then utilized in further machine learning endeavors.
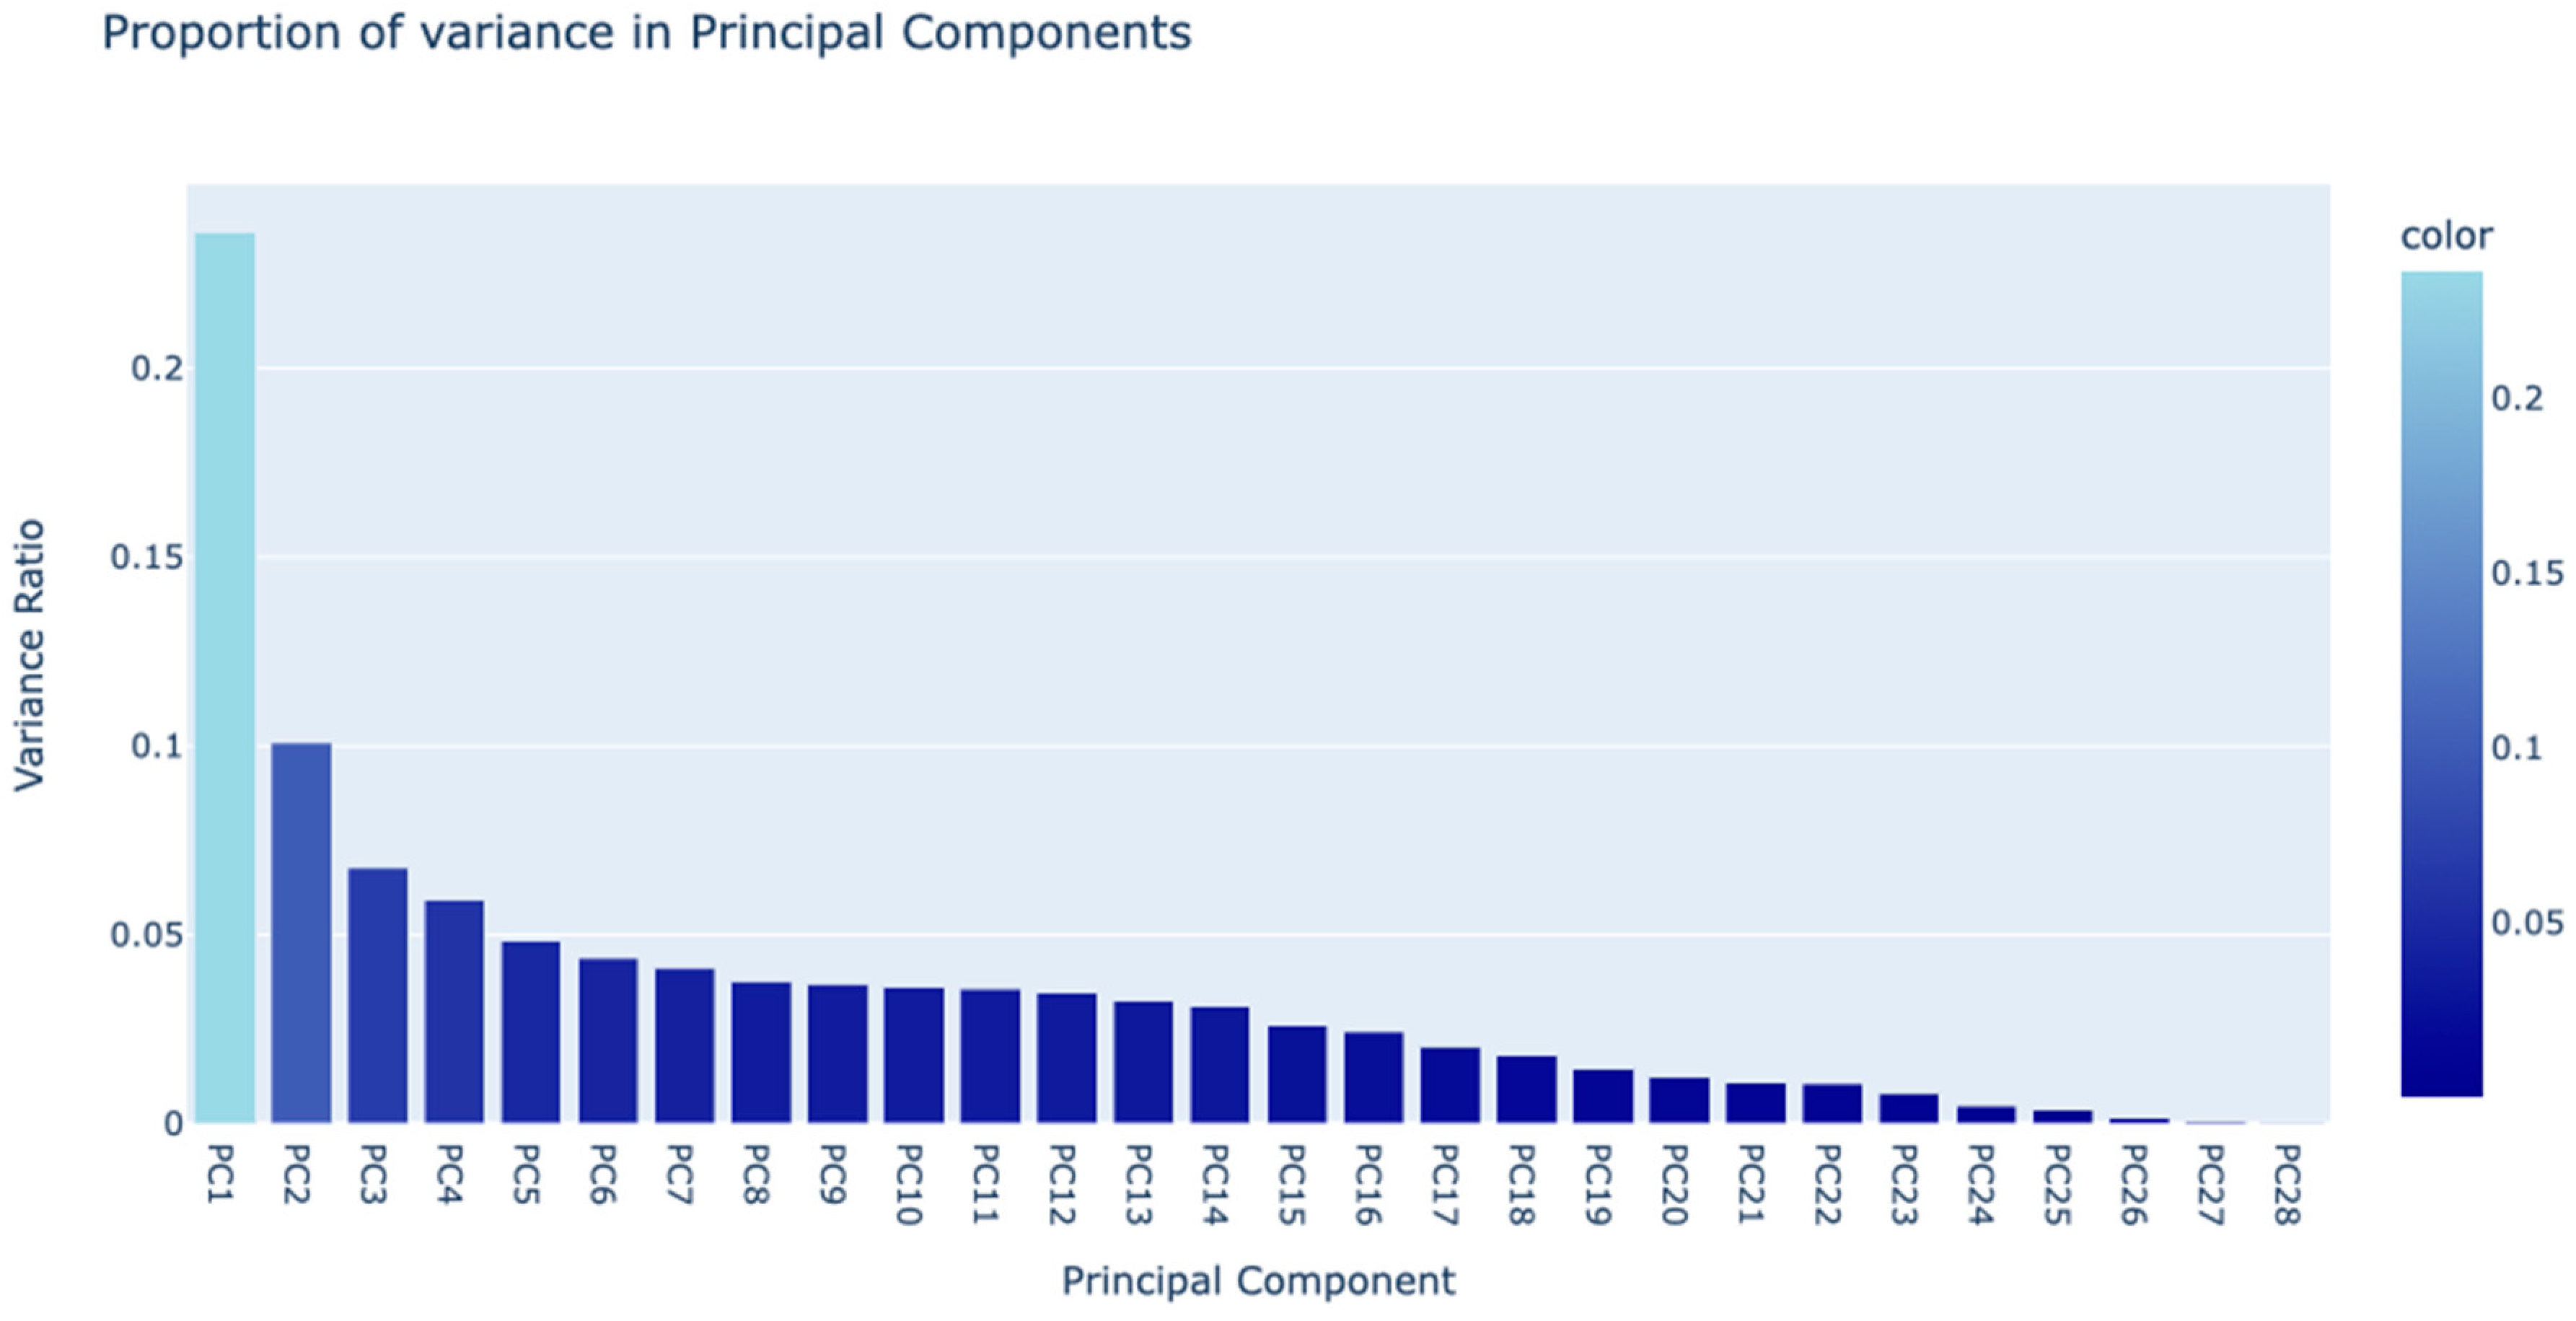
Figure 1.
Principal Component Analysis.
3.3. Descriptive Statistics
In Table 1, we perform the descriptive analysis on the remaining seven key variables were retained for further detailed examination; each of them would show a substantial difference in their statistical characteristics between failed and non-failed firms. This distinctness points out its potential use in forecasting Brazilian non-financial firms’ financial stability.
On the Environmental, Social, and Governance (ESG) scores, it presented a pronounced non-failed firm, with significantly higher averages than their failed counterparts and slightly more variability. In other words, companies with strong ESG values may subject great operational stability and governance, features that might be very proficient in yielding financial risk reduction. In a Brazilian context, where ESG issues have an increased influence, sustainability impacts both business operations and investor decisions. That is to say, higher ESG scores may reflect improved management of risks and long-term strategic planning.
Similarly, the Net Profit Margin (P1) analysis presented a negative mean in both groups, referring to difficult or typical economic conditions of a sector that makes a large impact on profitability. The variability is so high among failing firms that such does tend to indicate a further susceptibility towards extreme financial distress, indicating the importance of this metric toward firm health.
This can be translated into the fact that, in the operational efficiency, as captured by the operating return on assets (P7) and the return on capital employed (P8), non-failed firms were able to have positive returns, which clearly shows more efficiency in the management and use of assets and capital. Negative returns in the meantime, failed firms point to poor capital management—an aspect not of great importance in a landscape, which characterizes many sectors in Brazil: this aspect is that of poor capital management in essential capital-intensive.
For instance, liquidity metrics like the Quick Ratio (L2) and the Cash to Current Liabilities (L3) revealed less variability in failed firms, though both the groups carried negative mean values. All the same, this would mean a uniformly poor liquidity position among these firms, hence leading to financial instability. On the contrary, the high level of variability in non-failed firms might signal the divergence of their liquidity management practices, where some firms possibly maintain adequate liquidity buffers that can cushion operational and financial pressures.
Lastly, Inventory Turnover Ratio (AC1) gave insight into operational efficiency, where the non-failure group had relatively high turnover but extreme variability. This would mean that, while some of the non-failed firms are effectively managing their inventory as reflected from their capacity to meet demands of the market and saving cost, some could have been experimentative with their strategies in regards to the optimization of the inventory level.
These variables together give a more comprehensive idea about the financial situation and operational efficiency of firms in Brazil, thereby pointing out most important financial indicators to predict stability or distress situations of firms. This will give a worthy insight to the stakeholders in the sense that the investors, creditors, and regulatory bodies, among them, will make informed choices on the financial viability of firms within the emerging market.

Table 1.
Descriptive Analysis.
| Group | Failed Firm | Non-Failed Firm | ||
| Variable | Mean | Std. Deviation | Mean | Std. Deviation |
| ESG | 34.532 | 22.247 | 53.848 | 21.425 |
| P1 | -1692 | 11511 | -2.061 | 173 |
| P7 | -0.447 | 1.604 | 0.102 | 0.535 |
| P8 | -0.190 | 0.990 | 0.109 | 0.419 |
| L2 | -1.700 | 1.946 | -1.588 | 2.783 |
| L3 | 0.500 | 0.883 | 1.209 | 1.220 |
| AC1 | 41.16 | 124.37 | 88.83 | 1466.57 |
ESG = ESG Score, P1 = Net Profit margin, P7 = Operating return on assets, P8 = Return on capital employed, L2 = Quick ratio, L3 = Cash to current liabilities, AC1 = Inventory Turnover Ratio.
3.4. Pooled Within-Groups Correlation
In building up our predictive model, we provided the pooled within-groups correlation matrix in Table 2. This is having been very instrumental to refine the selection of variables discriminating robustly between failed and non-failed firms. In general, relations among the seven variables (ESG, P1, P7, P8, L2, L3, AC1) indicate a weak relationship, just confirming little redundancy among the features. This lack of strong correlations is beneficial in that it signifies each of the variables contributes unique informational value and enhances the model’s ability to discriminate the groups based on distinct financial indicators. More notably, weak positive correlations (0.046) between ESG score and Net Profit Margin (P1) would explain that while relevant, the two actually contribute independently toward the model and thus allow fine-tuned interpretations of financial health. The high coefficient of correlation (-0.628) between Operating Return on Assets (P7) and Return on Employed Capital (P8) would therefore indicate a crucial trade-off, augmenting the model with the insight of opposite movements of profitability and capital utilization efficiency.
Further, the negative relationship of liquidity ratios (L2, L3) with other profitability ratios (P1, P7, P8) offers a contradiction to many dimensions which need balancing between liquidity and the profile of the income statement ratios, which are of much importance for forecasting needs. It will underline relationships that indicate either financial weaknesses or strengths based on the strategies used by the firm in managing such. The correlation matrix informs the process of feature selection by identifying the independent variables that are most informative, minimizes the problems of multicollinearity, and makes sure that the model developed has the capability to fit a wide range of indicators of financial health. Then, carried out over these variables was the Principal Component Analysis (PCA) in order to reduce dimensionality and extract variables most able to capture critical aspects of data variance; an important exercise for both computational efficiency and model predictive accuracy.
The insight drawn from the presented matrix is paramount in training our machine-learning models to make effective predictions of the financial stability of Brazilian non-financial firms. This structured approach helps us derive a more robust model that not only predicts with higher accuracy but also yields clear and actionable insights for stakeholders into the financial dynamics within the Brazilian market.
4. Results and Analysis
4.1. Application of Machine Learning Models for prediction Business Failure
In this study, reduced data obtained after an exhaustive pre-processing exercise, including multicollinearity checks and principal component analysis, were used to predict the bankruptcy potential of non-financial firms in Brazil using various machine learning models provided in Table 3. The evaluation is based on effectiveness with regard to each model, using the precision, recall, F1-score, and the overall accuracy. We provide a strong set of combined metrics: one that ensures our findings are statistically sound and practically relevant.
The logistic regression model showed high precision and recall scores amounting to 0.92 and 0.94 for non-failure firms, respectively, and 0.94 and 0.92 for failure firms, respectively, with a resultant F1-score of 0.93 for both groups. This further supports the assertion of logistic regression being slightly less accurate than the more sophisticated models and points to a good choice for this kind of binary classification task, with an overall accuracy of 93.39%.
Among some other advanced models, K-Nearest Neighbors, Decision Tree, and a whole series of ensemble methods—such as Random Forest, Gradient Boosting, XgBoost, AdaBoost, and CatBoost—brought out super high performance. The model, especially Random Forest and CatBoost, had 100% scores in all metrics of differentiating between failed and non-failed firms. It is demonstrated through these models that they reflect well the patterns hidden in the data and hence depict good ability toward the handling of complex, nonlinear relationships and interactions among the financial indicators.
Also, support vector machine (SVM) with linear and radial basis function (RBF) kernel models exhibited a robust performance. The linear kernel SVM gave slightly improved precision and recall of non-failed firm classifications than failed firms; it gave a slightly higher sense of sensitiveness to the identification of non-failed firms. On the other hand, SVM with the RBF kernel found a little bit more failed firms due to its higher recall in this category.
Both precision and recall approached 0.97-0.98, with F1-scores around 0.97, and overall accuracy at 97.65% for the Neural Network model. This is an obvious indicator that the model can generalize well in performance for both classes, without having serious bias towards any. In a nutshell, applied prediction models from our study add a lot of value to knowledge in financial risk management, as they offer precise and reliable prediction of bankruptcy. The high-performance metrics in both our feature selection and data processing techniques reflect effectiveness, reassuring that the key retained variables post-PCA possess critical predictive power. Those insights do make our understanding of the financial stability indicators in Brazilian firms richer and also serve as an instrument that would bring added value for the stakeholders, which includes the investor, creditors, and regulatory bodies, to make informed decisions. Our findings underline the reliance on advanced analytical techniques for the assessment of financial health of firms and reinforce the potential of machine learning in financial forecasting and risk assessment.
4.2. Receiver Operating Characteristic (ROC) curves
The Receiver Operating Characteristic (ROC) curve in Figure 2 is among the most critical evaluation tools in a given diagnostic test. In the context of this study, the ROC curve graphically demonstrates the compromise from the true positive rate (sensitivity) to the false-positive rate (1-specificity) of the used classification models. Each curve represents a different model, and the area under the ROC curve (AUC) will give a single measure of overall performance. The closer the curve comes to the left-hand border, then the top border of the ROC space, the better the classifier. Notably, both classifiers built by Random Forest and CatBoost yield high sensitivity and specificity, with ROC curves being close to the top-left corners—an excellent prediction model in financial assessments.
The ROC curve in the current research represents the performance of machine-learning models used in the classification of failure from non-failure of Brazilian-based firms. Those with ROC curves closing into the top-left corner of the graph, like the Random Forest and CatBoost classifiers, signal better performance. These give the curves, together with the high AUC values, the discriminative power in the models, and this is of great importance in getting precise financial risk assessments by investors or regulatory bodies.
4.3. Confusion Matrices
Confusion matrices in Figure 3 are a very detailed breakdown of model’s predictions against actual labels. It includes true positives, true negatives, false positives, and false negatives. This is a very important piece of information to understand the precision of the model (number of positive predictions made correctly/total positive predictions made) and recall (number of positive predictions made correctly/positives that should have been identified).
The confusion matrix of the ensemble methods, such as Random Forest and CatBoost, showed a near-perfect classification in their confusion matrix, where a high number of true positives and negatives had very small incidences of both false positives and negatives. This proves their reliability to stakeholders making critical financial decisions. Last but not the least, the confusion matrices showed accurate results based on the model. High counts of true positives and true negatives have been achieved, especially in models like the Random Forest and CatBoost classifiers, which allude that these models are very reliable.
Fewer false positives and negatives show that the models are doing a good job in minimizing the cost of misclassification. This, therefore, becomes an interesting study for the creditors whose major concern is not to assure them that the firm is stable and performing well without any undue assurance.
4.4. Feature Importance
The feature importance in Figure 4 shows a contribution—that is, the relationship of each variable to the model’s prediction. For instance, the ESG score in many models represents a significant predictor and points to increasing importance for the financial stability of firms in terms of environmental, social, and governance factors. High feature importance for ESG across models suggests the sustainable practice might be close to linked with the financial corporate health of an enterprise. Both are key insights to investors and regulators keen on an interest in financial performance just as for the responsibility of the corporation. The feature importance graph explains the relative weightage of each variable in the predictive models. For example, in some models, the ESG score predicts the firm’s stability and, therefore, is an important variable with high importance. This result corresponds to the current trend of sustainability, which emphasizes relevance to the stakeholders’ interest in long-term financial returns and sustainable business practices. Other than this, the variables Return on Capital Employed (P8) and Net Profit Margin (P1) showed varying levels in the case of multiple models. This implies that pretty nuanced roles of the indicators in financial health take place.
Conclusion
This work examines thoroughly, with the support of Machine Learning techniques, the predictive ability of ESG scores for Brazilian non-financial firms. The results of the study do provide that models which incorporate ESG rating indeed greatly help improve the precision of bankruptcy predictions, thus pointing out clearly the focus on sustainability as a business. These insights play a big role for stakeholders whose ambition is to shore up economic stability and foster responsible investment strategies, especially in dynamic and emerging markets like Brazil.
The consequences of this work are substantial. This demonstrates that ESG scores belong as a part of sustainability metrics in standard financial analysis, with potential impacts at the policy and corporate governance levels. These findings would therefore support more nuanced risk assessments and more nuanced investment decisions, i.e., that investment decisions should assess, side by side with economic considerations, social and environmental impacts on a level-playing-field basis. Besides, such an approach is likely to inspire the companies to increase the ESG performance when they recognize a direct relation of ESG with their financial firmness and confidence of the investors.
Nonetheless, some limitations are related to the study. One limitation is that it focuses only on non-financial firms in Brazil, which is limiting with regards to its generalizability in other sectors or geographies. Furthermore, reliance on the model’s predictions to machine learning models, though it bestows great strength on the analysis of models, may make the interpretability of predictions difficult—common criticism of complex models alludes to a "black box" problem. This might therefore make such models nearly practically cumbersome for stakeholders who need clear, easily interpretable decision-support tools in their hands.
Future studies on this subject must, therefore, expand in such a way as to replicate across several markets and industries. In-depth ESG-factors analysis should be conducted, since it is very important to take into consideration the scores of ESG analysis such as Total ESG Risk Score, Environmental Risk Score, Governance Risk Score, Social Risk Score, and the level of Controversy Score. This will refine further the predictive model in a manner that brings out factors that affect most of the financial performance. It has to be done in a way that brings about the development of approaches to improve clarity and interpretability of ML models’ predictions. One such approach could be hybrid models marrying the prediction strength of deep learning with the power to explain, which is traditional, of statistical methods. These may include longitudinal study designs to help assess the temporal stability of ESG scores as predictor constructs of financial health and, thereby, understand the impacts of long-term good sustainability practices on financial outcomes over several economic cycles.
References
- Abdi, A. M. (2020). Land cover and land use classification performance of machine learning algorithms in a boreal landscape using Sentinel-2 data. GIScience and Remote Sensing, 57(1), 1–20. [CrossRef]
- Ahmad, N., Mobarek, A., & Roni, N. N. (2021). Revisiting the impact of ESG on financial performance of FTSE350 UK firms: Static and dynamic panel data analysis. Cogent Business and Management, 8(1). [CrossRef]
- Ahsan, M., Anam, A. K., Julian, E., & Jaya, A. I. (2022). Interpretable Predictive Model of Network Intrusion Using Several Machine Learning Algorithms. BAREKENG: Jurnal Ilmu Matematika Dan Terapan, 16(1), 057–064. [CrossRef]
- Aljawazneh, huthaifa riyad. (2021). NEW APPROACHES TO IMPROVE THE PERFORMANCE OF MACHINE LEARNING AND DEEP LEARNING ALGOR I THMS IN SOLV ING REAL -WORLD PROBLEMS : COMPANIES FINANCIAL FAILURE FORECASTING.
- Alsayegh, M. F., Rahman, R. A., & Homayoun, S. (2020). Corporate economic, environmental, and social sustainability performance transformation through ESG disclosure. Sustainability (Switzerland), 12(9). [CrossRef]
- Ansari, A., Ahmad, I. S., Bakar, A. A., & Yaakub, M. R. (2020). A hybrid metaheuristic method in training artificial neural network for bankruptcy prediction. IEEE Access, 8, 176640–176650. [CrossRef]
- Antunes, F., Ribeiro, B., & Pereira, F. (2017). Probabilistic modeling and visualization for bankruptcy prediction. Applied Soft Computing Journal, 60, 831–843. [CrossRef]
- Aoki, S., & Hosonuma, Y. (2004). Bankruptcy Prediction Using Decision Tree. The Application of Econophysics, 299–302. [CrossRef]
- Arshad, R., Iqbal, S. M., & Omar, N. (2015). Prediction of business failure and fraudulent financial reporting: Evidence from Malaysia. Indian Journal of Corporate Governance, 8(1), 34–53. [CrossRef]
- Asselman, A., Khaldi, M., & Aammou, S. (2023). Enhancing the prediction of student performance based on the machine learning XGBoost algorithm. Interactive Learning Environments, 31(6), 3360–3379. [CrossRef]
- Aydoğmuş, M., Gülay, G., & Ergun, K. (2022). Impact of ESG performance on firm value and profitability. Borsa Istanbul Review, 22, S119–S127. [CrossRef]
- Ayuni, N. W. D., Lasmini, N. N., & Putrawan, A. A. (2022). Support Vector Machine (SVM) as Financial Distress Model Prediction in Property and Real Estate Companies. Proceedings of the International Conference on Applied Science and Technology on Social Science 2022 (ICAST-SS 2022), 397–402. [CrossRef]
- Bapat, V., & Nagale, A. (2014). Comparison of Bankruptcy Prediction Models: Evidence from India. Accounting and Finance Research, 3(4). [CrossRef]
- Baranyi, A., Faragó, C., Fekete, C., & Szeles, Z. (2018). The Bankruptcy Forecasting Model of Hungarian Enterprises. Advances in Economics and Business, 6(3), 179–189. [CrossRef]
- Barboza, F. L. D. M., Duarte, D. L., & Cunha, M. A. (2022). Anticipating corporate’s distresses. Exacta, 20(2), 470–496. [CrossRef]
- Bateni, L., & Asghari, F. (2016). Bankruptcy Prediction Using Logit and Genetic Algorithm Models: A Comparative Analysis. Computational Economics, 55(1), 335–348. [CrossRef]
- Buckley, T., Ghosh, B., & Pakrashi, V. (2023). A Feature Extraction & Selection Benchmark for Structural Health Monitoring. Structural Health Monitoring, 22(3), 2082–2127. [CrossRef]
- Byvatov, E., Fechner, U., Sadowski, J., & Schneider, G. (2003). Comparison of Support Vector Machine and Artificial Neural Network Systems for Drug/Nondrug Classification. Journal of Chemical Information and Computer Sciences, 43(6), 1882–1889. [CrossRef]
- Capelli, P., Ielasi, F., & Russo, A. (2021). Forecasting volatility by integrating financial risk with environmental, social, and governance risk. Corporate Social Responsibility and Environmental Management, 28(5), 1483–1495. [CrossRef]
- Chaudhuri, A., & De, K. (2011). Fuzzy Support Vector Machine for bankruptcy prediction. Applied Soft Computing Journal, 11(2), 2472–2486. [CrossRef]
- Chen, T., & Guestrin, C. (2016). XGBoost: A scalable tree boosting system. Proceedings of the ACM SIGKDD International Conference on Knowledge Discovery and Data Mining, 13-17-Augu, 785–794. [CrossRef]
- Choi, H., Sung, H., Cho, H., Lee, S., Son, H., & Kim, C. (2017). Comparison of single classifier models for predicting long-term business failure of construction companies using finance-based definition of the failure. ISARC 2017 - Proceedings of the 34th International Symposium on Automation and Robotics in Construction, Isarc, 282–287. [CrossRef]
- Chouaibi, S., Rossi, M., Siggia, D., & Chouaibi, J. (2022). Exploring the moderating role of social and ethical practices in the relationship between environmental disclosure and financial performance: evidence from esg companies. Sustainability (Switzerland), 14(1). [CrossRef]
- Chui, K. T., & Lytras, M. D. (2019). A novel MOGA-SVM multinomial classification for organ inflammation detection. Applied Sciences (Switzerland), 9(11). [CrossRef]
- Condon, M. (2022). Scholarly Commons at Boston University School of Law Market Myopia ’ s Climate Bubble.
- Dellepiane, U., Di Marcantonio, M., Laghi, E., & Renzi, S. (2015). Bankruptcy Prediction Using Support Vector Machines and Feature Selection During the Recent Financial Crisis. International Journal of Economics and Finance, 7(8), 182–195. [CrossRef]
- DeSalvo, G., & Mohri, M. (2016). Random composite forests. 30th AAAI Conference on Artificial Intelligence, AAAI 2016, 1540–1546. [CrossRef]
- Ding, Y., Song, X., & Zen, Y. (2008). Forecasting financial condition of Chinese listed companies based on support vector machine. Expert Systems with Applications, 34(4), 3081–3089. [CrossRef]
- Elklawy, M. (2024). Is ESG a Determinant of Banks ’ resilience and Growth Everywhere ? A Response from an AI-Aided Approach Is ESG a determinant of banks ’ resilience and growth everywhere ? A response from an AI-aided approach.
- Faris, H., Abukhurma, R., Almanaseer, W., Saadeh, M., Mora, A. M., Castillo, P. A., & Aljarah, I. (2020). Improving financial bankruptcy prediction in a highly imbalanced class distribution using oversampling and ensemble learning: a case from the Spanish market. Progress in Artificial Intelligence, 9(1), 31–53. [CrossRef]
- Feng, J., Xu, Y.-X., Jiang, Y., & Zhou, Z.-H. (2020). Soft Gradient Boosting Machine. 1–16. [CrossRef]
- Ferreira, A. J., & Figueiredo, A. T. (2012). Ensemble Machine Learning. In Ensemble Machine Learning. [CrossRef]
- Friede, G., Busch, T., & Bassen, A. (2015). ESG and financial performance: aggregated evidence from more than 2000 empirical studies. Journal of Sustainable Finance and Investment, 5(4), 210–233. [CrossRef]
- Furman, J., & Stiglitz, J. E. (1998). Economic crises: Evidence and insights from East Asia. Brookings Papers on Economic Activity, 1998(2), 1–135. [CrossRef]
- Gaber, T., Tharwat, A., Hassanien, A. E., & Snasel, V. (2016). Biometric cattle identification approach based on Weber’s Local Descriptor and AdaBoost classifier. Computers and Electronics in Agriculture, 122, 55–66. [CrossRef]
- Ganatra, A. P., & Kosta, Y. P. (2010). Comprehensive Evolution and Evaluation of Boosting. International Journal of Computer Theory and Engineering, January 2010, 931–936. [CrossRef]
- Gaytan, J. C. T., Ateeq, K., Rafiuddin, A., Alzoubi, H. M., Ghazal, T. M., Ahanger, T. A., Chaudhary, S., & Viju, G. K. (2022). AI-Based Prediction of Capital Structure: Performance Comparison of ANN SVM and LR Models. Computational Intelligence and Neuroscience, 2022. [CrossRef]
- Georganos, S., Grippa, T., Vanhuysse, S., Lennert, M., Shimoni, M., & Wolff, E. (2018). Very High Resolution Object-Based Land Use-Land Cover Urban Classification Using Extreme Gradient Boosting. IEEE Geoscience and Remote Sensing Letters, 15(4), 607–611. [CrossRef]
- Habib, A. M. (2023). Do business strategies and environmental, social, and governance (ESG) performance mitigate the likelihood of financial distress? A multiple mediation model. Heliyon, 9(7), e17847. [CrossRef]
- Hamzah, D. A., Kalambe, A. A., Goklas, L. S., & Alkhayyat, N. G. (2021). 613-Article Text-3028-1-10-20210930.
- He, S., & Li, F. (2021). Artificial Neural Network Model in Spatial Analysis of Geographic Information System. Mobile Information Systems, 2021. [CrossRef]
- Hegde, G., Hulipalled, V. R., & Simha, J. B. (2023). Data driven algorithm selection to predict agriculture commodities price. International Journal of Electrical and Computer Engineering, 13(4), 4671–4682. [CrossRef]
- Helminen, N. (2023). ESG MOMENTUM AND STOCK PERFORMANCE IN U.S. DURING 2018-2023 Does market reward companies for improving ESG scores? 6, 142–151.
- Hjaltason, G. R., & Samet, H. (1999). Distance browsing in spatial databases. ACM Transactions on Database Systems, 24(2), 265–318. [CrossRef]
- Jacobs, Jr, M. (2024). Benchmarking alternative interpretable machine learning models for corporate probability of default. In Data Science in Finance and Economics (Vol. 4, Issue 1). [CrossRef]
- Jadhav, S., He, H., & Jenkins, K. (2018). Information gain directed genetic algorithm wrapper feature selection for credit rating. Applied Soft Computing Journal, 69, 541–553. [CrossRef]
- Jafarzadeh, H., Eric Gill, F. M. M. M., & Homayouni, S. (2021). Bagging and Boosting Ensemble Classifiers for Classification of Comparative Evaluation. Remote Sensing, MDPI.
- Kadkhodaei, H. R., Moghadam, A. M. E., & Dehghan, M. (2020). HBoost: A heterogeneous ensemble classifier based on the Boosting method and entropy measurement. Expert Systems with Applications, 157, 113482. [CrossRef]
- Kalaiarasi, G., & Maheswari, S. (2021). Deep proximal support vector machine classifiers for hyperspectral images classification. Neural Computing and Applications, 33(20), 13391–13415. [CrossRef]
- Kalantar, B., Pradhan, B., Amir Naghibi, S., Motevalli, A., & Mansor, S. (2018). Assessment of the effects of training data selection on the landslide susceptibility mapping: a comparison between support vector machine (SVM), logistic regression (LR) and artificial neural networks (ANN). Geomatics, Natural Hazards and Risk, 9(1), 49–69. [CrossRef]
- Karatzoglou, A., Smola, A., Hornik, K., & Zeileis, A. (2004). A survey on patents of typical robust image watermarking. Advanced Materials Research, 271–273(9), 389–393. [CrossRef]
- Kim, S., & Li, Z. (2021). Understanding the impact of esg practices in corporate finance. Sustainability (Switzerland), 13(7), 1–15. [CrossRef]
- Klutse, S. K. (2022). PhD DISSERTATION Senanu Kwasi Klutse Szeged, 2022.
- Kovacova, M., & Kliestikova, J. (2017). Modelling bankruptcy prediction models in Slovak companies. SHS Web of Conferences, 39, 01013. [CrossRef]
- Kristanti, F. T., Isynuwardhana, D., & Rahayu, S. (2019). Market concentration, diversification, and financial distress in the Indonesian banking system. Jurnal Keuangan Dan Perbankan, 23(4), 514–524. [CrossRef]
- Kuang, L., Yan, H., Zhu, Y., Tu, S., & Fan, X. (2019). Predicting duration of traffic accidents based on cost-sensitive Bayesian network and weighted K-nearest neighbor. Journal of Intelligent Transportation Systems: Technology, Planning, and Operations, 23(2), 161–174. [CrossRef]
- Kumar, M., Bajaj, K., Sharma, B., & Narang, S. (2021). A Comparative Performance Assessment of Optimized Multilevel Ensemble Learning Model with Existing Classifier Models. Big Data, 10(5), 371–387. [CrossRef]
- Le, T., Vo, M. T., Vo, B., Lee, M. Y., & Baik, S. W. (2019). A Hybrid Approach Using Oversampling Technique and Cost-Sensitive Learning for Bankruptcy Prediction. Complexity, 2019. [CrossRef]
- Lim, S. H., & Nam, K. (2006). Artificial Neural Network Modeling in Forecasting a Successful Implementation of ERP Systems. International Journal of Computational Intelligence Research, 2(1), 115–119. [CrossRef]
- Lim, T. (2024). Environmental, social, and governance (ESG) and artificial intelligence in finance: State-of-the-art and research takeaways. Artificial Intelligence Review, 57(4), 1–45. [CrossRef]
- Lin, W., Lu, Y., & Tsai, C. (2018). Feature selection in single and ensemble learning - based bankruptcy prediction models. July, 1–8. [CrossRef]
- Liu, Y., & Lin, M. (2022). Research on The Influence of ESG Information Disclosure on Enterprise Financial Risk. Frontiers in Business, Economics and Management, 5(3), 264–271. [CrossRef]
- Marom, S., & Lussier, R. N. (2014). A Business Success Versus Failure Prediction Model for Small Businesses in Israel. Business and Economic Research, 4(2), 63. [CrossRef]
- Masanobu, M., SHOICHI, K., Hideki, K., & Takaaki, K. (2019). Bankruptcy prediction for Japanese corporations using support vector machine, artificial neural network, and multivariate discriminant analysis. International Journal of Industrial Engineering and Operations Management, 01(01), 78–96. [CrossRef]
- Michalkova, L., Valaskova, K., Michalikova, K. F., & Constantin, A. D. (2018). The Holistic View of the Symptoms of Financial Health of Businesses. 56(Febm), 90–94. [CrossRef]
- Michela, P. (2023). The relationship between ESG Performance and Financial Stability : are sustainable companies less likely to fail ?
- Min, J. H., & Lee, Y. C. (2005). Bankruptcy prediction using support vector machine with optimal choice of kernel function parameters. Expert Systems with Applications, 28(4), 603–614. [CrossRef]
- Mishina, Y., Murata, R., Yamauchi, Y., Yamashita, T., & Fujiyoshi, H. (2015). Boosted random forest. IEICE Transactions on Information and Systems, E98D(9), 1630–1636. [CrossRef]
- Moreno, S. R., Silva, R. G., Ribeiro, M. H. dal M., Fraccanabbia, N., Mariani, V. C., & Coelho, L. dos S. (2020). Very Short-term Wind Energy Forecasting Based on Stacking Ensemble. November, 1–7. [CrossRef]
- Mukarramah, R., Atmajaya, D., & Ilmawan, L. B. (2021). Performance comparison of support vector machine (SVM) with linear kernel and polynomial kernel for multiclass sentiment analysis on twitter. ILKOM Jurnal Ilmiah, 13(2), 168–174. [CrossRef]
- Muñoz-Izquierdo, N., Camacho-Miñano, M. D. M., Segovia-Vargas, M. J., & Pascual-Ezama, D. (2019). Is the external audit report useful for bankruptcy prediction? Evidence using artificial intelligence. International Journal of Financial Studies, 7(2). [CrossRef]
- Neumeyer, P. A., & Perri, F. (2005). Business cycles in emerging economies: The role of interest rates. Journal of Monetary Economics, 52(2), 345–380. [CrossRef]
- Nguyen, P. T. (2021). Application Machine Learning in Construction Management. TEM Journal, 10(3), 1385–1389. [CrossRef]
- Ogachi, D., Ndege, R., Gaturu, P., & Zoltan, Z. (2020). Corporate Bankruptcy Prediction Model , a Special Focus on Listed Companies in Kenya.
- Olatunji Akinrinola, Wilhelmina Afua Addy, Adeola Olusola Ajayi-Nifise, Olubusola Odeyemi, & Titilola Falaiye. (2024). Application of machine learning in tax prediction: A review with practical approaches. Global Journal of Engineering and Technology Advances, 18(2), 102–117. [CrossRef]
- ÖZPARLAK, G., & ÖZDEMİR DİLİDÜZGÜN, M. (2022). Corporate Bankruptcy Prediction Using Machine Learning Methods: the Case of the Usa. International Journal of Management Economics and Business, 18(4), 1007–1031. [CrossRef]
- Paramita, A. S., Maryati, I., & Tjahjono, L. M. (2022). Implementation of the K-Nearest Neighbor Algorithm for the Classification of Student Thesis Subjects. Journal of Applied Data Sciences, 3(3), 128–136. [CrossRef]
- Prokhorenkova, L., Gusev, G., Vorobev, A., Dorogush, A. V., & Gulin, A. (2018). Catboost: Unbiased boosting with categorical features. Advances in Neural Information Processing Systems, 2018-Decem(Section 4), 6638–6648.
- Prusak, B. (2018). Review of Research into Enterprise Bankruptcy Prediction in Selected Central and Eastern European Countries. International Journal of Financial Studies, 6(3), 60. [CrossRef]
- Purnomo, A. T., Lin, D. B., Adiprabowo, T., & Hendria, W. F. (2021). Non-contact monitoring and classification of breathing pattern for the supervision of people infected by covid-19. Sensors, 21(9), 1–26. [CrossRef]
- Rainarli, E. (2019). The Comparison of Machine Learning Model to Predict Bankruptcy: Indonesian Stock Exchange Data. IOP Conference Series: Materials Science and Engineering, 662(5), 0–6. [CrossRef]
- Ramdani, F., & Furqon, M. T. (2022). The simplicity of XGBoost algorithm versus the complexity of Random Forest, Support Vector Machine, and Neural Networks algorithms in urban forest classification. F1000Research, 11, 1069. [CrossRef]
- Rokach, L. (2016). Decision forest: Twenty years of research. Information Fusion, 27, 111–125. [CrossRef]
- Saadaari, F. S., Mireku-Gyimah, D. ., & Olaleye, B. M. (2020). Development of a Stope Stability Prediction Model Using Ensemble Learning Techniques - A Case Study. Ghana Mining Journal, 20(2), 18–26. [CrossRef]
- Sachs, J., Tornell, A., & Velasco, A. (1996). Financial crises in emerging markets in 1995.pdf (p. 16).
- Sahin, E. K. (2020). Assessing the predictive capability of ensemble tree methods for landslide susceptibility mapping using XGBoost, gradient boosting machine, and random forest. SN Applied Sciences, 2(7). [CrossRef]
- Sarker, I. H., Faruque, F., Alqahtani, H., & Kalim, A. (2020). K-Nearest Neighbor Learning based Diabetes Mellitus Prediction and Analysis for eHealth Services. EAI Endorsed Transactions on Scalable Information Systems, 7(26), 1–9. [CrossRef]
- Shekar, S., Mohamed, M., & Xavier, B. (2022). Bankruptcy Prediction Using Machine Learning Methods. Information Society, 1, 56–67. [CrossRef]
- Shin, K. S., & Lee, K. J. (2004). Neuro-genetic approach for bankruptcy prediction modeling. Lecture Notes in Computer Science (Including Subseries Lecture Notes in Artificial Intelligence and Lecture Notes in Bioinformatics), 3214, 646–652. [CrossRef]
- Smiti, S., & Soui, M. (2020). Bankruptcy Prediction Using Deep Learning Approach Based on Borderline SMOTE. Information Systems Frontiers, 22(5), 1067–1083. [CrossRef]
- Smiti, S., Soui, M., & Ghedira, K. (2022). Tri-XGBoost Model: An Interpretable Semi-supervised Approach for Addressing Bankruptcy Prediction. 1–44. [CrossRef]
- Sun, B., Cheng, W., Goswami, P., & Bai, G. (2018). Short-term traffic forecasting using self-adjusting k-nearest neighbours. IET Intelligent Transport Systems, 12(1), 41–48. [CrossRef]
- Sun, J., Li, H., Huang, Q. H., & He, K. Y. (2014). Predicting financial distress and corporate failure: A review from the state-of-the-art definitions, modeling, sampling, and featuring approaches. Knowledge-Based Systems, 57, 41–56. [CrossRef]
- Tang, Y., Ji, J., Zhu, Y., Gao, S., Tang, Z., & Todo, Y. (2019). A Differential Evolution-Oriented Pruning Neural Network Model for Bankruptcy Prediction. Complexity, 2019. [CrossRef]
- Tesyon Korjo Hwase, & Abdul Joseph Fofanah. (2021). Machine Learning Model Approaches for Price Prediction in Coffee Market using Linear Regression, XGB, and LSTM Techniques. International Journal of Scientific Research in Science and Technology, 10–48. [CrossRef]
- Torlay, L., Perrone-Bertolotti, M., Thomas, E., & Baciu, M. (2017). Machine learning–XGBoost analysis of language networks to classify patients with epilepsy. Brain Informatics, 4(3), 159–169. [CrossRef]
- Uğurlu, M., & Aksoy, H. (2006). Prediction of corporate financial distress in an emerging market: The case of Turkey. Cross Cultural Management: An International Journal, 13(4), 277–295. [CrossRef]
- Vanhaeren, T., Divina, F., García-Torres, M., Gómez-Vela, F., Vanhoof, W., & García, P. M. M. (2020). A comparative study of supervised machine learning algorithms for the prediction of long-range chromatin interactions. Genes, 11(9), 1–17. [CrossRef]
- Wang, F., Yuan, G., Guo, C., & Li, Z. (2022). Research on fault diagnosis method of aviation cable based on improved Adaboost. Advances in Mechanical Engineering, 14(9), 1–14. [CrossRef]
- Wang, M., Chen, H., Li, H., Cai, Z., Zhao, X., Tong, C., Li, J., & Xu, X. (2017). Grey wolf optimization evolving kernel extreme learning machine: Application to bankruptcy prediction. Engineering Applications of Artificial Intelligence, 63, 54–68. [CrossRef]
- Wang, N., Li, D., Cui, D., & Ma, X. (2022). governance disclosure and corporate sustainable growth : Evidence from China. October, 1–13. [CrossRef]
- Wyner, A. J., Olson, M., Bleich, J., & Mease, D. (2017). Explaining the success of adaboost and random forests as interpolating classifiers. Journal of Machine Learning Research, 18, 1–33.
- Xu, Y., Yu, Z., Cao, W., & Chen, C. L. P. (2023). A Novel Classifier Ensemble Method Based on Subspace Enhancement for High-Dimensional Data Classification. IEEE Transactions on Knowledge and Data Engineering, 35(1), 16–30. [CrossRef]
- Yotsawat, W., Phodong, K., Promrat, T., & Wattuya, P. (2023). Bankruptcy prediction model using cost-sensitive extreme gradient boosting in the context of imbalanced datasets. International Journal of Electrical and Computer Engineering, 13(4), 4683–4691. [CrossRef]
- Yotsawat, W., Wattuya, P., & Srivihok, A. (2021). Improved credit scoring model using XGBoost with Bayesian hyper-parameter optimization. International Journal of Electrical and Computer Engineering, 11(6), 5477–5487. [CrossRef]
- Youn, H., & Gu, Z. (2010). Predict US Restaurant Firm Failures: The Artificial Neural Network Model versus Logistic Regression Model. Tourism and Hospitality Research, 10(3), 171–187. [CrossRef]
- Zhang, G., Hu, M. Y., Patuwo, B. E., & Indro, D. C. (1999). Artificial neural networks in bankruptcy prediction: general framework and cross-validation analysis. European Journal of Operational Research, 116(1), 16–32. [CrossRef]
- Zhang, W., Chen, X., Liu, Y., & Xi, Q. (2020). A Distributed Storage and Computation k-Nearest Neighbor Algorithm Based Cloud-Edge Computing for Cyber-Physical-Social Systems. IEEE Access, 8, 50118–50130. [CrossRef]
- Zhao, C., Guo, Y., Yuan, J., Wu, M., Li, D., Zhou, Y., & Kang, J. (2018). ESG and corporate financial performance: Empirical evidence from China’s listed power generation companies. Sustainability (Switzerland), 10(8), 1–18. [CrossRef]
- Zizi, Y., Jamali-Alaoui, A., El Goumi, B., Oudgou, M., & El Moudden, A. (2021). An optimal model of financial distress prediction: A comparative study between neural networks and logistic regression. Risks, 9(11). [CrossRef]
- Zou, Y., Gao, C., & Gao, H. (2022). Business Failure Prediction Based on a Cost-Sensitive Extreme Gradient Boosting Machine. IEEE Access, 10, 42623–42639. [CrossRef]
Figure 2.
Receiver Operating Characteristic (ROC) curves.
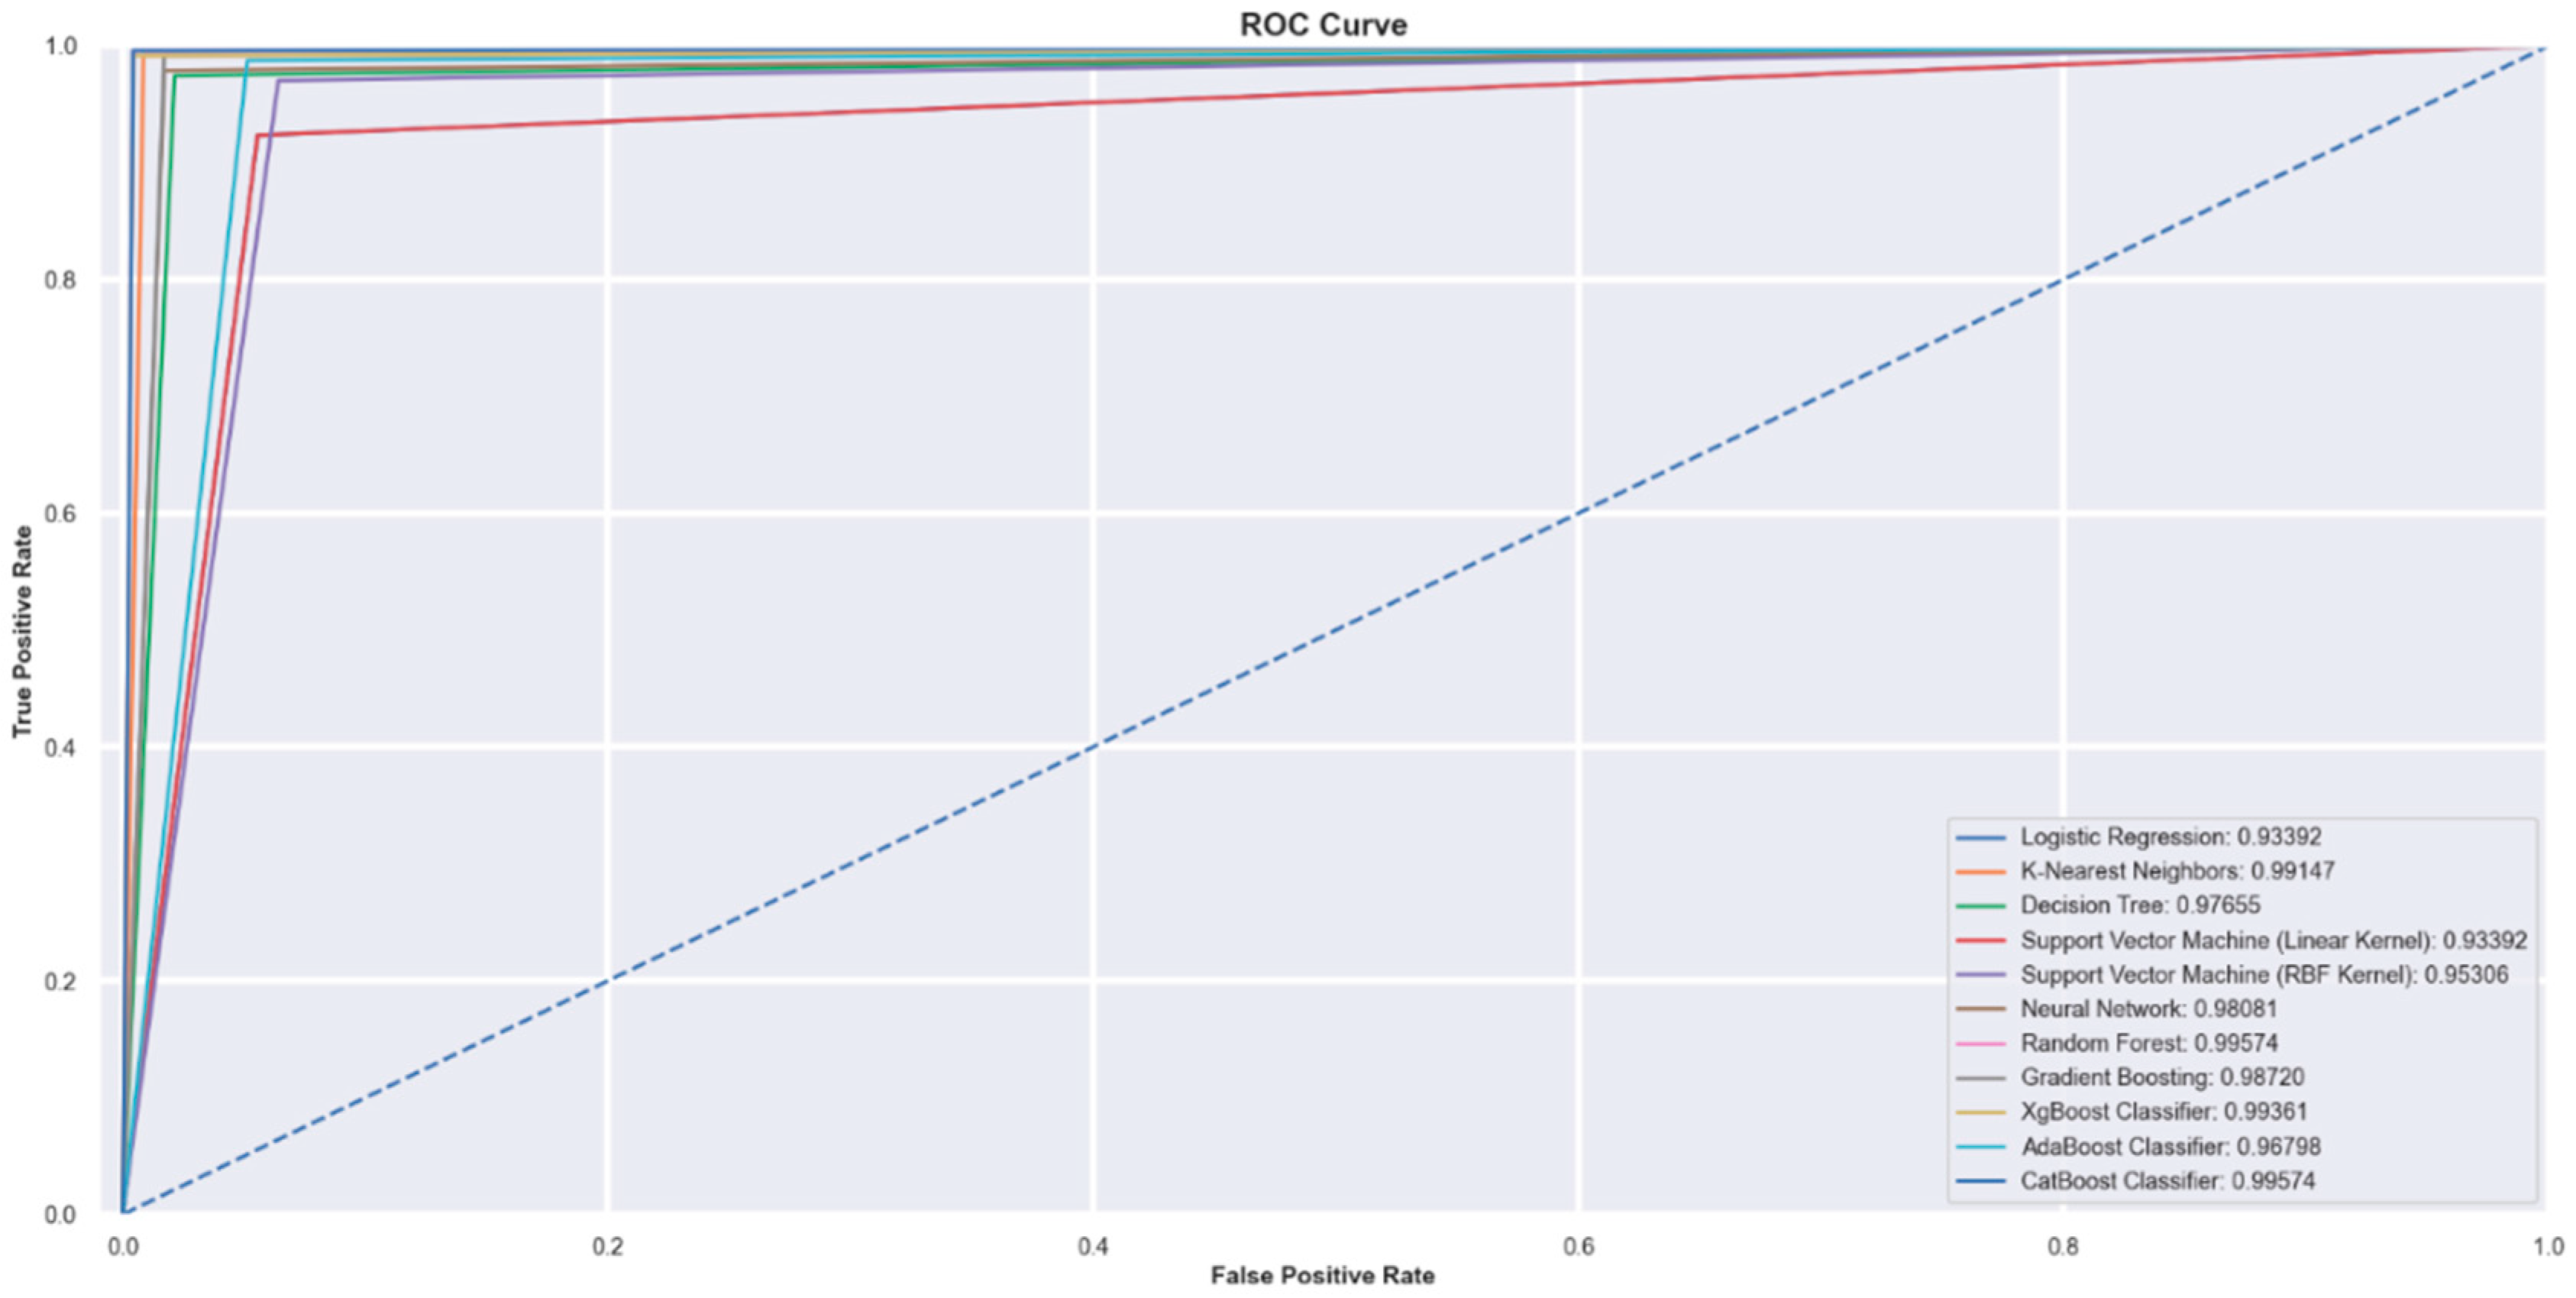
Figure 3.
Confusion Matrix Curve.
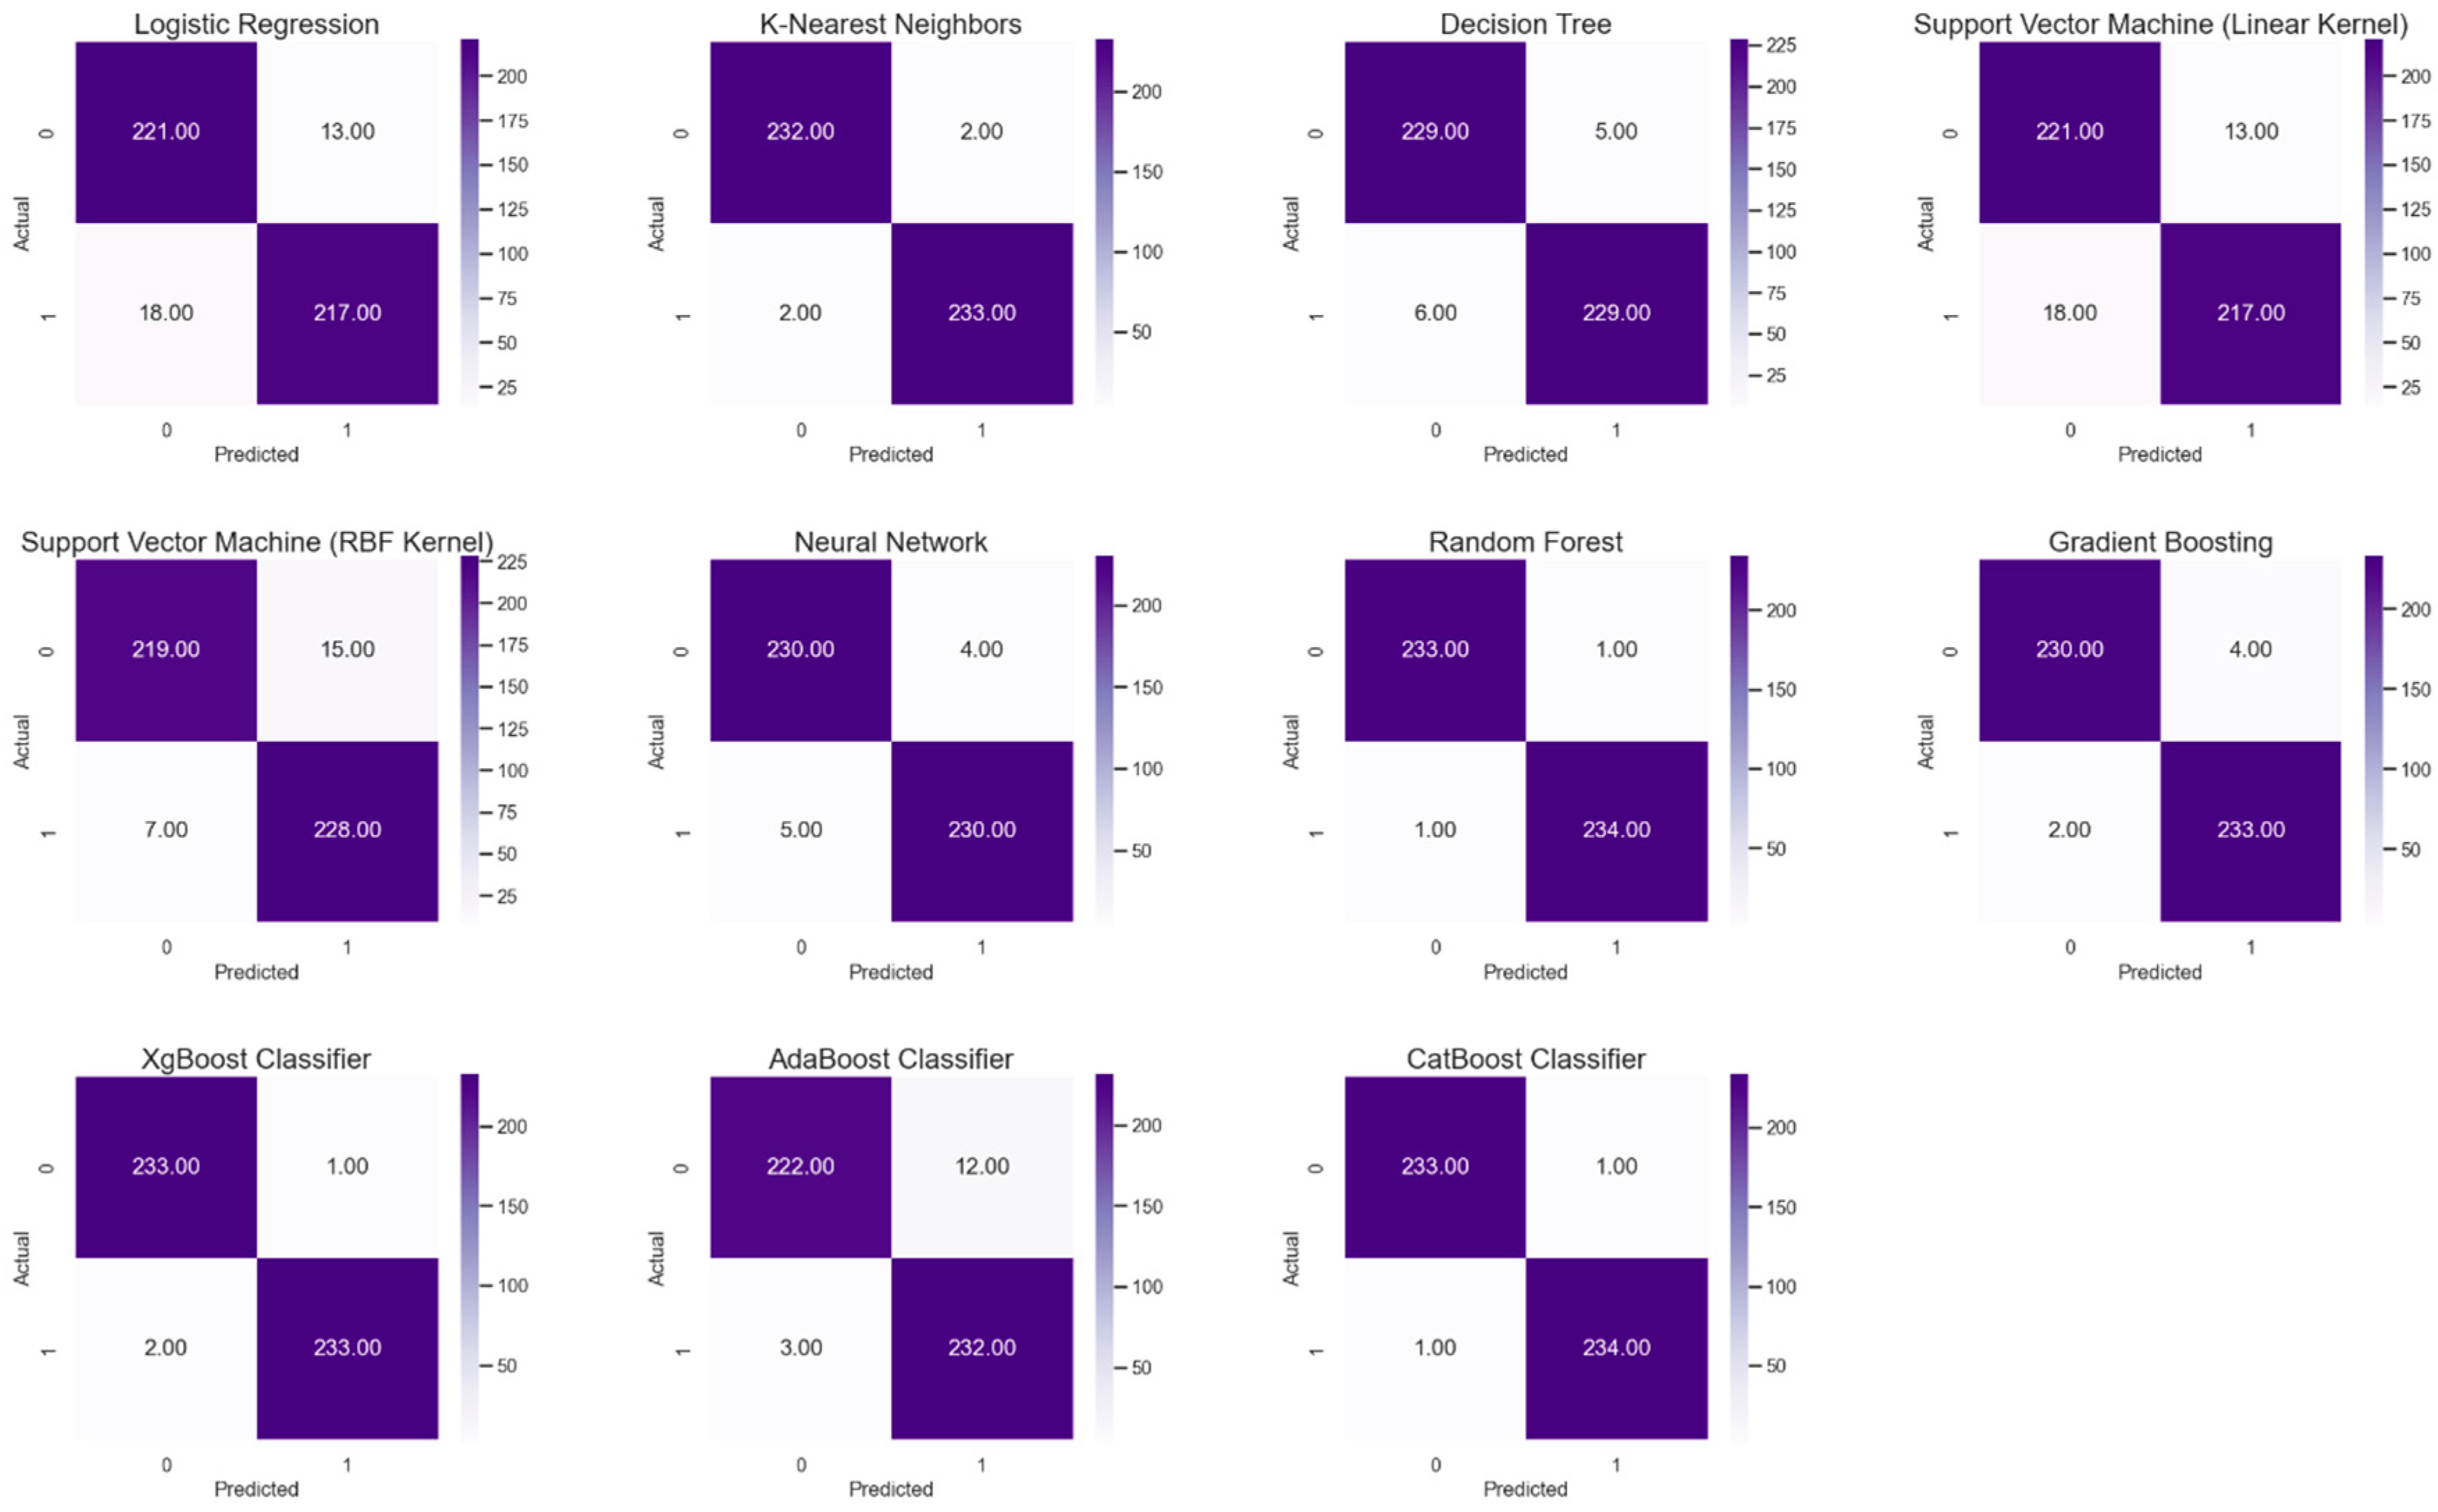
Figure 4.
Features Importance Graph.
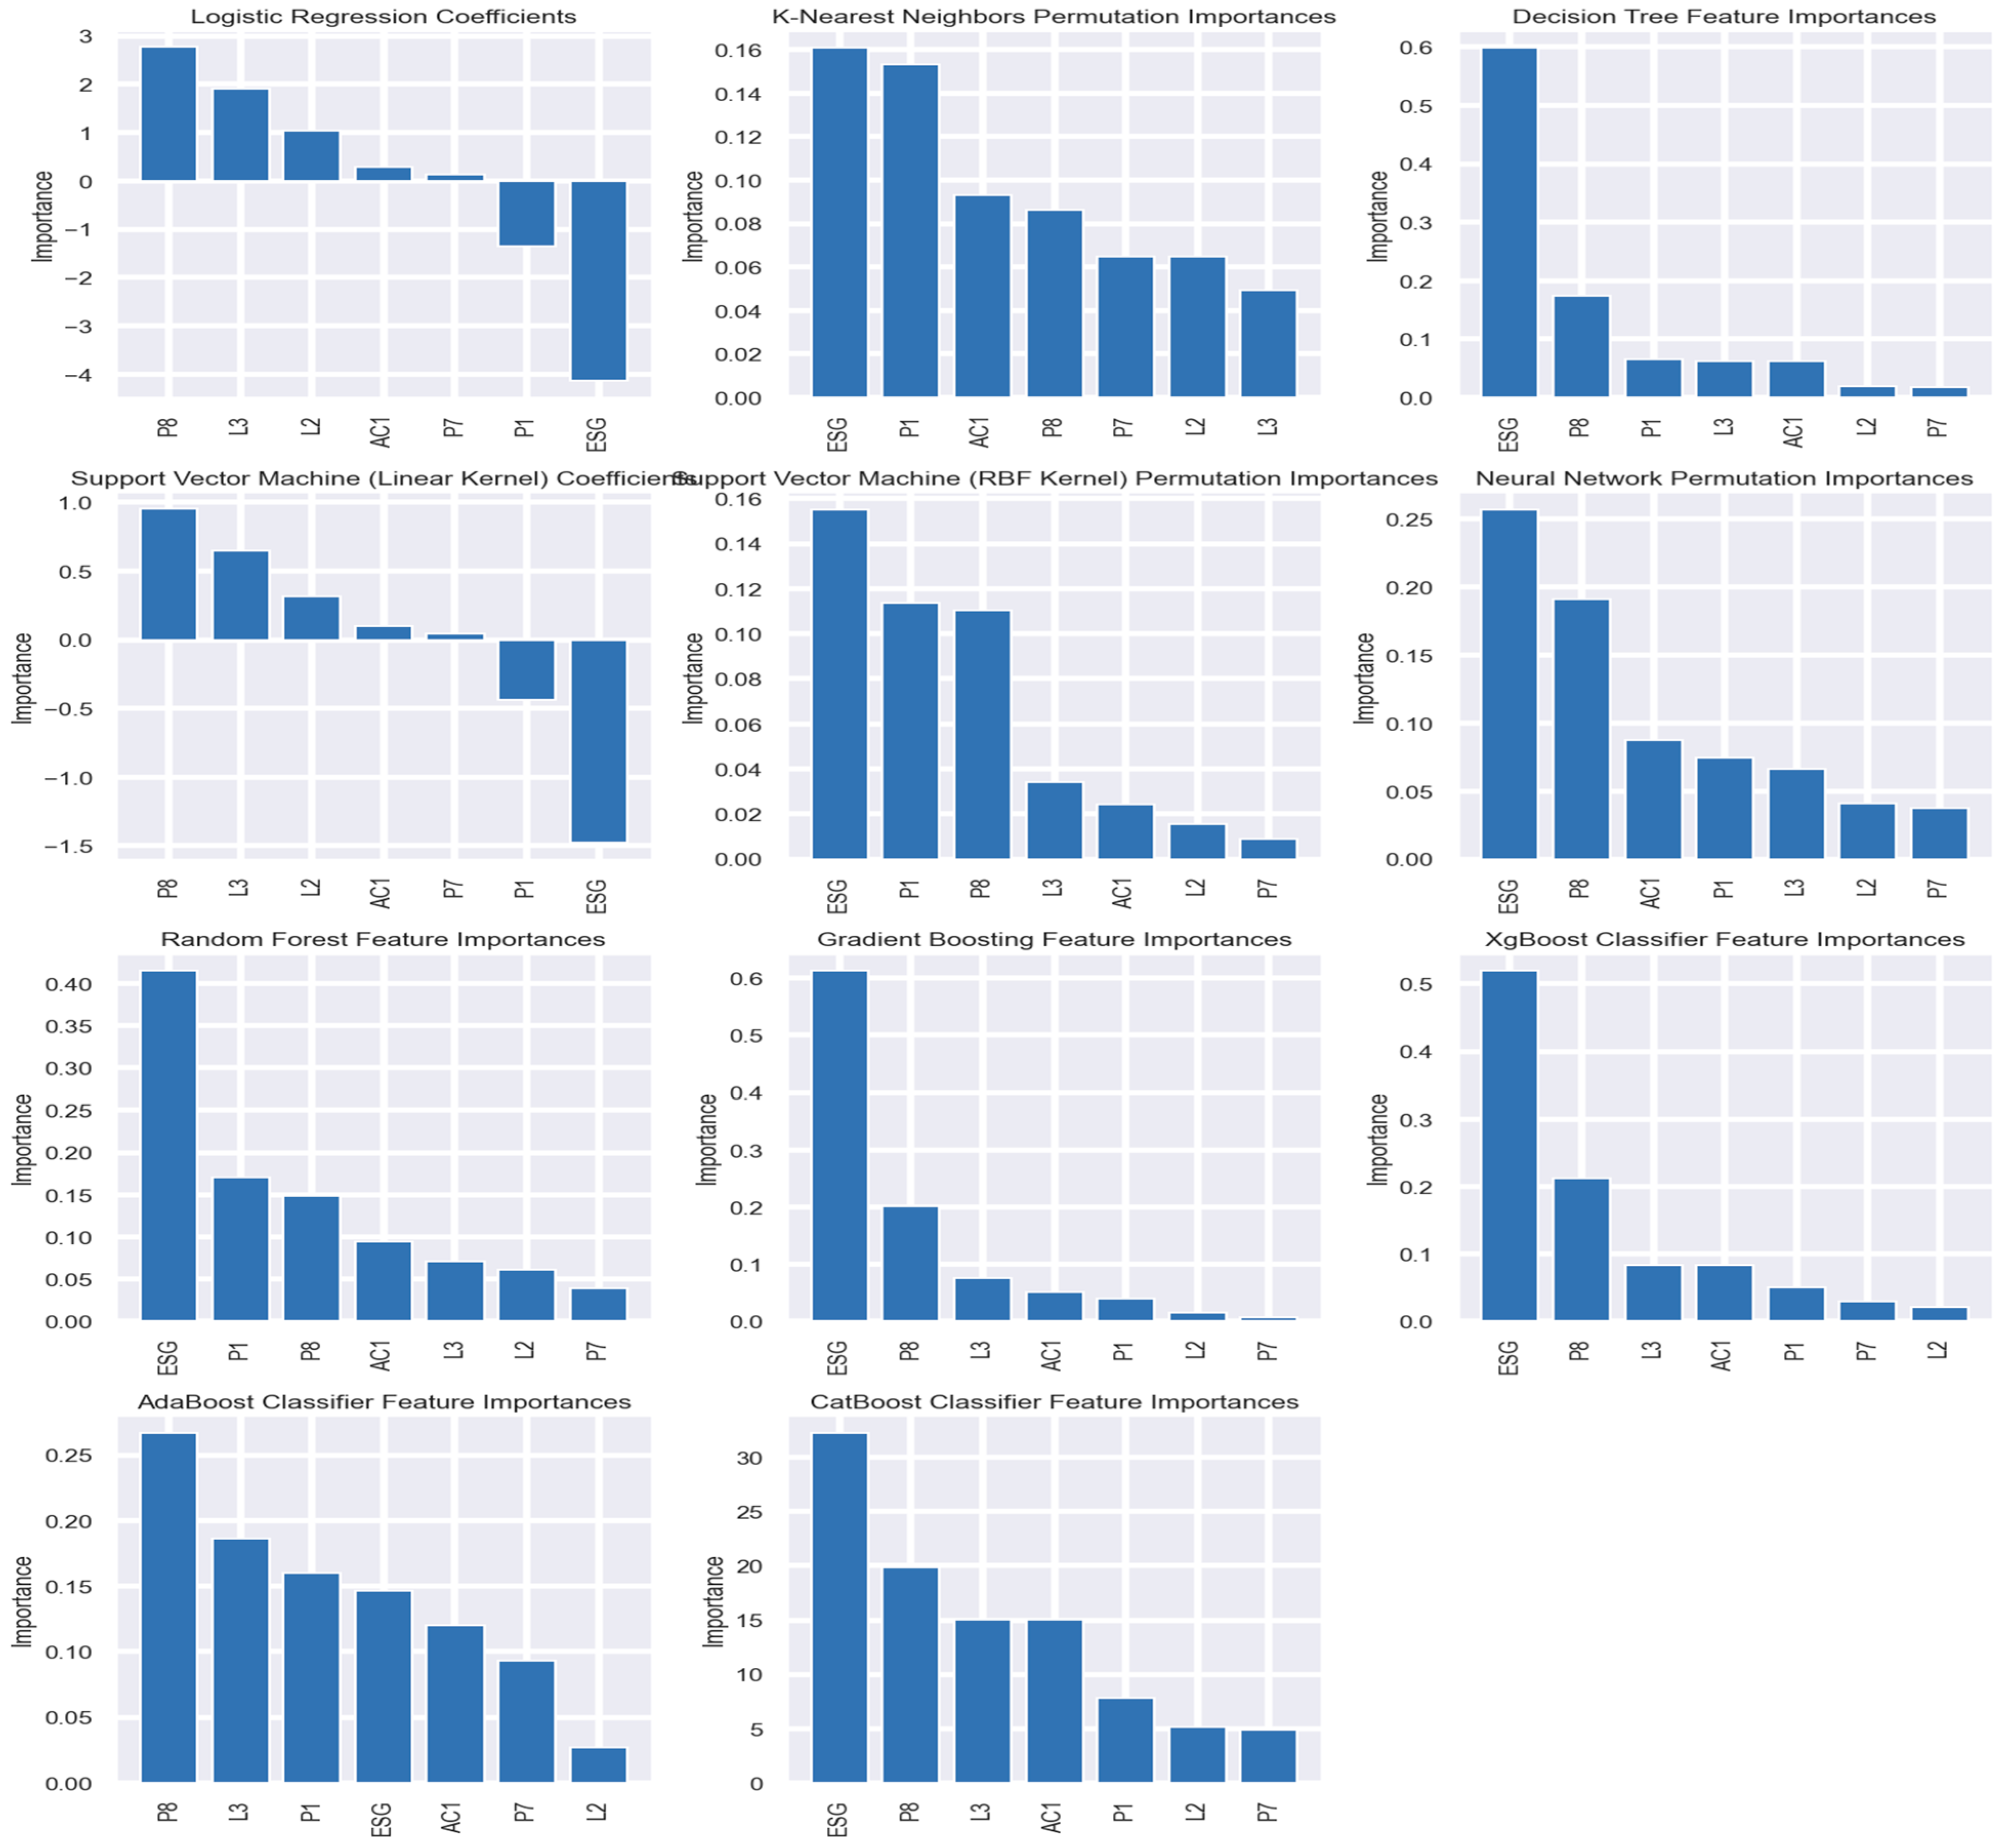
Table 2.
Pooled Within-Groups Correlation.
| ESG | P1 | P7 | P8 | L2 | L3 | AC1 | |
| ESG | 1 | ||||||
| P1 | 0.046 | 1 | |||||
| P7 | -0.029 | 0.079 | 1 | ||||
| P8 | 0.021 | 0.024 | -0.628 | 1 | |||
| L2 | -0.083 | -0.031 | 0.065 | 0.026 | 1 | ||
| L3 | -0.108 | -0.039 | -0.003 | -0.009 | 0.08 | 1 | |
| AC1 | -0.058 | -0.001 | -0.004 | -0.006 | -0.069 | 0.014 | 1 |
ESG = ESG Score, P1 = Net Profit margin, P7 = Operating return on assets, P8 = Return on capital employed, L2 = Quick ratio, L3 = Cash to current liabilities, AC1 = Inventory Turnover Ratio.
Table 3.
Application of Machine Learning Models for prediction Business Failure.
| Model(s) | Precision | Recall | F1-Score | Overall Accuracy | |||
| Failed | Non-Failed | Failed | Non-Failed | Failed | Non-Failed | ||
| Logistic Regression | 0.92 | 0.94 | 0.94 | 0.92 | 0.93 | 0.93 | 93.39% |
| K-Nearest Neighbors | 0.99 | 0.99 | 0.99 | 0.99 | 0.99 | 0.99 | 99.15% |
| Decision Tree | 0.99 | 0.98 | 0.98 | 0.99 | 0.99 | 0.99 | 98.51% |
| SVM (Linear Kernel) | 0.93 | 0.95 | 0.95 | 0.92 | 0.94 | 0.94 | 93.60% |
| SVM (RBF Kernel) | 0.97 | 0.93 | 0.93 | 0.97 | 0.95 | 0.95 | 95.10% |
| Neural Network | 0.97 | 0.98 | 0.98 | 0.97 | 0.98 | 0.98 | 97.65% |
| Random Forest | 1 | 1 | 1 | 1 | 1 | 1 | 99.57% |
| Gradient Boosting | 0.99 | 0.99 | 0.99 | 0.99 | 0.99 | 0.99 | 98.93% |
| XgBoost Classifier | 0.99 | 0.99 | 0.99 | 0.99 | 0.99 | 0.99 | 99.15% |
| AdaBoost Classifier | 0.98 | 0.95 | 0.95 | 0.98 | 0.96 | 0.96 | 96.38% |
| CatBoost Classifier | 1 | 1 | 1 | 1 | 1 | 1 | 99.57% |
Disclaimer/Publisher’s Note: The statements, opinions and data contained in all publications are solely those of the individual author(s) and contributor(s) and not of MDPI and/or the editor(s). MDPI and/or the editor(s) disclaim responsibility for any injury to people or property resulting from any ideas, methods, instructions or products referred to in the content. |
© 2024 by the authors. Licensee MDPI, Basel, Switzerland. This article is an open access article distributed under the terms and conditions of the Creative Commons Attribution (CC BY) license (http://creativecommons.org/licenses/by/4.0/).
Copyright: This open access article is published under a Creative Commons CC BY 4.0 license, which permit the free download, distribution, and reuse, provided that the author and preprint are cited in any reuse.


