
Submitted:
03 October 2024
Posted:
04 October 2024
You are already at the latest version
Abstract
Single crystal nickel-based superalloys are extensively used in turbine blade applications 1
due to their superior creep resistance compared to their polycrystalline counterparts. With the high 2
creep resistance, High Cycle Fatigue (HCF) and Low Cycle Fatigue (Single crystal nickel-based 3
superalloys are extensively used in turbine blade applications due to their superior creep resistance 4
compared to polycrystalline counterparts. As a result, fatigue becomes the primary failure mechanism 5
in such applications. Specifically, High Cycle Fatigue (HCF) and Low Cycle Fatigue (LCF) are of 6
significant concern under these conditions. This study investigates the fatigue life prediction of 7
CMSX-4 using a combined crystal plasticity and lifetime assessment model. The constitutive crystal 8
plasticity model simulates the anisotropic, rate-dependent deformation behavior of CMSX-4, while 9
a modified Chaboche damage model is used for lifetime assessment, incorporating anisotropy by 10
focusing on cleavage stresses on active slip planes. Both qualitative and quantitative data obtained 11
from HCF experiments on single crystal superalloys with notched geometry were used to validate 12
the model. Furthermore, artificial neural networks (ANNs) were employed to enhance the accuracy 13
of lifetime predictions across varying temperatures by analyzing the stress-strain data obtained from 14
simulations. The integration of crystal plasticity, damage mechanics, and ANNs resulted in accurate 15
predictions of fatigue life and crack initiation points under complex loading conditions of single 16
crystal superalloys.
Keywords:
Crystal Plasticity
; Fatigue
; Artificial Neural Networks
; Lifetime Assessment Modelling
; 18 Turbine Blades
1. Introduction
Single-crystal nickel-based superalloys are widely used in turbine blade components due to their excellent high-temperature resistance and superior mechanical properties [1,2]. Turbine blades operate under severe high-cycle fatigue (HCF) and low-cycle fatigue (LCF) loading conditions, coupled with high operating temperatures, making fatigue (both HCF and LCF) and creep the primary concerns for failure [3,4]. While creep-fatigue interaction adversely affects component life, fatigue fracture remains the predominant failure mode in these applications [1,5].
The high rotational speeds and rapid transient startups of turbines primarily induce LCF loadings [3]. Additionally, the high temperatures generated by the heated gas flow contribute to creep damage, compounding the effects of LCF loadings [4]. As a result, nickel-based single crystals are frequently exposed to severe LCF and Thermomechanical Fatigue (TMF) conditions [6,7,8]. Understanding the interaction between creep and fatigue, as well as the LCF fatigue failure mechanisms of these components, is essential for accurate life prediction.
Turbine blades are subjected to vibration loads due to the gas flow within the engine [3,9] resulting in severe HCF loading conditions addition to LCF and TMF. Therefore, special attention is paid to HCF lifetime assessment of single crystal superalloys since reliability and security of aircraft engines significantly related to the HCF properties of such alloys. In the case of single crystals crack initiation points and growth directions are highly dependent on cutting plane and loading types [10] unlike most polycrystalline materials. Depending on the crystal structure and operating temperature, plasticity observed through active slip planes and directions. Although nominal stress is in the elastic region for HCF loadings, plasticity observed on stress concentration zones as geometric irregularities and micro-cracks. Hence, considering active slip systems is essential to lifetime assessment of such components.
Fatigue life prediction of single crystal materials has been extensively studied from various perspectives. Experimental observations by Brown and Miller [11] suggest that in multiaxial loading conditions, fatigue crack initiation and growth predominantly occur along dominant slip planes. Building on this finding, many lifetime prediction models have been developed using critical plane formulations, probabilistic approaches, and modifications to isotropic fatigue models to account for multiaxial anisotropy [2,9,12,13]. In these models, resolved shear stresses on critical planes are identified as the primary drivers of failure, as it has been demonstrated that fatigue cracks tend to initiate along crystallographic directions under shear strain control [11]. Once initiated, crack growth is also governed by the direction of maximum shear strain. However, the orientation of the maximum stress in these mechanisms may vary depending on the crystallographic structure of the material.
The integration of Artificial Neural Networks (ANNs) into fatigue life assessment has greatly improved both prediction accuracy and efficiency. ANNs are particularly well-suited to managing the complex, nonlinear interactions between variables that are characteristic of fatigue scenarios. For instance, Samavatian et al. [14] demonstrated that machine learning techniques can predict solder joint reliability under cyclic stress with greater precision than traditional methods. Additionally, ANNs have been successfully applied to interpret multiaxial fatigue data, providing new insights into the critical stress and strain thresholds that precede material failure [15]. These advancements highlight the potential of ANNs to refine predictive models in high-stakes applications such as aerospace engineering, where multiple material failure mechanisms often act simultaneously.
In this study, the fatigue life of CMSX-4 is predicted by incorporating both crystal plasticity and multiaxial fatigue properties. A small-strain constitutive crystal plasticity model, described in the next section, is used to simulate the stress-strain behavior of the single crystal, particularly in regions with geometric irregularities. The lifetime assessment is conducted using the Chaboche lifetime estimation model, based on the stress history obtained from the single crystal model, with cleavage stress considered the primary failure criterion. Parameter optimization is performed for the Chaboche model at three different temperatures, and the resulting fatigue curves are used to train Artificial Neural Networks (ANNs). This enables lifetime assessment across different temperatures with a single optimized model, in contrast to the Chaboche model, which requires separate parameterization for each temperature.
2. Experimental Procedure and Methodology
HCF test results and notched specimen geometry were taken from Aslan [10], in which CMSX-4 specimen preparation procedures and various tensile and fatigue tests at different R ratios are widely discussed provided by PREMECCY project [16]. Related specifics about HCF tests and specimen geometry are further discussed in the following sections.
2.1. Material and Specimen
The second-generation nickel-based single crystal superalloy CMSX-4, whose chemical composition (in wt %) is shown in Table 1, was solution-treated and rapidly cooled to achieve a high volume fraction of precipitates (approximately 70%), which serve as the primary strengthening phase in the material.
Notched specimens with a cut orientation of (100)[001] were subjected to cyclic tension at R=0 and R=0.6 with a frequency of 118 Hz at C. Figure 1 illustrates the dimensions of the notched specimen, which has a thickness of 1.6 mm at the notched section. The presence of the notch creates varying stress concentrations depending on the notch radius and thickness. Therefore, using lifetime dependency based on the maximum stress induced within the specimen, rather than the applied stress, provides a more generalized understanding of the fracture mechanics.
The elastic stress concentration factor, Kt, is determined to be 2.15 for the geometry represented in Figure 1 and the stress at the notched tip, is calculated by
where is the nominal stress across cross-section of the specimen.
2.2. Crystal Plasticity
The constitutive framework of the single-crystal plasticity model, developed from Cailletaud’s crystallographic model [17], is presented in this section. This model is designed to simulate the anisotropic, rate-dependent plastic behavior of Ni-based superalloys under small strains. The linear strain tensor is expressed as , derived from the symmetric part of the displacement gradient. Given that small deformations are considered in this study, an additive decomposition is applied.
where is the elastic strain and is the plastic part. The Cauchy stress can be expressed as a state law:
where represents the fourth-order elasticity tensor. The material being simulated has an FCC structure, exhibiting cubic elastic behavior. As a result, has three independent constants: , , and , as shown below.
Another state law can shown which represents isotropic hardening of the each slip system as:
where s denotes the slip system and N represents the total number of slip systems. The term is the interaction matrix that governs both self and latent hardening, resulting from interactions among the N slip systems. The literature typically suggests taking as an identity matrix for single crystal Ni-based superalloys, as they do not exhibit predominant latent hardening [18]. Additionally, represents the dislocation density, which is defined by a nonlinear isotropic hardening rule as:
hence becomes
In order to define (which is plastic slip of slip system s) schmid law must be presented here:
where is the resolved shear stress of slip system s, which drives the plastic slip in the corresponding slip system. In other words, for a slip system to undergo plastic deformation, the resolved shear stress must exceed a stress threshold defined by Schmid’s law. Therefore, Schmid’s law serves as a multimechanism plastic yield criterion in this context. The resolved shear stress can be calculated as:
where is the slip direction of slip system s and is the corresponding slip normal. Table 2. shows a list of slip normals and directions of FCC materials.
The plastic strain rate is then expressed as:
Finally, the plastic slip rate of slip system s can be defined using a Norton rule with a threshold as:
where K is a model parameter and n is the rate-sensitivity parameter.
2.3. Lifetime Assessment
2.3.1. Critical Stress Determination
The selection of an equivalent stress that accurately describes static fracture, based on the material and loading type, is crucial for correct life estimations, particularly for complex geometries that result in triaxiality. For most metals, using maximum principal stress or von Mises stress is considered an appropriate approach for estimating multiaxial fatigue. However, for single crystals, it is more effective to account for slip planes to capture the anisotropic response of different crystal orientations.
FCC single crystals have four active octahedral slip planes and three cubic slip planes, as shown in Figure 2a,b. The influence of cubic slip systems becomes apparent at elevated temperatures due to their higher activation energy requirement for plasticity, while octahedral systems remain active even at room temperature, owing to their densely packed structure. Since fractures typically occur along active slip planes, stress in the cleavage directions is considered the critical factor for fatigue life estimations.
Experimental studies demonstrate that mixed-mode loadings are evident in multiaxial fatigue fractures across various specimens and loading types. Mode I is observed to be the most dominant mode, even under pure shear loadings, as the appearance of shearing and tearing crack modes depends on the crack inclination and material orientation. The cleavage system (Mode I) is consistently present, while the accommodation systems (Modes II and III) manifest depending on the fatigue loadings. The growth of fatigue micro-cracks is predominantly influenced by the cleavage system. [20,21,22,23] Based on these findings, critical stress is defined as the cleavage stresses acting on the slip planes where crack initiation occurs.
2.3.2. Modified Fatigue Damage Law
The damage law is typically expressed by assuming that the fatigue damage accumulated during each cycle is a function of the amplitude and mean values of the stress:
where D is the scalar variable representing the evolution of fatigue damage, ranging from the virgin state () to fatigue fracture (). Lemaitre and Chaboche [19] proposed fatigue life models based on the Woehler rule for both uniaxial and multiaxial loading conditions. Multiaxial fatigue damage is estimated using equivalent fatigue limits and stress values relevant to the specific loading conditions. Due to the anisotropic nature of single crystals, the crack initiation location and propagation path are determined by the material’s slip systems. Since it is crucial to consider both crack initiation and propagation for fatigue lifetime assessment of single crystals, cleavage stress acting on the crack is used instead of the macroscopic equivalent amplitude stress. The equation governing fatigue damage on the dominant cleavage plane is expressed as:
where and represent the dominant cleavage stress amplitude and mean stress, respectively, and is a temperature-dependent model parameter. The function accounts for the effects of nonlinear accumulation:
where a is a model parameter, is the ultimate tensile stress, and is the fatigue limit in terms of amplitude stress. The relationship between fatigue limit and mean stress is expressed by Goodman’s linear relation:
where represents the fatigue limit at zero mean stress (i.e., the endurance limit), and is the model parameter that defines the relationship between fatigue limit and mean stress. The parameter M is expressed using a similar linear relationship, dependent on mean stress and model parameters and , as follows:
The fatigue life, , of a material is determined by integrating the damage variable, D, in equation 13 from 0 to 1, as represents the fatigue failure of a virgin material:
2.3.3. Artificial Neural Networks (ANNs)
Artificial Neural Networks (ANNs) are machine learning tools designed to establish nonlinear relationships between given inputs and desired outputs by mimicking the neurological structure of the human brain [27]. ANNs consist of three main parts, as shown in Figure 4.
The input vector, , represents the independent variables that affect the output vector, . Hidden layers establish the nonlinear relationship between the input layer and the output layer. These hidden layers receive the independent variables from the input layer and adjust them by applying weights, , and biases, . The mathematical notation for the i-th neuron in a hidden layer is as follows:
The activation function, , introduces nonlinearity into the system by processing the linear relationship through weights and biases. These functions are among the primary factors controlling the output range and learning capability of artificial neurons. ANNs operate in a feed-forward structure, where the output from each neuron is fed into the next neuron until a prediction is made in the output neuron. The weights and biases are adjusted by monitoring the difference between the predicted and actual outputs using the backpropagation algorithm: . ReLU, shown in Equation 19, is commonly used as an activation function because it reduces the vanishing gradient problem and has derivatives that are easier to compute. In the vanishing gradient problem, gradients become smaller as training progresses, significantly slowing down or completely halting the learning process.
The difference between the actual and predicted output values in the output layers is computed by defining a loss function, , such as the mean square error. The loss function is minimized by calculating its derivatives with respect to weights and biases in each iteration, k, until the error between predicted and actual data is sufficiently reduced. The mathematical expression for optimizing the loss function via gradient descent is as follows:
Convergence to the minimum value of the loss function is controlled by the learning rate, , which determines the step size in each iteration.
2.3.4. Finite Element Model of the Nothced Specimen
The finite element model of the notched specimen, presented in Figure 1, was created using Abaqus CAE with quadratic axisymmetric elements (CAX8). The corresponding finite element analysis (FEA) mesh is shown in Figure 5. The behavior of the single crystal material was modeled using the small-strain crystal plasticity theory, as described in Section 2.2, and implemented as a user material subroutine (UMAT).
The stress history at each integration point was obtained from the output database of the single crystal plasticity model via Abaqus Post-Scripting Python Modules. Lifetime predictions, based on these stress histories, were carried out using the multiaxial anisotropic lifetime assessment theory described in Section 2.3.2. The lifetime values and mesh information from the FEA model were stored in Visualization Toolkit (VTK) data format, allowing lifetime contours to be visualized using Paraview, an open-source post-processing visualization tool.
3. Results and Discussion
3.1. Lifetime Prediction of the Notched Specimen at C
The model parameter, K, and the rate-sensitivity parameter, n, were selected to replicate the stress-strain behavior of CMSX-4 at 750°C. The elastic moduli constants of CMSX-4, provided in Table 3, were sourced from the literature [26].
The temperature-dependent material parameters of the lifetime assessment model, including yield strength () and ultimate tensile strength () of CMSX-4 at C, were also taken from the literature [25]. Amplitude and mean stress values were derived from HCF results, and the temperature-dependent model parameters were adjusted for accurate lifetime estimation at both R ratios.
Table 4 outlines the parameter sets for both the crystal plasticity and lifetime assessment models. As CMSX-4 does not exhibit a true fatigue limit due to its FCC microstructure, the endurance limit () was set to zero instead of defining a specific lifetime as infinite, to improve visualization of the lifetime across the specimen. Since the fatigue limit is computed for different mean stress levels, resulting in a value of zero, the parameter is not applicable in this case.
The maximum cyclic stress-strain distribution for the CMSX-4 notched specimen with a (100)[001] cut orientation is shown in Figure 6. Stress at the notch tip remains elastic throughout the cyclic loading for R ratios of 0 and 0.6, as typically observed in HCF loadings. Figure 6 suggests that the maximum applied stress distribution and lifetime distribution vary according to the dominant cleavage stress directions along active slip systems.
For the (100)[001] cut orientation, octahedral slip planes are observed to dominate over cubic systems, even at elevated temperatures. Consequently, crack initiation is expected to occur along the 111 planes, with crack growth following the cleavage (Mode I opening) stress directions. As a result, the crack initiation points depend entirely on the orientation of the specimen, despite the same applied elastic stress distribution shown in Figure 6.
Lifetime distributions for different cut orientations are determined by adjusting the local coordinate system of the crystal plasticity model to align with the tensile loading orientation. A comparison of crack initiation points with simulation results for various cut orientations of the notched specimen is provided in Figure 7 and Figure 8.
Fatigue crack initiation for the notched specimen with a <001> crystal orientation occurs above the notch tip, despite the higher geometric stress concentration at the notch tip, as shown in Figure 8a. This is due to the high accumulation of slip in these regions, driven by the elastic and plastic anisotropy of the cut orientation [24]. This phenomenon is also observed at the notch tip for <011> and <111> orientations in Figure 8c and Figure 7a, as the dominant slip systems provided in Table 2 align with the tensile loading directions.
3.2. Fatigue Curve Predictions with Artificial Neural Networks
3.2.1. Training Dataset and ANN Configuration
Parameter optimization of the damage model is performed for 600°C and 900°C, as the model parameters presented in Table 5 are temperature dependent. Fatigue curves at these temperatures can be generated using the damage model; however, this temperature dependency makes it challenging to predict variations in temperature without further modifications to the damage law. Artificial neural networks (ANNs), on the other hand, do not have this limitation, as temperature is treated as another variable in establishing the nonlinear relationship between input variables—maximum stress, R ratio—and the output variable, which is the predicted lifetime.
ANNs require a wide range of loading data across these temperatures to accurately predict the lifetime of components under complex load conditions. Since it is not feasible to produce experimental results for single crystal superalloys like CMSX-4, the combination of ANNs and the modified damage model enhances lifetime assessment by leveraging the damage model to provide a broad data range and using ANNs to make predictions without parameter restrictions. The parameter optimization of the modified damage model for 600°C and 900°C is presented in Table 5. Although FCC materials generally do not exhibit a clear fatigue limit, in this case, a target lifetime of 10° cycles is considered as infinite life, and the fatigue limit is adjusted by defining as the endurance limit for , with the relationship between mean stress and fatigue limit established using parameter .
Fatigue curves generated by the Chaboche Model for 600°C and 900°C, with R ratios from 0 to 0.4, were fed into the ANNs to simulate temperature variation between 600°C and 900°C. The ANNs consist of 20 hidden layers with 20 neurons each, and a single output layer with one neuron to predict the lifetime. The stochastic gradient descent optimizer "Adam" is used, as it adjusts the learning rate according to the corresponding decrease in the loss function, with an initial learning rate set at 0.0001.
The loss function was chosen as Mean Square Error (MSE), as the training data generated from the damage model is consistent, meaning the dataset does not contain data points that significantly deviate from others. Additionally, the stress-lifetime values fed into the ANNs are on a logarithmic scale, eliminating the need for a logarithmic error function. This approach yields better training results compared to using actual lifetime values with a mean squared logarithmic error (MSLE). The lifetime data ranges from 1 to and is normalized before being fed into the input layer. Logarithmic scaling reduces the difference between maximum and minimum lifetime values, making it easier for the ANNs to compute the nonlinear relationship.
The validation set comprised 15% of the total training data produced using the modified damage model, while the experimental data presented in Figure 10 is used as the test data. The model’s metric, Root Mean Square Error (RMSE), is computed as 0.21 for log-scaled lifetime values. Additionally, the same metric comparison was performed with the experimental data shown in Figure 10, yielding an error value of 0.81, which was expected due to the scatter of the experimental data around the training data.
The fatigue curves generated from the training data spectrum, shown in Figure 11, demonstrate that it is possible to reproduce the lifetime results obtained by the modified Chaboche models with two different parameter sets using ANNs. The smooth data flow indicates that training with a batch size of 3.5% of the training data over 250 epochs was sufficient to capture the effects of fatigue limit and temperature, as well as the convergence to ultimate tensile strength for each R ratio at the same temperature, without overfitting the model.
The prediction results between 600°C and 900°C exhibit a coherent temperature-dependent behavior, where both ultimate tensile strength (UTS) and the fatigue limit decrease with increasing temperature, as the material becomes softer. Since UTS and fatigue limit values were not provided to the ANNs for 700°C and 800°C due to the lack of property characterization at these temperatures, real-life values may differ from the data represented in Figure 12. However, this discrepancy can be mitigated by simply introducing fatigue limit and UTS values characterized at these temperatures into the ANNs, further enhancing the model’s performance.
4. Conclusions
In this study, the damage-based lifetime prediction model presented by Chaboche and Lemaitre was modified into an anisotropic lifetime assessment model by incorporating Mode I crack opening stress to account for the effects of anisotropy on the life of single crystal components. This lifetime assessment model was combined with the rate-dependent crystal plasticity model described in Section 2.2, enabling the accurate simulation of the octahedral and cubic slip system behavior characteristic of FCC single crystals.
The HCF lifetime estimation of the Ni-based single crystal CMSX-4 for a notched specimen at C and various R ratios shows strong agreement with experimental data. Furthermore, crack initiation locations were predicted for different crystal orientations of the notched specimen, yielding results consistent with fatigue tests conducted on another Ni-based single crystal, SC16. This demonstrates the model’s accuracy in predicting both lifetime values and crack initiation points for geometries with stress concentration zones.
By selecting cleavage stress as the critical stress for lifetime estimation, the model accounts for both crack initiation and propagation, even under rapid crack propagation conditions, such as HCF loadings. These findings indicate that the model can provide accurate predictions for real-world geometries, such as turbine blades, under both creep and combined fatigue loadings, given that cleavage systems are more prominent in LCF loadings. Further modifications, such as incorporating creep-fatigue interaction (as previously developed by Chaboche [19]) and HCF-LCF superimposition, are necessary to extend the modified Chaboche model to predict the behavior of real-world single crystal components with complex geometries.
While the parameters of the modified damage model are inherently temperature-dependent and require careful optimization for each specific temperature, ANNs offer a robust alternative for predicting fatigue curves across a range of temperatures. This research demonstrates that with sufficient data, ANNs can effectively internalize and replicate the complex behaviors captured by the damage model, adapting to different thermal environments without the need for manual re-parameterization. This capability not only streamlines the predictive process but also enhances the scalability of fatigue life assessments in practical engineering applications.
Integrating ANNs with traditional damage models, such as the Chaboche model, could significantly improve the efficiency and accuracy of lifetime predictions for critical components subjected to diverse operational stresses and temperatures. With additional fatigue tests incorporating dwell times and HCF-LCF combinations, a wide range of lifetime predictions using ANNs for such loading conditions seems achievable.
Author Contributions
Conceptualization, A.O.; methodology, C.K. and U.K.; validation, U.K.; writing—original draft preparation, U.K.; writing—review and editing, all of the authors; visualization, U.K.; supervision, A.O.; funding acquisition, C.K. All authors have read and agreed to the published version of the manuscript.
Funding
This research was funded by the TÜBİTAK 2244 Industrial PhD Program under project number [119C037]. Additionally, publication fees were covered by Turkish Aerospace Industries (TAI).
Data Availability Statement
Restrictions apply to the availability of these data. Data were obtained from the PREMECCY project (Contract number: AST5-CT-2006-030889) and are available from the author, Özgür Aslan, with the permission of the PREMECCY project.
Acknowledgments
The author(s) would like to acknowledge the financial support provided by TÜBİTAK through the 2244 Industrial PhD Program. Special thanks to TUSAŞ Engine Industries (TEI) for their collaboration and contribution to this program. The support from all institutions has been instrumental in conducting this research.
Conflicts of Interest
The authors declare no conflicts of interest.
References
- Shi, Z.; Shi, X.Z.; Wang, X.; Liu, S.; Li, J. Low cycle fatigue properties and microstructure evolution at 760°C of a single crystal superalloy. Prog. Nat. Sci. Mater. Int. 2015, 25, 78–83. [Google Scholar] [CrossRef]
- Wang, R.; Wang, B.R.; Zhang, B.; Hu, D.; Jiang, K.; Hao, X.; Mao, J.; Jing, F. In-phase thermomechanical fatigue lifetime prediction of nickel-based single crystal superalloys from smooth specimens to notched specimens based on coupling damage on critical plane. Int. J. Fatigue 2019, 126, 327–334. [Google Scholar] [CrossRef]
- Riccius, J.; Zametaev, E. HCF and LCF Analysis of a Generic Full Admission Turbine Blade. Aerospace 2023, 10, 154. [Google Scholar] [CrossRef]
- Hou, J.; Hou, B.J.J.; Wicks, B.J.; Antoniou, R.A. An investigation of fatigue failures of turbine blades in a gas turbine engine by mechanical analysis. Eng. Fail. Anal. 2002, 9, 201–211. [Google Scholar] [CrossRef]
- Kalluri, S.; Mcgaw, M.A. S. Kalluri and M. A. Mcgaw, "Effect of Tensile Mean Stress on Fatigue Behavior of Single-Crystal and Directionally Solidified Superalloys. NASA Tech. Memo. 1990, 103644. [Google Scholar]
- Arakere, N.K.; Swanson, G. Effect of crystal orientation on fatigue failure of single crystal nickel base turbine blade superalloys. J. Eng. Gas Turbines Power 2002, 124, 161–176. [Google Scholar] [CrossRef]
- Hong, H.U.; Hong, J.G.H.U.; Kang, J.G.; Choi, B.G.; Kim, I.S.; Yoo, Y.S.; Jo, C.Y. A comparative study on thermomechanical and low cycle fatigue failures of a single crystal nickel-based superalloy. Int. J. Fatigue 2011, 33, 1592–1599. [Google Scholar] [CrossRef]
- Okazaki, M.; Sakaguchi, M. M. Okazaki and M. Sakaguchi, "Thermo-mechanical fatigue failure of a single crystal Ni-based superalloy. Int. J. Fatigue 2008, 30, 318–323. [Google Scholar] [CrossRef]
- Yu, Y.; Yu, S.P.Y.; Zhu, S.P.; Liu, Q.; Liu, Y. A new energy-critical plane damage parameter for multiaxial fatigue life prediction of turbine blades. Materials 2017, 10, 513. [Google Scholar] [CrossRef]
- Aslan, O. Numerical modeling of fatigue crack growth in single crystal nickel-based superalloys. Ph.D. dissertation, Ecole Nationale Supérieure des Mines de Paris, 2010.
- Brown, M.W.; Miller, K.J. A theory for fatigue failure under multiaxial stress-strain conditions. Proc. Inst. Mech. Eng. 1973, 745. [Google Scholar] [CrossRef]
- Bourbita, F.; Rémy, L. A combined critical distance and energy density model to predict high temperature fatigue life in notched single crystal superalloy members. Int. J. Fatigue 2016, 84, 17–27. [Google Scholar] [CrossRef]
- Levkovitch, V.; Levkovitch, R.V.; Sievert, R.; Svendsen, B. Simulation of deformation and lifetime behavior of a fcc single crystal superalloy at high temperature under low-cycle fatigue loading. Int. J. Fatigue 2006, 28, 1791–1802. [Google Scholar] [CrossRef]
- Samavatian, V.; Samavatian, M.V.; Fotuhi-Firuzabad, M.; Samavatian, M.; Dehghanian, P.; Blaabjerg, F. Correlation-driven machine learning for accelerated reliability assessment of solder joints in electronics. Scientific Reports, 10, no. 1, Nature Publishing Group, 2020. [CrossRef]
- George, A.; George, J.A.; Zipprich, J.; Breitenbach, M.; Klingler, M.; Nowottnick, M. Reliability investigation of large area solder joints in power electronics modules and its simulative representation. Microelectron. Reliab. 2018, 88–90, 762–767. [Google Scholar] [CrossRef]
- Predictive methods for combined cycle fatigue in gas turbine blades. Final Project Report AST5-CT-2006-030889, European Commission—6th RTD Framework Program. 2012.
- Cailletaud, G. Une approche micromécanique phénoménologique du comportement inélastique des métaux," Ph.D. dissertation, Paris 6-Jussieu, 1987.
- Meric, L.; Meric, P.L.; Poubanne, P.; Cailletaud, G. Single Crystal Modeling for Structural Calculations: Part 1-Model Presentation. Eng. Mater. Technol. 1991, 113, 162. [Google Scholar] [CrossRef]
- Chaboche, J.L.; Lemaitre, J. Mechanics of Solid Materials, 1990.
- Donahue, R.J.; Donahue, H.M.R.J.; Clark, H.M.; Atanmo, P.; Kumble, R.; McEvily, A.J. Crack Opening Displacement and The Rate of Fatigue Crack Growth. Int. J. Fract. Mech. 1972, 8. [Google Scholar] [CrossRef]
- Hoshidet, T.; Socies, D.F. Mechanics of mixed mode small fatigue crack growth. Eng. Fract. Mech. 1987, 26, 841–850. [Google Scholar] [CrossRef]
- Lankford, J.; Lankford, D.L.J.; Davidson, D.L.; Chan, K.S. The Influence of Crack Tip Plasticity in the Growth of Small Fatigue Cracks. Metall. Trans. 1984, 15, 1579–1588. [Google Scholar] [CrossRef]
- Qian, J.; Fatemit, A. Mixed mode fatigue crack growth: A literature survey. Eng. Fract. Mech. 1996, 55, 969–990. [Google Scholar] [CrossRef]
- Forest, S. Nickel base single crystals across length scales. in Crystal plasticity and damage at cracks and notches in nickel-base single-crystal superalloys 2022, 457-473.
- Sengupta, A.; Sengupta, S.K.A.; Putatunda, S.K.; Bartosiewicz, L.; Hangas, J.; Nailos, P.; Peputapeck, M.; Alberts, E.E. Tensile Behavior of a New Single-Crystal Nickel-Based Superalloy (CMSX-4) at Room and Elevated Temperatures. J. Mater. Eng. Perform. 1994, 3, 73–81. [Google Scholar] [CrossRef]
- Dye, D.; Dye, J.D.; Coakley, J.; Vorontsov, V.A.; Stone, H.J.; Rogge, R.B. Elastic moduli and load partitioning in a single-crystal nickel superalloy. Scr. Mater. 2009, 61, 109–112. [Google Scholar] [CrossRef]
- López, O.A.M.; López, A.O.A.M.; López, A.M.; Crossa, J. Fundamentals of Artificial Neural Networks and Deep Learning. Multivariate Statistical Machine Learning Methods for Genomic Prediction 2022, 425, 379. [Google Scholar] [CrossRef]
- Bartošák. Using machine learning to predict lifetime under isothermal low-cycle fatigue and thermo-mechanical fatigue loading. Int. J. Fatigue 2022, 165, 107067. [Google Scholar] [CrossRef]
Figure 1.
Dimensions of the notched specimen [10].
Figure 1.
Dimensions of the notched specimen [10].
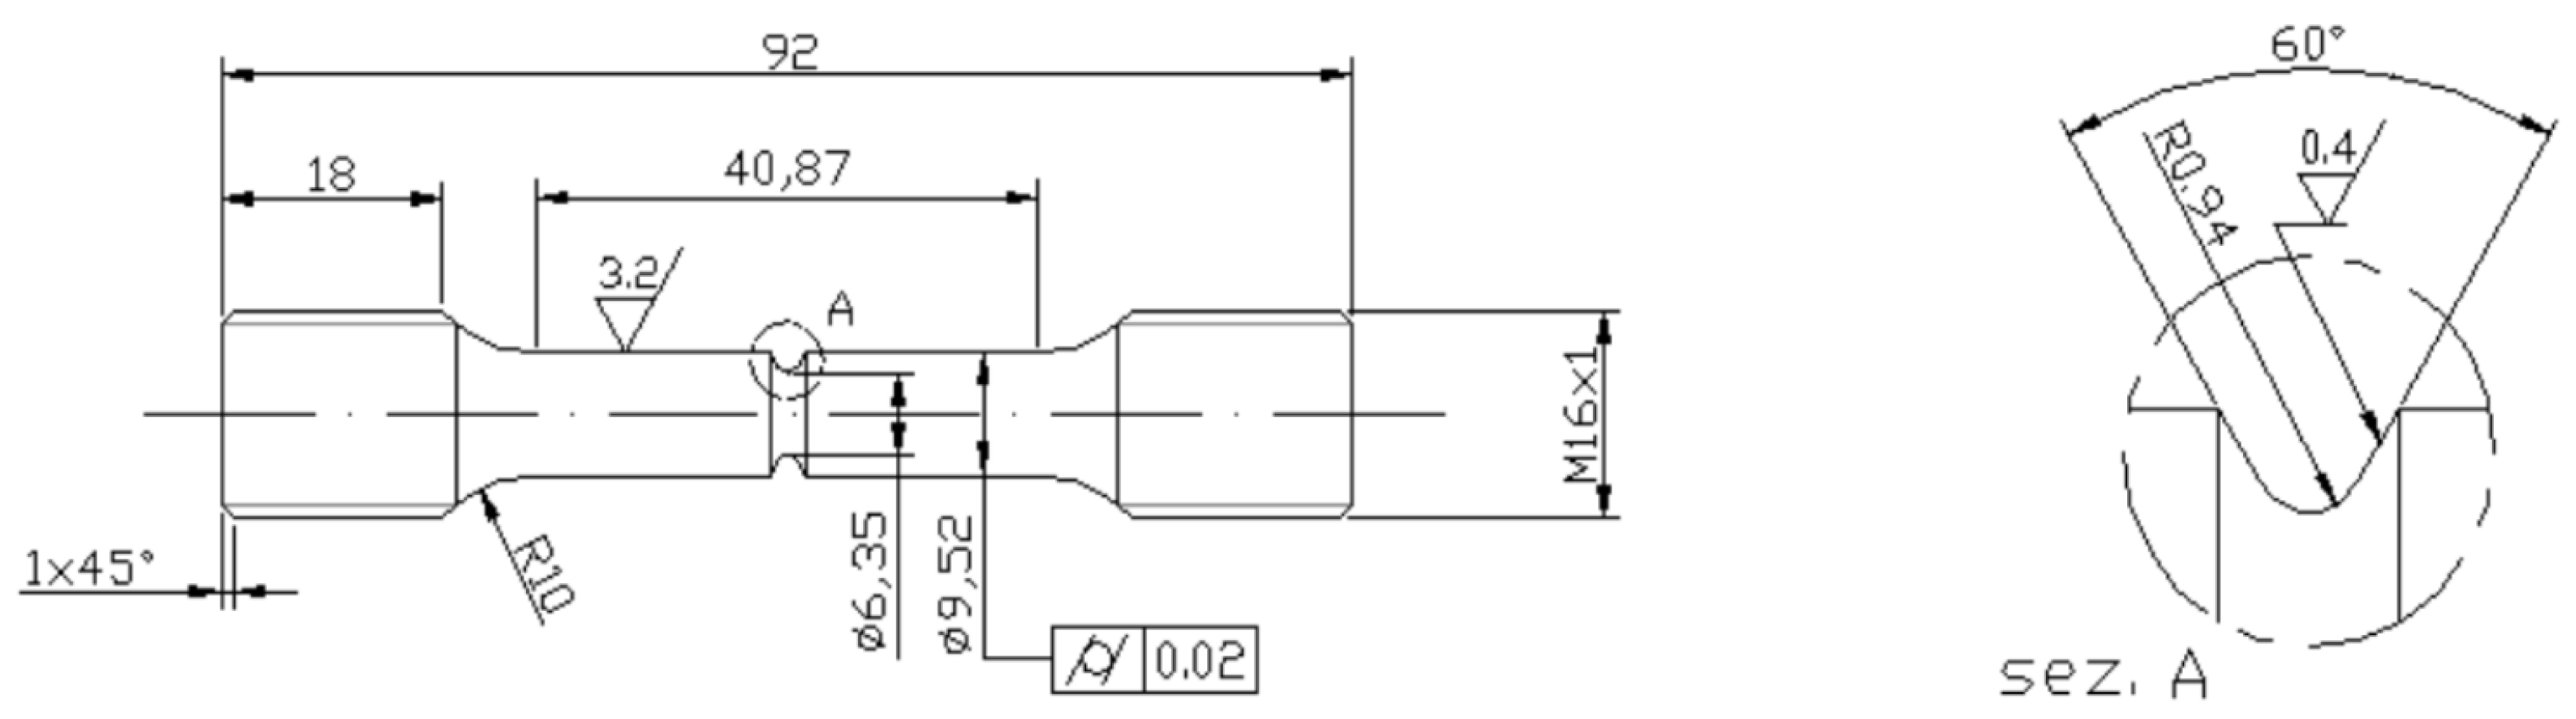
Figure 2.
Octahedral (a) and cubic (b) slip planes of a FCC crystal.
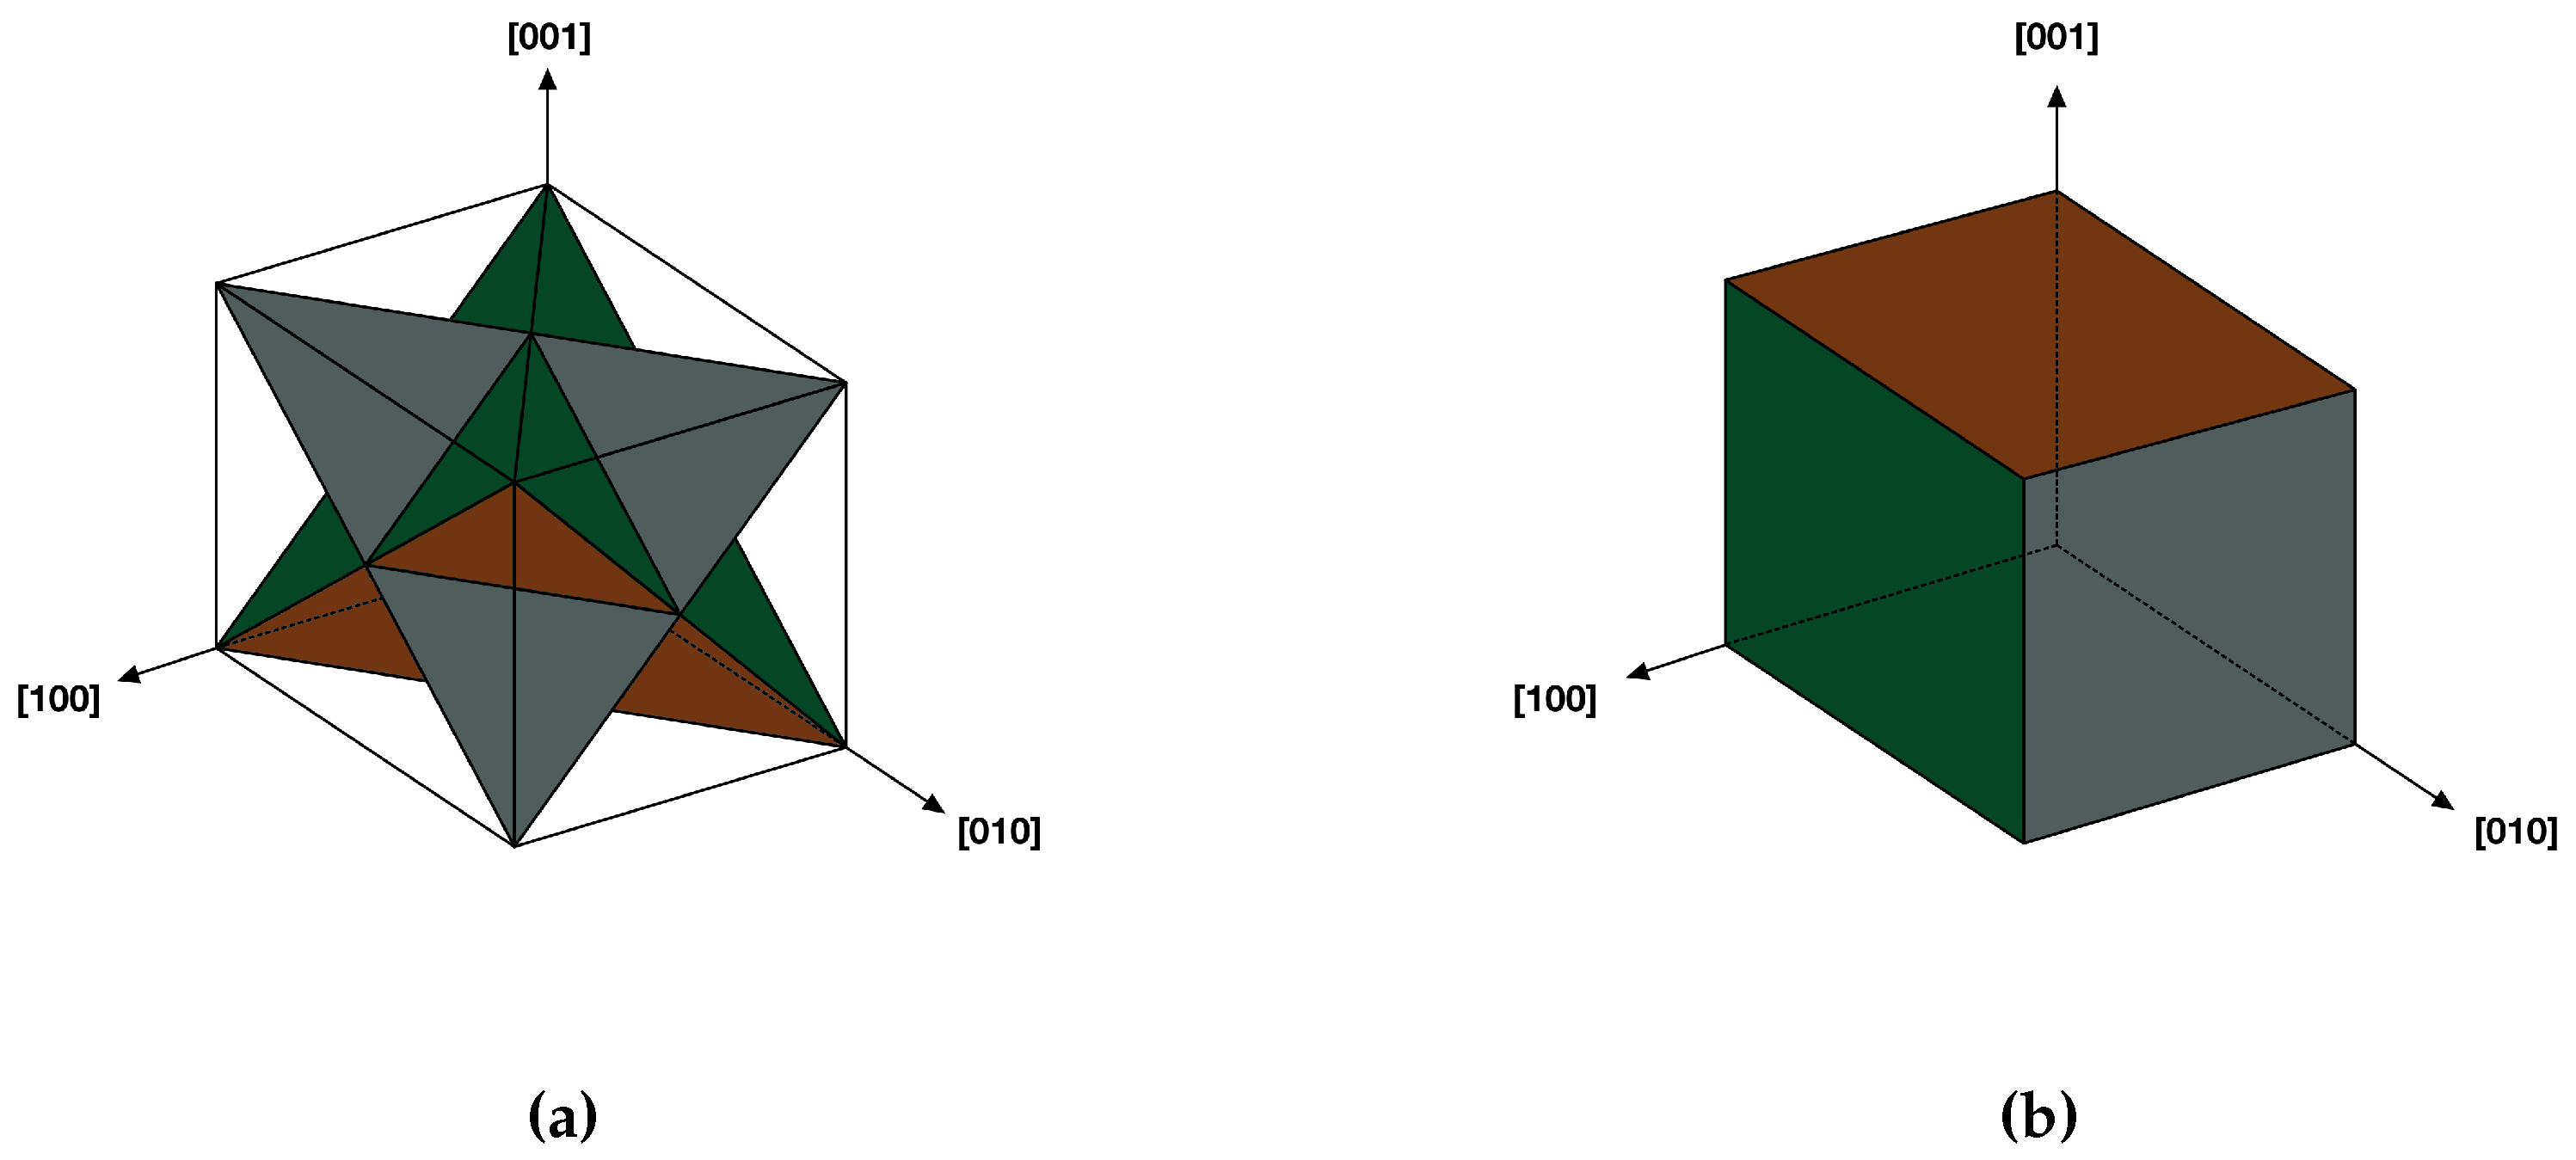
Figure 3.
Demonstration of crack modes for slip planes [10].
Figure 3.
Demonstration of crack modes for slip planes [10].
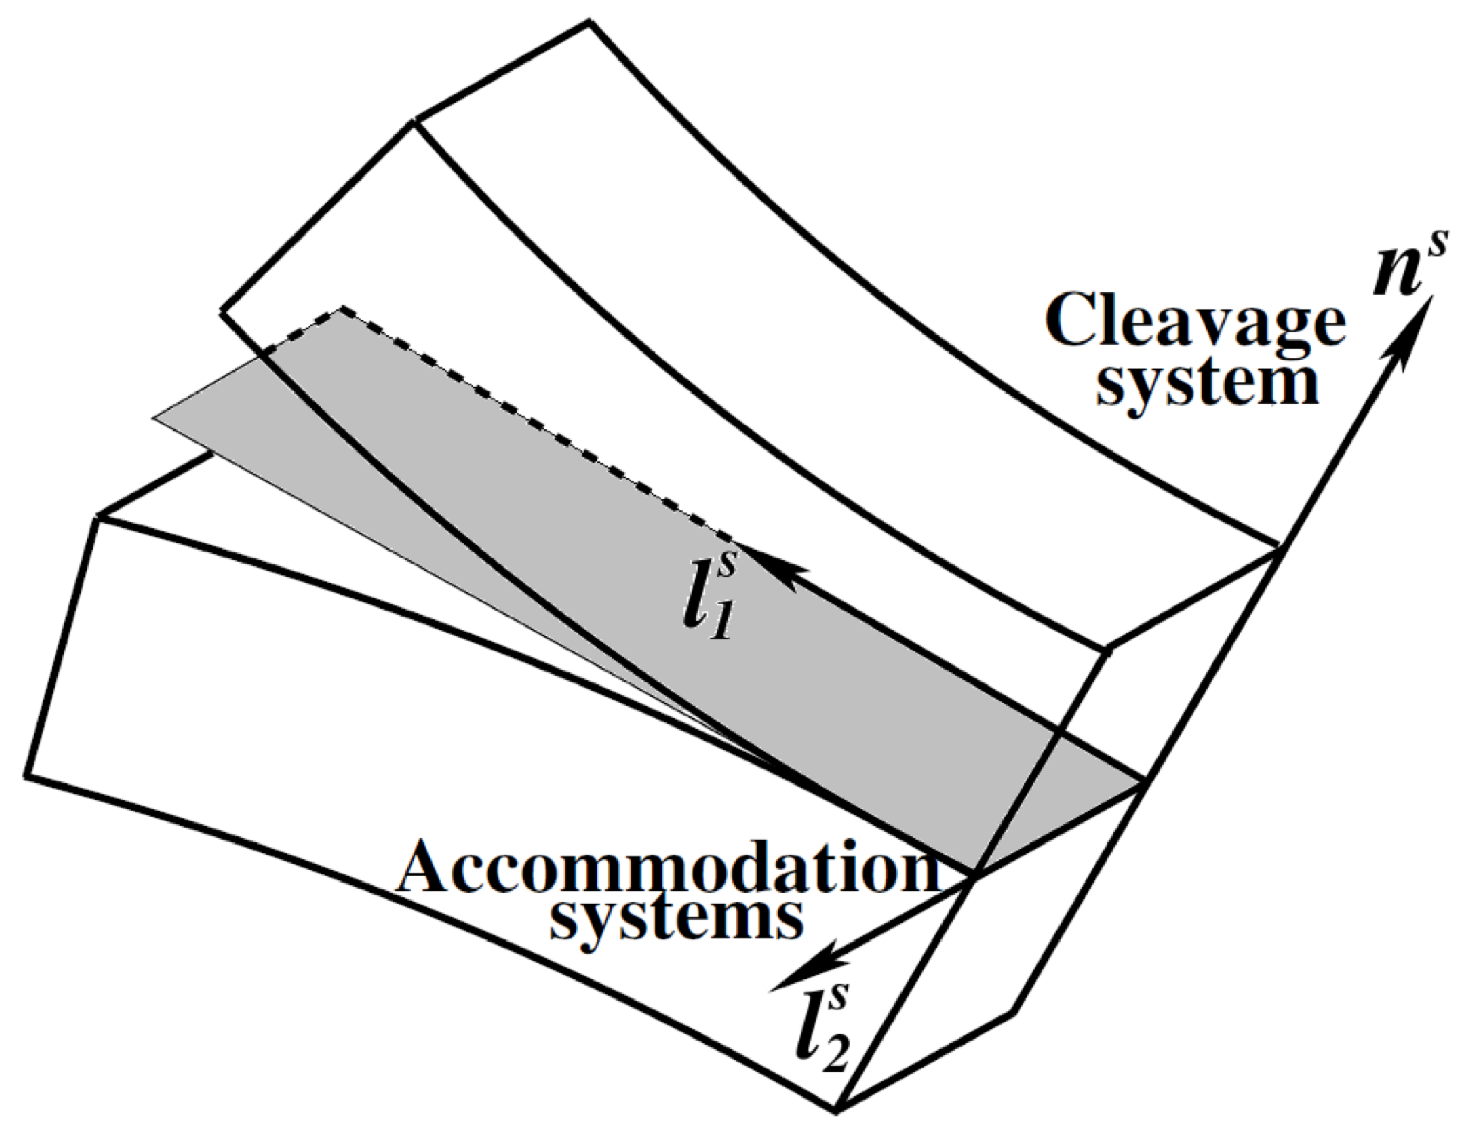
Figure 4.
Schematic of artificial neural networks [28].
Figure 4.
Schematic of artificial neural networks [28].

Figure 5.
Finite element mesh of the notched specimen.
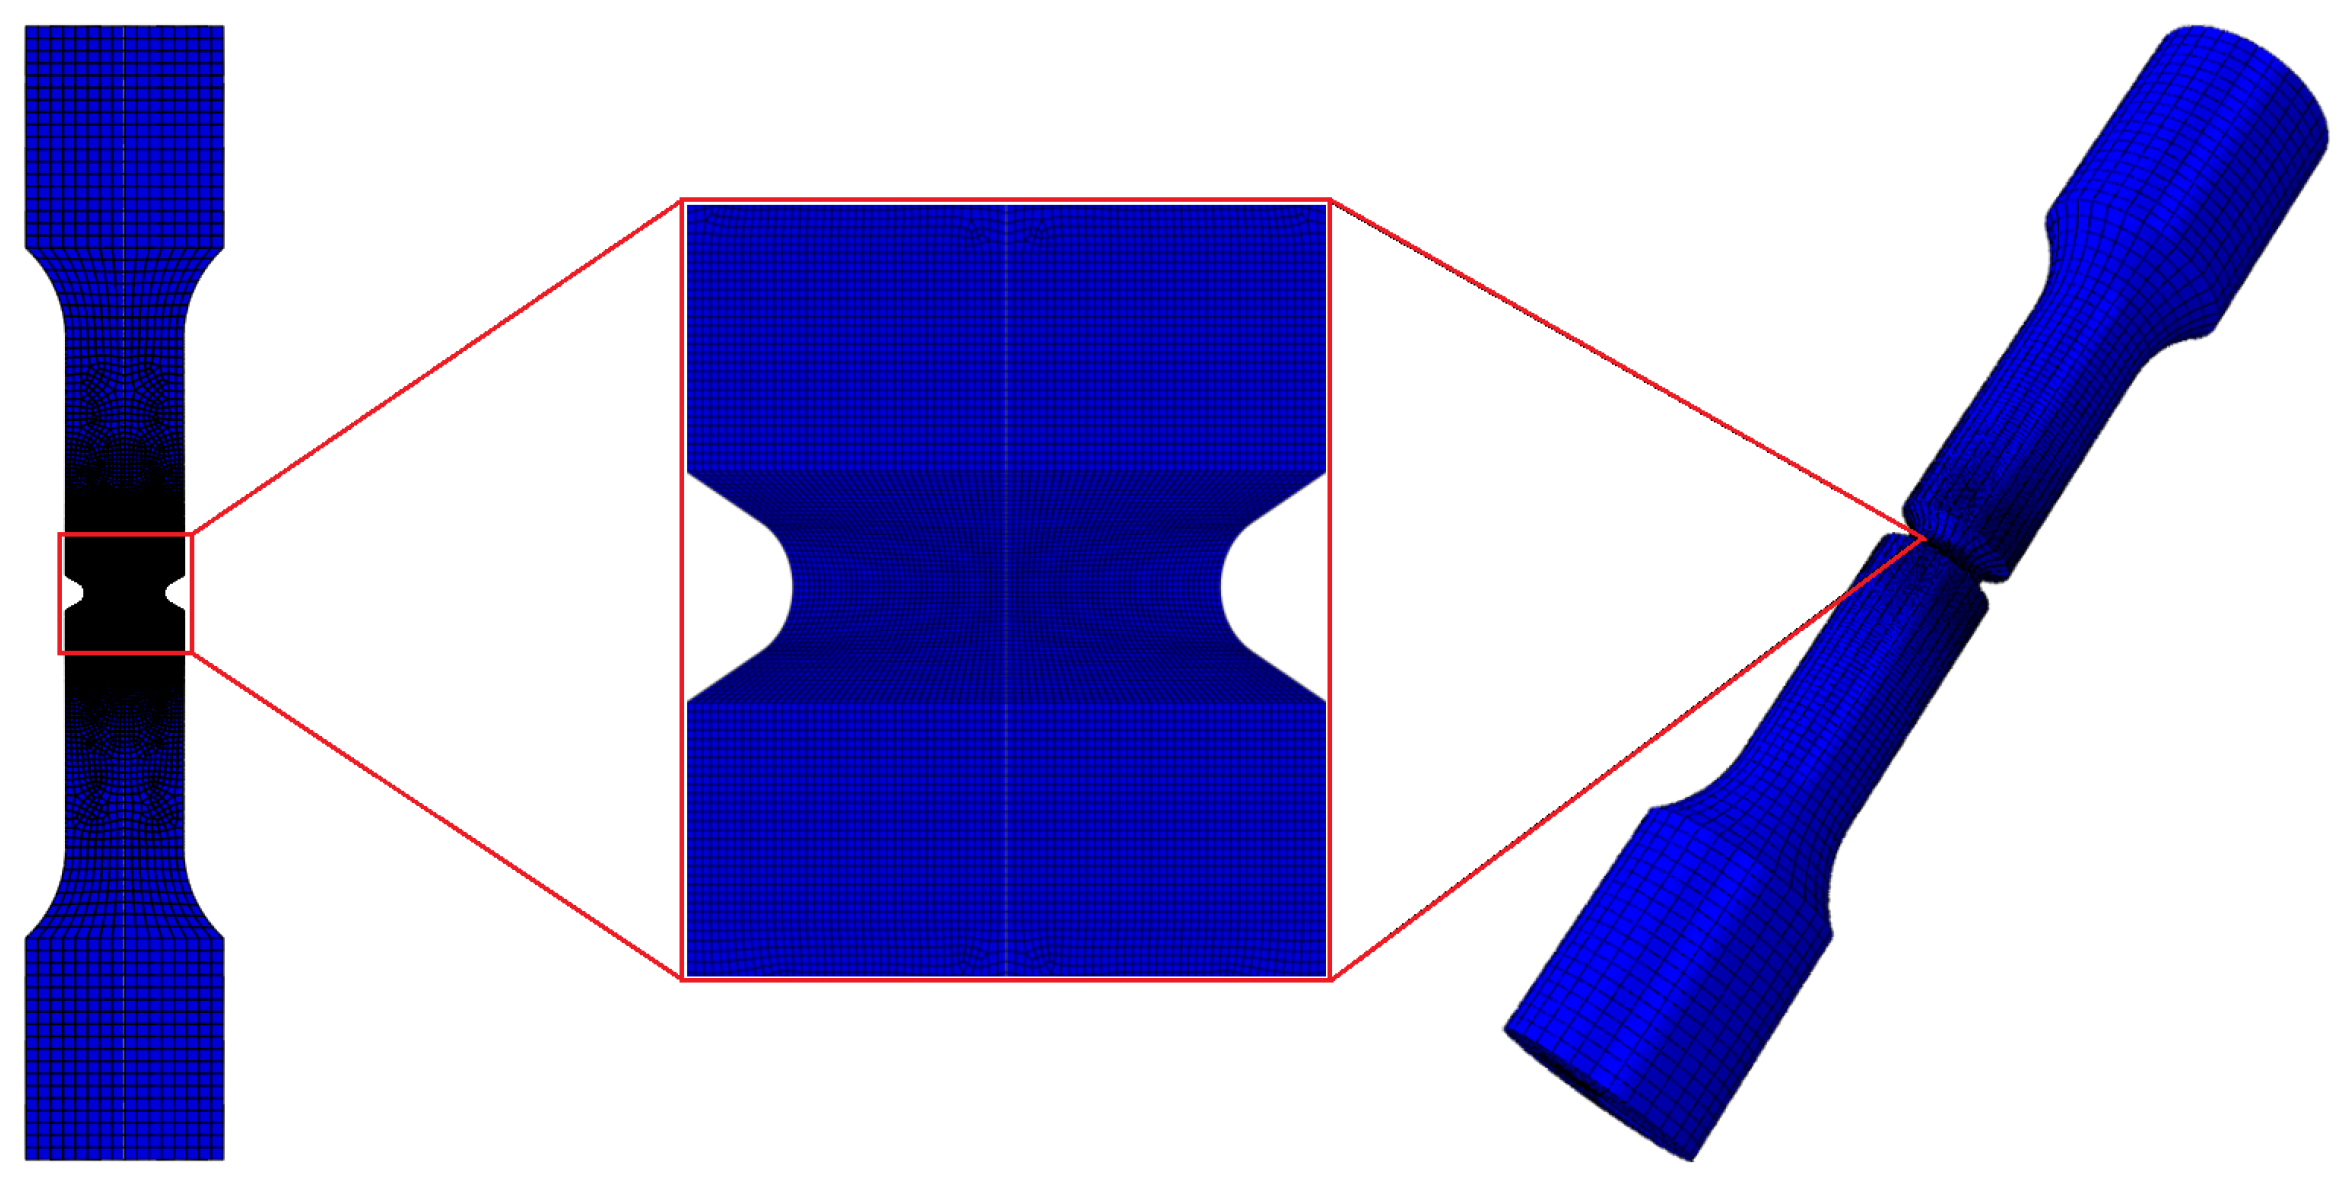
Figure 6.
Stress in 22-direction (a), logarithmic strain in 22-direction (b) and lifetime (c) contours of a single crystal notch specimen under HCF with R= 0.6 and cut orientation of (100)[001].
Figure 6.
Stress in 22-direction (a), logarithmic strain in 22-direction (b) and lifetime (c) contours of a single crystal notch specimen under HCF with R= 0.6 and cut orientation of (100)[001].
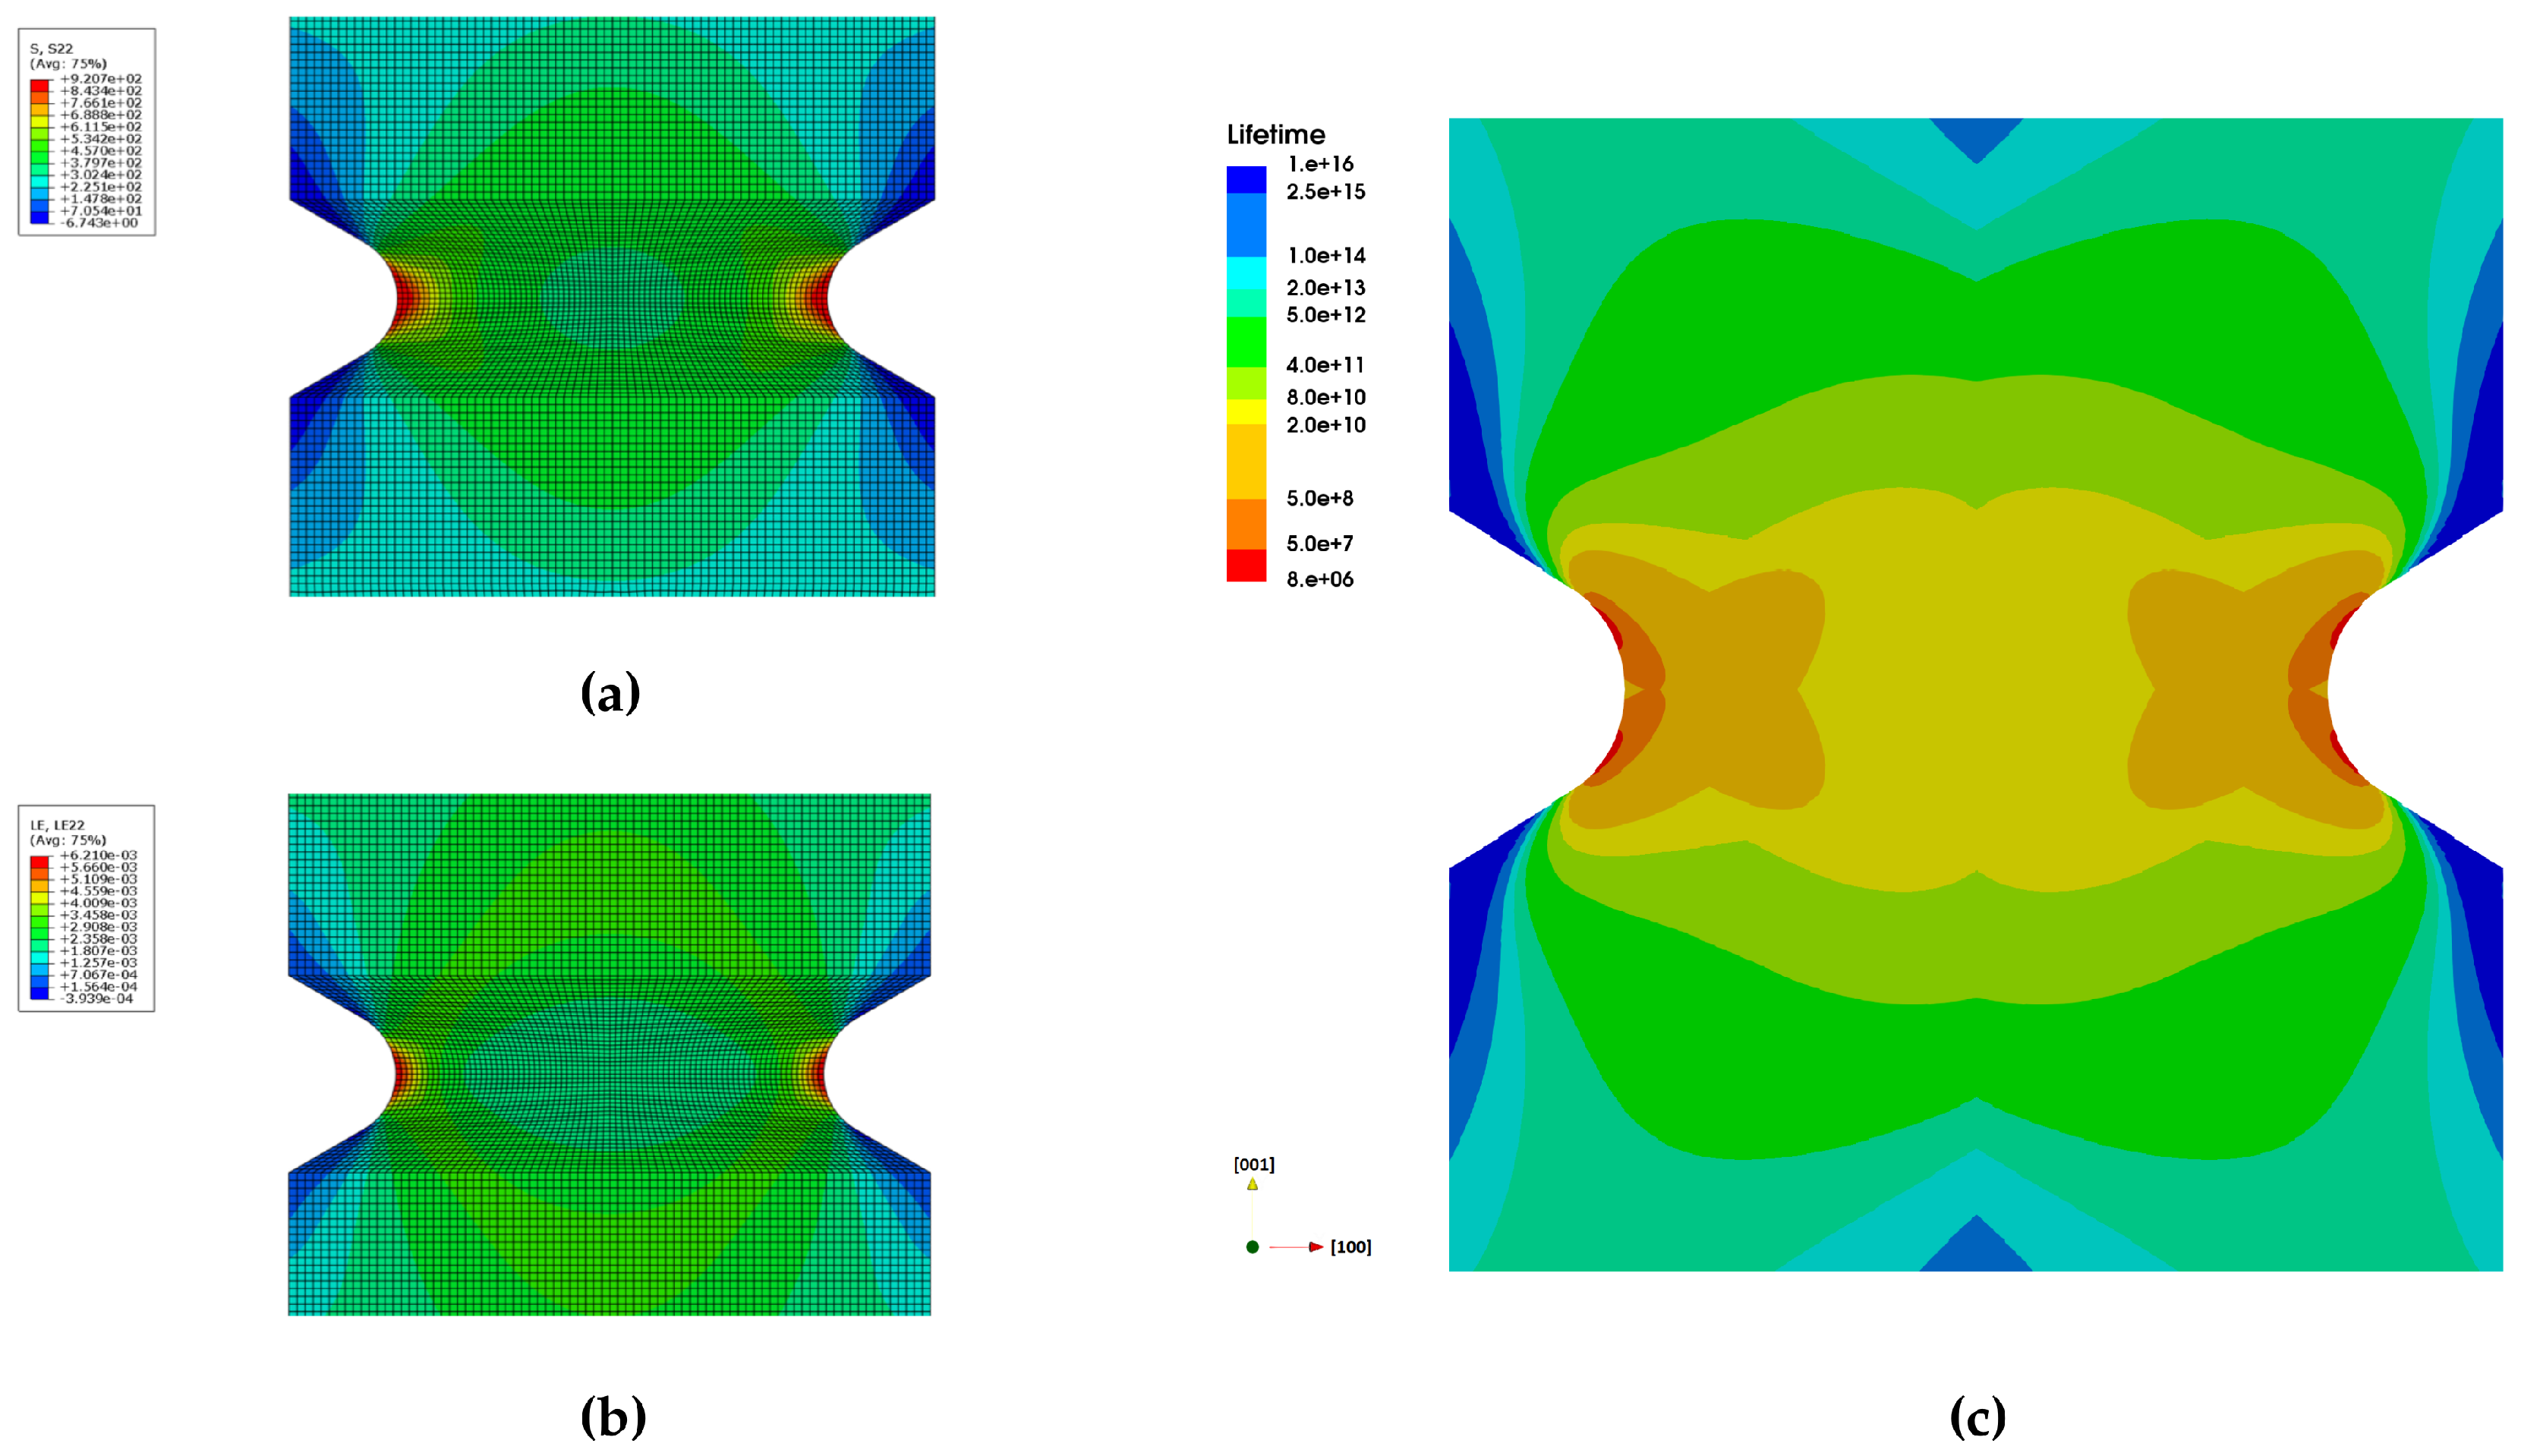
Figure 7.
Fatigue crack initiation at the surface of SC16 nickel-based single crystal with tensile crystal orientation <001> is shown in (a) [24]. The lifetime assessment for the same specimen orientation is shown in (b), where the minimum lifetime in the FEA model marks the predicted crack initiation location.
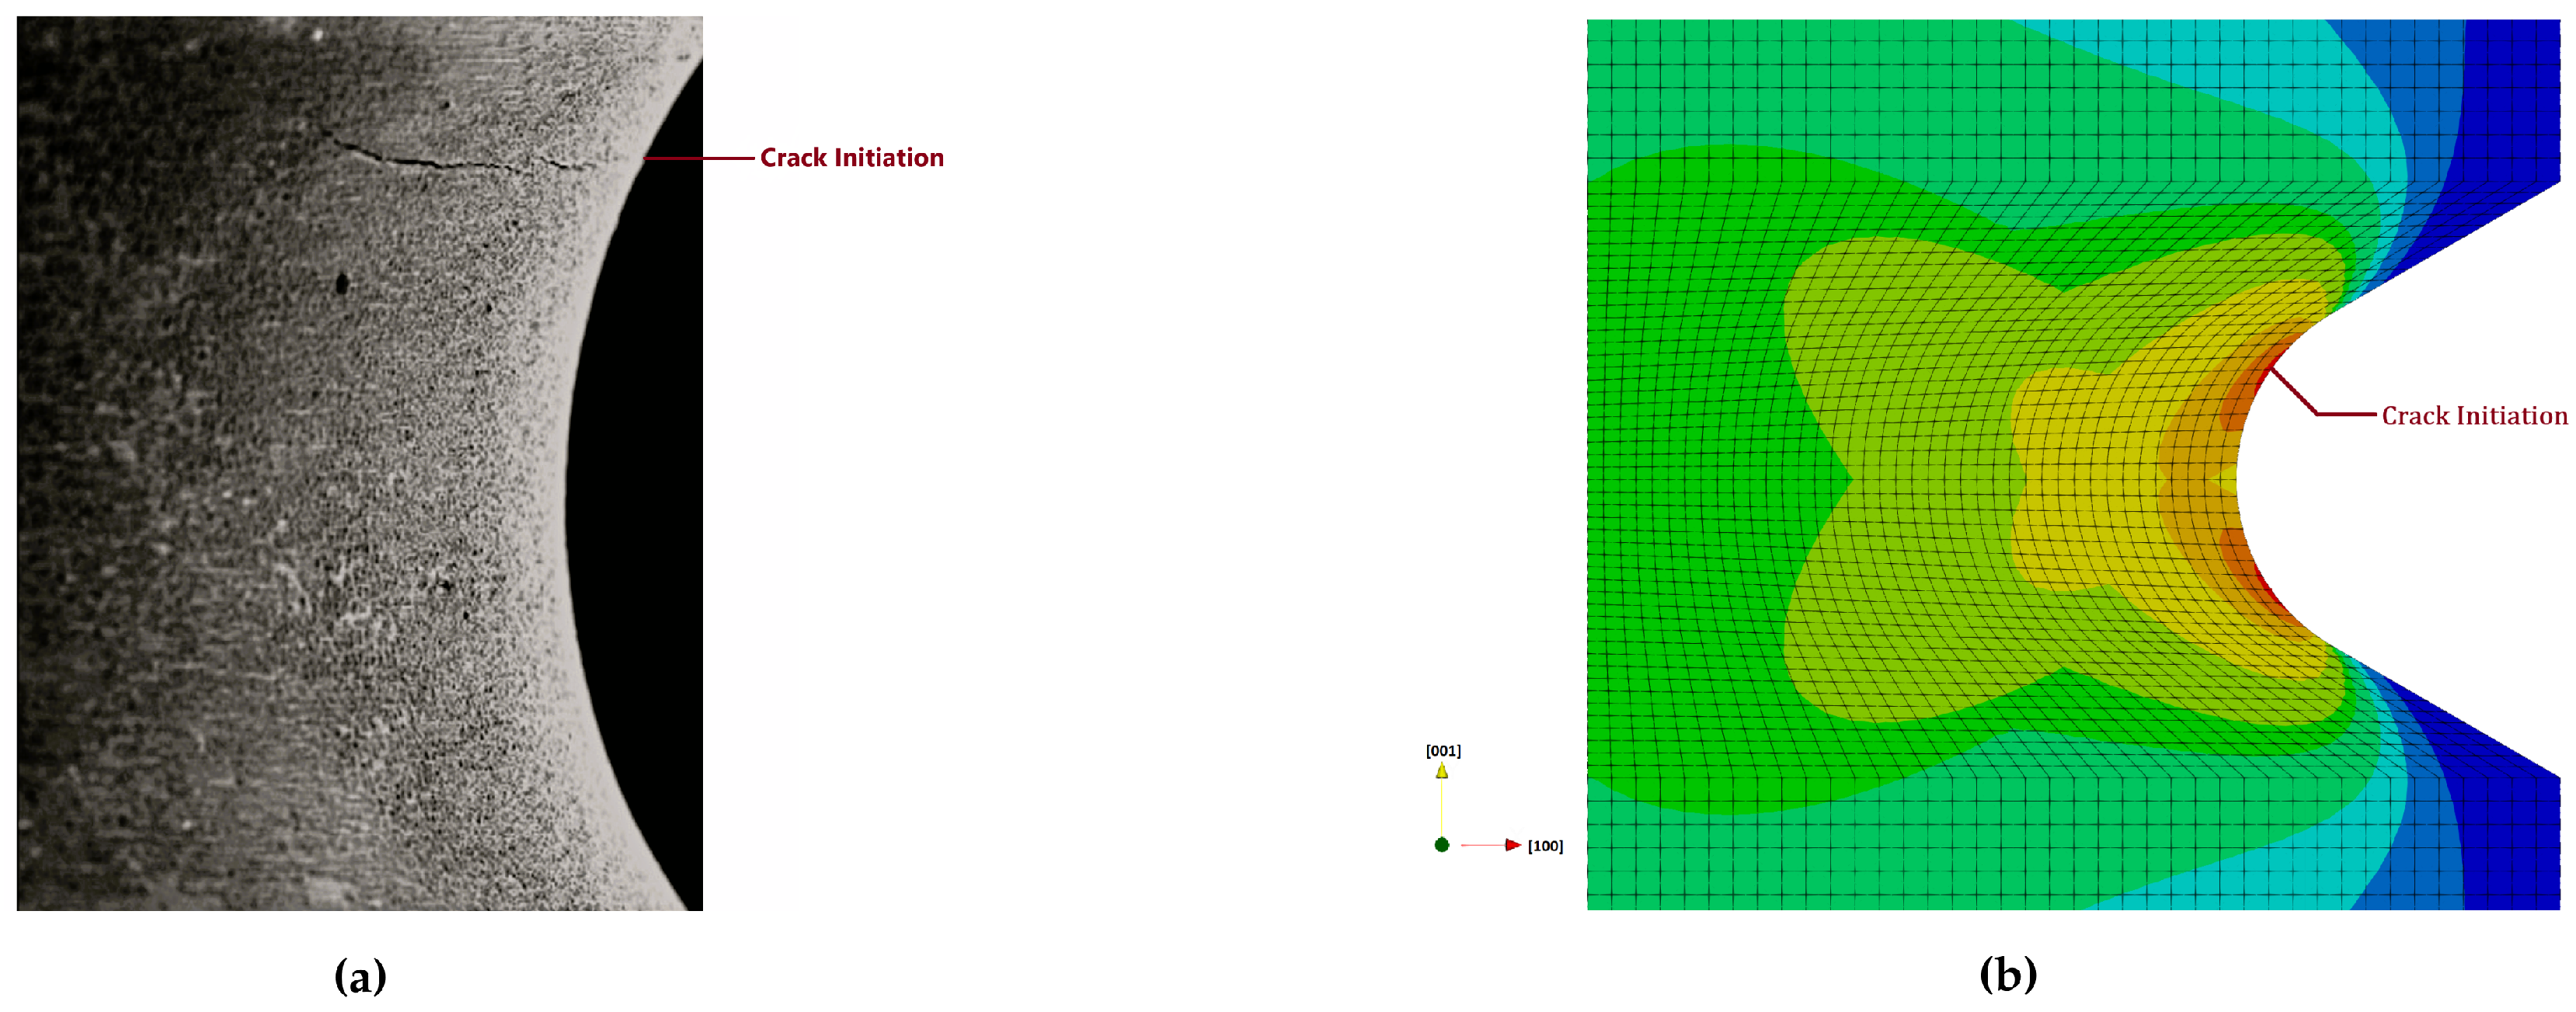
Figure 8.
Fatigue crack initiation at the surface of SC16 nickel-based single crystal with tensile crystal orientations <011> and <111> are shown in (a) and (c), respectively [24]. The lifetime assessments for the same specimen orientations are presented in (b) and (d), where the minimum lifetime in the FEA model indicates the predicted crack initiation locations.
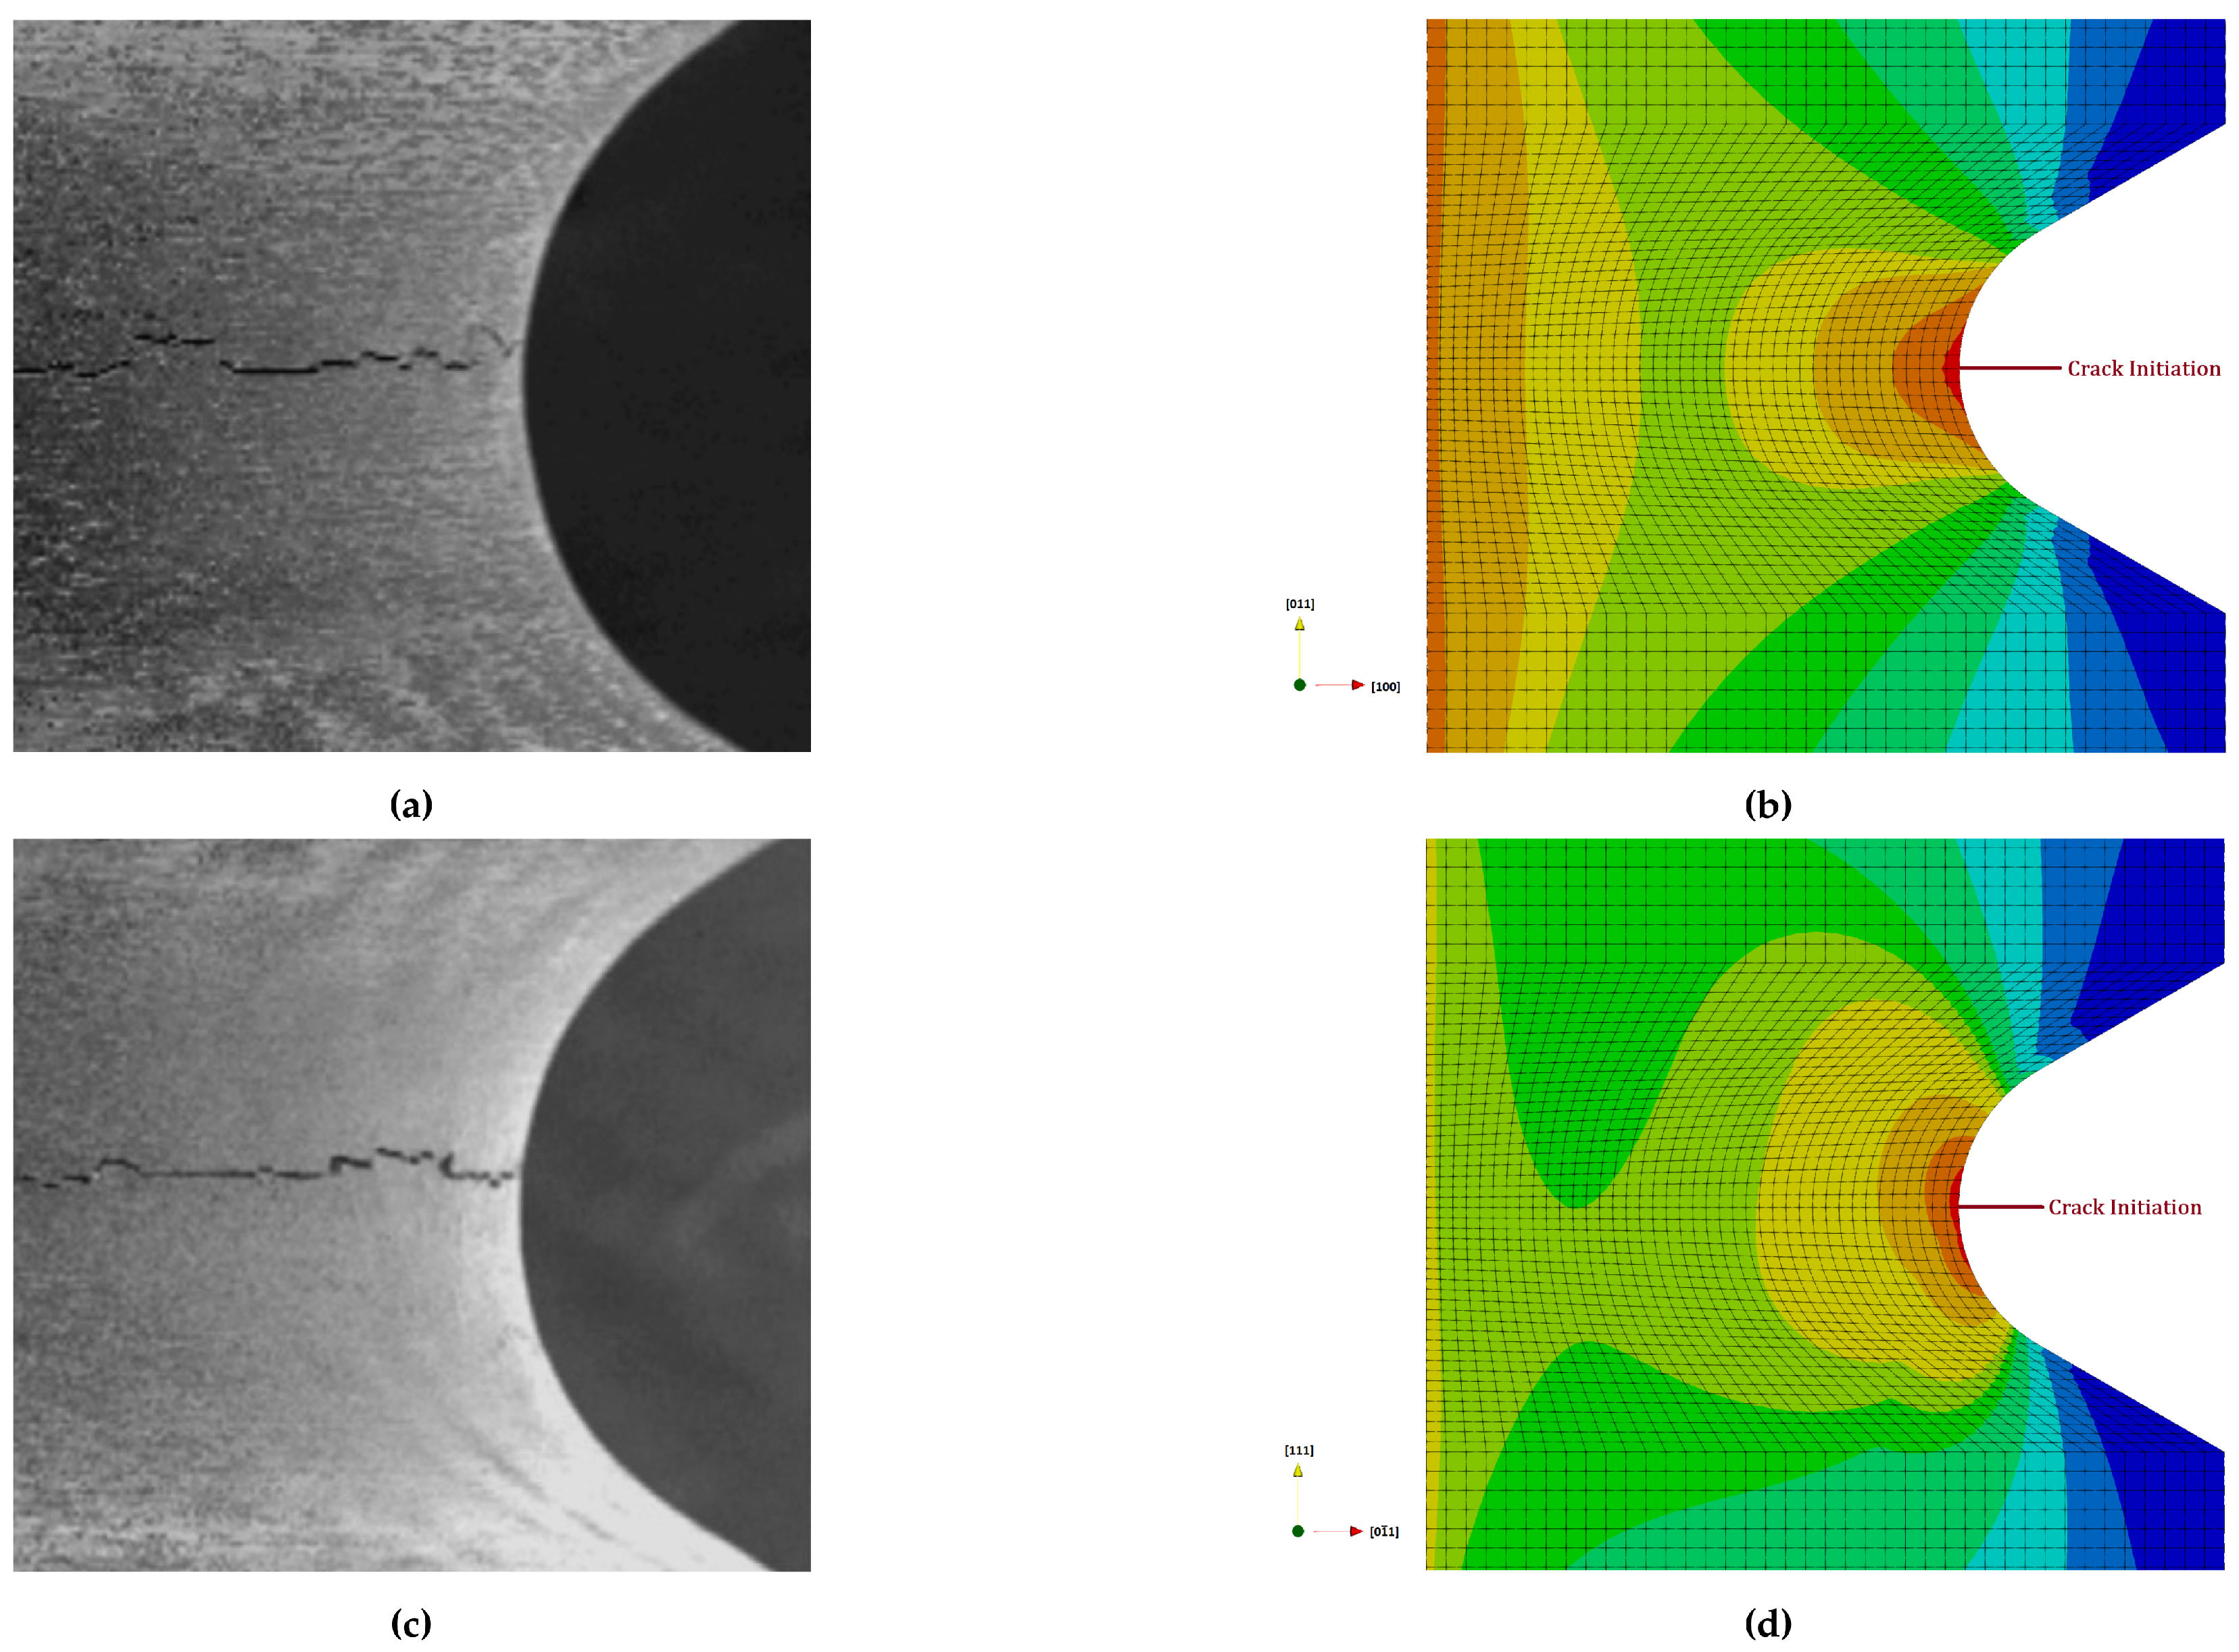
Figure 9.
Comparison of numerical and experimental results of CMSX4 notched specimen under HCF loading at 750°C with R (a) and R (b).
Figure 9.
Comparison of numerical and experimental results of CMSX4 notched specimen under HCF loading at 750°C with R (a) and R (b).
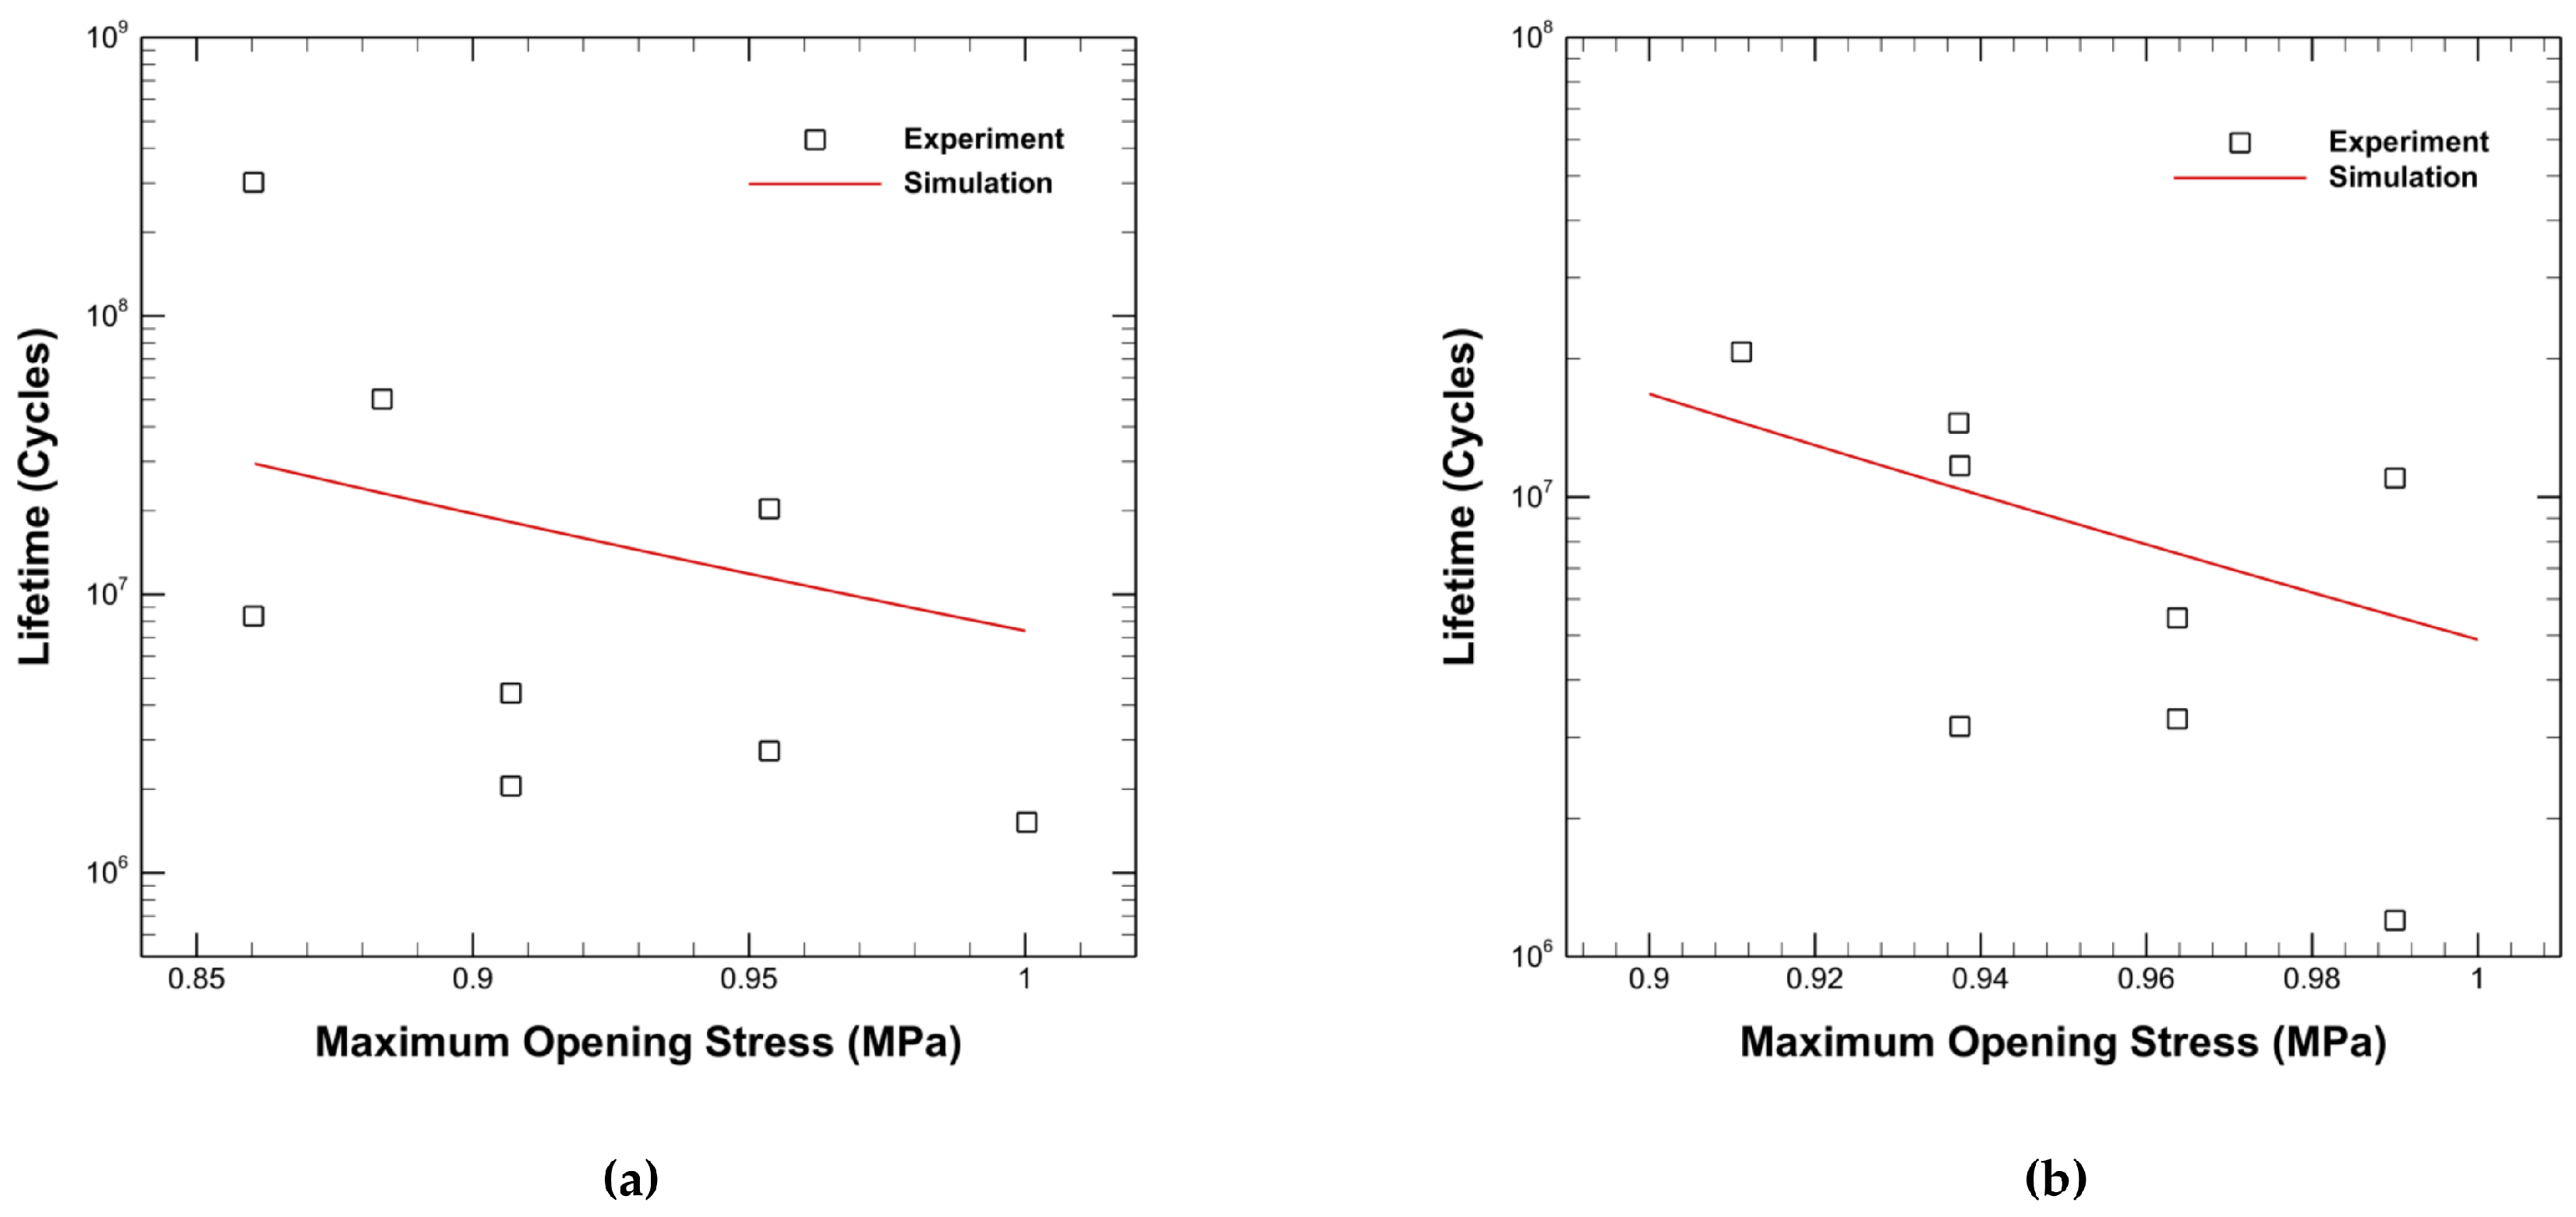
Figure 10.
Comparison of modified Chaboche model (CM) and experimental results of CMSX4 at 600°C for R = 0 and R = 0.4 (a) and at 900°C for R = 0 (b).
Figure 10.
Comparison of modified Chaboche model (CM) and experimental results of CMSX4 at 600°C for R = 0 and R = 0.4 (a) and at 900°C for R = 0 (b).
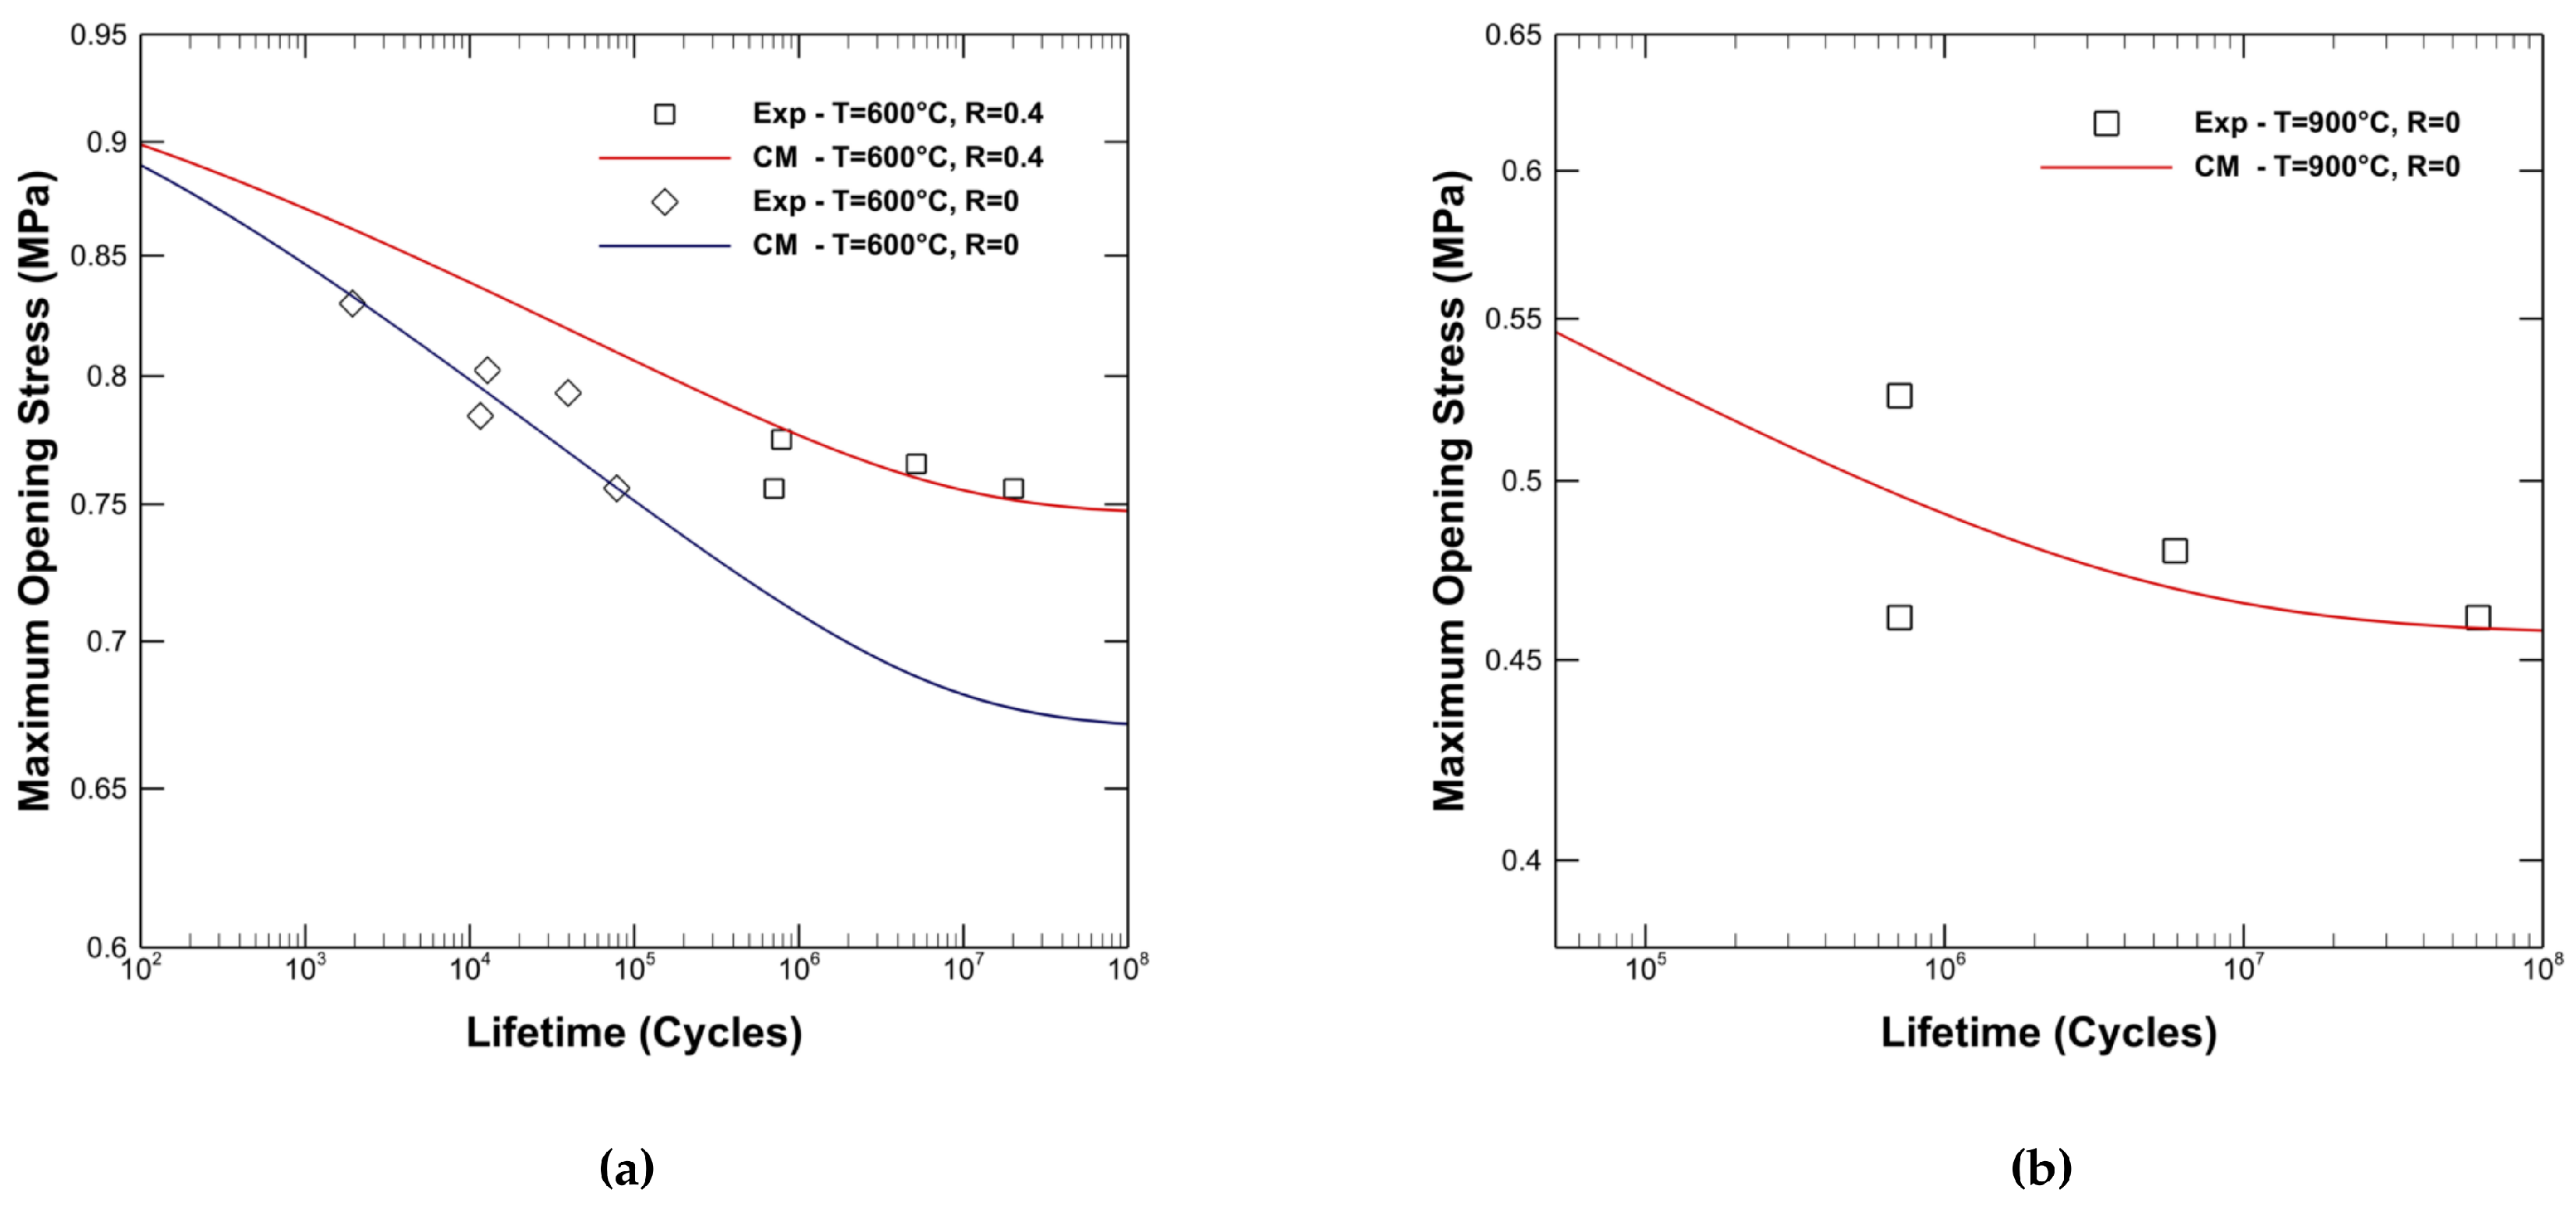
Figure 11.
Fatigue curves generated from the training data spectrum for different temperatures and R ratios, compared with experimental data (a), and fatigue curves for different R ratios at the same temperature (b).
Figure 11.
Fatigue curves generated from the training data spectrum for different temperatures and R ratios, compared with experimental data (a), and fatigue curves for different R ratios at the same temperature (b).
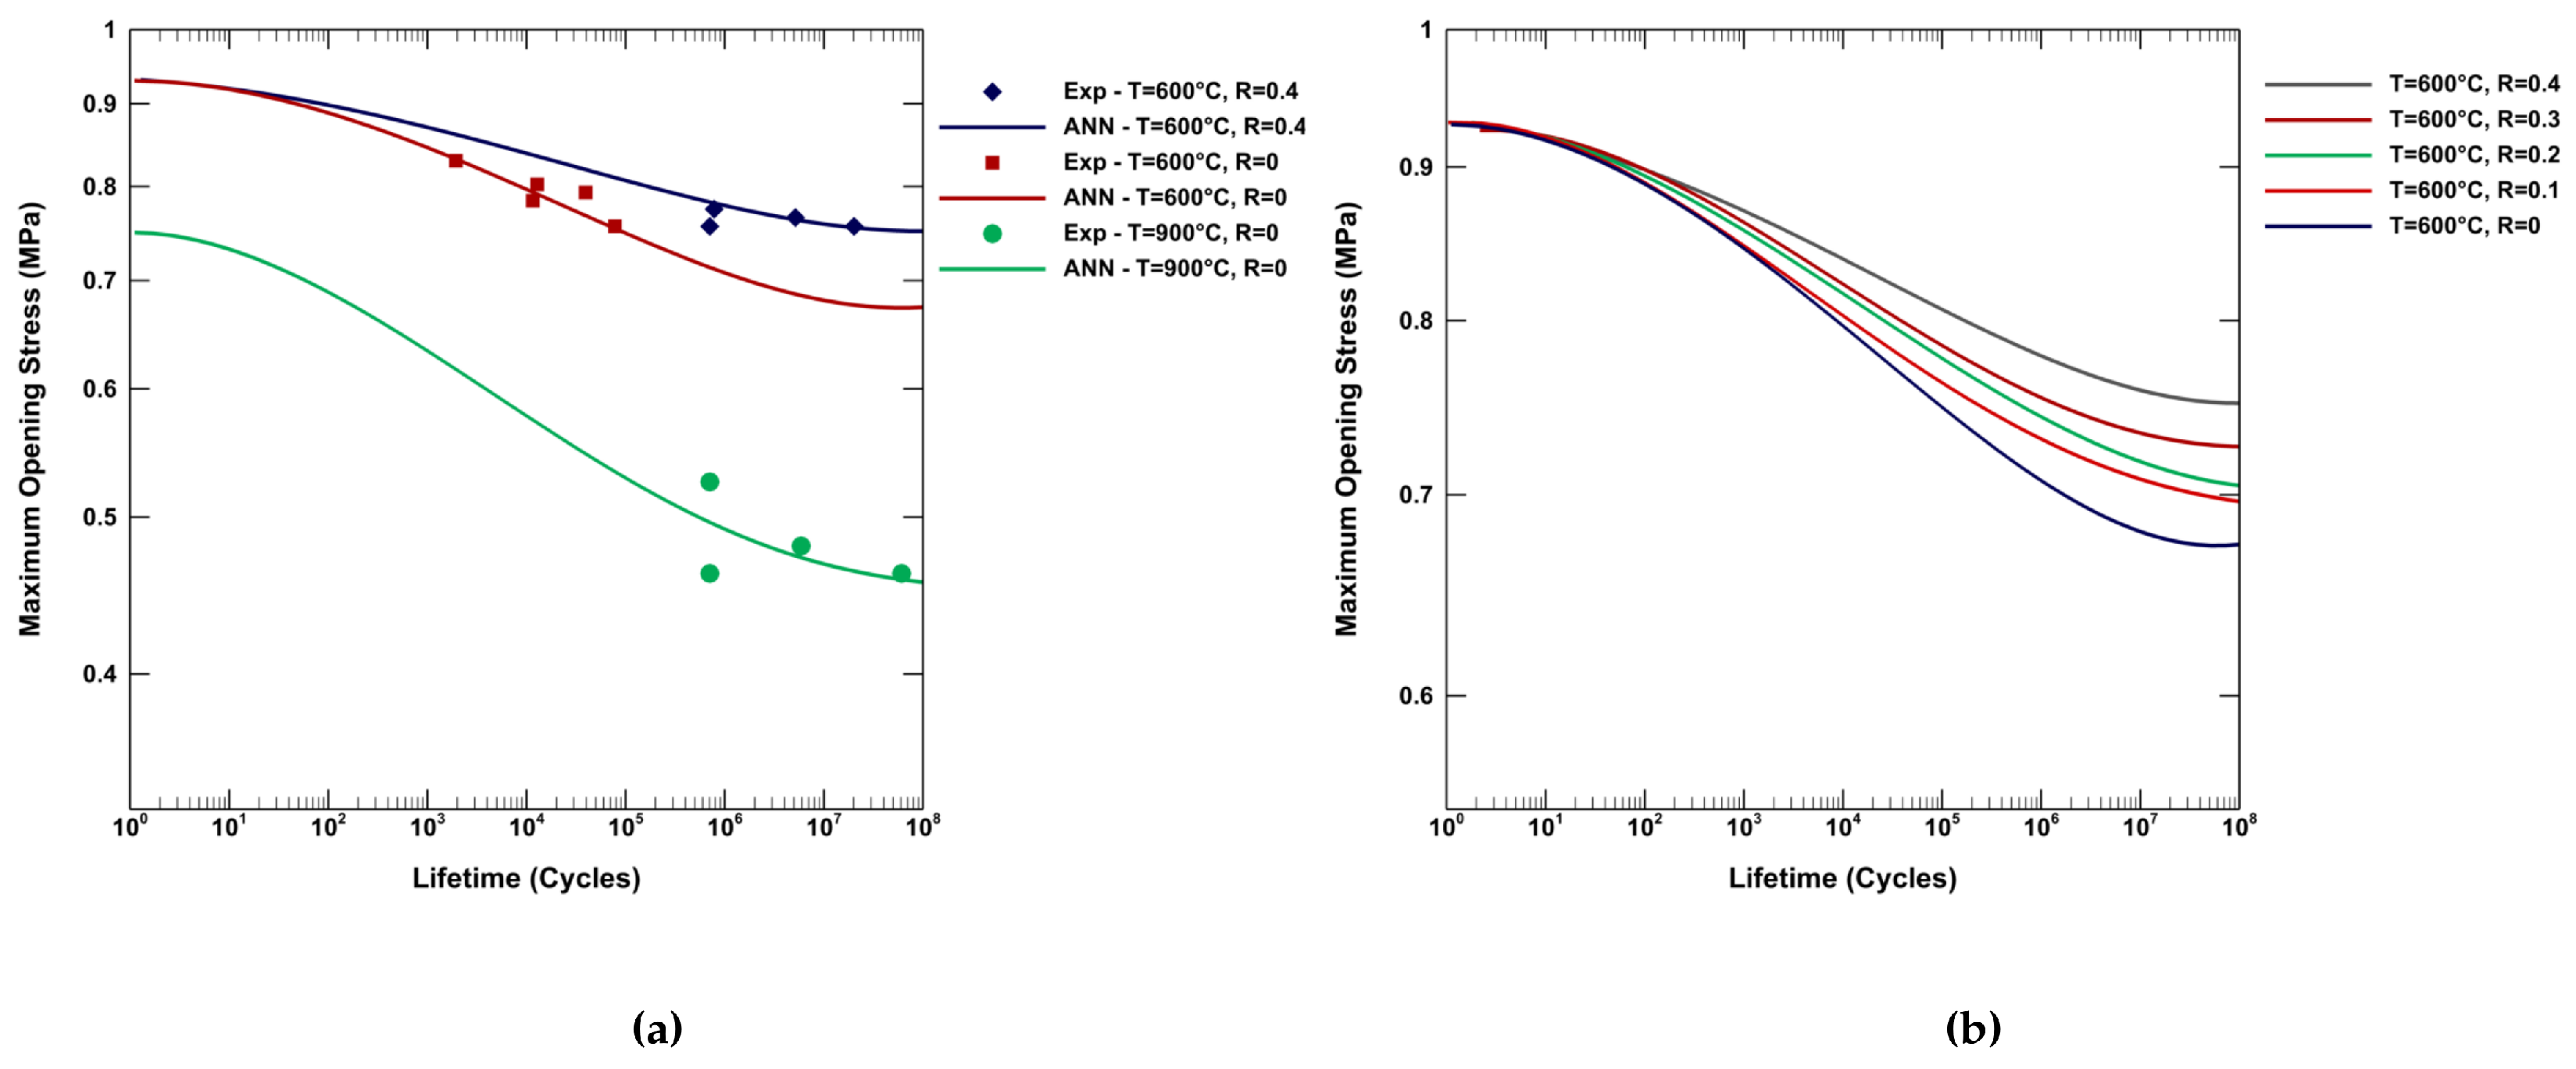
Figure 12.
Fatigue curves prediction at various temperatures for CMSX-4.
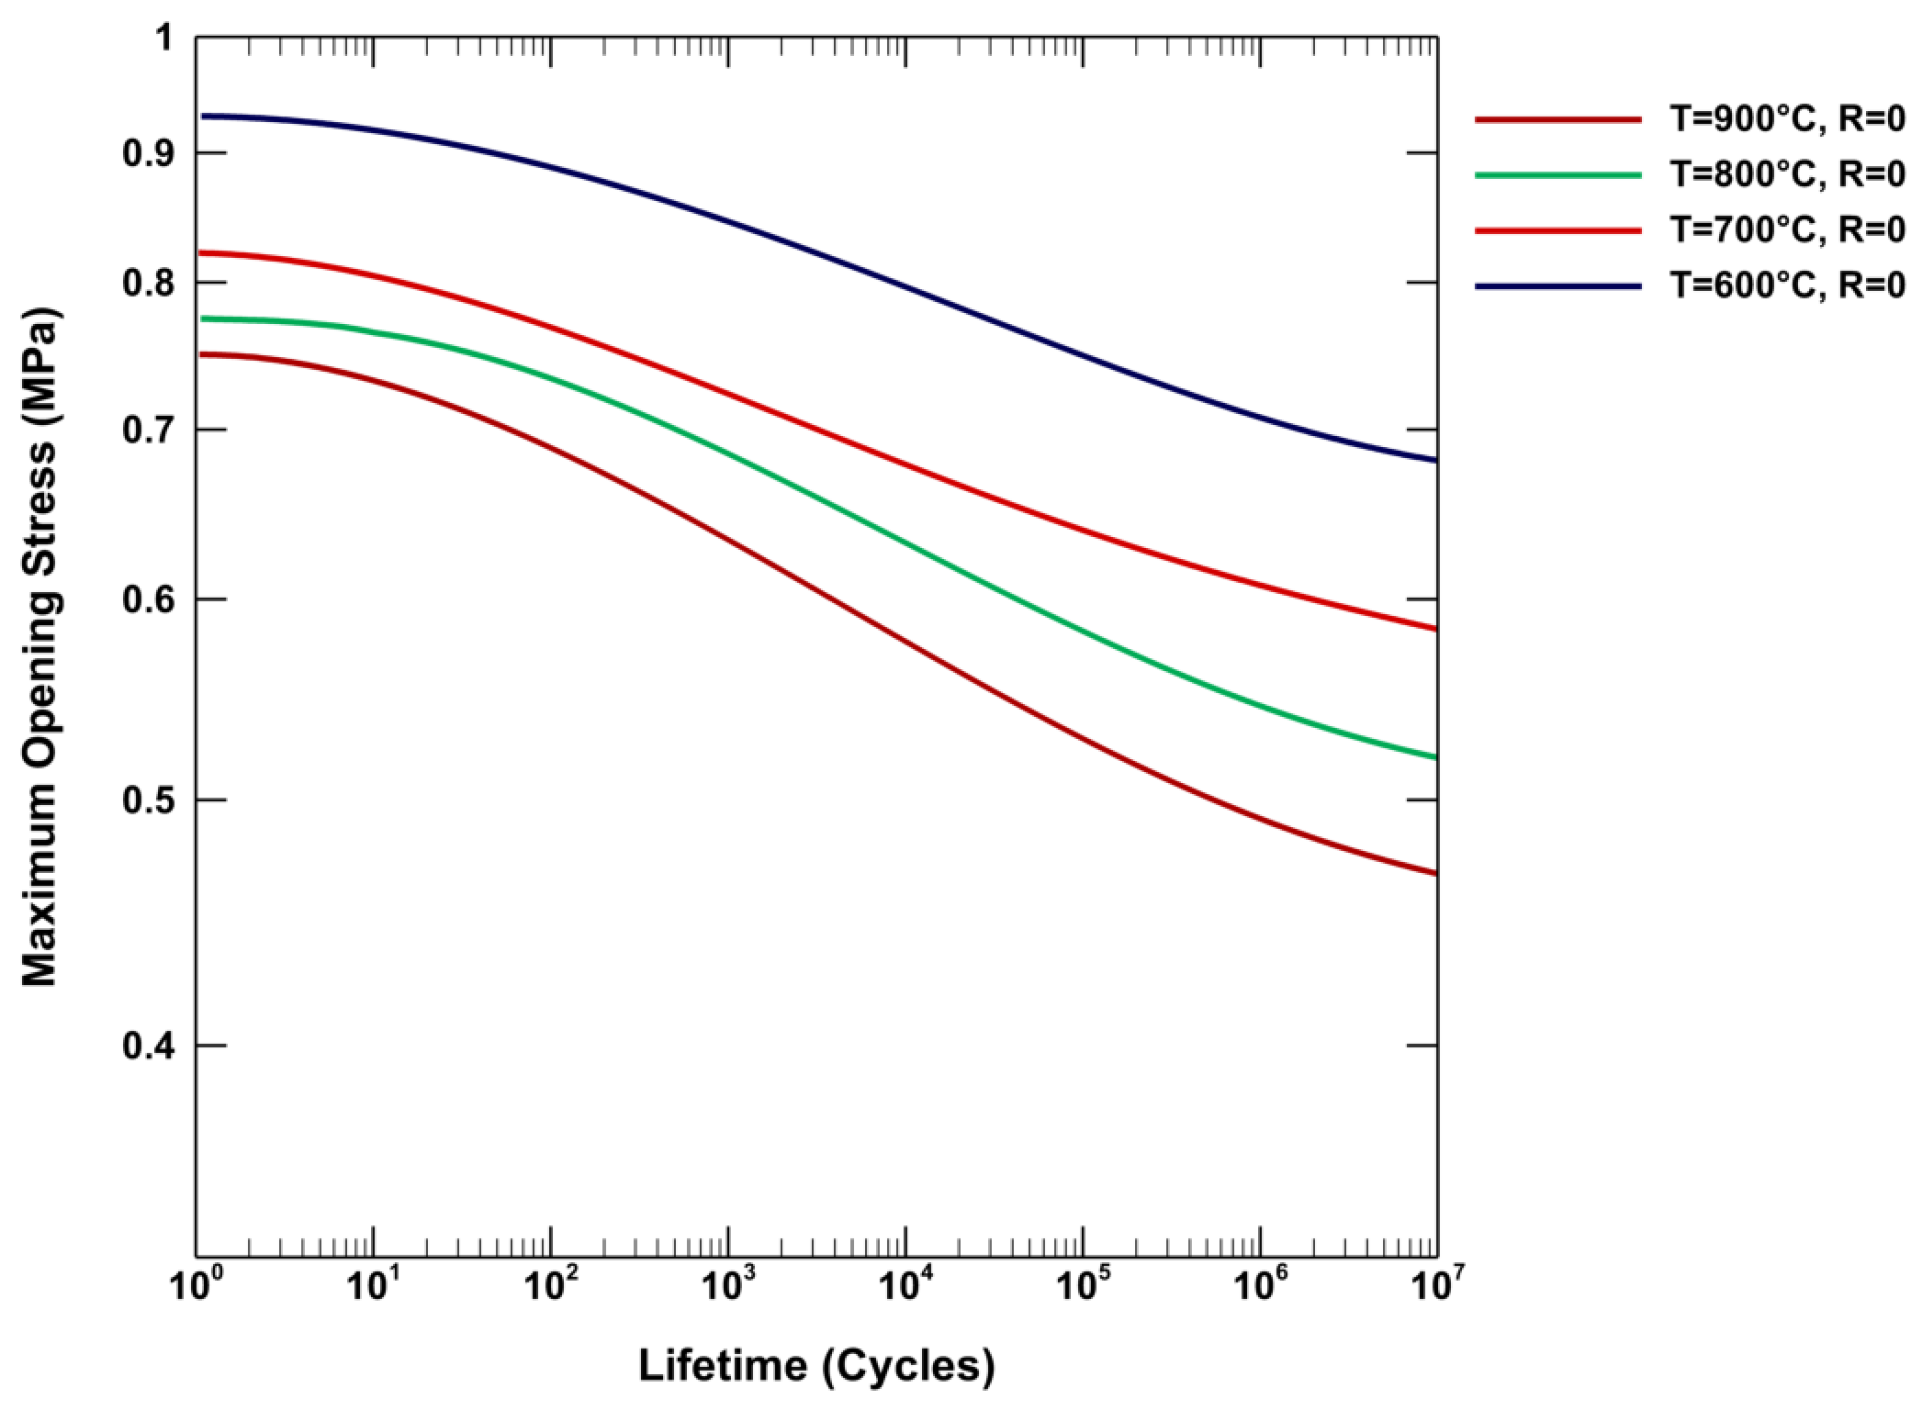

Table 1.
Chemical Composition of CMSX-4 (wt%)
| Ni | Cr | Co | Mo | W | Al | Ti | Ta | Re | Hf |
|---|---|---|---|---|---|---|---|---|---|
| 61.8 | 6.5 | 9 | 0.6 | 6 | 5.6 | 1 | 6.5 | 3 | 0.1 |
Table 2.
FCC crystal slip system list.
| Slip System Family | System s | Slip Normal | Slip Direction |
|---|---|---|---|
| Octahedral | 1 | (111) | [01] |
| 2 | [01] | ||
| 3 | [10] | ||
| 4 | (11) | [01] | |
| 5 | [011] | ||
| 6 | [110] | ||
| 7 | (11) | [01] | |
| 8 | [110] | ||
| 9 | [101] | ||
| 10 | (11) | [10] | |
| 11 | [101] | ||
| 12 | [011] | ||
| Cubic | 1 | (001) | [10] |
| 2 | [110] | ||
| 3 | (100) | [011] | |
| 4 | [01] | ||
| 5 | (010) | [01] | |
| 6 | [101] |
Table 3.
Parameters of crystal plasticity model for CMSX-4.
| K () | n | Q | b | C11 (GPa) | C12 (GPa) | C44 (GPa) |
|---|---|---|---|---|---|---|
| 2200 | 7.5 | 100 | 250 | 296 | 204 | 125 |
Table 4.
Parameters of anisotropic lifetime assessment model for CMSX-4.
| (MPa) | ) | ) | a | ||||
|---|---|---|---|---|---|---|---|
| 1200 | 1100 | 1800 | 0 | 0.65 | 7.8 |
Table 5.
Parameters of modified damage model of CMSX-4 for various temperatures.
| a | |||||||
|---|---|---|---|---|---|---|---|
| 600 | 840 | 1010 | 480 | 0.01 | 14.5 | ||
| 900 | 675 | 800 | 375 | 0.12 | 12.2 |
Disclaimer/Publisher’s Note: The statements, opinions and data contained in all publications are solely those of the individual author(s) and contributor(s) and not of MDPI and/or the editor(s). MDPI and/or the editor(s) disclaim responsibility for any injury to people or property resulting from any ideas, methods, instructions or products referred to in the content. |
© 2024 by the authors. Licensee MDPI, Basel, Switzerland. This article is an open access article distributed under the terms and conditions of the Creative Commons Attribution (CC BY) license (http://creativecommons.org/licenses/by/4.0/).
Copyright: This open access article is published under a Creative Commons CC BY 4.0 license, which permit the free download, distribution, and reuse, provided that the author and preprint are cited in any reuse.


