
Submitted:
01 October 2024
Posted:
02 October 2024
You are already at the latest version
Abstract
Background/Objectives: Consumption of a high energy density diet (HED) leads to increased body weight and fat mass, gut dysbiosis, and obesity. The aim of this study was to characterize the initial response to HED consumption, as well as identify any sex differences, on body composition, systemic inflammation, gut microbiome, and fecal fat excretion in rats. Methods: Male and female Sprague-Dawley rats were fed a low energy density (LED) for 10 days and then were switched to HED for four weeks. Food intake was measured twice a week, body weight and body composition were measured weekly. Serum samples were collected to measure inflammatory cytokines/chemokines. Fecal samples were collected for microbiome analysis and lipid content. Results: Both males and females experienced increases in body weight, fat mass and fecal fat excretion, while males were more susceptible to significant weight gain, particularly in the diet-induced obesity-prone (DIO-P) group. Males showed elevated TGF-β levels, while females exhibited increases in IP-10, RANTES, and FGFb. Changes in gut microbiota composition revealed a reduction in beneficial species like Bacteroides uniformis and Parabacteroides distasonis and an increase in species such as Akkermansia muciniphila. Sex differences in fat metabolism were shown in the greater fecal fat excretion observed in males. Conclusions: Our study demonstrates that short-term consumption of a high-energy diet elicits notable sex-specific differences in body weight, body composition, inflammatory markers, gut microbiota, and fat excretion in Sprague-Dawley rats. These findings underscore the importance of considering sex as a biological variable in studies of diet-induced obesity and its metabolic consequences.
Keywords:
obesity
; high energy density diet
; inflammatory cytokines/chemokines
; gut dysbiosis
; fecal lipid excretion
1. Introduction
The World Health Organization defines obesity, in adults, as having a Body Mass Index (BMI) greater than 30.0 [1]. Obesity is characterized by a significant increase in fat mass accumulation and has been associated with several comorbidities, including low-grade inflammation, hypertension, hyperglycemia, and dyslipidemia. These conditions place people at a higher risk for diseases such as atherosclerotic cardiovascular disease, type 2 diabetes, and cancer [2,3].
Corroborated in humans and animal models, it is now widely recognized that long-term consumption of a high energy density (HED) diet, high in fat and sugar, increases caloric intake, body weight, and fat mass accumulation [4,5]. It has also been shown to trigger microbiota dysbiosis [6], low-grade systemic inflammation [7], and disruptions of the vagal gut-brain axis [8] and the mesolimbic reward pathway [9]. In addition, Sprague-Dawley rats typically exhibit a diet-induced obesity-prone (DIO-P) or a diet-induced obesity-resistant (DR) phenotype when exposed to a HED [10,11]. Rats exhibiting the DIO-P phenotype have significantly increased body weights, caloric intakes, and fat mass when compared to control or DR rats [12,13,14]. The emergence of these two phenotypes typically happens within five weeks of HED consumption [14,15].
A HED consumption in animals has been shown to lead to dysbiosis in the gut, characterized mainly by an overall decrease in bacterial diversity and an increase in the ratio of Firmicutes to Bacteroidetes [16,17]. In addition, in a study comparing the gut microbiome of male and female rats exposed to a HED for three weeks, males had a greater increase in the Firmicutes to Bacteroidetes ratio than female rats [18]. A link between the increased number of Firmicutes bacteria and obesity has been hypothesized to be due to an increased ability of members of the Firmicutes phylum to absorb nutrients, thus increasing weight gain [19,20]. However, the genera Lactobacillus, belonging to the Firmicutes phylum, and Bifidobacterium, belonging to the Actinobacteria phylum, are commonly used probiotics due to their ability to reduce inflammation, food intake, and body weight gain [21]. These observations serve as a possible link between gut dysbiosis and systemic inflammation in obesity. High fat diet-type gut microbiota have been reported to directly influence the food-associated reward deficit in dopaminergic signaling through the vagal afferent pathway [9]. Other common gut genera, including Prevotella and Bacteroides (Bacteroidetes), Lactobacillus and Enterococcus (Firmicutes), and Bifidobacterium (Actinobacteria), are hypothesized to have positive effects on dopaminergic signaling and dopamine bioavailability [22].
The amount of fat excreted in the feces after a HED can be used to determine the amount of dietary fat absorbed in the GI tract. In a study conducted on male mice, HED exposure significantly increased the levels of triglycerides (µmol/3 days), free fatty acids (µmol/3 days), and the total dry matter (g/3 days) in the feces [23]. Also, male mice on HED had significantly higher fecal excretion of total sterols and fatty acids [24]. When fed a western-type HED, female mice had a slightly greater fecal excretion of acylglycerol and cholesterol than male mice but had slightly less excretion of free fatty acids than males [25]. However, in another study of male and female mice fed a 20% fat HED, male mice had a greater fecal excretion of total triglycerides and total cholesterol than females [26].
Obesity has been associated with a state of chronic, low-grade inflammation that may be responsible for many of its accompanying metabolic disorders [27,28]. Adipose tissue not only serves a role for energy storage but also has been identified as a highly complex endocrine organ, with adipocyte cells capable of secreting adipokines – peptide hormones capable of carrying out various endocrine functions [29,30]. Adipokines can include both pro-inflammatory molecules, such as leptin or interleukin-6 (IL-6), which upregulate inflammation by the recruitment of immune cells, or anti-inflammatory molecules, like adiponectin, that reduce inflammation [31,32].
Given this gap in knowledge, in this study we sought to characterize the effect of short-term HED consumption on fat mass accumulation, microbiota composition, systemic inflammation, and fecal fat excretion in male and female rats. Our goal was to characterize the initial response as well as identify any sex differences. As expected, HED consumption triggered a transient increase in caloric intake. Although this initial response waned within a week, body weight and fat mass continued to increase during the four-week HED consumption. Within the male cohort, we identified the DIO-P and DR phenotypes within a week of HED consumption. HED induced a significant decrease in IL-1α in males and females. Insulin levels were significantly increased by HED in males and females. TGF-β was significantly increased after HED only in males. IP-10 and RANTES were significantly increased by HED only in females. FGFb was significantly increased by HED in females, but not in males. Fat excretion in feces was significantly higher after HED, and this response was more pronounced in males than females.
2. Materials and Methods
2.1. Animals
Male and female Sprague–Dawley rats (n = 6 per group; ~300 g; Envigo, Indianapolis, IN) were housed individually in conventional polycarbonate shoe-box cages in a temperature-controlled vivarium with ad libitum access to low energy density (LED; 5% fat, 3.25% sucrose) pellets of rat chow (PicoLab rodent diet 20, product #5053, Fort Worth, TX) and water. Rats were maintained on a 12:12-h light: dark cycle with lights on at 0700-h and allowed to acclimate to laboratory conditions for 1 week prior to starting experiments. All animal procedures were approved by the University of Georgia Institutional Animal Care and Use Committee and conformed to National Institutes of Health Guidelines for the Care and Use of Laboratory Animals.
2.2. Food Intake, Body Weight, and Body Composition
Following the acclimation period, rats were maintained on a low energy density diet (LED) for an additional ten days and were then switched to a high energy density diet (HED) (45% fat, 20% sucrose, Research Diet #D12451, New Brunswick, NJ) for four weeks. Food intake was measured twice. Body weight and body composition were measured weekly using a minispec LF 110 BCA Analyzer (Bruker Corp., The Woodlands, TX).
2.3. Cytokines, Leptin, and Insulin Levels in Serum
Blood samples were collected on the last day of LED and last day of HED. The serum was collected and stored at −21°C. A cytokine array (Rat Cytokine ELISA Kit, cat #EA-4006, Signosis Inc., Sunnyvale, CA) was used to measure levels of cytokines and chemokines. Insulin levels were determined using the Rat Insulin ELISA kit (cat #80-INSRT-E01; ALPCO Diagnostics, Inc., Salem, NH).
2.4. Microbiome Analysis
Fecal samples were collected at four timepoints: upon arrival at animal facility, after ten days of LED, after one week on HED, and after four weeks on HED. Bacterial DNA was extracted from feces using a commercial kit (Quick-DNA Fecal/Soil Microbe Miniprep Kit, cat #D6010, Zymo research, Irvine, CA). High-throughput sequencing was performed using Illumina MiSeq paired-end runs (GGBC, Athens, GA). The raw sequences were demultiplexed, filtered, trimmed and denoised using the software Quantitative Insights Into Microbial Ecology 2 (QIIME2) version 2023.2 [33]. Subsequently, features were identified and Operational Taxonomic Units (OTUs) were picked against the GreenGenes database for further analysis. Using the microbiome analyst platform, bacterial abundance was normalized by log-transformation, and β-diversity ((dis-)similarities between samples) was assessed via Principal Coordinates Analysis (PCoA) with distances determined using the Bray-Curtis index. Significant dissimilarities between groups were determined via permutational multivariate ANOVA (PERMANOVA) [34].
2.5. Lipid Content in Feces
Fecal samples were collected after four weeks of HED consumption. Samples from aged-matched, LF-fed rats were used for comparison. The samples were processed and analyzed to determine the lipid content using the acid steatocrit method as described by Tran et al. [35]. Stool (0.5 g) was diluted with a volume of deionized water equal to two times the weight of the stool and homogenized using a 5 ml Potter Elvehjem tissue homogenizer. 5N Perchloric acid (HClO4) was added to the homogenate in a volume equal to one-fifth of the homogenate volume. The resulting homogenate was mixed for 30 seconds using a standard Vortex mixer. The homogenate was aspirated into a 75 micro-liter glass hematocrit capillary tube. The capillary tube was centrifuged horizontally at 13000 rpm for 15 minutes. After centrifugation, the lengths of the upper fatty layer and the bottom solid layers were measured by means of a graduated magnifying lens. Steatocrit was calculated using the following equation:
3. Results
3.1. Consumption of a HED Diet Significantly Increased Body Weight and Fat Mass Accumulation
Caloric intake, body weight gain, and body composition are shown in Figure 1. Given that males and females have inherently different caloric needs due to differences in body size, caloric intake is shown as calories consumed divided by body weight in grams. Male and female rats significantly increased their caloric intake in the first week after introduction of the HED compared to their intake on LED (F2.071, 20.71 = 54.70, p<0.0001) (Figure 1A). This increase was transient and caloric intake returned to LED levels by the second week on HED and remained stable thereafter. Caloric intake was slightly higher in females than males during the second week of HED consumption (p<0.05). Body weight was analyzed as body weight gain from the last day of LED; Within the first week of HED feeding, there was a noticeable variance within the males with some gaining more weight than others. Thus, the male cohort was split into two groups for further analysis: DIO-P –males with highest weight gain– and DR –males with lowest weight gain. Two-way ANOVA showed a main effect of time (F1, 9 = 48.06, p<0.0001) and cohort (F2, 9 = 18.31, p<0.001). All rats gained weight within a week of HED feeding (Figure 1B) with DIO-P rats gaining more weight than DR and female rats (p<0.05). After four weeks on HED, weight gained had nearly doubled compared to week one (ps<0.05). There was no difference between DIO-P and DR rats, however all males gained significantly more weight than females (ps<0.01).
Consistent with the significant weight gain, body fat increased significantly with HED consumption. Two-way ANOVA on body fat percentage showed a main effect of time (F1, 9 = 26.26, P<0.001) and cohort (F2, 9 = 18.13, P<0.001) (Figure 1C). Within each group, fat mass accumulation was significantly higher after four weeks on HED compared to one week (ps<0.05). After one week of HED feeding, DIO-P rats gained significantly more fat mass than DR and female rats (ps<0.01). This difference become more pronounced after four weeks on HED (ps<0.001). There were no differences between DR and female rats. All rats continued to grow, as shown by their lean mass (Figure 1D), although male rats were gaining significantly more lean mass than female rats (ps<0.05).
3.2. HED Decreased Microbial Diversity within a Week
Analysis of fecal microbiota composition is shown in Figure 2. Fecal samples were collected on day of LED, at the end of LED, one week after introduction of HED (HED1) and after four weeks on HED (HED4). There was no significant difference between the two LED timepoints, thus the data were combined for those two points. Data for males and females are presented separate to better appreciate sex differences. HED consumption significantly reduced the number of different bacteria species present in the gut microbiota (Two-way ANOVA, F(2,41)=43.21, p<0.0001) in males and females within one week (Figure 2A). In males, a PERMANOVA analysis of (dis-)similarities between samples revealed a clear separation between the fecal microbiota of LED and HED timepoints (F = 12.457; p=0.001) (Figure 2B). LED microbiota composition was significantly different from HED1 (p=0.002) and HED4 (p=0.002). The microbiota composition at HED1 was also significantly different from HED4 (p=0.002). In females, a PERMANOVA analysis of (dis-)similarities between samples revealed a clear separation between the fecal microbiota of LED and HED timepoints (F = 12.237; p=0.001) (Figure 2B). LED microbiota composition was significantly different from HED1 (p=0.003) and HED4 (p=0.003). The microbiota composition at HED1 was also significantly different from HED4 (p=0.005).
Shown are mean ± SEM kcal consumed per g body weight (a), body weight gain (b), fat mass percentage (c), and lean mass percentage (d) for male rats (n = 6) and female rats (n = 6) fed a LED baseline-diet for ten days and then switched to HED for four weeks. Male rats were then split into DIO-P (n = 3) and DR (n = 3) groups and body weight gain (e), and fat mass percentage (f) were analyzed. Both males and females significantly increased their caloric intake when switched to the HED (Ps<0.01), but caloric intake decreased after one week and remained stable until the end of the study. HED consumption significant increased body weight gain in males after two weeks (P=0.0042), while significant body weight gain was observable in females after four weeks (P=0.0065). Both males and females had a significantly increased body fat percentage after one week of HED feeding (Ps<0.05), yet only females continued to increase body fat percentage until the end of the study. Males exhibited a clear 50% split in fat mass percentage which is consistent with DIO-P and DR phenotypes. Both males and females had a significantly decreased lean mass percentage after four weeks of switching to the HED Ps<0.05). Male rats in the DIO-P group had a significantly greater body weight gain (P=0.0088) and fat mass percentage (P=0.0087) than males in the DR group. Bars denoted with the same letter within each sex are not significantly different. Asterisk indicates statistical significance between sex or group at the given time-point, *P < 0.05, **P < 0.01, ****P < 0.0001.
In general, HED comsumption led to a significant decrease in species belonging to the phylum Bacteroidetes compared to LED in males (One-way ANOVA, F(2,21)=62.08, p<0.0001) and females (One-way ANOVA, F(2,21)=25.86, p<0.0001) (Figure 2C). The abundance of members of the species caccae of the genus Bacteroides, uniformis of the genus Bacteroides, and distasonis of the genus Parabacteroides were significantly depleted by HED compared to LED (ps<0.01). We further identified a significant increase in species belonging to the Firmicutes phylum in males (One-way ANOVA, F(2,21)=43.29, p<0.0001) and females (One-way ANOVA, F(2,18)=9.552, p=0.0015), specifically the species Flavefaciens of the genus Ruminococcus. In addition, the species Muciniphila of the genus Akkermansia (phylum Verrucomicrobia) was significantly increased after four weeks of HED in males (One-way ANOVA, F(2,21)=24.13), p<0.0001) and females (One-way ANOVA, F(2,21)=6.68, p=0.0057).
A. Shannon index shown as mean + SEM for each group. HED significantly decreased the number of different bacterial species present in the gut microbiome within one week of diet introduction. B. Principal coordinate analysis was analyzed using a pairwise PERMANOVA. The microbiota of the animals clustered together during LED and was significantly different after one week of HED and after four weeks of HED. C. Bacterial abundance at the phylum level was quantified. Bacteroidetes and Firmicutes were the most abundant bacterial phyla in all groups. HED consumption significantly decreased the abundance of members of the Bacteroidetes phylum, specifically the species caccae, uniformis, and distasonis. HED consumption significantly increased members of the Firmicutes phylum, specifically the species flavefaciens, and the Verrucomicrobia phylum, specifically the species muciniphila. There was no differences in microbial composition or bacterial abundance between males and females. Bars denoted with the same letter are not statistically different. LED (n=12): Low energy density diet; HED1 (n=6): high energy density diet, one week consumption; HED4 (n=6): high energy density diet, four weeks consumption.
3.3. Male Rats Excrete More Fat in Their Feces Than Female Rats
Analysis of fat content in fecal samples from LED and HED-fed revealed that males, independent of diet, excreted significantly more fat in their feces than females (F1, 19 = 42.45, P<0.0001) (Figure 3). The difference was evident in LF-fed animals and became more pronounced with HED consumption.
Shown is mean ± SEM fecal fat percentage for male rats (n = 6) and female rats (n = 6). HED consumption significantly increased fecal fat percentage in both males and females (Ps<0.01), but males had a significantly greater fecal fat percentage than females after the LED (P=0.0332) and HED diets (P<0.0001). Bars denoted with the same letter within each sex are not significantly different. Asterisk indicates statistical significance between sex at the given time-point, *P < 0.05, **P < 0.01, ****P < 0.0001.
3.4. HED Consumption Affects Cytokine and Chemokine Levels in Serum
Cytokine and chemokine levels were measured in sera collected at the end of the ten-day LED and after four weeks of HED consumption using an ELISA cytokine array and are shown in Figure 4 and Table 1. We observed that levels of IL-1α were significantly lower after being on a HED for four weeks (F1, 10 = 30.77, P<0.001) (Figure 4A). This effect was independent of sex. HED significantly increased TGF-β in male rats but it was not affected in female rats (p<0.05) (Figure 4B). In contrast, IP-10 was significantly increased by HED consumption in female rats but not in male rats (p<0.05) (Figure 4C). Levels of RANTES were significantly decreased by HED in female rats but remained unaffected in males (p<0.05) (Figure 4D). FGFb was not affected by HED consumption (F1, 10 = 0.2210, P=0.6484) (Figure 4E). However, HED-fed females had significantly higher levels than males (p<0.05) (Figure 4E). Further analysis revealed in LED-fed males, DR rats had significantly higher levels of FGFb compared to DIO-P rats (Figure 4F). This difference was abolished with HED consumption (Figure 4F). Consistent with previous reports, insulin was significantly higher after HED compared to LF (F1, 8 = 174.3, p<0.0001) (Figure 4G), with males exhibiting significantly higher levels than females (p<0.05) (Figure 4G). Furthermore, there was no difference in insulin within the male cohort when fed LF. However, DIO-P rats had higher levels of insulin than DR rats (Figure 4H). Short-term HED consumption did not affect serum levels of IL-6, VEGF, TNF-α, IFN-γ, MCP-1, SCF, MIP-1α, IL-1β, IL-5, IL-15, and leptin (Table 1).
4. Discussion
In the current study, we sought to characterize the initial responses of body weight, body composition, inflammatory markers, gut microbiome, and fat excretion in feces to HED consumption in male and female rats using a short-term HED feeding model. Here we show that although males and females exhibit increase body weight, fat mass accumulation, and fat excretion in feces in response to HED, the magnitude of the response differs between the sexes. The immediate impact on the gut microbiota composition is varied and complex as we identified depletion of species that have been associated with benefits to the host, uniformis and distasonis, but also increased abundance of species that have been associated with benefits to the host, flavefaciens and muciniphila. We further report differences in inflammatory markers in males and females in response to HED consumption. HED induced a significant decrease in IL-1α in all rats. Insulin levels were significantly increased by HED in all rats. TGFb was significantly increased after HED only in males. IP-10 and RANTES were significantly increased by HED only in females. FGFb was significantly increased by HED in females, but not in males. Fat excretion in feces was significantly higher after HED, and this response was more pronounced in males than females.
Consistent with prior reports, consumption of a HED diet triggered a transient increase in caloric intake, that was quickly reduced to a level equivalent with LED intake [14,36,37]. Although males are heavier than females [38], and thus have a greater caloric requirement [39], there was no difference in caloric intake between males and females after adjusting for body weight. Despite males and females having similar caloric intakes relative to body weight, male rats gained twice as much weight as females, 48.8g vs 20.7g, respectively. Males were also quicker than females to show significant increases in body weight. These findings add to the existing body of literature suggesting that males are highly susceptible to HED-induced obesity while females exhibit certain protection from short-term HED-induced alterations in energy balance [40,41,42]. In a study on the proteome of brown adipose tissue by Choi et al., female rats had greater levels of proteins associated with thermogenesis and fat oxidation than males, along with lower levels of lipogenic proteins [43].
A trend was observed when looking at body weight gain, as half of the males gained significantly more weight than the others. This is consistent with the DIO-P and DR phenotypes first identified by Levin et al. in 1983 [10]. Consistent with previous reports, when body weight gain was examined between these two phenotype groups separately, males in the DIO-P group had significantly greater body weight gain than DR rats [44,45]. Although there was no significant difference between the groups after the fourth week of HED, this is likely due to cohort size.
As previously shown [46,47,48], HED diet consumption induced a significant increase in body fat percent within one week of HED feeding, and body fat percent continued to increase throughout the duration of the study. Although males gained significantly more body weight than females after four weeks of HED consumption, no significant sex differences were found for body fat percent at any time-point in the study. Prior studies have reported a significantly higher body fat percent in males than in females [49,50]. This may be a result of the emergence of the DIO-P and DR phenotypes for the male rats, so body fat percent was analyzed separately with the two groups split. Males in the DIO-P group had a significantly higher body fat percentage than the DR group at all time points, which is consistent with prior reports [51,52]. DIO-P rats had a similar body fat percentage as female, which was significantly higher than in DR rats. Concurrent with the increase in body fat percentage in both males and females, both groups had a significantly decreased lean mass percentage that continued to decrease with increasing time on HED [47].
Gut bacterial diversity was significantly reduced by HED consumption. Low microbial diversity has been associated with adiposity, insulin resistance, and a more detrimental inflammatory profile [53]. Although the validity of the Firmicutes to Bacteroidetes ratio as a hallmark of the obese phenotype is still widely discussed, previous reports have shown that there is a decrease in Bacteroidetes abundance with a proportional increase in Firmicutes in obese compared to lean subjects [54,55,56]. Results from the present study further corroborate these findings given that one week of HED consumption was sufficient to trigger a significant increase in members of the Firmicutes phylum and a significant decrease in members of the Bacteroidetes phylum. We show that HED decreased abundance of the species uniformis, which is considered a beneficial bacterium as they can produce short-chain fatty acids and other metabolites that help regulate metabolism [57]. Similarly, Parabacteroides distasonis, which was significantly reduced by HED, has been shown to improve the obese phenotype through the production of succinate and secondary bile acids in the gut [58,59]. Interestingly, we identified a decrease in abundance in the species caccae. This change has potential beneficial consequences as this species has been associated with increased intestinal inflammation [60]. The observed increase in abundance of species flavefaciens and muciniphila could represent an initial response from the host to counteract the detrimental metabolic impact of HED since the species flavefaciens has been reported to be essential in reducing hepatic fat accumulation [61] and muciniphila are known beneficial microbes that have been associated with improved body fat mass and glucose tolerance [62].
Consistent with prior reports, HED consumption significantly increased fecal fat excretion in both males and females [63,64]. Fat content in feces nearly tripled in males and duplicated in females after HED compared to LED. This discrepancy may be explained by sex differences in lipid absorption and metabolism. Female Sprague-Dawley rats have been reported to absorb dietary fat significantly faster and to be more efficient at oxidizing fat than males [65]. Slower fat absorption in males may explain the elevated fecal fat excretion and increased oxidizing efficiency might remediate the increased fat absorption in females. Furthermore, estrogen in females has been hypothesized to influence sex differences in fat metabolism. Estrogen has been found to inhibit lipoprotein lipase, which hydrolyzes triglycerides into fatty acids for uptake by fat cells, and increase growth hormone, leading to lower fat storage and increasing fat mobilization [66].
Our results revealed that HED diet consumption induced significant changes in levels of IL-1α, TGF-β, IP-10, RANTES, FGFb, and insulin. Both males and females had significantly decreased levels of IL-1α after four weeks of HED consumption. This finding in consistent with prior reports in males [36] and females [67]. A study using IL-1α KO mice suggest that a deficiency and/or reduction in IL-1α might exert a protective effect against HED diet induced obesity and its metabolic consequences, through a finding of decreased adipose tissue weight and glucose intolerance in the knockout mice [68].
HED consumption significantly increased levels of TGF-β in male rats, consistent with a report from Kundu et al. [69]. There were no changes in TGF-β in female rats. Pinhal et al. reported that female rats fed a HED did not have significantly increased renal expression of TGF-β after five weeks on the die [70]. Although findings from a study using Smad3 knockout mice suggests that suppression of the TGF-β/Smad3 improves insulin sensitivity [71], the increase observed in male rats may be due to its ability to inhibit adipogenesis [72].
In the current study, HED consumption significantly increased IP-10 levels in females while having no effect on males. This is consistent with our previous report on short-term HED diet in males [36]. Given that females have been previously shown to exhibit no changes in IP-10 levels in response to a 60% fat diet after a 10-month dietary intervention [73], it is possible that this immediate response disappears over time.
Serum levels of RANTES were unaffected by HED feeding in males, however we observed a significant decrease in females. Previous studies have reported an increase in mRNA expression of RANTES in the pancreas [74] and muscle tissue [75] in male rats in response to long-term high fat consumption, yet no response to short-term HED intake [36]. To our knowledge, this is the first-time circulating levels of RANTES are evaluated in female rats in response to HED consumption.
Females had significantly greater levels of FGFb than males after HED feeding. When males in the DR and DIO-P groups were further analyzed for FGFb levels, the males in the DR group had greater levels than DIO-P males at baseline and after the HED intervention. Rapid adipose tissue expansion results in hypoxia, leading to the release of pro-angiogenic factors [76]. It is possible that this finding is due to an increased response by DR males and female rats to adipose tissue hypoxia induced by the HED.
Consistent with previous reports, HED significantly increased insulin levels in all animals. However, this increase was significantly more pronounced in DIO-P males compared to females and DR males [51,77,78,79,80,81].
Although the HED triggered a significant decrease in IL-1α in both males and females, the other interleukin measured - IL-6, IL-5, IL-15, and IL-1β - were unaffected. In addition, there were no changes in levels of VEGF, TNF-α, MCP-1, IFN-γ, MIP-1α, and SCF.
Leptin is produced by white adipose tissue adipocytes and that acts as a hormone in appetite suppression and as a proinflammatory cytokine in immune signaling through the upregulation of TNF-a and IL-6 secretion from macrophages [82,83]. In the current study, no differences in leptin levels were found. Males exhibiting no significant changes in leptin levels is consistent with our prior report and one by Gómez-Crisóstomo et al., in which males fed either a control, 30% sucrose, 30% fat, or 30% sucrose/30% fat diet did not show any significant differences in serum leptin after two months on the diets [36,84]. Females have also shown this trend in a four week study on both of two HED diets, although the two diets contained 78.7% kcal of fat and 92.8% kcal of fat, respectively [85]. The lack of an effect on leptin levels between the diets may be explained by the ability of leptin to induce STAT3 signaling in short-term HED diets, which is diminished as the diet continues in long-term [86]. The hypothalmic STAT3 signaling pathway is required for leptin’s actions on food intake and becomes resistant to activation by leptin after prolonged high-fat feeding [86,87]. This short-term HED diet was not long enough to induce leptin resistance in the STAT3 pathway, thus leptin levels were not elevated from the baseline.
5. Conclusions
In conclusion, our study demonstrates that short-term consumption of a high-energy diet (HED) elicits notable sex-specific differences in body weight, body composition, inflammatory markers, gut microbiota, and fat excretion in Sprague-Dawley rats. While both males and females experienced increases in body weight, fat mass, and fecal fat excretion, males were more susceptible to significant weight gain, particularly in the diet-induced obesity-prone (DIO-P) group. Differences in inflammatory responses further highlight sex-specific adaptations, with males showing elevated TGF-β levels, while females exhibited increases in IP-10, RANTES, and FGFb. Changes in gut microbiota composition, characterized by a reduction in beneficial species like Bacteroides uniformis and Parabacteroides distasonis and an increase in species such as Akkermansia muciniphila, suggest complex host-microbe interactions that may mitigate the metabolic impact of HED. Additionally, sex differences in fat metabolism, likely influenced by estrogen, were evident in the greater fecal fat excretion observed in males. These findings underscore the importance of considering sex as a biological variable in studies of diet-induced obesity and its metabolic consequences.
Author Contributions
Conceptualization: D.M.M and K.C.; methodology: D.M.M and K.C; formal analysis: D.M.M and K.C.; Investigation: D.M.M and K.C.; Resources: K.C.; Data curation: D.M.M, K.C. A.B.; Writing—original draft preparation: D.M.M., A.H., and A.B.; Writing—review and editing: K.C., D.M.M., A.H., A.B. and T.G.; Visualization: D.M.M.; Supervision: K.C. and T.G.; Project administration: K.C. and D.M.M.; Funding acquisition: K.C. All authors have read and agreed to the published version of the manuscript.
Funding
This research was funded by National Institutes of Health grant 5R01DC013904.
Institutional Review Board Statement
All animal procedures were approved by the University of Georgia Institutional Animal Care and Use Committee and conformed to National Institutes of Health Guidelines for the Care and Use of Laboratory Animals.
Acknowledgments
We would like to express our sincere gratitude to Dr. Michael Azain, for his invaluable expertise and assistance in measuring fat content in fecal samples. His support was crucial in ensuring the accuracy and reliability of our results.
Conflicts of Interest
The authors declare no conflicts of interest.
References
- Organization, W.H. , Obesity: preventing and managing the global epidemic: report of a WHO consultation. 2000.
- Engin, A. , The Definition and Prevalence of Obesity and Metabolic Syndrome, in Obesity and Lipotoxicity, A.B. Engin and A. Engin, Editors. 2017, Springer International Publishing: Cham. p. 1-17.
- Grundy, S.M. , et al., Diagnosis and Management of the Metabolic Syndrome. Circulation, 2005. 112(17): p. 2735-2752.
- Santiago, C.M.O. , et al., Unripe banana flour (Musa cavendishii) promotes increased hypothalamic antioxidant activity, reduced caloric intake, and abdominal fat accumulation in rats on a high-fat diet. Journal of Food Biochemistry, 2022. 46(10): p. e14341.
- Shen, C.-L. , et al., Green tea polyphenols benefits body composition and improves bone quality in long-term high-fat diet–induced obese rats. Nutrition Research, 2012. 32(6): p. 448-457.
- Sen, T. , et al., Diet-driven microbiota dysbiosis is associated with vagal remodeling and obesity. Physiology & Behavior, 2017. 173: p. 305-317.
- Binayi, F. , et al., Long-term high-fat diet disrupts lipid metabolism and causes inflammation in adult male rats: possible intervention of endoplasmic reticulum stress. Archives of Physiology and Biochemistry, 2023. 129(1): p. 204-212.
- Kim, J.S. , et al., Gut microbiota composition modulates inflammation and structure of the vagal afferent pathway. Physiology & Behavior, 2020. 225: p. 113082.
- Kim, J.S. , et al., The gut-brain axis mediates bacterial driven modulation of reward signaling. Molecular Metabolism, 2023. 75: p. 101764.
- Levin, B.E., J. Triscari, and A.C. Sullivan, Relationship between sympathetic activity and diet-induced obesity in two rat strains. American Journal of Physiology-Regulatory, Integrative and Comparative Physiology, 1983. 245(3): p. R364-R371.
- Nazari, S. and S.M.S. Moosavi, Temporal patterns of alterations in obesity index, lipid profile, renal function and blood pressure during the development of hypertension in male, but not female, rats fed a moderately high-fat diet. Archives of Physiology and Biochemistry, 2022. 128(4): p. 897-909.
- Jang, I. , et al., Physiological Difference between Dietary Obesity-Susceptible and Obesity-Resistant Sprague Dawley Rats in Response to Moderate High Fat Diet. Experimental Animals, 2003. 52(2): p. 99-107.
- Dobrian, A.D. , et al., Development of Hypertension in a Rat Model of Diet-Induced Obesity. Hypertension, 2000. 35(4): p. 1009-1015.
- Lartigue, G.d. , et al., Diet-induced obesity leads to the development of leptin resistance in vagal afferent neurons. American Journal of Physiology-Endocrinology and Metabolism, 2011. 301(1): p. E187-E195.
- Paulino, G. , et al., Increased expression of receptors for orexigenic factors in nodose ganglion of diet-induced obese rats. American Journal of Physiology-Endocrinology and Metabolism, 2009. 296(4): p. E898-E903.
- DeGruttola, A.K. , et al., Current Understanding of Dysbiosis in Disease in Human and Animal Models. Inflamm Bowel Dis, 2016. 22(5): p. 1137-50.
- Stojanov, S. Berlec, and B. Štrukelj, The Influence of Probiotics on the Firmicutes/Bacteroidetes Ratio in the Treatment of Obesity and Inflammatory Bowel disease. Microorganisms, 2020. 8(11).
- Yang, Y. , et al., Gut Microbiota Perturbation in Early Life Could Influence Pediatric Blood Pressure Regulation in a Sex-Dependent Manner in Juvenile Rats. Nutrients, 2023. 15(12).
- Hildebrandt, M.A. , et al., High-Fat Diet Determines the Composition of the Murine Gut Microbiome Independently of Obesity. Gastroenterology, 2009. 137(5): p. 1716-1724.e2.
- Magne, F. , et al., The Firmicutes/Bacteroidetes Ratio: A Relevant Marker of Gut Dysbiosis in Obese Patients? Nutrients, 2020. 12(5).
- García-Cabrerizo, R. , et al., Microbiota-gut-brain axis as a regulator of reward processes. Journal of Neurochemistry, 2021. 157(5): p. 1495-1524.
- Hamamah, S. , et al., Role of Microbiota-Gut-Brain Axis in Regulating Dopaminergic Signaling. Biomedicines, 2022. 10(2).
- Nakamura, Y. , et al., Fructooligosaccharides suppress high-fat diet-induced fat accumulation in C57BL/6J mice. BioFactors, 2017. 43(2): p. 145-151.
- Sugimoto, K. , et al., Dietary Bamboo Charcoal Decreased Visceral Adipose Tissue Weight by Enhancing Fecal Lipid Excretions in Mice with High-Fat Diet-Induced Obesity. Prev Nutr Food Sci, 2023. 28(3): p. 246-254.
- Oteng, A.B. , et al., Cyp2c-deficiency depletes muricholic acids and protects against high-fat diet-induced obesity in male mice but promotes liver damage. Mol Metab, 2021. 53: p. 101326.
- Song, M. , et al., Safety evaluation and lipid-lowering effects of food-grade biopolymer complexes (ε-polylysine-pectin) in mice fed a high-fat diet. Food & Function, 2017. 8(5): p. 1822-1829.
- Gómez-Martínez, S. Marcos, and F.P. de Heredia, Obesity, inflammation and the immune system. Proceedings of the Nutrition Society, 2012. 71(2): p. 332-338.
- Hildebrandt, X. Ibrahim, and N. Peltzer, Cell death and inflammation during obesity: “Know my methods, WAT(son)”. Cell Death & Differentiation, 2023. 30(2): p. 279-292.
- Kershaw, E.E. and J.S. Flier, Adipose Tissue as an Endocrine Organ. The Journal of Clinical Endocrinology & Metabolism, 2004. 89(6): p. 2548-2556.
- Liu, L. , et al., Adipokines, adiposity, and atherosclerosis. Cellular and Molecular Life Sciences, 2022. 79(5): p. 272.
- Zhang, J.M. and J. An, Cytokines, inflammation, and pain. Int Anesthesiol Clin, 2007. 45(2): p. 27-37.
- Pestel, J. , et al., Adipokines in obesity and metabolic-related-diseases. Biochimie, 2023. 212: p. 48-59.
- Bolyen, E. , et al., Reproducible, interactive, scalable and extensible microbiome data science using QIIME 2 (vol 37, pg 852, 2019). Nature Biotechnology, 2019. 37(9): p. 1091-1091.
- Lu, Y. , et al., MicrobiomeAnalyst 2.0: comprehensive statistical, functional and integrative analysis of microbiome data. Nucleic Acids Research, 2023. 51(W1): p. W310-W318.
- Tran, M. , et al., Improved Steatocrit Results Obtained by Acidification of Fecal Homogenates Are Due to Improved Fat Extraction. Journal of Pediatric Gastroenterology and Nutrition, 1996. 22(2): p. 157-160.
- Minaya, D.M. , et al., Consumption of a high energy density diet triggers microbiota dysbiosis, hepatic lipidosis, and microglia activation in the nucleus of the solitary tract in rats. Nutr Diabetes, 2020. 10(1): p. 20.
- Minaya, D.M. , et al., Roux-en-Y gastric bypass surgery triggers rapid DNA fragmentation in vagal afferent neurons in rats. Acta Neurobiol Exp (Wars), 2019. 79(4): p. 432-444.
- Braga Tibaes, J.R. , et al., Sex Differences Distinctly Impact High-Fat Diet-Induced Immune Dysfunction in Wistar Rats. The Journal of Nutrition, 2022. 152(5): p. 1347-1357.
- Minaya, D.M. L. Robertson, and N.E. Rowland, Circadian and economic factors affect food acquisition in rats restricted to discrete feeding opportunities. Physiology & Behavior, 2017. 181: p. 10-15.
- Taraschenko, O.D. M. Maisonneuve, and S.D. Glick, Sex differences in high fat-induced obesity in rats: Effects of 18-methoxycoronaridine. Physiology & Behavior, 2011. 103(3-4): p. 308-314.
- Huang, K.P. , et al., Sex differences in response to short-term high fat diet in mice. Physiology & Behavior, 2020. 221.
- Hwang, L.L. , et al., Sex Differences in High-fat Diet-induced Obesity, Metabolic Alterations and Learning, and Synaptic Plasticity Deficits in Mice. Obesity, 2010. 18(3): p. 463-469.
- Choi, D.K. , et al., Gender difference in proteome of brown adipose tissues between male and female rats exposed to a high fat diet. Cell Physiol Biochem, 2011. 28(5): p. 933-48.
- Levin, B.E. and A.A. Dunn-Meynell, Defense of body weight depends on dietary composition and palatability in rats with diet-induced obesity. American Journal of Physiology-Regulatory, Integrative and Comparative Physiology, 2002. 282(1): p. R46-R54.
- Li, X., C. -Y. Yeh, and N.T. Bello, High-fat diet attenuates morphine withdrawal effects on sensory-evoked locus coeruleus norepinephrine neural activity in male obese rats. Nutritional Neuroscience, 2022. 25(11): p. 2369-2378.
- Ma, Y. Gao, and D. Liu, Alternating Diet as a Preventive and Therapeutic Intervention for High Fat Diet-induced Metabolic Disorder. Scientific Reports, 2016. 6(1): p. 26325.
- Ross, A.W. , et al., Photoperiod regulates lean mass accretion, but not adiposity, in growing F344 rats fed a high fat diet. PLoS One, 2015. 10(3): p. e0119763.
- Rojas, J.M. L. Printz, and K.D. Niswender, Insulin detemir attenuates food intake, body weight gain and fat mass gain in diet-induced obese Sprague–Dawley rats. Nutrition & Diabetes, 2011. 1(7): p. e10-e10.
- Estrany, M.E. , et al., High-fat diet feeding induces sex-dependent changes in inflammatory and insulin sensitivity profiles of rat adipose tissue. Cell Biochemistry and Function, 2013. 31(6): p. 504-510.
- Fourny, N. , et al., Male and Female Rats Have Different Physiological Response to High-Fat High-Sucrose Diet but Similar Myocardial Sensitivity to Ischemia-Reperfusion Injury. Nutrients, 2021. 13(9).
- Levin, B.E. , et al., Selective breeding for diet-induced obesity and resistance in Sprague-Dawley rats. American Journal of Physiology-Regulatory, Integrative and Comparative Physiology, 1997. 273(2): p. R725-R730.
- de Lartigue, G. , et al., Diet-induced obesity leads to the development of leptin resistance in vagal afferent neurons. Am J Physiol Endocrinol Metab, 2011. 301(1): p. E187-95.
- Le Chatelier, E. , et al., Richness of human gut microbiome correlates with metabolic markers. Nature, 2013. 500(7464): p. 541-+.
- Ley, R.E. , et al., Microbial ecology - Human gut microbes associated with obesity. Nature, 2006. 444(7122): p. 1022-1023.
- Ley, R.E. , et al., Obesity alters gut microbial ecology. Proceedings of the National Academy of Sciences of the United States of America, 2005. 102(31): p. 11070-11075.
- Minaya, D.M. , et al., Consumption of a high energy density diet triggers microbiota dysbiosis, hepatic lipidosis, and microglia activation in the nucleus of the solitary tract in rats. Nutrition & Diabetes, 2020. 10(1).
- Tan, H.Z. X. Zhai, and W. Chen, Investigations of spp. towards next-generation probiotics. Food Research International, 2019. 116: p. 637-644.
- Wang, K. , et al., Alleviates Obesity and Metabolic Dysfunctions via Production of Succinate and Secondary Bile Acids. Cell Reports, 2019. 26(1): p. 222-+.
- Liu, S. P. Qin, and J. Wang, High-Fat Diet Alters the Intestinal Microbiota in Streptozotocin-Induced Type 2 Diabetic Mice. Microorganisms, 2019. 7(6).
- Desai, M.S. , et al., A Dietary Fiber-Deprived Gut Microbiota Degrades the Colonic Mucus Barrier and Enhances Pathogen Susceptibility. Cell, 2016. 167(5): p. 1339-+.
- Iwao, M. , et al., Supplementation of branched-chain amino acids decreases fat accumulation in the liver through intestinal microbiota-mediated production of acetic acid. Scientific Reports, 2020. 10(1).
- Dao, M.C. , et al., and improved metabolic health during a dietary intervention in obesity: relationship with gut microbiome richness and ecology. Gut, 2016. 65(3): p. 426-436.
- Jackson, C.D. , et al., Interactions of varying levels of dietary fat, carbohydrate, and fiber on food consumption and utilization, weight gain and fecal fat contents in female sprague-dawley rats. Nutrition Research, 1996. 16(10): p. 1735-1747.
- Shang, W. , et al., Characterization of fecal fat composition and gut derived fecal microbiota in high-fat diet fed rats following intervention with chito-oligosaccharide and resistant starch complexes. Food & Function, 2017. 8(12): p. 4374-4383.
- Jackman, M.R. , et al., Trafficking of dietary fat in obesity-prone and obesity-resistant rats. American Journal of Physiology-Endocrinology and Metabolism, 2006. 291(5): p. E1083-E1091.
- Ashley, C.D. L. Kramer, and P. Bishop, Estrogen and Substrate Metabolism. Sports Medicine, 2000. 29(4): p. 221-227.
- Escrich, R. , et al., A high-corn-oil diet strongly stimulates mammary carcinogenesis, while a high-extra-virgin-olive-oil diet has a weak effect, through changes in metabolism, immune system function and proliferation/apoptosis pathways. The Journal of Nutritional Biochemistry, 2019. 64: p. 218-227.
- Almog, T. , et al., Interleukin-1α deficiency reduces adiposity, glucose intolerance and hepatic de-novo lipogenesis in diet-induced obese mice. BMJ Open Diabetes Res Care, 2019. 7(1): p. e000650.
- Kundu, A. , et al., Protective effect of EX-527 against high-fat diet-induced diabetic nephropathy in Zucker rats. Toxicology and Applied Pharmacology, 2020. 390: p. 114899.
- Pinhal, C.S. , et al., Time-course morphological and functional disorders of the kidney induced by long-term high-fat diet intake in female rats. Nephrology Dialysis Transplantation, 2013. 28(10): p. 2464-2476.
- Yadav, H. , et al., Protection from obesity and diabetes by blockade of TGF-β/Smad3 signaling. Cell Metab, 2011. 14(1): p. 67-79.
- Tsurutani, Y. , et al., The roles of transforming growth factor-β and Smad3 signaling in adipocyte differentiation and obesity. Biochemical and Biophysical Research Communications, 2011. 407(1): p. 68-73.
- Semeraro, M.D. , et al., The effects of long-term moderate exercise and Western-type diet on oxidative/nitrosative stress, serum lipids and cytokines in female Sprague Dawley rats. European Journal of Nutrition, 2022. 61(1): p. 255-268.
- Aloui, F. , et al., Grape seed and skin extract reduces pancreas lipotoxicity, oxidative stress and inflammation in high fat diet fed rats. Biomed Pharmacother, 2016. 84: p. 2020-2028.
- Laurentius, T. , et al., Long-Chain Fatty Acids and Inflammatory Markers Coaccumulate in the Skeletal Muscle of Sarcopenic Old Rats. Disease Markers, 2019. 2019.
- Corvera, S. and O. Gealekman, Adipose tissue angiogenesis: Impact on obesity and type-2 diabetes. Biochimica et Biophysica Acta (BBA) - Molecular Basis of Disease, 2014. 1842(3): p. 463-472.
- Zhao, L. , et al., Lactobacillus plantarum S9 alleviates lipid profile, insulin resistance, and inflammation in high-fat diet-induced metabolic syndrome rats. Sci Rep, 2022. 12(1): p. 15490.
- Dharavath, R.N. , et al., High fat-low protein diet induces metabolic alterations and cognitive dysfunction in female rats. Metabolic Brain Disease, 2019. 34(6): p. 1531-1546.
- Amengual-Cladera, E. , et al., Sex differences in the effect of high-fat diet feeding on rat white adipose tissue mitochondrial function and insulin sensitivity. Metabolism, 2012. 61(8): p. 1108-1117.
- Cedernaes, J. , et al., Adipose tissue stearoyl-CoA desaturase 1 index is increased and linoleic acid is decreased in obesity-prone rats fed a high-fat diet. Lipids Health Dis, 2013. 12: p. 2.
- Levin, B.E. and A.A. Dunn-Meynell, Differential effects of exercise on body weight gain and adiposity in obesity-prone and -resistant rats. International Journal of Obesity, 2006. 30(4): p. 722-727.
- Obradovic, M. , et al., Leptin and Obesity: Role and Clinical Implication. Front Endocrinol (Lausanne), 2021. 12: p. 585887.
- Maurya, R. , et al., COVID-19 Severity in Obesity: Leptin and Inflammatory Cytokine Interplay in the Link Between High Morbidity and Mortality. Frontiers in Immunology, 2021. 12.
- Gómez-Crisóstomo, N.P. , et al., Differential effect of high-fat, high-sucrose and combined high-fat/high-sucrose diets consumption on fat accumulation, serum leptin and cardiac hypertrophy in rats. Archives of Physiology and Biochemistry, 2020. 126(3): p. 258-263.
- Zengin, A. , et al., Low-carbohydrate, high-fat diets have sex-specific effects on bone health in rats. European Journal of Nutrition, 2016. 55(7): p. 2307-2320.
- El-Haschimi, K. , et al., Two defects contribute to hypothalamic leptin resistance in mice with diet-induced obesity. J Clin Invest, 2000. 105(12): p. 1827-32.
- Buettner, C. , et al., Critical role of STAT3 in leptin’s metabolic actions. Cell Metab, 2006. 4(1): p. 49-60.
Figure 1.
High energy density diet (HED) consumption significantly increased body weight and fat mass in male and female rats.
Figure 1.
High energy density diet (HED) consumption significantly increased body weight and fat mass in male and female rats.
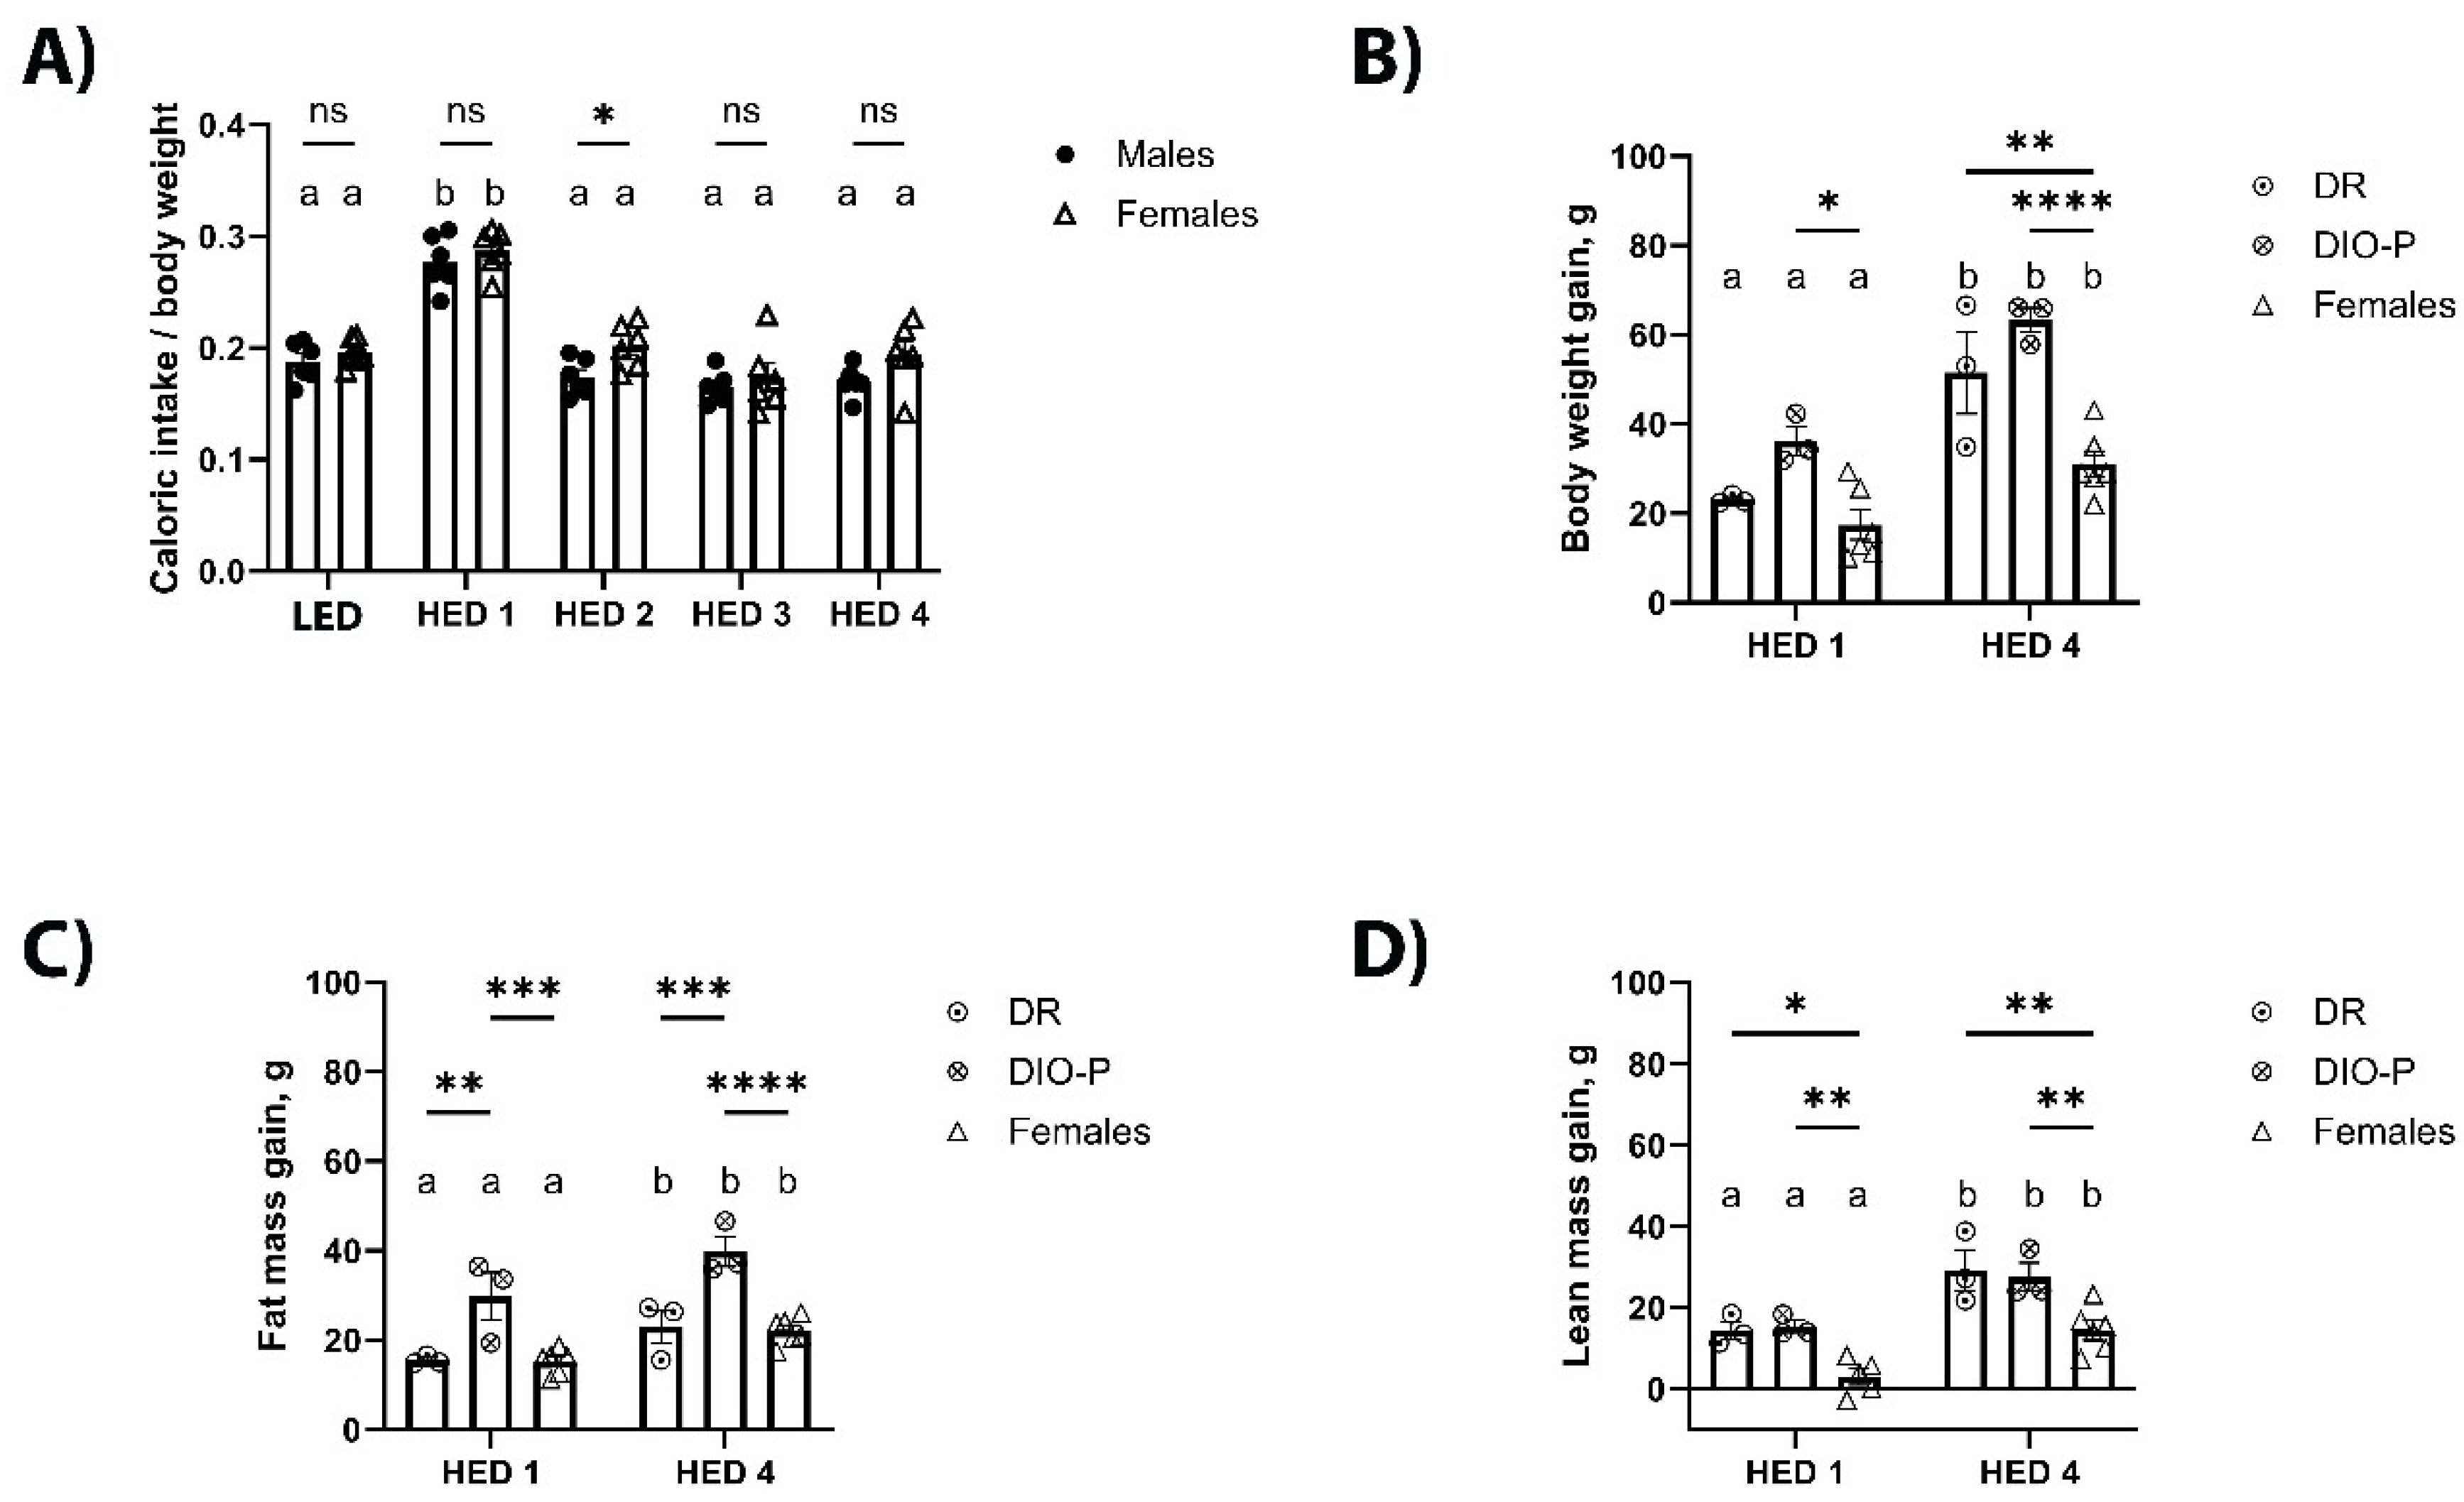
Figure 2.
High energy diet (HED) intake had a negative impact on gut microbiota composition.
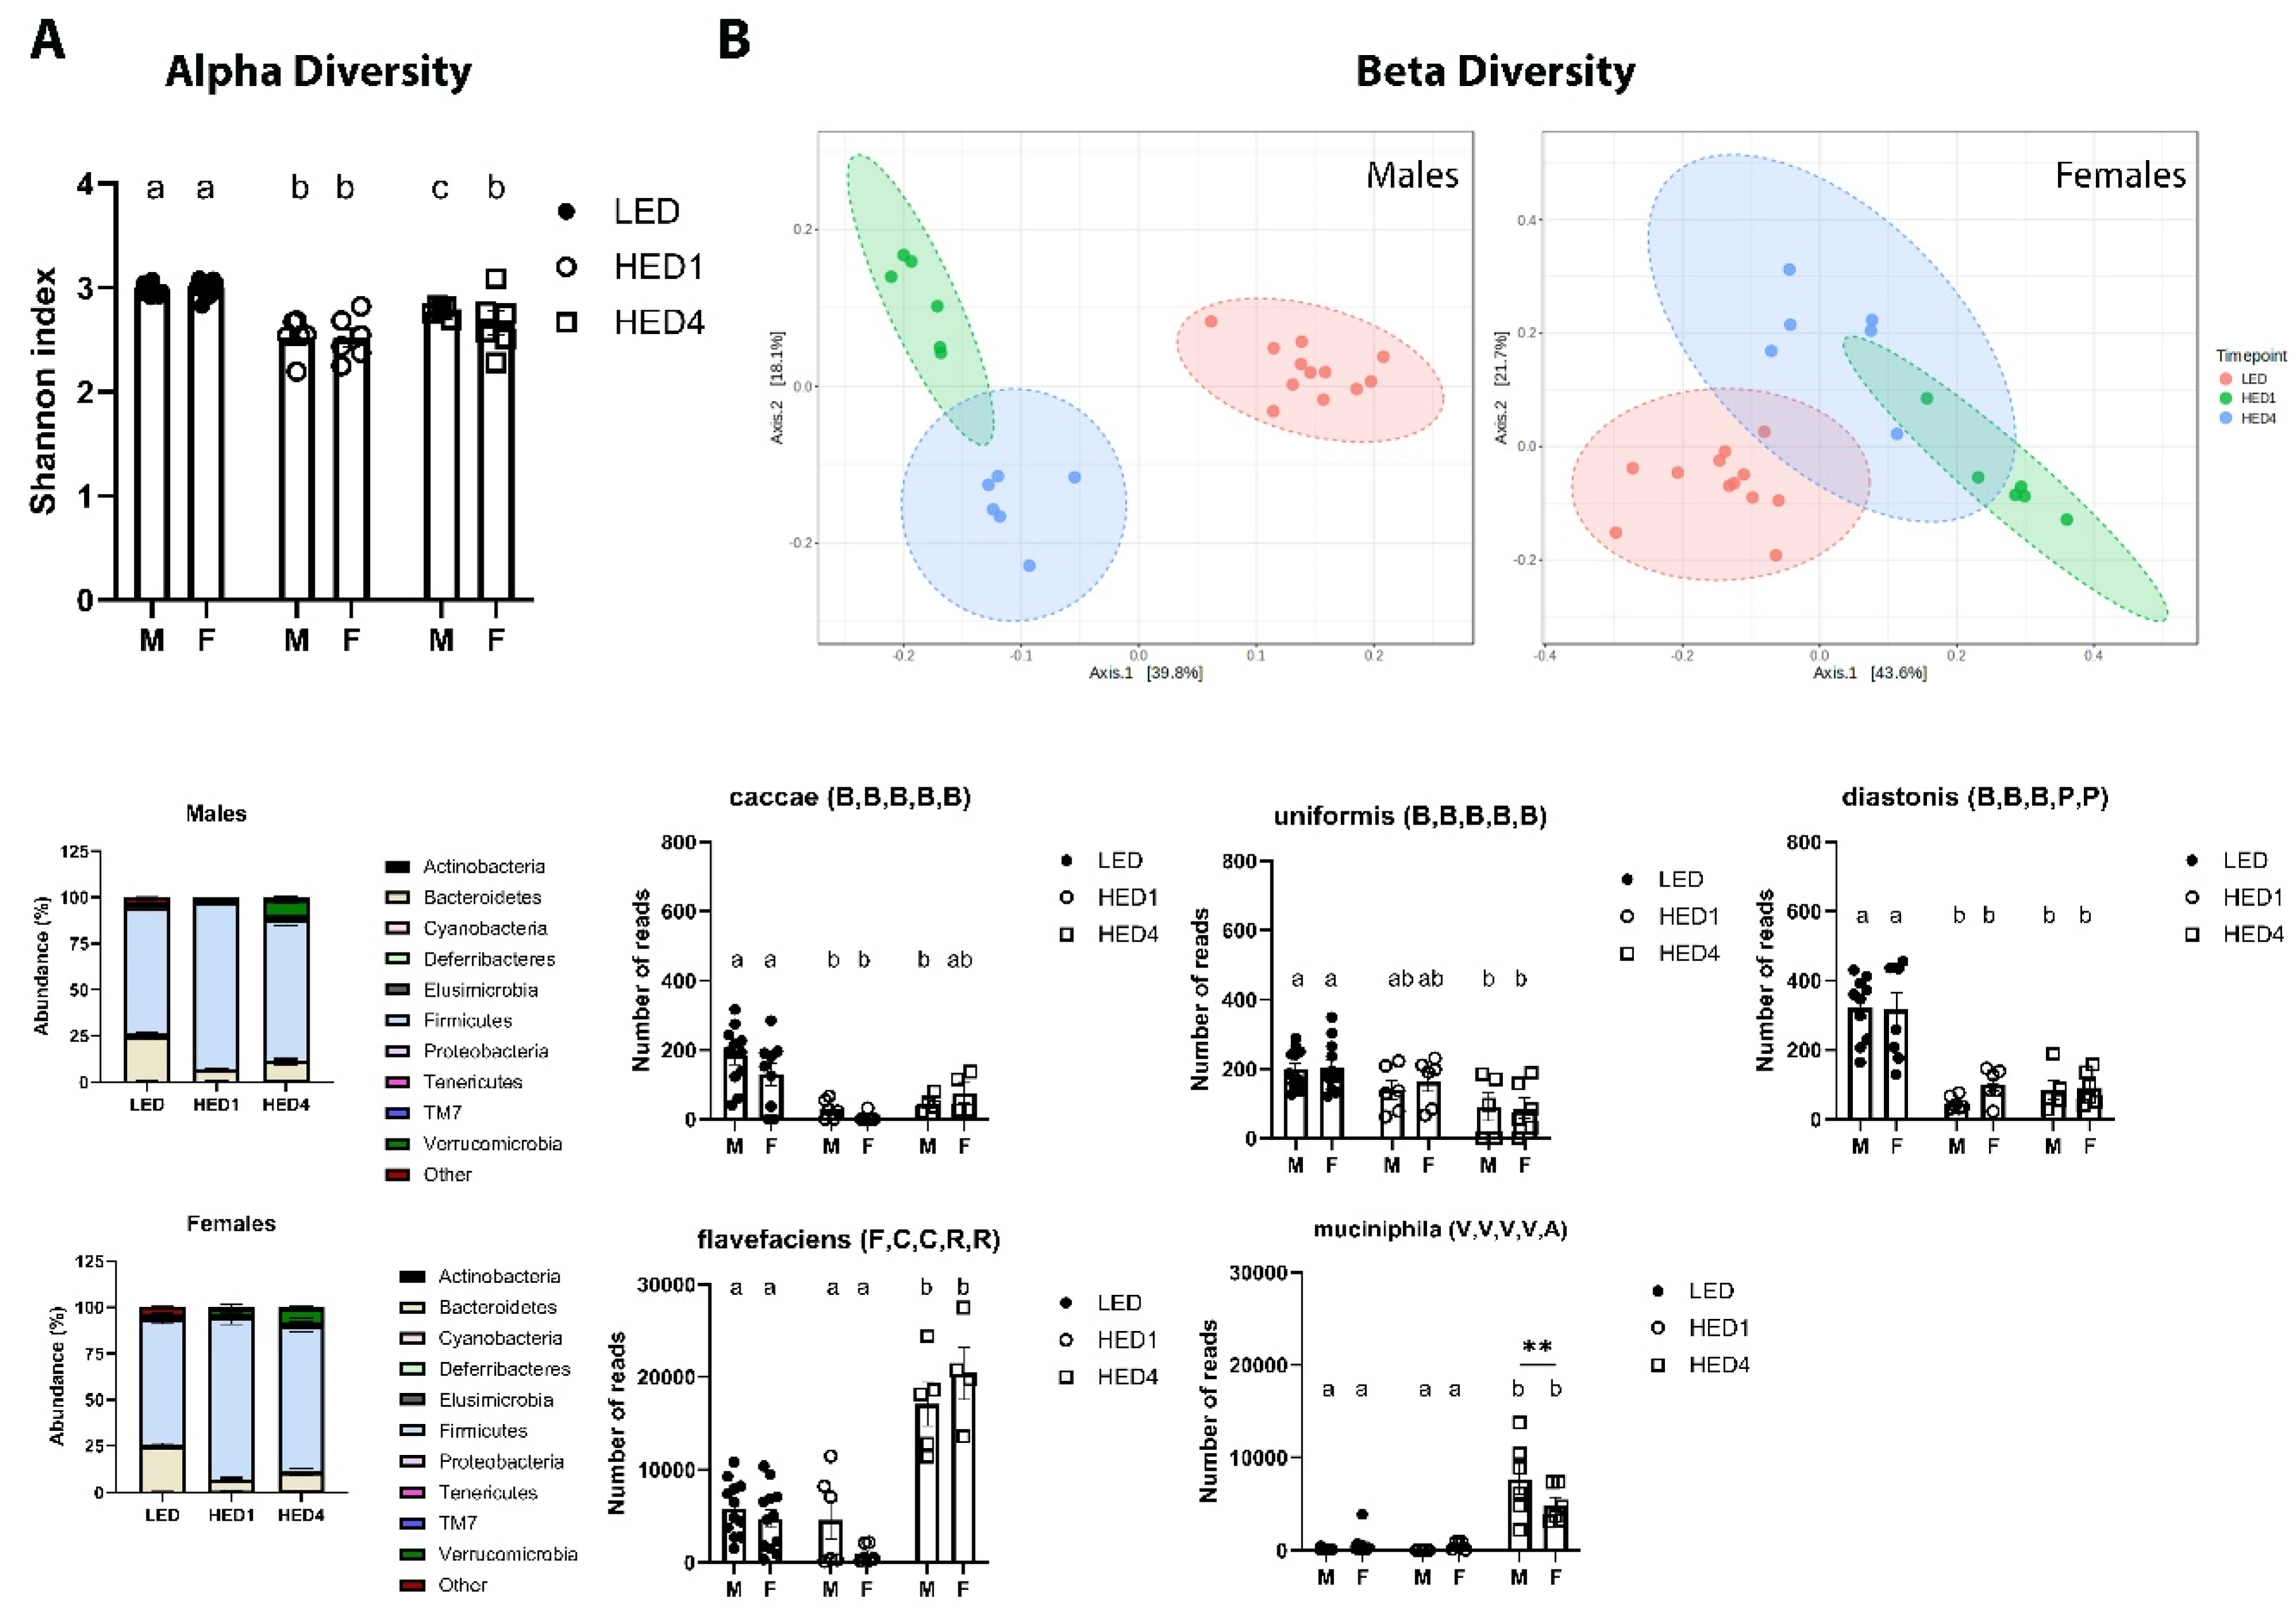
Figure 3.
Consumption of a high energy density diet (HED) significanly increased fecal fat excretion in rats.
Figure 3.
Consumption of a high energy density diet (HED) significanly increased fecal fat excretion in rats.
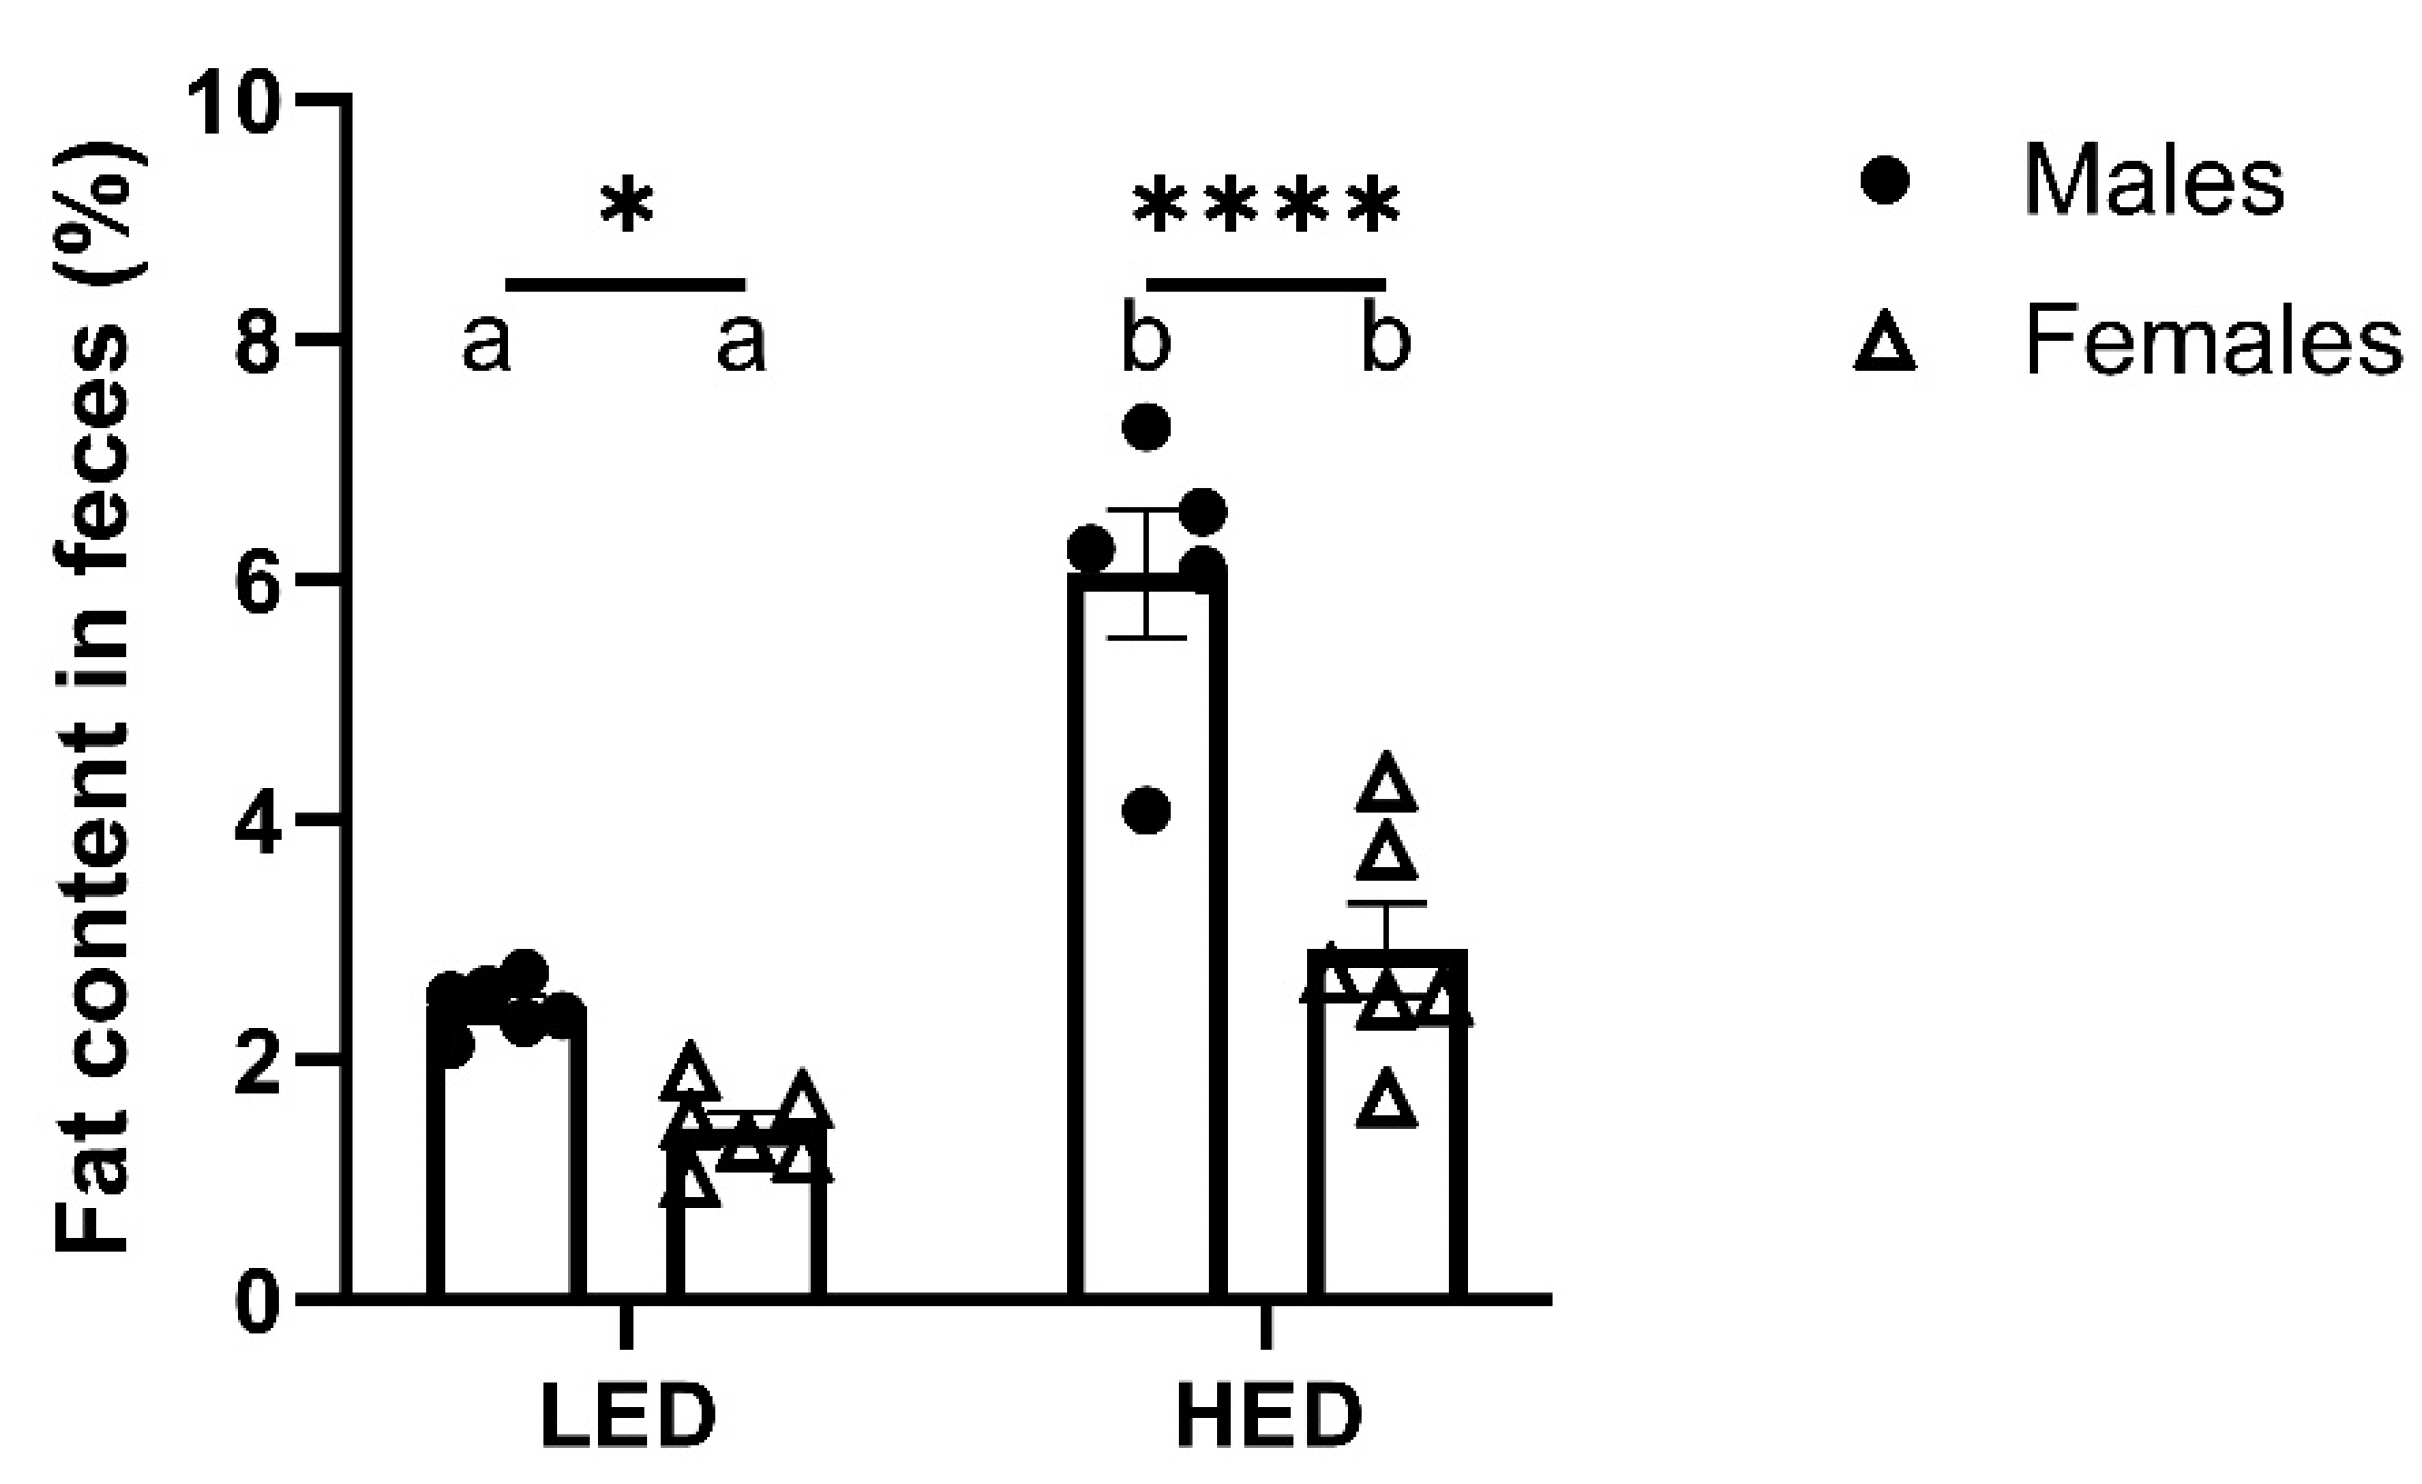
Figure 4.
Shown are mean ± SEM optical density (OD) of serum IL-1α (a), TGF-β (b), IP-10 (c), RANTES (d), FGFb (e), and FGFb for males split into DIO-P and DR groups. Serum concentration of insulin (ng/ml) is shown for males and females (g) and for males split into DIO and DR groups (h). Both males and females had significantly decreased serum IL-1α after the HED compared to LED (P=0.0013 and 0.0065, respectively). Males had significantly increased levels of TGF-β after HED compared to LED (P=0.0258), while females had significantly increased IP-10 levels after HED compared to LED (P=0.0326). Females had significantly greater levels of RANTES than males after LED (P=0.0037), which decreased significantly in after HED diet (P=0.0132). Females had significantly greater levels of FGFb than males after four weeks of the HED (P=0.0478). When males were split into DIO-P and DR groups, males in the DR group had significantly higher levels of FGFb after LED (P=0.0021), but there were no significant differences after HED. Both males and females had significant increases in serum insulin after HED (Ps<0.0001), with males having significantly greater levels than females (P=0.0148). Males in the DIO-P group had greater serum levels of insulin than males in the DR group after HED, but this difference was not significant (P=0.0734). Bars denoted with the same letter within each sex are not significantly different. Asterisk indicates statistical significance between sex or time-point, *P < 0.05, **P < 0.01, ****P < 0.0001.
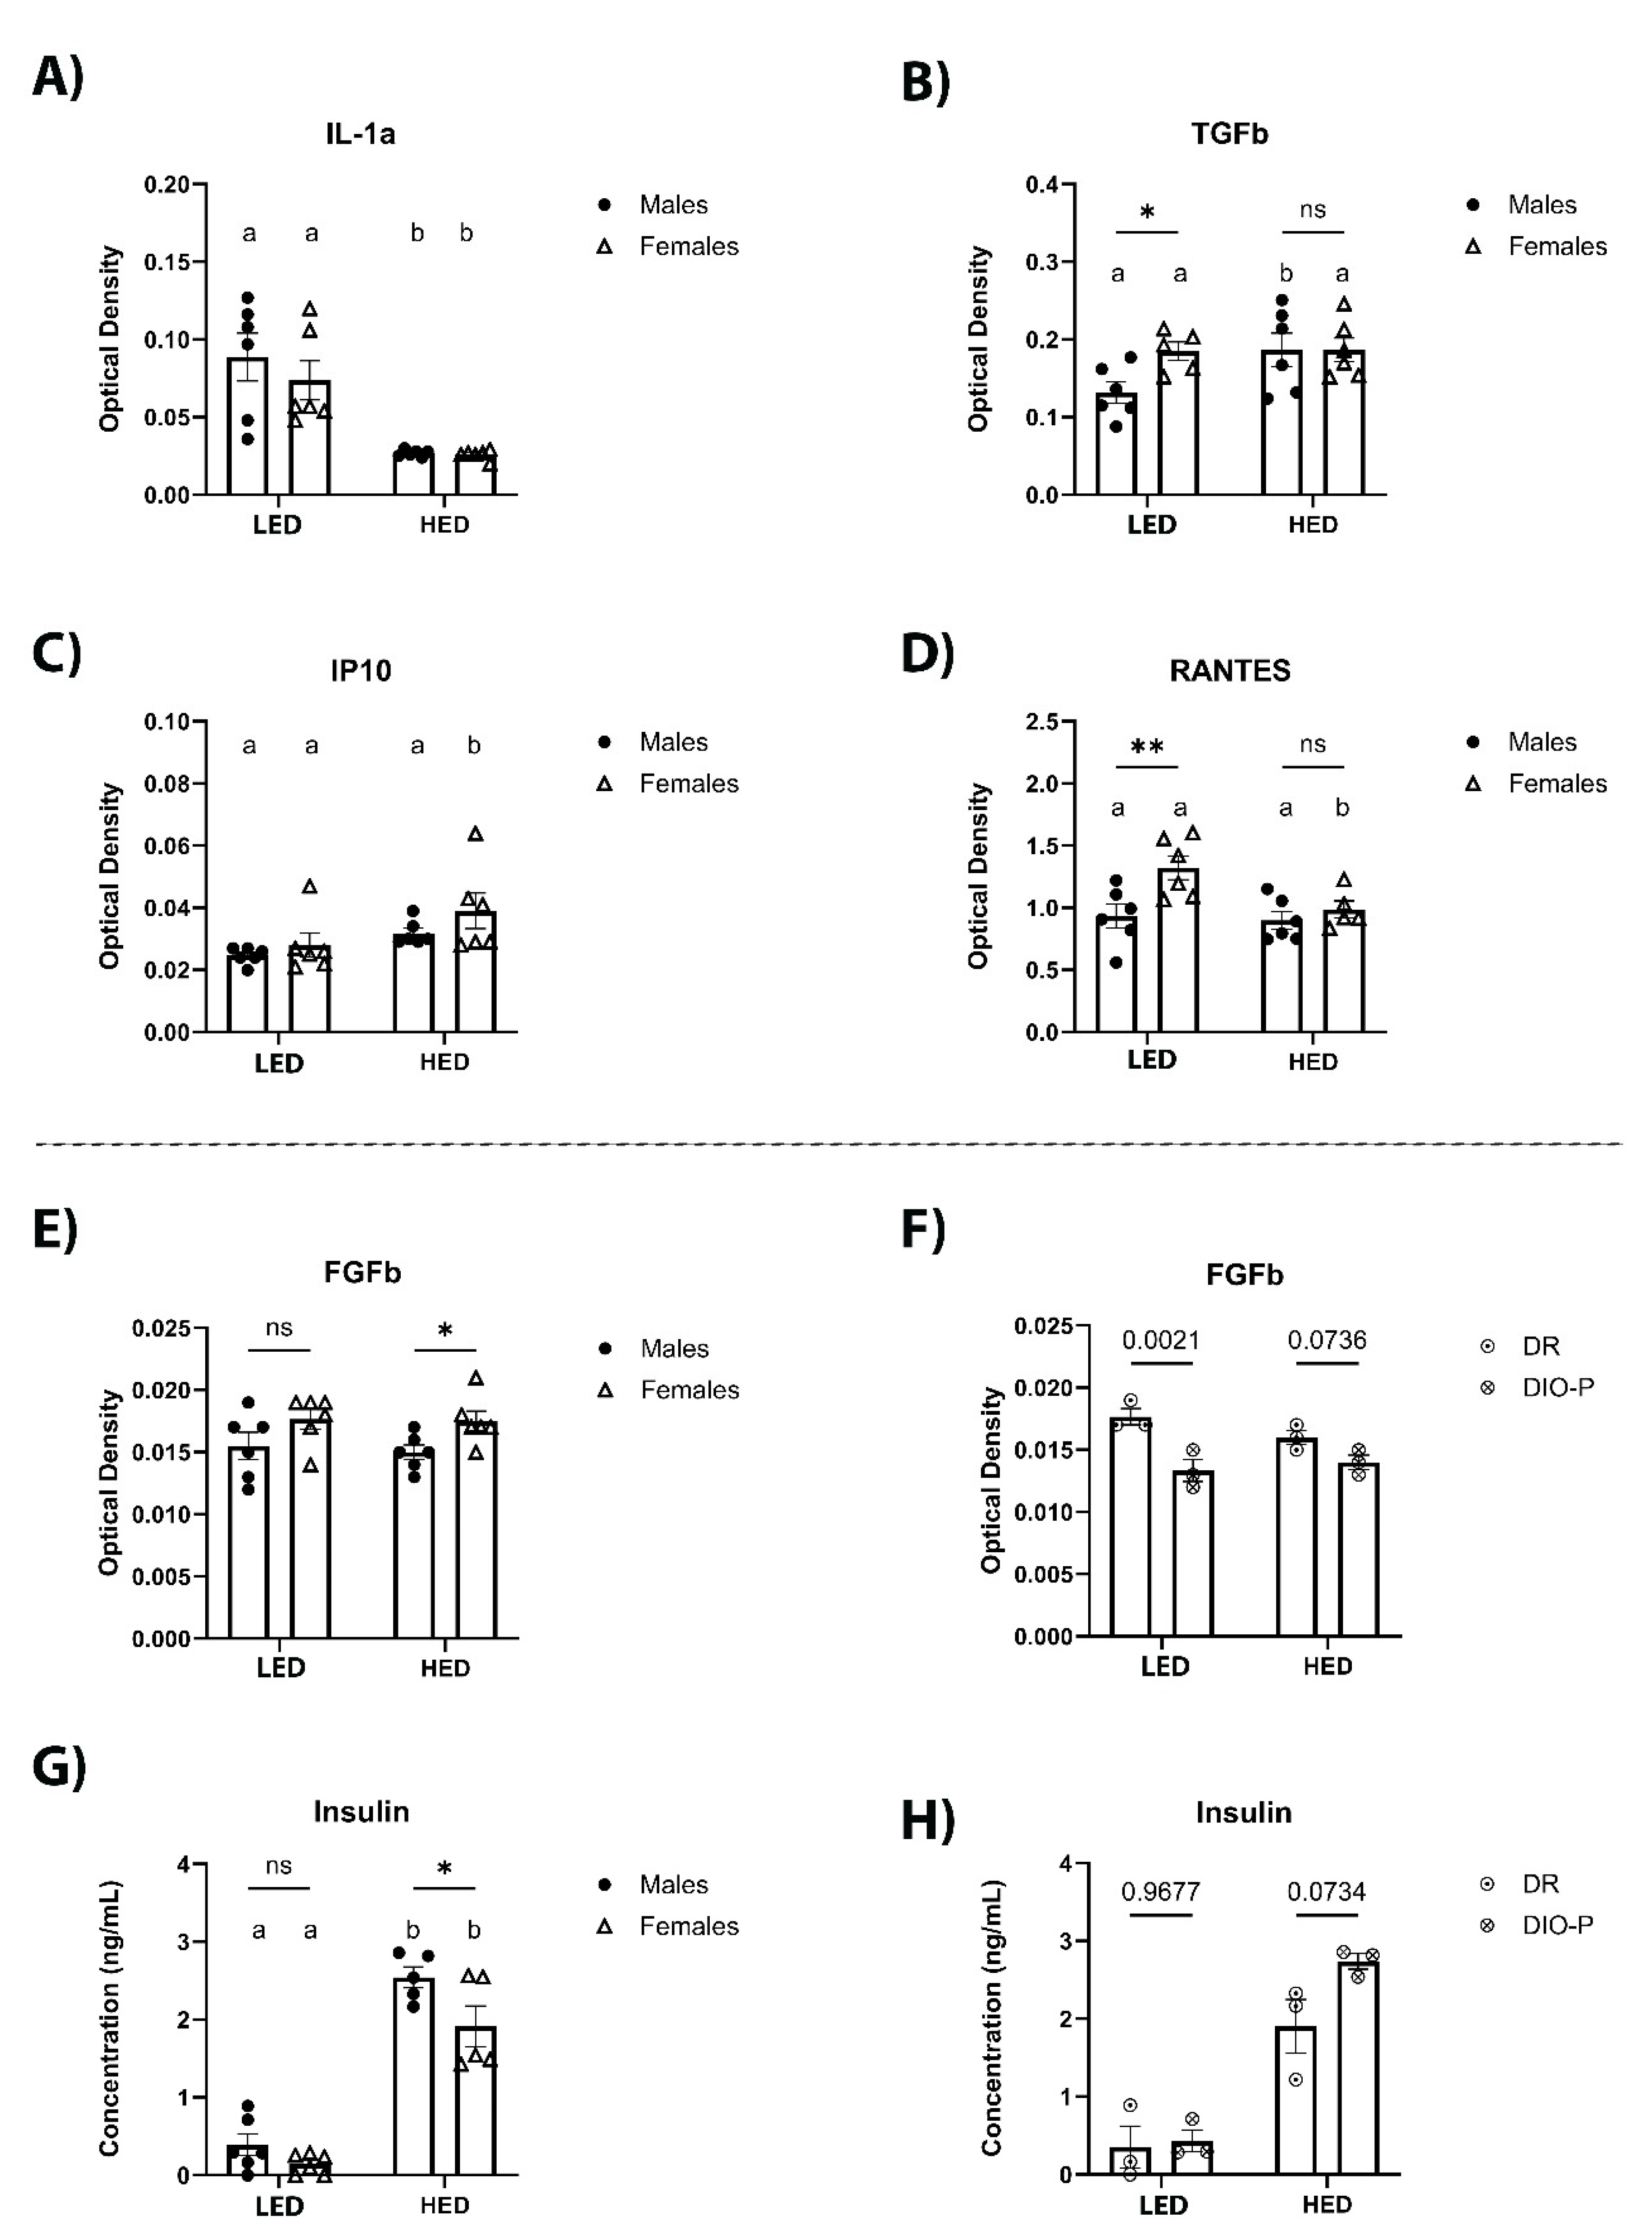

Table 1.
Cytokine levels in serum.
| Males | Females | ||||
|---|---|---|---|---|---|
| Cytokines | Category | LED | HED | LED | HED |
| IL-6 | Pro- and anti- inflammatory | 0.021 ± 0.001 | 0.027 ± 0.003 | 0.018 ± 0.001 | 0.020 ± 0.002 |
| IL-5 | Proinflammatory | 0.059 ± 0.007 | 0.047 ± 0.003 | 0.053 ± 0.003 | 0.058 ± 0.005 |
| IL-15 | Proinflammatory | 0.051 ± 0.006 | 0.045 ± 0.004 | 0.047 ± 0.003 | 0.046 ± 0.002 |
| IL-1β | Proinflammatory | 0.070 ± 0.007 | 0.056 ± 0.002 | 0.065 ± 0.003 | 0.062 ± 0.004 |
| Leptin | Proinflammatory | 0.050 ± 0.006 | 0.041 ± 0.002 | 0.046 ± 0.003 | 0.043 ± 0.003 |
| VEGF | Proinflammatory | 0.029 ± 0.003 | 0.027 ± 0.001 | 0.028 ± 0.002 | 0.028 ± 0.003 |
| TNF-α | Proinflammatory | 0.057 ± 0.007 | 0.044 ± 0.004 | 0.053 ± 0.003 | 0.050 ± 0.005 |
| MCP-1 | Proinflammatory | 0.027 ± 0.003 | 0.022 ± 0.001 | 0.028 ± 0.003 | 0.023 ± 0.001 |
| IFN-γ | Proinflammatory | 0.056 ± 0.008 | 0.045 ± 0.004 | 0.052 ± 0.003 | 0.047 ± 0.003 |
| MIP-1α | Proinflammatory | 0.019 ± 0.001 | 0.017 ± 0.002 | 0.017 ± 0.001 | 0.020 ± 0.001 |
| SCF | Stem cell factor | 0.074 ± 0.010 | 0.076 ± 0.016 | 0.067 ± 0.004 | 0.058 ± 0.004 |
Values are expressed as means ± SEM. Cytokine levels were measured in male (n = 6) and female (n = 6) rats after ten days on a low energy density (LED) diet and after four weeks on a high energy density (HED) diet. Cytokine levels were measured using Optical Density (OD) of sera in a cytokine array.
Disclaimer/Publisher’s Note: The statements, opinions and data contained in all publications are solely those of the individual author(s) and contributor(s) and not of MDPI and/or the editor(s). MDPI and/or the editor(s) disclaim responsibility for any injury to people or property resulting from any ideas, methods, instructions or products referred to in the content. |
© 2024 by the authors. Licensee MDPI, Basel, Switzerland. This article is an open access article distributed under the terms and conditions of the Creative Commons Attribution (CC BY) license (http://creativecommons.org/licenses/by/4.0/).
Copyright: This open access article is published under a Creative Commons CC BY 4.0 license, which permit the free download, distribution, and reuse, provided that the author and preprint are cited in any reuse.


