
Submitted:
30 September 2024
Posted:
01 October 2024
You are already at the latest version
Abstract
Avoiding global dependence on fossil oils, as well as improving the environmental impact during energy production, are factors that drive research into renewable energies. Considering lignocellulosic biomass residues as a raw material for gasification, a thermochemical process that converts lignocellulosic resources into synthesis gas (H2, CO, CH4 and CO2) is an alternative under study, due to its relatively low costs, high efficiency and the wide variety of applications of synthesis gas. Fortunately, there are still fields for its improvement and technological development. Gasification, for example: Different types of lignocellulosic biomass, such as sugarcane bagasse, wheat straw, pine sawdust or corn cob, differ in their physical, chemical and morphological properties, which can affect the characteristics of the gasification process. This work uses the methodology of generalized stoichiometry and mass and atomic balances in the gasification reactor, to predict the composition of syngas produced by gasification of both individual substrates and mixtures. The results provide useful information for the design and operation of gasification reactors, with their operating region between 2.0 bar and 4.5 bar, and 1024 K and 1224 K, understanding the effects of different types of biomasses, its humidity and molecular weight on the operation and performance of the process.
Keywords:
Atomic balances
; gasification of lignocellulosic wastes
; gasification reactor
; generalized stoichiometry
; mass balances
; synthesis gas
1. Introduction. Biomass and Biorefineries
The substitution of materials and energy from fossil hydrocarbons has promoted the development of biorefineries based on different platforms, such as the gasification of lignocellulosic waste. This gasification is carried out in reactors that receive as load different lignocellulosic waste (substrates) or mixtures of them, and some gasification agent that can be water vapour. Gasification takes place at high temperatures and pressures, using catalysts based on some alkaline metal to promote the dehydrogenation of the substrates [3]. This work presents the theoretical background used for the prediction of the composition of the syngas obtained from the gasification of lignocellulosic waste and mixtures. It starts using the empirical formulas of the unitary cells of waste and the stoichiometry necessary for the mass balance in gasification reactors. The results provide the theoretical basis for developing a mathematical strategy useful for decision making, which allows estimating composition of the products stream and, consequently, important quality parameters such as (H2/CO) ratio and H2 production as a function of the waste fed to the reactor. Thermodynamic feasibility is considered by fulfilling the equilibrium conditions of the reversible reactions that take place, thus limiting the actual operating region [7,11]. One important that should be taking into account is that the reactions proposed could or could not be the ones taking place inside the actual gasification reactor; however, since the process engineering point of view establish that the set of reactions to be used is the one useful for the modelling of the chemical transformations, the set of reactions obtained can be considered as the minimum number of reactions necessary to model the stoichiometry of the reactions set [7].
In biorefineries whose platform is gasification, one of the quality specifications of the syngas is the (H2/CO) ratio. For example, if Fischer-Tropsch synthesis is among the downstream processes, this ratio is recommended to be (H2/CO> 2.5), in the case of Gas-to-Liquids it is recommended (H2/CO> 1.8), and in case of lower ratios the syngas can be used as fuel within the biorefinery [5]. This makes being able to estimate this ratio a priori of primary importance for the use that will be given to the syngas.
On the other hand, the most abundant source of hydrogen on Earth is water, which means that using it as a gasification agent increases the value of the ratio (H2/CO). And finally, taking advantage of the humidity that accompanies lignocellulosic waste also favours this ratio, avoiding drying it as an expensive and energy-intensive pretreatment.
2. Methodology
2.1. Substrates and Their Characteristics
Three substrates were chosen, because of the availability of their gasification experimental data: Cane bagasse, pine sawdust [6] and wheat straw [13]. Empirical formulas were developed based on the relative mass content of the elements {C, H, O, N, S, Ash}; then, the definition of degree of polymerization [1] was used to characterise the chain length of the organic molecules in each substrate. The compositions of the unitary cell of the substrates considered in this work are shown in Table 1.
2.2. Generalized Stoichiometry of the Reacting System
The simulation of the reactor requires the resolution of the mass balance, for which it is necessary to know the stoichiometric scheme with which the transformation of the substrate molecules into products will be monitored. For this purpose, from papers in the literature, seven products were suggested namely {CO, H2, CO2, H2O, CH4, N2, H2S}. Using these products, the generalized stoichiometry technique, developed by Aris and Mah in 1963 [11], was used from the formula of the unit cell of each substrate. Details of this technique can be found, for example, in [2,10].
It was found that, for the proposed substrates, it is sufficient to solve the progress of 3 reactions, all of them restricted by equilibrium: water gas shift (1), wet methane reforming (2) and dry methane reforming (3).
In this work, the way in which the feasible operation region has been constrained is by ensuring that the reactions that reach equilibrium (1-3) satisfy this restriction. Since the equilibrium constants are mainly a function of temperature and pressure, by satisfying this restriction realistic values of the (H2/CO) ratio achievable at each operating condition are obtained, since this ratio cannot be increased infinitely during the gasification reactions.
Next, experimental data available in the literature were simulated adjusting the gasifier outlet composition of each individual substrate. To do this, two other reactions were added in order to fine-tune the composition within the feasible operating region, the same adjustment used when simulating the gasification of their mixtures. These two reactions were the wet reforming of the substrate (4) and the dry reforming of the substrate (5); the case of sugar cane is shown.
The reactions advances were solved assuming the conversion of the substrate up to approximately 76 wt%, except for the ashes; the rest is distributed as Tar and Char which were treated as side by-products. Up to date, the problem of modelling the Tar and Char products is still an unsolved problem; however, it has been proposed that their presence does not affect the equilibrium of reactions consideration [7,11].
There is an interesting point in the way the reactions were developed: There are two kinds of water in the system. The first one is the reactant that arrives with the substrates or could be supplied independently. The second one is the water produced by the Water-Gas-Shift reaction, which is produced rather than supplied. However, for the equilibrium conditions that should be satisfied, these water molecules are equivalent. In the case of the carbon dioxide, the reactant used in the dry reforming reactions is the one produced by Water-Gas-Shift.
Data of composition of the reactor effluent are available for gasification of sugar cane bagasse, pine sawdust [6] and wheat straw [13] as individual substrates. The adjustment of the advances of the proposed stoichiometric scheme, constrained to the equilibrium conditions described above, exhibit very good agreement with the reported data (Figure 1).
2.3. Mass Balances in the Gasification Reactor
Once the set of possible stoichiometric equations for the system have been generated, the degrees of freedom of the mass balance subproblem in the reactor are analysed, in order to identify the possible restrictions of each proposed reaction and the independent data necessary to solve this problem. According to the literature [5,9], it was proposed to operate in the region located at 2.0 bar ≤ Pressure ≤ 4.5 bar and 1123 K ≤ Temperature ≤ 1223 K. This operating region was confirmed by the evaluation of the equilibrium conditions after the gasification reactions took place [7,11]. These energy balance constrains were used to evaluate the equilibrium constants that restrain the operation region. Then, the advances for the three reactions that reach equilibrium were solved by numerical methods for nonlinear algebraic equations. Finally, by substituting these three advances in the mass balances, the composition of the reactor effluent is known. The accuracy of the solution is checked by the matching of atomic balances.
3. Results and Discussion
Reactor effluent compositions, for different dual mixtures of one mol of total substrates at three different proportions, were simulated. Cane bagasse was used as the ‘pivot’ waste, because of its high content of water. Two more substrates, pine sawdust and wheat straw, were mixed wit the cane bagasse, in order to see the effect of a dry substrate on the possible product distribution at the gasification reactor outlet.
3.1. Sugar Cane Bagasse and Pine Sawdust
The first mixture to be analysed is sugar cane bagasse and pine sawdust, in three different proportions: {8:2, 7:3, 6:4}. These proportions were selected, because incorporation of more pine sawdust prevents the gasification reactions. The atomic account of the first mixture, proportion 8:2, is given in Table 2.
Production of molecular hydrogen at the proportion 8:2 (Figure 2a) exhibits two noticeable maxims, one at 2.5 bar and the other at 3.8 bar, both at 1223.15 K. Therefore, it is possible to infer that there are some points that should be close to the optimum yield to hydrogen. On the other hand, the minimum vales are reached at the maximum operating pressure, which means that the pressure affects inversely the hydrogen production.
Production of CO at the proportion 8:2 (Figure 2b) follows a similar trend of the one exhibit by molecular hydrogen, showing two possible relative maximum points of production, at (2.0 bar, 1223.15 K) and (3.5 bar, 1223.15 K). Both gases are the principal components of the syngas, therefore it is possible to infer that syngas production is favoured at low pressures and the maximum operating temperature.
The (H2/CO) ratio at the proportion 8:2 (Figure 2c) follows a different pattern, which is important to notice, because of the importance of this ratio in the uses that will be given to this syngas. It is possible to notice that in the simulated cases, this ratio remains mostly unchanged, oscillating between values of 0.85 to the unity. This result is in agreement with experimental observations taken previously [6,13].
The water available in the reactor effluent at the proportion 8:2 experiments small changes (Figure 2d), exhibiting its relative maximum at (4.5 bar, 1223.15 k). Although the water profile is oscillating, it is possible to infer that its content in the reactor effluent is favoured by increasing the pressure.
The production of carbon dioxide at the proportion 8:2 (Figure 2e) exhibits oscillating behaviour with its relative maximum value at (4.5 bar, 1173.15 K), and two relative minimums at (2.0 bar, 1123.15 K) and (4.5 bar, 1223.15 K). Therefore, its production is favoured at high pressure and intermediate temperature and prevented at high pressure and either low or high temperature.
Finally, the production of methane at the proportion 8:2 (Figure 2f) experiments medium oscillations, reaching its relative maximum at (4.5 bar, 1173.15 K) and its relative minimum at (4.5 bar, 1223.15 K). It also shows a hill with the relative maximum at the intermediate value.
As long as the proportion is changed to 7:3, the global behaviour is very similar, with changes in some variables. The atomic account of the second mixture, proportion 7:3, is given in Table 3.
The first change is that the (H2/CO) ratio exhibits some decreasing, reaching a relative maximum close to one at (2.0 bar, 1223.15 K), but a smaller minimum value than in the case of the proportion 7:3. However, the productivities of hydrogen and carbon monoxide at the proportion 8:2 are similar to those reached at the proportion 7:3. Hence, the (H2/CO) ratio is not a good quality criteria, as it is mentioned in literature.
In the case of water in the reactor effluent at the proportion 7:3 (Figure 3d), there is a decrease in all its values, and its relative minimum is observed at intermediate temperatures. This situation changes the shape of the profiles to a hill-like ones.
The production of carbon dioxide remains in similar values for the proportion 7:3 (Figure 3e) in comparison with those at 8:2 (Figure 2e); however, the shape of the profile is changing, reaching its relative maximum at (2.5 bar, 1123.15 K) and its relative minimum at (4.5 bar, 1223.15 K).
The production of methane changes shape at the proportion 7:3 is changing, increasing its content in the reactor effluent, and reaching two relative maximum vales at (2.0 bar, 1173.15 K) and (4.5 bar, 1173.15 K). And in the case of the relative minimums, it is possible to observe oscillatory behaviour, reaching them at (2.5 bar, 1123.15 K) and (4.5 bar, 1223.15 K).
The atomic account of the third mixture, proportion 6:4, is given in Table 4.
The production of hydrogen decreases with respect to the previous proportions and exhibits oscillating behaviour. Its relative maximum is reached at (2.0 bar, 1223.15 K), like the previous two cases, but now there are two relative minimums at (4.5 bar, 1123.15 K) and (4.5 bar, 1223.15 K). Therefore, the conclusion is that lower pressure favours hydrogen production. The production of CO remains similar to the other two cases and also its relative maximum and relative minimum.
Due to the changes in the shape of hydrogen production, profiles of the (H2/CO) ratio change its shape to a hill-like one, reaching its relative maximum at (2.0 bar, 1223.15 K), and two relative minimums, both close to 0.65, at (4.5 bar, 1123.15 K) and (4.5 bar, 1223.15 K). Again, although the production of hydrogen and CO are similar to the previous cases, this ratio changes significatively, which seems to be a not very good quality parameter to classify the syngas.
By comparison of the mixtures with the three proportions of sugar cane bagasse and pine sawdust, it is noticed that the production of hydrogen and carbon monoxide remained similar in the three cases, however the (H2/CO) ratio changed its behaviour, noticeably. The amount of water in the reactor effluent decreased following the sequence 8:2, 7:3, 6:4; this situation is a consequence of the equilibrium conditions, and difficult to be assigned to any single influence.
3.2. Sugar Cane Bagasse and Wheat Straw
The second mixture to be analysed is sugar cane bagasse and wheat straw, in the same three proportions: {8:2, 7:3, 6:4}. The operating conditions for the gasification reactor are the same of the last case, so it is possible to compare the reactor effluent, directly. The atomic account of the fourth mixture, proportion 8:2, is given in Table 5.
Production of molecular hydrogen at the proportion 8:2 (Figure 5a), exhibits two noticeable maxims, one at 2.5 bar and the other at 3.8 bar, both at 1223.15 K. Again, it is possible to infer that there are some points that should be close to the optimum yield to hydrogen. The relative minimum vales are reached at the maximum operating pressure, which means that the pressure affects inversely the hydrogen production. The production of carbon monoxide at the proportion 8:2 (Figure 5b), remains with small changes in all the operating region, reaching two relative maximums at (2.0 bar, 1123 K) and (4.5 bar, 1223 K). This production reaches its relative minimum at (4.5 bar, 1123 K). Although the stable values, these are larger than in the cases of the other mixture.
The values exhibited by the (H2/CO) ratio are small at the proportion 8:2 (Figure 5c), reaching two relative maximums of about 0.84 at (2.0 bar, 1223 K) and (4.5 bar, 1173 K). However, for this mixture, the production of hydrogen is similar to the one reached with the mixture of sugar cane bagasse and pine sawdust, but the production of carbon monoxide is higher.
The amount of water in the gasification reactor outlet, at the proportion 8:2 (Figure 5d), reaches its relative maximum at (4.5 bar, 1223 K) and its relative minimum at (2.0 bar, 1223 K). Its shape is hill-like and oscillating, the relative changes are sensitive.
The production of carbon dioxide at the proportion 8:2 (Figure 5e) exhibits oscillating behaviour with its relative maximum value at (4.5 bar, 1173.15 K), and its relative minimum at (4.5 bar, 1223.15 K). Therefore, its production is favoured at high pressure and intermediate temperature and prevented at high pressure and high temperature.
The production of methane at the proportion 8:2 (Figure 5f) exhibits medium oscillations, reaching its relative maximum at (4.5 bar, 1173.15 K) and its relative minimum at (4.5 bar, 1223.15 K). Therefore, high pressures and intermediate temperatures favour the production of methane.
The fifth mixture, with proportion 7:3 exhibits a very different and oscillating behaviour, the atomic account of this mixture is given in Table 6.
Productivities of hydrogen (Figure 6a) and carbon monoxide (Figure 6b) exhibit hill-like shapes, with their relative maximum showing a plateau between 2.0 bar and 2.5 bar and 1223.15 K. Both of them exhibit two relative minimums at (4.5 bar, 1123.15 K) and (4.5 bar, 1223.15 K). The amounts produced are the highest for both gases analysed in this work. In fact, the profiles of both production curves are very similar.
As consequence of the similarity mentioned above, the (H2/CO) ratio (Figure 6c) remains with very small changes in all the operating region, exhibiting values as low as 0.73 at (2.0 bar, 1223.15 K) and 0.54 at (4.5 bar, 1123.15 K). Again, this ratio is not an illustrative quality index to indicate the availability of hydrogen.
The water amount in the reactor effluent (Figure 6d) exhibits its relative maximum at (4.5 bar, 1223.15 K) and its relative minimum at (2.0 bar, 1173 K). Its behaviour remains without great changes in the operating zone, as consequence of the equilibrium reached by the reactions.
The production of carbon dioxide (Figure 6e) remains without great changes in the operating zone, reaching its relative maximum at (4.5 bar, 1123.15 K) and its relative minimum at (2.0 bar, 1173.15 K).
Finally, production of methane (Figure 6f) exhibits small changes in the operating region, reaching two relative maximums at (4.5 bar, 1123.15 K) and (4.5 bar, 1223 K), reaching its relative minimum at (2.0 bar, 1173.15 K).
The atomic account of the sixth mixture, proportion 6:4, is given in Table 7.
The hydrogen production for this mixture is oscillating (Figure 7a), reaching three relative maximums at (2.0 bar, 1223.15 K), (2.5 bar, 1223.15 K) and (3.5 bar, 1223.15 K). The CO production (Figure 7b) exhibits small changes in the operating region reaching relative maximums at (2.0 bar, 1223.15 K) and (4.0 bar, 1223.15 K). Also, it exhibits sensitive changes at high temperature, reaching its minimum at (4.5 bar, 1123.15 K).
The (H2/CO) ratio (Figure 7c) exhibits very low values, reaching its maximum of 0.6 at (4.0 bar, 1173.15 K) and its minimum of 0.5 at (4.0 bar, 1173.15 K). Again, these values do not reflect the amount of hydrogen in the reactor effluent.
The water in the reactor effluent (Figure 7d) exhibits oscillating behaviour, reaching two relative maximums at (4.5 bar, 1123.15 K) and (4.5 bar, 1173.15 K). The production of carbon dioxide (Figure 7e) is very flat, reaching its maximum at (4.0 bar, 1226.15 K) and its minimum at (2.0 bar, 1223.15 K). Finally, the production of methane (Figure 7f) exhibits very low changes, reaching its relative maximum as a plateau between (2.0 bar, 1223.15 K) and (2.5 bar, 1223 K); its minimum is reached at (2.0 bar, 1223.15 K).
The amounts produced of gases changed according to the proportions of the sugar cane bagasse-wheat straw mixture. Production of hydrogen and carbon monoxide changed sensitively for the mixture in proportion 7:3, exhibiting their maximum values. For the other mixtures, the production of hydrogen was slower for the mixture proportion 6:4 and for the carbon monoxide the smaller production was obtained for the mixture 8:2. In the case of the (H2/CO) ratio, the observed values were decreasing from mixture to mixture, even when the production of the gases was very different, indicating again that this ratio does not reflect the syngas characteristics. The water in the reactor effluent decreased from simulation to simulation, as consequence of the equilibrium reached by the reactions. Production of carbon dioxide exhibits its maximum for the mixture with proportion 8:2, the minimum for the one with proportion 7:3 and an intermediate value for the mixture of proportion 6:4; again, as consequence of the equilibrium. Production of methane increased slowly from the first to the second mixture but increased notoriously for the third mixture.
Comparing the production profiles between the mixtures of pine sawdust with sugar cane bagasse and the wheat straw with sugan cane bagasse, all the values were higher for the mixtures with wheat straw. It was expected, because the higher amount of carbon and hydrogen atoms supplied by each mixture; however, it is not easy to predict the final distribution of these atoms in the products of the gasification reactions. Therefore, this methodology that uses empiric stoichiometry to follow the mass balances in the gasification reactor, constrained by the equilibrium conditions for the chemical reactions, helps in the prediction of production profiles during the gasification of mixtures of lignocellulosic waste, which are closed to experimental results.
4. Conclusions
Applying the methodology of generalised stoichiometry, three reversible reactions were identified as useful to restrain the actual operating region of gasification reactors. Including a couple of additional reactions, the wet and dry reforming of the lignocellulosic waste, it was possible to adjust experimental results of gasification of single substrates and, with the same relative ratio of wet and dry reforming of the substrates, it was possible to predict the composition of the gasification reactor effluent using dual mixtures. This methodology can be applied to any lignocellulosic substrate and may be extended to mixtures of multiple residues. The main steps are to represent the wastes in terms of their unitary cells and to develop the stoichiometry for the wet and dry reforming reactions, the other three reactions are useful to constraint the operating region. It is important to notice that the (H2/CO) ratio cannot be increased without limit, because of the thermodynamic equilibrium constraints. Also, this ratio is not as useful as quality parameter of the syngas, because does not reflect the availability of hydrogen. Therefore, gasification of lignocellulosic waste, with different amount of humidity, or even including more water as gasification agent, reaches a physicochemical limit in the syngas production and composition, that can be approached considering the equilibrium conditions for the chemical reactions.
Acknowledgments
CAMH fully thanks the CONAHCYT grant for PhD studies. GJG and RMY greatly appreciate the economic compliment from the National System of Researchers (CONAHCYT-SNII). RMY thanks the support by Project CIC-UMSNH 20.20.
References
- Bassem, B.; Hallac, B.; Ragauskas, A. Analyzing cellulose degree of polymerization and its relevancy to cellulosic ethanol. Biofuels, Bioproducts & Biorefining. 2011, 5, 215–225. [CrossRef]
- Cerro, R.L.; Higgins, B.G.; Whitaker, S. Material Balances for Chemical Engineers, Ch. 6. University of California at Davis, 2003. http://www.higgins.ucdavis.edu/MatBalance Visited on 04/06/2023, 06:04:07 p.m.
- Corella, J.; Toledo, J-M.; Molina, G. Biomass gasification with pure steam in fluidized bed: 12 variables that affect the effectiveness of the biomass gasifier. Int. J. Oil, Gas and Coal Technology. 2008, 18, 194-207.
- Fraga-Cruz, G.S.; PérezMéndez, M.A.; Jiménez-García, G.; Huirache-Acuña, R.; Nápoles-Rivera, F.; Espino-Valencia, J.; Maya-Yescas, R. Integration of Chemical Looping Combustion to a Gasified Stream with Low Hydrogen Content. Processes 2024, 12, 1033. [CrossRef]
- Kangas, P.; Hannula, I.; Koukkari, P.; Hupa, M. Modelling super-equilibrium in biomass gasification with the constrained Gibbs energy method. Fuel. 2014, 129, 86-94. [CrossRef]
- Lopes-Motta, I.; Toscano-Miranda, N.; Maciel-Filho, R.; Wolf-Maciel, M.R. Biomass gasification in fluidized beds: A review of biomass moisture content and operating pressure effects. Renewable and Sustainable Energy Reviews. 2018, 94, 998-1023. [CrossRef]
- Ortiz-Sanchez, M.; Cardona-Alzate, C.A. Analysis of the routes for biomass processing towards sustainable development in the conceptual design step: Strategy based on the compendium of bioprocesses portfolio. Bioresource Technology. 2022, 350, Article 125862. [CrossRef]
- Paniagua-Rodríguez, J.C.; Jiménez-García, G.; Maya-Yescas, R. Proposition of a Minimum Set of Independent Chemical Reactions to Model Gas-Phase Composition during Gasification of Complex Cokes. Energy and Fuels. 2011, 25, 4070-4076. [CrossRef]
- Raheem, A.; Zhao, M.; Dastyar, W.; Channa, A.Q.; Ji, G.; Zhang, Y. Parametric gasification process of sugarcane bagasse for syngas production. International Journal of Hydrogen Energy. 2019, 44, 16234-16247. [CrossRef]
- Reklaitis, G.V. Introduction to material and energy balances. John Wiley & Sons, New York, 1983, Ch. 4.
- Shafiq, H.; Azam, S.U.; Hussain, A. Steam gasification of municipal solid waste for hydrogen production using Aspen Plus® simulation. Discover Chemical Engineering. 2021, 1:4. [CrossRef]
- Waller, K.V.; Mäkllä, P.M. Chemical Modeling, Reaction Invariants and Variants and Their Use in Reactor Simulation, and Control. Industrial & Engineering Chemistry- Process Design & Development. 1981, 1081, 1-11.
- Wang, C.; Li, L.; Chen, Y.; Ge, Z.; Jin, H. Supercritical water gasification of wheat straw: Composition of reaction products and kinetic study. Energy. 2021, 227, Article 120449. [CrossRef]
Figure 1.
Composition at reactor outlet (%vol): CO2 (●), CH4 (■), CO (♦) and H2 (▲) compared with experimental results of gasification of cane bagasse, pine sawdust and wheat straw.
Figure 1.
Composition at reactor outlet (%vol): CO2 (●), CH4 (■), CO (♦) and H2 (▲) compared with experimental results of gasification of cane bagasse, pine sawdust and wheat straw.
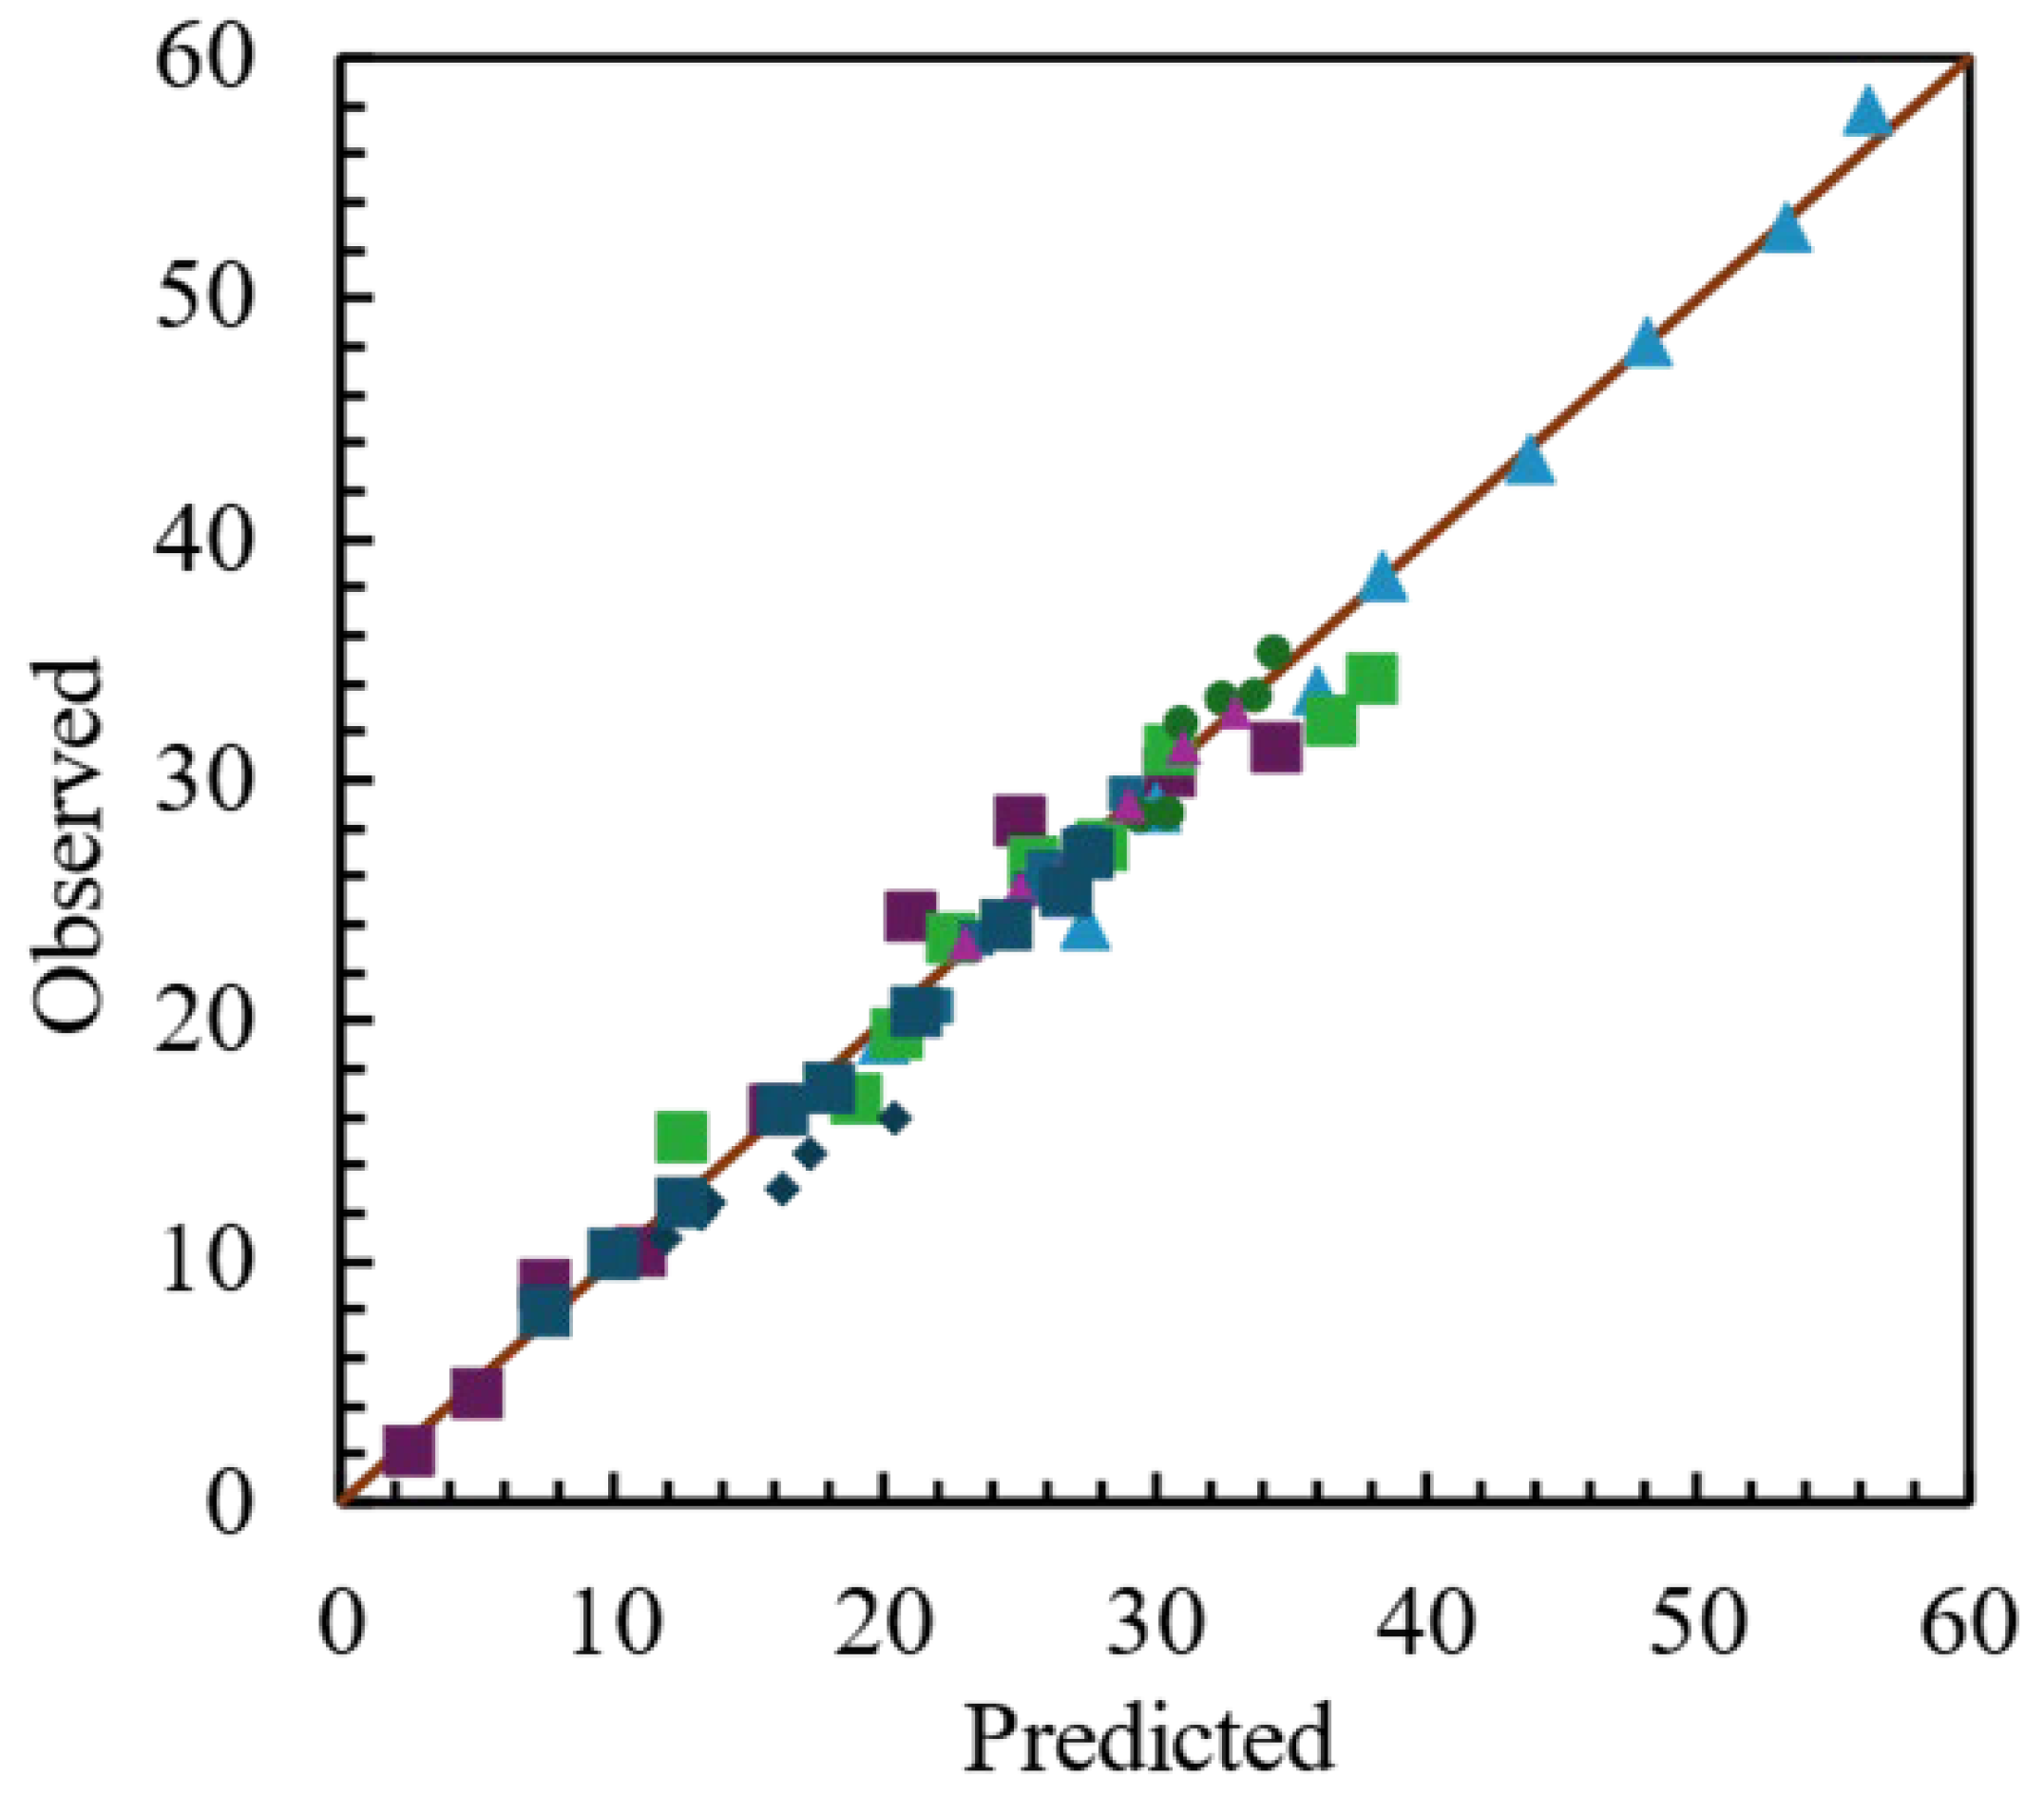
Figure 2.
Reactor effluent composition for the gasification of the mixture of 80 mol% bagasse and 20 mol% pine sawdust. a) Hydrogen. b) Carbon monoxide. c) (H2/CO) ratio. d) Water. e) Carbon dioxide. f) Methane.
Figure 2.
Reactor effluent composition for the gasification of the mixture of 80 mol% bagasse and 20 mol% pine sawdust. a) Hydrogen. b) Carbon monoxide. c) (H2/CO) ratio. d) Water. e) Carbon dioxide. f) Methane.
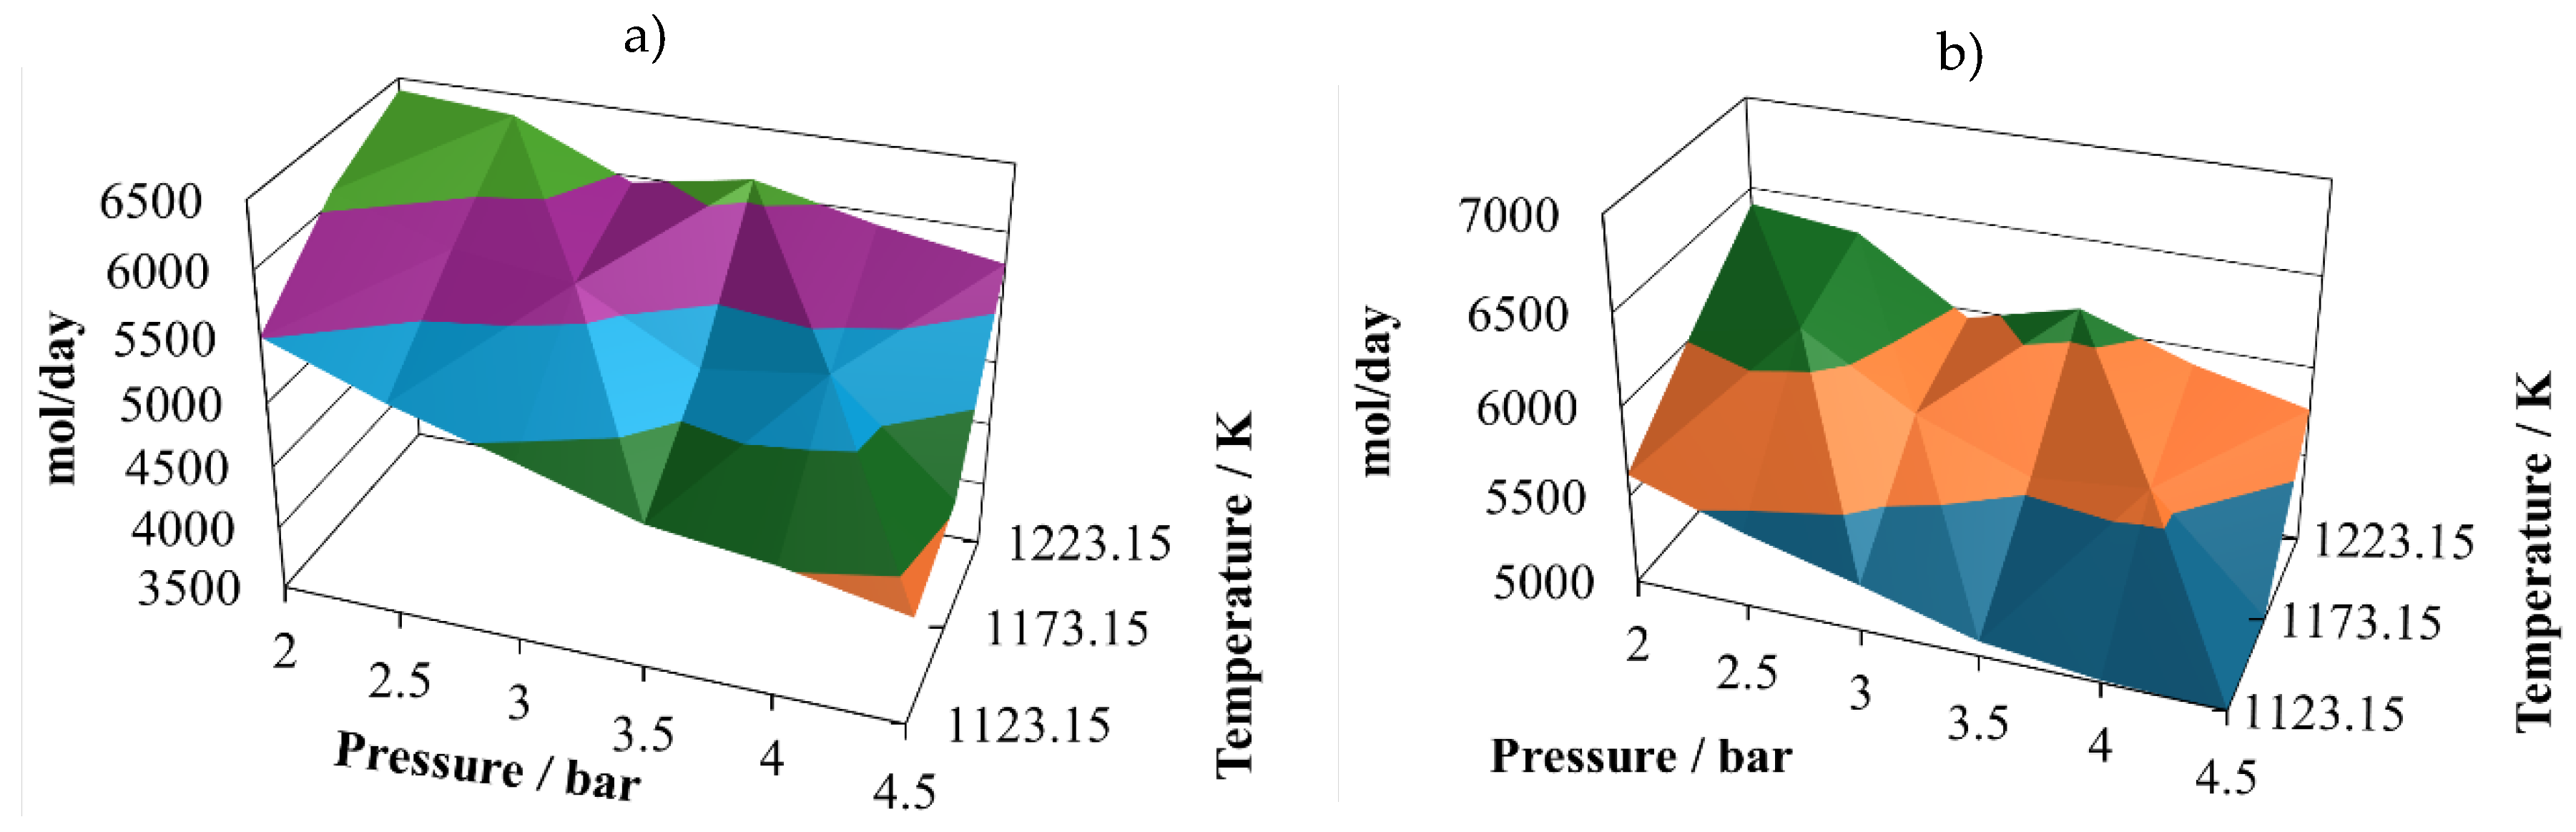
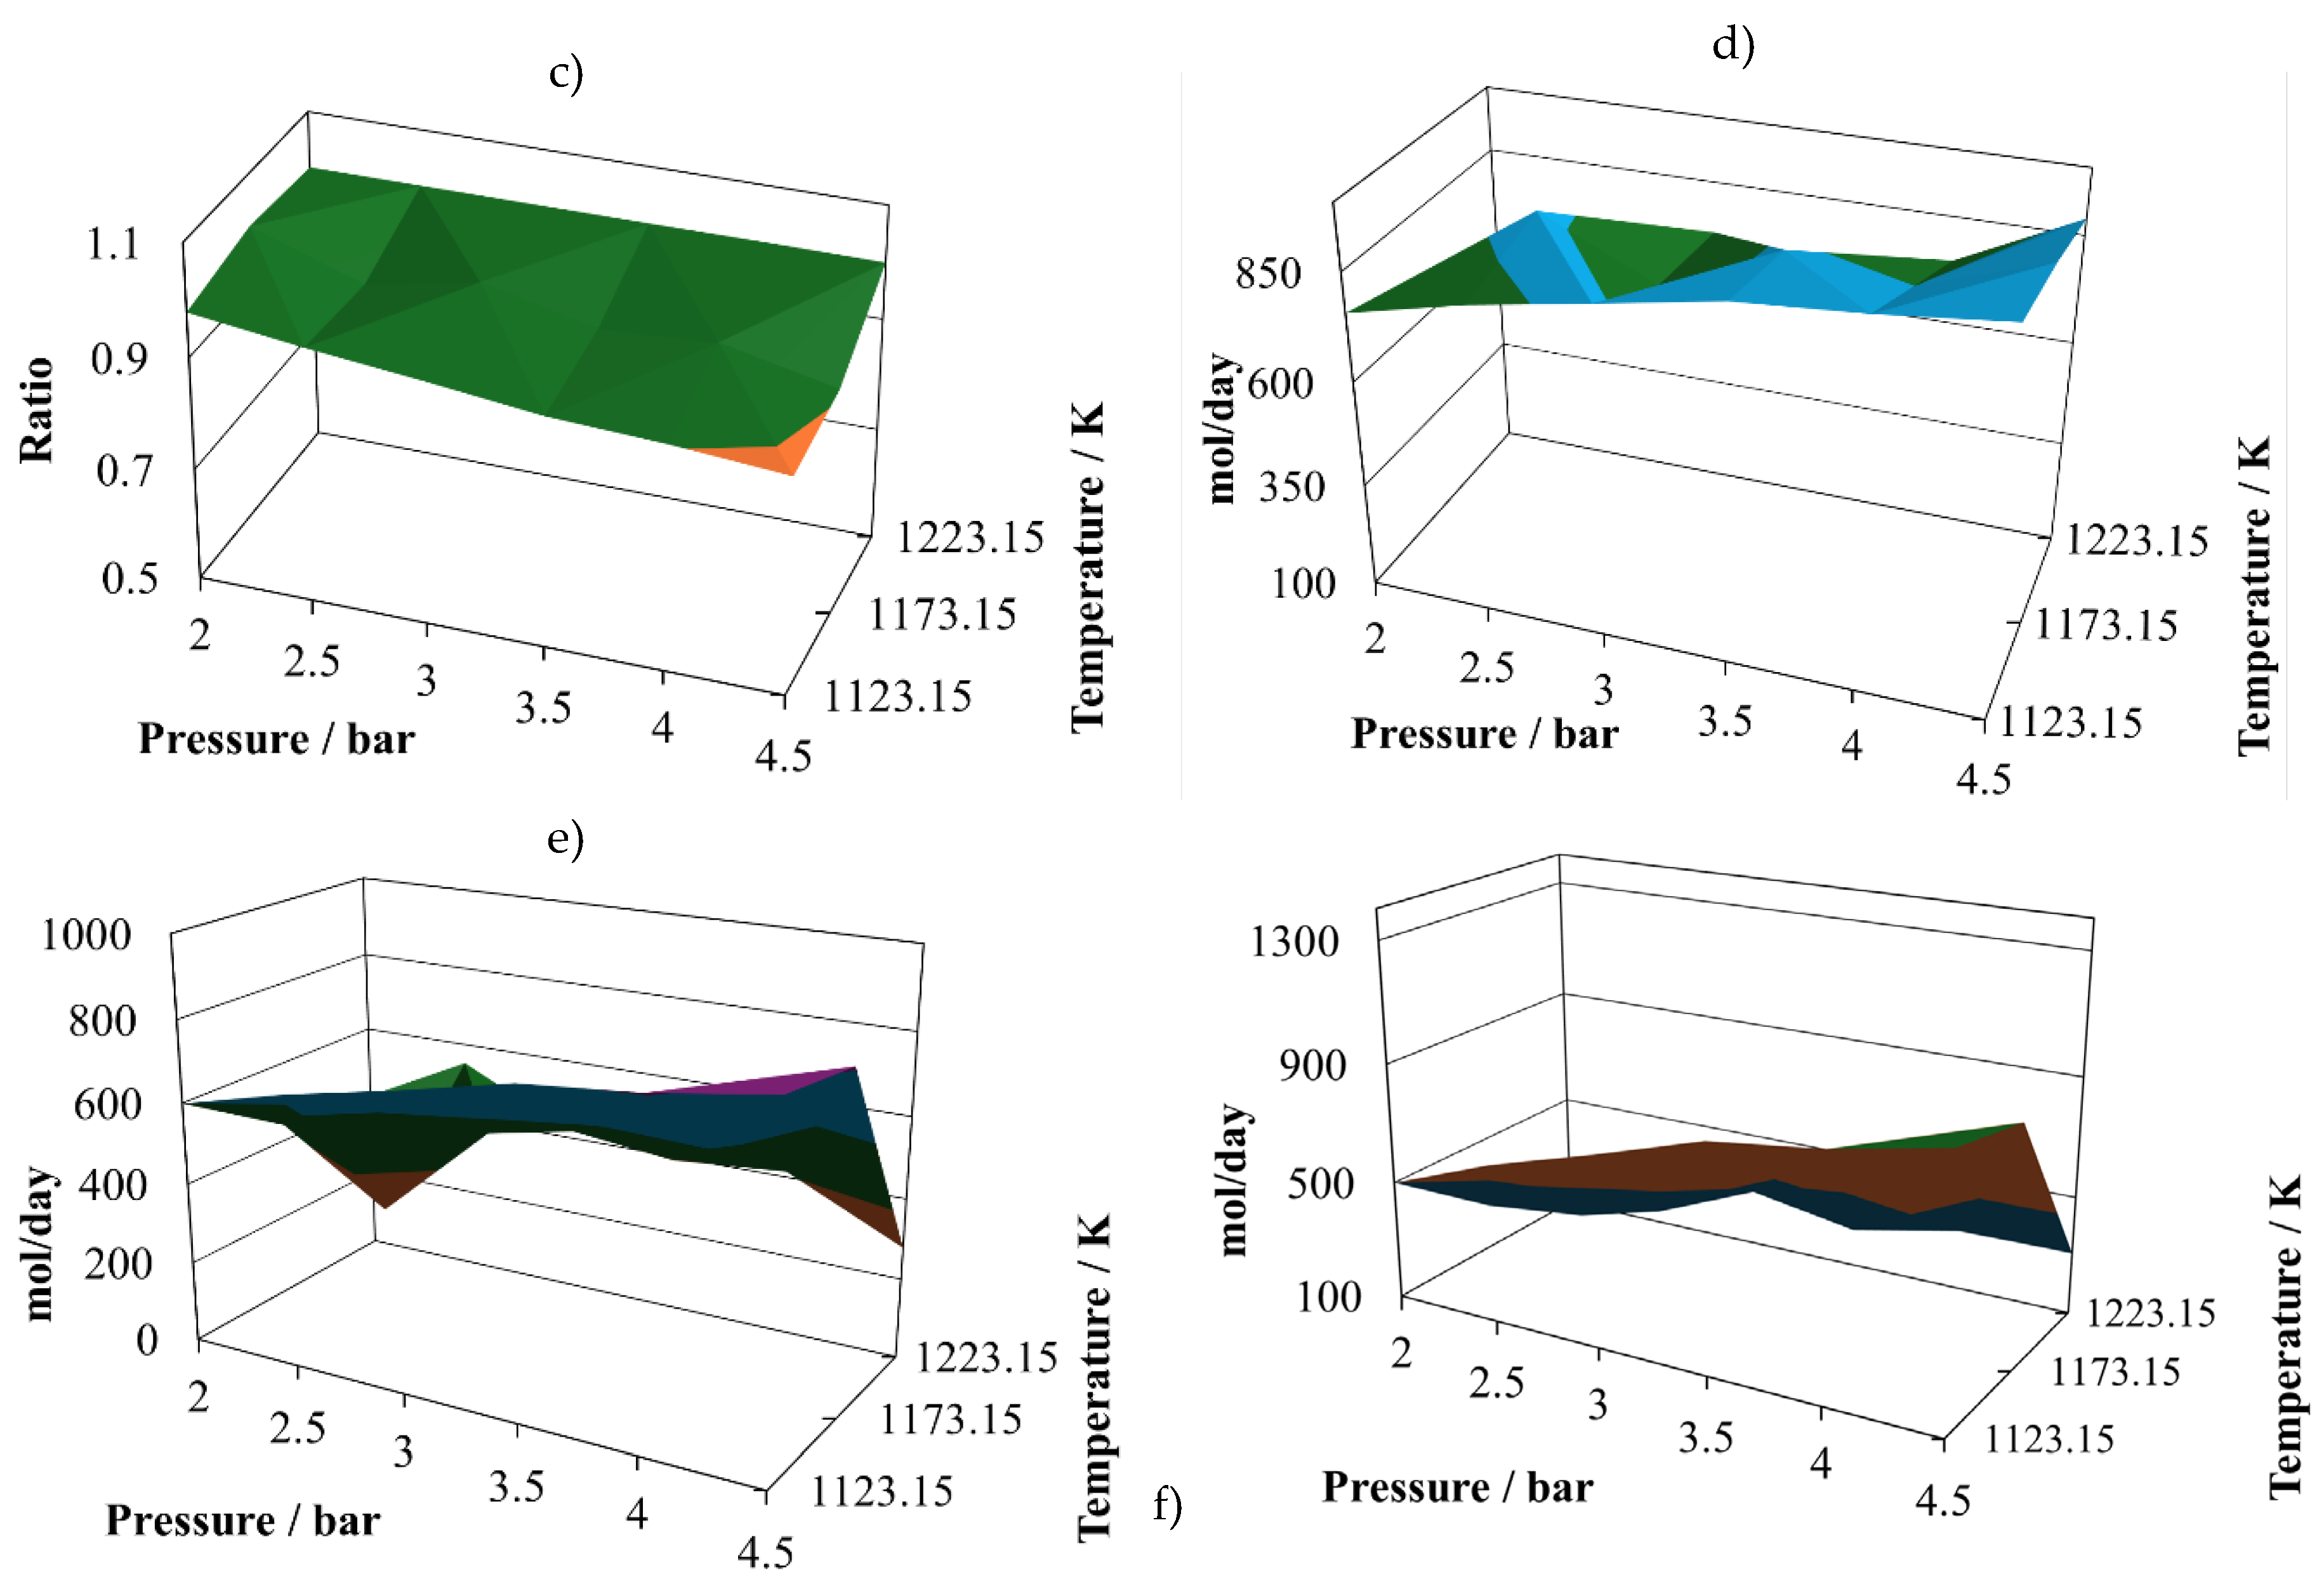
Figure 3.
Reactor effluent composition for the gasification of the mixture of 70 mol% bagasse and 30 mol% pine sawdust. a) Hydrogen. b) Carbon monoxide. c) (H2/CO) ratio. d) Water. e) Carbon dioxide. f) Methane.
Figure 3.
Reactor effluent composition for the gasification of the mixture of 70 mol% bagasse and 30 mol% pine sawdust. a) Hydrogen. b) Carbon monoxide. c) (H2/CO) ratio. d) Water. e) Carbon dioxide. f) Methane.
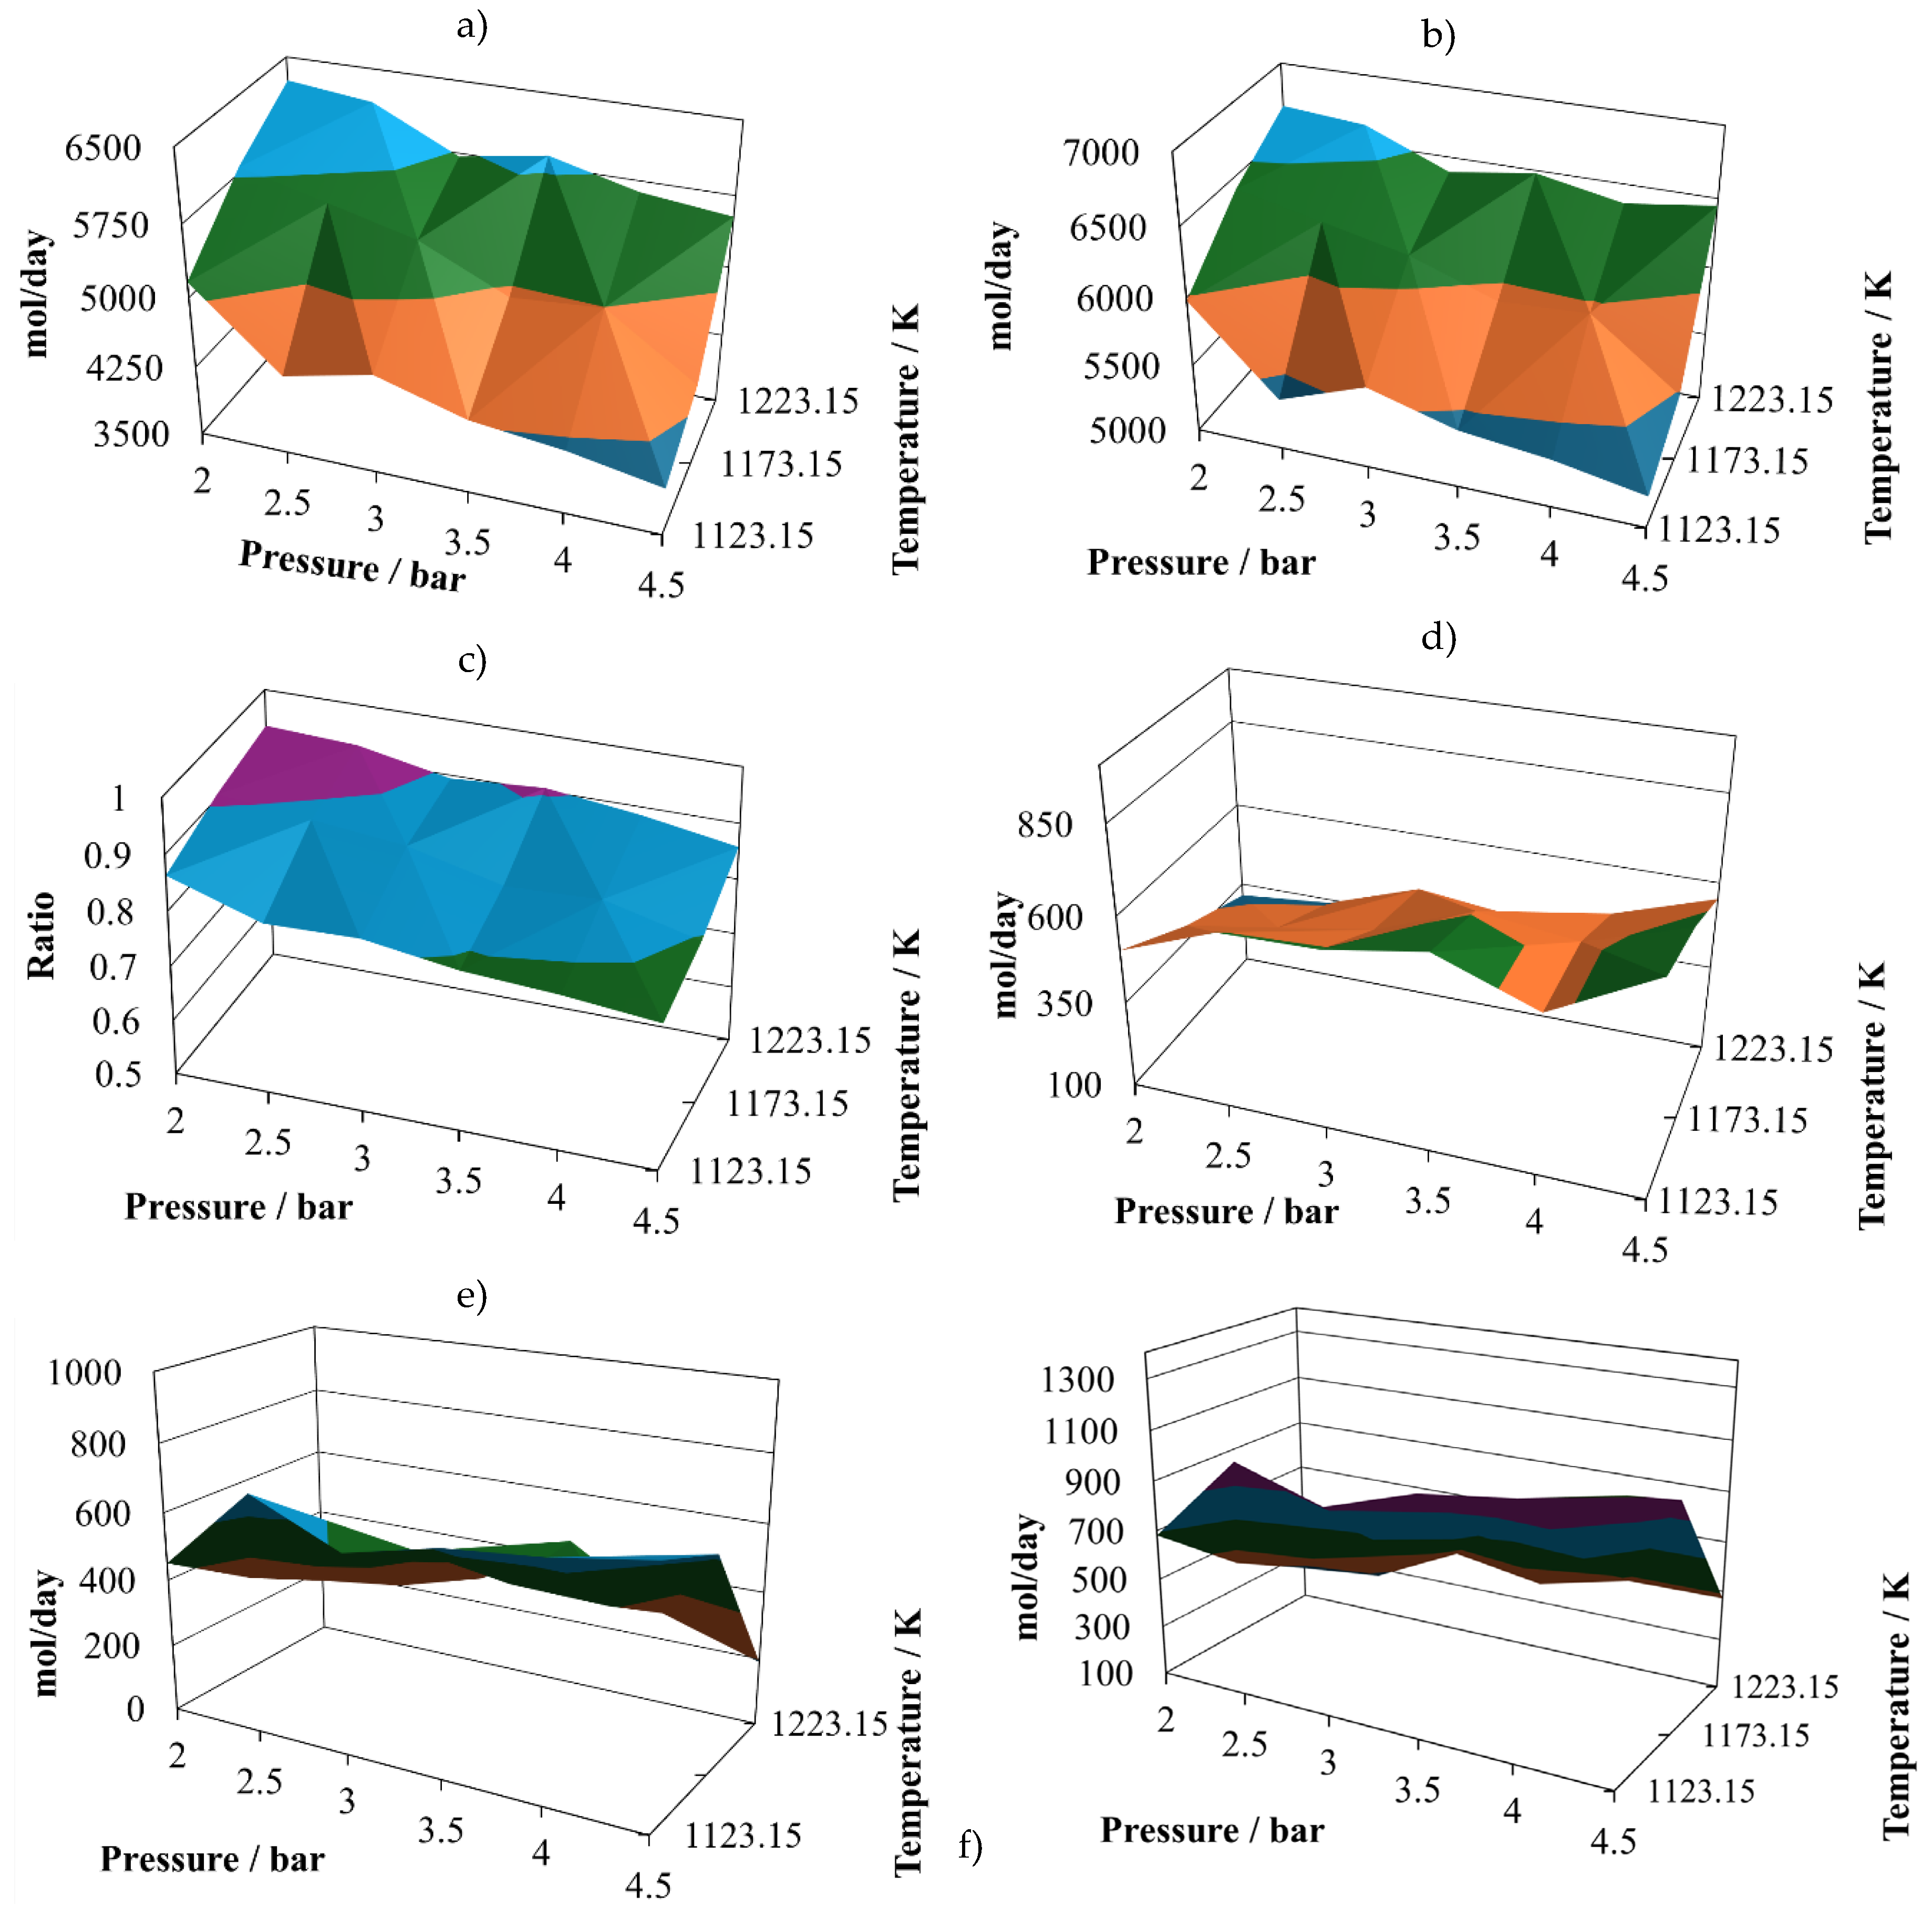
Figure 4.
Reactor effluent composition for the gasification of the mixture of 60 mol% bagasse and 40 mol% pine sawdust. a) Hydrogen. b) Carbon monoxide. c) (H2/CO) ratio. d) Water. e) Carbon dioxide. f) Methane.
Figure 4.
Reactor effluent composition for the gasification of the mixture of 60 mol% bagasse and 40 mol% pine sawdust. a) Hydrogen. b) Carbon monoxide. c) (H2/CO) ratio. d) Water. e) Carbon dioxide. f) Methane.
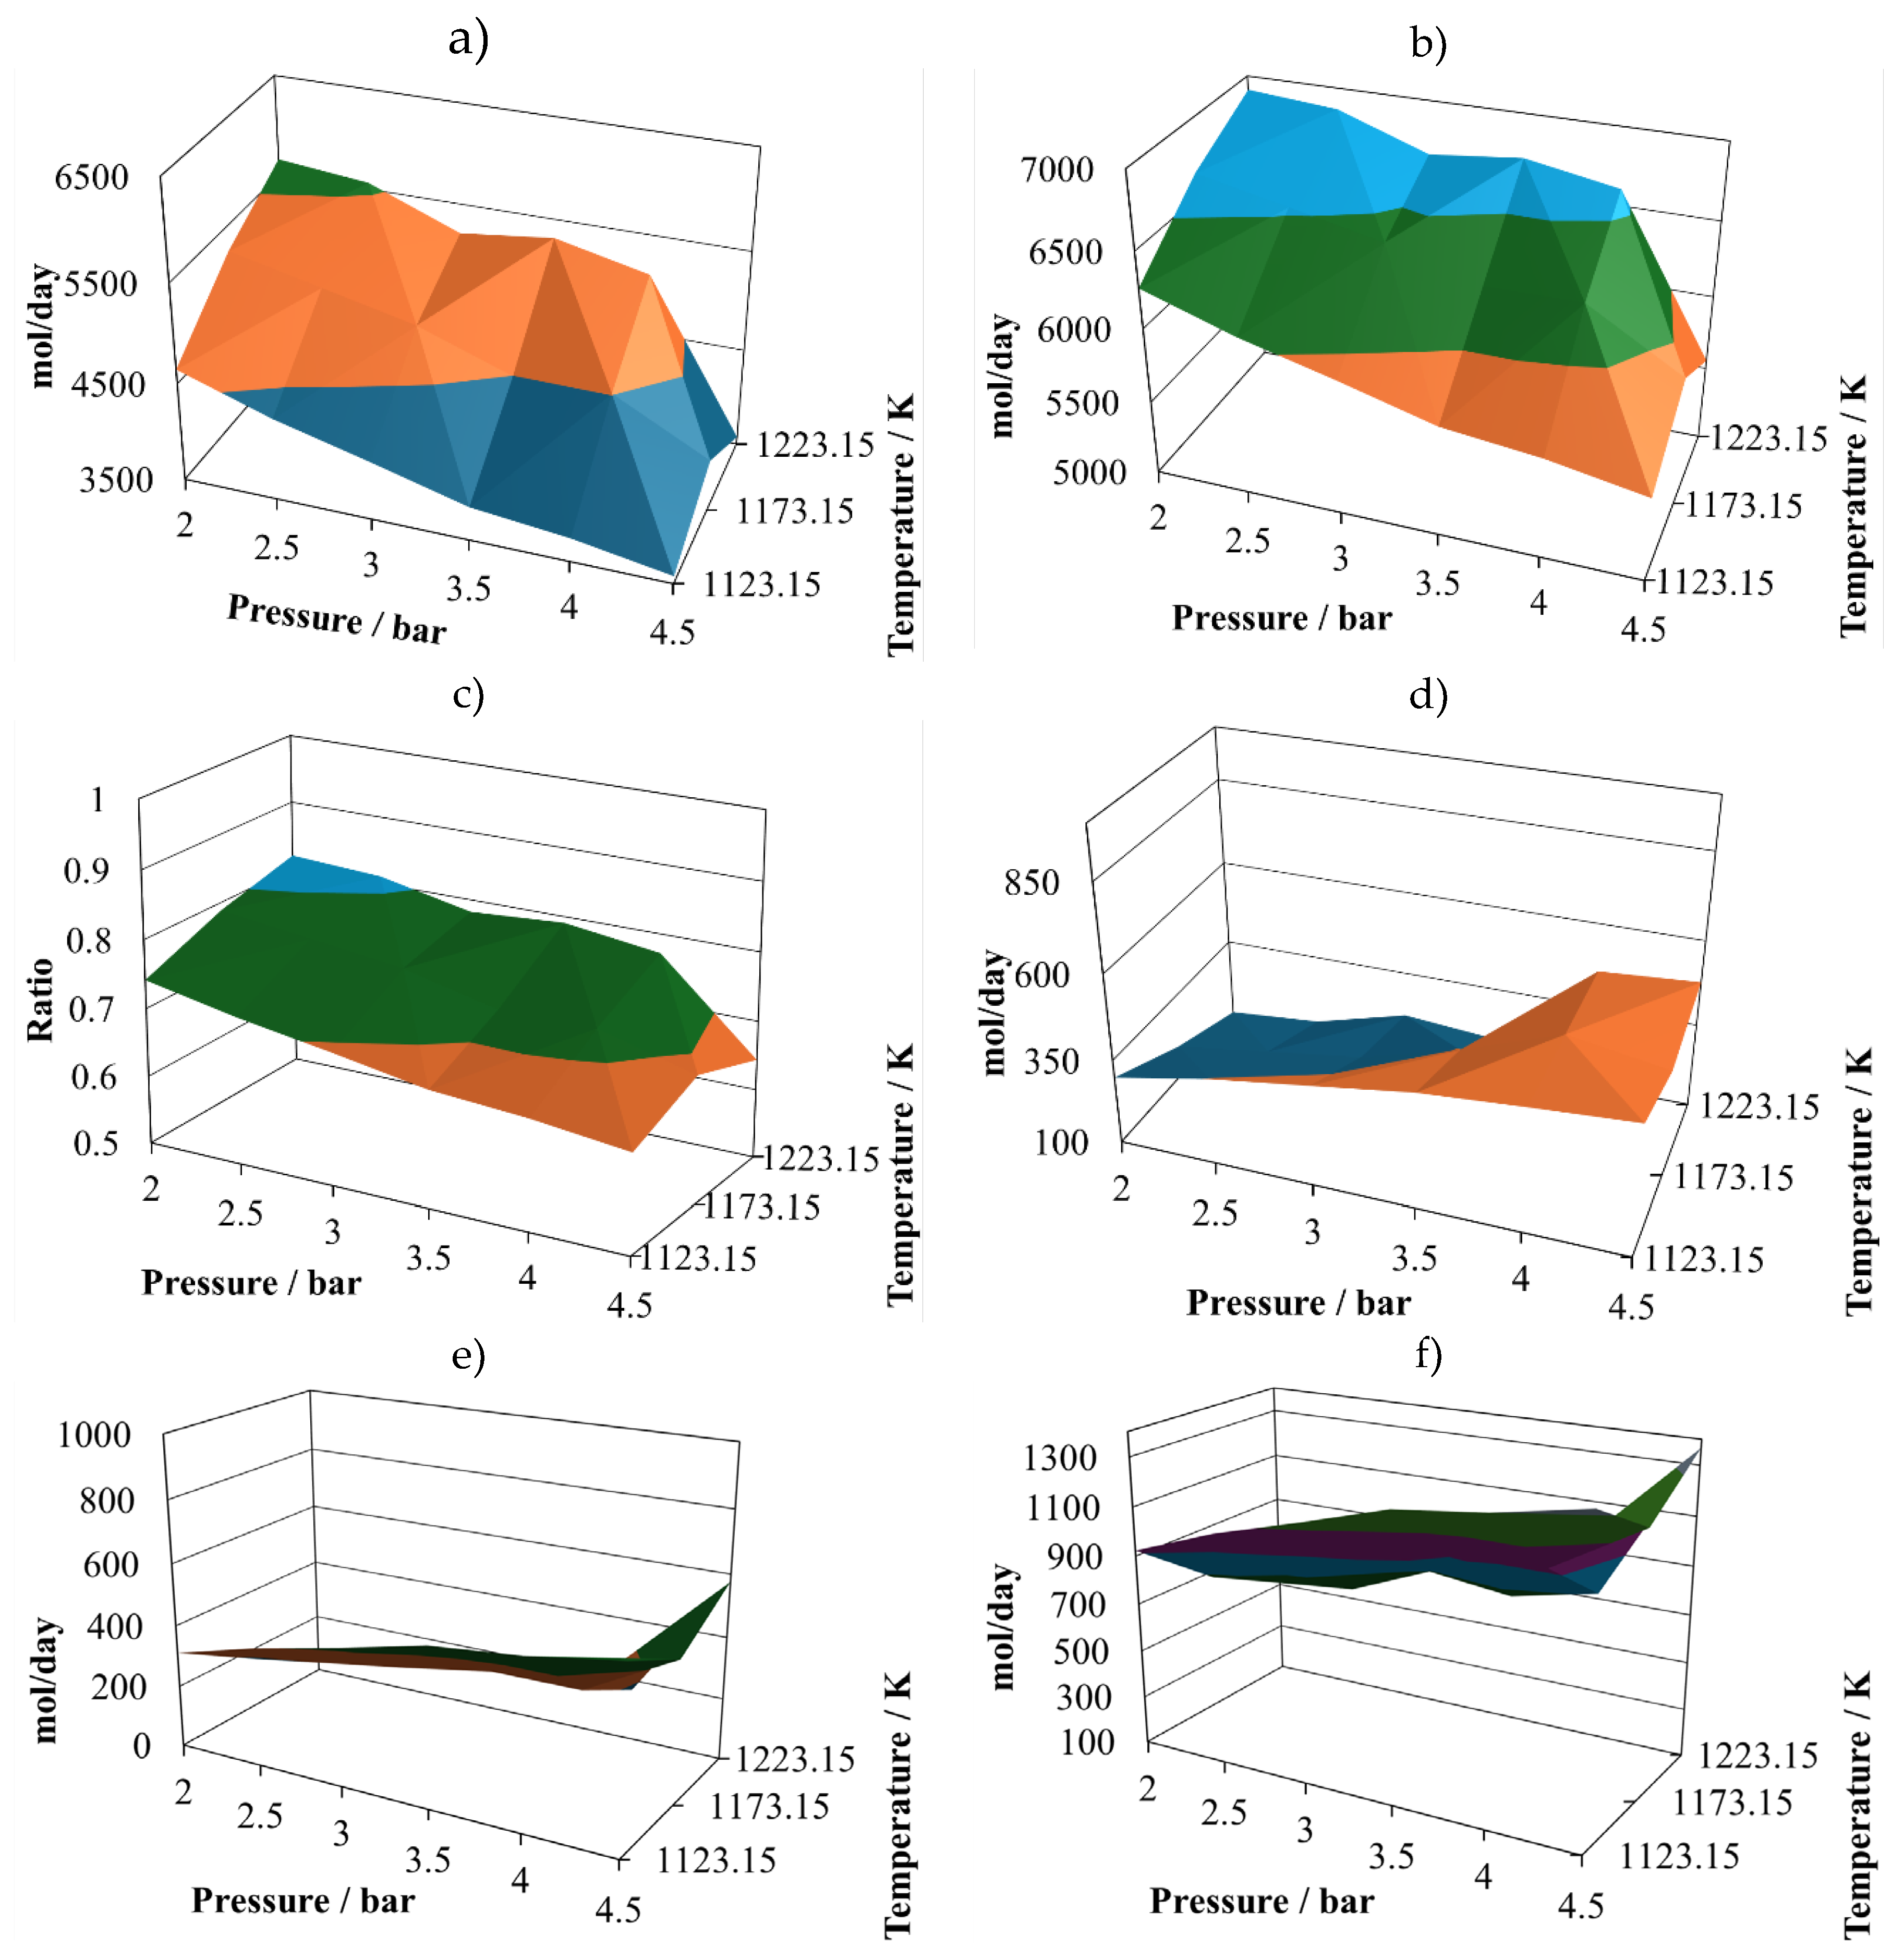
Figure 5.
Reactor effluent composition for the gasification of the mixture of 80 mol% bagasse and 20 mol% wheat straw. a) Hydrogen. b) Carbon monoxide. c) (H2/CO) ratio. d) Water. e) Carbon dioxide. f) Methane.
Figure 5.
Reactor effluent composition for the gasification of the mixture of 80 mol% bagasse and 20 mol% wheat straw. a) Hydrogen. b) Carbon monoxide. c) (H2/CO) ratio. d) Water. e) Carbon dioxide. f) Methane.
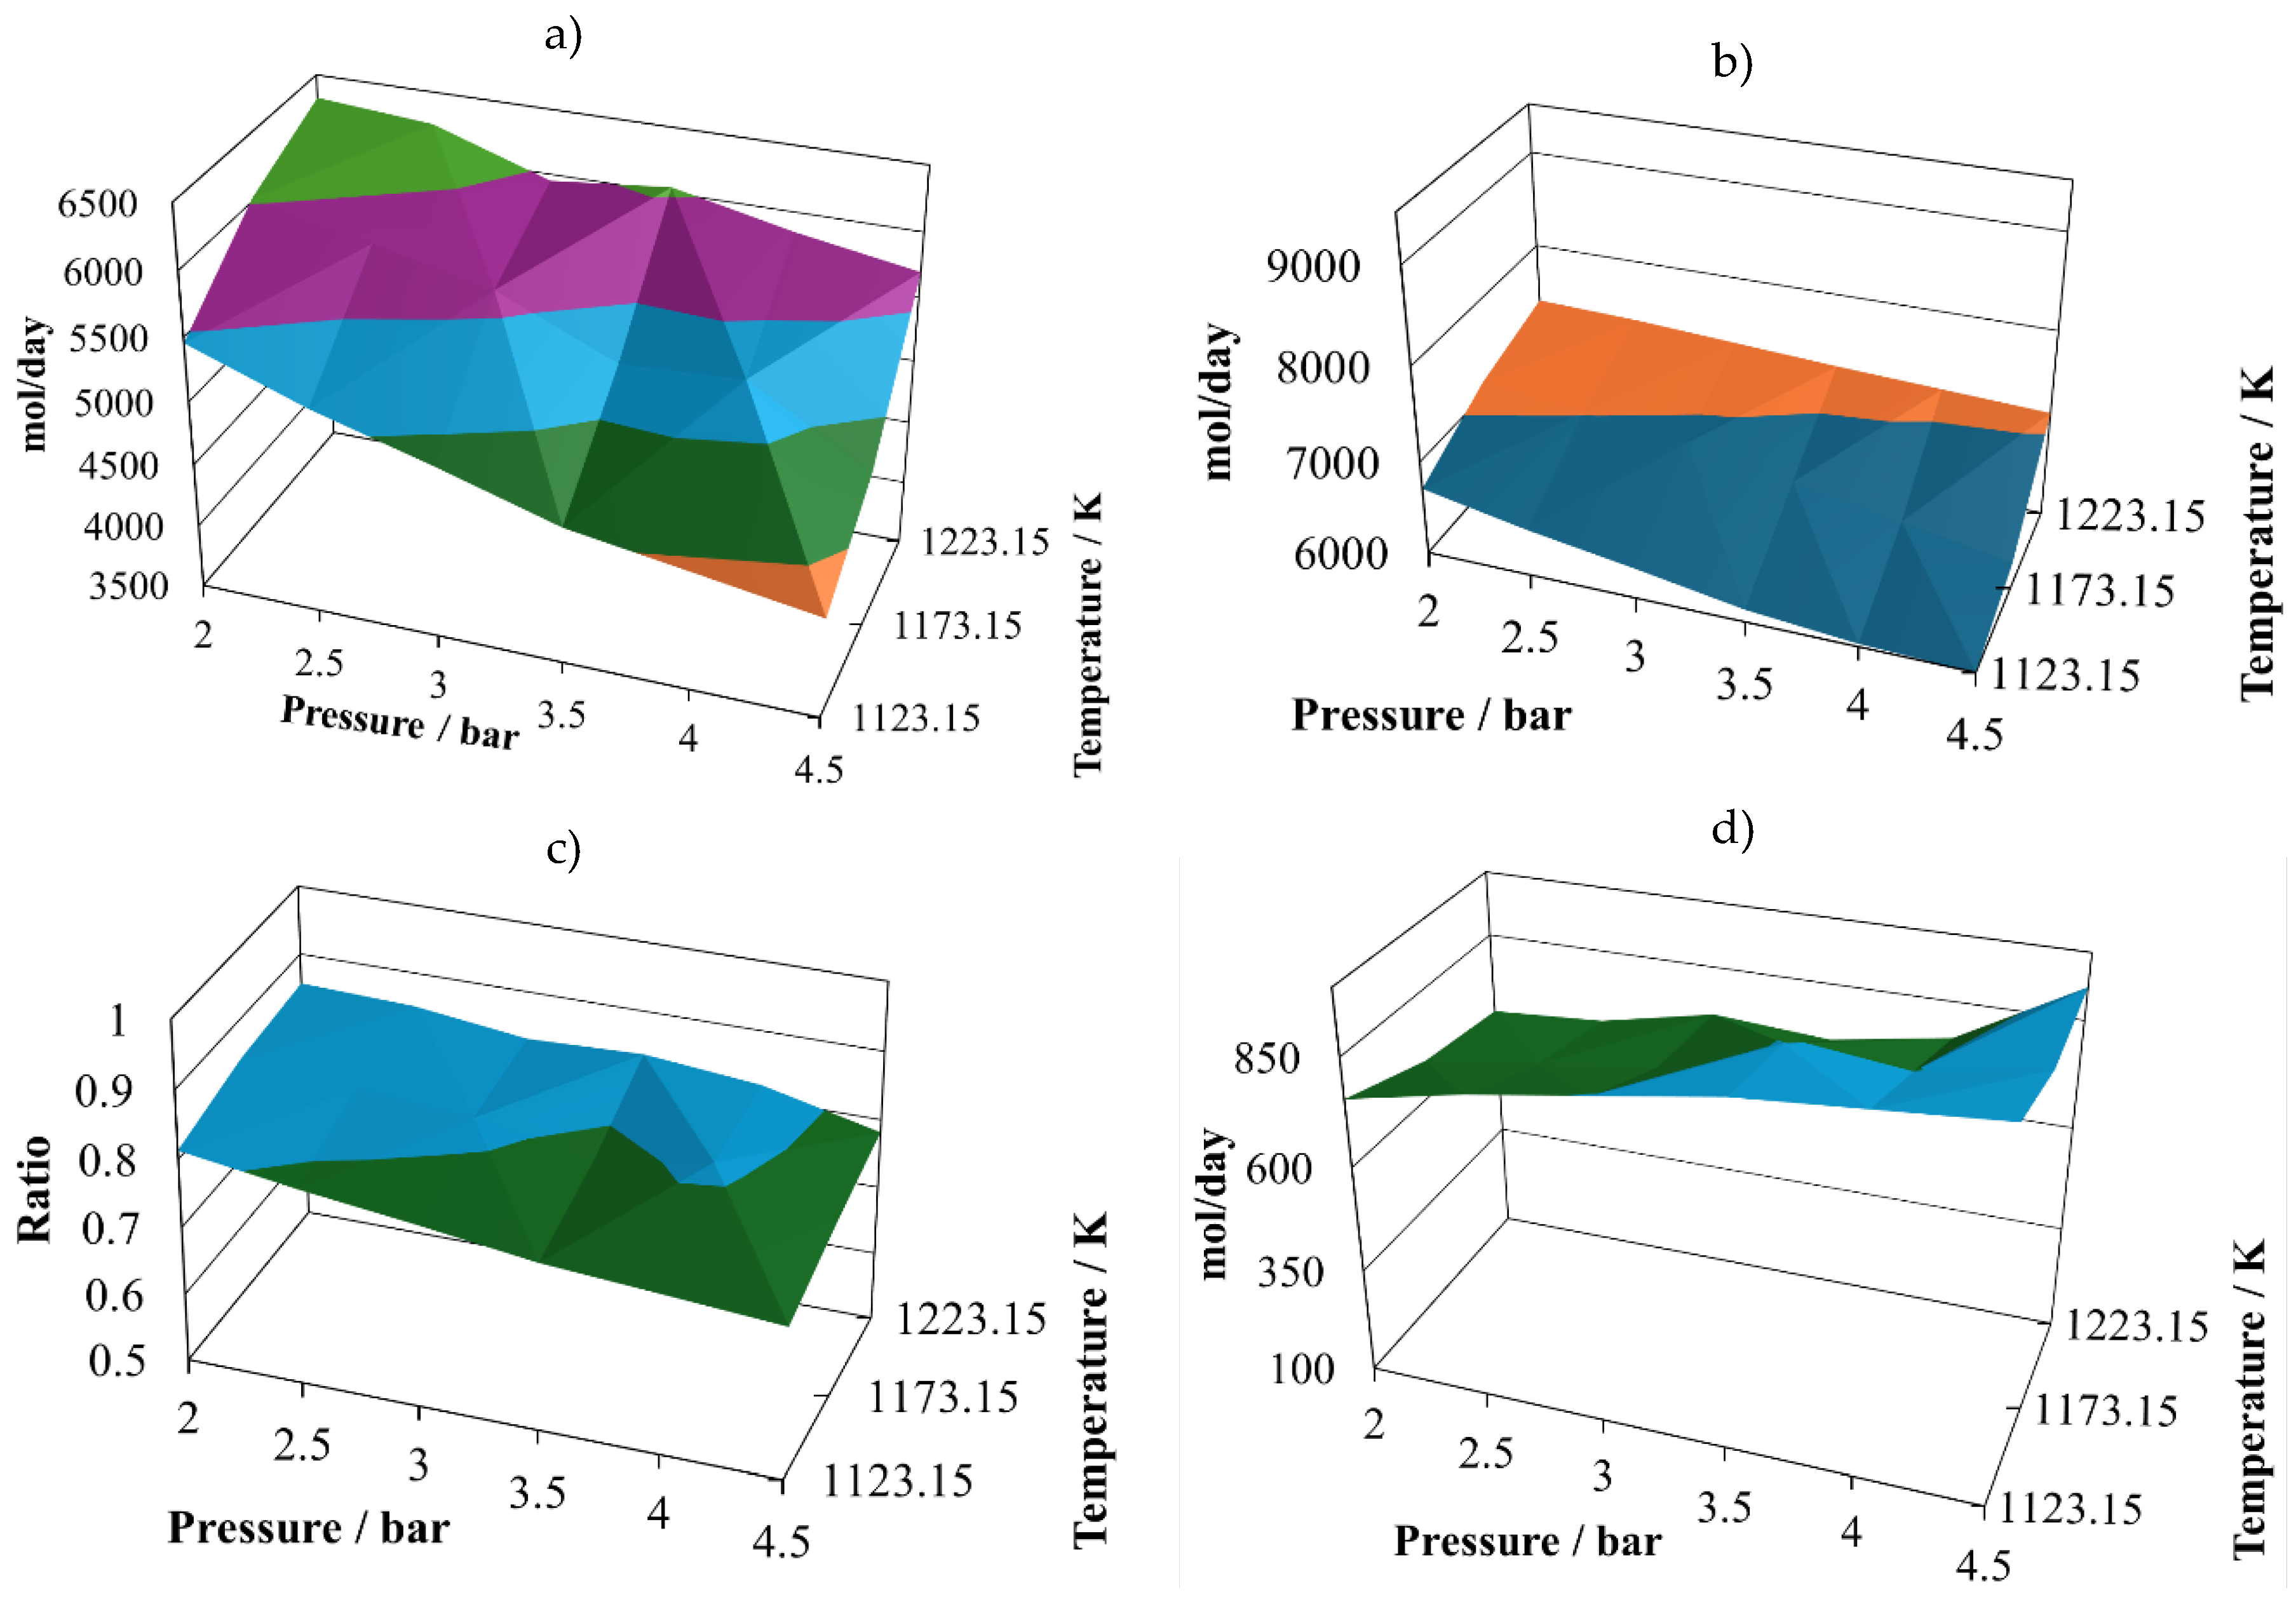
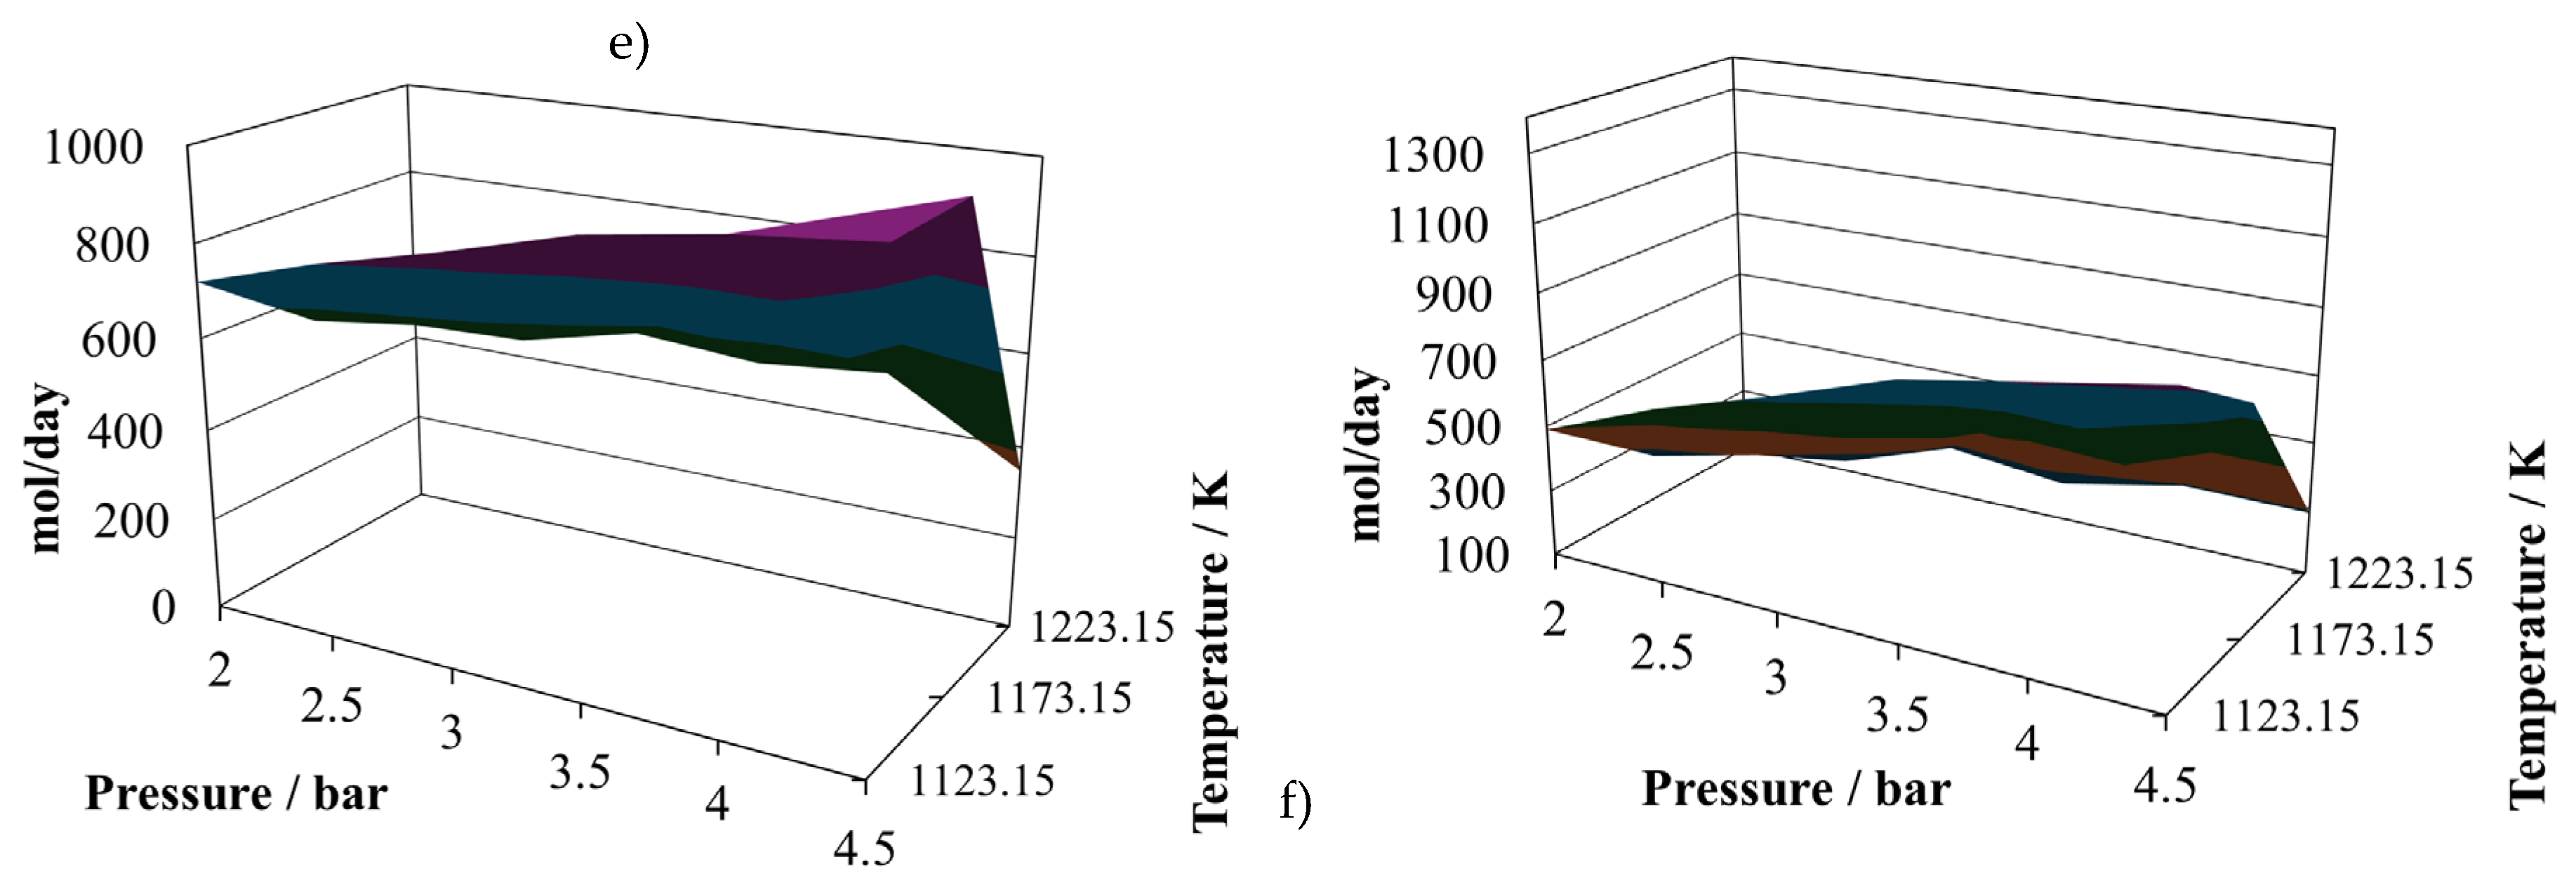
Figure 6.
Reactor effluent composition for the gasification of the mixture of 70 mol% bagasse and 30 mol% wheat straw. a) Hydrogen. b) Carbon monoxide. c) (H2/CO) ratio. d) Water. e) Carbon dioxide. f) Methane.
Figure 6.
Reactor effluent composition for the gasification of the mixture of 70 mol% bagasse and 30 mol% wheat straw. a) Hydrogen. b) Carbon monoxide. c) (H2/CO) ratio. d) Water. e) Carbon dioxide. f) Methane.
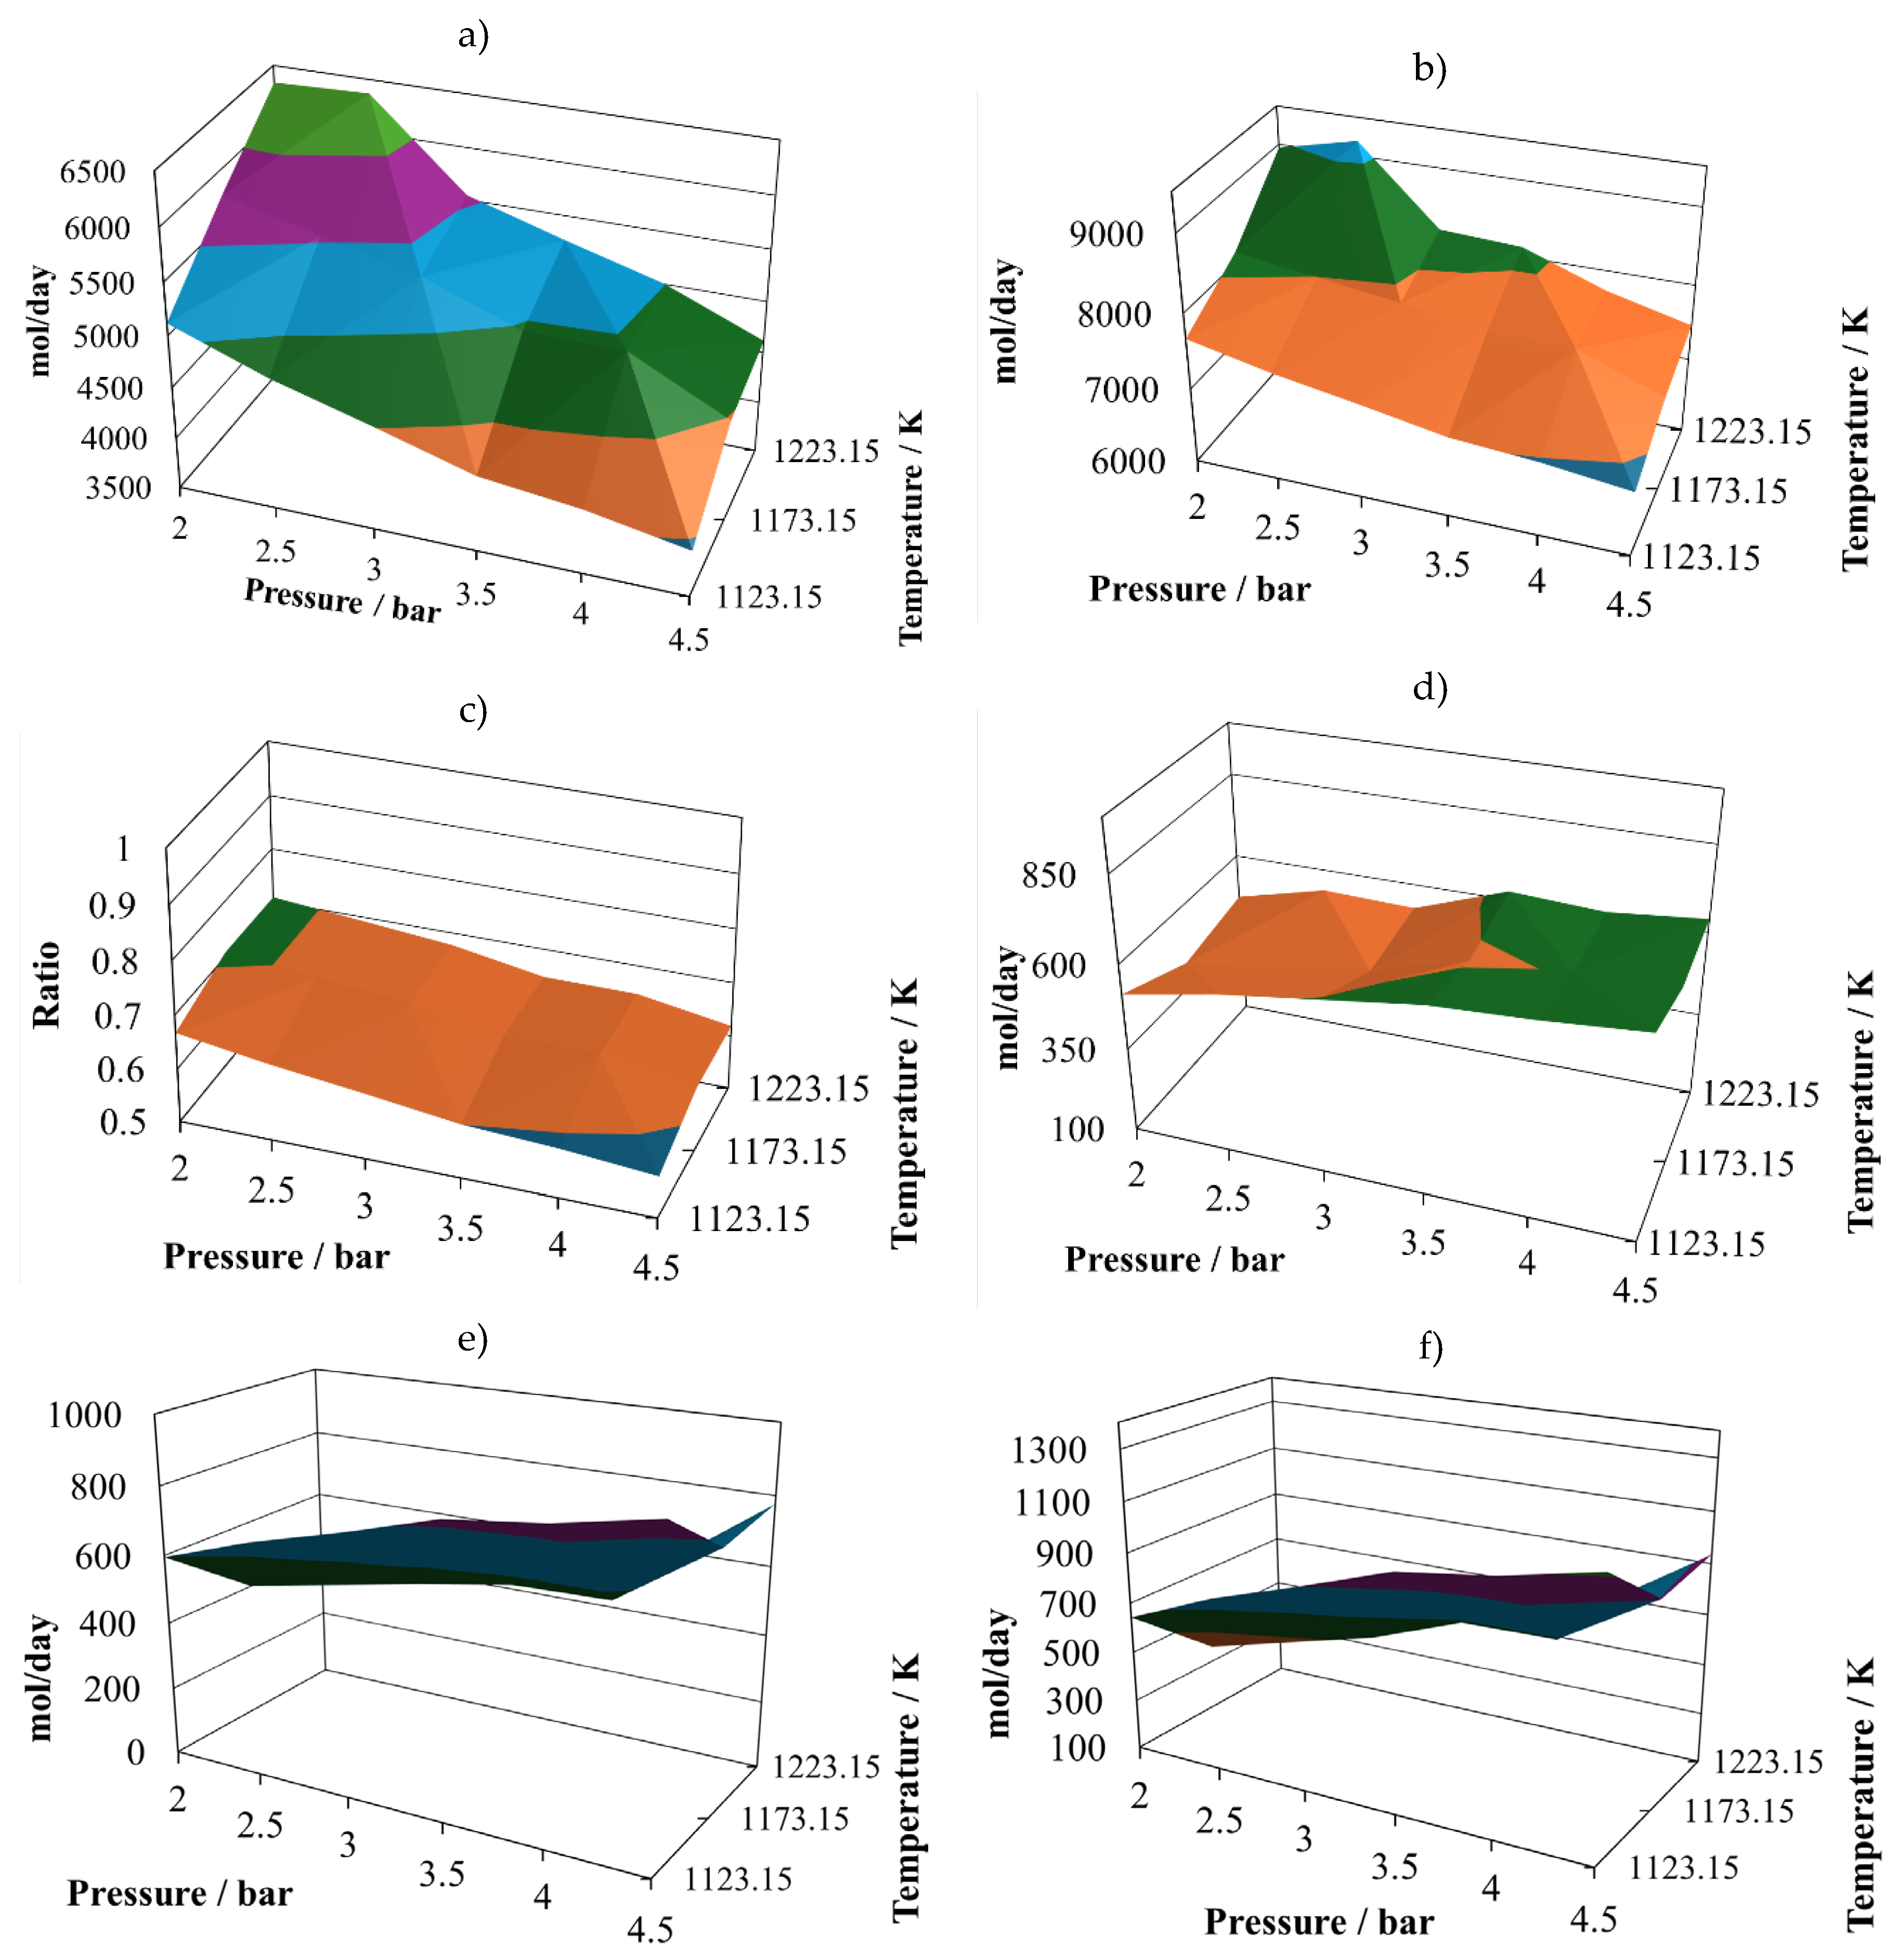
Figure 7.
Reactor effluent composition for the gasification of the mixture of 60 mol% bagasse and 40 mol% wheat straw. a) Hydrogen. b) Carbon monoxide. c) (H2/CO) ratio. d) Water. e) Carbon dioxide. f) Methane.
Figure 7.
Reactor effluent composition for the gasification of the mixture of 60 mol% bagasse and 40 mol% wheat straw. a) Hydrogen. b) Carbon monoxide. c) (H2/CO) ratio. d) Water. e) Carbon dioxide. f) Methane.
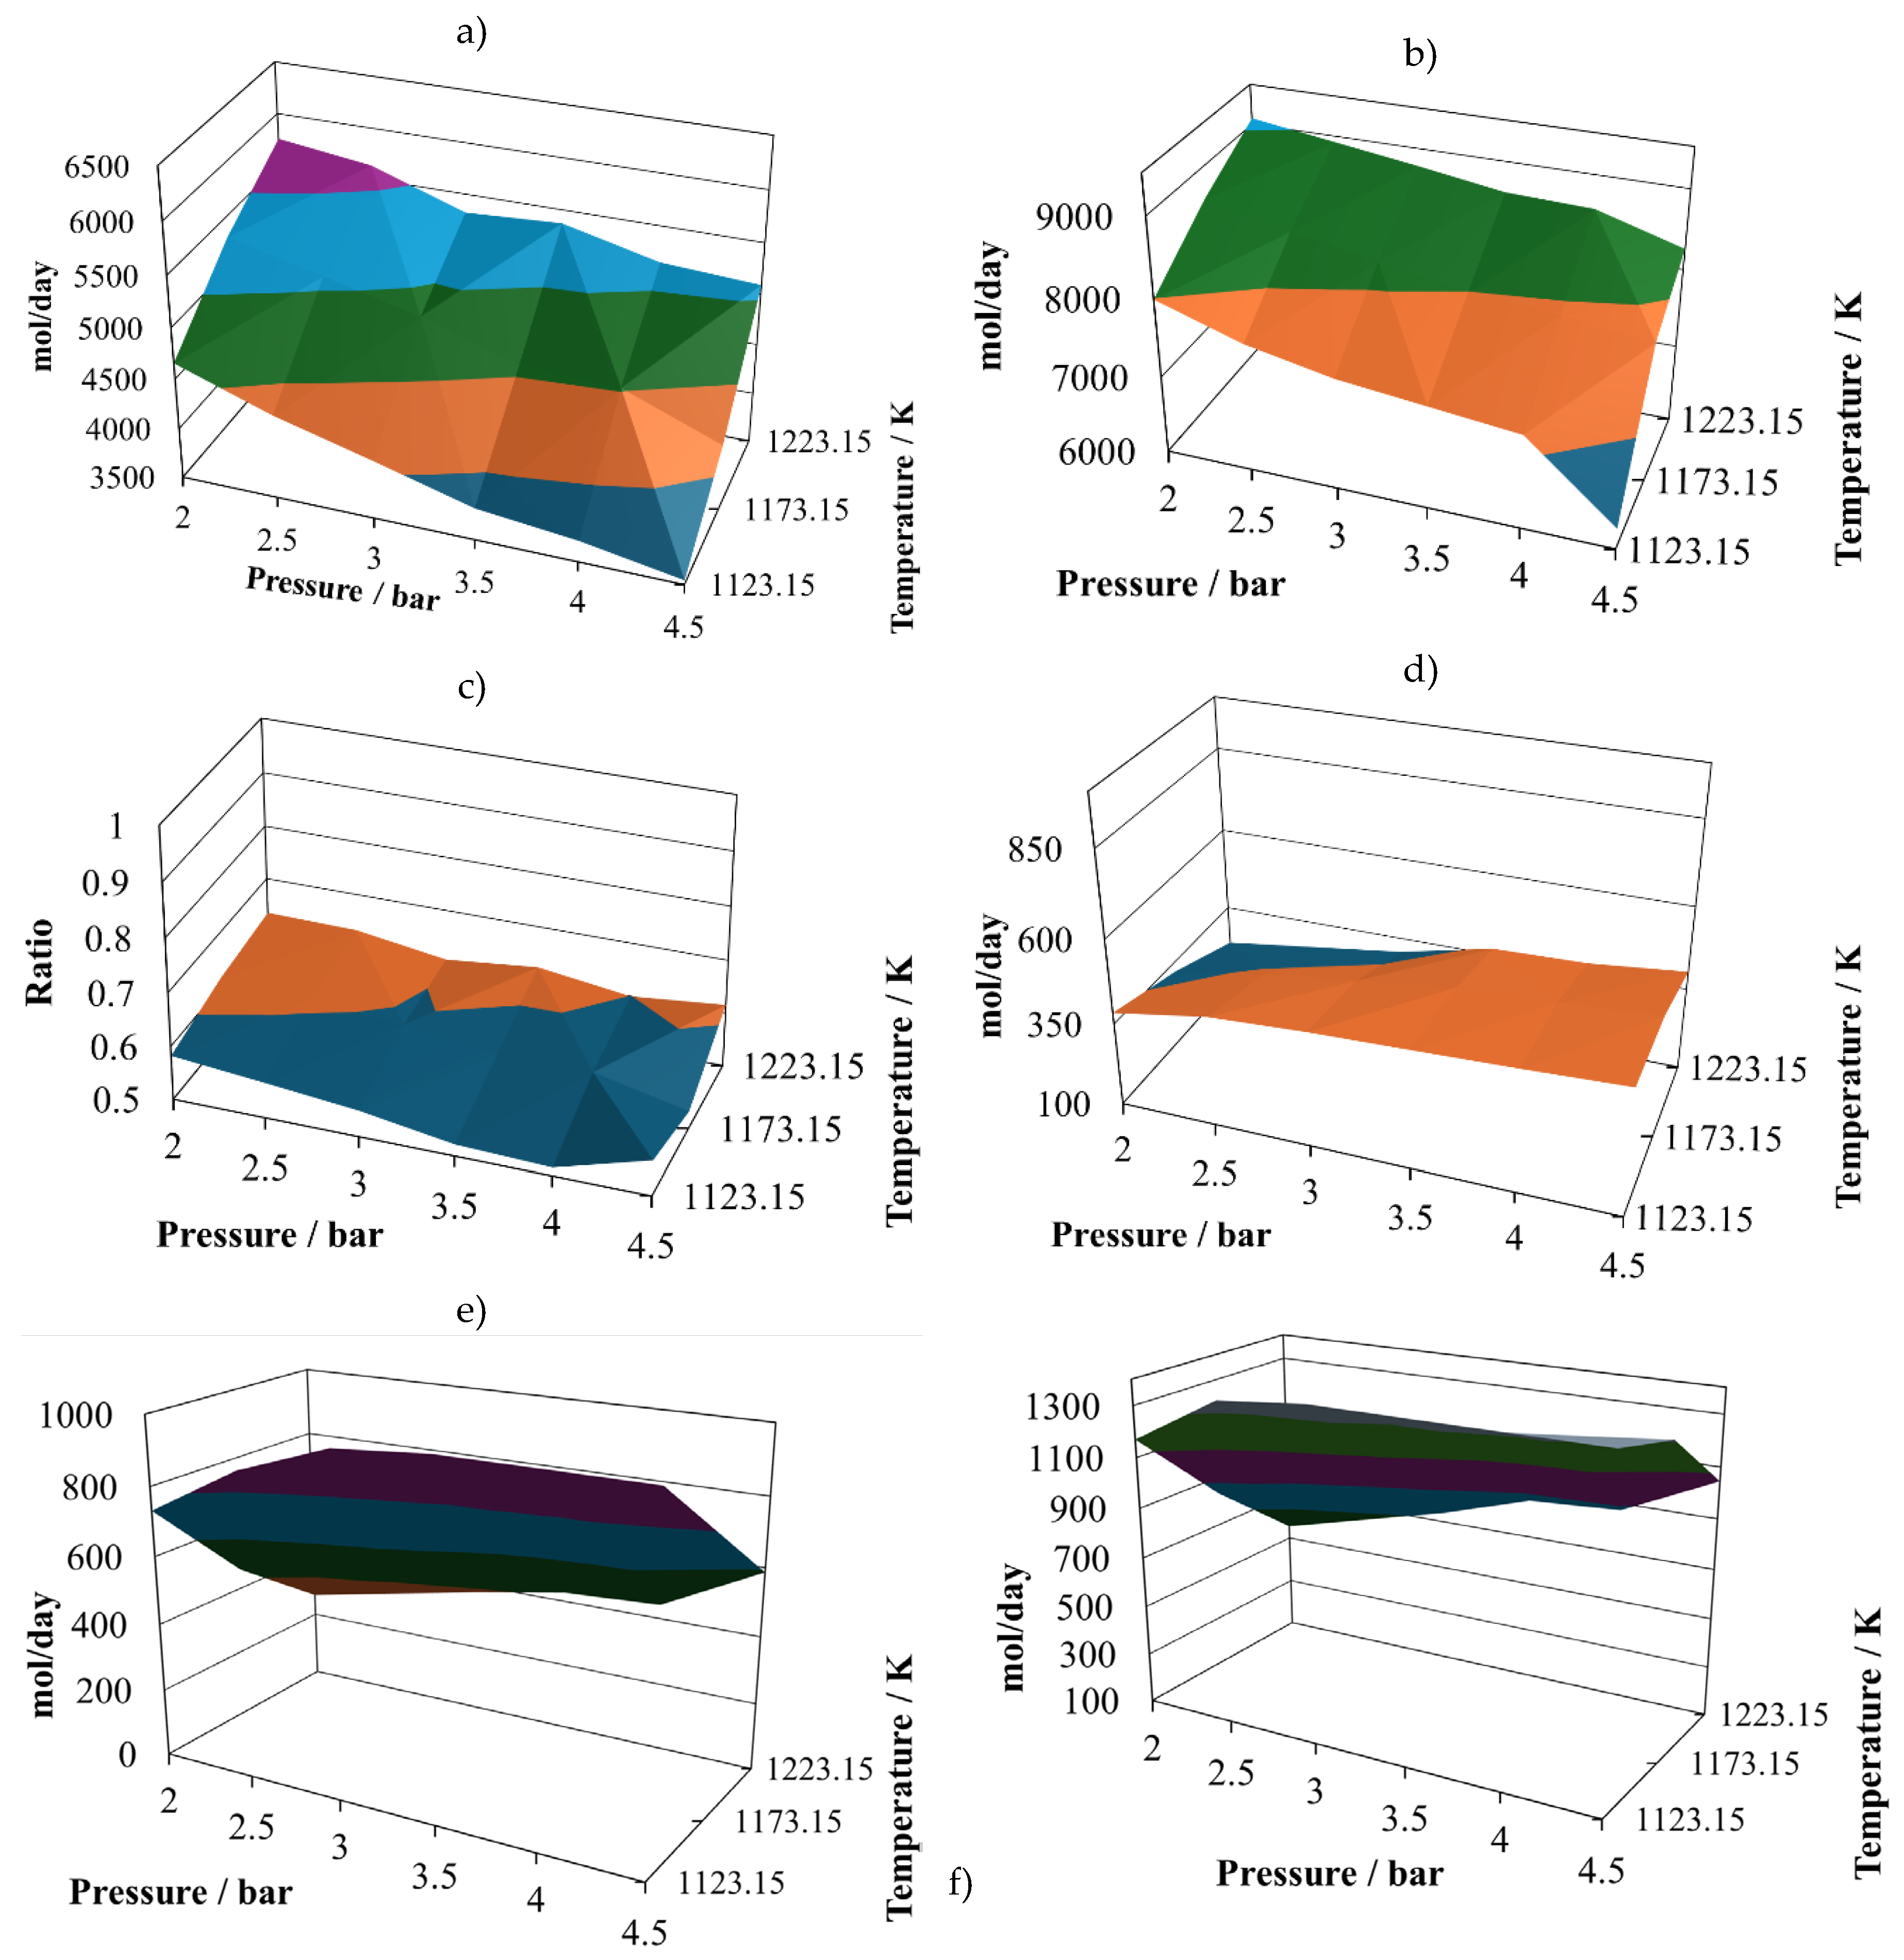

Table 1.
Substrates characterisation.
| Substrate | DP | Empiric unitary cell formulae | MWash (Da)/ |
|---|---|---|---|
| Cane bagasse | 925 | 5993/ 50 |
|
| Pine sawdust | 1450 | 707/ 8.6 |
|
| Wheat straw | 2660 | 43532/ 7.6 |
Table 2.
Atoms in the mixture proportion 8:2.
| C | H | O | N | S | |
|---|---|---|---|---|---|
| Atoms | 6722 | 15793 | 7831 | 57 | 19 |
Table 3.
Atoms in the mixture proportion 7:3.
| C | H | O | N | S | |
|---|---|---|---|---|---|
| Atoms | 7110 | 15924 | 7760 | 66 | 17 |
Table 4.
Atoms in the mixture proportion 6:4.
| C | H | O | N | S | |
|---|---|---|---|---|---|
| Atoms | 7498 | 16054 | 7687 | 76 | 15 |
Table 5.
Atoms in the mixture proportion 8:2.
| C | H | O | N | S | |
|---|---|---|---|---|---|
| Atoms | 7920 | 16744 | 8906 | 67 | 24 |
Table 6.
Atoms in the mixture proportion 7:3.
| C | H | O | N | S | |
|---|---|---|---|---|---|
| Atoms | 8907 | 17350 | 9371 | 82 | 24 |
Table 7.
Atoms in the mixture proportion 6:4.
| C | H | O | N | S | |
|---|---|---|---|---|---|
| Atoms | 9894 | 17956 | 9836 | 97 | 25 |
Disclaimer/Publisher’s Note: The statements, opinions and data contained in all publications are solely those of the individual author(s) and contributor(s) and not of MDPI and/or the editor(s). MDPI and/or the editor(s) disclaim responsibility for any injury to people or property resulting from any ideas, methods, instructions or products referred to in the content. |
© 2024 by the authors. Licensee MDPI, Basel, Switzerland. This article is an open access article distributed under the terms and conditions of the Creative Commons Attribution (CC BY) license (http://creativecommons.org/licenses/by/4.0/).
Copyright: This open access article is published under a Creative Commons CC BY 4.0 license, which permit the free download, distribution, and reuse, provided that the author and preprint are cited in any reuse.


