
Submitted:
29 September 2024
Posted:
30 September 2024
You are already at the latest version
Abstract
Thurstonian scaling, i.e., Thurstonian discriminal distance δ or d' can be used as a sensory measurement index to measure and monitor food sensory difference/similarity between test and control samples due to potential food contamination. It can be obtained from any one of the sensory discrimination methods. Thurstonian scaling is theoretically independent of methods or scales used for its estimation. This paper discusses statistical inference including estimations and tests of hypothesis for d'. Ten basic sensory discrimination methods including 6 forced-choice methods and 4 methods with response bias are used in this paper to estimate d' values and their variances. Statistical tests are conducted based on the estimated d' values and their variances. The statistical tests include difference testing and equivalence/similarity testing for individual d' values for test and control samples and for two or multiple d' values for test samples. Application and significance of Thurstonian scaling for sensory discrimination methods is discussed generally. R codes for estimations and tests for d' values are provided in the paper.
Keywords:
sensory discrimination methods
; Thurstonian discriminal distance d'
; statistical inference for d'
; difference testing
; equivalence/similarity testing
1. Introduction
Contamination may lead to changes of food sensory properties and consumers’ sensory perceptions. Sensory discrimination methods can be used to detect the sensory difference/similarity of samples.
Sensory discrimination methods are an important methodology of Sensory and Consumer Science. For more about sensory discrimination methods, see, e.g., Meilgaard et al. [1], Lawless and Heymann [2], Stone et al. [3], Rogers [4], Rogers et al. [5], and various ASTM Standards about sensory discrimination methods (see ASTM [6]).
Thurstonian scaling, i.e., Thurstonian discriminal distance δ or , which can be regarded as an estimator of δ, provides a unified framework for the sensory discrimination methods. Thurstonian discriminal distance can be estimated from a Thurstonian model, i.e., a psychometric function for any one of the sensory discrimination methods and can be used as a unique sensory measurement index. An advantage of is that it is theoretically independent of methods or scales used for its estimation. “As such, δ provides a common scale of measure for comparing samples measured under a variety of test conditions.” (ASTM-E2262 [7]).
For more details about Thurstonian models of sensory discrimination methods, see, e.g., Thurstone [8], Ura [9], David and Trivedi [10], Bradley [11], Frijters [12,13], Ennis et al. [14], Ennis [15,16], Ennis and Rousseau [17], Bi et al. [18], Bi [19,20,21,22,23,24,25,26], Bi and O’Mahony [27], Bi and Kuesten [28,29,30,31,32,33,34,35], Bi et al. [36,37,38,39,40,41,42,43,44], Brockhoff and Christensen [45], Ennis [46], Ennis and Christenson [47], Ennis et al. [48], Rousseau and O’Mahony [49], Rousseau and Ennis [50]. Signal Detection Theory (SDT) is also an important theoretical source of Thurstonian models of sensory discrimination methods. For the SDT, see, e.g., Green and Swets [51], Macmillan and Creelman [52], and Hautus et al. [53]. The R package ‘sensR’ (Christensen, et al. [54]) provides R programs for calculations of values from some basic sensory discrimination methods.
The main objectives of this paper include: 1). To estimate and its variance from some basic sensory discrimination methods; 2). To conduct statistical testing including difference testing and equivalence/similarity testing for individual for a test sample and a control sample in a sensory discrimination method; 3). To conduct statistical testing including difference testing, equivalence/similarity testing, and multiple comparisons for multiple values for multiple test samples. 4). To discuss generally application and significance of Thurstonian scaling for sensory discrimination methods. 5). To develop and provide corresponding R codes using R programs (R Core Team [55]) in Appendix A in the Supplementary Materials in the online version of this paper.
2. Materials and Methods
2.1. Estimating Values and Their Variances from Psychometric Functions of Some Basic Sensory Discrimination Methods
Thurstonian scaling, i.e., Thurstonian discriminal distance or can be derived from the Thurstonian models, i.e., psychometric functions of sensory discrimination methods. Any sensory discrimination method should have its unique psychometric function. The psychometric functions for the forced-choice methods describe the relationship between δ and the probability of correct response, Pc. The psychometric functions for the methods with response bias describe the relationship between δ and probabilities of hit and false alarm. The probability of hit is the probability of response “A” for sample A in the A–Not A method, or the probability of response “same” for the matched sample pair in the Same–Different method. The probability of false alarm is the probability of response “A” for sample Not A in the A–Not A method, or the probability of response “same” for the unmatched sample pair in the Same–Different method.
Thurstonian models, i.e., psychometric functions can be derived theoretically based on different decision rules and/or be produced by simulations. Ennis [46] developed a simulation-derived psychometric function for the “Two-out-of-Five” method. Bi et al. [38] developed the simulation-derived psychometric functions for various forced-choice sensory discrimination methods, i.e., “M+N” methods.
Estimation of variances of estimators is another important topic for Thurstonian modeling. With the estimated and its variance, statistical testing for or is possible. Bi et al. [18] is probably the first in the sensory literature to discuss the topic. The B-values in ASTM-E2262 [7] for the forced-choice methods are adapted from Bi et al. [18]. Bi [20] originally derived the variance of for the same-different method. Bi and O’Mahony [27] also originally derived the variances of for the specified and unspecified tetrads. Bi [23] (section 3.4) describes three general approaches for estimation of variance of . They are 1). The bootstrap method, 2). The delta method, and 3). Using some S-Plus (Insightful 2001) built-in functions and R packages, e.g., the R package “numDeriv” (Gilbert & Varadhan [56]), based on the Hessian of the log-likelihood function evaluated at the maximum-likelihood estimation.
Table 1 lists ten (10) basic sensory discrimination methods and corresponding R codes. The methods include three (3) specified forced-choice methods, i.e., the 2-AFC, the 3-AFC, and the specified tetrad; three (3) unspecified forced-choice methods, i.e., the triangle, the duo-trio, and the unspecified tetrad; four (4) methods with response bias, i.e., the A-Not A, the same-different, the ratings of A-Not A, and the ratings of same-different. The last two methods can be regarded as two versions of the degree of difference (DOD) method.
ASTM-E2262 [7] provides the values and corresponding B-values (note: variance =B/n, where n is the sample size) for four forced-choice methods (i.e., the triangle, the duo-trio, the 3-AFC, and the 2-AFC) and two methods with response bias (i.e., the A-Not A and the same-different methods). Ennis et al. [57] provide the values for the specified and unspecified tetrads. Bi and O’Mahony [27] provide variances of for the specified and unspecified tetrads. Bi et al. [37] provide the values and their variances for the ratings of the A-Not A, the ratings of A-Not AR, and the ratings of the same-different methods and regard them as three versions of the degree of difference (DOD) method. Ennis and Rousseau [17] and Ennis and Christensen [47] provide a version of the DOD based on the ratings of the same-different method.
The input of the R codes for all the 6 forced-choice methods are: x, n, i.e., the number of correct responses (x) and the number of sample size (n).
The input of the R code for the A-Not A are: a, an, n, nn, i.e., the number of response “A” for sample A (a), sample size of sample A (an), the number of response “A” for sample Not A (n), and sample size of sample Not A (nn).
The input of the R code for the same-different are: sn,n1,dn,n2, i.e., the number of response “Same” for matched sample pairs (AA or BB) (sn), sample size of matched sample pairs (n1), the number of response “Same” for the unmatched sample pairs (AB or BA) (dn), and sample size of the unmatched sample pairs (n2).
The input of the code for the ratings A-Not A are: rfal, rhit, i.e., a vector of the frequencies of the ratings of sample Not A (rfal) and a vector of the frequencies of the ratings of sample A (rhit).
The input of the R code for the ratings same-different are: rsam, rdif, i.e., a vector of the frequencies of the ratings of matched sample pairs (AA or BB) and a vector of the frequencies of the rating of unmatched sample pairs (AB or BA).
The output of the R codes for any one of all the 10 methods are the estimated and its variance.
2.2. Statistical Testing for Test Sample vs. Control Sample Based on Individual Estimator and Its Variance
2.2.1. Difference Test for Test Sample vs. Control Sample Based on Individual and Their Variance
The difference test based on the individual value and its variance is used to determine if there is a difference between one test sample and a control. The null hypothesis is . The alternative hypothesis is . The difference test statistic based on individual value and its variance is Equation (1).
where is the 1-α-th percentile of the standard normal distribution.
2.2.2. Equivalence/Similarity Test for Test Sample vs. Control Sample Based on Individual and Its Variance
The equivalence/similarity test based on individual value and its variance is used to determine if one test sample and a control sample are equivalent/similar in terms of a given equivalence/similarity limit . This is a one-sided equivalence/similarity test with the null hypothesis: , and the alternative hypothesis: . The equivalence/similarity test statistic based on the individual value and its variance is Equation (2).
where is the α-th percentile of the standard normal distribution.
2.3. Statistical Testing for Multiple Test Samples Based on Multiple Values and Their Variances
2.3.1. Difference Test for Multiple Test Samples Based on Multiple Values and Their Variances
According to Marascuilo [58,59], the test statistic in Equation (3) can be used for a difference test for multiple based on , where j=1,2, …k, and their variances.
where , which denotes a weighted mean of . The statistic in Equation (3) asymptotically follows a chi-square distribution with k-1 degrees of freedom.
2.3.2. Multiple Comparisons for Multiple Test Samples Based on Vector and Co-Variance Matrix
If a difference test for multiple test samples in terms of shows a significant difference among test samples, multiple comparisons can be conducted based on the vector and co-variance matrix for the estimators using S-Plus program ‘multicomp’ (Insightful [60]) or R package ‘multcomp’ (Hothorn, et al. [61]).
2.3.3. TOST Equivalence/Similarity Test for Two Test Samples Based on Two Values and Their Variances
TOST, i.e., Two One-Sided Test, is a widely-used method for an equivalence/similarity test proposed by Westlake [62] and Schuirmann [63,64]. See, e.g., Bi [23] (Chapter 5) for more interpretation about the method. This test is a two-sided equivalence/similarity test, which involves two sets of one-sided hypotheses: versus and versus . We can declare and are equivalent/similar in terms of , where is a selected equivalence/similarity limit, if and only if both and are rejected at a significance level α. The test statistics for the TOST are Equation (4) and Equation (5). The TOST can be used for equivalence/similarity testing for any two test samples.
where is the α-th percentile of the standard normal distribution, while is the 1-α-th percentile of the standard normal distribution.
The TOST is based on the intersection-union test (IUT) principle. A remarkable feature of the IUT is that unlike difference testing, the TOST based on the IUT principle does not need to make multiplicity adjustment to control the overall probability of Type I error for multiple comparisons using TOST equivalence/similarity tests. For the IUT theory, see, e.g., Berger [65], Casella and Berger [66], Berger and Hsu [67], and Silvapulle and Sen [68] (Chapter 5.3).
3. Results
3.1. Estimated Values and Their Variances from Psychometric Functions of 10 Basic Sensory Discrimination Methods
Examples using the R codes in Table 1 to get values and their variances are as below.
1). For the 2-AFC
> TwoAFC(x=76,n=100)
[1] 0.998900 0.037748
2). For the 3-AFC
> ThreeAFC(x=64,n=100)
[1] 1.021800 0.027862
3). For the Triangle
> TRI(x=42,n=100)
[1,] 1.0125 0.0985
4). For the Duo-trio
> DUTR(x=58,n=100)
[1] 0.983100 0.114003
5). For the Specified Tetrad
> STETR(x=46,n=100)
[1] 0.9925751 0.0212300
6). For the Unspecified Tetrad
> UTETR(x=49,n=100)
[1] 0.9862749 0.0326270
7). For the A-Not A
> ANAdv(a=90,an=100,n=61,nn=100)
[1] 1.0022325 0.0453817
8). For the Same-different
> SDdv(sn=27,n1=100,dn=21,n2=100)
[1] 1.023 0.272
9). For the Ratings of A-Not A
> ANARAT(rfal=c(66,29,83,40,17,15), rhit=c(21,10,46,68,37,68))
d': 0.9193 ; var: 0.0096
[1] 0.9193 0.0096
10). For the Ratings of Same-different
> SDRAT(rsam=c(66,29,83,40,17,15),rdif=c(21,10,46,68,37,68))
d': 2.0284 ; var: 0.0211
[1] 2.0284 0.0211
The results in the examples for the 10 sensory discrimination methods are consistent with the results in ASTM- E2262 [7], Ennis et al. [57], Bi and O’Mahony [27], Bi et al. [37], Bi [23] (Chapters 2-3), and the R package ‘sensR’ (Christensen, et al.[54]).
For example, for the ratings of same-different method, i.e., a version of the DOD method, using the R code ‘SDRAT(rsam=c(66,29,83,40,17,15), rdif=c(21,10,46,68,37,68))’, the output is: = 2.0284 and var()= 0.0211.
> SDRAT(rsam=c(66,29,83,40,17,15), rdif=c(21,10,46,68,37,68))
d': 2.0284 ; var: 0.0197
[1] 2.0284 0.0197
Using the R program ‘dod’ in the ‘sensR’, which is based on Ennis and Christensen [47] and Ennis and Rousseau [17] for the ratings of the same-different method, a version of the DOD method, the output is as below. The results are = 2.0257 and var() = 0.138^2 = 0.019044. The results are consistent with those above.
> library(sensR)
> dod(same= c(66,29,83,40,17,15), diff= c(21,10,46,68,37,68))
Results for the Thurstonian model for the Degree-of-Difference method
Confidence level for 2-sided profile likelihood interval: 95%
Estimates Std. Error Lower Upper
d.prime 2.057 0.138 1.781 2.324
Boundary coefficients:
1 2 3 4 5
Estimate 0.46472 0.67999 1.46685 2.2899 2.8429
Std. Error 0.04787 0.05745 0.08469 0.1073 0.1224
Data:
1 2 3 4 5 6
same-pairs 66 29 83 40 17 15
diff-pairs 21 10 46 68 37 68
Results of discrimination test:
Likelihood Root statistic = 9.535692, p-value = < 2.2e-16
Alternative hypothesis: d-prime is greater than 0
3.1. Statistical Testing for Test Sample vs. Control Sample Based on Individual Estimator and Its Variance
3.2.1. Difference Test Based on Individual and Their Variance
The R code ‘dpdtest(d,v)’ based on Equation (1) can be used for the difference test based on the individual value and its variance. For example, the result of the difference test is as below for the data in the first row in the data file ‘dpdat’ and in Table 2. Because the p-value is <0.01, a significant difference between test sample and control sample was found at a significance level α=0.01.
> dpdtest(d=dpdat [1,1],v=dpdat [1,2])
d' var(d') z p-v
[1,] 2.4868 0.0687 9.487734 0
> dpdat
d' v(d')
1 2.4868 0.0687
2 2.0849 0.0662
3 1.4422 0.1628
4 0.9442 0.3927
3.2.2. Equivalence/Similarity Test Based on Individual and Its Variance
The R code ‘dpstest(d,v,slim)’ based on Equation (2) can be used for the equivalence/similarity tests based on the individual value and its variance. For example, for the similarity limits , the equivalence/similarity test results are as below for the data in the first row in Table 2 and data file ‘dpdat’. Because the p-value is 0.0251, significant equivalence/similarity between the test sample and control sample can be claimed in terms of the equivalence/similarity limit at a significance level α = 0.05.
> dpstest(d=dpdat [1,1],v=dpdat [1,2],slim=3)
d' var(d') lim z p-v
[1,] 2.4868 0.0687 3 -1.95798 0.02511617
3.3. Statistical Testing for Multiple Test Samples Based on Multiple Values and Their Variances
3.3.1. Difference test for multiple test samples based on multiple values and their variances
The R code ‘dstest(d,v)’, based on Equation (3), can be used to do a difference test for multiple δ based on multiple and their variances.
For example, for a difference test for the four test samples based on the four values and their variances in Table 2 (‘dpdat’), the test results are as below, using the R code ‘dstest(d,v)’. A significant difference among the four test samples was found at an alpha level of 0.05 (p-value = 0.0425).
> dstest(d=dpdat[,1],v=dpdat[,2])
p-value: 0.0425
Weighted mean: 2.0588
Variance of Wm: 0.0261
[1] 0.0425 2.0588 0.0261
3.3.2. Multiple Comparisons for Multiple Test Samples Based on Vector and Co-Variance Matrix
The vector ‘dp’ and co-variance matrix ‘dv’ can be produced using the data ‘dpdat’ in Table 2 as below.
>dp<-c(T1=dpdat [1,1],T2=dpdat [2,1],T3=dpdat [3,1],T4=dpdat [4,1])
>dv<-matrix(0,4,4)
>diag(dv)<-dpdat[,2]
> dp
T1 T2 T3 T4
2.4868 2.0849 1.4422 0.9442
> dv
[,1] [,2] [,3] [,4]
[1,] 0.0687 0.0000 0.0000 0.0000
[2,] 0.0000 0.0662 0.0000 0.0000
[3,] 0.0000 0.0000 0.1628 0.0000
[4,] 0.0000 0.0000 0.0000 0.3927
The S-Plus program ‘multicomp’ in S-Plus software can be used for the multiple comparisons based on ‘dp’ and ‘dv’ with a selected alpha level, e.g., alpha = 0.2 as below. There are significant differences between T1 and T3 and between T1 and T4, based on δ.
> multicomp(dp,dv,alpha=0.2)
80 % simultaneous confidence intervals for specified
linear combinations, by the Tukey method
critical point: 1.9702
response variable:
intervals excluding 0 are flagged by ‘****’
Estimate Std.Error Lower Bound Upper Bound
T1-T2 0.402 0.367 -0.3220 1.13
T1-T3 1.040 0.481 0.0966 1.99 ****
T1-T4 1.540 0.679 0.2040 2.88 ****
T2-T3 0.643 0.479 -0.3000 1.59
T2-T4 1.140 0.677 -0.1940 2.48
T3-T4 0.498 0.745 -0.9700 1.97
The R programs ‘confint’, glht’, and ‘parm’ in R package ‘multcomp’ can also be used for the multiple comparisons based on ‘dp’ and ‘dv’ with a selected confidence level (1-alpha), e.g., 0.8 (alpha= 0.2) as below.
> library(multcomp)
> confint(glht(model = parm(dp, dv), linfct = c("T1 - T2=0", "T1 - T3=0","T1 - T4=0","T2 - T3=0","T2 - T4=0","T3-T4=0")), level = 0.8)
Simultaneous Confidence Intervals
Quantile = 1.9436
80% family-wise confidence level
Linear Hypotheses:
Estimate lwr upr
T1 - T2 == 0 0.4019 -0.3120 1.1158
T1 - T3 == 0 1.0446 0.1095 1.9797
T1 - T4 == 0 1.5426 0.2224 2.8628
T2 - T3 == 0 0.6427 -0.2874 1.5728
T2 - T4 == 0 1.1407 -0.1759 2.4573
T3 - T4 == 0 0.4980 -0.9506 1.9466
There are significant differences between T1 and T3 and between T1 and T4, based on δ. Figure 1 shows the simultaneous confidence limits for any pair of the test samples. The R programs produce the same results as those produced by using the S-Plus program ‘multicomp’.
3.3.3. TOST Equivalence/Similarity Test Based on Two Values and Their Variances
The R code ‘s2dptest(d,v,d0)’ based on Equations (4) and (5) can be used for the TOST equivalence/similarity test for two test samples based on two estimators, e.g., and for test samples T1 and T2 and their variances. The input of the code is the two estimators and their variances, as well as an equivalence/similarity limit . The output of the code are the test statistics Z1 and Z2, and the p-values. For example, for the data: d= c(2.4868,2.0849), v= c(0.0687,0.0662), and an equivalence/similarity limit d0=1, the output is as below. Significant equivalence/similarity of T1 and T2 can be concluded with an equivalence/similarity limit of 1 at a significance level of 0.1 with p-values of 0.0001 and 0.0517.
> s2dptest(d=c(2.4868,2.0849),v=c(0.0687,0.0662),d0=1)
Z1,Z2,pv1 and pv2:
[1] 3.8169 -1.6284 0.0001 0.0517
The R program ‘TOSTmeta’ in the R package ‘TOSTER’ (Lakens and Caldwell [69]) can also be used for the equivalence/similarity test for two test samples using the two estimators and their variances, as well as an equivalence/similarity limit . For example, for the data above and an equivalence/similarity limit d0=1, the same results can be obtained as below. Significant equivalence/similarity of T1 and T2 can be concluded with an equivalence/similarity limit of 1 at a significance level of 0.1 with p-values of 0.0001 and 0.052.
> library(TOSTER)
> TOSTmeta(ES=2.4868-2.0849, var=0.0687+0.0662, low_eqbound_d=-1, high_eqbound_d=1, alpha=0.1)
TOST results:
Z-value lower bound: 3.82 p-value lower bound: 0.00007
Z-value upper bound: -1.63 p-value upper bound: 0.052
….
Equivalence Test Result:
Equivalence Test Result:
The equivalence test was significant, Z = -1.628, p = 0.0517, given equivalence bounds of -1.000 and 1.000 and an alpha of 0.1.
…
4. Discussion
Thurstonian modeling of sensory discrimination methods is highly effective in enhancing sensory evaluation’s role in food safety by quantifying perceptual differences ( or ) between safe and potentially contaminated food products. Sensory evaluation is an essential frontline tool used primarily to detect and assess potential issues with food quality, spoilage, and contamination, thereby offering valuable insights for early contamination detection and maintaining high food safety and quality standards.
4.1. Application of Sensory Discrimination Methods
Sensory evaluation is typically used alongside microbiological and analytical laboratory testing for a more comprehensive assessment of food safety. Below is how sensory discrimination methods play an important role for monitoring food safety.
1). Identification of subtle differences before becoming easily perceptible that might indicate spoilage (unpleasant smells, visual changes, taste off-flavors and unexpected texture changes) or foreign substances (chemical residues, cleaning agents, etc.) or contaminants from processing or packaging (metals, dirt, plastics, etc.);
2). Threshold testing to estimate the minimum level detectable to provide a measurable threshold when a product should be considered changed or unsafe;
3). For shelf life, quality control and monitoring quality, an example being rancidity that can develop in fats and oils with age;
4). Detection of mold odors indicating potential mycotoxins or presence of fermentation or yeast activity in foods;
5). Contamination from off-flavors during processing due to improper equipment cleaning or cross-contact with other foods;
6). Determination if consumers can reliably differentiate standard (control) vs. contaminated or adulterated foods or changes in processing environment and the perceived consumer risk associated—how the perception of the sensory difference affects consumer acceptance to align safety margins with consumer expectations for safety and high-quality;
7). For assessor training to increase reliability; and
8). Development of rapid sensory-based screening tools like electronic noses or tongues by quantifying how these devices mimic human sensory evaluations; Thurstonian models can validate instrumental data accuracy in detecting subtle contamination levels that might not yet be harmful that could lead to consumer rejection.
4.2. Significance of d’ Differences
In sensory research, helps quantify how significant perceptual differences are and guides decisions related to product development, quality assurance, and consumer testing. In sensory perceptual research, delta () or d-prime () is a key measure derived from Thurstonian models that indicates the degree of perceptual difference between two products. It is commonly used in discrimination tests to quantify how distinct two stimuli are from each other based on sensory attributes. Delta () or d-prime () is a statistical measure of discriminability. It represents the distance between the distributions of sensory perceptions for two products. For example, a higher value indicates a greater difference between the two products, while a lower value indicates they are more similar in sensory perception. Interpretation of d-prime is as below.
1). No Perceptual Difference ( = 0): A d-prime of zero suggests that the two products are indistinguishable from one another by the panelists. Their sensory distributions completely overlap, meaning any difference perceived by the panel could be due to chance or noise.
2). Small Perceptual Difference ( between 0.5 and 1.0): A d-prime in this range indicates that there is a slight but perceptible difference between the two products. However, it might be subtle, and not all panelists will consistently detect the difference.
3). Moderate Perceptual Difference between 1.0 and 2.0): A d-prime in this range suggests a moderate difference that many panelists are likely to detect. It indicates that products are distinguishable based on their sensory characteristics.
4). Large Perceptual Difference above 2.0): A d-prime greater than 2.0 signals a strong perceptual difference, where most panelists can easily distinguish between the two products. The sensory profiles are clearly different, and these differences are unlikely to be ignored by consumers or trained panelists. In summary, a low indicates products are very similar or indistinguishable, a moderate suggests there is a noticeable difference between products and a high signifies products are highly distinct in sensory perception.
While the above values or ranges of d-prime represent a kind of rule-of-thumb among sensory researchers, it is difficult to give an absolute value for a meaningful d-prime size across all applications. Swets [70] indicates if a meaningful difference in terms of an area measure (R-index) should be larger than 0.7, the corresponding distance measure () should be larger than 0.74. See further background discussions on Thurstonian discriminal distance d-prime () and R-index based on Thurstonian modeling and Signal Detection Theory (Thurstone [8]; Green & Swets [51]; O’Mahony [71]) for basic effect size measures for perceptual sensory differences.
In practice, researchers use d′ to assess whether the change is perceptible to trained panels or consumers. If a company wants a product to be indistinguishable from the original, they should aim for a low d′. In quality control, a high d′ might indicate an undesirable variation in production, where products are not consistent with the expected sensory profile. For assessing consumer acceptance, a low d′ suggests the products are similar, which may be acceptable if consistency is the goal. A high d′, however, might require further investigation if sensory differences could impact consumer preference.
For defining the size of d-prime (d′) differences in sensory and psychophysical research, several key references provide foundational insights into the interpretation and application of d′ values. Here are some of the most widely cited sources in this area: detection theory and psychological foundation of d′ [52], applied use of d′ in sensory evaluation related to food products [2], statistical power of various discrimination methods and interpretation of d′ [15], detailed guidance on how d′ is calculated and interpreted with linkage of d′ to probabilistic models of perception [72], technical focus on statistical aspects with practical applications of sensory discrimination testing [23]. These references provide a thorough grounding in the use and interpretation of d′ in both general psychophysical contexts and specific sensory research applications.
4.3. Advantages of Thurstonian Discriminal Distance ( or d′)
Thurstonian scaling for sensory discrimination methods offers advantages in sensory research, particularly in assessing subtle differences between products. Some of the key benefits include:
1) improved sensitivity--making the method more sensitive to small perceptual differences between products compared to traditional testing; 2) quantitative interpretation--offering a quantitative estimate of the perceived difference between products, enabling researchers to measure and compare the intensity of sensory attributes more precisely; 3) statistical robustness and reliability--accounting for individual variability and response bias, leading to more accurate representations of true sensory differences; 4) clearer decision-making across methods based on a probabilistic framework--facilitating more informed decisions; and 5) compatibility across methods using a common parameter d′--thus, allowing selection of the most appropriate method for the nature of the product and study objectives.
As mentioned earlier, Thurstonian scaling can be used with trained panels or consumer panels. Trained panels are used to detail sensory differences, make objective assessments of product formulations, ingredient changes or quality control and product optimization to fine-tune product formulations or processes to achieve the desired sensory characteristics. Consumer panels are used to provide critical information on perceptual relevance, helping to quantify if consumers can detect differences between products and, if so, the probability of those differences being meaningful for consumer acceptability and if sensory differences will impact consumers buying behavior, driving decisions regarding product launch, positioning or marketing strategies and success in the marketplace. Thurstonian scaling provides quantitative and probabilistic insights, enabling better decision-making in product development and consumer research.
4.4. Application of Thurstonian Scaling for Food Quality and Safety
There are several review articles and research papers that apply Thurstonian scaling in the context of food quality and safety. These articles discuss the use of the scaling in sensory discrimination, consumer testing, and quality control. Recent studies have increasingly applied Thurstonian scaling to monitor and detect food quality and safety, particularly in the fields of sensory analysis, food contamination, and adulteration.
Moreover, other recent studies have emphasized using the scaling to explore consumer perceptions of food safety and quality. These approaches help better understand how sensory attributes contribute to perceived quality, influencing consumer acceptance and purchase decisions. The scaling has also been utilized to improve the accuracy of sensory panels in discriminating between small differences in product formulations, crucial for maintaining consistent food quality standards. Below are some specific review articles, studies, and book chapter content that discuss sensory discrimination methods in this field that are essential references for understanding how analyses and Thurstonian scaling are applied for quality control in the food industry.
Lee and Van Hout [73] deliver a review of practical applications to accurately quantify sensory differences/similarities in food; Lee and O’Mahony [74] and Ennis [16] provide detailed overviews of Thurstonian models in sensory and consumer science, offering examples specific to food products; Lawless [75] gives a review of sensory discrimination testing methods and includes practical applications of Thurstonian models for food quality testing; O’Mahony [76] offers statistical insights and a broader context for Thurstonian models in the evaluation of food quality and safety, providing a framework for interpreting sensory differences using statistical models; Ennis and Rosseau [17], Bi [[23], pp. 171-177] and Bi [77] extend the collection of Thurstonian models with the degree of difference method and other modified discrimination tests including double discrimination tests Bi [[23], pp. 177-186].
4.5. Government Organizations
It is worth noting government organizations around the world use sensory evaluation as part of their food safety and quality control measures which serves to emphasize the importance of this work:
United States Department of Agriculture (USDA) Food Safety and Inspection Service (FSIS) conducts routine inspections to assess the freshness and quality of meat and poultry products.
United States Food and Drug Administration (FDA) Center for Food Safety and Applied Nutrition (CFSAN) monitors food quality and potential foodborne hazards in various products as seafood, dairy and processed foods.
European Food Safety Authority (EFSA) provides independent scientific advice on food safety and regularly assesses the risk of various food products; sensory evaluation is part of the risk assessment process for assessing spoilage and quality deterioration, especially in relation to food freshness and storage conditions.
Canadian Food Inspection Agency (CFIA) enforces food safety regulations in Canada ensuring foods meet health and safety standards especially for meat, fish, dairy and other perishable foods ensuring food products are safe for consumption.
Food Standards Australia New Zealand (FSANZ) develops food standards for Australia and New Zealand including food labeling, food composition, and food safety; sensory evaluation is used for food quality assessment to ensure compliance with standards for food freshness and quality.
National Food Institute (Denmark), responsible for food safety and conducting risk assessments, uses sensory evaluation in inspection of food products to ensure that they meet national and EU food safety standards.
China Food and Drug Administration (CFDA) oversees the safety of food and drugs in China. Sensory evaluation forms part of routine inspections, particularly in assessing the quality and freshness of food products, such as fish, vegetables, and meat, to ensure that they meet safety standards.
Japan Food Safety Commission (FSC) provides risk assessments to ensure the safety of food products in Japan. Sensory evaluation techniques are used in the food industry to detect spoilage or contamination.
Department of Agriculture, Fisheries, and Forestry (Australia) enforces food safety and quality standards in Australia’s agriculture and fisheries sectors. Sensory evaluation plays a role in ensuring that food products, particularly perishable items like fish and seafood, are fresh and safe for consumption.
World Health Organization (WHO) and Food and Agriculture Organization (FAO) These international organizations provide guidelines and frameworks that national governments use to ensure food safety. These government agencies and organizations integrate sensory evaluation into broader food safety programs to monitor quality, identify potential risks, and ensure consumer safety. They recommend using sensory evaluation alongside laboratory testing to assess food quality and safety.
National Institutes of Health (NIH) While the NIH does not directly oversee or conduct food safety inspections using sensory evaluation, its research on sensory perception, foodborne illnesses, environmental hazards, and human health contributes significantly to improving food safety standards. NIH-funded research provides valuable insights that are applied in sensory evaluation methods used by regulatory agencies like the FDA and USDA to protect public health.
4.6. Future Trends
Overall, the use of sensory evaluation methods for detecting food contamination is evolving alongside technological advancements, offering both speed and precision in food quality control. Xia [78] accounts for the interest and importance of food quality and safety in food production by summarizing the volume of work published in Food Quality and Safety (FQS) between 2017-2022. The future of sensory evaluation for monitoring food safety is driven by advancements in technologies and the increasing demand for real-time, accurate assessments. One of the most effective uses of sensory evaluation for food quality and safety monitoring is the establishment of data relationships between perceptual sources of data and instrumental assessments [79]. Several trends are shaping the future of this field including: 1) integration of digital technologies that mimic human sensory systems (electronic noises and tongues) [80]; Artificial Intelligence (AI) and machine learning (ML) with algorithms to interpret sensory data [81]; 2) portable and real-time sensors allowing real-time monitoring for immediate feedback along stages of the supply chain [82] though often still used in combination with traditional sensory methods for assessing and understanding food quality [83]; Internet of Things (IoT) integration (smart sensors) [82]; 3) nanotechnology (nano-biosensors to detect contaminants at molecular levels) [80]; 4) enhanced consumer sensory feedback (crowdsourcing sensory data, integration of real-time data with smart devices; 5) non-destructive imaging testing techniques to assess food quality and safety without damage the product [82,84]; 6) personalized food safety monitoring (wearable and smart devices) for real-time assessments at in food production, home or restaurants [85,86]; 7) food microbiome detection to predict spoilage or contamination even before it becomes perceptible through traditional sensory methods [82], and advances continue for shelf-life prediction models with development of new models foreseen [87].
In summary, future trends in sensory evaluation for food safety will rely heavily on emerging technologies such as AI, IoT, nanotechnology, and non-destructive testing methods, enabling faster, more precise, and more accessible monitoring systems. These innovations aim to improve food safety at all stages of the supply chain and empower researchers and consumers with better tools. These emerging techniques should benefit from analysis in conjunction with predictive perceptual models to provide precise, quantitative assessments of food safety and help in developing novel methods for detecting food contamination or adulteration [88]. Such applications are critical for both research and industry, where maintaining high standards in food quality is essential. Applied use of Thurstonian modeling of sensory discrimination results serves to contribute to this evolution.
5. Conclusions
Thurstonian scaling, i.e., Thurstonian discriminal distance ( or ) is an advanced technique to measure sensory difference/similarity between two samples. The index can be produced from a Thurstonian model, i.e., a psychometric function of any one of the sensory discrimination methods. This paper briefly and comprehensively explores how to estimate and test Thurstonian discrimination distances ( values) and generally discusses application and significance of Thurstonian scaling for the sensory discrimination methods. R codes are developed and provided to calculate values and their variances from 10 basic sensory discrimination methods. The 10 basic sensory discrimination methods include 6 force-choice methods and 4 methods with response bias. With the estimated values and their variances, difference testing and equivalence/similarity testing for individual value, or two or multiple values can be conducted by using R codes, the S-Plus program, and R packages as shown in the paper.
We believe that the technique of Thurstonian scaling provided and discussed in the paper can be used as one of the powerful tools in several scientific research fields including the area of detecting and monitoring food contamination.
Supplementary Materials
The following supporting information can be downloaded at the website of this paper posted on Preprints.org. The R codes used in this paper and some statistical output can be found in Appendix A in Supplementary Materials in the online version of this paper.
Credit authorship contribution statement
Jian Bi: Conceptualization, Formal analysis, Software, Writing--original draft, Writing--review & editing. Carla Kuesten: Conceptualization, Writing--review & editing.
Data availability
Data in Table 2 of this paper were used for the research described in the article.
Declaration of Competing Interest
The authors declare that they have no known competing financial interests or personal relationships that could have appeared to influence the work reported in this paper.
References
- Meilgaard, M.; Civille, G.; Carr, B. Sensory Evaluation Techniques; Boca Raton, Florida: Taylor & Francis, 2006. [Google Scholar]
- Lawless, H.T.; Heymann, H. Sensory Evaluation of Food: Principles and Practices, 2ed.; Springer: New York, 2010. [Google Scholar]
- Stone, H.; Bleibaum, R.; Thomas, H.A. Sensory Evaluation Practices; Academic press: New York, 2020. [Google Scholar]
- Rogers, L. Discrimination Testing in Sensory Science: A Practical Handbook; Woodhead Publishing: Duxford, UK, 2017. [Google Scholar]
- Rogers, L.; Hort, J.; Kamp, S.E.; Hollowood, T. Discrimination Testing in Sensory Evaluation; Wiley: Hoboken, NJ, USA, 2024. [Google Scholar]
- ASTM. Annual Book of ASTM Standards. Vol. 14.03; ASTM International: West Conshocken, PA, USA, 2021.
- ASTM-E2262. Standard Practice for Estimating Thurstonian Discriminal Distances, E2262-03 (Re-approved 2020); ASTM International: West Conshocken, PA, USA, 2021.
- Thurstone, L.L. A law of comparative judgement. Psychological Review 1927, 34, 273–286. [Google Scholar] [CrossRef]
- Ura, S. Pair, triangle, and duo-trio test. Rep. Stat. Appl. Res., JUSE 1960, 7, 107–119. [Google Scholar]
- David, H.A.; Trivedi, M.C. Pair, triangle, and duo-trio tests. Virginia Poly. Inst., Tech. Rep. 54, 1962.
- Bradley, R.A. Some relationship among sensory difference tests. Biometrics 1963, 19, 385–397. [Google Scholar] [CrossRef]
- Frijters, J.E.R. Variations of the triangular method and the relationship of its unidimensional probabilistic models to 3-altenative forced choice signal detection theory models. British Journal of Mathematical and Statistical Psychology 1979, 32, 229–242. [Google Scholar] [CrossRef]
- Frijters, J.E.R. (1988). Sensory difference testing and the measurement of sensory discriminability. In Sensory Analysis of Foods, 2nd ed.; Piggott, J.R., Ed.; Elsevier Applied Science Publishers: London, UK, 1988; pp. 117–140. [Google Scholar]
- Ennis, D.M.; Mullen, K.; Frijters, J.E.R. Variants of the method of triads: Unidimensional Thurstonian models. British Journal of Mathematical and Statistical Psychology 1988, 41, 25–36. [Google Scholar] [CrossRef]
- Ennis, D.M. The power of discrimination methods. Journal of Sensory Studies 1993, 8, 353–370. [Google Scholar] [CrossRef]
- Ennis, D.M. Thurstonian Models: Categorical Decision Making in the Presence of Noise. The Institute for Perception: Richmond, VA, USA. 2016, ISBN:9780990644606, 099064460X.
- Ennis, D.M.; Rousseau, B. A Thurstonian model for the degree of difference protocol. Food Quality and Preference 2015, 41, 159–162. [Google Scholar] [CrossRef]
- Bi, J.; Ennis, D.M.; O’Mahony, M. How to estimate and use the variance of d’ from difference tests. Journal of Sensory Studies 1997, 12, 87–104. [Google Scholar] [CrossRef]
- Bi, J. The double discrimination methods. Food Quality and Preference 2001, 12, 507–513. [Google Scholar] [CrossRef]
- Bi, J. Variance of d’ for the same-different method. Behavior Research Methods, Instruments, & Computers 2002, 34, 37–45. [Google Scholar] [CrossRef]
- Bi, J. Estimating population or group sensitivity and its precision from a set of individual d’. British Journal of Mathematical and Statistical Psychology 2005, 58, 55–63. [Google Scholar] [CrossRef] [PubMed]
- Bi, J. Similarity tests using forced-choice methods in terms of Thurstonian discriminal distance, d’. Journal of Sensory Studies 2011, 26, 151–157. [Google Scholar] [CrossRef]
- Bi, J. Sensory Discrimination Tests and Measurements: Sensometrics in Sensory Evaluation. 2nd Edition; Wiley/Blackwell Publishing: Oxford, UK, 2015.
- Bi, J. An extension of Green’s area theorem. Journal of Mathematical Psychology 2018, 82, 131–137. [Google Scholar] [CrossRef]
- Bi, J. A new form of the psychometric function for the unspecified tetrad. Food Quality and Preference 2020, 82, 103869. [Google Scholar] [CrossRef]
- Bi, J. The methods of Tetrads, Hexads, and Octads: A type of more powerful sensory discrimination methods. Food Quality and Preference 2023, 108. [Google Scholar] [CrossRef]
- Bi, J.; O’Mahony, M. Variance of d’ for the tetrad test and comparisons with other forced choice methods. Journal of Sensory Studies 2013, 28, 91–101. [Google Scholar] [CrossRef]
- Bi, J.; Kuesten, C. Estimating and testing parameters of the Thurstonian model for Torgerson’s method of triads. Journal of Sensory Studies 2015, 30, 33–45. [Google Scholar] [CrossRef]
- Bi, J.; Kuesten, C. A simplified form of the psychometric function for the m-Alternative Forced Choice (mAFC) method. Journal of Sensory Studies 2016, 31, 306–368. [Google Scholar] [CrossRef]
- Bi, J.; Kuesten, C. The four-interval, two-alternative forced-choice (4I2AFC): A powerful sensory discrimination method to detect small, directional changes particularly suitable for visual or manual evaluations. Food Quality and Preference 2019, 73, 202–209. [Google Scholar] [CrossRef]
- Bi, J.; Kuesten, C. Review and development of Thurstonian models for the triangle and duo-trio methods and paired versions of the methods. Journal of Sensory Studies 2020, 35. [Google Scholar] [CrossRef]
- Bi, J.; Kuesten, C. A more powerful non-attribute-specified sensory discrimination method: The paired unspecified tetrad with different order (AB and BA) pairs. Journal of Sensory Studies 2020, 35. [Google Scholar] [CrossRef]
- Bi, J.; Kuesten, C. The paired A-Not A with AB and BA pairs. Journal of Sensory Studies 2022, 37. [Google Scholar] [CrossRef]
- Bi, J.; Kuesten, C. Thurstonian models for three variants (specified, unspecified, and unspecified with forgiveness) of the Two-Out-of-Five method. Journal of Sensory Studies 2023, 38. [Google Scholar] [CrossRef]
- Bi, J.; Kuesten, C. (2024). Thurstonian models for the duo-trio and its variants. Journal of Sensory Studies 2024. [CrossRef]
- Bi, J.; Lee, H.S.; O’Mahony, M. d’ and variance of d’ for four-alternative forced choice (4-AFC). Journal of Sensory Studies 2010, 25, 740–750. [Google Scholar] [CrossRef]
- Bi, J.; Lee, H.S.; O’Mahony, M. Statistical analysis of ROC curves for the ratings of the A-Not A and the Same-Different methods. Journal of Sensory Studies 2013, 28, 34–46. [Google Scholar] [CrossRef]
- Bi, J.; Lee, H.S.; O’Mahony, M. Estimation of Thurstonian models for various forced-choice sensory discrimination methods as a form of the ‘M+N’ test. Journal of Sensory Studies 2014, 29, 325–338. [Google Scholar] [CrossRef]
- Bi, J.; Lee, H.S.; O’Mahony, M. A Thurstonian model and statistical inference for the 2-Alternative choice test with both test pairs and placebo pairs. Journal of Sensory Studies 2015, 30, 10–20. [Google Scholar] [CrossRef]
- Bi, J.; Lee, H.S.; O’Mahony, M. An analytical psychometric function for the dual reference duo-trio (DRDT) method. Food Quality and Preference 2022, 96, 104418. [Google Scholar] [CrossRef]
- Bi, J.; Lee, H.S.; O’Mahony, M. Thurstonian model for the four-interval oddity task. Food Quality and Preference 2023, 111. [Google Scholar] [CrossRef]
- Bi, J.; O’Mahony, M.; Lee, H.S. Non-parametric estimation of d’ and its variance for the A-Not A with reminder. Journal of Sensory Studies 2013, 28, 381–386. [Google Scholar] [CrossRef]
- Bi, J.; O’Mahony, M.; Lee, H.S. The performance of the dual reference duo-trio (DRDT) method using a balanced-reference mode. Food Quality and Preference 2016, 48, 303–313. [Google Scholar] [CrossRef]
- Bi, J.; Kuesten, C.; Lee, H.S.; O’Mahony, M. Paired versions of various sensory discrimination forced-choice methods and the same-different area theorem. Food Quality and Preference 2018, 63, 97–106. [Google Scholar] [CrossRef]
- Brockhoff, B.P.; Christensen, R.H.B. Thurstonian models for sensory discrimination tests as generalized linear models. Food Quality and Preference 2010, 21, 330–338. [Google Scholar] [CrossRef]
- Ennis, J.M. A Thurstonian analysis of the Two-Out-of-Five test. Journal of Sensory Studies 2013, 28, 295–303. [Google Scholar] [CrossRef]
- Ennis, J.M.; Christenson, R.A. Thurstonian comparison of the Tetrad and Degree of Difference tests. Journal of Food Quality and Preference 2015, 40, 263–269. [Google Scholar] [CrossRef]
- Ennis, J.M.; Rousseau, B.; Ennis, D.N. Sensory difference tests as measurement instruments: A review of recent advances. Journal of Sensory Studies 2014, 29, 89–102. [Google Scholar] [CrossRef]
- Rousseau, B.; O’Mahony, M. Sensory difference tests: Thurstonian and SSA predictions for vanilla flavored yogurts. Journal Sensory Studies 1997, 12, 127–146. [Google Scholar] [CrossRef]
- Rousseau, B.; Ennis, D.N. A Thurstonian model for the dual pair (4IAX) discrimination method. Perception & Psychophysics 2001, 63, 1083–1090. [Google Scholar] [CrossRef]
- Green, D.M.; Swets, J.W. Signal detection theory and psychophysics. Wiley: New York, 1966.
- Macmillan, N.A.; Creelman, C.D. Detection theory: A user’s guide, 2nd ed.; Lawrence Erlbaum Associates, Inc.: New York, 2004. [Google Scholar]
- Hautus, M.J.; Macmillan, N.A.; Creelman, C.D. Detection theory: A user’s guide, 3rd ed.; New York: Taylor & Francis:New York, 2022. [Google Scholar]
- Christensen, R.H.B.; Brockhoff, B.P.; Kuznetsova, A.; Birot, S.; Stachlewska, K.A.; Rafacz, D. Package ‘sensR’. Available from: http://www.r-project.org. 2023.
- R Core Team R: A language and environment for statistical computing. Vienna, Austria: R Foundation for Statistical Computing. 2023. https://www.R-project.org/.
- Gilbert, P.; Varadhan, R. Accurate Numerical Derivatives, R Package “numDeriv.” Retrieved Dec.1, 2020, from http://www.r-project.org. 2019.
- Ennis, J.; Ennis, D.; Yip, D.; O’Mahony, M. Thurstonian models for variants of the method of tetrads. Brit. J. Math. Stat. Psychol. 1998, 51, 205–215. [Google Scholar] [CrossRef]
- Marascuilo, L.A. Large sample multiple comparisons. Psychological Bulletin 1966, 65, 280–290. [Google Scholar] [CrossRef]
- Marascuilo, L.A. Extension of the significance test for one-parameter signal detection hypotheses. Psychometrika 1970, 35, 237–243. [Google Scholar] [CrossRef]
- Insightful. S-PLUS 6. Guide to Statistics Vol.1. for Windows; Insightful Corporation: Seattle, Washington, 2001. [Google Scholar]
- Hothorn, T.; Bretz, F.; Westfall, P.; Heiberger, R.M.; Schuetzenmeister, A.; Scheibe, S. R package “multcomp”: Simultaneous Inference in General Parametric Models. http://www.r-project.org. 2023.
- Westlake, W.J. Response to T.B.L. Kirkwood: Bioequivalence testing – a need to rethink. Biometrics 1981, 37, 589–594. [Google Scholar]
- Schuirmann, D.J. On hypothesis testing to determine if the mean of a normal distribution is contained in a known interval. Biometrics 1981, 37, 617. [Google Scholar]
- Schuirmann, D.J. A comparison of the two one-sided tests procedure and the power approach for assessing the equivalent of average bioavailability. Journal of Pharmacokinetics and Biopharmaceutics 1987, 15, 657–680. [Google Scholar] [CrossRef]
- Berger, R.L. Multiparameter hypothesis testing and acceptance sampling. Technometrics 1982, 24, 295–300. [Google Scholar] [CrossRef]
- Casella, G.; Berger, R.L. Statistical Reference; Wadsworth and Brooks/Cole, Pacific: Grove, CA, 1990.
- Berger, R.L.; Hsu, J.C. Bioequivalence trials, intersection union tests and equivalence confidence set. Statistical Science 1996, 11, 283–319. [Google Scholar] [CrossRef]
- Silvapulle, M.J.; Sen, P.K. Constrained statistical inference: Inequality, order, and shape restrictions. Wiley: New York, 2004.
- Lakens, D.; Caldwell, A. R package “TOSTER”: Two One-Sided Tests (TOST) Equivalence Testing. http://www.r-project.org, 2023.
- Swets, J.A. Measuring the accuracy of diagnostic systems. Science 1988, 240, 1285–1293. [Google Scholar] [CrossRef]
- O’Mahony, M. Understanding discrimination tests: A user-friendly treatment of response bias, rating and ranking R-Index tests and their relationship to signal detection. Journal of Sensory Studies 1992, 7, 1–47. [Google Scholar] [CrossRef]
- Ennis, D.M.; Rousseau, B.; Ennis, J.M. Tools and Applications of Sensory and Consumer Science. The Institute for Perception, www.IFPress.com, Richmond, VA 2017.
- Lee, H.-S.; Van Hout, D. Quantification of Sensory and Food Quality: The R-Index Analysis. Journal of Food Science 2009, 74, R57–R64. [Google Scholar] [CrossRef]
- Lee, H.-S.; O’Mahony, M. Sensory difference testing: Thurstonian models. Food Sci. Biotechnol. 2004, 13, 841–847. [Google Scholar]
- Lawless, H.T. Chapter 4 Thurstonian Models for Discrimination and Preference. In Quantitative Sensory Analysis Psychophysics, Models and Intelligent Design; John Wiley & Sons, Ltd., Wiley Blackwell, Hoboken, NJ, USA, 2013; pp. 71–123.
- O’Mahony, M. Understanding Discrimination Tests: A User-Friendly Treatment of Response Bias, Rating and Ranking R-Index Tests and Their Relationship to Signal Detection. Journal of Sensory Studies 1992, 7, 1–47. [Google Scholar] [CrossRef]
- Bi, J. Statistical models for the Degree of Difference method. Journal of Food Quality and Preference 2002, 13, 31–37. [Google Scholar] [CrossRef]
- Xia, T.; Gong, C.; Zeng, J. Publication review of Food Quality and Safety during 2017–2022. Food Quality and Safety 2023, 7. [Google Scholar] [CrossRef]
- Ray, S. Sensory Properties of Foods and Their Measurement Methods. In Techniques to Measure Food Safety and Quality. Khan, M.S., Shafiur Rahman, M. Eds.; Springer, Cham. 2021. [CrossRef]
- Kumar, A.; Castro, M.; Feller, J.-F. Review on Sensor Array-Based Analytical Technologies for Quality Control of Food and Beverages. Sensors 2023, 23, 4017. [Google Scholar] [CrossRef]
- Ma, M.; Yang, X.; Ying, X.; Shi, C.; Jia, Z.; Jia, B. Applications of Gas Sensing in Food Quality Detection: A Review. Foods 2023, 12, 3966. [Google Scholar] [CrossRef]
- Rodrigues, S.S.; Dias, L.G.; Telxeria, A. Emerging Methods for the Evaluation of Sensory Quality of Food: Technology at Service. Current Food Science and Technology Reports 2024, 2, 77–90. [Google Scholar] [CrossRef]
- Sirangelo, T.M. Sensory Descriptive Evaluation of Food Products: A Review. Journal of Food Science and Nutrition Research 2019, 2, 354–363. [Google Scholar] [CrossRef]
- Special Edition: Recent Advances in the Food Safety and Quality Management Techniques; Perumal, A.B.; Li, X.; He, Y. Eds.; Foods 2023 (ISSN 2304-8158).
- Huang, Y.; Luo, C.; Xia, F.; Song, Y.; Jiang, L.; Li, F. ; Multi-analyte sensing strategies towards wearable and intelligent devices. Chemical Science 2022, 13, 12309–12325. [Google Scholar] [CrossRef]
- Liberty, J.T.; Sun, S.; Kucha, C.; Adedeji, A.A.; Agidi, G.; Ngadi, M.O. Augmented reality for food quality assessment: Bridging the physical and digital worlds. Journal of Food Engineering 2024, 367, 111893. [Google Scholar] [CrossRef]
- Cui, F.; Zheng, S.; Wang, D.; Tan, X.; Li, Q.; Li, J.; Li, T. Recent advances in shelf life prediction models for monitoring food quality. Comprehensive Reviews in Food Science and Food Safety – Wiley Online Library 2023 22, 2, 1257-1284. [CrossRef]
- Special Edition: Predictive Modelling of Food Quality and Safety; Valdramidis, V.; Cummins, E.; Celayeta, J.M.F. Eds.; Food Control 2013 29:2, pp. 289–470. [CrossRef]
Figure 1.
Multiple comparisons based on vector and co-variance matrix.
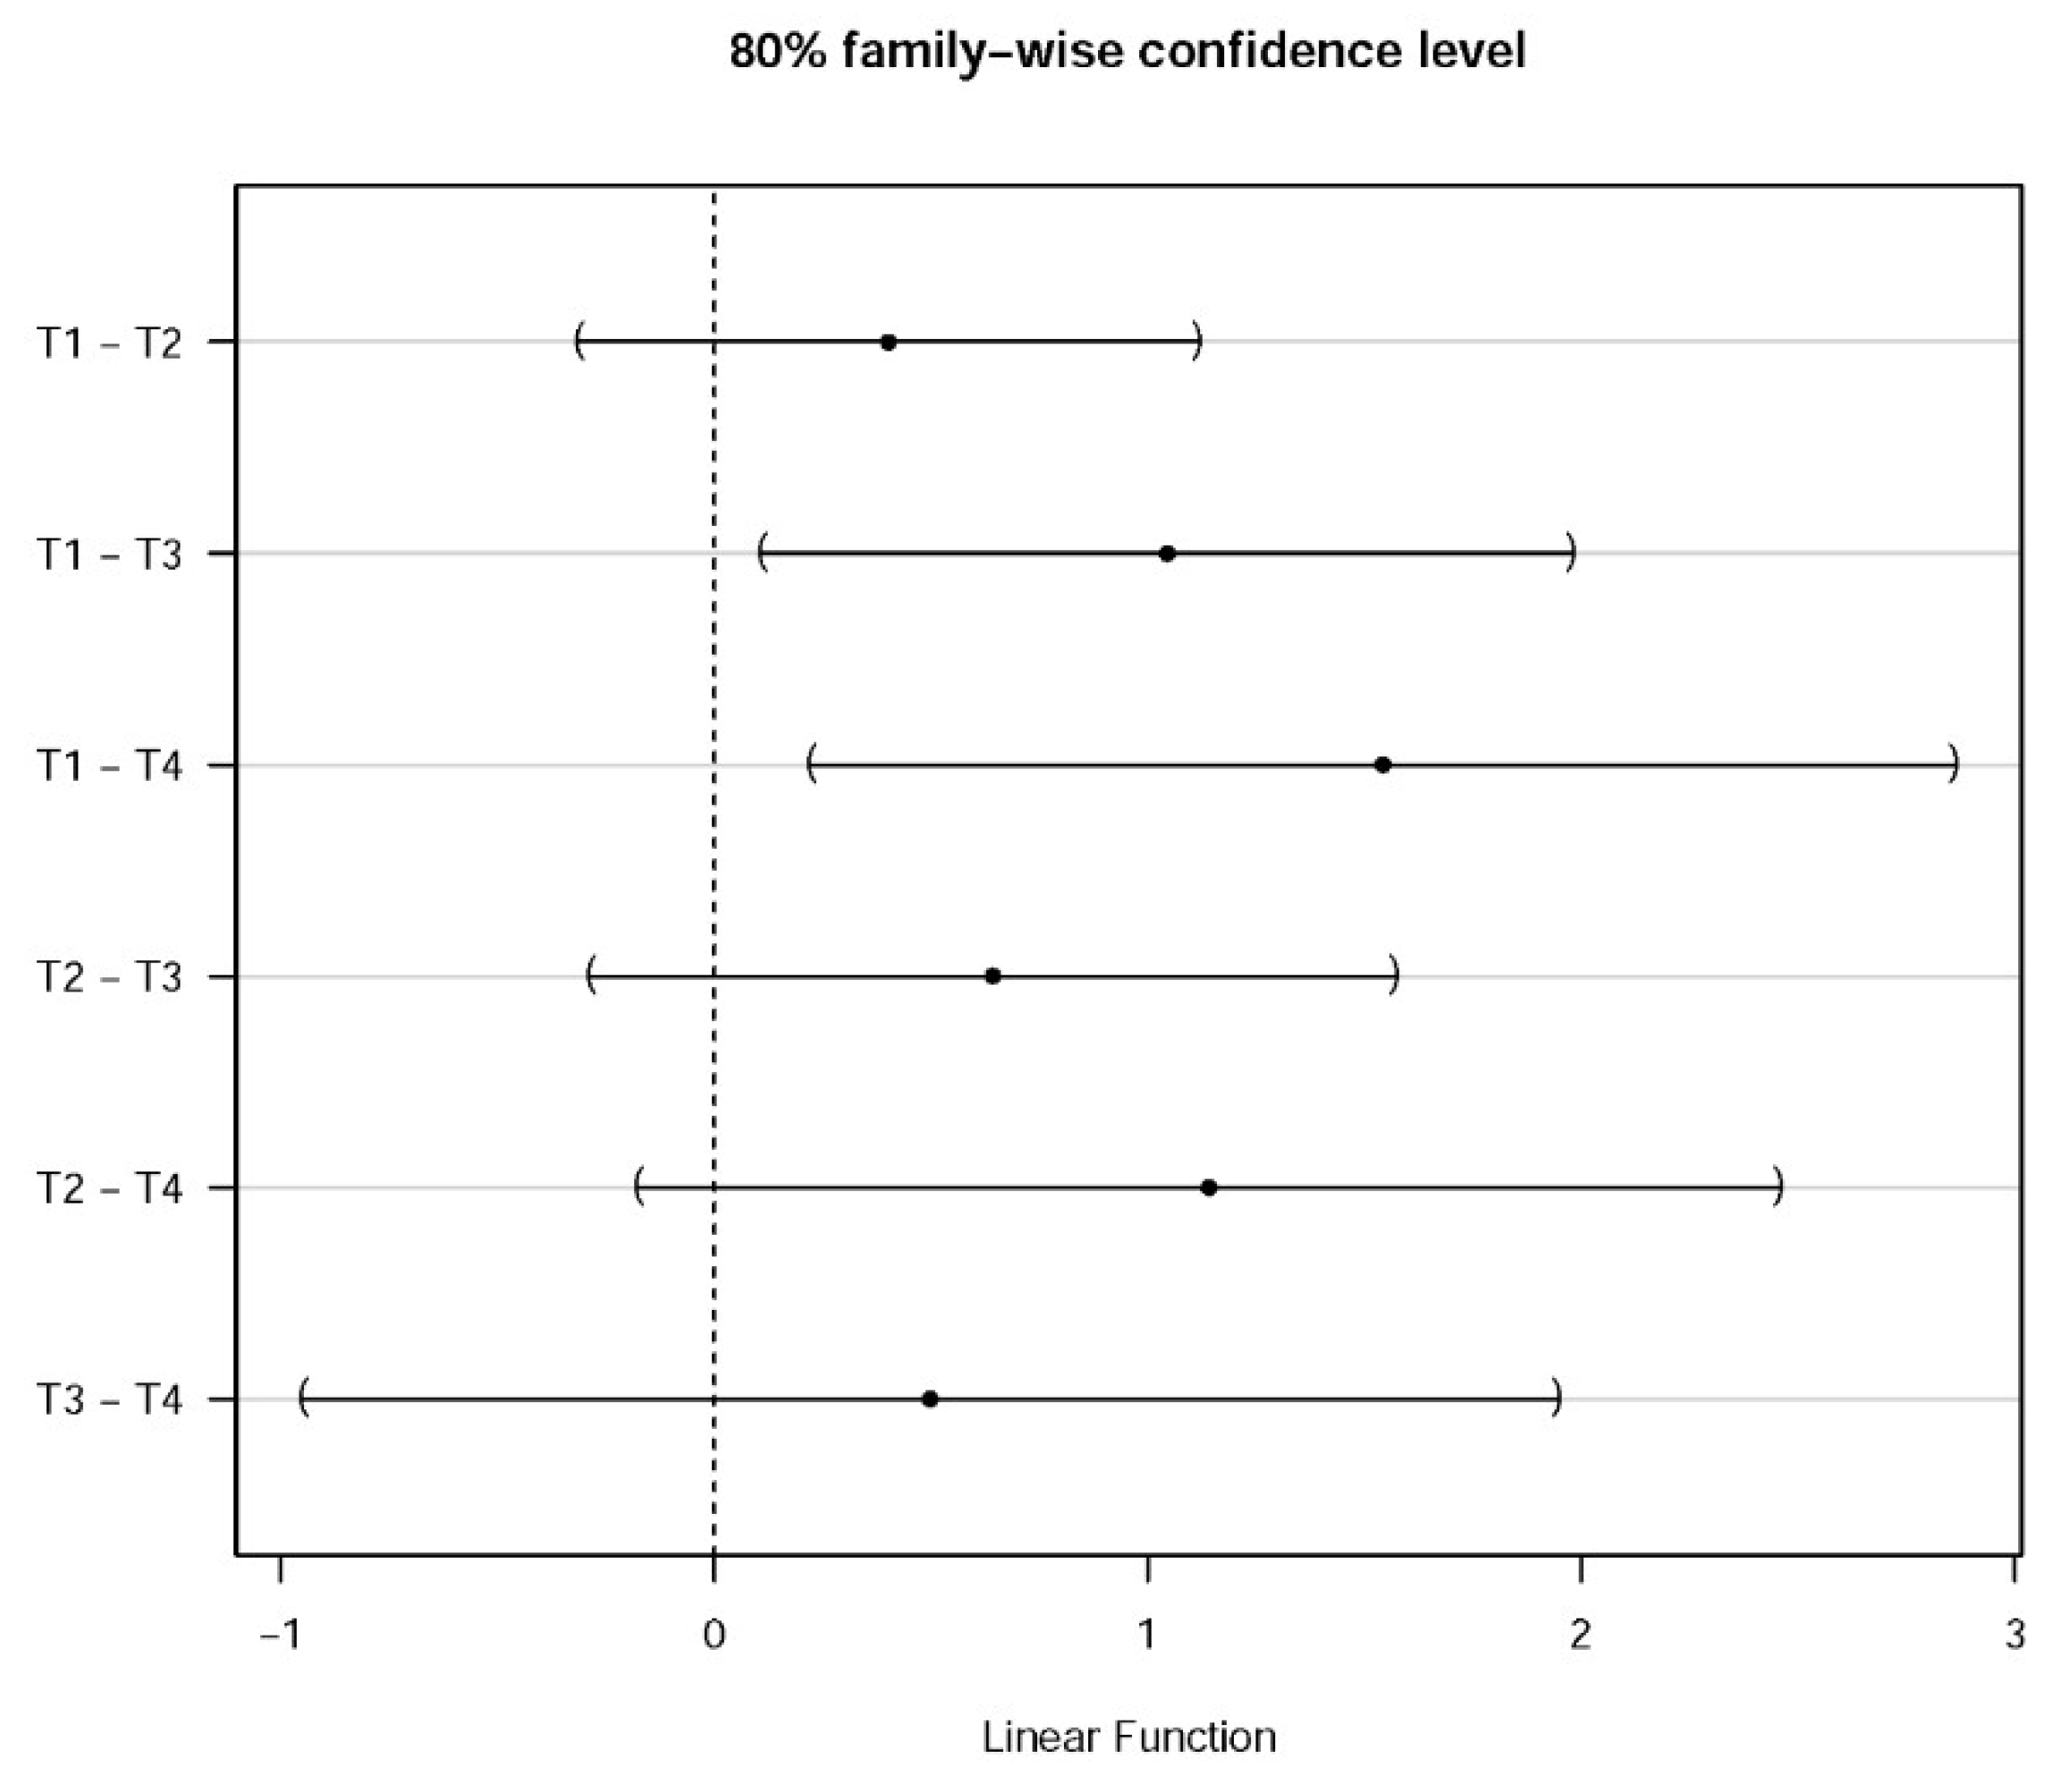

Table 1.
Estimations of and its variance for some basic sensory discrimination methods.
| .No. | Methods | R-code |
| 1 | 2-AFC | TwoAFC(x,n) |
| 2 | 3-AFC | ThreeAFC(x,n) |
| 3 | Triangle | TRI(x,n) |
| 4 | Duo-trio | DUTR(x,n) |
| 5 | Specified Tetrad | STETR(x,n) |
| 6 | Unspecified Tetrad | UTETR(x,n) |
| 7 | A-Not A | ANAdv(a,an,n,nn) |
| 8 | Same-different | SDdv(sn,n1,dn,n2) |
| 9 | Ratings of A-Not A | ANARAT(rfal,rhit) |
| 10 | Ratings of Same-different | SDRAT(rsam,rdif) |
Table 2.
Data of estimated and its variance.
| .No. | Variance of | |
| 1 | 2.4868 | 0.0687 |
| 2 | 2.0849 | 0.0662 |
| 3 | 1.4422 | 0.1628 |
| 4 | 0.9442 | 0.3927 |
Disclaimer/Publisher’s Note: The statements, opinions and data contained in all publications are solely those of the individual author(s) and contributor(s) and not of MDPI and/or the editor(s). MDPI and/or the editor(s) disclaim responsibility for any injury to people or property resulting from any ideas, methods, instructions or products referred to in the content. |
© 2024 by the authors. Licensee MDPI, Basel, Switzerland. This article is an open access article distributed under the terms and conditions of the Creative Commons Attribution (CC BY) license (http://creativecommons.org/licenses/by/4.0/).
Copyright: This open access article is published under a Creative Commons CC BY 4.0 license, which permit the free download, distribution, and reuse, provided that the author and preprint are cited in any reuse.


