
Submitted:
29 September 2024
Posted:
30 September 2024
You are already at the latest version
Abstract
Grilling has become a widespread method of thermal food processing. However, food prepared this way may be a source of carcinogenic organic compounds, such as polycyclic aromatic hydrocarbons (PAHs). The present study aimed to evaluate the impact of different marinades and grilling tools on PAH contamination of chicken breast tenderloins. Together with the determination of PAHs carried out using the QuEChERS–HPLC–FLD/DAD method, the amount of meat weight loss after the thermal process and the color of raw and grilled samples were analyzed. Statistically, the highest levels of PAH contamination were stated in samples prepared on a charcoal grill without a tray, whereas the lowest using the ceramic contact grill. Meat marination showed that universal and chicken marinades can be barriers against PAHs. Following requirements set in Commission Regulation (EU) No. 915/2023, none of the analyzed samples exceeded the maximum allowable level for B[a]P (5.0 µg/kg), and the sum of 4 marker–heavy PAHs (30.0 µg/kg). Thus, preparing meat before the thermal process, including marinades rich in phenolic compounds, and selecting a grilling method with appropriate grilling tools can ensure food safety and effectively reduce PAH contamination in grilled poultry meat.
Keywords:
PAHs
; chicken breast tenderloins
; grill
; marinades
; QuEChERS
; HPLC–FLD/DAD
1. Introduction
Polycyclic aromatic hydrocarbons (PAHs), or polyarenes, represent a diverse class of organic chemical compounds containing at least two fused aromatic rings of carbon and hydrogen atoms. The adverse effects of PAHs on the human body are primarily determined by their structure. Polycyclic aromatic hydrocarbons with 2–3 or 2–4 benzene rings, depending on categorization, are classified as light PAHs, and PAHs with at least 4 or 5 rings in their structure are classified as heavy PAHs [1,2].
Various organizations were engaged in research into the adverse effects of PAHs on human health. In 1976, the United States Environmental Protection Agency (US EPA) established a list of 16 PAHs as indicator compounds. This list included both highly carcinogenic PAHs and those with low toxicity to humans [3]. Nevertheless, compared to 16 PAHs from the US EPA list, in December 2002, the European Union Scientific Committee on Food (SCF) identified 15 heavy PAHs as much more genotoxic, mutagenic, and carcinogenic and recommended them for monitoring in food. They were as follows: benzo[a]pyrene (B[a]P), benzo[a]anthracene (B[a]A), benzo[b]fluoranthene (B[b]F), benzo[j]fluoranthene (B[j]F), benzo[k]fluoranthene (B[k]F), benzo[g,h,i]perylene (B[ghi]P), chrysene (Chr), cyclopenta[c,d]pyrene (C[cd]P), dibenzo[a,h]anthracene (D[ah]A), dibenzo[a,l]pyrene (D[al]P), dibenzo[a,e]pyrene (D[ae]P), dibenzo[a,h]pyrene (D[ah]P), dibenzo[a,i]pyrene (D[ai]P), indeno[cd]pyrene (I[cd]P), 5–methylchrysene (5-MChr) [4]. In 2005, the Join FAO WHO Expert Committee on Food Additives (JECFA) classified 13 of them as carcinogenic and mutagenic compounds and recommended further analysis of heavy polyarenes. The International Agency for Research on Cancer (IARC) classified polyarenes into four groups of carcinogenicity: group 1 – human carcinogens, group 2A – probable carcinogens, group 2B – possible carcinogens, group 3 – not classifiable as human carcinogens, and group 4 – probably not carcinogenic to humans [5]. The reference in this classification was benzo[a]pyrene, the most common and studied PAH compound with a toxicity value of 1. Several years ago, benzo[a]pyrene was considered a good marker for the occurrence of PAHs in food products. However, the 2005 European Commission Recommendation and the EFSA Panel on Contaminants in the Food Chain (CONTAM) revealed that B[a]P is not an appropriate indicator of other PAHs in food products [5,6,7]. Subsequently, the sum of 4 heavy PAHs (benzo[a]pyrene, chrysene, benzo[b]fluoranthene, and benzo[a]anthracene) has been established as the best marker of PAH occurrence in food [8].
PAHs are found in different environmental compartments, such as water, air, or soil [9,10,11]. They are formed in various anthropogenic activities, especially combustion processes, during forest fires and volcanic eruptions. Food is contaminated due to environmental deposition and specific thermal treatment processes and is the primary source of human exposure to PAHs [8,10,12,13]. According to some studies, it has been reported that there are mainly three potential mechanisms of PAH formation: pyrolysis of organic substances (fats, proteins, carbohydrates) at high temperatures, incomplete combustion of fuel used, and dripping of fat onto the open flames [14].
Grilling is one of the most common meat processing methods, especially in the summer. This cooking technique allows consumers to quickly prepare food with the product's unique taste, color, and aroma. However, many carcinogenic substances, including polycyclic aromatic hydrocarbons, are formed during this thermal process. The primary factors influencing PAH contamination in grilled foodstuffs are the type of meat, its fat content, processing time and temperature, the method of cooking, and the distance from the heating source [8,15]. In the direct method of grilling, the dripping fat from the meat onto the hot coals generates carcinogenic substances such as PAHs, which are deposited on the surface of the food, thus contributing to high concentration levels of polyarenes [9]. To minimize their formation, an indirect method of grilling is often used. Shortening the grilling time or avoiding direct contact with the flames using an aluminum tray can significantly minimize the formation of PAHs. Instead of charcoal grills, other types, such as electric and gas grills, are increasingly used to reduce PAH contamination [15,16].
Intensive research is ongoing on preventing PAHs in food, mainly processed foods. In addition to choosing the appropriate cooking technique, preparing raw materials, including marinating, can significantly reduce PAH formation. Marinades with acids and phenolic compounds can minimize PAH content in the final products. Furthermore, marinating meat improves its texture and color and prolongs its shelf life [17,18,19].
According to the high PAH contamination risk in grilled meat products and their regular consumption by consumers, especially in the summer season, maximum permissible levels for polyarenes, including the sum of 4 heavy–marker SCF PAHs and benzo[a]pyrene, were set in Commission Regulation (EU) No. 915/2023 for grilled meat products, respectively at the level of 30 and 5 µg/kg [20].
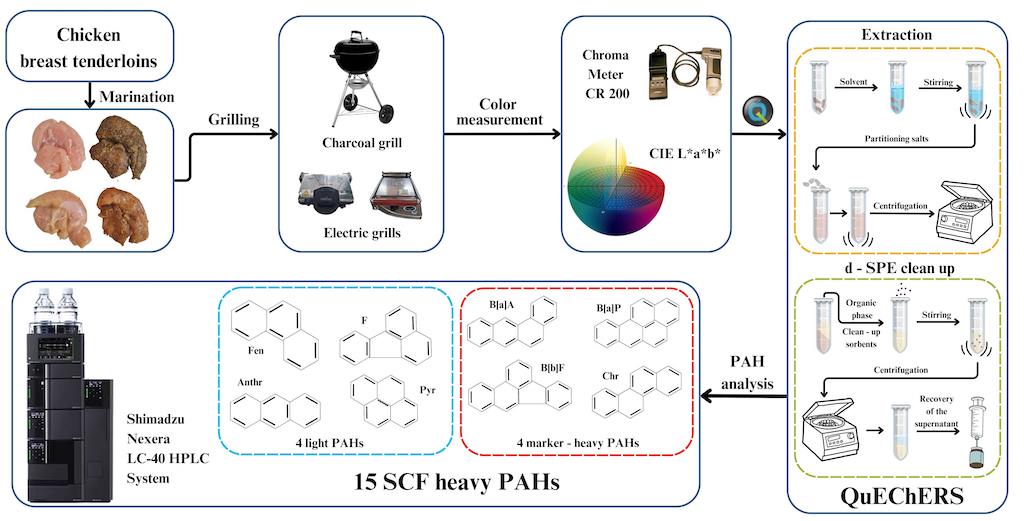
In light of the above, examining PAH formation and occurrence levels in grilled meat products and developing treatments and methods to prevent and reduce PAH contamination in such products is essential. While many scientific publications address minimizing PAH levels in processed meats, they often focus on the list of 16 EPA PAHs. However, according to the SCF and EFSA opinions and recommendations mentioned above, researchers should prioritize the more toxic PAHs listed by the SCF. Therefore, the scope of this study was the examination of chicken breast tenderloins, the most frequently grilled type of poultry meat, prepared in different, commonly used in Poland types of marinades, subsequently grilled using various grilling tools. PAH determination was performed using one of the modern eco–friendly extraction methods, the QuEChERS method, and liquid chromatography with fluorescence and diode array detectors (QuEChERS-HPLC–FLD/DAD). This work aimed to select which type of grilling tool and marination contributed to minimizing PAH content in the analyzed products. In light of the aforementioned, PAH determination covered 19 polyarenes, comprising 15 heavy SCF PAHs with B[a]P and 4 heavy–marker PAHs, in addition to the 4 light EPA PAHs, which are typically predominant in profiles of PAH contamination. They were also analyzed, primarily for comparison with previous studies. The research data will contribute further insight into the effect of the grilling method and marinating on the level of PAH contamination in grilled poultry meat and propose strategies for PAH reduction to minimize consumers’ dietary exposure to these toxic compounds.
2. Materials and Methods
2.1. Research Material and Preparation for Grilling
The materials investigated were raw chicken breast tenderloins purchased from the local market in Warsaw, Poland. Samples were cut into 100 g pieces and marinated in three previously prepared marinades: universal, chicken, and honey–mustard marinade, all typically used in Poland for poultry marinating. The marinades were prepared according to the manufacturer’s instructions (the formulation of marinades is given in Table 1).
The marinated samples were stored in glass food containers in a refrigerator at 4 ± 1 °C overnight. The unmarinated chicken breast tenderloins were treated identically, but no marinating was involved. Samples were prepared in triplicate. The following day, before grilling, the chicken breast tenderloins were placed at room temperature until the internal temperature of samples reached 15–20 °C (HANNA Instrument HI 98804 thermometer, Woonsocket, United States).
2.2. Grilling Tools and Cooking Procedure
To assess whether the grilling method and the type of grill have an impact on the formation of PAHs, the following grilling tools were used: a charcoal grill without a tray (Weber Original Kettle E-4710, Weber-Stephen Deutschland GmbH, Ingelheim am Rhein, Germany), and the same charcoal grill with an aluminum tray, an electric cast iron contact grill with corrugated upper and bottom surfaces (Combi Grill, GR-1000 model, Optimum, Mińsk Mazowiecki, Poland) and electric ceramic contact grill with a corrugated upper surface and smooth bottom surface (SpidoCook, XP010PR model, UNOX, Cadoneghe, Italy).
Firstly, the appliances were preheated for at least 10 min. During that time, the weights of the chicken breast tenderloin samples before cooking were recorded. Once the appliances were preheated, meat samples were placed on the grill surface. The grilling parameters for the particular types of grills are given in Table 2.
W1 – Charcoal grill without a tray, W2 – Charcoal grill with an aluminum tray, E1 – Electric ceramic contact grill, E2 – Electric cast iron contact grill.
Once reaching the preferred medium degree of meat doneness and the desired temperature inside the product geometric center (>80 °C), samples were removed from the grilled surface, cooled to room temperature, reweighted, and packed into glass containers for consequent PAH analysis.
2.3. Weight Loss
To determine the weight loss, the weights of the chicken breast tenderloins samples were recorded in triplicate before and after grilling. The equation for calculating the cooking loss in grilled samples is provided below:
M – weight of raw chicken breast tenderloin sample
Mg – weight of grilled chicken breast tenderloin sample
2.4. Color Measurement
CIE L*a*b* parameters were measured for raw and grilled samples using a Minolta Colorimeter, model Chroma Meter CR–200 (Konica Minolta Corp., Japan) calibrated with a white plate (L*-97.83, a*-0.45, b*+1.88). Based on the lightness (L*), redness (a*), and yellowness (b*), the color differences between samples before and after grilling (ΔE) were calculated.
∆E=[(∆L^* )+(∆a^* )+(∆b^* )]0.5
2.5. Chemicals and Materials
Acetonitrile (HPLC gradient grade), sodium chloride, and anhydrous magnesium sulfate (analytical purity >99.0%) were obtained from Avantor Performance Materials Poland S.A. (Gliwice, Poland). Sorbents used in the QuEChERS method were primary secondary amine, silica gel modified with C18 groups and graphitized carbon black, respectively, Sepra PSA Bulk Packing, Sepra C18–E Bulk Packing and Sepra GCB Bulk Packing, and were supplied by Phenomenex (Warsaw, Poland). Standard mixtures of 15 PAHs from the SCF list (PAH–Mix 183, Dr Ehrenstorfer) and 16 US EPA PAHs (PAH–Mix 9, Dr Ehrenstorfer) were provided by Witko (Łódź, Poland). The 16 US EPA PAH standard mixture was utilized only for the determination of 4 light PAHs, such as phenanthrene (Phen), anthracene (Anthr), fluoranthene (F), and pyrene (Pyr). Deionized water was sourced from a Millipore Milli-Q water purification system. Polytetrafluoroethylene syringe filters (PTFE, 25 mm i.d., 1 µm pore size) and Falcon centrifuge tubes (PTFE) were both supplied by BioAnalytic (Gdańsk, Poland).
2.6. Determination of PAHs Using QuEChERS–HPLC–FLD/DAD Method
The sample preparation or the qualitative and quantitative PAH analysis followed the methodology described by Ciecierska et al. [19], although some modifications were added.
To ensure representativeness and increase the contact area with the reagent, grilled chicken breast tenderloin samples were homogenized using an IKA A11 basic laboratory grinder (IKA Poland Sp. z o. o., Warsaw, Poland) before the extraction and clean–up process.
For fat and PAH extraction, 5 g of homogenized sample was weighed into a Falcon centrifuge tube (50 mL), then 10 mL of acetonitrile was added, and the mixture was shaken on a vortex for 1 min. Next, 4 g of magnesium sulfate and 1 g of sodium chloride were added to the tube, vortexed for 3 min, and centrifuged for 3 min at 3400 rpm (MPW– 352R laboratory centrifuge, Warsaw, Poland). Subsequently, 4 mL of the upper phase was transferred into a centrifuge tube (15 mL) containing clean–up sorbents: 900 mg MgSO4, 300 mg PSA, 150 mg C18, and 10–20 mg GC (depending on the color of the extract). The Falcon tube content was intensively mixed using a vortex (3 min) and subsequently centrifuged at 3400 rpm (3 min). The supernatant was subjected to filtration through the PTFE filter (0.2 µm of pore diameter) into a chromatography vial and then injected into a chromatographic column in the HPLC–FLD/DAD system.
The analyses of 4 light and 15 heavy PAHs in grilled chicken breast tenderloin samples were performed according to the method outlined by Ciecierska et al. [19], with the use of Nexera Shimadzu HPLC (LC–40DXR, Kyoto, Japan) with fluorescence detector RF–20 XL, and diode array detector SPD–M10AVP. Data were collected and analyzed with the LabSolution 2.1 program. Chromatographic separations were conducted at 30 °C on a Kinetex–PAH column (150 mm x 4.6 mm x 3.5 µm, Phenomenex, Warsaw, Poland) under gradient conditions, with acetonitrile (A) and water (B) (70:30, v/v), at the flow rate of 1.5 mL/min. The following program of gradient elution was used: 0–3 min 70% A to 73% A, 3–10 min 73% A to 100% A, 10–15.5 min 100% A, 15.5–16.5 min 100% A to 70% A, 16.5–23.0 min 70% A/ 30% B.
Different parameters of fluorescence detection were used. The excitations and emission wavelengths (Ex/Em) for PAH detection were as follows: 256/370 (Anthr, Phen), 270/420 nm (F, Pyr, B[a]A, Chr, 5–MChr, B[b]F, B[k]F, B[a]P, D[ah]A, D[al]P, B[ghi]P, and D[ae]P), 270/470 nm (D[ai]P and D[ah]P), and 270/500 nm (B[j]F and I[cd]P). The diode array detector (DAD), with a wavelength of 254 nm, was used to detect C[cd]P.
2.7. Quantification and Validation of the QuEChERS–HPLC–FLD/DAD Method
Qualitative and quantitative PAH analysis, utilizing an external standard method and validating the QuEChERS–HPLC–FLD/DAD method, was performed following the procedure previously described by Ciecierska et al. [19]. Two PAH standard mixtures (PAH-Mix 183 and PAH-Mix 9, Dr Ehrenstorfer) were used. Six standard solutions of PAHs at varying concentrations (0.5 – 50.0 μg/L) were examined to establish the calibration curves for individual PAHs. High correlation coefficients proved the method's linearity for almost all PAHs in the analyzed concentration range (Table 3). Validation parameters for 19 analyzed PAHs, such as the limit of detection (LOD), the limit of quantification (LOQ), recovery values along with relative standard deviation (RSD), as well as HORRATR values were determined according to Commission Regulation (EU) No. 836/2011 [21]. To perform recovery experiments, samples of the grilled chicken tenderloin (unmarinated and grilled on a ceramic contact grill) were fortified with PAHs at three concentration levels of standard mixtures (1, 10, and 100 μg/kg). The fortified as well as unfortified samples were examined in triplicate. The QuEChERS-HPLC–FLD/DAD method performance for PAH analysis in grilled chicken tenderloin sample is presented in Table 3.
All validation parameters of the applied QuEChERS–HPLC–FLD/DAD method, such as LOD, LOQ, recovery, and HORRATR, demonstrated that it complies with the requirements of Commission Regulation (EU) No. 836/2011 [21] for the analysis of 4 marker PAHs in food. Additionally, satisfactory parameters of the method performance were achieved for the analyzed polyarenes both from the SCF list and the 4 light EPA PAHs, as shown in Table 3. Figure 1 depicts the chromatograms of the analyzed heavy PAHs of chicken breast tenderloin samples marinated in different marinades and unmarinated, grilled on the charcoal grill without a tray
2.8. Statistical Analysis
The results were statistically analyzed using Statistica ver. 10 PL (StatSoft, Inc., Tulsa, OK, USA). To assess the significance of differences in the mean PAH contamination levels among different analyzed variants of grilled products, a two–way analysis of variance and Tukey’s test at a significance level of α=0.05 were applied. Pearson correlation analysis was also utilized for the weight loss and the components of color and the content of 15 heavy PAHs and 19 PAHs.
3. Results and Discussion
3.1. Analysis of the Meat Weight Loss after the Grilling Process
Due to the grilling process, the weight of the analyzed products decreased (Table 4). Cooking loss was determined within a range of 15.7 – 39.0%, depending on the type of the analyzed sample. Grilled chicken breast tenderloins marinated in universal, chicken, and honey–mustard marinade showed significantly the highest cooking loss on the charcoal grill without a tray (25.7 – 39.0%). For samples without marinade, the highest cooking loss was found on two grilling tools: cast iron electric contact grill (32.2%) and charcoal grill without a tray (32.8%). Moreover, comparing only charcoal grills, the result showed that despite sample variants, weight loss was significantly higher for charcoal grills without a tray. Furthermore, comparing the two types of electric grills showed that weight loss for samples prepared on cast iron electric contact grill was significantly higher (20.0 – 33.6%) than on ceramic electric contact grill (16.2 – 27.5%).
W1 – Charcoal grill without a tray, W2 – Charcoal grill with an aluminum tray, E1 – Ceramic contact grill, E2 – Cast iron contact grillAccording to the Pearson correlation analysis, as the weight loss increased, the contamination of 15 heavy PAHs showed a significant, strong positive correlation (P<0.001). However, comparing the results obtained for the correlation of weight loss and the sum of 19 PAHs, no correlation was observed (P=0.117), which may be due to greater variation in the content of light PAHs in the samples.
The differences in weight loss of chicken breast tenderloin samples prepared in various marinades mainly depend on the grilling temperature and the cooking method. For direct heating, the charcoal grill without a tray was used. Samples were cooked faster than chicken prepared on a charcoal grill with an aluminum tray. The indirect heating method caused limited contact of the meat with the flames, which leads to significantly lower weight loss than the direct cooking method. Furthermore, compared to charcoal grilling tools, using the electric grills showed that preparing the meat on the cast iron contact grill caused significantly higher weight loss than cooking on the electric ceramic contact grill. This result could be explained by the fact that the iron grill's corrugated surface allowed for greater water evaporation from the product. Moreover, higher weight loss was also caused by the pressure force of the heating surface on the product and higher temperature of grilling (200–220 ℃) than ceramic grill (180–200 ℃).
The results agreed with those of Ormian et al. [22], where studies on chicken breast showed significantly higher weight loss on samples prepared at 85 ℃ (31.4%) than samples grilled at 10 ℃ lower temperature (24.7%). Similarly, Suleman et al. [23] confirmed that choosing the cooking method significantly impacts meat weight loss. Lamb patties on a charcoal grill had a significantly higher weight loss than samples grilled in an electric oven and superheated steam cooked. Furthermore, the obtained results also agreed with the conclusions formulated by Purslow et al. [24] that rising temperature causes losing weight during cooking.
3.2. Color Analysis
The effect of different marination treatments and grilling tools on the color of chicken breast tenderloins is shown in Table 5. Our results indicated that the different marinades and cooking methods affected the samples’ color parameters. Examining the L* parameter, it was observed that for the charcoal grill without a tray, samples marinated in honey–mustard, universal marinade and without treatment were significantly darker (38.74, 32.88, 57.43, respectively) than on other types of appliances. Because of the higher temperature and direct contact with the flames on this grill, most samples showed a significantly darker color on the surface after the grilling process. The redness value (a*) showed that unmarinated samples grilled on a charcoal grill with a tray (3.79) and ceramic grill (3.85) had the lowest value of this parameter. Using a charcoal grill without a tray showed significantly lower redness values for the samples without marination (11.55) and those marinated in the universal marinade (9.87). The cast iron contact grill results showed a lower a* value for three types of samples: universal, chicken, and without marination (7.87, 9.93, 5.27, respectively). The differences in redness may be due to the grill design, including corrugated surfaces, temperature of grilling, and uneven color of marinades used. Moreover, the results corresponded to the conclusion formulated by Suman et al. [25] that during grilling, high temperatures over 70 ℃ cause complete denaturation of myoglobin, the value of the a* parameter decreases, and the b* parameter increases.
To compare the color changes before and after grilling, the ΔE parameter was determined (Table 6). For each sample, it was noted that even the inexperienced observer could notice the color differences (ΔE>5).
Pearson correlation of color components and PAHs in chicken breast tenderloins showed a weak, negative correlation between the L* parameter and 19 PAHs (P=0.043) and a weak, positive correlation between a* and 15 heavy PAHs (P=0.011) and a* and 19 PAHs (P=0.040). There was no significant correlation between lightness and the sum of 15 PAHs and yellowness and the sum of 15 and 19 PAHs.
According to the results obtained in this work, the type of grill and marination treatment significantly affects the color parameters of the analyzed samples. Moreover, Pearson’s correlation leads to the conclusion that the lower the proportion of redness (a*), the higher the PAH content in the sample, and the lighter the sample, the lower the contamination of light and heavy PAHs. The results of this work agree with the studies reported by many authors. Silva et al. [26] reported that after the grilling process, the meat becomes darker, and the proportion of redness and yellowness increases. Wongmaneepratip et al. [27], in their studies on chicken breast grilled on a charcoal grill, confirmed that different marinades significantly affect the color parameters. Furthermore, according to Ormian et al. [22], the higher temperature in the geometric center substantially affects the color parameters, lowering the L* and a* parameters and increasing the b* parameter.
3.3. Analysis of PAH Contamination in Grilled Meat Samples
3.3.1. Effect of Various Grilling Tools on PAH Formation in Chicken Breast Tenderloins
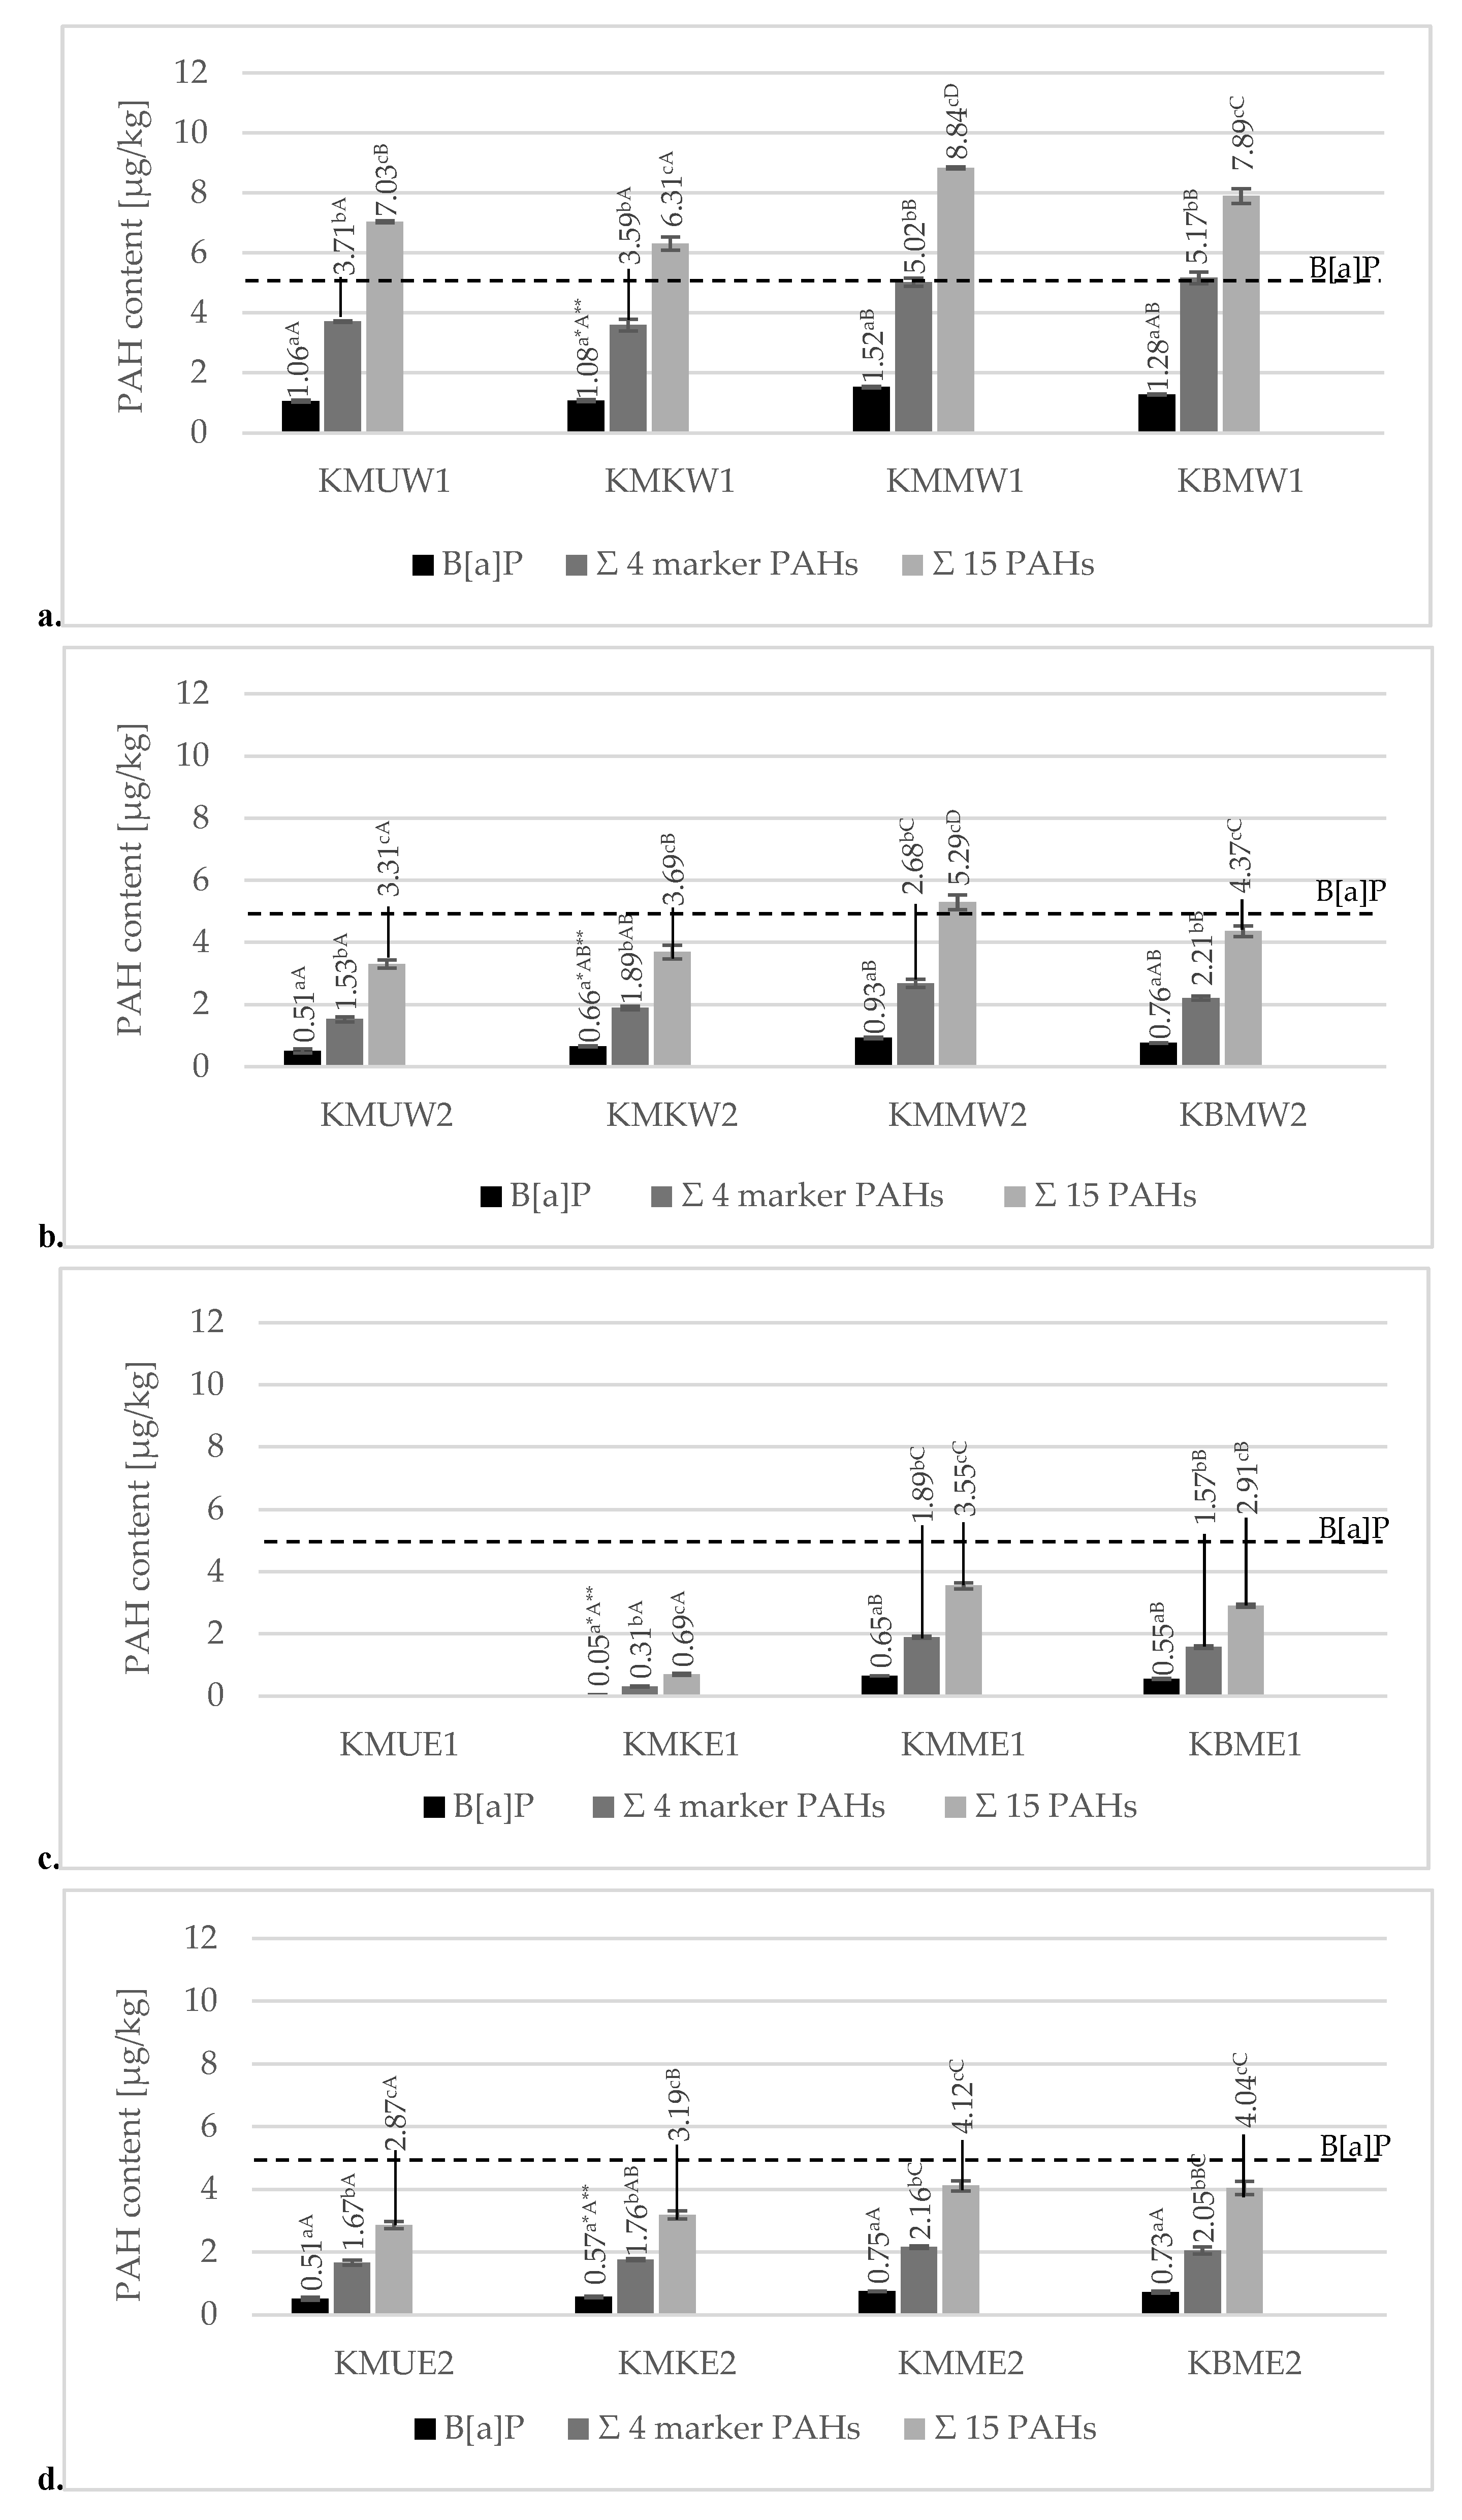
Results of the content of PAHs in chicken breast tenderloin samples prepared on four types of grilling tools are presented in Figure 2. Data for the sum of all analyzed PAHs, including the sum of 15 heavy SCF PAHs, 4 heavy and marker PAHs, and B[a]P, are given. The obtained results confirmed the statistically significant differences in the content of analyzed PAHs between each type of grilling tool. Significantly, the highest levels of a total of 15 PAHs, 4 marker–heavy PAHs, and B[a]P content were observed in the products prepared on a charcoal grill without a tray (6.31 – 8.84 µg/kg, 3.59 – 5.17 µg/kg, 1.06 – 1.52 µg/kg, respectively). Modification of the charcoal grill by using an aluminum tray significantly decreased the level of PAHs (3.31 – 5.21 µg/kg, 1.53 – 2.68 µg/kg, 0.51 – 0.93 µg/kg, respectively). Considering samples prepared on two types of charcoal grills, it can be concluded that direct contact between samples with the open flames is the main factor that promotes PAH formation. Using an aluminum tray prevented meat samples from direct contact with the fire, which caused significantly lower PAH contamination. Furthermore, the aluminum tray by the charcoal grill prevented the melting fat from the chicken from dropping onto the hot coals. During such a thermal process, chemical modification of organic compounds like lipids generates in the pyrolysis toxic compounds, including PAHs, which are towed by smoke and accumulate on the surface of the processed food [1].
Although the variation of PAH levels detected in heat-processed foods is determined by many factors, including temperature and time of the thermal process, type of fuel used, and proximity or direct contact with the heat source, the content of those carcinogenic compounds may differ due to type and fat content of the food. Electric grilling can be an alternative grilling method that significantly decreases levels of PAHs. In the current study, as compared to charcoal grills, chicken breast tenderloins were hence prepared on cast iron and ceramic electric grills. The contamination level of chicken breast tenderloins was significantly higher for the electric cast iron contact grill (15 heavy PAHs: 2.87 – 4.12 µg/kg, 4 marker PAHs: 1.67 – 2.16 µg/kg, B[a]P: 0.51 – 0.75 µg/kg) than electric ceramic contact grill (15 heavy PAHs: 0.69 – 3.55 µg/kg, 4 marker PAHs: 0.31 – 1.89 µg/kg, B[a]P: 0.05 – 0.65 µg/kg). The concentrations of all analyzed heavy PAHs in meat marinated in universal marinade grilled on the electric ceramic contact grill (Figure 2a) were below the method detection limit. The fact that could explain this result is that the cast iron contact grill had a corrugated surface, and the fat accumulated in grooves recesses and promotes the concentration of PAHs. The ceramic contact grill had a smooth bottom surface and a lower grilling temperature. Consequently, the fat melted less. Moreover, the melting fat did not accumulate on its surface.
Figure 2.
Comparison of mean content of B[a]P, 4 marker–SFC PAHs, and total 15 PAHs for chicken breast tenderloin samples grilled on the charcoal grill without a tray (W1), charcoal grill with an aluminum tray (W2), ceramic contact grill (E1) and cast iron grill (E2) marinated in various marinades a) universal marinade (KMU), b) chicken marinade (KMK), c) honey–mustard marinade (KMM), d) without marination (KBM). * Different values for various marination treatments used in the same method of grilling followed by the different lowercase letters (a–c) are significantly different at α=0.05 level. ** Different values for various grills in the same marination treatment followed by the different capital letters (A–D) are significantly different at α=0.05 level.
The concentration levels of B[a]P and 4 heavy and marker PAHs in the analyzed samples did not exceed the requirements of Commission Regulation (EU) No. 915/2023 of 25 April 2023 for grilled meat products (5 µg/kg for B[a]P, 30 µg/kg for 4 heavy PAHs) [20]. Therefore, it can be concluded that each final product did not pose a health problem.
According to the current study's results and other authors' conclusions, the highest PAH concentration in charcoal grill samples may result from direct heating and the high temperature of coals reaching 900 °C [2]. Modification of the charcoal grill by using an aluminum tray showed a significantly lower concentration of PAHs, such as using an electric cast iron contact grill and an electric ceramic contact grill. Different studies have confirmed that the method of grilling significantly differentiates PAH contamination in cooked products. Most studies, however, as previously mentioned, focused on the determination of PAHs from the US EPA list. Badyda et al. [28] in their study noticed that the concentration of 15 EPA PAHs was considerably higher in meat grilled over charcoal briquettes (48.19 µg/kg) and ten times lower on the electric grill (4.25 µg/kg). Similar studies have been conducted by Fatma et al. [29] on grilled broiler chicken. The highest mean values of benzo[a]pyrene, the sum of 4 PAHs and total PAHs, mostly from EPA list, were detected in charcoal grill samples (1.38 µg/kg, 3.09 µg/kg, and 36.0 µg/kg, respectively) while preparing meat on the electric grill generated the lowest average levels of PAHs (0 µg/kg, 0.44 µg/kg, and 26.4 µg/kg, respectively). These results agreed with those of Hamzawy et al. [30], whose study showed an almost 100% reduction of the mean concentration of B[a]P in electric grilled chicken and Σ 16 EPA PAHs at the level of 0.04 µg/kg, instead of traditional charcoal grilled samples for which Σ 16 EPA PAHs was equal to 1.60 µg/kg. These results corresponded to the conclusions formulated by Onwukeme et al. [31] that the level of PAHs is strongly affected by the cooking method. The barbecued and fried samples were the most contaminated by 16 EPA PAHs (0.20 µg/kg, 10.84 µg/kg, respectively) compared to boiled and roasted chicken (0.14 µg/kg, 0.18 µg/kg, respectively). Furthermore, Husseini et al. [32] in their study noticed that grilled thighs, which have a larger amount of lipids, contained a higher amount of 4 heavy PAHs (2.89 – 49.90 µg/kg) than grilled chicken breast (1.52 – 42.74 µg/kg).
3.3.2. Effect of Various Marinades on PAH Formation in Grilled Chicken Breast Tenderloins
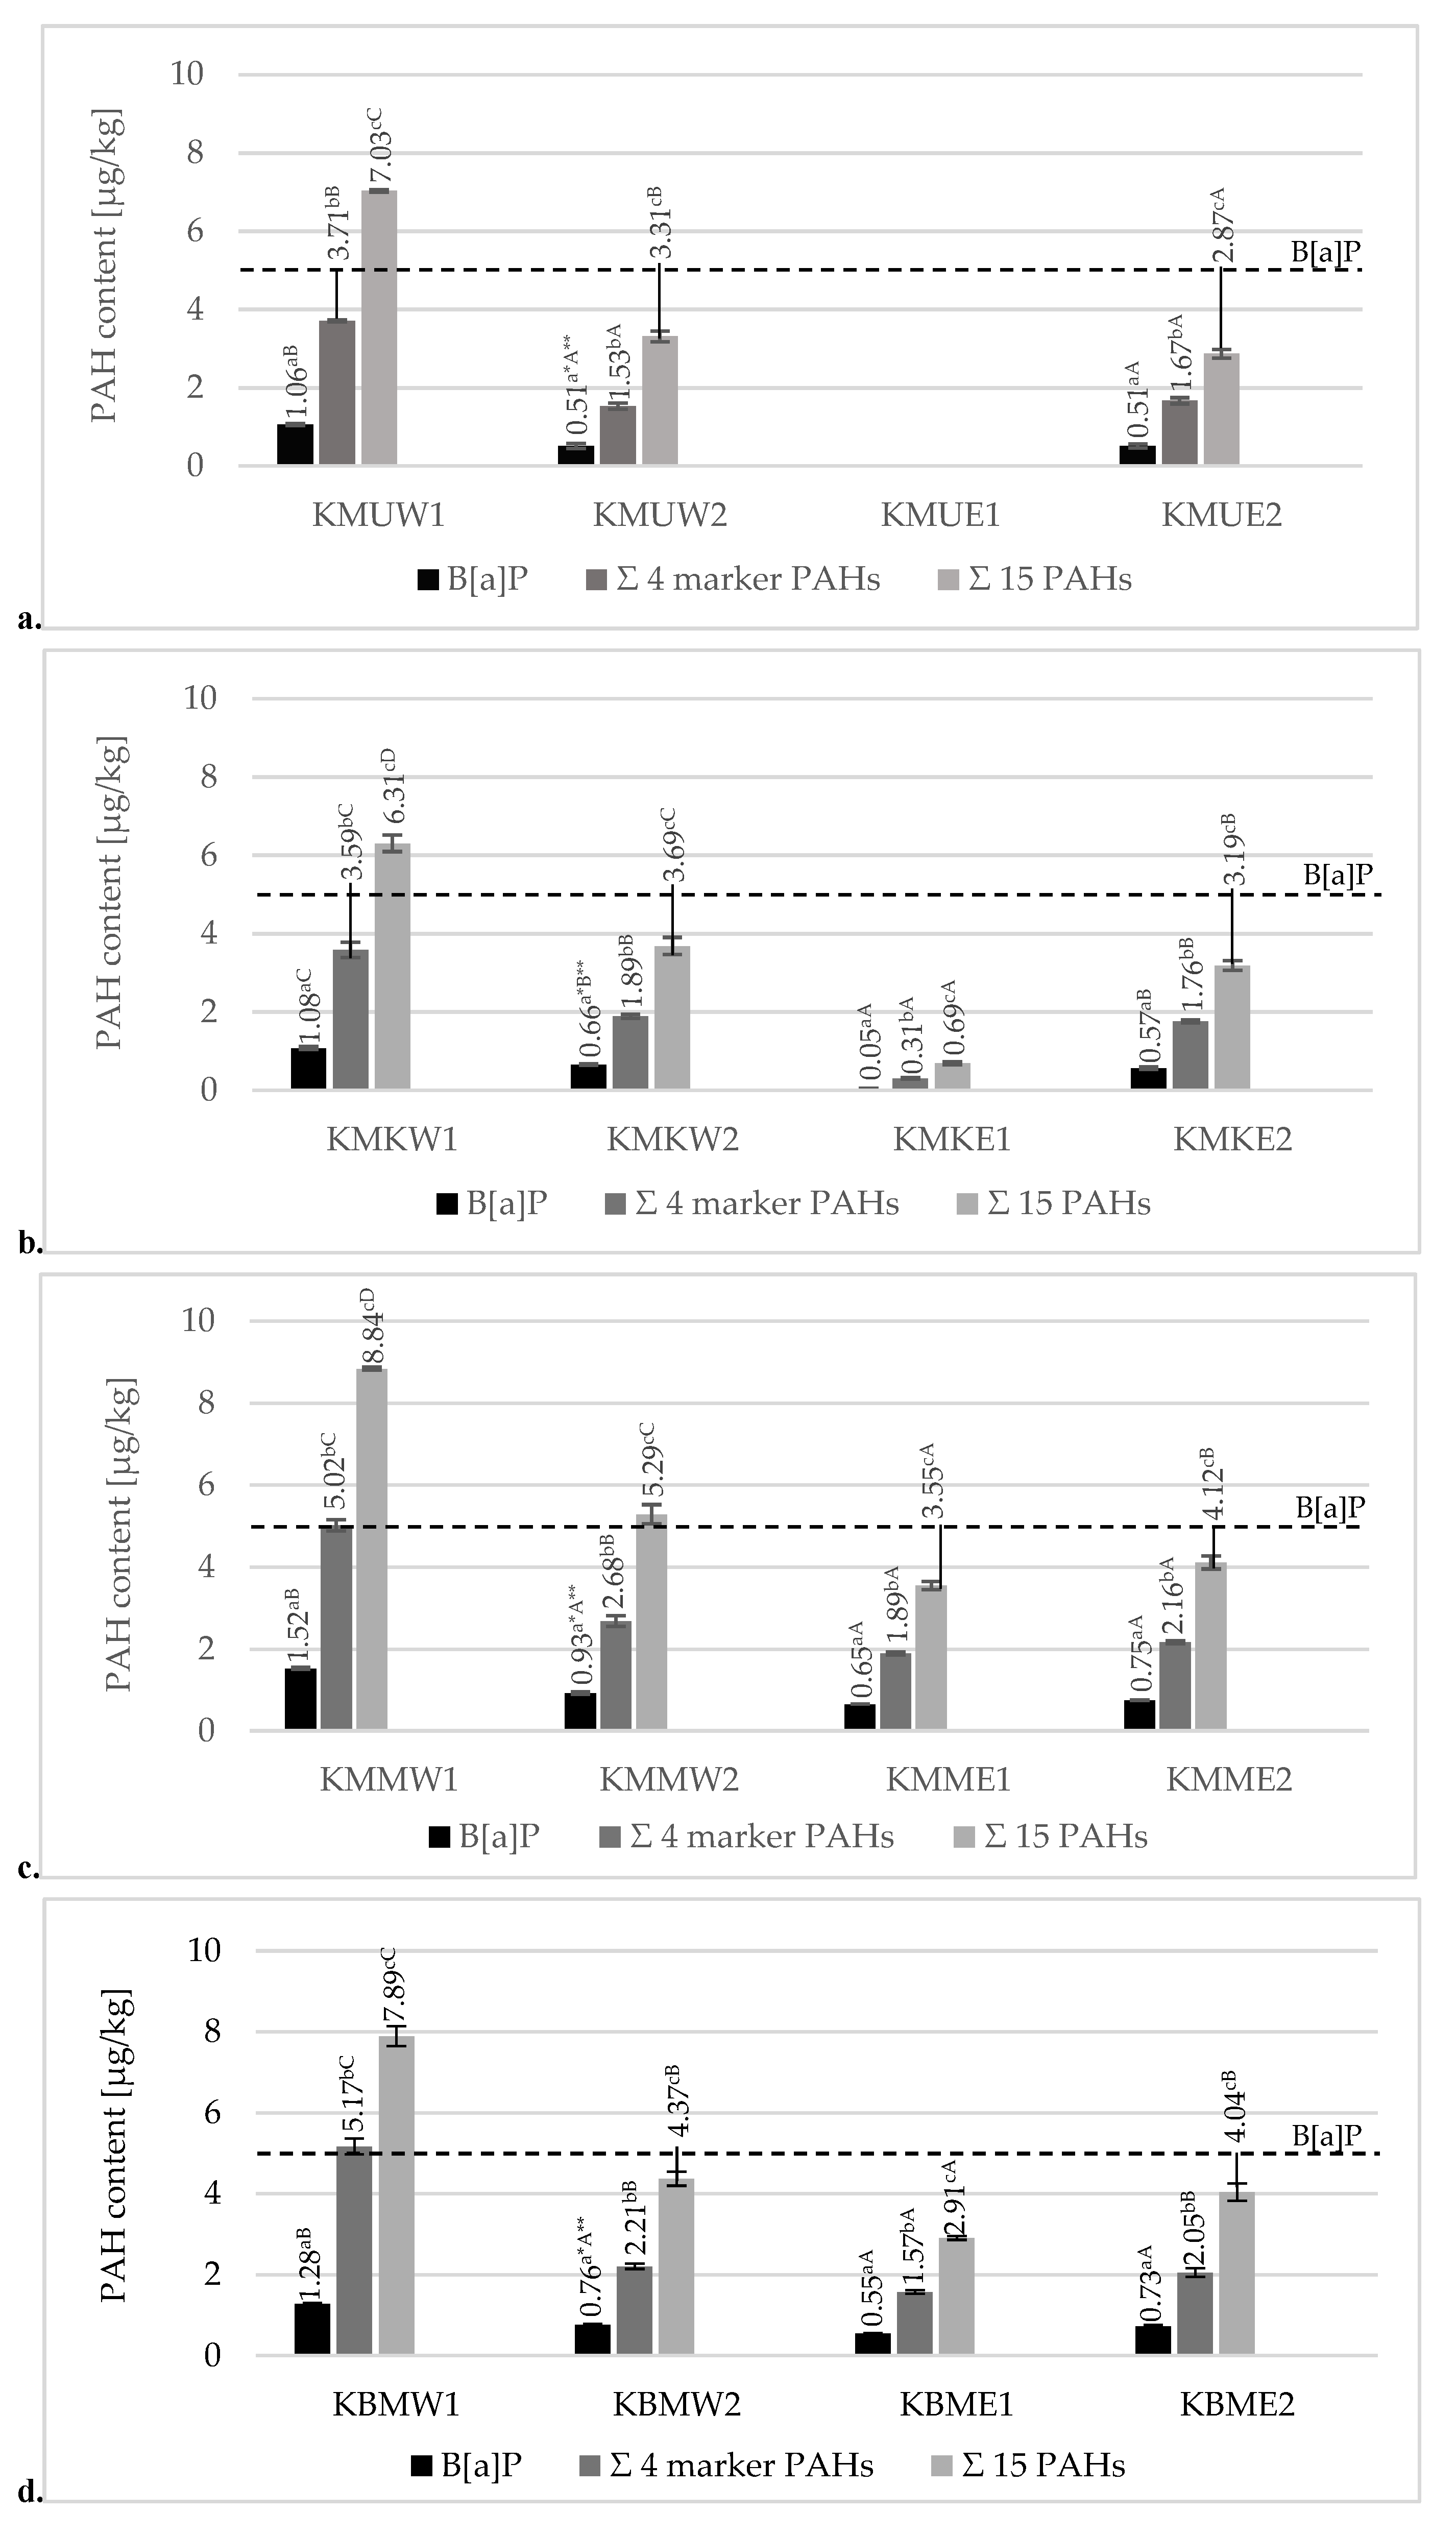
In the study, three different marinades were used to reduce the level of PAHs in grilled chicken breast tenderloins. Results of the mean content of PAHs in meat products prepared with three different marinades and samples without it are presented in Figure 3. Data of the sum of analyzed PAHs, including 15 SCF PAHs, 4 heavy–marker SCF PAHs, and B[a]P, are given.
The obtained results confirmed the statistically significant differences in the content of PAHs between marinated and unmarinated samples. The results for the charcoal grill without a tray (Figure 3a) illustrated that the highest total concentration of 15 PAHs was observed in chicken breast tenderloins marinated in honey–mustard marinade (8.84 µg/kg) and significantly the lowest in chicken marinade (6.31 µg/kg). Similarly to a charcoal grill without a tray, samples grilled using an aluminum tray (Figure 3b) showed significantly the highest concentration of PAHs in honey–mustard marinade (5.29 µg/kg). However, the lowest concentration was observed in universal marinade (3.31 µg/kg). According to the concentration of PAH4 and benzo[a]pyrene, the highest contamination levels of these compounds were observed in the honey–mustard marinade samples (5.02 µg/kg, 1.52 µg/kg, respectively) and without marinade (5.17 µg/kg, 1.28 µg.kg, respectively). Significantly, the lowest contamination levels of the sum of 4 heavy PAHs and B[a]P were observed in universal (3.71 µg/kg, 1.06 µg/kg, respectively) and chicken marinade (3.39 µg/kg, 1.08 µg/kg, respectively). However, after using a tray, contamination in honey–mustard marinade was significantly higher (2.68 µg/kg, 0.93 µg/kg, respectively) than in samples without marination treatment (2.21 µg/kg, 0.76 µg/kg, respectively). The contamination levels in samples prepared on an electric ceramic grill (Figure 3c) for the sum of 15 PAHs and 4 heavy ones were significantly different for each variant. Similarly to charcoal grill without an aluminum tray, the highest PAH contamination was observed in honey–mustard marinade (2.91 µg/kg, 1.57 µg/kg, respectively) and the lowest in chicken marinade treatment (0.69 µg/kg, 0.31 µg/kg, respectively). Comparing these samples regarding B[a]P concentration, the chicken marinade showed the lowest concentration of this compound (0.05 µg/kg). However, for B[a]P, there was no significant difference between the honey–mustard marinade and the sample without treatment (0.55 and 0.65 µg/kg). For universal marinade, heavy PAHs were not detected at all in meat prepared on an electric ceramic grill. Regarding the total 15 and 4 heavy–marker PAH contamination in the chicken breast tenderloin samples grilled on a cast iron contact grill (Figure 3d), it was noted that universal and chicken marinade led to significantly lower levels of contamination (2.87–3.19 µg/kg and 1.67–1.76 µg/kg, respectively). In samples without marination treatment and grilled in honey–mustard marinade, the concentrations were significantly higher (4.04 – 4.12 µg/kg and 2.05 – 2.16 µg/kg, respectively, for the sum of 15 PAHs and 4 marker PAHs). However, for each variant of samples, there were no significant differences in the concentration of B[a]P (0.51 – 0.75 µg/kg).
Considering applicable legal requirements, the concentrations of B[a]P and 4 heavy PAHs in all samples were within the limit established by Commission Regulation (EU) No. 915/2023 [20].
Other studies have also reported that marinating food can significantly affect the concentration of PAHs by decreasing it. In studies followed by Wang et al. [33], it was found that chicken wings, which were marinated in six different beer marinades, showed significantly lower concentrations of B[a]P (0.30 – 1.17 µg/kg) and PAH8 (4.31 – 8.89 µg/kg) than samples without marinade (B[a]P: 2.05 µg/kg; PAH8: 13.03 µg/kg). The same author’s research [34] on chicken wings marinated in various phenolic marinades with different concentrations of gallic, ferulic, and protocatechuic acids confirmed that marinating samples by adding 0.1–5 mg/l of acids before the grilling process can effectively inhibit the formation of B[a]P and PAH8 (B[a]P: 2.08 – 2.95; PAH8: 7.66 – 10.66 µg/kg). Samples without any phenolic acid added showed significantly higher concentrations of PAHs (B[a]P: 3.27 µg/kg, PAH8: 12.83 µg/kg). The obtained results corresponded to the conclusions formulated by Yunita et al. [35] to the effect that lemon marinade can reduce PAH content. Chicken satay without lemon marinade showed the highest concentration of B[a]P and PAH4 (5.61 µg/kg and 14.96 µg/kg, respectively). Regarding samples with different percentages of the lemon marinade, the sample with the highest lemon concentration (15%) showed the lowest levels of carcinogens (B[a]P: 3.72 µg/kg; PAH4: 8.79 µg/kg).
Figure 3.
Comparison of mean content of B[a]P, 4 marker–SFC PAHs, and total 15 PAHs for chicken breast tenderloin samples marinated in universal, chicken, honey–mustard marinade and without marination (respectively KMU, KMK, KMM and KBM) grilled on a) charcoal grill without a tray (W1), b) charcoal grill with an aluminum tray (W2), c) ceramic contact grill (E1), d) cast iron grill (E2). * Different values for various grills in the same method of marination treatment followed by different lowercase letters (a–c) are significantly different at α=0.05 level. ** Different values for various marination treatments in the same method of grilling followed by different capital letters (A–D) are significantly different at α=0.05 levelThe results obtained in this work and other studies confirmed that marinating chicken meat with spices and other food additives rich in phenolic compounds and antioxidants can reduce the levels of polycyclic aromatic hydrocarbons. However, this study has shown that the presence of sugars in marinade can also increase the contamination of PAHs. In most cases, chicken breast tenderloins marinated in honey–mustard marinade showed significantly higher PAH contamination than samples without marinade. Kazazic et al. [36], in their study of monitoring honey contamination with PAHs, reported that honey from apiaries located close to industrial areas had a higher level of PAHs (12.58 µg/kg) than hives located in unpolluted areas (total PAHs: 2.68 – 4.76 µg/kg). PAH concentration levels in honey can be diverse and depend on other factors, including vehicle traffic intensity. Nor Hasyimah et al. [37] noticed that samples of grilled beef satay marinated in honey–spices marination had significantly higher levels of PAH contamination (B[a]P: 4.49 – 32.60 µg/kg; PAH8: 78.47 – 164.40 µg/kg) than control samples without marinade (B[a]P: 2.67 – 4.60 µg/kg; PAH8: 34.59 – 89.52 µg/kg). Moreover, samples with Trigona sp. honey–spices marination grilled at 250℃ and 350℃ showed higher levels of the sum of 15 PAHs from the US EPA list (197.05 and 350.38 µg/kg, respectively) than samples with Apis mellifera honey used (168.04 and 296.03 µg/kg). The amount of sugars in honey also determines the differences in concentrations of PAHs between those samples. Raw samples marinated in honey from Trigona sp. bees have significantly higher amounts of reducing sugars (2.42 ± 0.11 g/100 g) than samples marinated in honey from Apis mellifera bees (1.54 ± 0.04 g/100 g). The researchers explained that a higher level of PAH contamination is caused by changes associated with the Maillard reaction and that carbohydrates can act as precursors of PAH formation. High temperatures above 110℃ cause thermal degradation of honey components such as glucose and fructose, and chloropropanols are formed, which are precursors to PAH formation [37].
3.3.3. Analysis of PAH Qualitative Profiles
Describing the samples prepared on the charcoal grill with and without an aluminum tray (Figure 4, Table S1), the 4 light PAHs constituted 84 – 94% of all PAHs under investigation, and the 15 heavy PAHs averaged 6 – 16% of the total content of 19 PAHs. The results from this study revealed that the concentration of PAHs in grilled chicken breast tenderloin samples depends on the marinade used and that the high sugar content of the marinade causes a higher level of contamination with heavy PAHs. Therefore, the highest percentages of 15 heavy PAHs of the total 19 PAHs content were stated for samples marinated in honey–mustard marinade and averaged 15 and 16%, respectively, for the charcoal grill with and without an aluminum tray.
The qualitative profiles of PAH contamination of 4 light and 15 heavy polyarenes were also performed for two electric grills: the cast iron electric grill with a corrugated top and bottom surface and the ceramic electric grill with a smooth bottom surface (Figure 5, Table S2).
Figure 4.
The qualitative profile of the 4 light and the 15 heavy PAHs in the 19 PAHs content in chicken breast tenderloins prepared on the charcoal grill without tray (W1) and charcoal grill with aluminum tray (W2).
Figure 4.
The qualitative profile of the 4 light and the 15 heavy PAHs in the 19 PAHs content in chicken breast tenderloins prepared on the charcoal grill without tray (W1) and charcoal grill with aluminum tray (W2).
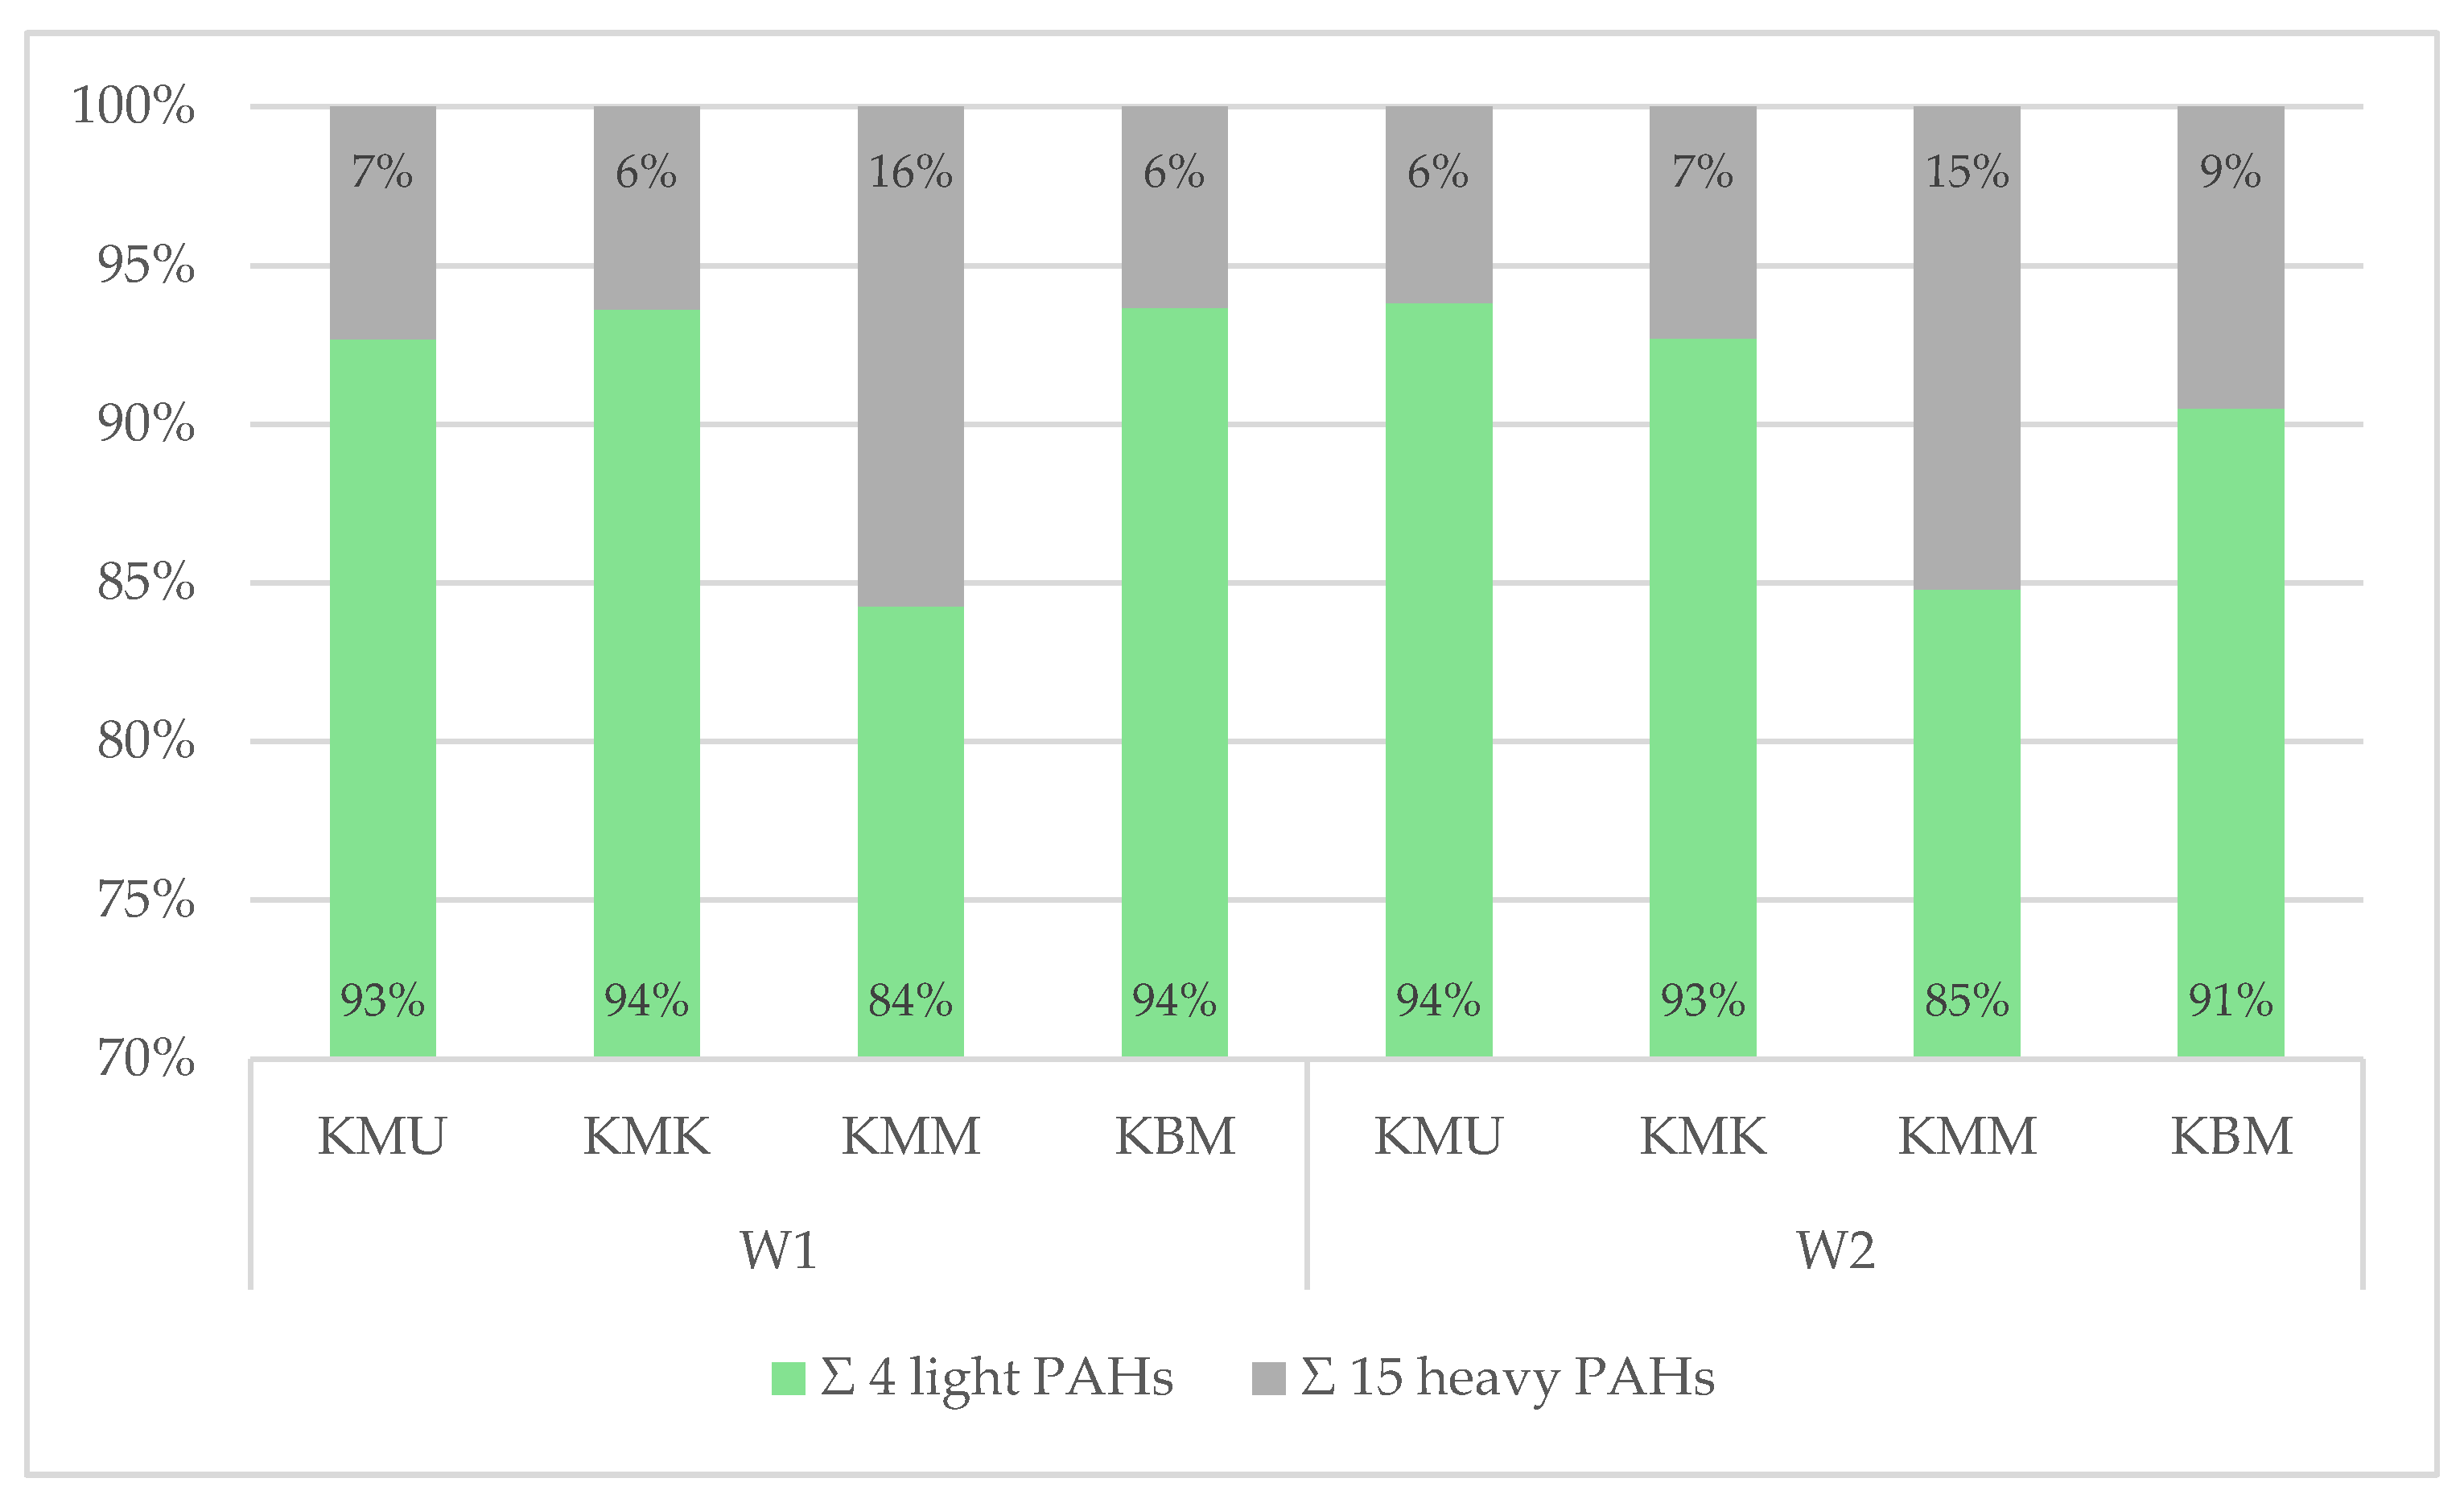
Figure 5.
The qualitative profile of the 4 light and the 15 heavy PAHs in the 19 PAHs content in chicken breast tenderloins prepared on the electric ceramic contact grill (E1) and electric cast iron contact grill (E2).
Figure 5.
The qualitative profile of the 4 light and the 15 heavy PAHs in the 19 PAHs content in chicken breast tenderloins prepared on the electric ceramic contact grill (E1) and electric cast iron contact grill (E2).
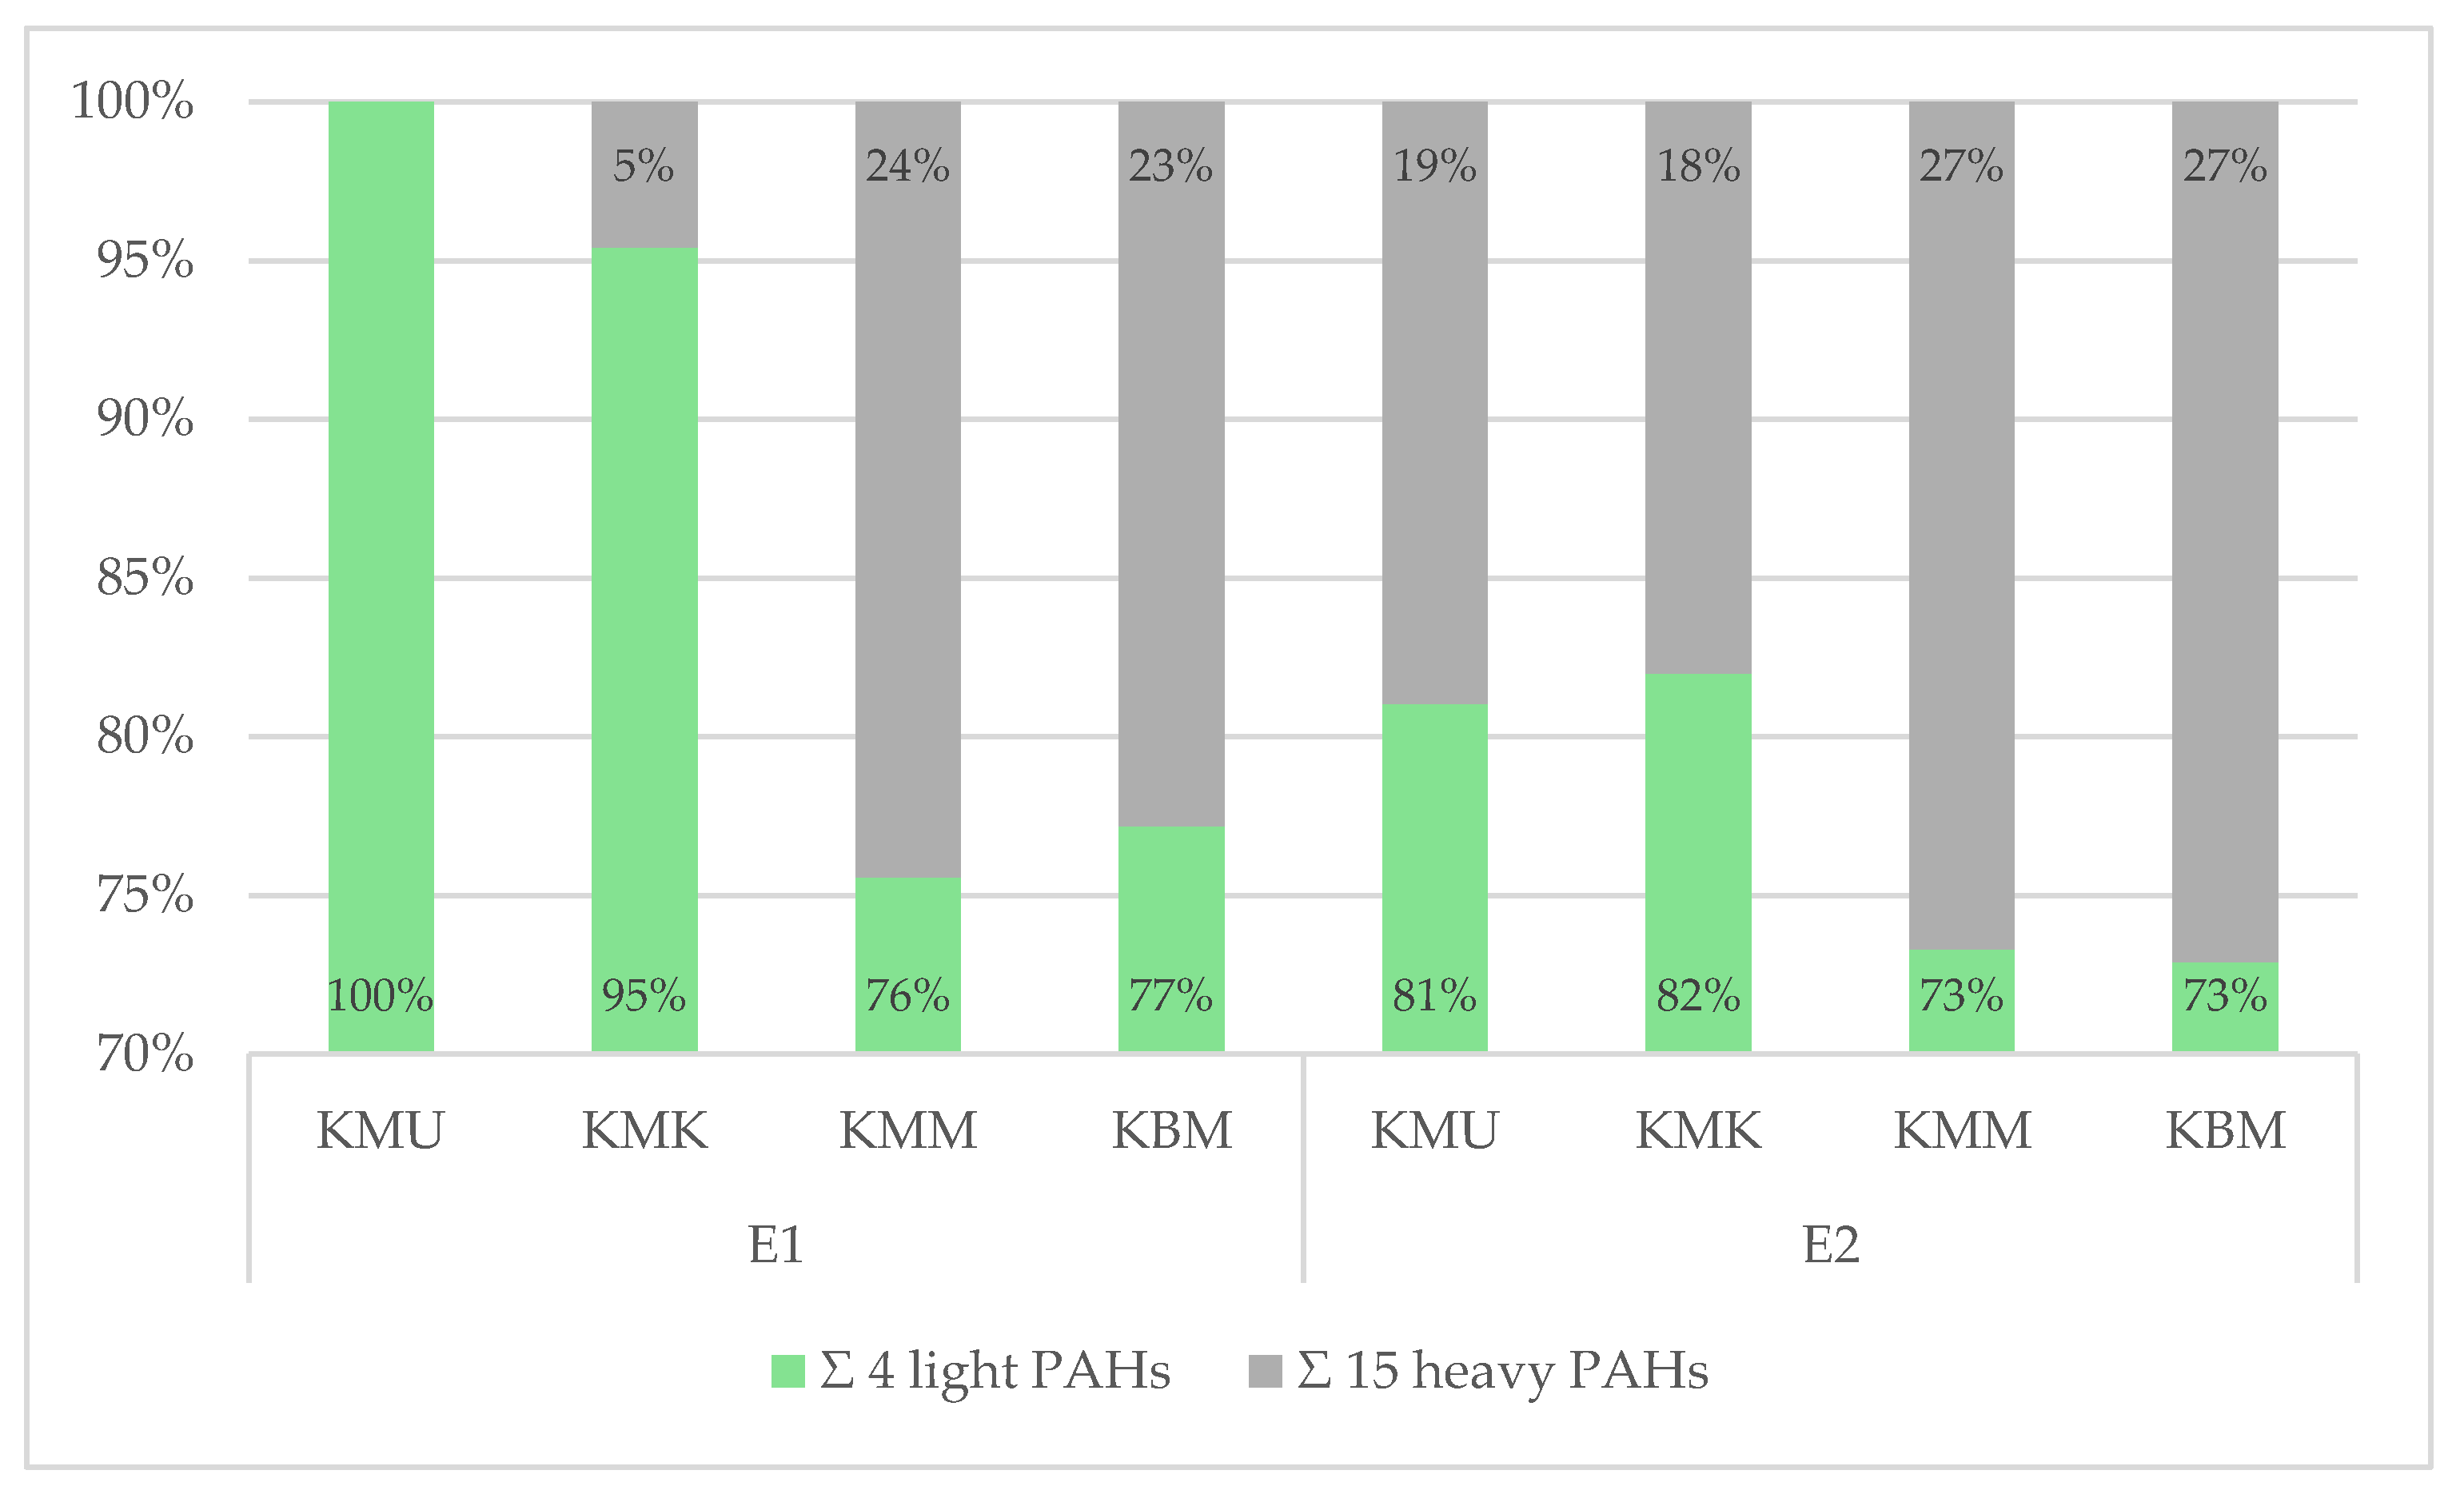
The analysis of the tested PAHs on the cast iron contact grill revealed that the 15 heavy PAHs constituted 18 to 27%, and the 4 light PAHs averaged from 73 to 82%. Chicken breast tenderloin samples marinated in honey–mustard marinade and without it showed higher contamination of heavy PAHs (27%) than the other two samples prepared in universal and chicken marination treatment (19% and 18%, respectively). The analysis of the electric ceramic grill showed differentiation in the heavy and light hydrocarbon percentages between the samples. The same as in iron grill samples, the qualitative profiles of chicken breast tenderloins marinated in the honey–mustard marinade and without marination showed a higher share of the sum of 15 heavy PAHs (24% and 23%) and lower in the chicken marinade (5%). Moreover, in universal marinated samples, only light PAHs were detected. The cast iron grill applied in this work caused higher levels of 15 heavy SCF PAH percentage in each of the samples, which may be explained by the high pressure of the grilling plates on the product and the corrugated bottom surface of the appliance, which caused the accumulation of fat and its pyrolysis. Therefore, the above–mentioned results and studies of the other authors confirmed that the PAH contamination profile is influenced by many factors [38], including the type of grill, design of grilling tools, grilling conditions, and marinade treatment used.
4. Conclusions
In conclusion, our study shows that chicken poultry meat subjected to heat treatment on a grill can be a source of carcinogenic compounds such as PAHs. Conscious selection of appropriate equipment for grilling and marinating meat before cooking is extremely important for consumers and food producers, allowing for minimizing the harmful impact of PAHs on human health. Charcoal grills, due to direct contact of the chicken breast tenderloins with the heat source, cause the highest levels of PAH contents in processed meat. Modification of charcoal grills by using an aluminum tray or indirect grilling methods and the selection of suitable processing parameters can reduce PAH contamination. In addition, key strategies for minimizing PAHs in grilled poultry meat involve appropriate marinades used before grilling, especially those rich in phenolic compounds. Therefore, considering the high consumption rate of grilled meat, notably in the summer season, following the rules of safe grilling, consumers can reduce the amount of PAHs and ensure the safety of consumed products. Additional scientific research on strategies for the reduction of polycyclic aromatic hydrocarbons in various food products is essential to enhance food safety and protect public health.
Supplementary Materials
The following supporting information can be downloaded at the website of this paper posted on Preprints.org, Table S1: Content of individual PAHs in chicken breast tenderloins in different marinades and unmarinated grilled on the charcoal grill without a tray (W1) and with an aluminum tray (W2); Table S2: Content of individual PAHs in chicken breast tenderloins in different marinades and unmarinated grilled on the electric ceramic contact grill (E1) and cast iron contact grill (E2).
Author Contributions
Conceptualization, M.C.; methodology, M.C..; software, M.C.; validation, M.C.; formal analysis, M.C.; investigation, M.C. and U.K.; data curation, M.C.; writing—original draft preparation, M.C. and U.K.; writing—review and editing, M.C.; visualization, M.C. and U.K.; supervision, M.C.; project administration, M.C. All authors have read and agreed to the published version of the manuscript.
Funding
This research received no external funding.
Data Availability Statement
The data presented in this study are available on request from the corresponding author.
Conflicts of Interest
The authors declare no conflict of interest.
References
- Lawal, A.T. Polycyclic aromatic hydrocarbons: A review. Cogent Environ. Sci. 2017, 3, 1339841. [CrossRef]
- Zhang, Y.; Chen, X.; Zhang, Y. Analytical chemistry, formation, mitigation and risk assessment of polycyclic aromatic hydrocarbons: from food processing to in vivo metabolic transformation. Compr. Rev. Food Sci. Food Saf. 2021, 20(2), 1422–1456. [CrossRef]
- United States Environmental Protection Agency, US EPA. Environmental Fate of Selected Polynuclear Aromatic Hydrocarbons. Final Report, Task Two. Office of Toxic Substances, 1976, Washington D.C. Available online: https://www.epa.gov/sites/default/files/2019-03/documents/ambient-wqc-pah-1980.pdf (accessed on 02 July 2024).
- Scientific Committee on Food. Polycyclic Aromatic Hydrocarbons–Occurrence in Foods, Dietary Exposure and Health Effects. Report No. SCF/CS/CNTM/PAH/29 Add1 Final 2002. Available online: https://ec.europa.eu/food/fs/sc/scf/out154_en.pdf (accessed on 15 June 2024).
- International Agency for Research on Cancer. Some non–heterocyclic polycyclic aromatic hydrocarbons and some related exposures. IARC Monogr. Eval. Carcinog. Risks Hum. 2010, Lyon, 92. Available online: http://monographs.iarc.fr/ENG/Monographs/vol92/ (accessed online on 15 May 2024).
- Commission of the European Communities. Commission Recommendation (EC) No. 108/2005 of 4 February 2005 on the Further Investigation into the Levels of Polycyclic Aromatic Hydrocarbons in Certain Foods. Official Journal of the European Union 2005, L 34/3. Available online: https://eur-lex.europa.eu/eli/reco/2005/108/oj (accessed on 01 June 2024).
- WHO. Summary Report of the Sixty-Fourth Meeting of the Joint FAO/WHO Expert Committee on Food Additive (JECFA). The ILSI Press International Life Sciences Institute 2005, Washington, D.C., 8–17. Available online: https://openknowledge.fao.org/home (accessed on 15 May 2024).
- European Food Safety Authority, EFSA. Polycyclic Aromatic Hydrocarbons in Food. Scientific Opinion of the Panel on Contaminants in the Food Chain Adopted on 9 June 2008. EFSA Journal 2008, 6, 724. [CrossRef]
- Hayakawa, K. Polycyclic aromatic hydrocarbons. In Handbook of Air Quality and Climate Change; Akimoto, H., Tanimoto, H.; Springer, Singapore 2022, 227–244. Available online: https://doi.org/10.1007/978-981-15-2527-8_22-1 (accessed on 16 May 2024). [CrossRef]
- Manousi, N.; Zachariadis, G.A. Recent advances in the extraction of polycyclic aromatic hydrocarbons from environmental samples. Molecules 2020, 25(9), 2182. [CrossRef]
- Yabalak, E.; Aminzai, M.T.; Gizir, A.M.; Yang, Y. A review: subcritical water extraction of organic pollutants from environmental matrices. Molecules 2024, 29(1), 258. [CrossRef]
- Maciejczyk, M.; Janoszka, B.; Szumska, M.; Pastuszka, B.; Waligóra, S.; Damasiewicz-Bodzek, A.; Nowak, A.; Tyrpień-Golder, K. Polycyclic Aromatic Hydrocarbons (PAHs) in Grilled Marshmallows. Molecules 2024, 29, 3119. [CrossRef]
- Liu, T.; Zhang, L.; Pan, L.; Yang, D. Polycyclic Aromatic Hydrocarbons’ Impact on Crops and Occurrence, Sources, and Detection Methods in Food: A Review. Foods 2024, 13, 1977. [CrossRef]
- Lei, S.; Youling, L.X. Plant protein–based alternatives of reconstructed meat: Science, technology, and challenges. Trends Food Sci. Tech. 2020, 102, 51–61. [CrossRef]
- Wang, Z.; Ng, K.; Warner, R.D.; Stockmann, R.; Fang, Z. Reduction strategies for polycyclic aromatic hydrocarbons in processed foods. Compr. Rev. Food Sci. Food Saf. 2022; 21(2), 1598-1626. [CrossRef]
- Sampaio, G.R.; Guizellini, G.M.; Silva, S.A.; Almeida, A.P.; Pinaffi–Langley, A.C.C.; Rogero, M.M.; Camargo, A.C.; Torres, E.A.F.S. Polycyclic aromatic hydrocarbons in foods: biological effects, legislation, occurrence, analytical methods, and strategies in reduce their formation. Int. J. Mol. Sci. 2021, 22(11), 1–30. [CrossRef]
- Onopiuk, A.; Kołodziejczak, K.; Szpicer, A.; Wojtasik–Kalinowska, I.; Wierzbicka, A.; Półtorak, A. Analysis of factors that influence the PAH profile and amount in meat products subjected to thermal processing. Trends Food Sci. Tech. 2021, 115, 366–379. [CrossRef]
- Shahidi, F.; Hossain, A. Importance of insoluble–bound phenolics to the antioxidant potential is dictated by source material. Antioxidants 2023, 12(1), 1–28. [CrossRef]
- Ciecierska, M.; Dasiewicz, K.; Wołosiak, R. Method of minimizing polycyclic aromatic hydrocarbon content in homogenized smoked meat sausages using different casing and variants of meat–fat raw material. Foods 2023, 12(22), 4120. [CrossRef]
- Commission of the European Communities. Commission Regulation (EU) No. 915/2023 of 25 April 2023 on maximum levels of certain contaminants in food and repealing Regulation (EC) No 1881/2006. Official Journal of the European Union 2011. Available online: http://data.europa.eu/eli/reg/2011/835/oj (accessed on 15 June 2024).
- Commission of the European Communities. Commission Regulation (EU) No. 836/2011 amending Regulation (EC) No. 333/2007 laying down the methods of sampling and analysis for the levels of lead, cadmium, mercury, inorganic tin, 3-MCPD and benzo(a)pyrene in foodstuffs. Official Journal of the European Union 2011. Available online: http://data.europa.eu/eli/reg/2011/836/oj (accessed on 20 June 2024).
- Ormian, M.; Augustyńska–Plejsnar, A.; Sokołowicz, Z. Jakość mięsa kur z chowu ekologicznego po zakończonym okresie nieśności. Post. Tech. Przem. Spoż. 2017, 2, 11–14. https://yadda.icm.edu.pl/baztech/element/bwmeta1.element.baztech-32e03781-e3b3-43a6-bcc6-71e0577a20a2.
- Suleman, R.; Hui, T.; Wang, Z.; Liu, H.; Zhang, D. Comparative analysis of charcoal grilling, infrared grilling and superheated steam roasting on the color, textural quality and the heterocyclic aromatic amines of lamb patties. J. Food Sci. Tech. 2019, 1–12. [CrossRef]
- Purslow, P.P.; Oiseth, S.; Hughes, J.; Warner, R.D. The structural basis of cooking loss in beef: variations with temperature and ageing. Food Res. Int. 2016, 89(1), 739–748. [CrossRef]
- Suman, P.S.; Mahesh, N.N.; Poulson, J.; Melvin, C.H. Factors influencing internal color of cooked meats. Meat Sci. 2016, 120, 133–144. [CrossRef]
- Silva, F.A.P.; Ferreira, V.C.S.; Madruga, M.S.; Estévez, M. Effect of the cooking method (grilling, roasting, frying and sous–vide) on the oxidation of thiols, tryptophan, alkaline amino acids and protein cross–linking in jerky chicken. J. Food Sci. Tech. 2016, 53, 3137–3146. [CrossRef]
- Wongmaneepratip, W.; Jom, K.N.; Vangai, K. Inhibitory effects of dietary antioxidants on the formation of carcinogenic polycyclic aromatic hydrocarbons in grilled pork. Asian–Australasian J. Ani. Sci. 2019, 32(8), 1205–1210. [CrossRef]
- Badyda, A.J.; Rogula–Kozłowska, W.; Majewski, G.; Bralewska, K.; Widziewicz–Rzońca, K.; Piekarska, B.; Rogulski, M., Bihałowicz, J.S. Inhalation risk to PAHs and BTEX during barbecuing: The role of fuel/food type and route of exposure. J. Hazard. Mater. 2022, 440, 1–11. [CrossRef]
- Fatma, H.M.A.; Abdel–Azeem, M.A.; Jehan, M.M.O.; Nasser, S.A. Effect of different grilling methods on polycyclic aromatic hydrocarbons content in grilled broiler chicken. J. Vet. Med. Res. 2023, 30, 1, 7–11. [CrossRef]
- Hamzawy, A.H.; Khorshid, M.; Elmarsafy, A.M.; Souaya, E.R. Estimated daily intake and health risk of polycyclic aromatic hydrocarbon by consumption of grilled meat and chicken in Egypt. Int. J. Curr. Microbiol. App. Sci. 2016, 5(2), 435–448. [CrossRef]
- Onwukeme, V.I.; Obijiofor, O.C.; Asomugha, R.N.; Okafor, F.A. Impact of cooking methods on the levels of polycyclic aromatic hydrocarbons (PAHs) in chicken meat. J. Environ. Sci. Toxicol. Food Technol. 2015, 9(4), 21–27. [CrossRef]
- Husseini, M.E.; Makkouk, R.; Rabaa, A.; Omae, F.A.; Jaber, F. Determination of polycyclic aromatic hydrocarbons (PAH4) in the traditional Lebanese grilled chicken: implementation of new, rapid and economic analysis method. Food Anal. Methods. 2017, 11, 201–214. https://link.springer.com/article/10.1007/s12161-017-0990-3.
- Wang, Ch.; Xie, Y.; Wang, H.; Bai, Y.; Dai, C.; Li, C.; Xu, X.; Zhou, G. Phenolic compounds in beer inhibit formation of polycyclic aromatic hydrocarbons from charcoal–grilled chicken wings. Food Chem. 2019, 294, 578–586. [CrossRef]
- Wang, H.; Wang, C.; Li, C.; Xu, X.; Zhou, G. Effects of phenolic acid marinades on the formation of polycyclic aromatic hydrocarbons in charcoal–grilled chicken wings. J. Food Prot. 2019, 82(4), 684–690. [CrossRef]
- Yunita, C.N.; Radiati, L.E.; Rosyidi, D. Effect of lemon marination on polycyclic aromatic hydrocarbons (PAH) and quality of chicken satay. J. Pen. Pend. IPA 2023, 9(6), 4723–4730. [CrossRef]
- Kazazic, M.; Djapo–Lavic, M.; Mehic, E.; Jesenkovic–Habul, L. Monitoring of honey contamination with polycyclic aromatic hydrocarbons in Herzegovina region. Chem. Ecol. 2020, 36, 1–7. [CrossRef]
- Nor Hasyimah, A.K.; Jinap, S.; Sanny, M.; Ainaatul, A.I.; Sukor, R.; Jambari, N.N.; Nordin, N.; Jahurul, M.H.A. Effects of honey–spices marination on polycyclic aromatic hydrocarbons and heterocyclic amines formation in gas–grilled beef satay. Polycycl. Aromat. Comp. 2020, 42(4), 1620–1648. [CrossRef]
- Sumer, G.; Oz, F. The effect of direct and indirect barbecue cooking on polycyclic aromatic hydrocarbon formation and beef quality. Foods 2023, 12(7), 1–15. [CrossRef]
Figure 1.
The HPLC–FLD chromatograms of heavy SCF PAHs of chicken breast tenderloin samples marinated in universal marinade (brown), honey–mustard marinade (black), chicken marinade (blue), and without marination (pink) grilled on the charcoal grill without a tray.
Figure 1.
The HPLC–FLD chromatograms of heavy SCF PAHs of chicken breast tenderloin samples marinated in universal marinade (brown), honey–mustard marinade (black), chicken marinade (blue), and without marination (pink) grilled on the charcoal grill without a tray.
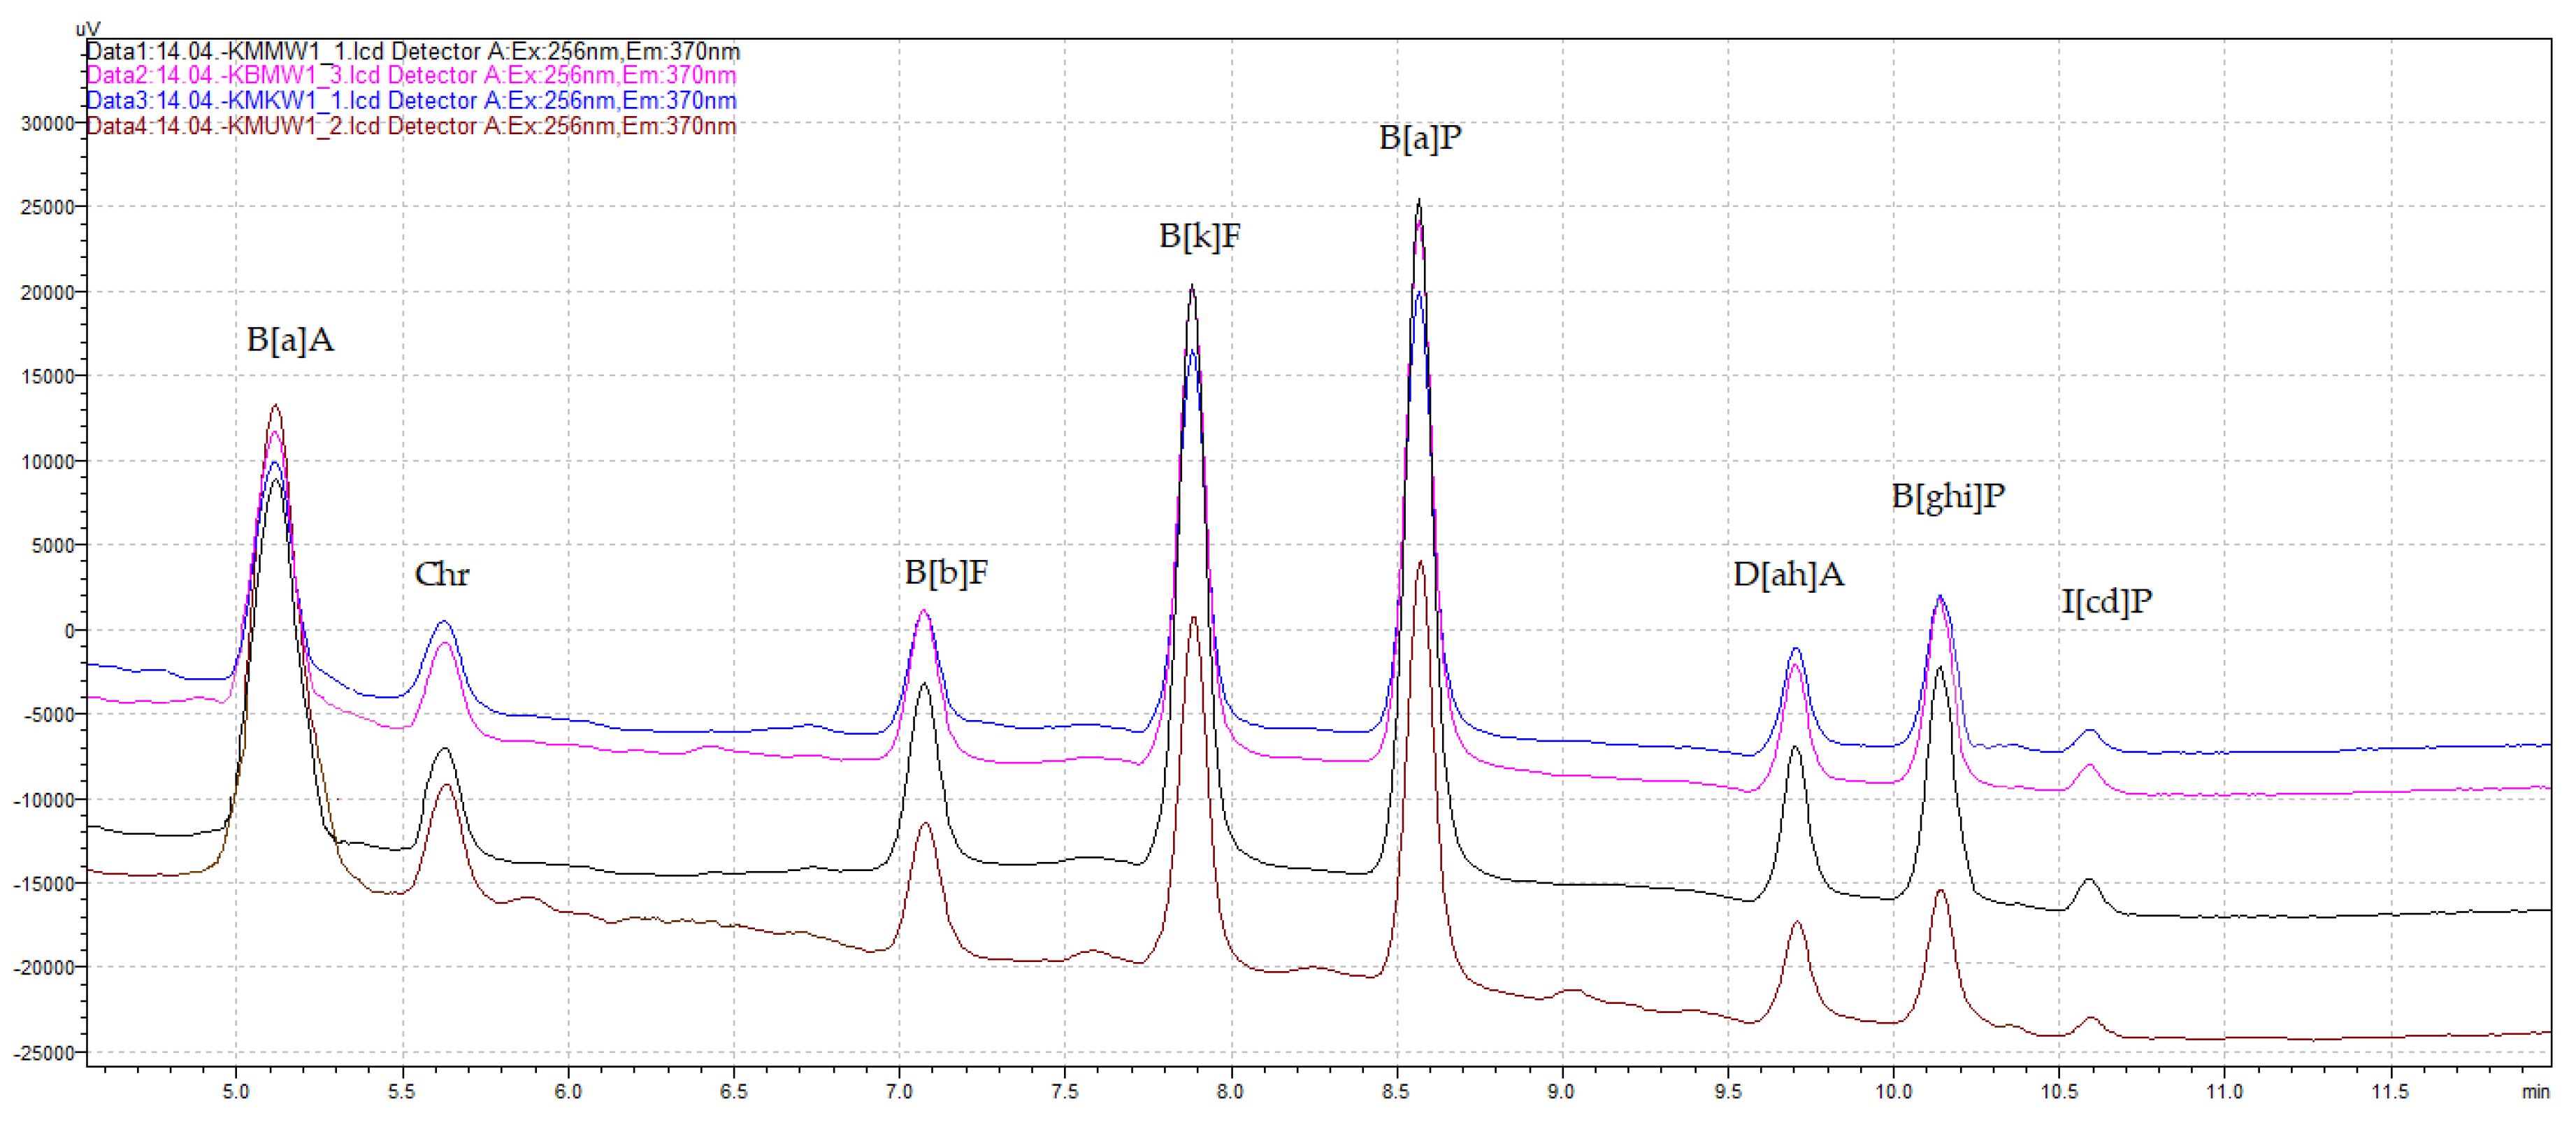

Table 1.
Composition of marinades.
| Marinade treatment | Ingredients [g/100 g of meat] | Code |
|---|---|---|
| Universal marinade | 5 g universal seasoning (composition: salt, rosemary (10.3%), basil, sugar, onion, paprika, oregano, marjoram, ground mustard, coriander, sunflower oil, thyme, lemon juice, turmeric, cayenne pepper), 5 g refined rapeseed oil | MU |
| Chicken marinade | 5 g chicken seasoning (composition: salt, coriander (11.0%), granulated garlic, sweet pepper (6.5%), rosemary, fenugreek (3.0%), basil (2.2%), black pepper, chili, turmeric, ginger, thyme), 5 g refined rapeseed oil | MK |
| Honey–mustard marinade | 5 g spicy mustard (water, white mustard, spirit vinegar, black mustard, sugar, salt, aroma, turmeric extract), 3.5 g lime honey, 1 g refined rapeseed oil, 0.5 g freshly squeezed lemon juice | MM |
Table 2.
Grilling parameters.
| Type of grill | Grill temperature [℃] | Grilling time [min] | Temperature at the end of the grilling process in the geometric center of the product [℃] |
|---|---|---|---|
| W1 | 240 – 300 | 8 | 88.1 |
| W2 | 170 – 220 | 13 | 81.3 |
| E1 | 180 – 200 | 10 | 85.1 |
| E2 | 200 – 220 | 10 | 87.8 |
Table 3.
The QuEChERS-HPLC–FLD/DAD method performance for PAH analysis in grilled chicken breast tenderloin sample.
Table 3.
The QuEChERS-HPLC–FLD/DAD method performance for PAH analysis in grilled chicken breast tenderloin sample.
| PAH | Calibration curve | Correlation coefficient r2 | Linearity range (µg/L) | LOD (µg/kg) | LOQ (µg/kg) | Recovery for 100 µg/kg of sample fortification | Recovery for 10 µg/kg of sample fortification | Recovery for 1 µg/kg of sample fortification | Recovery (%) * | RSD (%) * | HORRATR value * |
|---|---|---|---|---|---|---|---|---|---|---|---|
| Phen | y = 102211x + 37486.4 | 0.9997 | 1–50 | 0.08 | 0.16 | 81.5 | 78.8 | 76.9 | 79.1 | 8.5 | 0.7 |
| Anthr | y = 62303.9x + 26899.6 | 0.9990 | 1–50 | 0.09 | 0.18 | 81.8 | 77.9 | 74.8 | 78.2 | 8.6 | 0.7 |
| F | y = 23407.8x + 35387.1 | 0.9993 | 1–50 | 0.10 | 0.20 | 88.3 | 86.7 | 81.8 | 85.6 | 9.4 | 0.8 |
| Pyr | y = 268840x + 86012.2 | 0.9997 | 1–50 | 0.05 | 0.10 | 91.1 | 88.9 | 86.6 | 88.9 | 9.7 | 0.8 |
| C[cd]P | y = 221120x + 11345 | 0.9993 | 2–50 | 0.35 | 0.70 | 107.5 | 108.9 | 109.9 | 108.8 | 8.7 | 0.7 |
| B[a]A | y = 120488x + 36275.5 | 0.9997 | 1–50 | 0.06 | 0.12 | 92.2 | 88.9 | 84.8 | 88.6 | 7.2 | 0.6 |
| Chr | y = 39749.7x + 12690.7 | 0.9997 | 1–50 | 0.07 | 0.14 | 87.5 | 84.0 | 82.9 | 84.8 | 7.7 | 0.6 |
| 5-MChr | y = 97566x – 6394.4 | 0.9999 | 1–50 | 0.07 | 0.14 | 89.8 | 83.5 | 80.2 | 84.5 | 7.8 | 0.7 |
| B[j]F | y = 1600.7x + 196.91 | 0.9997 | 2–50 | 0.25 | 0.50 | 82.7 | 81.2 | 78.9 | 80.9 | 7.5 | 0.6 |
| B[b]F | y = 64900x + 19646.3 | 0.9997 | 1–50 | 0.08 | 0.16 | 91.3 | 86.4 | 80.5 | 86.1 | 8.4 | 0.7 |
| B[k]F | y = 193555x + 59017.2 | 0.9997 | 1–50 | 0.07 | 0.14 | 92.8 | 88.6 | 84.1 | 88.5 | 7.6 | 0.6 |
| B[a]P | y = 122195x + 65266.3 | 0.9998 | 1–50 | 0.07 | 0.14 | 91.6 | 89.8 | 86.3 | 89.2 | 7.7 | 0.6 |
| D[ah]A | y = 45718.9x + 11119 | 0.9999 | 1–50 | 0.12 | 0.24 | 85.1 | 81.5 | 80.1 | 82.2 | 8.2 | 0.7 |
| D[al]P | y = 359.96x – 154.23 | 0.9995 | 2–50 | 0.20 | 0.40 | 81.4 | 77.2 | 73.8 | 77.5 | 8.4 | 0.7 |
| B[ghi]P | y = 69415.7x + 18240.4 | 0.9999 | 1–50 | 0.14 | 0.28 | 88.6 | 85.2 | 82.7 | 85.5 | 8.5 | 0.7 |
| I[cd]P | y = 11025.7x + 1670.83 | 0.9997 | 1–50 | 0.21 | 0.42 | 83.6 | 81.4 | 78.0 | 81.0 | 8.6 | 0.7 |
| D[ae]P | y = 8144.2x + 456.41 | 0.9997 | 1–50 | 0.22 | 0.44 | 82.1 | 76.9 | 73.1 | 77.3 | 9.4 | 0.8 |
| D[ai]P | y = 226619x – 96869 | 0.9997 | 1–50 | 0.11 | 0.22 | 82.3 | 79.2 | 73.0 | 78.1 | 9.1 | 0.8 |
| D[ah]P | y = 172110x – 68308 | 0.9997 | 1–50 | 0.13 | 0.26 | 79.0 | 73.0 | 71.0 | 74.4 | 9.9 | 0.8 |
* Mean recovery, RSD, and HORRATR values of three different levels of sample fortification.
Table 4.
Weight loss in various marinated and unmarinated grilled chicken breast tenderloin samples.
Table 4.
Weight loss in various marinated and unmarinated grilled chicken breast tenderloin samples.
| Universal marinade | Chicken marinade | Honey–mustard marinade | Without marinade | ||||
|---|---|---|---|---|---|---|---|
| Sample code | Weight loss [%] | Sample code | Weight loss [%] | Sample code | Weight loss [%] | Sample code | Weight loss [%] |
| KMUW1 | 36.6±0.27c* | KMKW1 | 25.7±0.28c | KMMW1 | 39.0±0.28c | KBMW1 | 32.8±0.53c |
| KMUW2 | 15.7±0.36a | KMKW2 | 20.4±0.15b | KMMW2 | 34.0±0.19b | KBMW2 | 18.0±0.46a |
| KMUE1 | 16.2±0.04a | KMKE1 | 18.0±0.24a | KMME1 | 27.5±0.32a | KBME1 | 19.8±0.10b |
| KMUE2 | 23.6±0.05b | KMKE2 | 20.0±0.14b | KMME2 | 33.6±0.19b | KBME2 | 32.2±0.06c |
* Different values in the same marination treatment followed by different lowercase letters (a–c), meaning one analyzed comparison, are significantly different at α=0.05 level. K – Chicken breast tenderloins. MU – Universal marinade, MK – Chicken marinade, MM – Honey–mustard marinade, BM – Without marinade.
Table 5.
Color of marinated and unmarinated chicken breast tenderloins before and after grilling on different grills.
Table 5.
Color of marinated and unmarinated chicken breast tenderloins before and after grilling on different grills.
| Cooking method | Sample | L* | a* | b* |
|---|---|---|---|---|
| Before grilling | KMU | 33.27±1.07a*AB** | 6.39±0.25bA | 11.10±0.51bA |
| KMK | 36.00±1.08aA | 9.93±0.68bA | 13.06±0.82bA | |
| KMM | 48.12±0.64bAB | 2.26±0.15aA | 4.60±0.38aA | |
| KBM | 45.46±2.81bA | 4.45±0.27abA | 3.02±0.63aA | |
| Charcoal grill without a tray | KMUW1 | 32.88±1.63aA | 9.87±0.69aA | 24.76±0.42bB |
| KMKW1 | 48.22±0.77bB | 11.60±1.12abB | 22.28±0.99abB | |
| KMMW1 | 38.74±0.18aA | 15.96±0.07bB | 17.33±0.40aB | |
| KBMW1 | 57.43±0.32cB | 11.55±0.35aB | 24.23±1.93bC | |
| Charcoal grill with an aluminum tray | KMUW2 | 46.93±0.74aB | 6.13±0.39bA | 25.99±0.71cB |
| KMKW2 | 53.84±2.06bB | 7.68±0.19bA | 29.34±0.86cC | |
| KMMW2 | 65.46±0.23cC | 4.95±0.62abA | 23.33±1.29bCD | |
| KBMW2 | 74.79±1.64dC | 3.79±0.52aA | 14.87±0.19aB | |
| Ceramic contact grill | KMUE1 | 41.22±1.27aBC | 7.96±0.90bA | 21.44±1.18aB |
| KMKE1 | 48.86±1.41aB | 11.19±0.45cB | 24.16±1.44acBC | |
| KMME1 | 54.22±1.15bB | 13.43±0.66cBC | 28.50±0.72cD | |
| KBME1 | 69.81±1.83cC | 3.85±0.53aA | 19.72±1.19aBC | |
| Cast iron contact grill | KMUE2 | 43.23±1.57aC | 7.87±0.66aA | 25.06±0.70abB |
| KMKE2 | 50.86±1.08bB | 9.93±0.42aAB | 27.45±0.60bBC | |
| KMME2 | 52.54±1.30abB | 14.19±0.74bC | 17.19±0.46aBC | |
| KBME2 | 68.68±1.48cC | 5.27±0.18aA | 22.21±1.65abC |
* Different values in the same method of grilling followed by different lowercase letters (a–d) are significantly different at α=0.05 level. ** Different values in the same marination treatment followed by different capital letters (A–D) are significantly different at α=0.05 level.
Table 6.
The difference in color of chicken breast tenderloins before and after grilling.
| Charcoal grill without a tray | Charcoal grill with an aluminum tray | Ceramic contact grill | Cast iron contact grill | ||||
|---|---|---|---|---|---|---|---|
| Sample | ΔE | Sample | ΔE | Sample | ΔE | Sample | ΔE |
| KMUW1 | 14.10±0.20a*AB** | KMUW2 | 20.21±1.69aC | KMUE1 | 13.14±0.91aA | KMUE2 | 17.21±2.20aBC |
| KMKW1 | 15.40±0.86aA | KMKW2 | 24.26±2.53bC | KMKE1 | 17.03±0.87aAB | KMKE2 | 20.68±0.81aBC |
| KMMW1 | 20.92±0.48bA | KMMW2 | 25.67±1.15bB | KMME1 | 27.08±0.92bB | KMME2 | 17.90±0.80aA |
| KBMW1 | 25.37±2.29cA | KBMW2 | 31.64±3.18cB | KBME1 | 29.54±2.87bB | KBME2 | 30.14±2.66bB |
* Different values in the same method of grilling followed by different lowercase letters (a–d) are significantly different al α=0.05 level. ** Different values in the same marination treatment followed by different capital letters (A–D) are significantly different at α=0.05 level.
Disclaimer/Publisher’s Note: The statements, opinions and data contained in all publications are solely those of the individual author(s) and contributor(s) and not of MDPI and/or the editor(s). MDPI and/or the editor(s) disclaim responsibility for any injury to people or property resulting from any ideas, methods, instructions or products referred to in the content. |
© 2024 by the authors. Licensee MDPI, Basel, Switzerland. This article is an open access article distributed under the terms and conditions of the Creative Commons Attribution (CC BY) license (http://creativecommons.org/licenses/by/4.0/).
Copyright: This open access article is published under a Creative Commons CC BY 4.0 license, which permit the free download, distribution, and reuse, provided that the author and preprint are cited in any reuse.


