
Submitted:
21 October 2024
Posted:
24 October 2024
You are already at the latest version
Abstract
Background. Gastrointestinal (GI) distress is prevalent and often persistent among cancer survivors, impacting their quality of life, nutrition, daily function, and mortality. GI health screening is important to prevent and manage this distress. However, accurate classification methods for GI health remain unexplored. We aimed to develop machine learning (ML) models to classify GI health status (better vs. worse) by incorporating biological aging and social determinants of health (SDOH) indicators in cancer survivors. Methods. We included 645 adult cancer survivors from the 1999-2002 NHANES survey. Using training and test datasets, we employed six ML models to classify GI health conditions (better vs. worse). These models incorporated leukocyte telomere length (TL), SDOH, and demographic/clinical data. Results. Among the ML models, the random forest (RF) performed the best, achieving a high area under the curve (AUC = 0.98) in the training dataset. The gradient boosting machine (GBM) demonstrated excellent classification performance with a high AUC (0.80) in the test dataset. TL, several socio-economic factors, cancer risk behaviors (including lifestyle choices), and inflammatory markers were associated with GI health. The most significant input features for better GI health in our ML models were longer TL and an annual household income above the poverty level, followed by routine physical activity, low white blood cell counts, and food security. Conclusions. Our findings provide valuable insights into classifying and identifying risk factors related to GI health, including biological aging and SDOH indicators. To enhance model predictability, further longitudinal studies and external clinical validations are necessary.
Keywords:
cancer survivors
; gastrointestinal health
; telomere
; social determinants of health
; machine learning
1. Introduction
Cancer is the second leading cause of death in the United States, after heart disease. Projections for 2024 estimated 2.0 million new cases and 611,720 cancer deaths [1]. Encouragingly, medical advancements have increased survival rates among patients with cancer [2,3]. However, cancer survivors often deal with multiple short- and long-term side effects over the course of their cancer treatments [2,3]. These effects include physical (e.g., pain, neuropathy, functional limitations), gastrointestinal (GI), and mental health (e.g., depression, anxiety) concerns [2-4]. The prevalence and severity of these physical, GI, and mental health concerns can vary widely, impacting survivors’ health-related quality of life (HRQOL), treatment adherence, daily functioning, nutrition, and overall prognosis. Addressing these overall health concerns is essential for enhancing cancer survivors’ well-being in the long term.
Of note, GI symptoms often persist in cancer survivors even after completing treatment. These symptoms include nausea/vomiting, appetite loss, altered bowel movements (e.g., diarrhea or constipation), bloating, indigestion, heartburn, and abdominal pain [5-9]. GI symptoms rank as the most common chronic physical side effects of cancer treatments, after psychological distress and fatigue in cancer survivors with mixed cancer types [10]. In 142 breast cancer survivors, the GI symptom cluster was the second most prevalent after chemotherapy [11]. In 413 colorectal cancer survivors, 81% experienced persistent GI symptoms 8 years post-treatment [8]. In a review of GI toxicity after radiotherapy in rectal cancer survivors, long-term GI toxicity continued for over 3 months and included diarrhea (35%), fecal incontinence (22%), abdominal gas (71%), and abdominal pain (13%) [12].
GI side effects related to cancer treatments are prevalent in older adults cancer patients, impacting physical and social functioning and HRQOL [13]. GI symptoms are significant concerns for older adults cancer patients, with the incidence of overall GI symptoms reported to be as high as 40% in cancer patients on standard-dose chemotherapy and 100% on high-dose chemotherapy [14]. Several factors contribute to the increased prevalence of GI issues in this population. Firstly, the aging process causes clinically significant effects on oropharyngeal motility, upper-esophageal motility, colonic function, and GI immunity [15]. Second, older adults often have comorbidities and long-term exposure to medications, alcohol, and tobacco that may exacerbate GI distress [16]. Further, cancer treatments can induce accelerated aging in individuals with cancer [17]. Mechanisms such as oxidative stress, inflammation, and mitochondrial dysfunction are implicated [17]. This accelerated aging phenomenon can worsen existing GI health conditions. As such, GI health concerns may be associated with the aging process, and cancer survivors can be more vulnerable to these connections.
Recent studies highlight the increased significance of biological over chronological aging in cancer survivors’ physical and psychological well-being [18-20]. Of note, telomere length (TL), which shortens during cell division, is a validated measure of biological aging [21,22]. In individuals of the same chronological age, shorter TL is linked to accelerated biological aging and various health conditions in cancer survivors [20,21]. While the association of TL with survival and mortality is well-studied in cancer survivors [22], its association with HRQOL, including GI health, requires further investigation [18,19]. Social determinants of health (SDOH) significantly impact the physical and mental health of cancer survivors. Factors such as race/ethnicity, socioeconomic status, education, and marital status play crucial roles in the health outcomes of cancer survivors [23,24]. Chronic stress associated with poor SDOH triggers systemic inflammation, exacerbating physical symptoms [25,26]. Moreover, there is a potential link between TL, SDOH, and inflammation [27]. Poor SDOH status was associated with TL shortening due to chronic stress and inflammation in US adults living in the community [27]. Therefore, SDOH and TL may be related to GI health in cancer survivors. Understanding this complex interplay could inform interventions to improve GI health in cancer survivors.
The classification of GI health conditions and identification of contributing factors are crucial steps in choosing and applying personalized interventions for cancer survivors [28,29]. Machine learning (ML) offers substantial advantages in cancer survivorship care, particularly in classification or prediction models [30,31]. Unlike traditional statistical methods, ML can handle small sample sizes and multiple variables with complex relationships by controlling covariates and multicollinearity. It excels at identifying intricate patterns, handling high-dimensional data, and adapting over time [30,31]. This capability is especially beneficial in cancer survivorship research, where the number of survivors for certain types of cancer might be limited, and the relationships among cancer treatments, and health outcomes can be complex [28,29]. While ML has been employed to develop predictive models for cancer diagnosis and survival [32], its application to GI health conditions in cancer survivors remains relatively rare.
Therefore, by leveraging ML with high precision, we aimed to develop and validate an ML classification model of GI health conditions (better vs. worse), incorporating TL and SDOH indicators as our primary interests, and demographic and clinical characteristics including inflammatory markers as secondary interests. The current study is a pilot to explore and identify the significant features including biological aging markers (i.e., TL in our study), and SDOH indicators to classify GI health conditions in adult cancer survivors, not just limited to those over 65. This approach enhances the performance of ML classification models by increasing sample size and providing a comprehensive understanding of GI health across different age groups.
2. Methods
2.1. Sample and Procedures
In this secondary analysis, we employed data from the National Health and Nutrition Examination Survey (NHANES), conducted by the National Center for Health Statistics (NCHS) under the Centers for Disease Control (CDC) [33]. The NHANES includes cross-sectional, nationally representative health and nutritional data from 21,004 non-institutionalized US civilian aged 2 months and older [33]. We combined NHANES surveys from 1999-2000 and 2001-2002, for which leukocyte DNA samples were obtained to assess TL in participants 20 years of age and above. Of the 10,291 participants 20 or over, 7,827 (76%) had TL data. Among the participants with TL data, 645 with self-reported cancer diagnoses were included in the current study. We also applied sampling weights in the analysis to address oversampling and non-response biases, ensuring the accuracy of estimates reflecting the broader US population [34]. We employed a standard mining approach consisting of four stages: (1) data acquisition, (2) preprocessing (e.g., data cleaning, exploratory data with addressing class imbalances, optimizing dataset classes with feature engineering, and data normalization), (3) model learning with training and testing data, and (4) model evaluation [35] (Figure 1).
2.2. Features
2.2.1. Demographic and clinical data including inflammatory markers.
Information on chronological age (years), sex (male, female), comorbidities including hypertension, diabetes, cardiovascular disease, and history and types of cancer diagnosis were collected from self-reported questionnaires. White blood cell count (WBC) was extracted from complete blood count (CBC) data retrieved from the “Complete Blood Count with 5-part Differential - Whole Blood” category of the 1999-2002 NHANES laboratory data [36]. C-reactive protein (mg/dL) levels were measured by high-sensitivity, latex-enhanced nephelometry by the Immunology Division, Department of Laboratory Medicine, University of Washington Medical Center. As diet is relevant to GI health, we also included diet data [36].
2.2.2. Telomere length (TL) measurement.
The measurement of TL in the NHANES study has been published elsewhere [37-40]. Detailed protocols describing TL measurement for the NHANES study are accessible on the CDC website under the laboratory section [41]. In brief, TL was assessed by isolating purified DNA from whole blood samples using the Puregene (D-50 K) protocol. The TL assay was conducted via polymerase chain reaction. TL was measured relative to standard reference DNA (T/S ratio), with each sample analyzed three times on different days and in duplicate wells, totaling six data points. Potential outliers (<2% of samples) were identified and excluded. The interassay coefficient of variation was 6.5% [27]. The provided values represent the mean (standard deviation) of the T/S ratio. The CDC Institutional Review Board granted human subject approval for TL measurements, which were quality-controlled before being linked with the NHANES database.
2.2.3. Social determinants of health (SDOH).
We included nine selected SDOH variables based on sociodemographic variables and cancer health risk behaviors identified in the CDC Healthy People 2030 SDOH framework [42] and in the National Academy of Medicine [43]. The nine risk factors corresponding to SDOH domains included in our study were: i) Racial/ethnic minorities, ii) Low education achievement (i.e., less than a high school diploma or equivalent), iii) poverty-income ratio (i.e., Family Income/Poverty Threshold; A ratio <1 indicates annual family income is below the poverty level), (iv) Food insecurity as per the Kendall/Cornell scale (i.e., low or very low food security)[46], (v) Current smokers (individuals who have smoked a minimum of 100 cigarettes in their lifetime and who currently smoke either daily or occasionally), (vi) Heavy drinkers (as per the Alcohol Use Disorders Identification Test-Concise [AUDIT-C] screening tool, > 4 for males and > 3 for females indicating a moderate risk of alcohol abuse) [47], (vii) Low physical activity (engaging in less than 10 minutes of moderate or intense activity or strength training in the past month), (viii) lack of a partner (divorced/widowed/single marital status) [45], and (ix) diet quality. In the NHANES 1999-2002 datasets, dietary information was collected using 24-hour recalls [37]. Using this NHANES data, we included major food groups - total energy in kcal, total protein, total carbonate, total saturated fat, total fatty acid, total sodium, and total fruit and vegetables - based on the U.S. Dietary Guidelines for Americans in our study [38]. Then, we further computed overall diet quality using the Healthy Eating Index (HEI) 2015 [37,39]. The overall HEI-2015 score varies from 0, indicating nonadherence, to 100, perfect adherence. There is no established minimal clinically significant difference for the HEI-2015 [37,39].
2.3. Outcome
2.3.1. GI health.
We evaluated GI health status (i.e., worse or better status) using the Health Status Questionnaire, which includes the CDC health-related quality of life
(HRQOL)-4. The HRQOL-4 shows high reliability (0.57 - 0.75) in the general population and cancer survivors [48]. For GI health conditions, participants were asked to answer “Did you have a stomach or intestinal illness over the last month?” (No -better GI health versus Yes -worse GI health).
2.4. Data Analyses
2.4.1. Initial data analysis.
For descriptive analyses, categorical variables were presented as counts and percentages, while continuous variables were presented as means and standard deviations. We primarily compared the training and test datasets using two-sample independent t-tests or Chi-square tests. Additionally, we examined the initial associations of input data with GI health (better versus worse) using two-sample independent t-tests or Chi-square tests.
2.4.2. Machine learning model.
Data preprocessing. We only included input variables showing significant associations with GI health in our initial data analyses. We used the permutation feature importance to quantify the impact of each feature (i.e. input variables) on GI health prediction in our ML models [31,49]. Among 645 adult cancer survivors used to build the model, all had TL data and most of the employed features were available with low missing data rates (missing data rates <4%). Despite the rates of missing data in our study being trivial, we applied multivariate imputation with chained equations to address missing data. Prior to model training, continuous features underwent min-max normalization, while categorical features were target-encoded [49] reducing feature dimensions and enhancing the performance and stability of our ML models.
Classificationmodeling. We first created a training dataset by randomly matching 75% of all cancer survivors in the dataset and created a test dataset within the remaining 25% of cancer survivors (Figure 1). Python's train_test_split function was employed to
randomly assign samples to either the training or testing set based on the average prevalences of better GI health, ensuring dataset integrity [30]. The training dataset had 484 cancer survivors, and the test dataset had 161 cancer survivors. We utilized the training dataset for initial modeling and the test dataset to assess the model’s performance in classifying GI health on unseen data. When we considered the number of features in the 645 sample size, we applied 6 supervised ML modeling methods, including logistic regression (LR), supportive vector machine (SVM), decision tree (DT), random forest (RF), gradient boosting machine (GBM), and extreme gradient boosting (XGBoost) [30]. Each method was assessed with a specific learning algorithm to determine its effectiveness in classifying GI health conditions. Logistic regression, a widely used binary classifier, served as the baseline model for comparison. Hyperparameter tuning was conducted through random search with five-fold cross-validation to prevent overfitting [49]. Binary cross-entropy was used as the evaluation criterion. Hyperparameters such as tree complexity, learning rate, and number of trees were adjusted for RF, GBM, and XGBoost. Linear kernel functions were favored over nonlinear ones, like radial basis function kernel, in support vector machine models to avoid overfitting in a small dataset [49]. Feature importance analysis identified and sorted the top influential features for predicting GI health conditions. Finally, the prediction model performance was evaluated for various metrics, including accuracy, precision, recall (sensitivity), specificity, F1 score, and area under the receiver operating characteristic curve (AUC).
We controlled for other input features that showed significant relationships with GI health in our ML models. A significance level of p < 0.05 was applied, and the statistical analyses were carried out using R software, the MLR (Machine Learning in R) R package (version 3.6.3, R Foundation for Statistical Computing, Vienna, Austria), and Python (version 3.10.2, Python Software Foundation, Wilmington, USA).
2.5. Conceptual Framework
The conceptual framework (Figure 2) for this study is based on the original framework, the Integral Conceptual Model of Frailty [50]. Figure 2 displays this framework, which includes various factors (e.g., life course determinants) and diseases (e.g., cancer and cancer treatment) that may impact frailty, which is correlated with accelerated aging. This impact is seen in the model’s sub-dimensions, namely physical, psychological, and social frailty. These three sub-dimensions can be characterized by a decline in various factors. Specifically, a decline in nutrition, mobility, physical activity, and physical function in the GI tract is relevant to GI health. Increases in frailty (specifically physical GI function in our study) ultimately result in adverse events (i.e., GI distress in our study). We used TL as a proxy for accelerated aging, which is impacted by SDOH as well as cancer disease and its treatment. Our review analyzed and synthesized the data by mapping TL (accelerated aging), SDOH (life course determinants), and GI health (adverse events) in adult cancer survivors to elements of the Integral Conceptual Model of Frailty [50]. In our study, we focused on the components represented by the grey boxes in this framework (Figure 2).
3. Results
3.1. Initial Descriptive Analyses
3.1.1. Participant characteristics, clinical data including inflammatory markers, TL, and GI health.
Table 1 describes the participant demographic and clinical characteristics and TL of both the training (N = 484, 75% of the total sample N = 645 adult cancer survivors) and the test (N = 161, 25% of the total sample N = 645 adult cancer survivors) datasets. The mean participant age was 66.3 ± 14.7 years for the training dataset and 65.5 ± 16.2 for the test dataset (p =.102). Approximately half of the participants were women, and skin cancer (approximately half were melanoma) was the most common cancer type in both datasets. WBC, CRP, and TL did not significantly differ between the training and test datasets. 66.7% reported better GI health for the training dataset, while 62.7% reported better GI health in the test dataset (p =.412).
3.1.2. SDOH variables.
Table 2 presents the SDOH variables for both datasets. Most participants were non-Hispanic Whites, married, and had an education level of high school or below. Cancer risk behaviors (such as smoking, heavy alcohol consumption, physical activity, and diet quality score – HEI) were not significantly different between the two datasets. The prevalences of participants’ annual family incomes below the poverty level, and experiencing food insecurity were similar in both datasets (39.7% versus 37.3%, p =0.423; 8.6% versus 8.1%, p =0.879, in the training dataset versus the test dataset, respectively).
3.1.3. Potential risk factors for GI health within the training dataset.
Before developing the ML model for GI health, we examined the associations between potential risk factors, including demographics, clinical data including inflammatory markers, TL, and SDOH, and GI Health in the training dataset. Table 1 and Table 2 summarize the results of these comparisons between the cancer survivors with better and worse GI health. The better GI health group was younger (63.3 years vs. 66.4 years, p = 0.031), contained a smaller number of females (47% vs. 65%, p = 0.013), and had fewer comorbidities (41% vs. 45%, p = 0.043). Mean WBC (k/ul) and CRP (mg/dl) levels were also lower in the better GI health group. The mean TL (kb) was longer in the better GI health group (Table 1). Non-Hispanic Whites were more prevalent in the better GI health group (80.3% vs. 77.3%). Hispanic individuals were more prevalent in the worse GI health group (10.7% vs. 7.5%, p = 0.039) (Table 2). Higher-income levels were associated with better GI health (p = 0.038). In terms of cancer risk behaviors, heavy alcohol users (21.3% vs. 15.2%, p <.001) were more prevalent in the worse GI health group compared to the better GI health group. Cancer survivors with regular physical activity (38.5% vs. 58.3%, p =.035) and better diet quality (7.5% vs. 5.6%, p =.038) were more likely to have better GI health status, compared to those with worse GI health status. The worse GI health group had higher prevalences of income below the poverty level (37.6%) and experiencing food insecurity (8%) than the better GI health group. Marital status, education, and current smoking status were not associated with GI health status.
3.2. Machine Learning Models for GI Health
3.2.1. Performance comparison for classification models.
We present the classification performance of all ML models using the training dataset as a development phase and the test dataset as a validation phase (Table 3). This evaluation was conducted with five-fold cross-validation. Furthermore, Figure 3 illustrates and compares the AUCs for each model in the training and test datasets. In the training dataset, random forest (RF) performed well across multiple metrics with a higher AUC value and F1 score (AUC: 0.9842, F1 score: 0.9489) compared to other models (Table 3). In the test dataset, the gradient boosting machine (GBM) model showed the best performance with the highest accuracy (0.7442), a strong AUC (0.8035), and an F1 score (0.8092), indicating good overall performance in distinguishing between the positive and negative cases. Incorporating TL (a value of feature importance = 0.31 in training dataset) and several SDOH indicators (feature importance values ranges: 0.03 to 0.24) in our ML models proved their relative importance significantly contributing to classifying GI health conditions, achieving good classification performance, and demonstrating potential high predictive accuracy for both the training and test datasets.
3.2.2. Feature Importance.
The most significant features of the best-performing models in each dataset (the RF model in the training dataset and the GBM in the test dataset), were separately ranked using the permutation feature importance (Figure 4). Figure 4 illustrates the relative importance of input features included in the ML models. Among the 13 input features excluding marital status, education, and smoking status in each RF and GBM model, the important top features for GI health were similar between the training versus testing datasets. A longer TL was the most influential feature, followed by an annual household income below the poverty level. Physical activity, lower WBC, and food security were among the top-ranked features of importance for better GI health in both datasets. While several other features (e.g., lower WBC levels, no food insecurity, higher income, younger chronological age, non-Hispanice White group) play a role in better GI health, their impact is comparatively modest.
4. Discussion
This study is the first to develop and validate the ML classification models for GI health in adult cancer survivors using supervised ML approaches to account for multiple factors. Although we used cross-sectional data, the ML algorithms used in our study constructed classification models based on demographics and clinical characteristics including inflammatory markers, TL, and SDOH factors for GI health, with good (if 0.5 < AUC < 0.7) to moderate to high (if > 0.7) prediction accuracy [29-31,49]. We also identified the relative importance of features classifying GI health conditions, by demonstrating that TL and some SDOH features (e.g., economic status, lifestyles) significantly influence the outcome classification (Better vs. Worse GI health status). The ML models developed and validated in our study could inform personalized approaches to identify cancer survivors at high risk for long-term GI distress, and thus, provide tailored interventions that address unmet needs triggering GI distress in adult cancer survivors.
Despite various predictive ML models being used in cancer survivors such as cancer diagnosis risk predictions, cancer survival rates, or detection of psychological symptoms [51-54], few studies have applied ML algorithms to classify or predict GI health in cancer survivors. Previous research has identified risk factors for GI distress in cancer survivors [7,8], but these studies did not explore the associations of TL and SDOH with GI distress. Emerging evidence supports the impact of SDOH [55,56] and biological age [56,57] on symptom disparities and HRQOL in cancer survivors. Our study addresses this gap by demonstrating the feasibility of using ML approaches to classify GI health. Specifically, we explore how TL and SDOH factors contribute to GI health in cancer survivors, providing new knowledge in this area. The ML models can handle numerous features effectively, minimizing both Type I and Type II errors in multiple comparisons. This advantage is often not feasible in traditional statistical methods (e.g., regressions and univariate analyses). Furthermore, ML models predict or classify GI health conditions more accurately than traditional statistical methods by leveraging large datasets and complex relationships among multiple input features.
Our findings suggested that not all features contributed equally to classifying GI health conditions. TL was identified as the most influential factor in GI health, independent of chronological age, suggesting a potential role for biological aging in GI conditions. The results of our study identified the positive relationships between better GI health, younger age, and longer TL. Having an income higher than the poverty level and routine physical activity also significantly contributed to better GI health.
Telomeres, protective caps at the ends of chromosomes, play a crucial role in cellular aging [39]. Beyond chronological age, short TL lengths are associated with cellular senescence, where cells lose their ability to divide and function properly. Furthermore, senescent cells release inflammatory molecules, contributing to chronic inflammation associated with GI disorders like inflammatory bowel disease, altered bowel patterns, abdominal pain, indigestion, bloating, nausea, and gastroenteritis [19,58]. Biological aging influences gut health by impairing the integrity of the intestinal barrier, affecting immune cell function, and impacting gut microbial diversity [19,58]. Further, our findings reveal that the biological age might better reflect the functional aging of the GI tract, compared to chronological age [59]. Wang et al. [19] similarly discovered that longer leukocyte TL was associated with better GI function in patients with functional GI disorders. Investigating the mechanisms responsible for the shorter leukocyte TL observed in these settings could provide insights into managing GI health beyond chronological age considerations in cancer survivors.
The poverty-income ratio (PIR), was the second most significant feature of GI health in our study, other SDOH variables—such as lower income levels and racial/ethnic minority groups—were also associated with worse GI health. Previous studies support our findings that socially and economically vulnerable populations are exposed to more chronic stress, which can influence accelerating aging and pro-inflammatory status in the body [60,61]. Furthermore, socially and economically vulnerable populations face challenges in accessing healthcare resources, including community health services, oncology care, and primary care providers (PCPs). Additionally, vulnerable populations are more likely to reside in unsafe environments and neighborhoods, which may contribute to housing and food insecurity [62]. Collectively, all of the aforementioned risk factors can contribute to various forms of GI distress in cancer survivors [61].
Cancer risk behaviors, including lifestyle choices, smoking, and alcohol consumption, have well-documented associations with physical and psychological symptoms and HRQOL in cancer survivors [24,63,64]. However, limited research has explored the specific relationships between these risk behaviors and GI health in cancer survivorship. Our findings reveal that cancer risk behaviors play a significant role in GI health conditions. Although previous research has primarily focused on other aspects of survivorship such as HRQOL and psychological symptoms [24,63,64], our study highlights the need to consider GI-specific factors. The identification of risk behaviors associated with GI health provides actionable insights for survivor care. Of note, food security was a more significant feature of GI health compared to self-reported diet quality as measured by HEI. This discrepancy in feature importance for GI health could be due to several reasons. First, self-reported diet quality may not fully capture nutrient intake or align with actual dietary behaviors [65]. Some individuals may report high diet quality despite lacking essential nutrients [65]. Second, food security is prevalent among cancer survivors in the U.S. (from 4% to 83.6%) and directly influences nutrient intake, beyond broader social determinants such as poverty, and health literacy [66,67]. Furthermore, food insecurity induces stress, which can exacerbate the risk of GI diagnoses including GI cancers and GI disorders by promoting impaired gut mobility, immune responses, and barrier function [68,69]. Access to diverse healthy foods ensures essential nutrients and greater microbiome diversity, which are vital for overall well-being including GI health [68,69].
Clinical Implications. ML plays a crucial role in classifying or predicting GI health, particularly for socially vulnerable cancer survivors. ML models analyze data from cancer survivors to pinpoint those at greater risk of GI distress. Once identified, targeted interventions can address their unmet needs, whether through pharmacological or non-pharmacological approaches. Integrating ML algorithms into platforms like mobile apps or websites (such as MyChart) is a practical approach. Furthermore, users can access personalized insights about their GI health, receive recommendations, and make informed decisions based on ML-driven risk classifications. ML models can help to further tailor interventions for high-risk groups by considering their specific social needs and vulnerabilities. For example, routine assessment of accelerated aging in cancer survivors could be essential for overall well-being and GI health. Addressing smoking cessation, promoting healthy lifestyles (healthy diet and physical activity), and minimizing alcohol consumption directly could also impact GI health and serve as an anti-aging strategy. Lastly, routine screening for socio-economic needs may contribute to optimal GI health in cancer survivors. For example, oncologists or PCPs can refer to nutritional education or food assistance programs. Increasing multidisciplinary collaboration with social workers, nutritionists, and community resources is warranted not only for overall HRQOL but also for GI health.
Strengths and Limitations. The strengths of our study lie in the inclusion of a variety of input data, specifically inflammatory markers, TL, and SDOH features. Additionally, our focus on GI health—an unexplored area in cancer survivorship—along with the application of ML models, contributes to the development of powerful classification models for GI health that consider both biological and social mechanisms. The findings of our study also reflect the importance of biological age in GI health conditions, applicable to all adult cancer survivors, not just older adults. Furthermore, our ML model was validated using an independent test dataset. Our study has several limitations. First, NHANES is a cross-sectional survey, which may limit the predictability of our ML model. To enhance predictability, longitudinal studies with predictors and GI health conditions measured at different time points are needed. Second, the usefulness of inflammatory markers (WBC and CRP) for classifying GI health remains unclear in our study. One possible reason is that mean WBC and CRP levels fell within the clinically normal range in our samples. Third, findings regarding prediction performance should be interpreted with caution due to the overall small sample size of the test dataset. Further studies with larger sample sizes are warranted to prevent model overfitting. Fourth, using a single question to ask about GI health may have limitations in fully capturing the GI health conditions. Furthermore, the roles of SDOH on the relationships between TL and GI healthy is unknown. Lastly, cancer-related clinical characteristics, such as cancer stages, years since diagnosis, and types of treatments, were not available in our samples, although they are potential covariates for our ML models related to GI health.
5. Conclusions
Using an ML approach to develop and validate GI health classification (better vs. worse) models inclusive of TL and SDOH is feasible among cancer survivors. Overall, the RF- and GBM-generated models showed the best accuracy for GI health classification. This finding suggests the potential of ML to further develop a longitudinal prediction model for GI health. TL and poverty status were the most significant features used to classify GI health, and could be implemented to prevent and manage GI conditions in cancer survivors. We suggest including biological markers and SDOH in ML GI health models to optimize classification accuracy. Future longitudinal studies and external clinical validations are warranted to confirm our findings and improve model predictability.
Supplementary Materials
The following supporting information can be downloaded at the website of this paper posted on Preprints.org. The following supporting information can be downloaded at the website of this paper posted on Preprints.org
Author Contributions
Conceptualization, CH, XN, CB, MF, AN, DV; methodology, CH, XN, TF, DV ; validation, CH, XN, CB, MF, AN, FT, DV; formal analysis, CH, FT; investigation, CH, XN, CB, TF, DV; data curation, CH; writing—original draft preparation, CH, XN; writing—review and editing, CH, XN, CB, DV, MF, AN, FT; visualization, CH; supervision, XN, CB, DV. All authors have read and agreed to the published version of the manuscript.
Funding
The work was original research that had not been published previously. CH: Cancer Research Seed Grant from the Ohio State University College of Nursing and the Ohio State University Comprehensive Cancer Center. CH is also funded by the Oncology Nurse Foundation (ONF) RE03. The content is solely the responsibility of the authors and does not necessarily represent the official views of the National Institutes of Health.
Institutional Review Board Statement
This is a second data analysis of publicly available data, thus, the NHANES studies have their up-to-date approved IRB. The current manuscript as secondary data analysis does not require ethical approval.
Informed Consent Statement
Not applicable.
Data Availability Statement
The data utilized in this study were obtained from the National Health and Nutrition Examination Survey (NHANES). NHANES data are publicly available and can be accessed through the Centers for Disease Control and Prevention (CDC) website at NHANES Data. The datasets include comprehensive health and nutritional information collected from a representative sample of the U.S. population. Researchers and the public can freely download and use these data for analysis and research purposes.
Acknowledgments
Mr. Omer Chaudhry, BS, a data scientist at Brown University consulted on the data curation and machine learning analyses in this study.
Conflicts of Interest
The authors declare no conflicts of interest.
References
- Siegel, R.L.; Giaquinto, A.N.; Jemal, A. Cancer statistics, 2024. CA Cancer J Clin. 2024, 74, 12–49. [Google Scholar] [CrossRef] [PubMed]
- Lustberg, M.B.; Kuderer, N.M.; Desai, A.; Bergerot, C.; Lyman, G.H. Mitigating long-term and delayed adverse events associated with cancer treatment: implications for survivorship. Nat Rev Clin Oncol. 2023, 20, 527–542. [Google Scholar] [CrossRef] [PubMed]
- Firkins, J.; Hansen, L.; Driessnack, M.; Dieckmann, N. Quality of life in “chronic” cancer survivors: a meta-analysis. J Cancer Surviv. 2020, 14, 504–517. [Google Scholar] [CrossRef]
- Miller, K.D.; Nogueira, L.; Devasia, T.; Mariotto, A.B.; Yabroff, K.R.; Jemal, A.; Kramer, J.; Siegel, R.L. Cancer treatment and survivorship statistics, 2022. CA Cancer J Clin. 2022, 72, 409–436. [Google Scholar] [CrossRef] [PubMed]
- Song, B.C.; Bai, J. Microbiome-gut-brain axis in cancer treatment-related psychoneurological toxicities and symptoms: a systematic review. Support Care Cancer. 2021, 29, 605–617. [Google Scholar] [CrossRef]
- Mitra, A.; Biegert, G.W.G.; Delgado, A.Y.; Karpinets, T.V.; Solley, T.N.; Mezzari, M.P.; Yoshida-Court, K.; Petrosino, J.F.; Mikkelson, M.D.; Lin, L. Microbial diversity and composition is associated with patient-reported toxicity during chemoradiation therapy for cervical cancer. Int J Radiant Oncol Biol Phys. 2020, 107, 163–171. [Google Scholar] [CrossRef]
- Han, C.J.; Yang, G.S.; Syrjala, K. Symptom experiences in colorectal cancer survivors after cancer treatments: a systematic review and meta-analysis. Cancer Nurs. 2020, 43, E132–E158. [Google Scholar] [CrossRef]
- Han, C.J.; Reding, K.W.; Kalady, M.F.; Yung, R.; Greenlee, H.; Paskett, E.D. Factors associated with long-term gastrointestinal symptoms in colorectal cancer survivors in the women’s health initiatives (WHI study). Plos one 2023, 18, e0286058. [Google Scholar] [CrossRef]
- Deleemans, J.M.; Chleilat, F.; Reimer, R.A.; Baydoun, M.; Piedalue, K.-A.; Lowry, D.E.; Henning, J.-W.; Carlson, L.E. The chemo-gut pilot study: Associations between gut microbiota, gastrointestinal symptoms, and psychosocial health outcomes in a cross-sectional sample of young adult cancer survivors. Current Oncology 2022, 29, 2973–2994. [Google Scholar] [CrossRef]
- Muls, A.C.; Watson, L.; Shaw, C.; Andreyev, H.J.N. Managing gastrointestinal symptoms after cancer treatment: a practical approach for gastroenterologists. Frontline Gastroenterology 2013, 4, 57–68. [Google Scholar] [CrossRef]
- Wiranata, J.A.; Hutajulu, S.H.; Astari, Y.K.; Leo, B.; Bintoro, B.S.; Hardianti, M.S.; Taroeno-Hariadi, K.W.; Kurnianda, J.; Purwanto, I. Patient-reported outcomes and symptom clusters pattern of chemotherapy-induced toxicity in patients with early breast cancer. PLOS ONE 2024, 19, e0298928. [Google Scholar] [CrossRef] [PubMed]
- Sipaviciute, A.; Sileika, E.; Burneckis, A.; Dulskas, A. Late gastrointestinal toxicity after radiotherapy for rectal cancer: a systematic review. International Journal of Colorectal Disease 2020, 35, 977–983. [Google Scholar] [CrossRef] [PubMed]
- Baltussen, J.C.; de Glas, N.A.; van Holstein, Y.; van der Elst, M.; Trompet, S.; Uit den Boogaard, A.; van der Plas-Krijgsman, W.; Labots, G.; Holterhues, C.; van der Bol, J.M.; et al. Chemotherapy-Related Toxic Effects and Quality of Life and Physical Functioning in Older Patients. JAMA Network Open 2023, 6, e2339116–e2339116. [Google Scholar] [CrossRef]
- Podolski, A.J.; Gucalp, R. GI Toxicities from Cancer Therapy. In Geriatric Gastroenterology; Springer: 2021; pp. 341-379. [CrossRef]
- Dumic, I.; Nordin, T.; Jecmenica, M.; Stojkovic Lalosevic, M.; Milosavljevic, T.; Milovanovic, T. Gastrointestinal tract disorders in older age. Can J Gastroentero Hepato. 2019, 2019, 6757524. [Google Scholar] [CrossRef] [PubMed]
- Busby-Whitehead, J.; Whitehead, W.E.; Sperber, A.D.; Palsson, O.S.; Simrén, M. The aging gut: Symptoms compatible with disorders of gut-brain interaction (DGBI) in older adults in the general population. J Am Geriatr Soc. 2024, 72, 479–489. [Google Scholar] [CrossRef]
- Rentscher, K.E.; Bethea, T.N.; Zhai, W.; Small, B.J.; Zhou, X.; Ahles, T.A.; Ahn, J.; Breen, E.C.; Cohen, H.J.; Extermann, M. Epigenetic aging in older breast cancer survivors and noncancer controls: preliminary findings from the Thinking and Living with Cancer Study. Cancer 2023, 129, 2741–2753. [Google Scholar] [CrossRef]
- Gallicchio, L.; Guida, J.L.; Green, P.A. Introduction to the special section on cancer survivors and treatment-related accelerated aging. J Cancer Surviv. 2024, 1–4. [Google Scholar] [CrossRef]
- Wang, H.; Chen, X.; Wang, S.; Zhang, H. Exploration of the causal effects of leukocyte telomere length and four gastrointestinal diseases: a two-sample bidirectional Mendelian randomization study. BMC Gastroenterol. 2023, 23, 446. [Google Scholar] [CrossRef]
- Wang, S.; El Jurdi, N.; Thyagarajan, B.; Prizment, A.; Blaes, A.H. Accelerated Aging in Cancer Survivors: Cellular Senescence, Frailty, and Possible Opportunities for Interventions. Int J Mol Sci. 2024, 25, 3319. [Google Scholar] [CrossRef]
- Brown, J.C.; Sturgeon, K.; Sarwer, D.B.; Troxel, A.B.; DeMichele, A.M.; Denlinger, C.S.; Schmitz, K.H. The effects of exercise and diet on oxidative stress and telomere length in breast cancer survivors. Breast Cancer Res Treat. [CrossRef]
- Xu, X.; Qu, K.; Pang, Q.; Wang, Z.; Zhou, Y.; Liu, C. Association between telomere length and survival in cancer patients: a meta-analysis and review of literature. Front Med 2016, 10, 191–203. [Google Scholar] [CrossRef]
- Vince, R.A.; Jiang, R.; Bank, M.; Quarles, J.; Patel, M.; Sun, Y.; Hartman, H.; Zaorsky, N.G.; Jia, A.; Shoag, J. Evaluation of social determinants of health and prostate cancer outcomes among black and white patients: a systematic review and meta-analysis. JAMA Netw Open. 2023, 6, e2250416–e2250416. [Google Scholar] [CrossRef]
- Han, C.J.; Tounkara, F.; Kalady, M.; Noonan, A.M.; Burse, N.R.; Paskett, E.D.; Von Ah, D. Risk factors of health-related quality of life among gastrointestinal cancer survivors in the US: with a focus on social and behavioral determinants of health (SBDH). Int J Environ Res Public Health, 6676. [Google Scholar] [CrossRef]
- Yao, J.; Chen, X.; Meng, F.; Cao, H.; Shu, X. Combined influence of nutritional and inflammatory status and depressive symptoms on mortality among US cancer survivors: Findings from the NHANES. Brain Behav Immun. [CrossRef]
- Antoni, M.H.; Moreno, P.I.; Penedo, F.J. Stress management interventions to facilitate psychological and physiological adaptation and optimal health outcomes in cancer patients and survivors. Annu Rev Psychol. [CrossRef]
- Needham, B.L.; Adler, N.; Gregorich, S.; Rehkopf, D.; Lin, J.; Blackburn, E.H.; Epel, E.S. Socioeconomic status, health behavior, and leukocyte telomere length in the National Health and Nutrition Examination Survey, 1999-2002. Soc Sci Med 2013, 85, 1–8. [Google Scholar] [CrossRef] [PubMed]
- Kumar, K.; Kumar, P.; Deb, D.; Unguresan, M.-L.; Muresan, V. Artificial intelligence and machine learning based intervention in medical infrastructure: a review and future trends. Proceedings of the Healthcare 2023, 11, 207. [Google Scholar] [CrossRef] [PubMed]
- Oyebode, O.; Fowles, J.; Steeves, D.; Orji, R. Machine learning techniques in adaptive and personalized systems for health and wellness. Int J Human-Comp Int. 1938. [Google Scholar] [CrossRef]
- Black, J.E.; Kueper, J.K.; Williamson, T.S. An introduction to machine learning for classification and prediction. Fam Pract, 2023; 40, 200–204. [Google Scholar] [CrossRef]
- Shu, X.; Ye, Y. Knowledge Discovery: Methods from data mining and machine learning. Soc Sci Res, 2023; 110, 102817. [Google Scholar] [CrossRef]
- Zhang, B.; Shi, H.; Wang, H. Machine learning and AI in cancer prognosis, prediction, and treatment selection: a critical approach. J Multidiscip Healthc, 2023; 16, 1779–1791. [Google Scholar] [CrossRef]
- Dye, B.; Barker, L.; Selwitz, R.; Lewis, B.; Wu, T.; Fryar, C.; Ostchega, Y.; Beltran, E.; Ley, E. Overview and quality assurance for the National Health and Nutrition Examination Survey (NHANES) oral health component, 1999–2002. Community Dent Oral Epidemiol, 2007; 35, 140–151. [Google Scholar] [CrossRef]
- Johnson, C.L.; Paulose-Ram, R.; Ogden, C.L.; Carroll, M.D.; Kruszon-Moran, D.; Dohrmann, S.M.; Curtin, L.R. National health and nutrition examination survey: analytic guidelines, 1999-2010. Vital Health Stat 2, 2013; 1–24. [Google Scholar]
- Wirth, R.; Hipp, J. CRISP-DM: Towards a standard process model for data mining. In Proceedings of the Proceedings of the 4th international conference on the practical applications of knowledge discovery and data mining, 2000; pp. 29–39.
- Liu, B.; Taioli, E. Seasonal variations of complete blood count and inflammatory biomarkers in the US population-analysis of NHANES data. PloS one 2015, 10, e0142382–2015. [Google Scholar] [CrossRef] [PubMed]
- Mazidi, M.; Kengne, A.P.; Sahebkar, A.; Banach, M. Telomere Length Is Associated With Cardiometabolic Factors in US Adults. Angiology 2018, 69, 164–169. [Google Scholar] [CrossRef] [PubMed]
- Mazidi, M.; Kengne, A.P.; Vatanparast, H. Food Security and Leukocyte Telomere Length in Adult Americans. Oxid Med Cell Longev 2017, 2017, 5427657. [Google Scholar] [CrossRef]
- Mazidi, M.; Penson, P.; Banach, M. Association between telomere length and complete blood count in US adults. Arch Med Sci 2017, 13, 601–605. [Google Scholar] [CrossRef]
- Shen, G.; Huang, J.Y.; Huang, Y.Q.; Feng, Y.Q. The Relationship between Telomere Length and Cancer Mortality: Data from the 1999-2002 National Healthy and Nutrition Examination Survey (NHANES). J Nutr Health Aging 2020, 24, 9–15. [Google Scholar] [CrossRef]
- NHANES - National Health and Nutrition Examination Survey Homepage. www.cdc.gov. Published June 24, 2024. Accessed July 16, 2024. http://cdc.gov/nchs/nhanes.
- Gómez, C.A.; Kleinman, D.V.; Pronk, N.; Gordon, G.L.W.; Ochiai, E.; Blakey, C.; Johnson, A.; Brewer, K.H. Addressing health equity and social determinants of health through healthy people 2030 J Public Health Manag Pract. 2021, 27 (Suppl 6), S249-S257. [CrossRef]
- Committee on the Recommended Social and Behavioral Domains and Measures for Electronic Health Records; Board on Population Health and Public Health Practice; Institute of Medicine. Capturing Social and Behavioral Domains and Measures in Electronic Health Records: Phase 2. Washington (DC): National Academies Press (US); January 8, 2015.
- Giuse, N.B.; Koonce, T.Y.; Kusnoor, S.V.; Prather, A.A.; Gottlieb, L.M.; Huang, L.C.; Phillips, S.E.; Shyr, Y.; Adler, N.E.; Stead, W.W. Institute of Medicine Measures of Social and Behavioral Determinants of Health: A Feasibility Study. Am J Prev Med 2017, 52, 199–206. [Google Scholar] [CrossRef]
- Byhoff, E.; Tripodis, Y.; Freund, K.M.; Garg, A. Gender Differences in Social and Behavioral Determinants of Health in Aging Adults. J Gen Intern Med 2019, 34, 2310–2312. [Google Scholar] [CrossRef] [PubMed]
- Kendall, A.; Olson, C.M.; Frongillo, E.A., Jr. Validation of the Radimer/Cornell measures of hunger and food insecurity. J Nutr 1995, 125, 2793–2801. [Google Scholar] [CrossRef]
- Bush, K.; Kivlahan, D.R.; McDonell, M.B.; Fihn, S.D.; Bradley, K.A. The AUDIT alcohol consumption questions (AUDIT-C): an effective brief screening test for problem drinking. Ambulatory Care Quality Improvement Project (ACQUIP). Alcohol Use Disorders Identification Test. Arch Intern Med 1998, 158, 1789–1795. [Google Scholar] [CrossRef]
- Zhang, L.; Ferguson, T.F.; Simonsen, N.; Chen, L.; Tseng, T.S. Racial/Ethnic Disparities in Health-Related Quality of Life among Participants with Self-Reported Diabetes from NHANES 2001-2010. Diabetes Educ 2014, 40, 496–506. [Google Scholar] [CrossRef]
- Cabello-Solorzano K, De Araujo IO, Peña M, Correia L, Tallón-Ballesteros AJ. The impact of data normalization on the accuracy of machine learning algorithms: a comparative analysis. In: Lecture Notes in Networks and Systems. ; 2023:344-353. [CrossRef]
- Gobbens, R.J.; Luijkx, K.G.; Wijnen-Sponselee, M.T.; Schols, J.M. Towards an integral conceptual model of frailty. J Nutr Health Aging 2010, 14, 175–181. [Google Scholar] [CrossRef]
- Swanson, K.; Wu, E.; Zhang, A.; Alizadeh, A.A.; Zou, J. From patterns to patients: Advances in clinical machine learning for cancer diagnosis, prognosis, and treatment. Cell 2023, 186, 1772–1791. [Google Scholar] [CrossRef]
- Cruz, J.A.; Wishart, D.S. Applications of machine learning in cancer prediction and prognosis. Cancer informatics 2006, 2, 59–77. [Google Scholar] [CrossRef]
- Rafique, R.; Islam, S.R.; Kazi, J.U. Machine learning in the prediction of cancer therapy. Comput Struct Biotechnol J. 2021, 19, 4003–4017. [Google Scholar] [CrossRef]
- Haun, M.W.; Simon, L.; Sklenarova, H.; Zimmermann-Schlegel, V.; Friederich, H.C.; Hartmann, M. Predicting anxiety in cancer survivors presenting to primary care–A machine learning approach accounting for physical comorbidity. Cancer Medicine 2021, 10, 5001–5016. [Google Scholar] [CrossRef]
- Badger, T.A.; Segrin, C.; Crane, T.E.; Chalasani, P.; Arslan, W.; Hadeed, M.; Sikorskii, A. Social determinants of health and symptom burden during cancer treatment. Nursing research 2023, 72, 103–113. [Google Scholar] [CrossRef]
- McCall, M.K.; Connolly, M.; Nugent, B.; Conley, Y.P.; Bender, C.M.; Rosenzweig, M.Q. Symptom experience, management, and outcomes according to race and social determinants including genomics, epigenomics, and metabolomics (SEMOARS+ GEM): an explanatory model for breast cancer treatment disparity. J Cancer Educ. 2020, 35, 428–440. [Google Scholar] [CrossRef]
- Westrick, A.C.; Langa, K.M.; Eastman, M.; Ospina-Romero, M.; Mullins, M.A.; Kobayashi, L.C. Functional aging trajectories of older cancer survivors: a latent growth analysis of the US Health and Retirement Study. J Cancer Surviv. 2023, 17, 1499–1509. [Google Scholar] [CrossRef] [PubMed]
- Chi, Z.; Bai, X.; Zhang, Z. Risk relationship between leukocyte telomere length and constipation: a Mendelian randomization study. Frontiers in Medicine 2023, 10, 1177785. [Google Scholar] [CrossRef] [PubMed]
- Singh, S.; Giron, L.B.; Shaikh, M.W.; Shankaran, S.; Engen, P.A.; Bogin, Z.R.; Bambi, S.A.; Goldman, A.R.; Azevedo, J.L.; Orgaz, L. Distinct intestinal microbial signatures linked to accelerated systemic and intestinal biological aging. Microbiome 2024, 12, 31. [Google Scholar] [CrossRef] [PubMed]
- Hooten, N.N.; Pacheco, N.L.; Smith, J.T.; Evans, M.K. The accelerated aging phenotype: the role of race and social determinants of health on aging. Ageing Res Rev. 2022, 73, 101536. [Google Scholar] [CrossRef] [PubMed]
- Androulakis, I.P. From cells to society: untangling the web of stress, inflammation, and social determinants of health. 2024, 2, 1358784. [CrossRef]
- Tarver, W.L.; Justice, Z.; Jonnalagadda, P.; Rahurkar, S.; Obeng-Gyasi, S.; Krok-Schoen, J.L.; Petrecca, A.; Paskett, E.D. A scoping review of the evidence on survivorship care plans among minority, rural, and low-income populations. J Cancer Surviv. 2024, 1–39. [Google Scholar] [CrossRef]
- Vardy, J.; Liew, A.; Turner, J.; Kerin-Ayres, K.; Butler, S.; Deguchi, C.; Khatri, S.; Wildbore, C.; Mo, C.; Hamayun, M. What happens to cancer survivors attending a structured cancer survivorship clinic? Symptoms, quality of life and lifestyle changes over the first year at the Sydney Cancer Survivorship Centre clinic. Support Care Cancer. 2021, 29, 1337–1345. [Google Scholar] [CrossRef] [PubMed]
- Addison, S.; Shirima, D.; Aboagye-Mensah, E.B.; Dunovan, S.G.; Pascal, E.Y.; Lustberg, M.B.; Arthur, E.K.; Nolan, T.S. Effects of tandem cognitive behavioral therapy and healthy lifestyle interventions on health-related outcomes in cancer survivors: a systematic review. J Cancer Surviv. 2022, 16, 1023–1046. [Google Scholar] [CrossRef]
- Nouve, Y.; Zhao, S.; Zheng, Y. Decoding the misperception: Exploring measurement error in self-rated assessments of diet quality. Food Quality and Preference 2024, 105234. [Google Scholar] [CrossRef]
- Tucker, A.C.; Bresnahan, C.; John, S.; Johnson, J.; Leung, C.W.; Mui, Y.; Hager, E.R.; Wolfson, J.A. Food (in) security in relation to nutrition (in) security in a national cross-sectional sample of Supplemental Nutrition Assistance Program participants: considerations of an emerging construct. Am J Clin Nutr. 2024, 119, 1475–1484. [Google Scholar] [CrossRef]
- Robien, K.; Clausen, M.; Sullo, E.; Ford, Y.R.; Griffith, K.A.; Le, D.; Wickersham, K.E.; Wallington, S.F. Prevalence of food insecurity among cancer survivors in the United States: a scoping review. J Acad Nutr Diet. 2023, 123, 330–346. [Google Scholar] [CrossRef]
- Christian, V.J.; Miller, K.R.; Martindale, R.G. Food insecurity, malnutrition, and the microbiome. Curr Nutr Rep. 2020, 9, 356–360. [Google Scholar] [CrossRef]
- Hussaini, S.Q.; Chen, K.Y.; Blackford, A.L.; Chino, F.; Gupta, A. Food insecurity and gastrointestinal (GI) cancer mortality in the United States, 2015 to 2019. J Clin Oncol. 2023, 41, 788. [Google Scholar] [CrossRef]
Figure 1.
Data Processing. This figure illustrates the comprehensive process of machine learning data processing. Model deployment is suggested in a future study.
Figure 1.
Data Processing. This figure illustrates the comprehensive process of machine learning data processing. Model deployment is suggested in a future study.
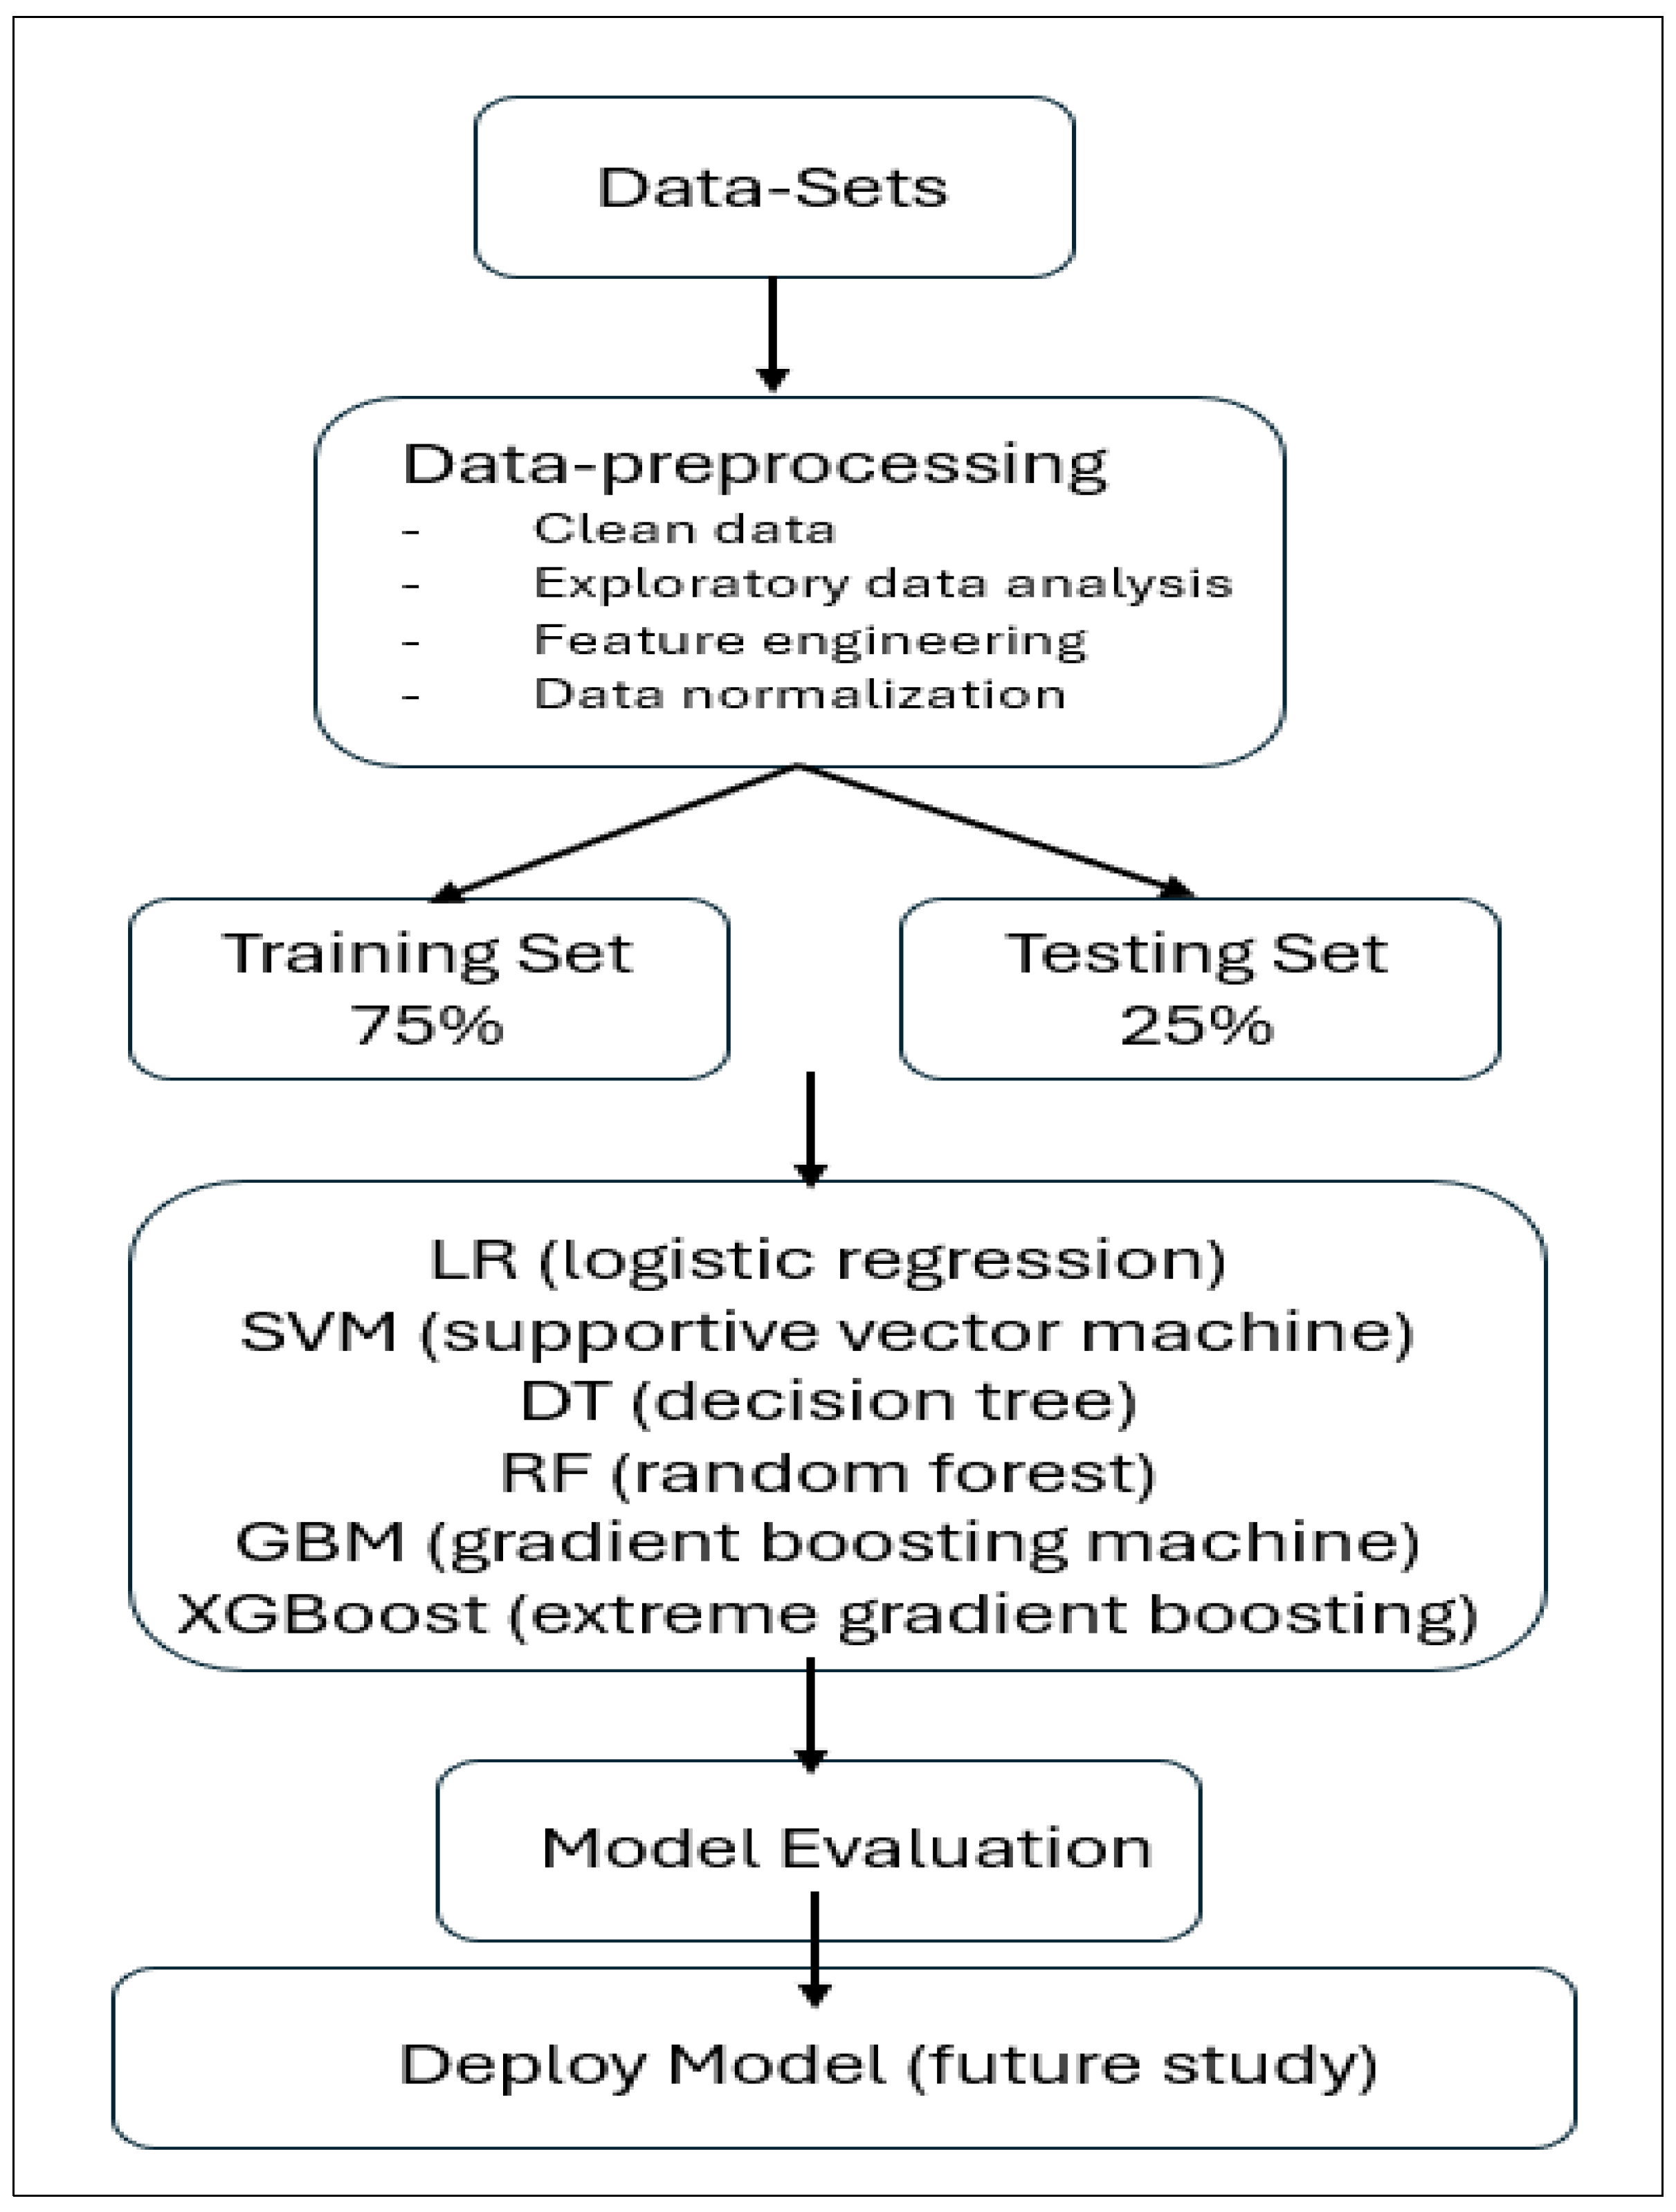
Figure 2.
Integral Conceptual Model of Frailty Adapted to the Current Study. We have obtained permission to revise the original framework, adapted to the current study, ensuring compliance with copyright regulations. Both reproduction and adaptation of the original framework have been granted copyright permission.(Supplementary material).
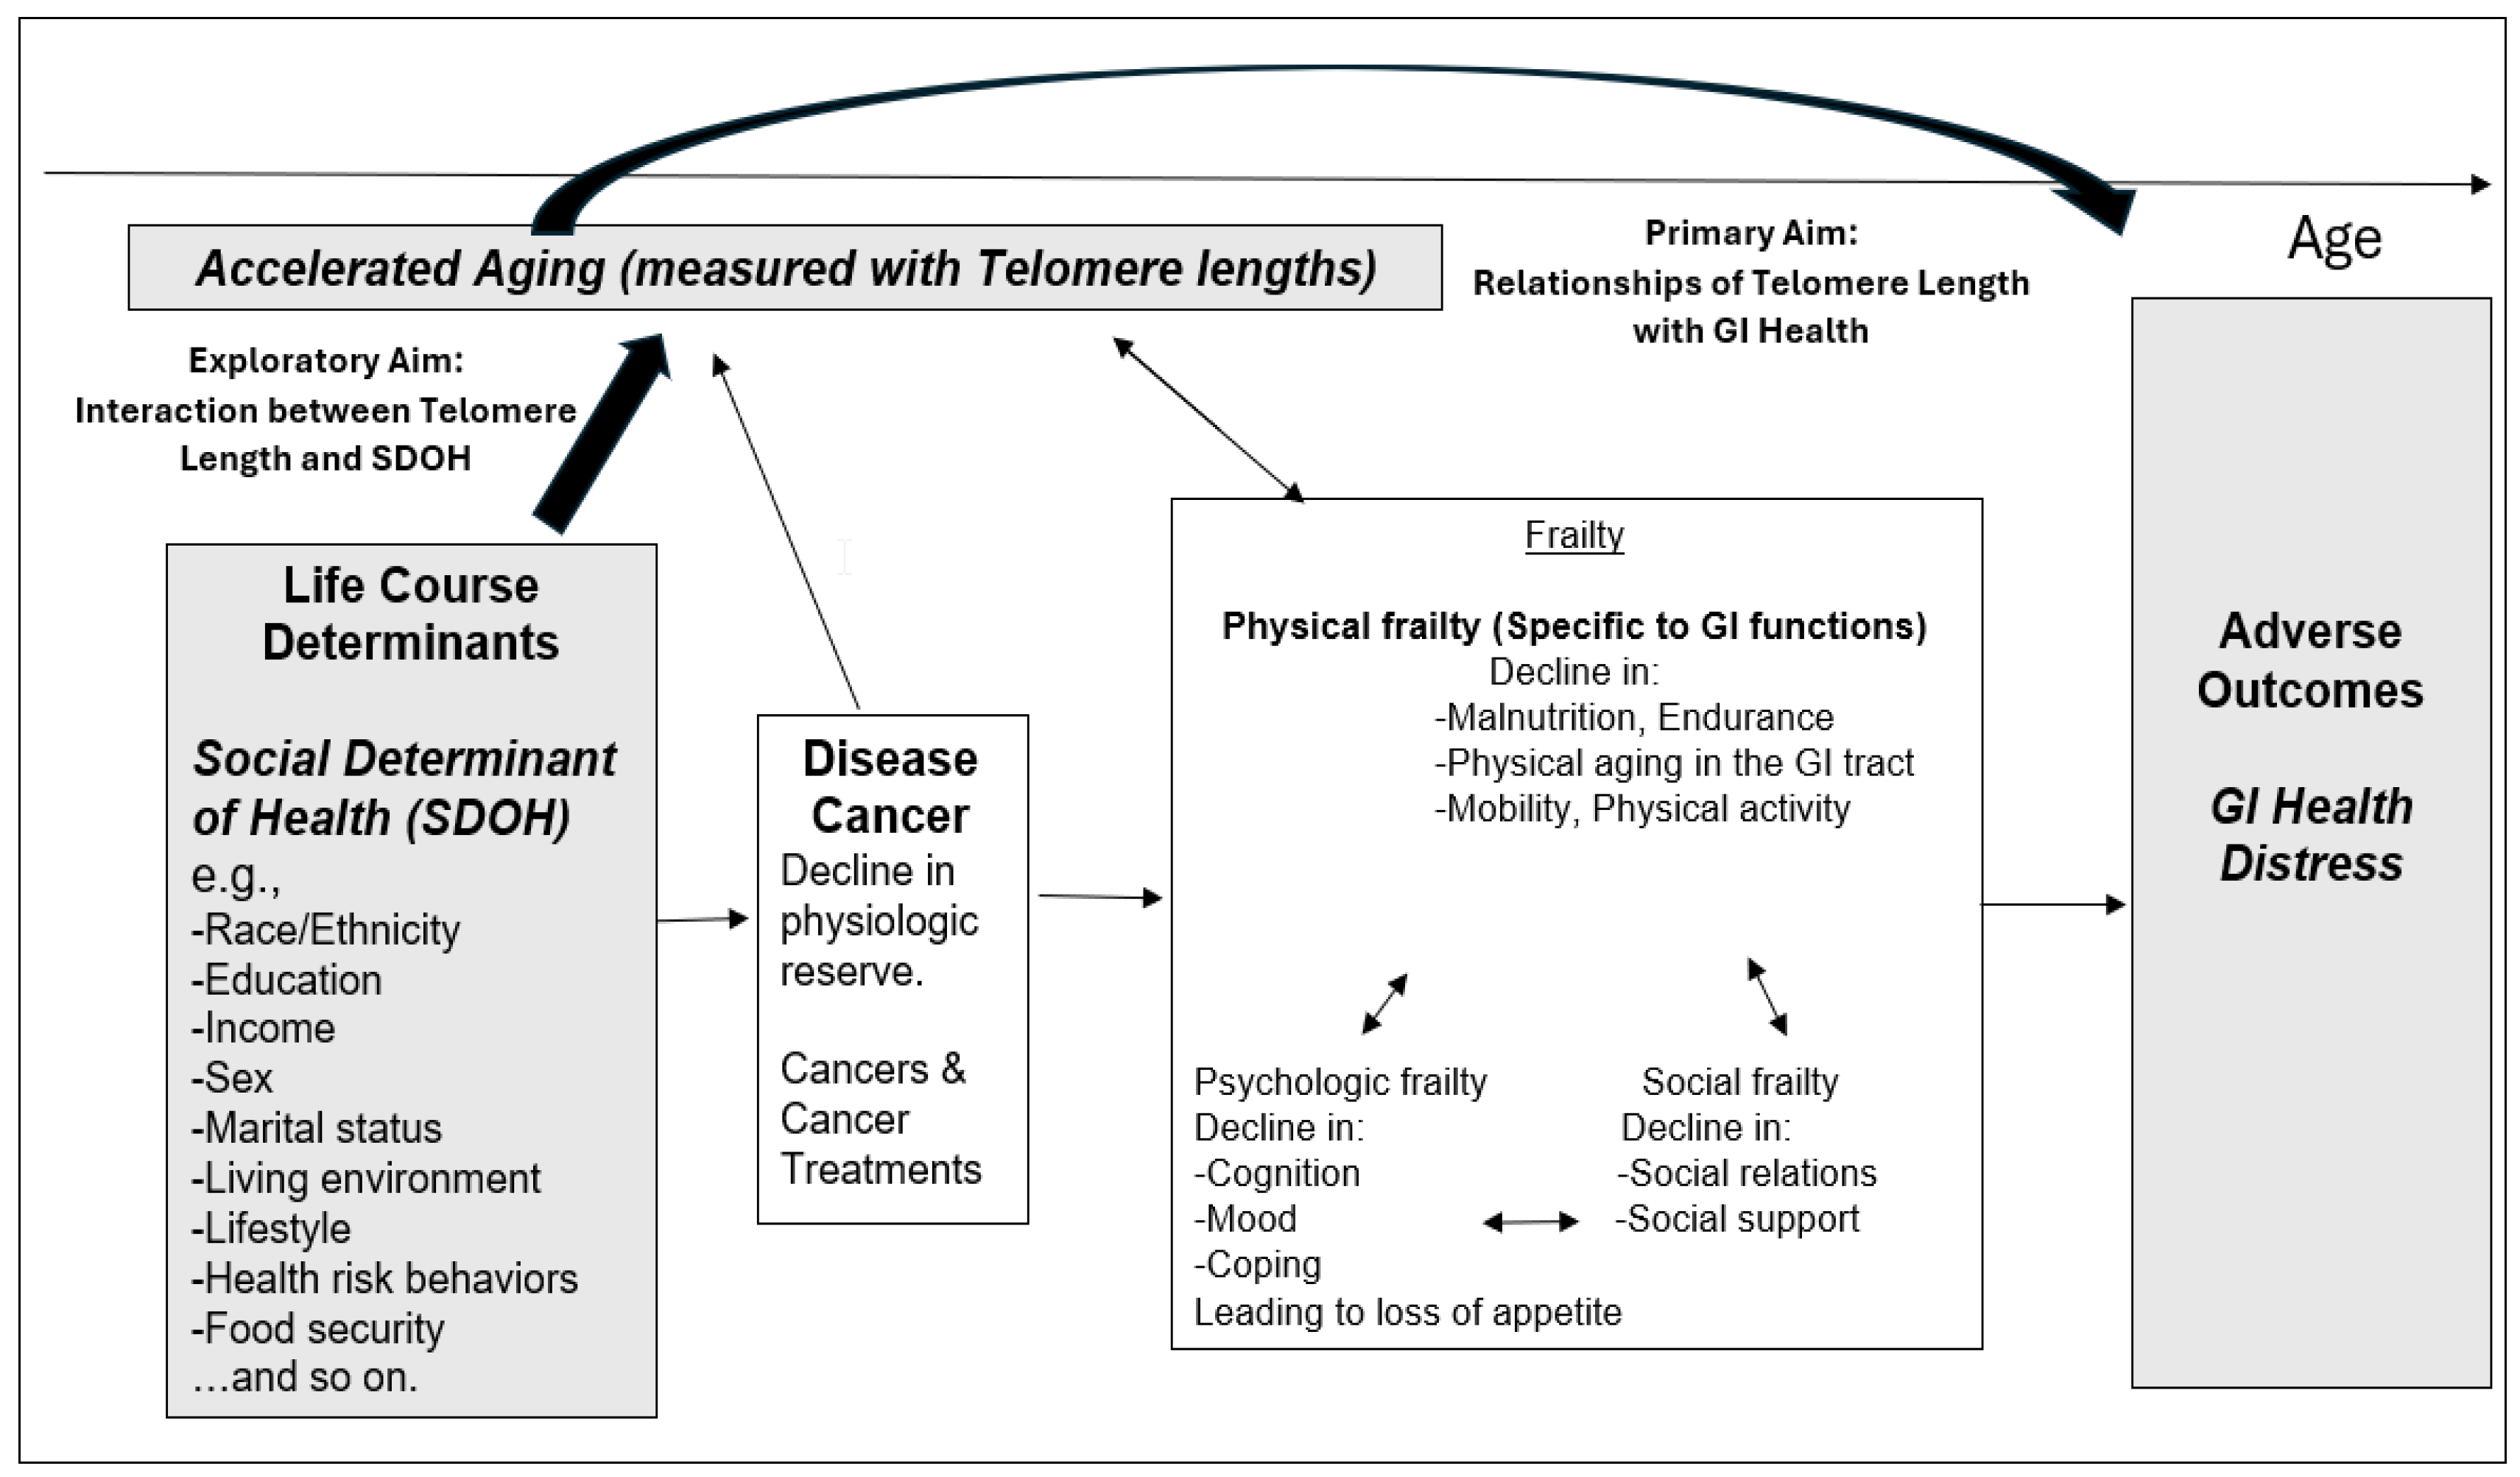
Figure 3.
Receiver Operating Characteristic (ROC) Curves and Area Under the Curve (AUC) for Model Performance. The ROC curve is a graphical representation of a model’s diagnostic ability, plotting the True Positive Rate (TPR) against the False Positive Rate (FPR). Both graphs plot the True Positive Rate (TPR) on the y-axis, ranging from 0 to 1, and the False Positive Rate (FPR) on the x-axis, also ranging from 0 to 1. The AUC in ROC curves represents the probability that the classifier will rank a randomly chosen positive instance higher than a randomly chosen negative one. An AUC close to 1 indicates a high model accuracy, 0.7 < AUC < 0.8 indicates a good and moderate model accuracy, 0.5 < AUC < 0.7 indicates a poor performance, and an AUC < 0.5 indicates a fail. SVM= supportive vector machine, XGBoost = extreme gradient boosting.
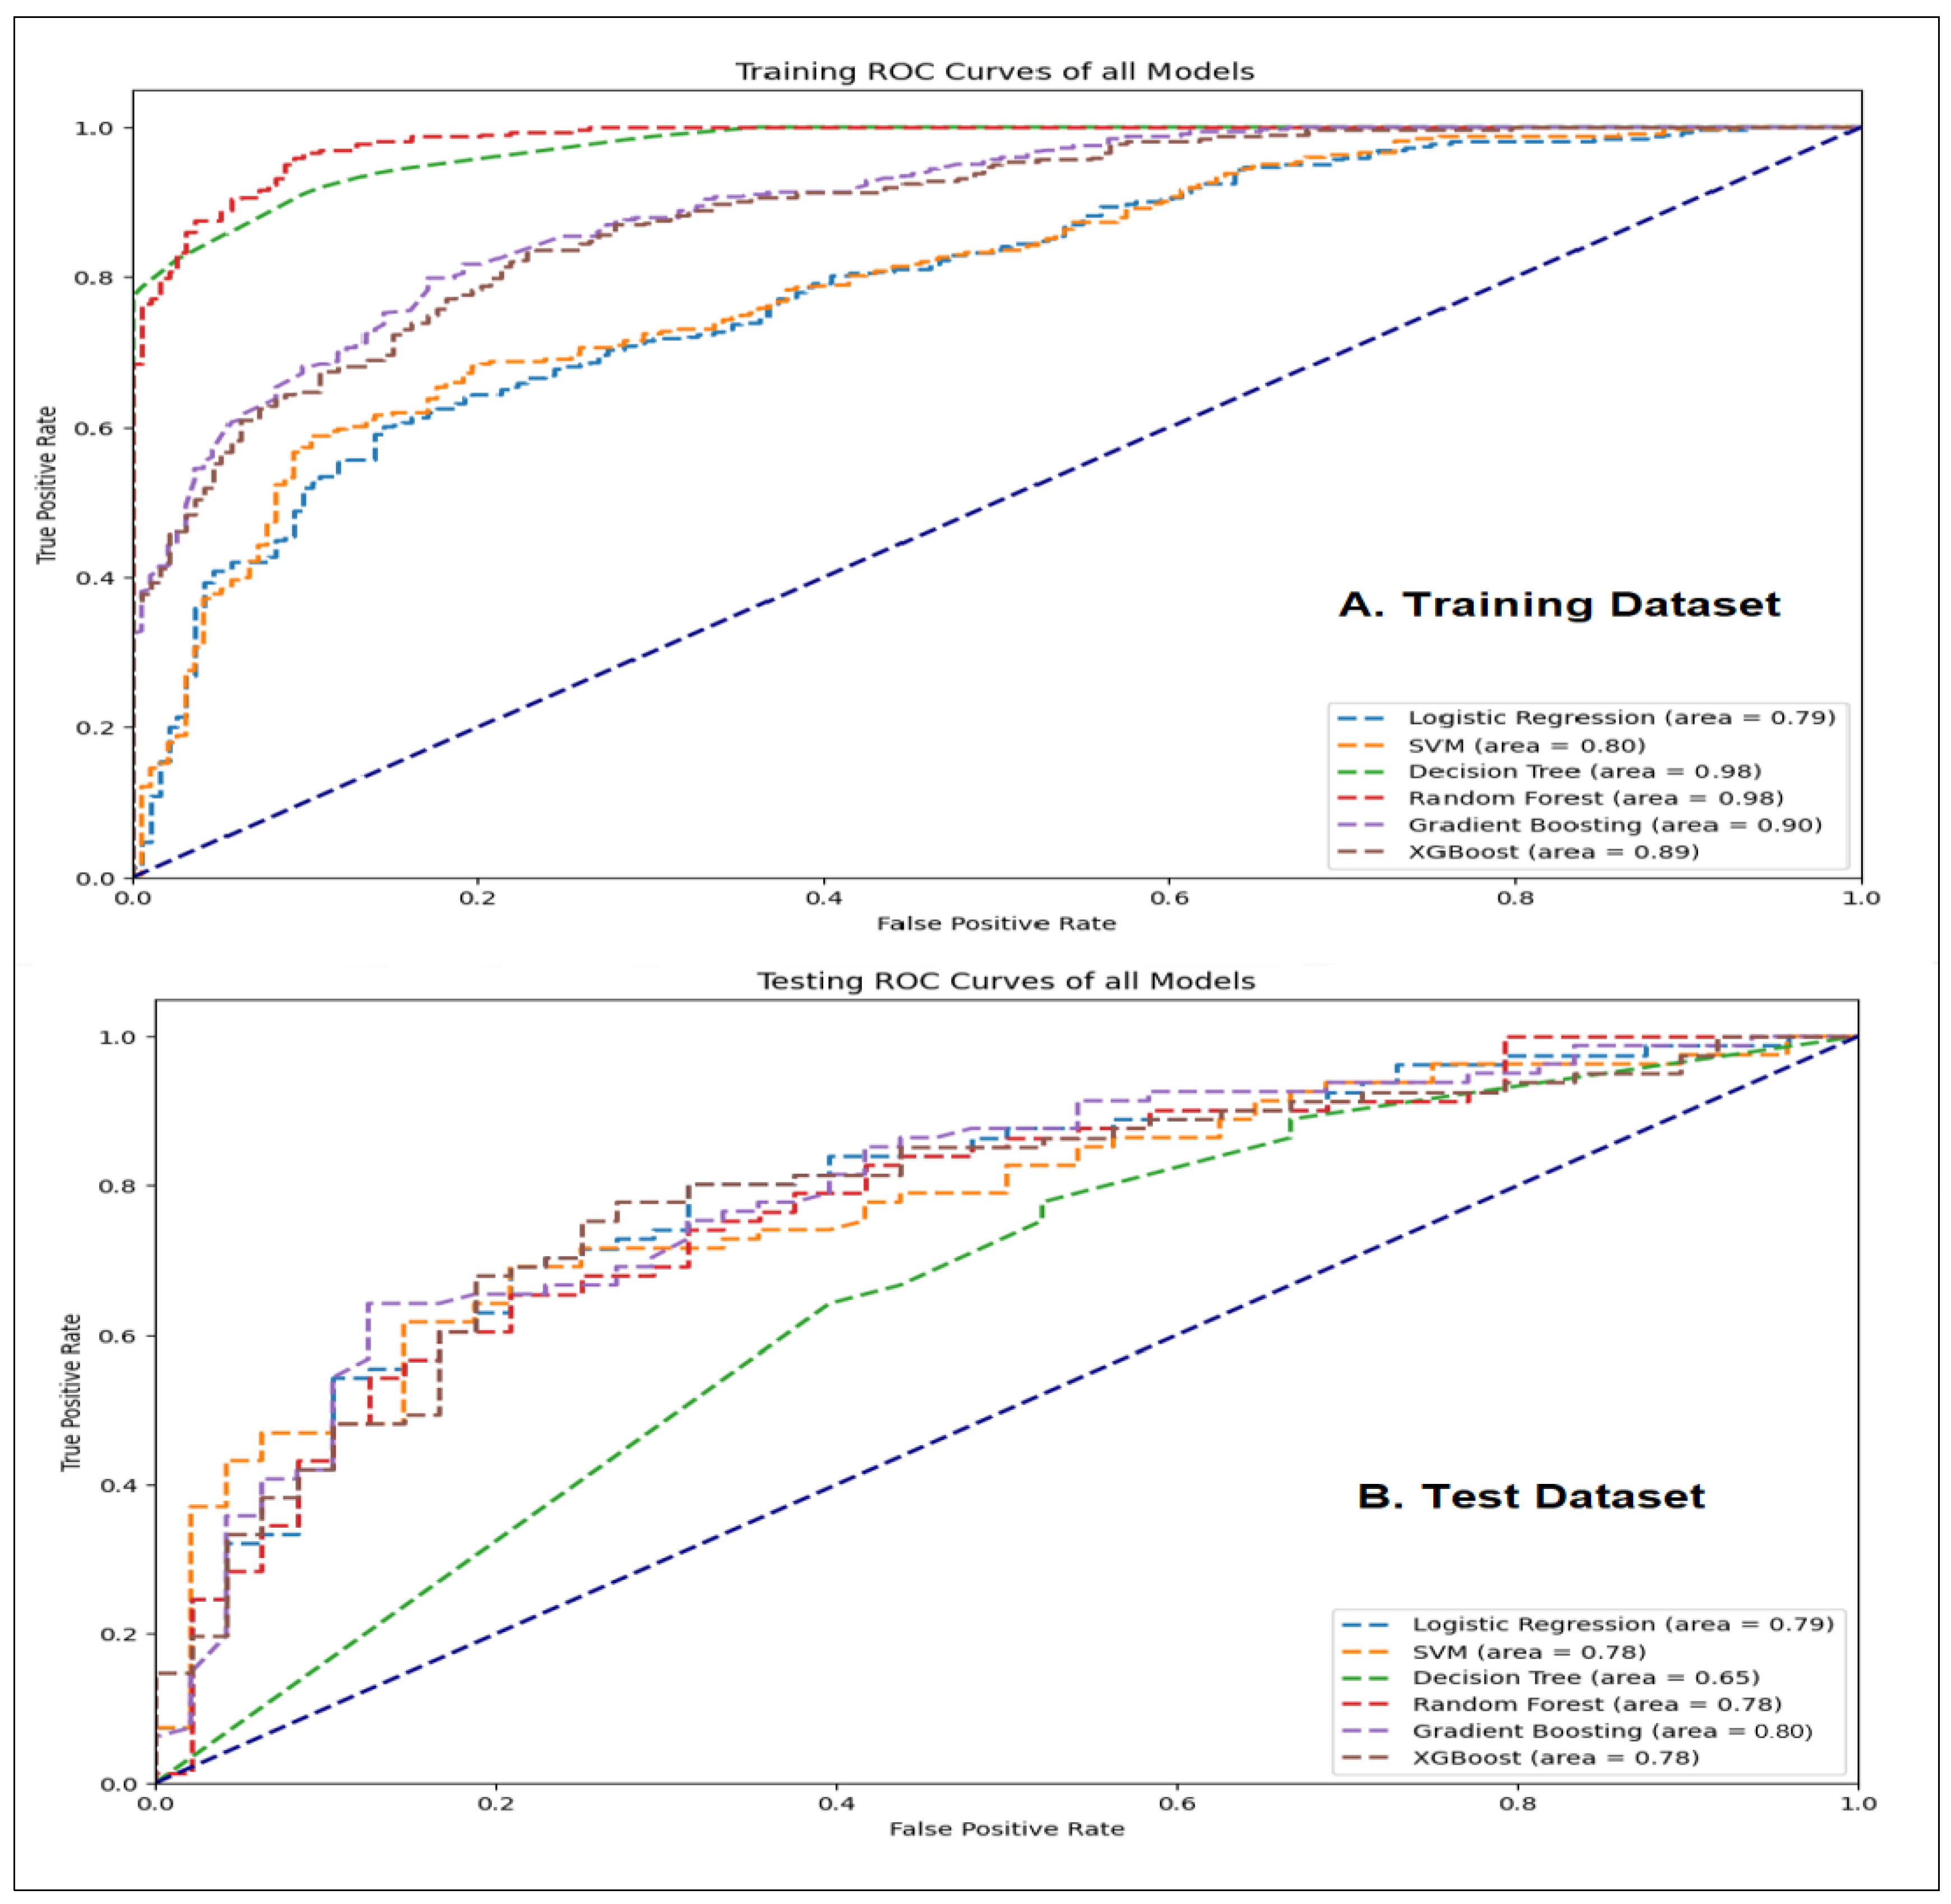
Figure 4.
Feature Importance. The bar graph indicates the positive associations of input features with a better GI health condition. The height of the bar graph of the feature importance, represents the importance of the feature, with relative importance compared to the importance values of other features to understand their significance. The feature importance scores were calculated using the Gini impurity metric. Interpretation of this graph should be based on a relative comparison of the values.
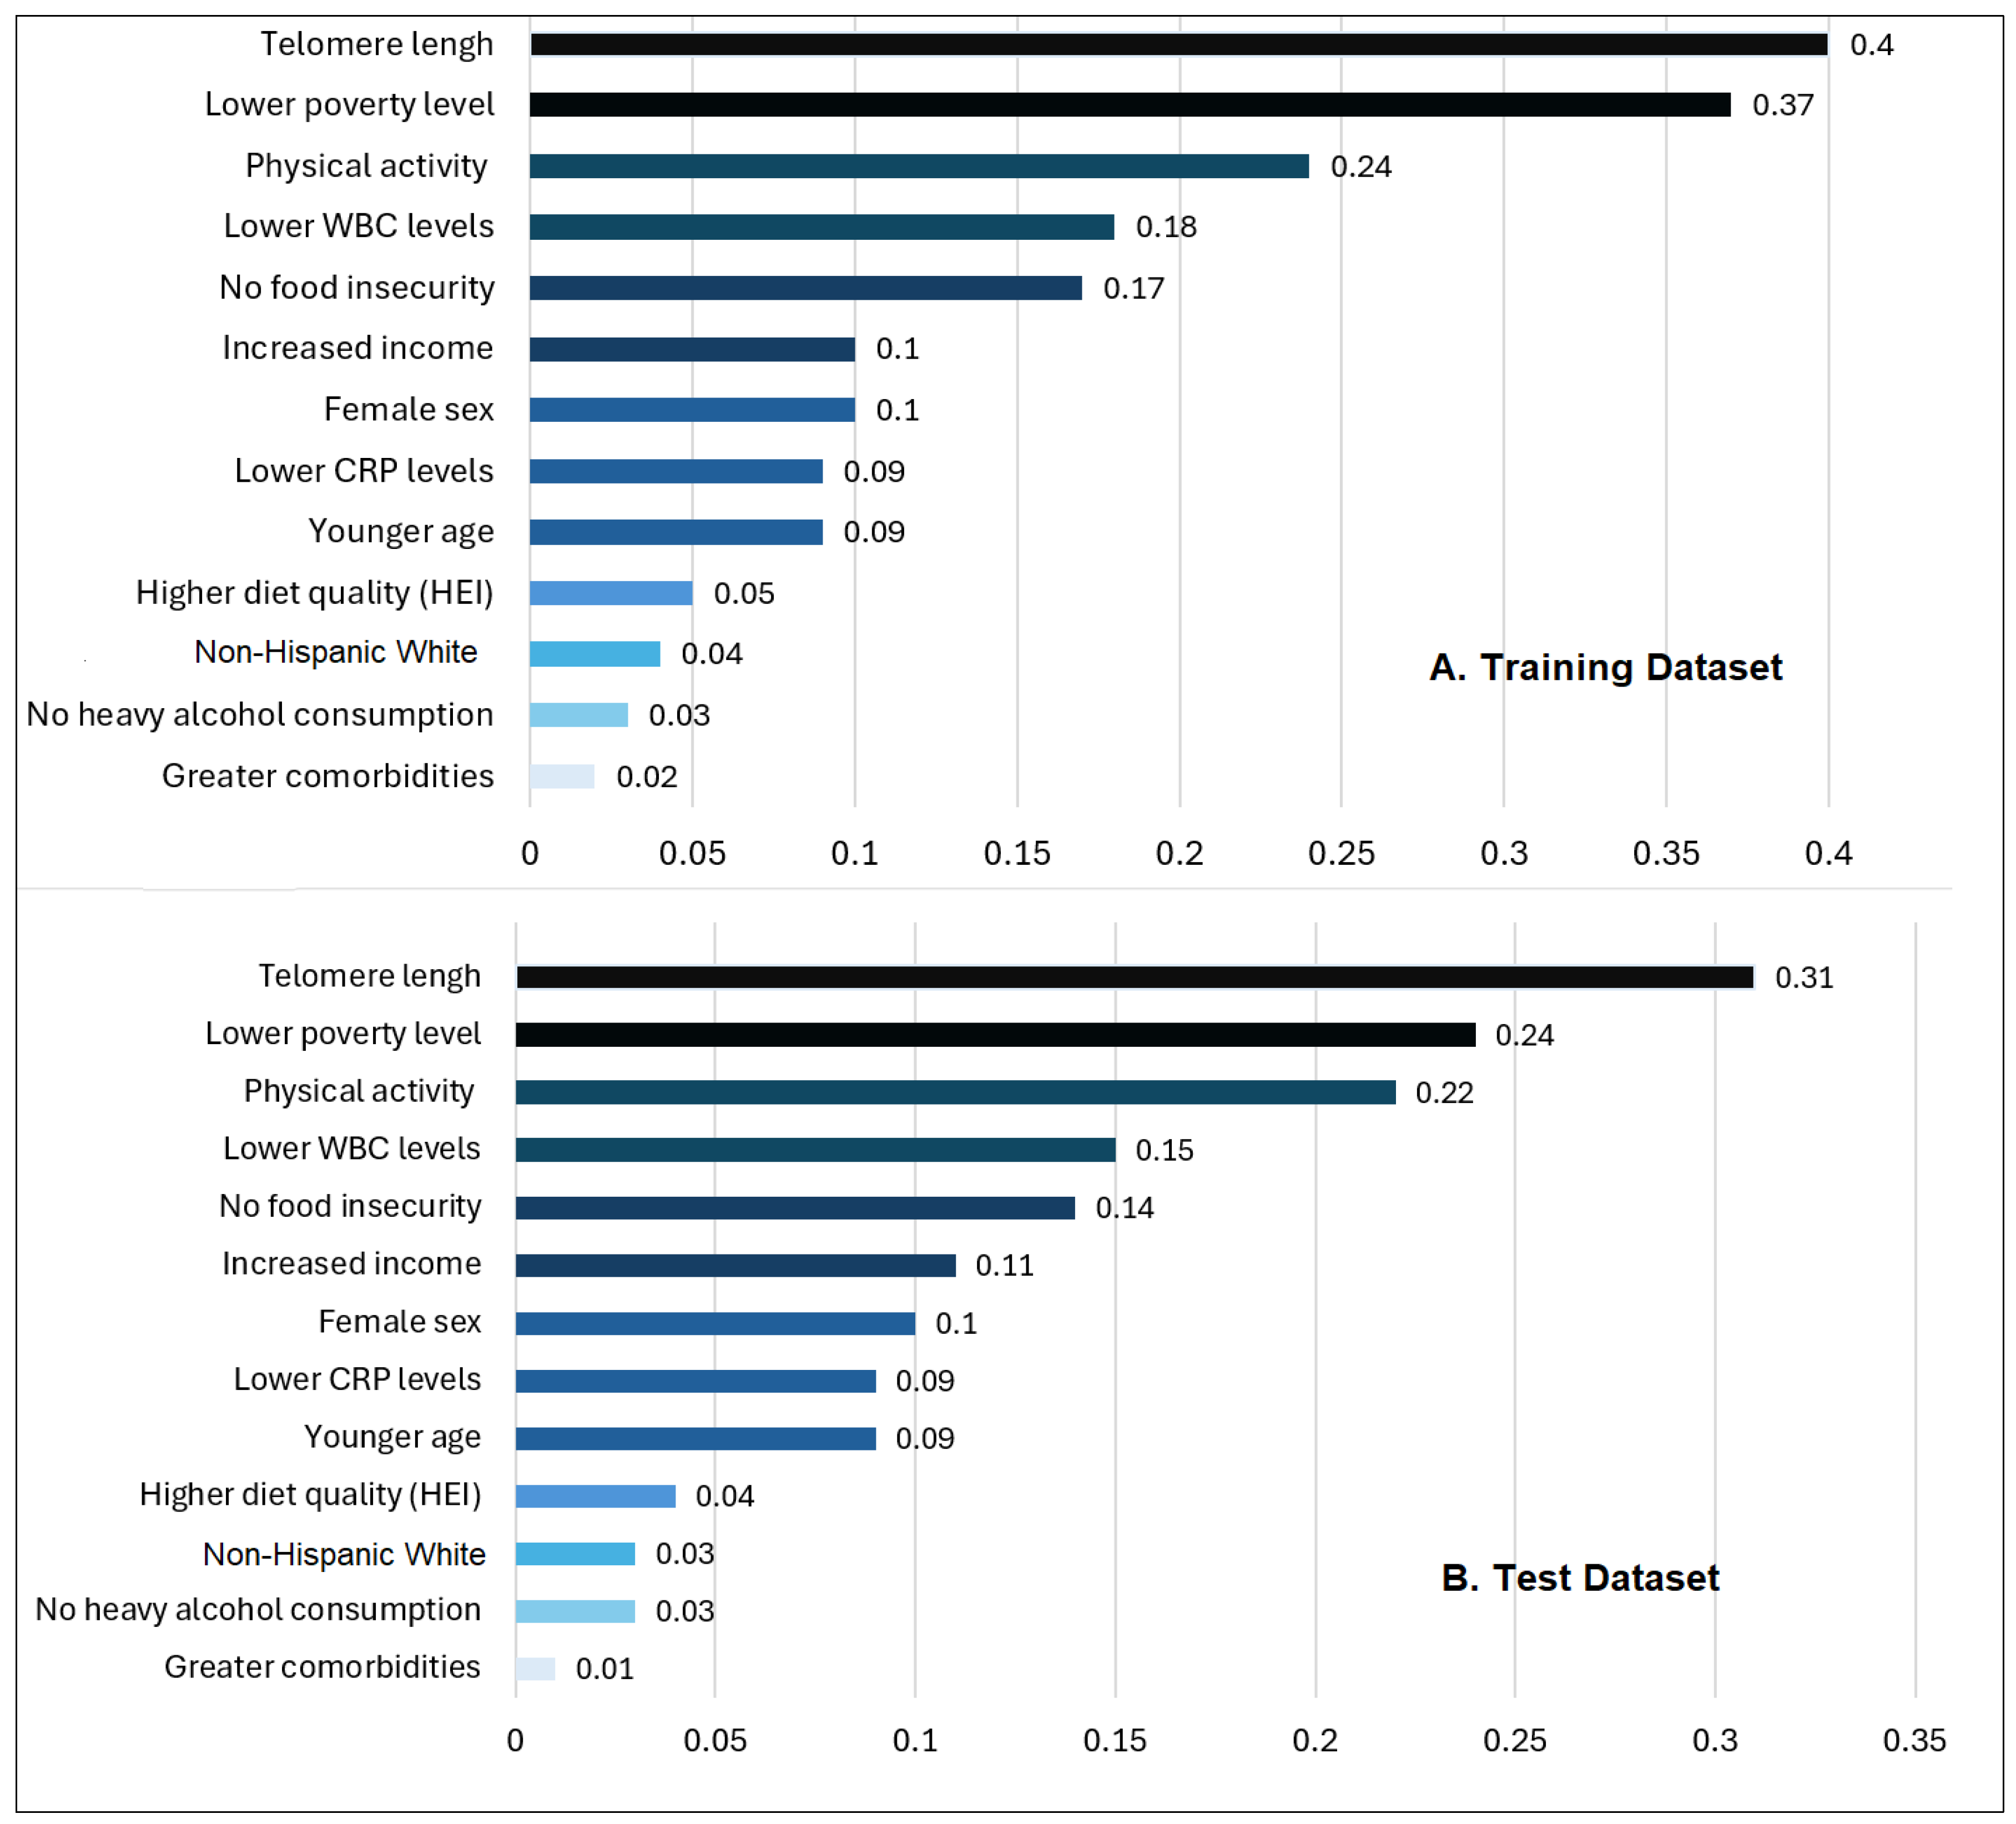

Table 1.
Patients Characteristics, Telomere Lengths, and their relationships with GI Health.
| Total cancer survivors (N = 645) |
Training seta (n = 75% of total sample, n = 484 |
Test setb (n = 25% of total sample, n = 161) |
p |
GI health (n, %) | |||||
|---|---|---|---|---|---|---|---|---|---|
| Better | Worse | p | |||||||
| Age (years) mean ± SE, range |
66.3 ± 14.7 (21-85) | 65.5 ± 16.2 (22-85) | .102 | 63.3 (10.9) | 66.4 (11.2) | 47.4, .031 | |||
| Female (n,%) | 235 (49.5) | 84 (50.7) | .311 | 153 (47) | 103 | 6.1, .013 | |||
| Modified Comorbidities(>2)(n,%) | 168 (42.3) | 66 (43.2) | .122 | 133 | 71 (45) | 5.4, .043 | |||
| Types of Cancers (n,%) |
Skin: 152 (21.2) GU: 102 (21.0) Breast: 75 (15.6) Ovary-Uterine: 45 (9.3) Head & Neck: 42 (8.6) GI: 41 (8.4) Lung: 15 (3.1) Hematological: 12(2.5) |
Skin: 44 (27.3) Breast: 35 (21.7) GU: 30 (18.6) Head & Neck: 21(13.0) GI: 15 (9.3) Ovary-Uterine: 8 (5.0) Lung: 5 (3.1) Hematological: 3 (1.9) |
.143 | Skin: 65 (20.1) GU: 62 (19) Breast: 53 (16.3) Ovary-Uterine: 37 (11.3) Head & Neck: 31 (9.5) GI: 27 (8.5) Lung:13 (4.1) Hematological: 36 (11.2) |
Skin: 31(19.8) GU: 26 (16.2) Breast:27(17.3) Ovary-Uterine: 18(11.5) Head & Neck: 17 (10.9) GI: 15 (9.3) Lung: 8 (5.2) Hematological 15 (9.8) |
12.1, .100 | |||
| WBC (k/ul), normal (4 -11k/ul), mean ± SE |
7.0 (2.1) | 7.04 (2.0) | .192 | 5.4 (1.1) | 8.5 (1.5) | 146.3, .046 | |||
| CRP (mg/dl), normal (<0.3mg/dl), mean ± SE | 0.5 (0.9) | 0.6 (1.4) | .124 | 0.4 (0.8) | 1.0 (1.1) | 238.4, .001 | |||
| Telomere Lengths (kb) mean ± SE |
0.93 (0.2) | 0.93 (0.2) | .823 | 0.97 (0.2) | 0.64 (0.3) | 85.1, .013 | |||
| Gastrointestinal Health (n, %) |
Worse: 158 (32.5) Better: 324 (66.7) |
Worse: 59 (36.6) Better: 101 (62.7) |
.412 | Not applicable | |||||
Note. N and means are based on unweighted raw sample; % and standard errors (SE) are based on weighted NHANES 1999-2002 participants. aTraining dataset samples n: Weighted population n = 13,186,077. bTest dataset samples n = Weighted population n = 4,386,277. P-values in bold if they are <.05, as this is considered the statistical significance level, based on either using two sample independent t-test or Chi-square test.
Table 2.
Descriptive statistics for SDOH and their relationships with GI health conditions.
| Total cancer survivors (N = 645). n (%) otherwise specified |
Training seta (n = 75% of total sample, n = 484 |
Test setb (n = 25% of total sample, n = 161) |
p | GI Health (n, %) | ||||
|---|---|---|---|---|---|---|---|---|
| Better | Worse | p | ||||||
| Race/Ethnicity | .413 | 24.2, .039 | ||||||
| Non-Hispanic White | 356 (73.3) | 121(75.0) | 260 (80.3) | 122 (77.3) | ||||
| Non-Hispanic Black | 53 (10.9) | 18 (11.0) | 35 (10.7) | 17 (10.5) | ||||
| Non-Hispanic Other | 6 (1.2) | 2 (1.2) | 5 (1.5) | 2 (1.5) | ||||
| Hispanic | 69(14.2) | 20 (12.8) | 24 (7.5) | 17 (10.7) | ||||
| Marital status | .541 | 3.6, .730 | ||||||
| Married/Partnered | 329 (68.1) | 110 (68.3) | 220(67.9) | 104 (65.6) | ||||
| Divorced/Widowed/Single | 155 (31.9) | 51 (31.7) | 104(32.1) | 54 (34.4) | ||||
| Education | .112 | 16.6, .502 | ||||||
| High school or less | 247 (51.0) | 80 (49.7) | 158(48.8) | 81 (51.1) | ||||
| College of technical school | 130 (26.9) | 44 (27.3) | 88 (27.1) | 41 (25.8) | ||||
| Graduate school | 107 (22.1) | 37 (23.0) | 78 (24.1) | 36 (23.1) | ||||
| Household Income (yr.) | .353 | 8.43, .038 | ||||||
| Less than $25,000 | 169 (34.9) | 57 (35.4) | 114(35.3) | 58 (36.8) | ||||
| $25,000 to <$55,000 | 150 (31.0) | 51 (31.7) | 100(31.0) | 45 (28.3) | ||||
| $55,000 to <$75,000 | 45 (9.2) | 17 (10.6) | 50 (15.4) | 26 (16.4) | ||||
| $75,000 and over | 107 (22.1) | 33 (20.5) | 59 (18.3) | 29 (18.5) | ||||
| Poverty-income ratio (PIR) <1 indicating a high poverty level (Yes): Annual household income below the poverty level. | 193 (39.7) | 60 (37.3) | .423 | 113(34.9) | 59 (37.6) | 18.01,<.001 | ||
| Food Insecurity (Yes) | 42 (8.6) | 13 (8.1) | .879 | 18 (5.6) | 13 (8.0) | 17.01, .021 | ||
| Cancer Health Behaviors (Yes) | ||||||||
| Current Smoking Status | 86 (17.7) | 31 (19.3) | .114 | 53 (16.3) | 31 (19.5) | 13.1, .080 | ||
| Current Heavy Alcohol Use | 86 (17.7) | 21 (13.0) | .198 | 49 (15.2) | 34 (21.3) | 37.01,<.001 | ||
| Regular physical activity | 286 (58.8) | 76 (47.2) | .108 | 189(58.3) | 61 (38.5) | .52.4, .035 | ||
| Diet quality(HEI-2015 Score, 0-100, mean ± SE) |
48.8 (12.3) | 48.9 (8.3) | .103 | 52.5 (5.6) | 47.3 (7.5) | 56.1, .038 | ||
Note. N and means are based on unweighted raw sample; % and standard errors (SE) are based on weighted NHANES 1999-2002 participants. aTraining dataset samples n: Weighted population n = 13,186,077. bTest dataset samples n = Weighted population n = 4,386,277. P-values in bold if they are <.05, as this is considered the statistical significance level, based on either using two sample independent t-test or Chi-square test.
Table 3.
Performance comparison of the classification models for GI health conditions for the training and test datasets with five-fold cross-validation.
Table 3.
Performance comparison of the classification models for GI health conditions for the training and test datasets with five-fold cross-validation.
| Model | AUC | Accuracy | Precision | Sensitivity (Recall) | Specificity | F1 Score |
|---|---|---|---|---|---|---|
| Training Dataset | ||||||
| LR | 0.7918 | 0.7192 | 0.7214 | 0.8978 | 0.4197 | 0.8111 |
| SVM | 0.7994 | 0.7112 | 0.7753 | 0.7585 | 0.6321 | 0.7668 |
| Decision Tree | 0.9758 | 0.9089 | 0.9340 | 0.9195 | 0.8912 | 0.9267 |
| RF | 0.9842 | 0.9341 | 0.9213 | 0.9783 | 0.8601 | 0.9489 |
| GBM | 0.8952 | 0.7907 | 0.7867 | 0.9133 | 0.5855 | 0.8453 |
| XGBoost | 0.7829 | 0.7755 | 0.9195 | 0.5544 | 0.5544 | 0.8414 |
| Test Dataset | ||||||
| LR | 0.7904 | 0.7287 | 0.7447 | 0.8642 | 0.5312 | 0.8312 |
| SVM | 0.7774 | 0.7054 | 0.7792 | 0.7407 | 0.6458 | 0.7595 |
| Decision Tree | 0.6480 | 0.6512 | 0.7093 | 0.7531 | 0.4792 | 0.7305 |
| RF | 0.7760 | 0.7364 | 0.7640 | 0.8395 | 0.5625 | 0.8000 |
| GBM | 0.8035 | 0.7442 | 0.7609 | 0.8642 | 0.5417 | 0.8092 |
| XGBoost | 0.7834 | 0.7287 | 0.7500 | 0.8519 | 0.5208 | 0.7977 |
Note. AUC: the area under the receiver operating characteristics (ROC) curve known as the AUC; GBM: Gradient boosting machine; LR: Logistic regression, RF: Random forest; SVM: Support vector machine; XGBoost: Extreme gradient boosting.
Disclaimer/Publisher’s Note: The statements, opinions and data contained in all publications are solely those of the individual author(s) and contributor(s) and not of MDPI and/or the editor(s). MDPI and/or the editor(s) disclaim responsibility for any injury to people or property resulting from any ideas, methods, instructions or products referred to in the content. |
© 2024 by the authors. Licensee MDPI, Basel, Switzerland. This article is an open access article distributed under the terms and conditions of the Creative Commons Attribution (CC BY) license (https://creativecommons.org/licenses/by/4.0/).
Copyright: This open access article is published under a Creative Commons CC BY 4.0 license, which permit the free download, distribution, and reuse, provided that the author and preprint are cited in any reuse.


