
Submitted:
28 March 2023
Posted:
28 March 2023
You are already at the latest version
Abstract
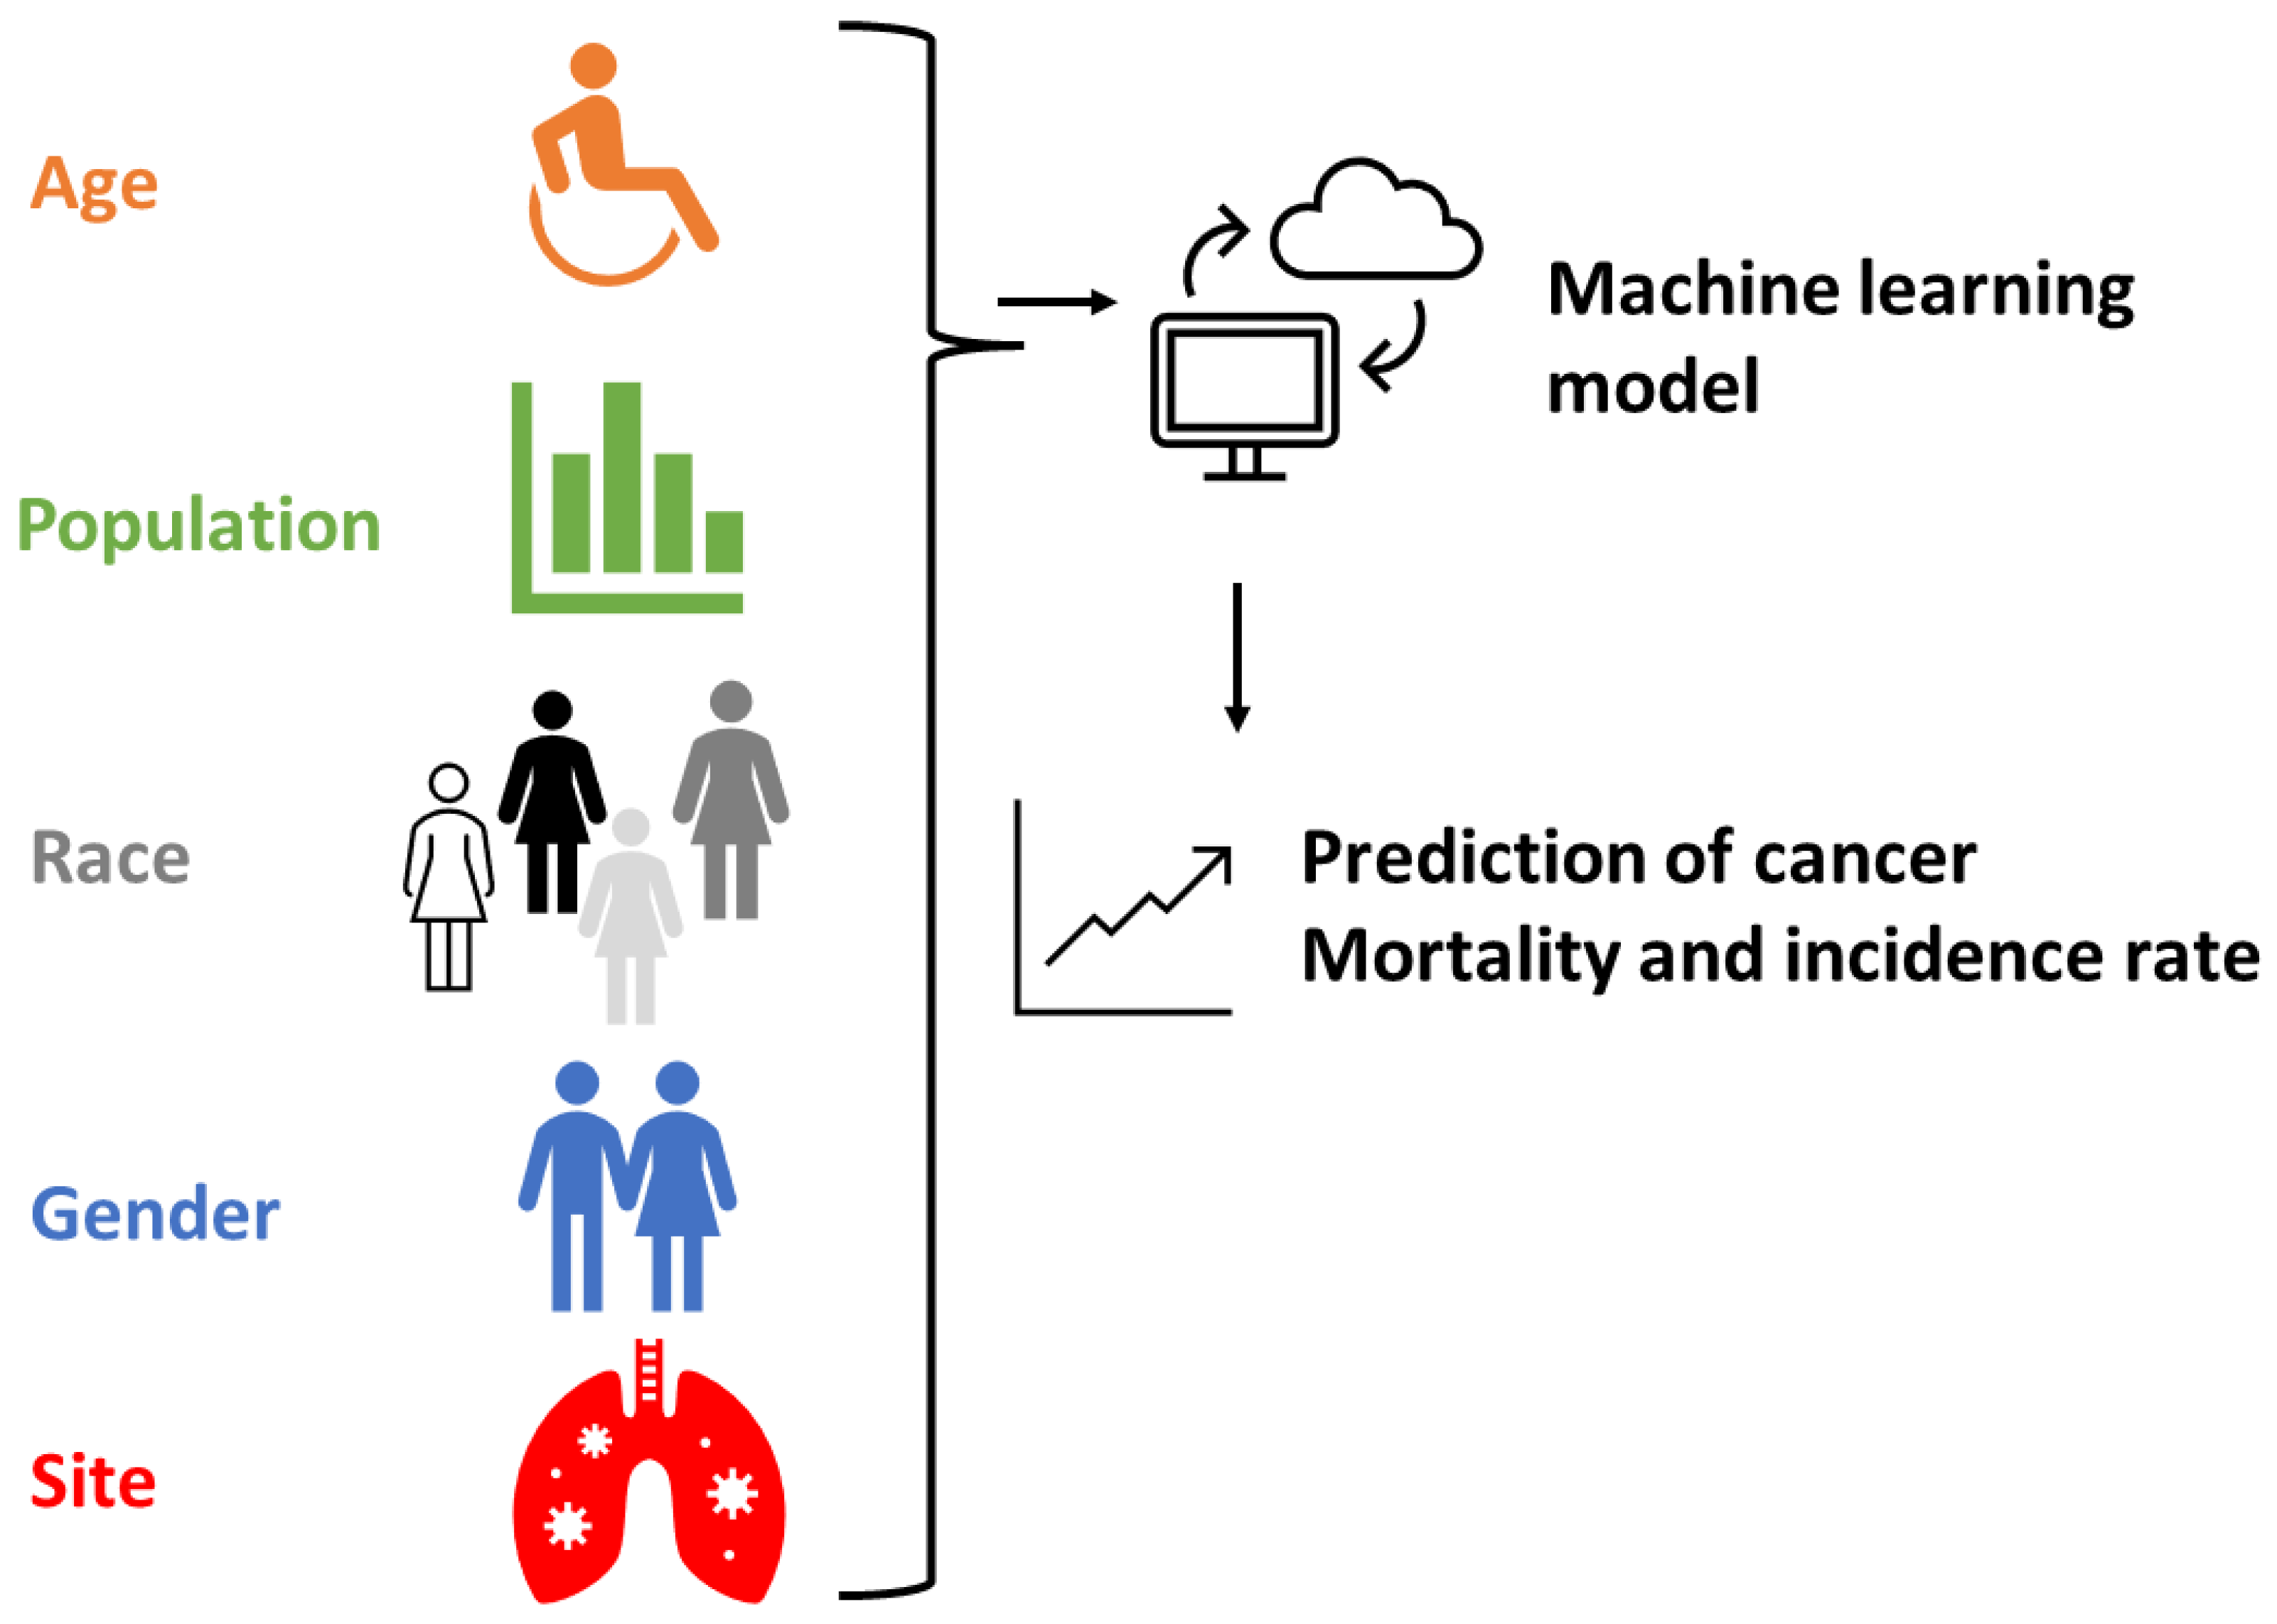
Cancer is a major concern for people, and accurately predicting the probability of cancer incidence and mortality is an important research topic. With the development of big data and artificial intelligence technology, a new machine learning model has emerged. Using 72,591 pieces of data, including age, case count, population size, race, gender, site of onset, and year of discovery, we built a machine learning model. Through calculations, we found that the decision tree, random forest, logistic regression, support vector machine, and neural network achieved testing accuracies of 62.11%, 61.68%, 54.53%, 55.72%, and 63.10%, respectively. With the help of this model, scientists and policymakers can accurately predict future cancer incidence and mortality rates through databases, allowing them to make relevant policies (such as timely allocating doctors and medical resources) to better serve the people.
Keywords:
Cancer
; Incidence
; Mortality
; Artificial Intelligence
; Machine learning
; Neural network
1. Introduction
Cancer is a pervasive and devastating disease that poses a significant threat to human health and wellbeing [1]. It is estimated that globally, there are approximately 18.1 million new cases of cancer and 9.6 million cancer-related deaths annually [2,3]. Notably, males have a higher incidence and mortality rate than females, with around 20% of males and 17% of females experiencing cancer at some point in their lifetime, while 13% of males and 9% of females will die from it [2,3]. In cancer research, accurately predicting the incidence and mortality rates of cancer is a crucial research topic. Various factors influence the incidence rates, including demographic, lifestyle, environmental, and genetic factors. On the other hand, mortality rates are additionally impacted by healthcare accessibility and quality [4]. Therefore, the precise prediction of cancer incidence and mortality rates is of vital importance, as it can empower policymakers and healthcare providers with the necessary information to develop targeted and effective policies and interventions to combat cancer’s pervasive and devastating impact on individuals and communities [5].
Traditional cancer prediction relies on mathematical calculations [6,7]. The first step involves collecting relevant data, followed by using the collected data to calculate and fit a formula that establishes connections between cancer occurrence and factors such as family history, age, height, BMI, and age at first childbirth. The third step involves using the formula for cancer prediction, while the fourth step involves examining the accuracy of the predictions [6]. However, the accuracy of the prediction is heavily reliant on the accuracy of the formula, which depends on the assumptions made (such as BMI affecting cancer) and the researchers’ experience. To mitigate the risk of incorrect assumptions and biases from researchers, a novel technique is being developed - machine learning (ML). ML models directly connect the input data and cancer prediction output, without considering the formula. The accuracy of the prediction depends on the quality and quantity of data, making it a promising technique for predicting cancer incidence and mortality rates.

Table 1.
Comparison between traditional cancer and new ML model on cancer prediction.
| Breast cancer prediction model | ML model | |
|---|---|---|
| Rationales | Use of mathematic formula to predict the cancer | Prediction of cancer via the ML algorithm |
| Methods | Use of data to build formula, connecting factors (e.g., age, height, BMI) and cancer; | Prediction via the “black box” without considering the connections |
| Accuracy of prediction | Assumptions and connections | Quality and quantity of data |
| Advantages | Matured methods with clear process | Convenient and fact prediction |
| Limitations | Incorrect assumption and researchers’ bias | “Black swan” effect |
| Reference | [6,7] | [8,9,10,11,12,13] |
The purpose of this study is to investigate the feasibility of using ML models to predict cancer incidence and mortality rates. The specific objectives are as follows: (1) to collect large datasets of cancer and perform data cleaning; (2) to construct ML models using the collected data; (3) to predict cancer outcomes using the ML models; and (4) to validate the prediction results and calculate the accuracy. The significance of this study is that, following the validation of the feasibility of ML models, policymakers may employ these models to forecast cancer outbreaks and better plan for medical resource allocation in advance.
Figure 1.
Schematic illustration showing the process of ML model setup and prediction.
2. Material and Methods
2.1. Data collection and clear
This study utilized data from the Centers for Disease Control and Prevention (CDC), United States Cancer Statistics (USCS), unless otherwise specified (https://www.cdc.gov/cancer/uscs/dataviz/download_data.htm, accessed on 1 March 2023). Prior to analysis, all incomplete records were removed from the dataset. Specifically, we extracted the following categories: “age”, “count”, “population”, “race”, “gender”, “site”, “year”, “incidence rate”, and “mortality rate”. To facilitate analysis, a relationship matrix was generated to compare the different categories. To ensure consistency in data formatting, all data were converted to positive integers based on the classification presented in Table 2.
2.2. ML models
The application of machine learning (ML) models in cancer prediction has been a topic of interest for researchers in recent years [8,9]. In this study, we built upon previous studies by making slight modifications to the ML models used. A total of 72591 records were utilized for the ML calculations, with 75% of the records being used for training the models, and the remaining 25% for testing. The ML models were implemented on the Anaconda 3 and Jupyter 6.3.0 platform using programming tools such as Scikit-learn, Graphviz, Numpy, Pandas, Matplotlib, and SciPy, as detailed in Tables S1 and S2. We employed five different ML methods to make the calculations - decision tree, random forest, logistic regression, support vector machine (SVC), and neural network. In the case of the random forest model, we employed a hyper-tuning process via the random search method (Table S3 and S4). Our neural network model consisted of a total of 100 hidden layers, with each layer containing 100 nodes.
After the models were trained, we conducted an analysis of the testing accuracy and confirmed the ML model that showed the highest accuracy. We then conducted a detailed investigation into the two significant factors - "age" and "site" - and their influence on the incidence and mortality rates of cancer. Our analysis yielded important insights into the factors that contribute to the incidence and mortality rates of different types of cancer. Finally, based on the results of our study, we provided recommendations to improve the ML models and control the most lethal cancers identified. These recommendations could help policymakers and healthcare providers develop targeted and effective policies and interventions to combat cancer’s pervasive and devastating impact on individuals and communities. Overall, this study underscores the potential of ML models to aid in cancer prediction and the importance of continued research in this area.
3. Results
3.1. Factors affecting the cancer
After conducting a comprehensive analysis of the data, our findings revealed that the risk of developing cancer is highly influenced by two major factors: "age" and "site". We used a heatmap analysis to evaluate the relationship between these factors and the cancer incidence rate. Our results indicate that the correlation coefficient between "age" and cancer incidence rate was found to be +0.38 (Figure 2). This suggests that as individuals age, they become more susceptible to developing cancer.
Furthermore, our analysis also showed that the "site" of cancer is another crucial factor that affects the incidence rate of cancer. The correlation coefficient between "site" and cancer incidence rate was found to be +0.43 (Figure 2). This implies that the location or the specific organ where the cancer is found has a significant impact on its progression.
In contrast, our study found that factors such as "race", "gender", and "year of discovery" have relatively low impact on the incidence rate of cancer. The correlation coefficient between race and cancer incidence rate was found to be +0.0047, while that between gender and cancer incidence rate was found to be +0.11. Similarly, the correlation coefficient between year of discovery and cancer incidence rate was found to be +0.044. Although these factors are important, their influence on the incidence rate of cancer is comparatively low.
Our study underscores the importance of identifying and understanding the factors that affect the incidence rate of cancer. By recognizing the significant impact of "age" and "site", health professionals and policymakers can develop more targeted prevention and treatment strategies. Our findings provide a foundation for further research to identify additional factors that may influence the incidence rate of cancer, ultimately leading to more effective prevention and treatment methods.
The mortality rate analysis of the study further confirmed the significance of age and site in influencing the outcome of cancer. The heatmap analysis revealed that "age" and "site" have a high positive correlation coefficient with the mortality rate, indicating that they are important predictors of cancer death. The correlation coefficient for "age" was found to be +0.39 (Figure 2), which implies that the likelihood of cancer death increases with age. Similarly, the correlation coefficient for "site" was +0.40 (Figure 3), indicating that the location of cancer significantly affects its progression and outcome.
On the other hand, the study found that the impact of race, gender, and year of discovery on cancer mortality rate is relatively low, with correlation coefficients of +0.043, +0.13, and +0.05 respectively. These findings suggest that although these factors may have some influence on cancer mortality, their effect is much weaker compared to age and site.
The results of the mortality rate analysis reinforce the importance of age and site as key predictors of cancer outcome. The findings can have significant implications for the development of effective strategies for cancer prevention and treatment. Based on these results, healthcare professionals may prioritize screening and early detection programs for individuals with a higher risk of developing cancer due to age or site factors. Additionally, this study highlights the need for further research to better understand the underlying mechanisms linking age and site to cancer development and progression, which can inform the development of more targeted and personalized treatment approaches.
3.2. Different ML models and prediction accuracy
In this study, we utilized five different machine learning (ML) methods, namely decision tree, random forest, logistic regression, support vector machine (SVC), and neural network, to evaluate and compare their effectiveness in predicting cancer incidence and mortality rates. After training the models, we assessed their performance by analyzing the testing accuracy. The results showed that the neural network model achieved the highest accuracy with 60.82% for incidence rate and 63.10% for mortality rate, surpassing the other four models.
Comparing the neural network with the other models, the decision tree, random forest, logistic regression, and SVC models showed relatively lower testing accuracy, indicating that they are less effective in predicting cancer incidence and mortality rates. Table 3 provides a summary of the testing accuracy of each model.
It is worth noting that the selection of ML methods should consider various factors, such as the data characteristics, model complexity, and computational resources. Therefore, future studies may need to further evaluate and compare different ML methods with larger datasets and more complex models to improve the prediction accuracy of cancer incidence and mortality rates.
4. Discussion
4.1. Age affecting incidence and mortality rate
Our analysis of the heatmap (Figure 2 and Figure 3) revealed that age has a greater impact on the incidence and mortality rates of cancer than race, gender, and year of discovery. Specifically, most cancer cases occurred after the age of 40, with the highest incidence rate frequency in the “60-64” age category and the highest mortality rate frequency in the “70-74” age category (Figure 4). These results are consistent with previous studies that have shown that cancer rates increase as people age [14]. Moreover, the incidence of breast cancer, for example, is known to be extremely low before the age of 30 and reaches its highest level at the age of 80 [15]. While it is possible for cancer to occur at any age, most patients with invasive cancer are over 65, which may be due to the accumulation of protein-altering mutations [16].
The impact of age on cancer incidence and mortality rates is not surprising, given that aging is a complex process that affects all body systems. With increasing age, cells in the body accumulate genetic mutations and other changes that increase the risk of developing cancer [17,18]. Additionally, the immune system weakens with age, making it less effective in detecting and fighting cancer cells [19,20]. These factors contribute to the higher incidence and mortality rates of cancer in older adults. Overall, our findings highlight the importance of age as a risk factor for cancer and suggest that strategies aimed at preventing and treating cancer should consider the age of the patient. Moreover, our results underscore the need for continued research into the complex interplay between aging and cancer development.
4.2. Cancer of the lung, bronchus, and prostate and prevention
Our analysis of cancer mortality rates revealed that prostate cancer and lung and bronchus cancer pose the greatest threat, with 170 and 140 reported deaths per 100,000 individuals, respectively. This indicates that these cancers are associated with the highest mortality rates compared to other types of cancer, as presented in Table 4. On the other hand, the incidence of testis cancer, Hodgkin lymphoma cancer, and thyroid cancer had the lowest reported deaths per 100,000 individuals, with rates of 0.416, 1.052, and 2.675, respectively.
It is important to note that our findings corroborate with previous studies that have also reported prostate and lung cancer as the leading causes of cancer deaths worldwide. For instance, according to the World Health Organization, lung cancer is the most common cancer worldwide, with 2.1 million new cases in 2018, representing 11.6% of all new cancer cases, and 1.8 million deaths, accounting for 18.4% of all cancer deaths [21]. Similarly, the American Cancer Society estimates that prostate cancer is the second most common cancer and the second leading cause of cancer death among men in the United States, with an estimated 248,530 new cases and 34,130 deaths in 2021 [22,23].
Considering these findings, it is crucial to prioritize prevention, early detection, and effective treatment of these types of cancer to reduce the associated morbidity and mortality rates. This may involve regular screening, lifestyle modifications, such as smoking cessation and physical activity, and the development of novel therapies for advanced-stage cancers. Our analysis of cancer mortality rates highlights the significance of cancer type in predicting cancer-related outcomes. While prostate and lung cancer are associated with the highest mortality rates, testis cancer, Hodgkin lymphoma cancer, and thyroid cancer have the least reported deaths. By identifying these patterns, we can better understand the risk factors and implement effective strategies to improve cancer prevention and treatment outcomes.
According to recent research, one of the emerging factors that can lead to the development of prostate cancer and lung cancer is bacteria and biofilm infection [24,25,26,27]. Bacteria and biofilms are known to play a critical role in the genesis of prostate calcifications [26,28,29], which can cause inflammation and ultimately lead to prostate cancer. Similarly, biofilm formation can lead to lung infections caused by microorganisms such as Pseudomonas aeruginosa and Enterococcus faecalis [30,31,32], which can further develop into lung cancer.
Biofilm is essentially a community of microorganisms that attach to a surface and are embedded in extracellular polymeric substances, such as extracellular DNA, proteins, and polysaccharides [33,34,35,36,37]. In recent years, researchers have been able to engineer biofilms for various purposes, including electricity generation [38,39,40], pollutant removal [34,35,36], and concrete enhancements [41,42,43]. Given the negative effects of biofilm on human health, it is important to explore ways to decrease biofilm in the environment. For example, researchers can develop anti-biofilm cementitious materials [44,45,46] that could help to create a cleaner environment and reduce the risk of cancer. By developing effective strategies to combat biofilm, we may be able to reduce the incidence of prostate cancer and lung cancer and improve overall public health.
4.3. Future improvement on ML models
This paper proposes a promising direction for the use of machine learning (ML) models in predicting cancer incidence and mortality rates. As with any statistical model, the accuracy of the predictions is influenced by various factors. The accuracy of ML models in cancer prediction is mainly affected by the number of input factors and the quantity of records.
The number of input factors is crucial in determining the accuracy of the prediction. This feasibility study uses six factors (“age”, “count”, “population”, “race”, “gender”, “site”, “year”) to predict cancer incidence and mortality rates. However, due to computation power limitations, the number of input factors is restricted. If higher computation power is available in the future, it will be possible to use more factors (e.g., height, weight, smoking habit, drinking habit, family inheritance, migration history, current city, and living environment) to build up the ML model, leading to higher prediction accuracy. Increasing the number of input factors will advance the ML methods, and consequently, the prediction accuracy will also increase [47].
The quantity of records is another factor that determines the accuracy of prediction. This study uses 72591 records to calculate cancer incidence and mortality rates. In the future, if we can use more records (e.g., 1 million), we will have a more accurate prediction of cancer incidence and mortality rates [48,49]. By using a larger amount of data, the ML models can learn better and discover hidden patterns, leading to more accurate predictions.
Furthermore, this study only compares five ML methods (decision tree, random forest, logistic regression, support vector machine (SVC), and neural network) and finds that neural network makes the highest prediction accuracy rate. However, it is possible that there are other ML methods that may perform better. For example, k-means [50], nearest neighbour [51], linear discriminant analysis [52], hidden Markov [53] are other ML methods that can be used to compare prediction accuracy. By employing these additional methods, it may be possible to identify the most accurate method.
In conclusion, the use of ML models in cancer prediction holds great promise. However, there is still room for improvement in the accuracy of the predictions. In the future, by increasing the number of input factors and the quantity of records and exploring other ML methods, we can make more accurate predictions of cancer incidence and mortality rates.
Supplementary Materials
The following supporting information can be downloaded at the website of this paper posted on Preprints.org.
References
- Siegel, R.L.; Miller, K.D.; Wagle, N.S.; Jemal, A. Cancer statistics, 2023. CA A Cancer J. Clin. 2023, 73, 17–48. [Google Scholar] [CrossRef] [PubMed]
- Qawoogha, S.S.; Shahiwala, A. Identification of potential anticancer phytochemicals against colorectal cancer by structure-based docking studies. J. Recept. Signal Transduct. 2020, 40, 67–76. [Google Scholar] [CrossRef] [PubMed]
- Zhang, R.; Meng, Z.; Wu, X.; Zhang, M.; Zhang, S.; Jin, T. Mortalin promotes breast cancer malignancy. Exp. Mol. Pathol. 2021, 118, 104593. [Google Scholar] [CrossRef] [PubMed]
- Kolonel, L.N.; Altshuler, D.; Henderson, B.E. The multiethnic cohort study: exploring genes, lifestyle and cancer risk. Nat. Rev. Cancer 2004, 4, 519–527. [Google Scholar] [CrossRef] [PubMed]
- Ferlay, J.; Colombet, M.; Soerjomataram, I.; Mathers, C.; Parkin, D.M.; Piñeros, M.; Znaor, A.; Bray, F. Estimating the global cancer incidence and mortality in 2018: GLOBOCAN sources and methods. Int. J. Cancer 2019, 144, 1941–1953. [Google Scholar] [CrossRef] [PubMed]
- Tyrer, J.; Duffy, S.W.; Cuzick, J. A breast cancer prediction model incorporating familial and personal risk factors. Stat. Med. 2004, 23, 1111–1130. [Google Scholar] [CrossRef] [PubMed]
- Antoniou, A.C.; Easton, D.F. Risk prediction models for familial breast cancer. 2006.
- Chen, S.; Ding, Y. Machine Learning and Its Applications in Studying the Geographical Distribution of Ants. Diversity 2022, 14, 706. [Google Scholar] [CrossRef]
- Chen, S.; Ding, Y. A Machine Learning Approach to Predicting Academic Performance in Pennsylvania’s Schools. Soc. Sci. 2023, 12, 118. [Google Scholar] [CrossRef]
- Chen, S.; Ding, Y.; Liu, X. Development of the growth mindset scale: Evidence of structural validity, measurement model, direct and indirect effects in Chinese samples. Curr. Psychol. 2021, 1–15. [Google Scholar] [CrossRef]
- Wabartha, M.; Durand, A.; Francois-Lavet, V.; Pineau, J. Handling black swan events in deep learning with diversely extrapolated neural networks. 2021; pp. 2140–2147.
- Cruz, J.A.; Wishart, D.S. Applications of machine learning in cancer prediction and prognosis. Cancer Inform. 2006, 2, 117693510600200030. [Google Scholar] [CrossRef]
- Wang, G.; Lam, K.-M.; Deng, Z.; Choi, K.-S. Prediction of mortality after radical cystectomy for bladder cancer by machine learning techniques. Comput. Biol. Med. 2015, 63, 124–132. [Google Scholar] [CrossRef] [PubMed]
- Jemal, A.; Bray, F.; Center, M.M.; Ferlay, J.; Ward, E.; Forman, D. Global cancer statistics. CA A Cancer J. Clin. 2011, 61, 69–90. [Google Scholar] [CrossRef]
- Singletary, S.E. Rating the risk factors for breast cancer. Ann. Surg. 2003, 237, 474. [Google Scholar] [CrossRef] [PubMed]
- Vogelstein, B.; Papadopoulos, N.; Velculescu, V.E.; Zhou, S.; Diaz Jr, L.A.; Kinzler, K.W. Cancer genome landscapes. science 2013, 339, 1546–1558. [Google Scholar] [CrossRef]
- Preston-Martin, S.; Pike, M.C.; Ross, R.K.; Jones, P.A.; Henderson, B.E. Increased cell division as a cause of human cancer. Cancer Res. 1990, 50, 7415–7421. [Google Scholar] [PubMed]
- Rubin, J.B.; Lagas, J.S.; Broestl, L.; Sponagel, J.; Rockwell, N.; Rhee, G.; Rosen, S.F.; Chen, S.; Klein, R.S.; Imoukhuede, P. Sex differences in cancer mechanisms. Biol. Sex Differ. 2020, 11, 1–29. [Google Scholar] [CrossRef] [PubMed]
- Marasco, V.; Carniti, C.; Guidetti, A.; Farina, L.; Magni, M.; Miceli, R.; Calabretta, L.; Verderio, P.; Ljevar, S.; Serpenti, F. T-cell immune response after mRNA SARS-CoV-2 vaccines is frequently detected also in the absence of seroconversion in patients with lymphoid malignancies. Br. J. Haematol. 2022, 196, 548–558. [Google Scholar] [CrossRef]
- Mellman, I.; Coukos, G.; Dranoff, G. Cancer immunotherapy comes of age. Nature 2011, 480, 480–489. [Google Scholar] [CrossRef]
- Bray, F.; Ferlay, J.; Soerjomataram, I.; Siegel, R.L.; Torre, L.A.; Jemal, A. Global cancer statistics 2018: GLOBOCAN estimates of incidence and mortality worldwide for 36 cancers in 185 countries. CA: A Cancer J. Clin. 2018, 68, 394–424. [Google Scholar] [CrossRef]
- Berglund, A.; Matta, J.; Encarnación-Medina, J.; Ortiz-Sanchéz, C.; Dutil, J.; Linares, R.; Marcial, J.; Abreu-Takemura, C.; Moreno, N.; Putney, R. Dysregulation of DNA Methylation and Epigenetic Clocks in Prostate Cancer among Puerto Rican Men. Biomolecules 2022, 12, 2. [Google Scholar] [CrossRef]
- Spieker, A.J.; Gordetsky, J.B.; Maris, A.S.; Dehan, L.M.; Denney, J.E.; Arnold Egloff, S.A.; Scarpato, K.; Barocas, D.A.; Giannico, G.A. PTEN expression and morphological patterns in prostatic adenocarcinoma. Histopathology 2021, 79, 1061–1071. [Google Scholar] [CrossRef] [PubMed]
- Li, S.; Konstantinov, S.R.; Smits, R.; Peppelenbosch, M.P. Bacterial biofilms in colorectal cancer initiation and progression. Trends Mol. Med. 2017, 23, 18–30. [Google Scholar] [CrossRef]
- Mirzaei, R.; Sabokroo, N.; Ahmadyousefi, Y.; Motamedi, H.; Karampoor, S. Immunometabolism in biofilm infection: lessons from cancer. Mol. Med. 2022, 28, 10. [Google Scholar] [CrossRef] [PubMed]
- Parsonnet, J. Bacterial infection as a cause of cancer. Environ. Health Perspect. 1995, 103, 263–268. [Google Scholar] [PubMed]
- Uemura, N.; Okamoto, S.; Yamamoto, S.; Matsumura, N.; Yamaguchi, S.; Yamakido, M.; Taniyama, K.; Sasaki, N.; Schlemper, R.J. Helicobacter pylori infection and the development of gastric cancer. New Engl. J. Med. 2001, 345, 784–789. [Google Scholar] [CrossRef] [PubMed]
- Cai, T.; Santi, R.; Tamanini, I.; Galli, I.C.; Perletti, G.; Bjerklund Johansen, T.E.; Nesi, G. Current knowledge of the potential links between inflammation and prostate cancer. Int. J. Mol. Sci. 2019, 20, 3833. [Google Scholar] [CrossRef] [PubMed]
- Cai, T.; Tessarolo, F.; Caola, I.; Piccoli, F.; Nollo, G.; Caciagli, P.; Mazzoli, S.; Palmieri, A.; Verze, P.; Malossini, G. Prostate calcifications: A case series supporting the microbial biofilm theory. Investig. Clin. Urol. 2018, 59, 187–193. [Google Scholar] [CrossRef] [PubMed]
- Chudzik-Rząd, B.; Zalewski, D.; Kasela, M.; Sawicki, R.; Szymańska, J.; Bogucka-Kocka, A.; Malm, A. The Landscape of Gene Expression during Hyperfilamentous Biofilm Development in Oral Candida albicans Isolated from a Lung Cancer Patient. Int. J. Mol. Sci. 2023, 24, 368. [Google Scholar] [CrossRef]
- Vijayakumar, S.; Vaseeharan, B.; Malaikozhundan, B.; Gopi, N.; Ekambaram, P.; Pachaiappan, R.; Velusamy, P.; Murugan, K.; Benelli, G.; Kumar, R.S. Therapeutic effects of gold nanoparticles synthesized using Musa paradisiaca peel extract against multiple antibiotic resistant Enterococcus faecalis biofilms and human lung cancer cells (A549). Microb. Pathog. 2017, 102, 173–183. [Google Scholar] [CrossRef]
- Bjarnsholt, T.; Buhlin, K.; Dufrêne, Y.F.; Gomelsky, M.; Moroni, A.; Ramstedt, M.; Rumbaugh, K.P.; Schulte, T.; Sun, L.; Åkerlund, B. Biofilm formation–what we can learn from recent developments. 2018, 284, 332–345.
- Wu, Y.; Ding, Y.; Cohen, Y.; Cao, B. Elevated level of the second messenger c-di-GMP in Comamonas testosteroni enhances biofilm formation and biofilm-based biodegradation of 3-chloroaniline. Appl. Microbiol. Biotechnol. 2015, 99, 1967–1976. [Google Scholar] [CrossRef]
- Ding, Y.; Peng, N.; Du, Y.; Ji, L.; Cao, B. Disruption of putrescine biosynthesis in Shewanella oneidensis enhances biofilm cohesiveness and performance in Cr (VI) immobilization. Appl. Environ. Microbiol. 2014, 80, 1498–1506. [Google Scholar] [CrossRef] [PubMed]
- Ding, Y.; Zhou, Y.; Yao, J.; Szymanski, C.; Fredrickson, J.; Shi, L.; Cao, B.; Zhu, Z.; Yu, X.-Y. In situ molecular imaging of the biofilm and its matrix. Anal. Chem. 2016, 88, 11244–11252. [Google Scholar] [CrossRef] [PubMed]
- Ding, Y.; Zhou, Y.; Yao, J.; Xiong, Y.; Zhu, Z.; Yu, X.-Y. Molecular evidence of a toxic effect on a biofilm and its matrix. Analyst 2019, 144, 2498–2503. [Google Scholar] [CrossRef] [PubMed]
- Flemming, H.-C.; Wingender, J. The biofilm matrix. Nat. Rev. Microbiol. 2010, 8, 623–633. [Google Scholar] [CrossRef] [PubMed]
- Yang, Y.; Ding, Y.; Hu, Y.; Cao, B.; Rice, S.A.; Kjelleberg, S.; Song, H. Enhancing bidirectional electron transfer of Shewanella oneidensis by a synthetic flavin pathway. ACS Synth. Biol. 2015, 4, 815–823. [Google Scholar] [CrossRef] [PubMed]
- Zhao, C.-e.; Chen, J.; Ding, Y.; Wang, V.B.; Bao, B.; Kjelleberg, S.; Cao, B.; Loo, S.C.J.; Wang, L.; Huang, W. Chemically functionalized conjugated oligoelectrolyte nanoparticles for enhancement of current generation in microbial fuel cells. ACS Appl. Mater. Interfaces 2015, 7, 14501–14505. [Google Scholar] [CrossRef] [PubMed]
- Zhao, C.e.; Wu, J.; Ding, Y.; Wang, V.B.; Zhang, Y.; Kjelleberg, S.; Loo, J.S.C.; Cao, B.; Zhang, Q. Hybrid conducting biofilm with built-in bacteria for high-performance microbial fuel cells. ChemElectroChem 2015, 2, 654–658. [Google Scholar] [CrossRef]
- Zhang, Z.; Liu, D.; Ding, Y.; Wang, S. Mechanical performance of strain-hardening cementitious composites (SHCC) with bacterial addition. J. Infrastruct. Preserv. Resil. 2022, 3, 1–11. [Google Scholar] [CrossRef]
- Zhang, Z.; Weng, Y.; Ding, Y.; Qian, S. Use of Genetically Modified Bacteria to Repair Cracks in Concrete. Materials 2019, 12, 3912. [Google Scholar] [CrossRef]
- Zhang, Z.; Ding, Y.; Qian, S. Influence of bacterial incorporation on mechanical properties of engineered cementitious composites (ECC). Constr. Build. Mater. 2019, 196, 195–203. [Google Scholar] [CrossRef]
- Hamdany, A.H.; Ding, Y.; Qian, S. Visible light antibacterial potential of graphene-TiO2 cementitious composites for self-sterilization surface. J. Sustain. Cem. -Based Mater. 2022, 1-11.
- Hamdany, A.H.; Ding, Y.; Qian, S. Cementitious Composite Materials for Self-Sterilization Surfaces. ACI Mater. J. 2022, 119. [Google Scholar] [CrossRef]
- Hamdany, A.H.; Ding, Y.; Qian, S. Mechanical and antibacterial behavior of photocatalytic lightweight engineered cementitious composites. J. Mater. Civ. Eng. 2021, 33, 04021262. [Google Scholar] [CrossRef]
- Taninaga, J.; Nishiyama, Y.; Fujibayashi, K.; Gunji, T.; Sasabe, N.; Iijima, K.; Naito, T. Prediction of future gastric cancer risk using a machine learning algorithm and comprehensive medical check-up data: A case-control study. Sci. Rep. 2019, 9, 12384. [Google Scholar] [CrossRef] [PubMed]
- Al-Jarrah, O.Y.; Yoo, P.D.; Muhaidat, S.; Karagiannidis, G.K.; Taha, K. Efficient machine learning for big data: A review. Big Data Res. 2015, 2, 87–93. [Google Scholar] [CrossRef]
- Bzdok, D.; Krzywinski, M.; Altman, N. Machine learning: a primer. Nat. Methods 2017, 14, 1119. [Google Scholar] [CrossRef] [PubMed]
- Zhao, M.; Tang, Y.; Kim, H.; Hasegawa, K. Machine learning with k-means dimensional reduction for predicting survival outcomes in patients with breast cancer. Cancer Inform. 2018, 17, 1176935118810215. [Google Scholar] [CrossRef] [PubMed]
- Moitra, D.; Mandal, R.K. Automated grading of non-small cell lung cancer by fuzzy rough nearest neighbour method. Netw. Model. Anal. Health Inform. Bioinform. 2019, 8, 1–9. [Google Scholar] [CrossRef]
- Jessica, E.O.; Hamada, M.; Yusuf, S.I.; Hassan, M. The Role of Linear Discriminant Analysis for Accurate Prediction of Breast Cancer. 2021; pp. 340–344.
- Nguyen, T.; Khosravi, A.; Creighton, D.; Nahavandi, S. Hidden Markov models for cancer classification using gene expression profiles. Inf. Sci. 2015, 316, 293–307. [Google Scholar] [CrossRef]
Figure 2.
Heatmap analysis showing the relationship between “age”, “count”, “population”, “race”, “gender”, “site”, “year”, and “rate” in cancer incidence rate.
Figure 2.
Heatmap analysis showing the relationship between “age”, “count”, “population”, “race”, “gender”, “site”, “year”, and “rate” in cancer incidence rate.
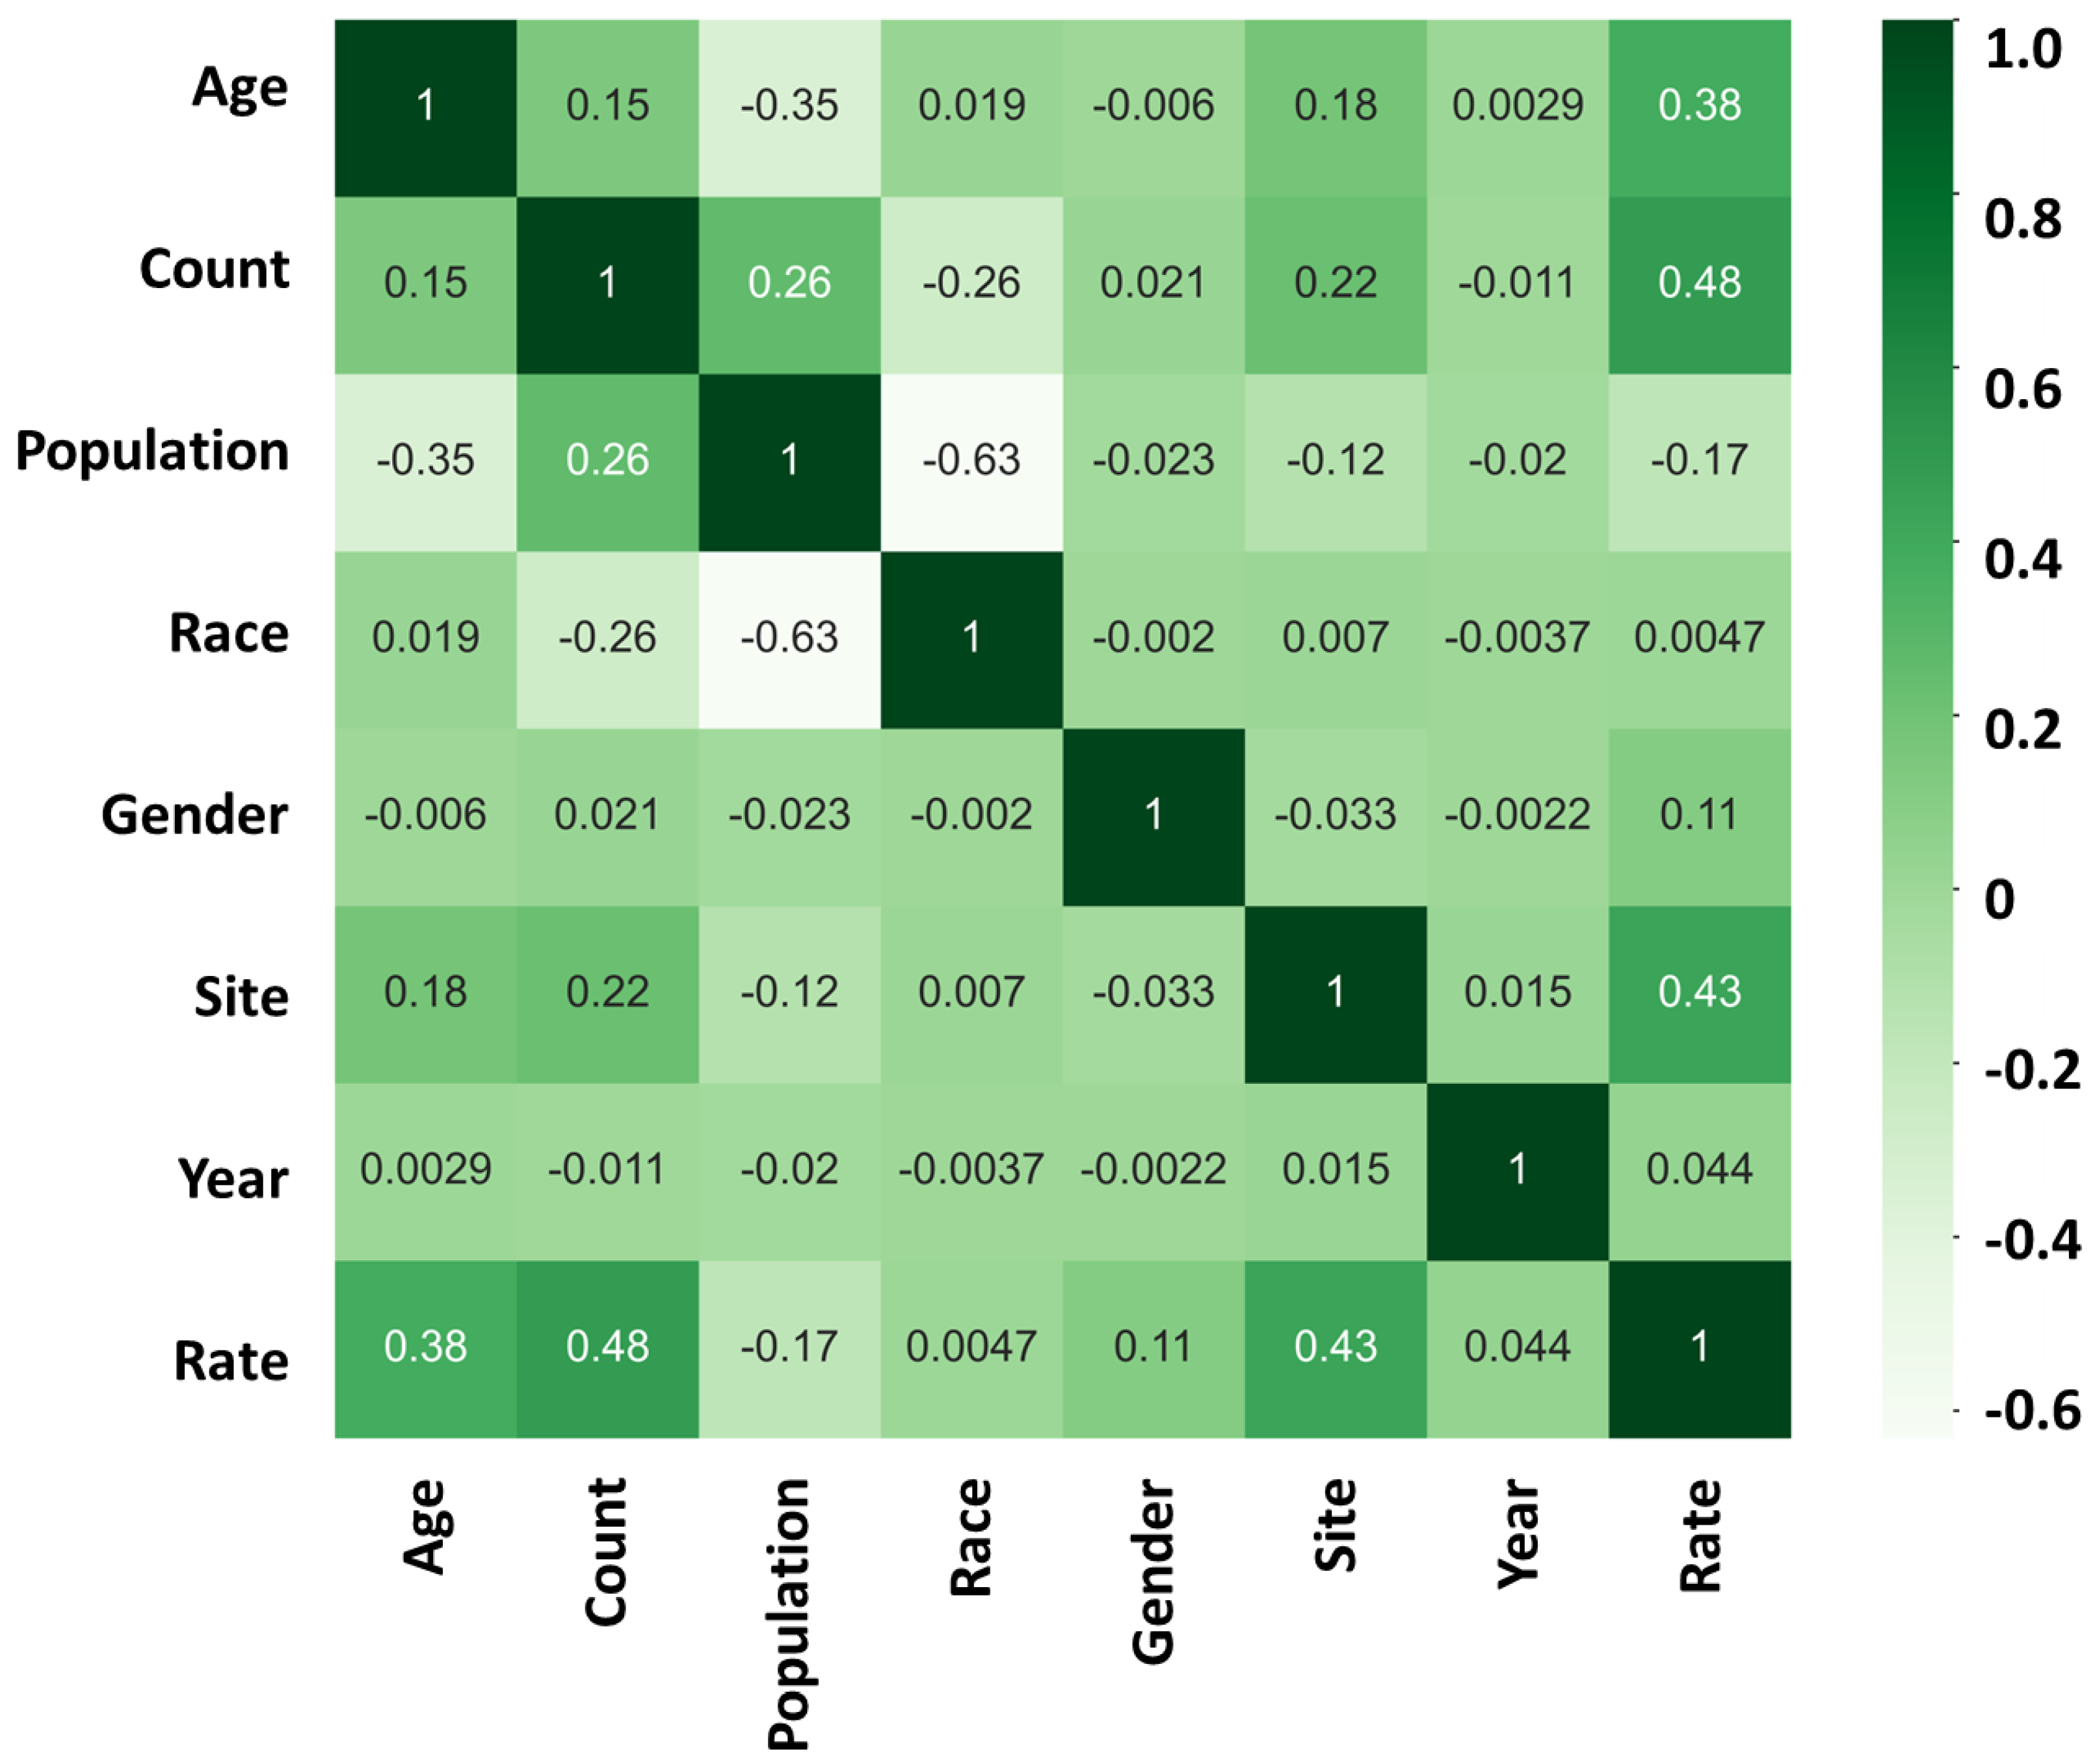
Figure 3.
Heatmap analysis showing the relationship between “age”, “count”, “population”, “race”, “gender”, “site”, “year”, and “rate” in cancer mortality rate.
Figure 3.
Heatmap analysis showing the relationship between “age”, “count”, “population”, “race”, “gender”, “site”, “year”, and “rate” in cancer mortality rate.
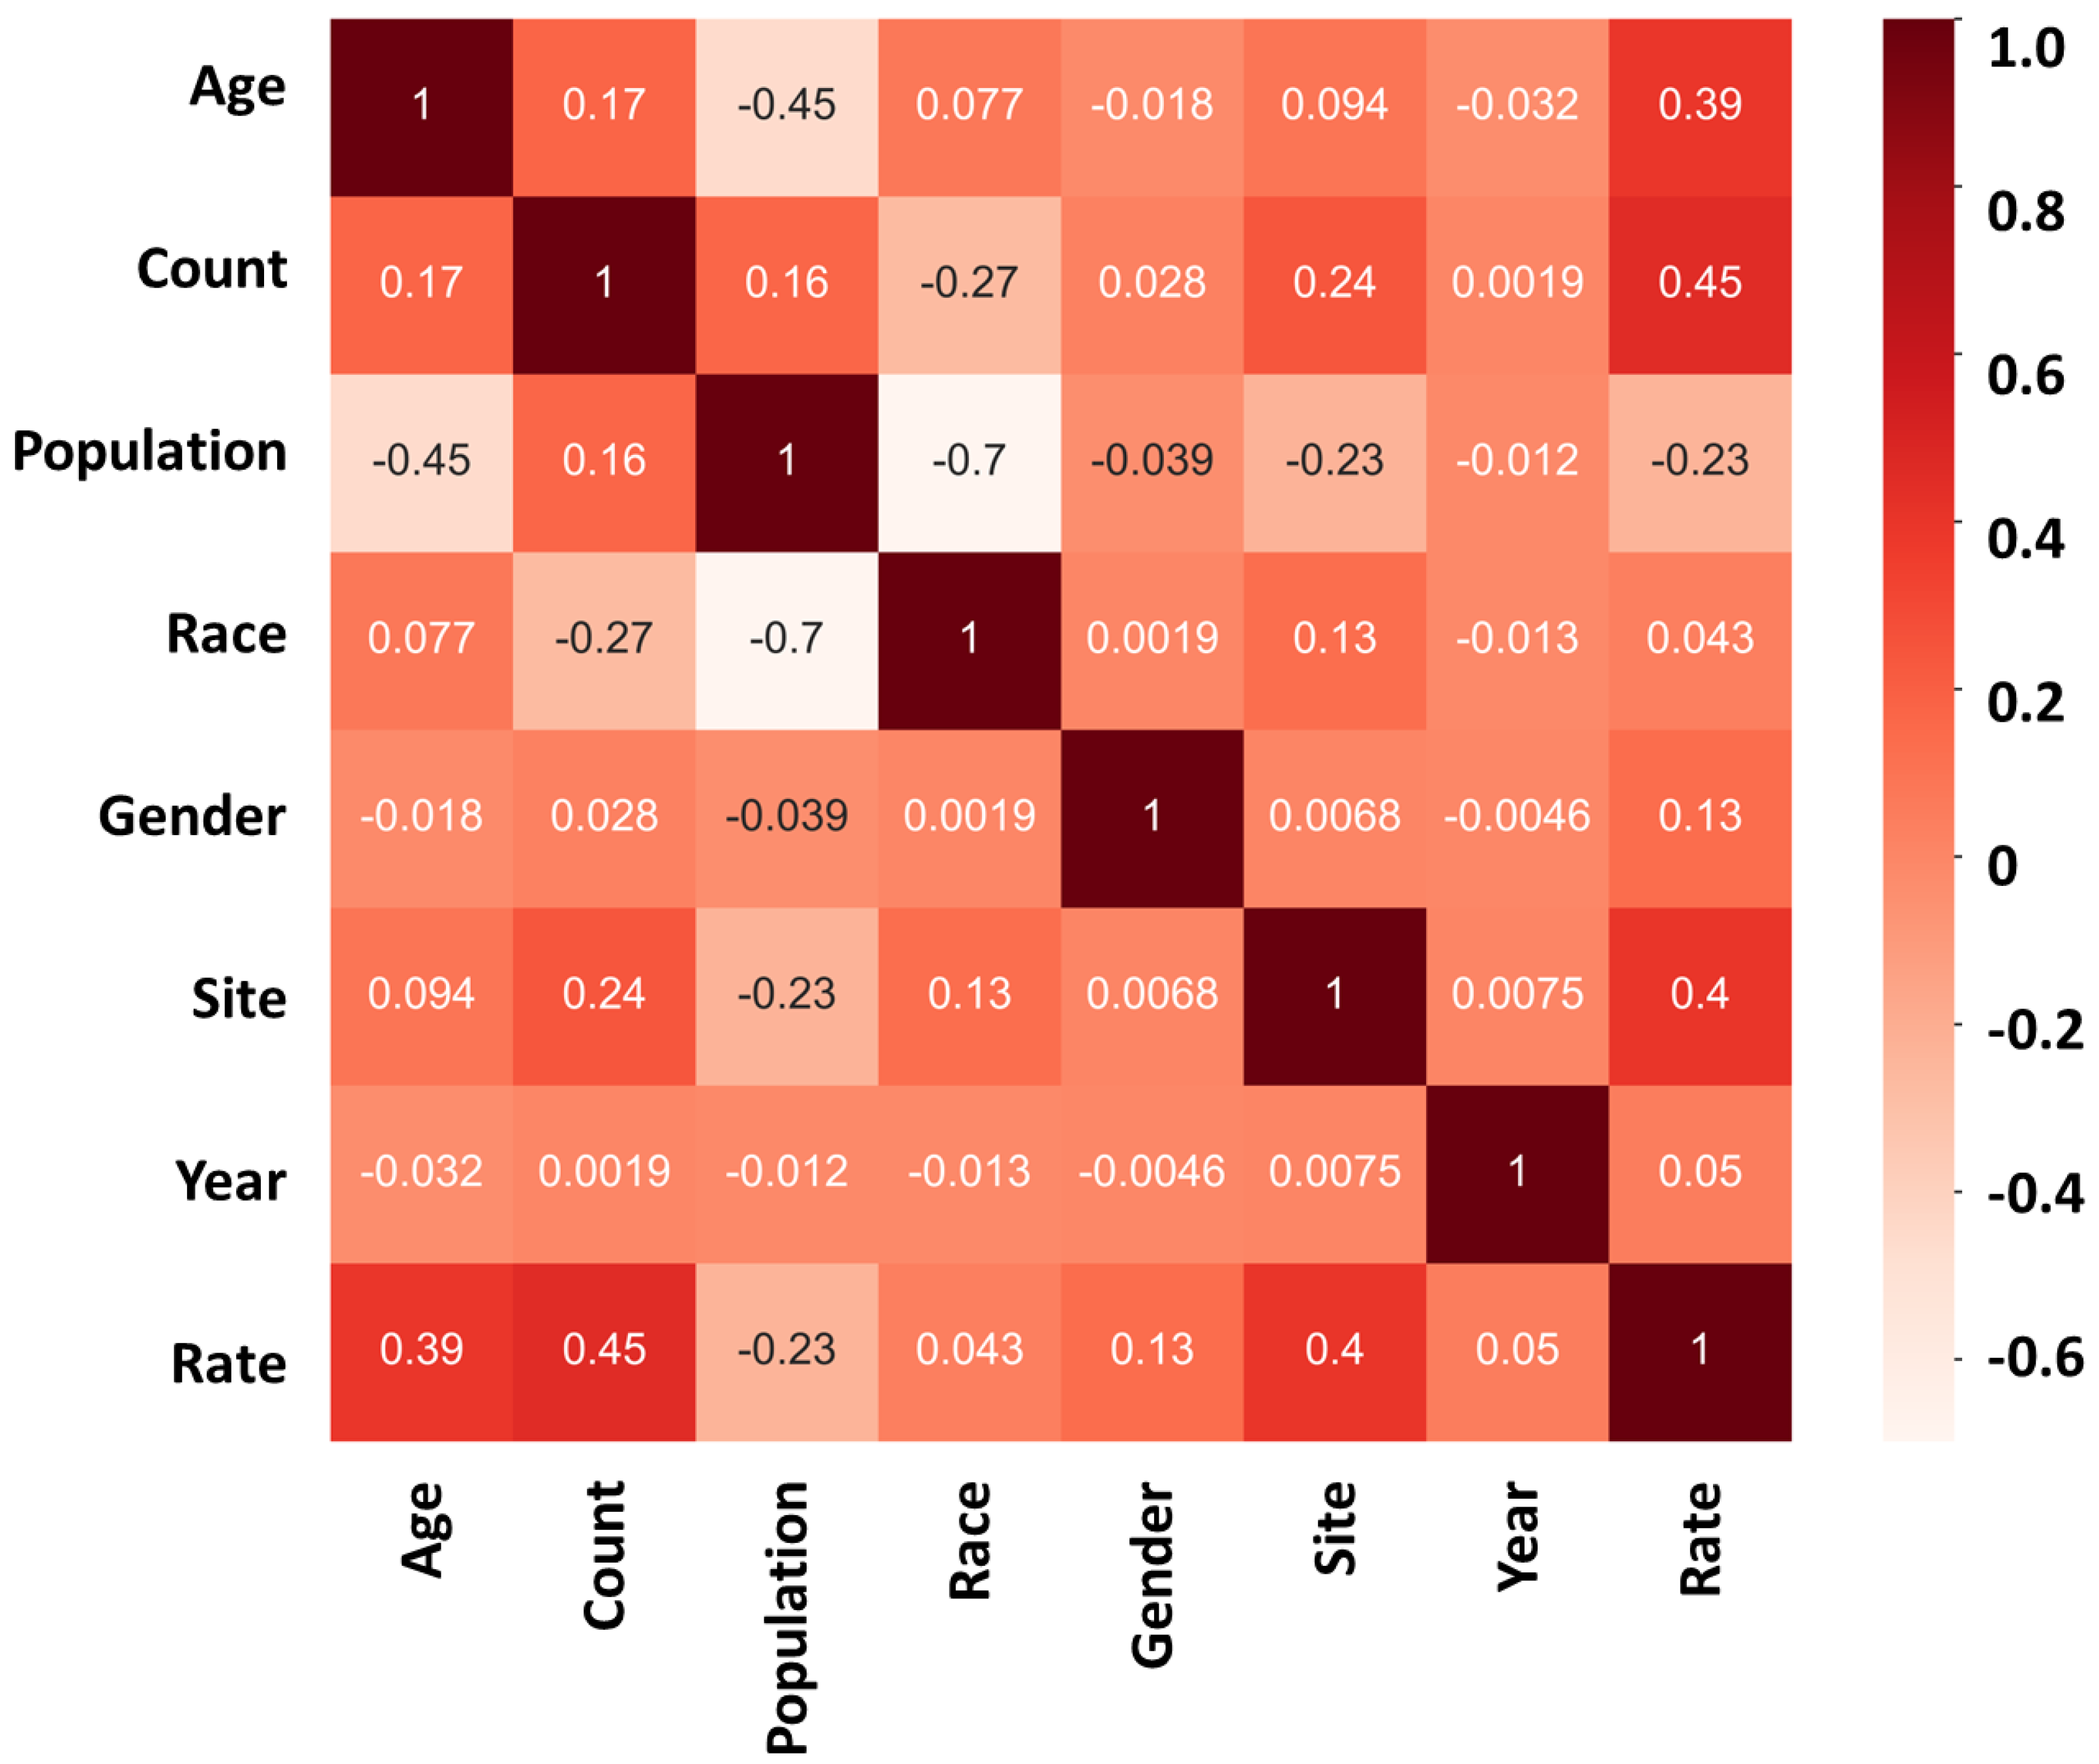
Figure 4.
Incidence and mortality by age. Frequency a value from 0 (the lowest possibility) to 1 (the highest possibility).
Figure 4.
Incidence and mortality by age. Frequency a value from 0 (the lowest possibility) to 1 (the highest possibility).
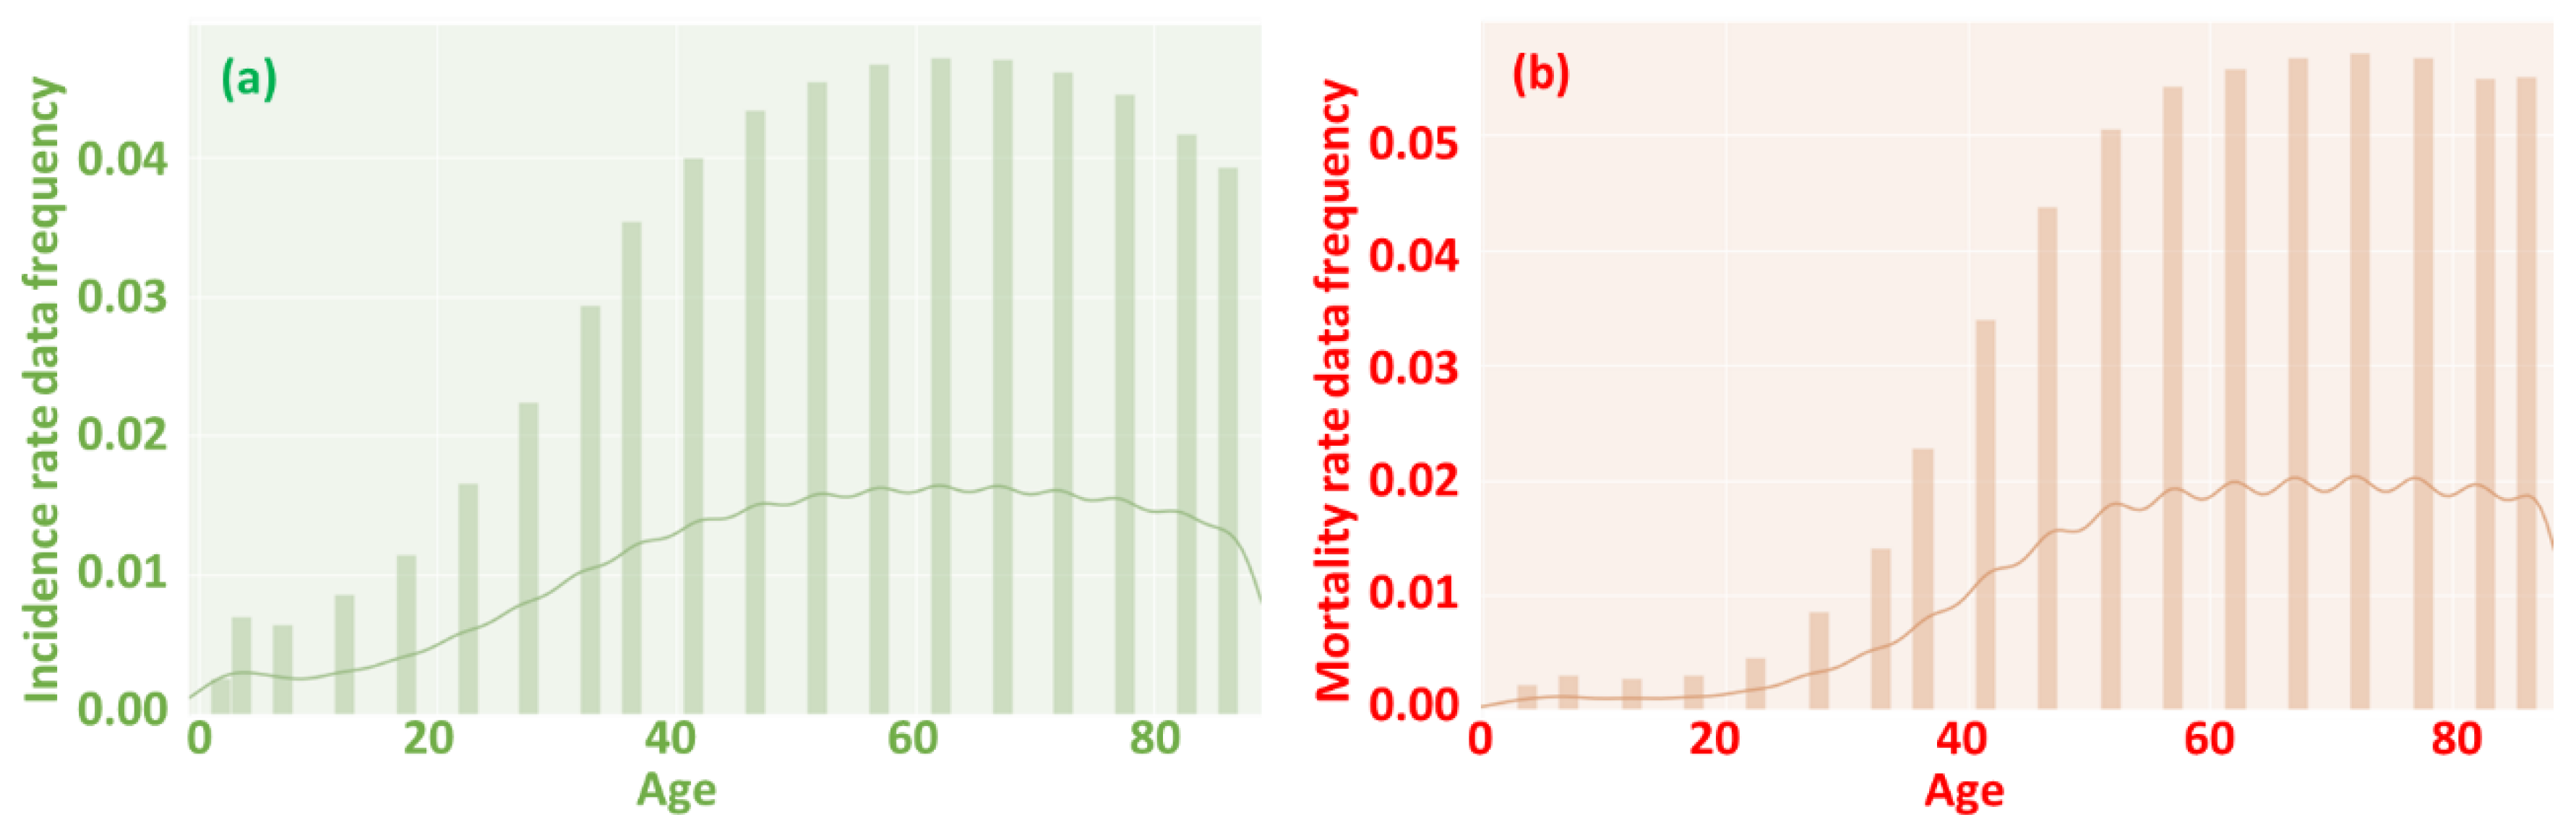
Table 2.
Classification method for data treatment.
| Age | Approximate number | Site | Assigned number | Year | Assigned number |
| ≤ 1 | 1 | Testis | 1 | 2019 | 1 |
| 1-4 | 3 | Hodgkin Lymphoma | 2 | 2018 | 2 |
| 5-9 | 7 | Thyroid | 3 | 2017 | 3 |
| 10-14 | 12 | Mesothelioma | 4 | 2016 | 4 |
| 15-19 | 17 | Cervix | 5 | 2015 | 5 |
| 20-24 | 22 | Brain and Other Nervous System | 6 | 2014 | 6 |
| 25-29 | 27 | Larynx | 7 | 2013 | 7 |
| 30-34 | 32 | Melanomas of the Skin | 8 | 2012 | 8 |
| 35-39 | 37 | Oral Cavity and Pharynx | 9 | 2011 | 9 |
| 40-44 | 42 | Kidney and Renal Pelvis | 10 | 2010 | 10 |
| 45-49 | 47 | Leukemias | 11 | 2009 | 11 |
| 50-54 | 52 | Esophagus | 12 | 2008 | 12 |
| 55-59 | 57 | Corpus and Uterus, NOS | 13 | 2007 | 13 |
| 60-64 | 62 | Myeloma | 14 | 2006 | 14 |
| 65-69 | 67 | Ovary | 15 | 2005 | 15 |
| 70-74 | 72 | Non-Hodgkin Lymphoma | 16 | 2004 | 16 |
| 75-79 | 77 | Stomach | 17 | 2003 | 17 |
| 80-84 | 82 | Urinary Bladder | 18 | 2002 | 18 |
| 85+ | 87 | Liver and Intrahepatic Bile Duct | 19 | 2001 | 19 |
| Pancreas | 20 | 2000 | 20 | ||
| Female Breast | 21 | 1999 | 21 | ||
| Colon and Rectum | 22 | ||||
| Lung and Bronchus | 23 | ||||
| Prostate | 24 | ||||
| Gender | Assigned number | Race | Approximate number | Event type | Assigned number |
| Female | 1 | Non-Hispanic White | 1 | Incidence | 1 |
| Male | 2 | Non-Hispanic Asian/Pacific Islander | 2 | Mortality | 2 |
| Non-Hispanic American Indian/Alaska Native | 3 | ||||
| Non-Hispanic Black | 4 | ||||
| Hispanic of any race | 5 | ||||
| CIlower/CIupper | Approximate number | Incidence/Mortality Rate | Assigned number | ||
| [0-0.5) | 0 | [0-5) | 0 | ||
| [0.5-1.5) | 1 | [5-15) | 10 | ||
| [1.5-2.5) | 2 | [15-25) | 20 | ||
| [2.5-3.5) | 3 | [25-35) | 30 | ||
| … | … | … | … |
Table 3.
Comparison of ML prediction method.
| Incidence rate prediction | Method | Classifier | Testing Accuracy |
| Decision tree | DecisionTreeClassifier | 57.22% | |
| Random forest | RandomForestClassifier | 57.80% | |
| Logistic regression | LogisticRegression | 50.11% | |
| SVC | SupportVectorClassifier | 49.99% | |
| Neural network | MLPClassifier | 60.82% | |
| Mortality rate prediction | Method | Classifier | Testing Accuracy |
| Decision tree | DecisionTreeClassifier | 62.11% | |
| Random forest | RandomForestClassifier | 61.68% | |
| Logistic regression | LogisticRegression | 54.53% | |
| SVC | SupportVectorClassifier | 55.72% | |
| Neural network | MLPClassifier | 63.10% |
Table 4.
Average mortality rate by different sites of cancer.
| Scheme 100. | Reported incidence rate per 100’000 | Reported death rate per 100’000 |
|---|---|---|
| Testis | 6.109 | 0.416 |
| Hodgkin Lymphoma | 3.357 | 1.052 |
| Thyroid | 15.838 | 2.675 |
| Mesothelioma | 5.771 | 5.176 |
| Cervix | 14.571 | 6.23 |
| Brain and Other Nervous System | 7.758 | 7.599 |
| Larynx | 14.946 | 7.642 |
| Melanomas of the Skin | 26.591 | 8.439 |
| Oral Cavity and Pharynx | 21.866 | 9.773 |
| Kidney and Renal Pelvis | 34.078 | 15.238 |
| Leukemias | 20.492 | 15.742 |
| Esophagus | 16.881 | 16.278 |
| Corpus and Uterus, NOS | 46.417 | 16.556 |
| Myeloma | 25.058 | 18.811 |
| Ovary | 20.202 | 19.706 |
| Non-Hodgkin Lymphoma | 33.855 | 19.849 |
| Stomach | 31.179 | 21.067 |
| Urinary Bladder 18 | 58.880 | 23.543 |
| Liver and Intrahepatic Bile Duct | 31.211 | 28.477 |
| Pancreas | 40.685 | 40.167 |
| Female Breast | 137.875 | 51.988 |
| Colon and Rectum | 113.632 | 55.407 |
| Lung and Bronchus | 169.056 | 139.842 |
| Prostate | 429.041 | 169.678 |
Disclaimer/Publisher’s Note: The statements, opinions and data contained in all publications are solely those of the individual author(s) and contributor(s) and not of MDPI and/or the editor(s). MDPI and/or the editor(s) disclaim responsibility for any injury to people or property resulting from any ideas, methods, instructions or products referred to in the content. |
© 2023 by the authors. Licensee MDPI, Basel, Switzerland. This article is an open access article distributed under the terms and conditions of the Creative Commons Attribution (CC BY) license (http://creativecommons.org/licenses/by/4.0/).
Copyright: This open access article is published under a Creative Commons CC BY 4.0 license, which permit the free download, distribution, and reuse, provided that the author and preprint are cited in any reuse.


