
Submitted:
24 September 2024
Posted:
25 September 2024
You are already at the latest version
Abstract
Peroxisome proliferator-activated receptors (PPARs) are important targets for cannabidiol (CBD), which mediate many of its biological actions. The hypothesis of the present research assumed that PPARs affect the gut response to different challenge factors in chickens (C. perfringens vs lipopolysaccharides (LPS) from E. coli), and CBD can mediate the pathways of this response. The study proved that CBD and challenge factors significantly affect the expression level of PPARα (P=0.001) and selected genes determining gut barrier function. A positive correlation was demonstrated between PPARs and genes involved in the formation of tight junctions, immune and oxidative stress responses in chickens. Dietary supplementation with CBD actively mediated the expression rate of PPARs, but the mechanism of interaction between CBD and PPARs was different depending on the stress factor used. The addition of CBD to the birds’ diets did not contribute to reducing intestinal permeability under induced stress conditions and did not cause a stress-inducing effect resulting in the increase of cortisol and endotoxin concentration in the blood. CBD also supported the mechanisms of protecting intestinal cells from cytotoxic effects in a C. perfringens challenge. This study indicates the importance of research towards understanding the mechanisms of PPARs as a target for enhancing intestinal barrier function, provides new results on the biological action of CBD in chickens and shows a constant PPARs association with the jejunum mucosa of birds.
Keywords:
cannabidiol
; proliferator-activated receptors
; Clostridium perfringens
; necrotic enteritis
; colibacteriosis
; E. coli LPS
; gastrointestinal tract
; broiler chickens
1. Introduction
The poultry industry, mainly the production of broiler chickens, is one of the fastest-growing sectors of livestock production in the worldwide. Broiler chickens are undergoing intensive selection, mainly due to their fast growth rate and good feed utilization. Consequently, modern lines of broiler chickens will reach slaughter weight at 35 days of age. The negative consequences of such a rapid growth rate include a deterioration in overall welfare, reduced resistance to stress factors and increased susceptibility to infection. The natural result of such a situation is the increasing use of veterinary drugs in broiler housing. The European Medicines Agency (EMA) has noted an increasing trend in the use of antibiotics (per kilogram of body weight) to treat birds, not only due to the increasing pace of production but also to the growing health problems of commercially kept birds [1,2].
One of the most common problems in chickens is necrotic enteritis (NE), caused by the anaerobic bacterium Clostridium perfringens (C. perfringens), and colibacteriosis caused by Escherichia coli (E. coli). NE and colibacteriosis are estimated to be responsible for high economic losses in the poultry industry due to decreased bird performance, and increased morbidity and mortality [3,4,5,6,7]. Due to the prohibition on the preventive use of antibiotics and antibiotic growth promoters in the European Union in 2006 (Regulation No. 1831/2003), there has been a rise in the incidence of C. perfringens and E. coli infections in broiler flocks. The acute form of NE leads to increased mortality. Birds with the subclinical form of NE do not show any clinical signs, but there is an ongoing damage to the intestinal mucosa. Although many E. coli strains are harmless commensals, a subset have acquired the ability to cause intestinal or extraintestinal diseases. Enterotoxic strains of E. coli lead to acute enteritis of the small intestinal mucosa, which manifests as diarrhea. Both diseases lead to impaired digestion and malabsorption of nutrients, resulting in reduced growth rates and a worsened feed conversion ratio. Moreover, broilers with mild NE and those infected with enterotoxigenic strains of E. coli pose a potential threat as a vector of bacteria and/or the toxins they produce into the food chain [4,8,9,10]. Therefore, the broiler industry will continue to pose a serious threat to human health due to its role as a vector of zoonotic diseases and its contribution to the rise in antibiotic resistance due to inappropriate drug use.
The importance of bioactive nutrients in promoting and modulating gastrointestinal tract (GIT) functions indicates the potential for the development of new and effective applications in disease prevention in birds [11]. Klasing [12] reported that the effective nutritional modulation of resistance in birds is possible due to the substrate functions of nutrients throughout several mechanisms: (i) effects on the development of the immune system, (ii) supply of substrates to the immune system, (iii) nutritional immunity, (iv) changes to the hormonal milieu, (v) direct regulatory action on the immune system, (vi) reduction in pathology, and (vii) physical and chemical actions on the intestines. These findings support the concept that the nutritional modulation of GIT functions may occur due to the regulatory action of bioactive nutrients. The gastrointestinal tract, specifically the intestinal barrier, is the first line of defense against pathogens, toxins and antigens and largely determines the immune response. The intestinal epithelium is a selective barrier that allows the transport of various nutrients and ions. The intestine defense mechanisms, including physical, chemical and immunological barriers are essential for maintaining body homeostasis [13]. Although the function of the intestinal barrier varies depending on the intestinal segment, the barrier is an essential component of the innate immune response [14]. The integrity of the intestinal barrier is maintained through trans-membrane tight junction (TJ) proteins. TJ proteins are crucial for the paracellular permeability of the epithelium, thus preventing harmful substances from entering the bloodstream [15]. Effective infection control strategies can be achieved by identifying the interactions occurring in the avian gastrointestinal tract and understanding the interaction between the functional state of the gastrointestinal tract and bioactive nutrients such as cannabidiol.
Cannabidiol is one of the main pharmacologically active phytocannabinoids of the Cannabis sativa L. plant, which has no psychoactive effects but has many demonstrated beneficial properties, including anti-inflammatory, antimicrobial and antioxidant properties [16]. Cannabinoids exert their pharmacological effects by acting on the cannabinoid (CB) receptors of the endocannabinoid system. The endocannabinoid system, consisting of receptors (CB1, CB2) and endogenous ligands, plays a key role in controlling many physiological processes, including food intake, gastrointestinal motility, ion transport, intestinal inflammation and cell proliferation in the gut, making it a potential therapeutic target for pathophysiological processes, including inflammation and pain [17,18,19]. The CB1 receptor is expressed mainly in the central nervous system, while the CB2 receptor is primarily expressed in the immune system. Stimulation of CB2 reduces inflammation and pain and exerts immunosuppressive effects. The role of intercellular mediators is regulated by fatty acids or their metabolically active derivatives. Due to the direct link between the initial inflammatory pathway and the loss of integrity of intracellular junctions, CBD may exert a modulating effect on the intestinal barrier and be an effective intervention for treating inflammation [20,21,22]. Studies suggest that cannabinoids inhibit the biosynthesis of pro-inflammatory prostaglandins (PGE) through acetylation of cyclooxygenase-2 and, due to the similarity of PGE to endocannabinoid structures, there is an interaction between metabolic pathways [23,24]. Importantly, CBD is an agonist of proliferator-activated receptors and mediates many biological processes by activating these receptors [25,26].
PPARs are a family of nuclear receptors with three subtypes: PPARα, PPARβ/δ, and PPARγ. All three PPAR isotypes exhibit potent anti-inflammatory properties and have a strong impact on various aspects of the physiology of the immune system. PPARs have been detected in several cell types, including immune cells, muscles, adipose tissues and the brain. PPARs have large ligand binding domains and can be activated by several ligands of different chemical structures, such as phytanic acid and fatty acids, and they oxidize metabolites of linoleic acid such as eicosanoids or polyunsaturated fatty acids (e.g. arachidonic acid) and many plant extracts [27,28,29,30]. PPARs stimulate the expression of many genes and mediate glucose homeostasis, lipid metabolism, cells sensitivity to insulin, cell fate, inflammation and immune responses [31,32]. Growing evidence suggests that PPARs control the inflammatory response and the barrier function of epithelial and endothelial cells [33,34]. Activation of PPARs enhances the barrier function and upregulates tight junction protein expression in intestinal, brain, pulmonary and urothelial epithelial cells (ECs) [33,34,35,36]. The main targets of CBD activity are nuclear receptors, such as the peroxisome proliferator-activated receptors [25]. Thus, CBD, as a PPAR agonist, promotes significant pharmacological effects [37]. CBD not only activates PPARs but also affects their expression in the body [38]. The high and increasing prevalence of inflammatory and allergic diseases, coupled with encouraging results from recent clinical trials, suggest that natural PPAR agonists found in food may have anti-inflammatory effects in humans [39,40]. Although CBD has been used in several animal studies, the lack of research on CBD use in poultry is notable [41]. Therefore, the hypothesis of the present research assumed that PPARs affect the gut response to different challenge factors in chickens, and CBD can mediate the pathways of this response.
2. Results
2.1. CBD-, LPS- and C. Perfringens-Mediated Changes in the Transcript Levels of PPARs and Selected Genes
The relative mRNA expression levels of PPARs are presented in Figure 1. The PPARδ and PPARγ mRNA expression levels were not significantly different between the study groups (P>0.05). However, compared to the CBD group, expression of PPARα was significantly lowered in both challenged groups (with C. perfringens or E. coli LPS) (P=0.001). It should be noted that dietary supplementation with CBD in challenged groups significantly increased the PPARα expression rate (P=0.001). In all groups, the expression rate of this gene was at the same level or higher compared to that of the control.
The relative mRNA expression levels of CLDN, CLDN-3, and JAM-2 are shown in Figure 2. The mRNA expression level of CLDN was significantly higher in the CBD + C. perfringens and CBD + LPS groups compared to the infected group without CBD addition (P=0.003). CLDN-3 levels were significantly lower in the C. perfringens-infected group compared to the control group with and without CBD supplementation (P=0.048). The infection did not negatively affect CLDN-3 levels in the infected groups with CBD addition. The level of JAM-2 was significantly lower in the LPS group compared to the control groups with and without CBD supplementation and the infected group with CBD supplementation and was significantly higher in the C. perfringens group compared to the CBD + C. perfringens group (P=0.001).
The relative mRNA expression levels of GLP-2, IAP, and TFF2 are shown in Figure 3. The expression level of GLP-2 was significantly lower in the CBD-infected groups compared to the control-infected groups (P=0.005). GLP-2 levels between the CON and CBD groups were not significantly different. The level of IAP was significantly higher in the infected groups without the additive compared to the infected groups with CBD, and its level was significantly lower in the CBD + LPS group compared to all tested groups (P=0.001). The expression level of the TFF2 gene did not differ among the dietary treatment groups (P>0.05).
The relative mRNA expression levels of HSP70 and OGG-1 are shown in Figure 4. The mRNA levels of HSP70 and OGG-1 were significantly higher in the C. perfringens group compared to the group infected with CBD addition and in CBD group compared to the CON group (P=0.006). There were no significant differences in the expression of the two genes between the LPS-infected groups with and without CBD addition and in the CON group compared to the CBD + C. perfringens group.
The relative mRNA expression levels of CD36 and TLR4 are shown in Figure 5. The expression level of CD36 was significantly higher in the LPS-infected group with CBD supplementation compared to all other study groups (P=0.026), besides LPS and CBD groups. There were no significant differences between the group infected with C. perfringens and those with and without CBD addition. TLR4 levels were significantly higher in the infected groups with CBD supplementation compared to the infected control groups and in the group with CBD supplementation than in the LPS-infected group without supplementation (P=0.002). There were no significant differences between the control group and the C. perfringens-infected group.
The expression level of the P53, ZO-1, ZO-2, OCLN, MUC-5B, MUC-2, E-cad, GPX-1, CLDN-1, Tac1, CNR1 and CNR2 gene did not differ among the dietary treatment groups (P>0.05).
2.2. Correlations between mRNA Expression Levels of PPARs and Selected Genes
The results of correlations are presented in Table 1. There was a significant positive correlation between PPARγ, and ZO-1 (P=0.052), ZO-2 (P=0.001), OCLN (P=0.015), JAM-2 (P=0.026), E-cad (P=0.001), CLDN-3 (P=0.022), CLDN-1 (P=0.001), CD36 (P=0.002); between PPARα, and ZO-1 (P=0.030), ZO-2 (P=0.007), TLR4 (P=0.027), OCLN (P=0.001), MUC-5B (P=0.005), MUC-2 (P=0.032), E-cad (P=0.003), CLDN-3 (P=0.017), CLDN-1 (P=0.014), CNR1 (P=0.001); between PPARδ, and ZO-1 (P=0.030), ZO-2 (P=0.001), OCLN (P=0.051), MUC-2 (P=0.001) and JAM-2 (P=0.033).
2.3. Effect of CBD on FITC-d Concentration in Blood of Challenged and Non-Challenged Birds
The results of a gut permeability test are presented in Figure 6. Serum FITC-d concentrations were significantly lower in control and infected groups than in birds infected with E. coli LPS fed a diet with CBD (P=0.001). In contrast, FITC-d levels were not significantly different between the control and infected groups without CBD supplementation and between CBD, CBD + C. perfringens and CBD + LPS groups.
2.4. Correlations between Gene Expression and FITC-d Concentration
The results of correlations are presented in Table 4. There was a significant positive correlation between FITC-d, and TLR4 (P=0.036), CD36 (P=0.040), CLDN (P=0.038), and a negative correlation between FITC-d, and IAP (P=0.032) and PPARα (P=0.032).

Table 2.
Correlations between gene expression in the jejunum and FITC-d concentration in blood serum.
Table 2.
Correlations between gene expression in the jejunum and FITC-d concentration in blood serum.
| Gene | FITC-d | |
|---|---|---|
| r | p-value | |
| HSP70 | -0.105 | 0.500 |
| TFF2 | 0.213 | 0.155 |
| PPARγ | -0.083 | 0.590 |
| PPARα | -0.275 | 0.032* |
| PPARδ | 0.005 | 0.974 |
| P53 | 0.002 | 0.992 |
| ZO-1 | 0.206 | 0.175 |
| ZO-2 | 0.06 | 0.972 |
| TLR4 | 0.311 | 0.036* |
| OCLN | 0.255 | 0.087 |
| MUC-5B | 0.279 | 0.062 |
| MUC-2 | 0.147 | 0.330 |
| JAM-2 | -0.150 | 0.338 |
| IAP | -0.313 | 0.032* |
| E-cad | -0.055 | 0.719 |
| CLDN-3 | 0.189 | 0.215 |
| GLP-2 | -0.269 | 0.071 |
| OGG-1 | -0.027 | 0.864 |
| GPX-1 | -0.141 | 0.398 |
| CLDN-1 | -0.083 | 0.591 |
| CD36 | 0.301 | 0.040* |
| CLDN | 0.318 | 0.038* |
| CNR1 | 0.258 | 0.083 |
* Calculated Pearson’s correlation coefficient between FITC-d in blood serum and gene expression in jejunum in chickens subjected to different challenges. * Significant correlation at P<0.05. Abbreviations: HSP70 heat shock protein 70, TFF2 trefoil factor 2, PPARγ peroxisome proliferator activated receptor gamma, PPARα peroxisome proliferator activated receptor alpha, PPARδ peroxisome proliferator activated receptor delta, P53 tumor protein 53, ZO-1 zonula occludens 1, ZO-2 zonula occludens 2, TLR4 toll like receptor 4, OCLD occludin, MUC-5B mucin 5B, MUC-2 mucin 2, JAM-2 junctional adhesion molecule 2, IAP intestinal alkaline phosphatase, E-cad e-cadherin, CLDN-3 claudin-3, GLP-2 glucagon like peptide 2, OGG-1 8-oxyguanine DNA glycosylase, GPX-1 glutathione peroxidase 1, CLDN-1 claudin 1, CD36 CD36 molecule, CLDN claudin, CNR1 cannabinoid receptor 1.
2.5. The Effect of CBD on Cortisol and Endotoxin Concentration in the Blood
The results of cortisol and endotoxin (LPS) concentration in the blood serum of challenged and non-challenged chickens are presented in Figure 7. The concentrations of both did not differ among the dietary treatment groups (P>0.05).
2.6. Correlations between Gene Expression and Cortisol Concentration
The results of correlations are presented in Table 3. There was a significant negative correlation between cortisol concentration and CNR1 (P=0.037) and JAM-2 (P=0.047).
Table 3.
Correlations between gene expression in jejunum and cortisol concentration in blood serum.
| Gene | Cortisol | |
|---|---|---|
| r | p-value | |
| HSP70 | -0.067 | 0.664 |
| TFF2 | 0.104 | 0.488 |
| PPARγ | -0.154 | 0.308 |
| PPARα | -0.105 | 0.478 |
| PPARδ | -0.21 | 0.157 |
| P53 | 0.186 | 0.217 |
| ZO-1 | -0.087 | 0.566 |
| ZO-2 | -0.024 | 0.881 |
| TLR4 | -0.047 | 0.754 |
| OCLN | -0.085 | 0.571 |
| MUC-5B | -0.24 | 0.104 |
| MUC-2 | -0.105 | 0.481 |
| JAM-2 | -0.301 | 0.047* |
| IAP | -0.192 | 0.190 |
| E-cad | -0.044 | 0.771 |
| CLDN-3 | -0.053 | 0.726 |
| GLP-2 | -0.146 | 0.327 |
| OGG-1 | -0.218 | 0.151 |
| GPX-1 | -0.053 | 0.748 |
| CLDN-1 | -0.044 | 0.775 |
| CD36 | 0.1 | 0.498 |
| CLDN | 0.186 | 0.226 |
| CNR1 | -0.305 | 0.037* |
* Calculated Pearson’s correlation coefficient between cortisol in blood serum and gene expression in the jejunum in chickens subjected to different challenges. * Significant correlation at P<0.05. Abbreviations: HSP70 heat shock protein 70, TFF2 trefoil factor 2, PPARγ peroxisome proliferator-activated receptor gamma, PPARα peroxisome proliferator-activated receptor alpha, PPARδ peroxisome proliferator-activated receptor delta, P53 tumor protein 53, ZO-1 zonula occludens 1, ZO-2 zonula occludens 2, TLR4 toll-like receptor 4, OCLD occludin, MUC-5B mucin 5B, MUC-2 mucin 2, JAM-2 junctional adhesion molecule 2, IAP intestinal alkaline phosphatase, E-cad e-cadherin, CLDN-3 claudin-3, GLP-2 glucagon-like peptide 2, OGG-1 8-oxyguanine DNA glycosylase, GPX-1 glutathione peroxidase 1, CLDN-1 claudin 1, CD36 CD36 molecule, CLDN claudin, CNR1 cannabinoid receptor 1.
2.7. Correlations between Gene Expression and Endotoxin Concentration
The results of correlations are presented in Table 4. There was a significant negative correlation between endotoxin concentration and CLDN-1 (P=0.022) and CD36 (P=0.028).
Table 4.
Correlations between gene expression in jejunum and endotoxin (LPS) concentration in blood serum.
Table 4.
Correlations between gene expression in jejunum and endotoxin (LPS) concentration in blood serum.
| Gene | Endotoxin | |
|---|---|---|
| r | p-value | |
| HSP70 | -0.234 | 0.131 |
| TFF2 | 0.045 | 0.769 |
| PPARγ | -0.154 | 0.308 |
| PPARα | 0.099 | 0.511 |
| PPARδ | -0.133 | 0.384 |
| P53 | 0.001 | 1.000 |
| ZO-1 | 0.053 | 0.731 |
| ZO-2 | -0.027 | 0.867 |
| TLR4 | 0.07 | 0.646 |
| OCLN | 0.043 | 0.780 |
| MUC-5B | 0.066 | 0.667 |
| MUC-2 | 0.042 | 0.783 |
| JAM-2 | -0.203 | 0.198 |
| IAP | -0.092 | 0.546 |
| E-cad | -0.152 | 0.325 |
| CLDN-3 | 0.117 | 0.451 |
| GLP-2 | -0.255 | 0.091 |
| OGG-1 | 0.21 | 0.177 |
| GPX-1 | -0.093 | 0.586 |
| CLDN-1 | -0.344 | 0.022* |
| CD36 | -0.325 | 0.028* |
| CLDN | -0.076 | 0.631 |
| CNR1 | 0.097 | 0.525 |
* Calculated Pearson’s correlation coefficient between endotoxin in blood serum and gene expression in the jejunum in chickens subjected to different challenges. * Significant correlation at P<0.05. Abbreviations: HSP70 heat shock protein 70, TFF2 trefoil factor 2, PPARγ peroxisome proliferator-activated receptor gamma, PPARα peroxisome proliferator-activated receptor alpha, PPARδ peroxisome proliferator-activated receptor delta, P53 tumor protein 53, ZO-1 zonula occludens 1, ZO-2 zonula occludens 2, TLR4 toll-like receptor 4, OCLD occludin, MUC-5B mucin 5B, MUC-2 mucin 2, JAM-2 junctional adhesion molecule 2, IAP intestinal alkaline phosphatase, E-cad e-cadherin, CLDN-3 claudin-3, GLP-2 glucagon-like peptide 2, OGG-1 8-oxyguanine DNA glycosylase, GPX-1 glutathione peroxidase 1, CLDN-1 claudin 1, CD36 CD36 molecule, CLDN claudin, CNR1 cannabinoid receptor 1.
3. Discussion
The PPAR family regulates the transcription of genes involved in lipid and lipoprotein metabolism, glucose and energy homeostasis, cellular differentiation, influencing cell proliferation and the immune and inflammatory response in different tissues and cells [42]. In the present experiment, the focus was directed at the interactions between PPARs and the gastrointestinal response to various challenging agents. Although studies by other authors [43] indicate that PPAR gene expression is higher in the kidney or liver than in the intestinal mucosa, it was hypothesized that their expression in the intestinal mucosa may also play an important role in the initiation of the gastrointestinal-related immune response due to the role of lipids in regulating this response [44]. Lipids have been shown to be important for the optimal synthesis and inclusion of long-chain polyunsaturated fatty acids in the membrane phospholipids of immune cells, also associated with the gut immune system [45]. The current results showed that both CBD and challenge had no significant effect on the expression levels of PPARδ and PPARγ genes in the jejunum but significantly affected the expression level of the PPARα gene. Perhaps the lack of significant impacts on PPARγ is due to the fact that PPARγ induction in the small intestine is directly related to epithelial cell differentiation [46] or to the animal species or section of the gastrointestinal tract, as De Filippis et al. [47] showed that anti-inflammatory effects of CBD are PPARγ-mediated in the gastrointestinal system in LPS-treated mice. The present results may be attributed to the role of PPARα in regulating the rate of fatty acid and glucose oxidation. This could be because PPARα expression corresponds to the area of the gastrointestinal tract where most lipids are absorbed, potentially interacting with the immune response [48]. The current results show a significant reduction in PPARα gene expression levels in both challenged groups, confirming the strong dependence of the stress factor interaction on PPARα expression levels [49]. Interestingly, in the group challenged with C. perfringens but not with LPS and concomitantly supplemented with CBD, PPARα expression levels increased significantly, indicating that the mechanism of interaction between CBD and PPARα is different depending on the stress factor. These results are partially in line with that of Gharib-Naseri et al. [50], who showed that C. perfringens infection affected the chicken gut fatty acid metabolism and absorption, modulating the expression of the genes and respective pathways and their functions, which may differ depending on challenge conditions. In addition, evidence suggests that PPARα may counteract inflammation through multiple distinct mechanisms and affect acute and chronic inflammatory processes [51]. This effect can be enhanced by CBD, as indicated by the results presented herein.
The claudin family (CLDN and CLDN-3) is important in tight junction formation and its function. They are major constituents of the tight junction complexes that regulate the integrity and permeability of epithelia, forming continuous seals around cells and serving as a physical barrier to prevent solutes and water from passing freely through the paracellular space. In addition, claudins are also a low-affinity receptor for Clostridium perfringens enterotoxin [52]. JAM-2 belongs to the junctional adhesion molecule (JAM) family. Type I membrane protein, which is encoded by this gene, is located at the tight junctions of both epithelial and endothelial cells, and it also acts as an adhesive ligand for interacting with a variety of immune cell types [53]. However, in the current study, supplementation of CBD (alone with no challenge) did not improve the expression level of CLDN. However, the CBD supplementation improved the CLDN expression level in challenged groups. Moreover, a clear depression in CLDN-3 expression level was observed in all challenged but not CBD-supplemented groups compared to other groups, indicating that CBD can have a modulatory effect on CLDN-3 expression level. The same was true for JAM-2 expression level in LPS-challenged but not C. perfringens-challenged. In the present experiment, changes in expression levels of selected TJP genes varied due to the challenge factor used. Compared to the positive controls, the addition of CBD to the diets caused a significant increase in CLDN expression levels, decreased JAM-2 expression levels, and did not significantly affect CLDN-3 expression levels. In contrast, only an increase in JAM-2 expression levels was found for LPS. This indicates that CBD mediates only specific mechanisms of response to the stress factor. C. perfringens bacteria secrete toxins and may weaken the TJP barrier in the intestines, leading to malabsorption. Awad et al. [54] summarized that C. perfringens produce endotoxin, which increases intercellular permeability and disrupts intestinal mucosal barrier function in chickens. Since selected TJPs, including claudin proteins, play an important role in the regulation of cell signaling, it may be possible that changes in the expression of TJP genes in the current study were more pronounced than in case of LPS. This may also indicate that CBD may be involved in the regulation of cell signaling during inflammation.
The functions of GLP-2 include protective signaling during an inflammatory state, stimulating intestinal growth and increasing villus height in the small intestine. Intestinal alkaline phosphatase plays a role in gut mucosal defense and inactivation of pathogens, as well as promoting colonization of the intestine with commensal organisms [55]. In the present study, it was found that in the case GLP-2 expression level, supplementation of CBD significantly decreased the expression level of this gene in the intestine of birds infected with C. perfringens, indicating that CBD ameliorated inflammation caused by this pathogen. The same relationship was found for the response of birds to LPS and for IAP expression levels. It should also be noted that the expression levels of both genes in the intestine in the positive control groups were at the same level as in the challenged + CBD supplementation groups, indicating that the addition of CBD alone to the birds’ diets did not cause a stressful effect manifested by the activation of a defense mechanism involving GLP-2 and IAP. Cani et al. [56] demonstrated in a probiotic-treated mouse model lower plasma LPS levels and reduced expression of inflammatory and oxidative markers in the liver. This, in turn, reduced intestinal permeability through increased expression levels of TJPs. The mice showed increased endogenous production of GLP-2 during obesity-induced inflammation. Similarly, in the current experiment, GLP-2 expression levels increased in chickens during inflammation induced by C. perfringens or E. coli LPS. In contrast, chickens challenged with dexamethasone stress showed a significant increase in IAP expression levels, indicating its active involvement in the gastrointestinal-related immune response [57]. The reason for the inverse reaction in case of IAP gene expression levels in the avian gut to the stress agent may be due to the severity of the challenge, as in the current research model (for both C. perfringens and E. coli LPS), the challenge applied was mild.
On the other hand, HSP70 and OGG-1 are genes involved in protecting cells from oxidative stress. Heat shock protein 70 is induced in response to cell stress, protects cells from injury, and promotes refolding of denatured proteins. OGG-1 prevents the accumulation of mutations, regulates the transcription of various oxidative stress-response genes, and has an integral role in maintaining cellular homeostasis under oxidative stress. Although both genes are associated with the regulation of the gastrointestinal response to pathogen-induced oxidative stress in the current experiment, differential activity was observed depending on the stress factor. In case of HSP70, which promotes the protection of cells from the lethal effects of oxidative stress [58], a significant reduction was found in its expression levels in C. perfringens-challenged birds given CBD compared to challenged-only birds, while no differences were observed for LPS-challenged (LPS-challenged vs. LPS-challenged and CBD-supplemented) birds. This indicates that CBD supports mechanisms protecting intestinal cells from lethal effects. In another study, the expression level of HSP70 in chickens subjected to acute heat stress was found to play an important role in the oxidative stress response [59]. That study demonstrated a strong positive correlation between HSP70 expression levels and digestive enzyme activity under heat stress, proving that HSP70 may improve gut function during acute heat stress. With regard to the current results, it can be concluded that CBD reduced the oxidative stress associated with C. perfringens infection because the expression level of HSP70 was the same in the challenged chickens as in the control group. In contrast, the fact that these levels did not differ from the CBD group indicates that the activity of CBD in regulating oxidative stress is induced by a specific stress factor. The lack of significant response in OGG-1 gene expression level is unclear. However, in the turkey model challenged with either C. perfringens or with E. coli LPS, no significant response was found in the jejunum to this gene expression level [60]. Because OGG-1 recognizes modified bases of DNA and initiates the repair process of DNA strands at the site of damage [61], it may indicate that neither C. perfringens nor E. coli LPS harmed mucosal cell DNA integrity in the current study.
CD36 and TLR4 receptors are involved in processes of innate immunity. The functions of CD36 are related to the transport of fatty acids into the cell for lipid synthesis of their metabolism, uptake of cholesterol, and consequently, regulation of the inflammatory response to inflammation. Whereas TLR4 is a primary signal of the innate immune response pathway, which plays a key role in the defense mechanism against infectious diseases, evidence suggests that endotoxin is also recognized via TLR4 receptors [62,63]. In the current study, CD36 activity did not change due to challenge vs. CBD supplementation, although a significant response was found regarding TLR4. CBD supplementation in both cases increased the expression level of the TLR4 gene. This response is consistent with other reports, in which an upregulation of this gene expression was reported in case of challenge factors in the birds’ immune tissues [64]. In the mentioned study, the expression level of TLR4 was upregulated in the spleen (although there was no significant effect in the ileum) on day 1 post-challenge with C. perfringens, and then it dropped to the base level. This may partially explain the observed response, in which the post-challenge expression level of TLR4 in challenged birds did not differ from the CON. The current results also indicate a positive effect of CBD in this regard since in both challenged groups except the CBD-supplemented group, this expression was upregulated at this time point. This action is beneficial for the host since recognition of potential pathogens by the innate immune system is the function of PRRs, which include the Toll-like receptors (including TLR4).
PPARs family has been reported to play a regulatory role in the host response to different pathogenic stimuli. Although many studies have been conducted on the interaction between the host and PPARs, new pathways for their activity in birds are still being discovered [65], and little is known about the effects of phytocannabinoids on PPARα and the potential role of PPARδ activation by cannabinoids [26]. The present experiment verified the regulatory properties of PPARs on the functional status of the gastrointestinal tract. The study revealed a significant correlation between determinants of intestinal barrier integrity in chickens maintained under optimal and induced stress conditions. Based on the correlation between PPARs and gene expression levels, a significant correlation was found between PPARγ vs. eight genes (ZO-1, ZO-2, OCLN, JAM-2, E-cad, CLDN-3, CLDN-1, CD36), PPARα vs. ten genes (ZO-1, ZO-2, TLR4, OCLN, MUC-5B, MUC-2, E-cad, CLDN-3, CLDN-1, CD36), and PPARδ vs. five genes (ZO-1, ZO-2, OCLN, MUC-2, JAM-2) which determine the formation of TJPs, immune response and oxidative stress response in chickens. Particularly noteworthy is that in all cases in which a significant correlation was found, it was positive, and the most significant positive correlation between the PPARs studied was between genes responsible for TJPs, including ZO-1, ZO-2, and OCLN. The current study may also point to a specific mechanism for supporting the host immune system by enhancing the integrity of the intestinal barrier through PPARs. Although the host response varied depending on the challenge factor (C. perfringens vs. LPS), globally, the response mechanism proceeded by increasing the expression level of selected genes encoding TJPs. The results may be significant because other studies have shown that although PPAR expression in birds is manifested in different tissues of the biological system though, its expression rate varies to a high extent depending on the tissue [66]. In light of the above, the current results seem to show a constant association in the jejunum mucosa of chickens. Similarly, other researchers also revealed a key role of PPARs in supporting gut function, in particular in challenging conditions due to affecting the expression of TJPs, including ZO-1, ZO-2, mucins, claudins, or occludins or may even manifest a neuroprotective effect [67,68]. Although there are few studies investigating the association between PPARs and TJPs in poultry, the current results on a chicken model are in line with other reports indicating that this association might be highly conservative. It is also interesting to note that the current study found a more pronounced response of inveterate gene expression in the challenged birds when CBD was supplemented. According to O’Sullivan [26], CBD activates the different isoforms of PPARs, and this, in turn, mediates anti-inflammatory actions. This may explain why different host responses to challenge stimuli in CBD-supplemented birds were mostly observed compared to challenged birds alone.
In the present study, a FITC-d test was performed to verify if dietary treatments affect gut permeability in birds. This test can be widely applied to study gut response to challenge factors as it is simply based on the difference between the concentration of 4-kDa fluorescein isothiocyanate-dextran in the blood as a response to gavage that is measured in a defined time period. The results indicate that the higher the concentration of FITC-d in the blood, the higher the permeability of the gut was manifested by the host. In the present study, there is no logical explanation for why the permeability of the gut did not increase due to the challenge of either C. perfringens or LPS from E. coli. It is possible that the challenge model was not severe enough as it did not prevent molecules of such a mass from passing the gut barrier. Another explanation is that response to FITC-d transposing in chicken varies for different reasons, i.e., challenge conditions, type of diet, age of birds, etc. However, most studies show an increase in blood concentration of FITC-d due to different challenges [69]. There are also reports indicating no response due to challenges [70,71] compared to the control group. Regarding the increased level of FITC-d in birds exposed to LPS and fed CBD when compared to the LPS-challenged group alone, as reported in the current study, it might be due to the potential properties of CBD in gut collagen degradation through increased activity of collagenase in the gut because such response was found in a previous study by the authors [21]. This may also partially explain the positive correlation found for the expression levels of TLR4, CD36, and CLDN genes in the jejunum and blood FITC-d. In addition, the negative correlation between FITC-d and PPARα may confirm the Mazzon et al. study [72], which provides evidence that the PPARα pathway modulates the degree of TJ permeability associated with experimental colitis in a mouse model.
In the present study, cortisol measurements were applied to investigate the host’s response to treatments. Cortisol concentration is a commonly used indicator to assess acute stress [73]. Despite ample previous evidence that corticosterone is the main glucocorticoid produced by the adrenal glands of birds [74,75], the authors of the present study decided to investigate serum cortisol levels in chickens. There are several factors that limit the reliability of using corticosterone in studies of stress, including heat stress in poultry. First, it is possible to reduce corticosterone levels to baseline levels through a negative feedback mechanism [76]. In addition, corticosterone levels fluctuate with diurnal rhythm and reproductive cycle [76,77]. A recent study by Kim et al. [78] found cortisol levels above 10 ng/mL, although its concentration in chickens is thought to be only at very low levels. Li et al. [79] studied the effect of electrical stunning before slaughter on serum cortisol levels as an indicator of stress. Their study showed that cortisol levels were almost twice as high in the non-stunned group. Research by Gou et al. [73] also showed statistically significant changes in cortisol levels in birds. Tetel et al. [80] conclude that in addition to corticosterone, cortisol is also stimuli-responsive and should be further studied in poultry. These studies show that cortisol levels should also be considered in poultry studies as a marker of stress. In the present experiment, it was found that there was no significant effect of dietary treatments on the concentration of cortisol in the blood of birds. However, it was found that there was a negative correlation between gene expression levels in the jejunum, including JAM-2 and CNR1, and the blood concentration of cortisol. The first gene is associated with the formation of TJPs, whereas the second is the cannabinoid receptor-coding gene. In the first case, the reason is that TJPs are being disrupted, which increases patterns of stress, whereas the second phenomenon seems to be associated with CBD action. This may also partially explain the different responses of challenged birds supplemented vs. not supplemented with CBD, which could have been associated with the activation of the CBD-1 receptor.
In the present experiment, neither the CBD treatment nor the provocation used had any effect on the endotoxin concentration in the blood of chickens. However, it was found that there was a negative correlation between the expression level of genes in the jejunum, such as CLDN-1 and CD36, and the endotoxin concentration in the blood. This response is consistent with the gene expression described in the first section. The disruption of intestinal mucosal function in the present study resulted in higher endotoxin concentrations in the blood. However, this response was rather small, as only two of all genes tested were significantly associated with endotoxin.
4. Materials and Methods
4.1. Chicken Experiment, Diets and Applied Experimental Challenges
4.1.1. Chemical Composition of Cannabis Extract
Hemp panicles (Cannabis sativa) were obtained from plants harvested in 2019 at the Institute of Natural Fibres and Medical Plants in Poznan, Poland. Plants for the experiment were cultivated from certified seeds, and all procedures complied with institutional, national and international legislation. The supercritical carbon dioxide extract of hemp was obtained from the Supercritical Extraction Plant, Institute of New Chemical Synthesis, Puławy, Poland. Parameters of extraction: pressure: 250 bar, temperature: 60°C and flow rate of 40 kg CO2/kg of spent hemp. The desired result of the extraction was to obtain the highest concentration of CBD in the extract, which increased the content of other cannabinoids, including tetrahydrocannabinol, in the final extract. After evaporation, the hemp extract contained 12% CBD, 0.49% tetrahydrocannabinol and 0.38% tetrahydrocannabinolic acid, as determined by HPLC [81]. Consequently, considering the inclusion level (30 g/kg diet) of CBD extract in the diet, the final concentrations were 0.147 g tetrahydrocannabinol per 1 kg of feed (0.015%) and 3.6 g CBD per 1 kg feed (0.36%) [81].
4.1.2. Chicken Experiment and Diets
The experimental procedures for this study were approved by the Local Ethics Committee for animal testing at UWM Olsztyn, Poland (Resolution No. 54/2019 of 30 July 2019), and all procedures involving animals were performed in accordance with EU regulations (recommendation 2007/526/CE) and the Polish Law on Animal Protection. All procedures in this study complied with the ARRIVE guidelines.
A total of 204 Ross 308 male broilers were purchased from a local hatchery on the day of hatching. After arrival at the experimental unit, the chicks were divided into six treatment groups according to average body weight, each containing 34 chicks. Birds were fed a starter diet on days 0-7 and a grower diet on days 8-35. The birds received diets similar to commercial one formulated to meet or exceed the nutritional requirements of Ross 308 broilers according to their age. Access to feed and drinking water was unrestricted throughout the experiment. The birds in each group were kept on bedding in pens, and housing conditions, such as humidity, temperature, and light cycle (an 18-hour day cycle and a 6-hour night cycle), were maintained according to standard management practices for commercial poultry houses. Birds in the control (CON) group consumed a basal diet throughout the experiment, while those in the CBD group received a CON diet supplemented with 30 g/kg of C. sativa extract. Birds in the C. perfringens and LPS (positive control) groups were fed the basal diet and challenged with C. perfringens and E. coli LPS, respectively. Birds in the CBD + C. perfringens and CBD + E. coli LPS groups consumed the diet as the CBD group and, in addition, were challenged. The division into groups is shown in Table 5. The diets were cold pelleted using a CL-2 CPM (CA, USA) laboratory pellet mill. A simple diagram of the study is shown in Figure 8.
4.1.3. Applied Experimental Challenges and Sampling Procedure
C. perfringens and LPS from E. coli in four challenged groups were given to the birds at 21 and 22 days of age. After 4 hours of food deprivation, the birds from LPS and CBD + LPS were weighed and administered orally (per os) LPS (Escherichia coli serotype O55:B5; Sigma Chemical, St. Louis, MO, USA) in 0.9% NaCl (0.5 mg/mL) at a dose of 1 mL, which contained 250 μg/kg body weight LPS [81]. On the same days, the animals in the C. perfringens and CBD + C. perfringens groups were given (per os) 1mL inoculum (brain–heart infusion medium) containing approximately 108 CFU/mL C. perfringens type A strain 56 bacteria [81], which was isolated from infected chickens. According to supplier declaration, the strain was previously confirmed to be α-toxin- and NetB toxin-positive and β-toxin- and enterotoxin-negative (Ghent University, Merelbeke, Belgium). The birds in the CON and CBD groups were each administered 1 mL of sterile saline and brain–heart infusion medium with a coccidial cocktail.
At day 35, the birds were weighed, and eight broilers from each group were electrically stunned (150 mA, 350 Hz) and decapitated. Blood was drawn from the wing vein into serum tubes and centrifuged after 30 minutes Subsequently, the entire digestive tract was removed from the same birds, and a section of the small intestine (at Meckel’s diverticulum) was collected. The samples of jejunum and serum were immediately frozen at -80°C for ELISA and Real-Time PCR analysis.
4.2. Real-Time PCR
Total mRNA from the collected small intestine was isolated using the Total RNA Mini Kit (A&A Biotechnology, Gdynia, Poland) according to the manufacturer’s protocol. The yield of isolated RNA was assessed spectrophotometrically (Nanodrop, NanoDrop Technologies, Wilmington, DE), and integrity was evaluated electrophoretically by separation on a 1.5% agarose gel containing ethidium bromide. To synthesize complementary cDNA, 1000 ng/mL mRNA from selected tissues in a total volume of 20 μL was retrotranscribed using the Maxima First Strand cDNA Synthesis Kit for RT-qPCR, with ds DNase (ThermoFisher Scientific, Warsaw, Poland) as indicated by the manufacturer’s instructions. The chickens (Gallus gallus) specific primers used for housekeeping and test gene expression determination, including heat shock protein 70 (HSP70), trefoil factor 2 (TFF2), peroxisome proliferator-activated receptor gamma (PPARγ), peroxisome-proliferator activated receptor alpha (PPARα), peroxisome proliferator-activated receptor delta (PPARδ), tumor protein 53 (P53), zonula occludens 1 (ZO-1), zonula occludens 2 (ZO-2), toll-like receptor 4 (TLR4), occludin (OCLD), mucin 5B (MUC-5B), mucin 2 (MUC-2), junctional adhesion molecule 2 (JAM-2), intestinal alkaline phosphatase (IAP), e-cadherin (E-cad), claudin-3 (CLDN-3), glucagon-like peptide 2 (GLP-2), 8-oxyguanine DNA glycosylase (OGG-1), glutathione peroxidase 1 (GPX-1), claudin 1 (CLDN-1), CD36 molecule (CD36), claudin (CLDN), tachykinin precursor 1 (Tac1), cannabinoid receptor 1 (CNR1) and cannabinoid receptor 2 (CNR2) were designed using Primer designing tool NCBI software (https://www.ncbi.nlm.nih.gov/tools/primer-blast/) and synthesized by Genomed (Poland). Real-time qPCR was performed using 2 × AMPLIFYME SG No-Rox Mix (Blirt, Gdańsk, Poland) in a total volume of 15 μL containing 7.5 μL Master Mix, 5 μL RNAse-free H2O, 2 × 0.5 μL primers (0.5 mM), and 1.5 μL cDNA template. Amplification was performed using a Rotor Gene 6000 thermocycler (Corbett Research, Mortlake, Australia) according to the following PCR protocol: one cycle at 95°C for 3 min (enzyme activation); 40 cycles at 95°C for 5 s (denaturation), 60°C for 10 s (annealing), and 72°C for 5 s (elongation); followed by one cycle at 72°C for 7 min (product stabilization). The melting curve was performed at 70-95°C in 0.5°C intervals. Negative controls without the cDNA template were included in each reaction. The real-time qPCR reaction for each cDNA sample was performed twice in duplicate. The identity of the PCR products was confirmed by direct sequencing. Relative gene expression was calculated using the comparative quantification option of Rotor Gene 6000 1.7 software (Qiagen GmbH, Hilden, Germany) and determined using the Relative Expression Software Tool based on the PCR efficiency correction algorithm. β-actin (ACTB), glyceraldehyde-3-phosphate dehydrogenase (GADPH), phosphoglycerate kinase 1 (PGK1), ribosomal protein L12 (RPL12), histone deacetylase (HDAC) genes were tested as host genes using NormFinder software. GAPDH and ACTB genes were used as endogenous controls for normalizing gene expression. The results were presented as relative expression of the target gene vs. housekeeping gene and relative gene expression for a selected group of birds.
Table 2.
Genes and primers used in the study.
| Gene | Primer | Sequence (5’-3’) | Product size (nt) | GenBank accession no. |
|---|---|---|---|---|
| ACTB | Forward | CGGACTGTTACCAACACCCA | 115 | NM_205518 |
| Reverse | TCCTGAGTCAAGCGCCAAAA | |||
| GADPH | Forward | GCACGCCATCACTATCTT | 82 | NM_204305 |
| Reverse | GGACTCCACAACATACTCAG | |||
| HSP70 | Forward | GGCAATAAGCGAGCAGTG | 146 | NM_001006685 |
| Reverse | CGAGTGATGGAGGTGTAGAA | |||
| TFF2 | Forward | ACTACCCTACTGAGAGAACAAA | 143 | XM_416743 |
| Reverse | CTGAAGAACCTGCTCAACTG | |||
| PPARγ | Forward | GACCTTAATTGTCGCATCCA | 130 | XM_025154399 |
| Reverse | TCTCCTTCTCCGCTTGTG | |||
| PPARα | Forward | CGGAGTACATGCTTGTGAAGG | 198 | XM_025150258.2 |
| Reverse | TCAGACCTTGGCATTCGTCC | |||
| PPARδ | Forward | TACACCGACCTTTCGCAGAG | 108 | NM_204728.2 |
| Reverse | TCCACAGACTCTGCACTCCA | |||
| P53 | Forward | AGGTGGGCTCTGACTGTA | 98 | NM_001407269.1 |
| Reverse | TGTAAGGATGGTGAGGATGG | |||
| ZO-1 | Forward | TCGCTGGTGGCAATGATGTT | 89 | XM_413773 |
| Reverse | TTGGTCTCCTTCCTCTAATCCTTCTT | |||
| ZO-2 | Forward | CCTCCTACCAGACCTTACC | 153 | NM_204918 |
| Reverse | CCAGCAAGCCTACAGTTC | |||
| TLR4 | Forward | CAAGCACCAGATAGCAACA | 146 | FJ915527 |
| Reverse | CACTACACTACTGACAGAACAC | |||
| OCLN | Forward | ATCAACGACCGCCTCAAT | 86 | XM_046904540.1 |
| Reverse | TACTCCTCTGCCACATCCT | |||
| MUC-5B | Forward | TGACTGTACCTGCTGCCAAG | 145 | XM_046919157.1 |
| Reverse | TGCTTCAAGGGTTTGTGGGT | |||
| MUC-2 | Forward | ATCGTGAGGAATGTGAGAAGTT | 140 | XM_421035 |
| Reverse | GCAGAGGCAGAAGGAGTC | |||
| JAM-2 | Forward | TCCTCCCACTACTCCAATATG | 134 | XM_026849998 |
| Reverse | ACTGCCTGTTCCTGTCTT | |||
| IAP | Forward | CAGGAGCAGCACTATGTTG | 199 | XM_015291489 |
| Reverse | CTAGAGGAGGGCTTGGTAG | |||
| E-cad | Forward | GGATGGCGTCGTCTCAACA | 75 | NM_001039258 |
| Reverse | TCCTGTGCGTAGATGGTGAAG | |||
| CLDN-3 | Forward | CGTCATCTTCCTGCTCTC | 87 | NM_204202 |
| Reverse | AGCGGGTTGTAGAAATCC | |||
| GLP-2 | Forward | TGTGTTCAGACGGTAAGG | 127 | NM_001163248 |
| Reverse | TCATCCAGTGCCATCTTC | |||
| OGG-1 | Forward | GAGTCTGAGTCTGGAGCA | 79 | XM_046926490.1 |
| Reverse | CTTCCTGGCTTGGCTTATC | |||
| GPX-1 | Forward | AGTAAAGGAAAGCCCGCACC | 157 | NM_001277853.3 |
| Reverse | GCTGTTCCCCCAACCATTTC | |||
| CLND-1 | Forward | GGTGAAGAAGATGCGGATG | 99 | NM_001013611 |
| Reverse | GCCACTCTGTTGCCATAC | |||
| CD36 | Forward | AGACCAGTAAGACCGTGAAG | 134 | NM_001030731 |
| Reverse | TAGGACTCCAGCCAGTGT | |||
| Tac1 | Forward | CCGATGACCTCAGCTACTGG | 99 | XM_004939318.3 |
| Reverse | GTCTCCTTGCCATCCTCTGC | |||
| CNR1 | Forward | GTCACCAGCGTCCTCTTG | 127 | NM_001038652 |
| Reverse | CTCCGTACTCTGAATGATTATGC | |||
| CNR2 | Forward | AACTGAATGAGGCTCTTCCA | 194 | XM_025143151 |
| Reverse | GCTCTTGTCACTTACTGCTG |
* Abbreviations: ACTB β-actin, GADPH glyceraldehyde-3-phosphate dehydrogenase, HSP70 heat shock protein 70, TFF2 trefoil factor 2, PPARγ peroxisome proliferator-activated receptor gamma, PPARα peroxisome proliferator-activated receptor alpha, PPARδ peroxisome proliferator-activated receptor delta, P53 tumor protein 53, ZO-1 zonula occludens 1, ZO-2 zonula occludens 2, TLR4 toll-like receptor 4, OCLD occluding, MUC-5B mucin 5B, MUC-2 mucin 2, JAM-2 junctional adhesion molecule 2, IAP intestinal alkaline phosphatase, E-cad e-cadherin, CLDN-3 claudin-3, GLP-2 glucagon-like peptide 2, OGG-1 8-oxyguanine DNA glycosylase, GPX-1 glutathione peroxidase 1, CLDN-1 claudin 1, CD36 CD36 molecule, Tac1 tachykinin precursor 1, CNR1 cannabinoid receptor 1, CNR2 cannabinoid receptor 2.
4.3. Determination of the FITC-D Concentration in Blood Serum
To test intestinal permeability, a total of eight 35-day-old chickens in each group were orally administered 1 mL aqueous solution of fluorescein isothiocyanate–dextran (FITC-D; Sigma Aldrich, St. Louis, MO, FD4) at a rate of 2.2 mg/bird according to a previously described protocol [82]. Two chickens from each group received saline as a control serum. Two and a half hours after administered FITC-D broilers were sacrificed. Blood samples were collected from the wing vein into a serum blood collection tube (BD Vacutainer, Franklin Lakes, NJ) and centrifuged (3,000 x g for 15 minutes) [66]. The separated serum was then aliquoted and shorted at -80°C in amber tubes. Serum from control broilers was used to prepare a standard curve for FITC-D. All samples from non-FITC-d broilers were diluted at a ratio of 1:5 in saline. All dilutions and standard curves were performed in a microtiter dilution plate. The final volume of samples was 100 uL/well in the plate reader. Each 96-well assay plate run with samples contained its standard curve. Diluted samples were plated in duplicate. Fluorescence was measured at 485 nm excitation and 528 nm emission using a spectrophotometer with a microplate reader (Multiskan Sky, Thermo Scientific, Rockford, IL, USA). Levels of fluorescence in the samples were converted to respective FITC-d micrograms per milliliter of serum based on a calculated standard curve.
4.4. Determination of the Cortisol in Blood Serum
Cortisol level in blood was determined using a commercial ELISA kit (MyBioSource, Eersel, Netherlands) according to the supplier’s procedure.
4.5. Determination of Endotoxin in Blood Serum
The Pierce LAL Chromogenic Endotoxin Quantitation Kit (Thermo Scientific, Rockford, IL, USA) was used to determine the level of gram-negative bacterial endotoxins in blood samples according to the provided protocol.
4.6. Statistics
Data are presented as the means (n=8 chickens per group), the variability is expressed as the pooled standard error of the mean (SEM) test or standard deviations (SD) values. Differences between groups were assessed using one-way ANOVA with the least significant difference (LSD) test. The significance level was set at p<0.05. Correlations between the concentration of cortisol, endotoxin, FITC-d, and gene expression were assessed with a Pearson correlation analysis. Statistical calculations were performed using STATGRAPHICS Centurion XVI ver. 16.1.03 software.
5. Conclusions
The present research delivered evidence that there is a close association between PPARs and the gut response of chickens to different challenge conditions. This association was mostly manifested in modulating the expression level of the jejunum genes, determining the formation of TJPs, immune response, and oxidative stress response. However, the most constant association was between PPARα, PPARβ, PPARδ, and genes encoding TJPs, including ZO-1, ZO-2 and OCLN, which determine gut barrier integrity. Expression of investigated PPARs in the jejunum was more pronounced in the challenge conditions. However, it varied depending on the challenge factor (C. perfringens vs. E. coli LPS). Dietary supplementation of CBD actively mediated the expression rate of PPARs, but the interaction mechanism between CBD and PPARs differed depending on the stress factor used. CBD supplementation to avian diets did not contribute to a decrease in intestinal permeability under induced stress. Moreover, it did not cause a stress-inducing effect increasing blood cortisol and endotoxin concentrations. In addition, CBD exhibited a supportive effect on mechanisms to protect intestinal cells from lethal effects, and its addition alone did not cause a stress-inducing effect based on the levels of genes involved in oxidative stress. The current results seem to show a constant PPAR association with the jejunum mucosa of chickens. The present study indicates the importance of research toward understanding the action of PPAR mechanisms as a target to enhance intestinal barrier function in chickens. In addition, the present study provided new results on the biological action and mechanism of CBD in chickens.
Author Contributions
Conceptualization, D.S., M.M., and P.K.; Methodology, D.S., M.K., B.F., J.J., P.M., and P.K.; Validation, D.S. and P.K.; Formal analysis, D.S., M.K., B.F., and J.J.; Investigation, D.S. and P.K.; Resources, D.S. and P.K.; Data curation, D.S. and P.K.; Writing – original draft preparation, D.S.; Writing – review & editing, M.M., K.K., and P.K.; Visualization, D.S. and P.K.; Supervision, P.K.; Project administration, P.K.; Funding acquisition, D.S., P.K., and K.K.
Funding
1. This work was supported by the National Science Centre, Grant No. 2018/29/B/NZ9/01351. 2. This research was partially funded (analysis of mRNA levels of PPARs and Tac1 genes) by the statutory funds of the KIAPN PAS obtained in the 5th edition of “Grant for a Start”. 3. Research Funded by the Minister of Science under “The Regional Initiative of Excellence Program” (cost of publication). .
Institutional Review Board Statement
The experimental procedures for this study were approved by the Local Ethics Committee for animal testing at UWM Olsztyn, Poland (Resolution No. 54/2019 of 30 July 2019), and all procedures involving animals were performed in accordance with EU regulations (recommendation 2007/526/CE) and the Polish Law on Animal Protection. All procedures in this study complied with the ARRIVE guidelines.
Informed Consent Statement
Not applicable.
Data Availability Statement
All data generated during the study are available from the corresponding author upon reasonable request.
Acknowledgments
Not applicable.
Conflicts of Interest
The authors declare no conflicts of interest.
References
- European Centre for Disease Prevention and Control (ECDC); European Food Safiety Authority (EFSA); European Medicines Agency (EMA). Antimicrobial consumption and resistance in bacteria from humans and food-producing animals. EFSA J. 2024, 22(2), e8589. [CrossRef]
- European Centre for Disease Prevention and Control (ECDC); European Food Safiety Authority (EFSA); European Medicines Agency (EMA). ECDC/EFSA/EMA second joint report on the integrated analysis of the consumption of antimicrobial agents and occurrence of antimicrobial resistance in bacteria from humans and food-producing animals – Joint Interagency Antimicrobial Consumption and Resistance Analysis (JIACRA) Report. EFSA J. 2017, 15, 135. [Google Scholar]
- Kaldhusdal, M.; Løvland, A. The economical impact of Clostridium perfringens is greater than anticipated. Worlds Poult. 2000, 16, 50–51. [Google Scholar]
- Van Immerseel, F.; De Buck, J.; Pasmans, F.; Huyghebaert, G.; Haesebrouck, F.; Ducatelle, R. Clostridium perfringens in poultry: an emerging threat for animal and public health. Avian Pathol. 2004, 33, 537–549. [Google Scholar] [CrossRef]
- McReynolds, J.L.; Byrd, J.A.; Anderson, R.C.; Moore, R.W.; Edrington, T.S.; Genovese, K.J.; Poole, T.L.; Kubena, L.F.; Nisbet, D.J. Evaluation of immunosuppressants and dietary mechanisms in an experimental disease model for necrotic enteritis. Poult Sci. 2004, 83(12), 1948–1952. [Google Scholar] [CrossRef]
- Mellata, M. Human and avian extraintestinal pathogenic Escherichia coli: infections, zoonotic risks, and antibiotic resistance trends. Foodborne Pathog. Dis. 2013, 10(11), 916–32. [Google Scholar] [CrossRef]
- Russo, T.A.; Johnson, J.R. Medical and economic impact of extraintestinal infections due to Escherichia coli: focus on an increasingly important endemic problem. Microbes Infect. 2003, 5, 449–56. [Google Scholar] [CrossRef]
- Shojadoost, B.; Vince, A.R.; Prescott, J.F. The successful experimental induction of necrotic enteritis in chickens by Clostridium perfringens: a critical review. Vet. Res. 2012, 43. [Google Scholar] [CrossRef]
- Ewers, C.; Antao, E.M.; Diehl, I.; Philipp, H.C.; Wieler, L.H. Intestine and environment of the chicken as reservoirs for extraintestinal pathogenic Escherichia coli strains with zoonotic potential. Appl. Environ. Microbiol. 2009, 75(1), 184–192. [Google Scholar] [CrossRef]
- Bélanger, L.; Garenaux, A.; Harel, J.; Boulianne, M.; Nadeau, E.; Dozois, C.M. Escherichia coli from animal reservoirs as a potential source of human extraintestinal pathogenic E. coli. E. coli. FEMS Immunol. Med. Microbiol. 2011, 62, 1–10. [Google Scholar] [CrossRef]
- Broom, L.J.; Kogut, M.H. Gut immunity: its development and reasons and opportunities for modulation in monogastric production animals. Anim. Health Res. Rev. 2018, 19(1), 46–52. [Google Scholar] [CrossRef] [PubMed]
- Klasing, K.C. Nutritional modulation of resistance to infectious diseases. Poult. Sci. 1998, 77(8), 1119–1125. [Google Scholar] [CrossRef] [PubMed]
- Turner, J. Intestinal mucosal barrier function in health and disease. Nat. Rev. Immunol. 2009, 9, 799–809. [Google Scholar] [CrossRef] [PubMed]
- Zhang, Q.; Eicher, S.D.; Applegate, T.J. Development of intestinal mucin 2, IgA, and polymeric Ig receptor expressions in broiler chickens and Pekin ducks. Poult. Sci. 2015, 94(2), 172–180. [Google Scholar] [CrossRef]
- Boehm, E.; Droessler, L.; Amasheh, S. Cannabidiol attenuates inflammatory impairment of intestinal cells expanding biomaterial-based therapeutic approaches. Materials Today Bio 2023, 23, 23. [Google Scholar] [CrossRef]
- Atalay, S.; Jarocka-Karpowicz, I.; Skrzydlewska, E. Antioxidative and anti-inflammatory propertied of cannabidiol. Antioxidants 2020, 9(1), 21. [Google Scholar] [CrossRef]
- Alhamoruni, A.; Lee, A.C.; Wright, K.L.; Larvin, M.; O’Sullivan, S.E. Pharmacological effects of cannabinoids on the Caco-2 cell culture model of intestinal permeability. J. Pharmacol. Exp. Ther. 2010, 335(1), 92–102. [Google Scholar] [CrossRef]
- De Petrocellis, L.; Ligresti, A.; Moriello, A.S.; Moriello, A.S.; Allara, M.; Bisogno, T.; Petrosino, S.; Stott, C.G.; Di Marzo, V. Effects of cannabinoids and cannabinoid-enriched Cannabis extracts on TRP channels and endocannabinoid metabolic enzymes. Br. J. Pharmacol. 2011, 163, 1479–1494. [Google Scholar] [CrossRef]
- Di Marzo, V.; Bifulco, M.; Petrocellis, L. The endocannabinoid system and its therapeutic exploitation. Nat. Rev. Drug. Discov. 2004, 3, 771–784. [Google Scholar] [CrossRef]
- López-Posadas, R.; Stürz, M.; Atreya, I.; Neurath, M. F.; Britzen-Laurent, N. 2017. Interplay of GTPases and Cytoskeleton in Cellular Barrier Defects during Gut inflammation. Front. Immunol. 2017, 8. [Google Scholar] [CrossRef]
- Konieczka, P.; Szkopek, D.; Kinsner, M.; Fotschki, B.; Juśkiewicz, J.; Banach, J. Cannabis-derived cannabidiol and nanoselenium improve gut barrier function and affect bacterial enzyme activity in chickens subjected to C. perfringens challenge. Vet. Res. 2020, 51, 141. [Google Scholar] [CrossRef] [PubMed]
- Yekhtin, Z.; Khuja, I.; Meiri, D.; Or, R.; Almogi-Hazan, O. Differential effects of D9 tetrahydrocannabinol (THC)- and cannabidiol (CBD)-based cannabinoid treatments on macrophage immune function in vitro and on gastrointestinal inflammation in a murine model. Biomedicines 2022, 10(8), 1793. [Google Scholar] [CrossRef] [PubMed]
- Ruhaak, L.R.; Felth, J.; Karlsson, P.C.; Rafter, J.J.; Verpoorte, R.; Bohlin, L. Evaluation of the cyclooxygenase inhibiting effects of six major cannabinoids isolated from Cannabis sativa. Biol. Pharm. Bull. 2011, 34(5), 774–778. [Google Scholar] [CrossRef]
- Mlost, J.; Bryk, M.; Starowicz, K. Cannabidiol for pain treatment: Focus on pharmacology and mechanism of action. Int. J. Mol. Sci. 2020, 21(22), 8870. [Google Scholar] [CrossRef] [PubMed]
- Khosropoor, S.; Alavi, M.; Etemad, L.; Roohbakhsh, A. Cannabidiol goes nucler: The role of PPAR γ. Phytomedicine 2023, 114, 154771. [Google Scholar] [CrossRef]
- O’Sullivan, S.E. An update on PPAR activation by cannabinoids. Br. J. Pharmacol. 2016, 173(12), 1899–1910. [Google Scholar] [CrossRef]
- Wang, L.; Waltenberger, B.; Pferschy-Wenzing, E.; Blunder, M.; Liu, X.; Malainer, C.; Blazevic, T.; Schwaiger, S.; Rollinger, J.M.; Heiss, E.H.; Schuster, D.; Kopp, B.; Bauer, R.; Stuppner, H.; Dirsch, V.M.; Atanasov, A.G. Natural product agonists of peroxisome proliferator-activated receptor gamma (PPARγ): a review. Biochem. Pharmacol. 2014, 92, 73–89. [Google Scholar] [CrossRef]
- Behl, T.; Kaur, I.; Goel, H.; Kotwani, A. Implications of endogenous PPAR-gamma ligand, 15-Deoxy-Delta-12,14-prostaglandin J2, in diabetic retinopathy. Life Sci. 2016, 153, 93–99. [Google Scholar] [CrossRef]
- Schild, R.L.; Schaiff, W.T.; Carlson, M.G.; Cronbach, E.J.; Nelson, D.M.; Sadovsky, Y. The activity of PPAR gamma in primary human trophoblasts is enhanced by oxidized lipids. J. Clin. Endocrinol. Metab. 2002, 87(3), 1105–1110. [Google Scholar] [CrossRef]
- Grygiel-Gorniak, B. Peroxisome proliferator-activated receptors and their ligands: nutritional and clinical implications—a review. Nutr. J. 2014, 13, 17. [Google Scholar] [CrossRef]
- Fajas, L.; Auboeuf, D.; Raspe, E.; Schoonjans, K.; Lefebvre, A.; Saladin, R.; Najib, J.; Laville, M.; Fruchart, J.; Deeb, S.; Vidal-Puig, A.; Flier, J.; Briggs, M.R.; Staels, B.; Vidal, H.; Auwerx, J. The organization, promoter analysis, and expression of the human PPARgamma gene. J. Biol. Chem. 1997, 272(30), 18779–18789. [Google Scholar] [CrossRef] [PubMed]
- Elbrecht, A.; Chen, Y.; Cullinan, C.A.; Hayes, N.; Leibowitz, M.D.; Moller, D.E.; Berger, J. Molecular cloning, expression and characterization of human peroxisome proliferator activated receptors gamma 1 and gamma 2. Biochem. Biophys. Res. Commun. 1996, 224(2), 431–437. [Google Scholar] [CrossRef] [PubMed]
- Ogasawara, N.; Kojima, T.; Ohkuni, T.; Koizumi, J.; Kamekura, R.; Masaki, T.; Murata, M.; Tanaka, S.; Fuchimoto, J. , Himi, T.; Sawada, N. PPARgamma agonists upregulate the barrier function of tight junctions via a PKC pathway in human nasal epithelial cells. Pharmacol. Res. 2010, 61(6), 489–498. [Google Scholar] [CrossRef]
- Lai, Y.; Wu, T.; Tsai, B.; Hung, Y.; Lin, H.; Tsai, Y., Ko; Tsai, P. Peroxisome proliferator-activated receptor-γ as the gatekeeper of tight junction in Clostridioides difficile infection. Front. Microbiol. 2022, 13. [Google Scholar] [CrossRef] [PubMed]
- Li, H.; Singh, S.; Potula, R; Persidsky, Y.; Kanmogne, G.D. Dysregulation of claudin-5 in HIV-induced interstitial pneumonitis and lung vascular injury. Protective role of peroxisome proliferator-activated receptor-gamma. Am. J. Respir. Crit. Care. Med. 2014, 190, 85–97. [Google Scholar] [CrossRef] [PubMed]
- Hung, Y.P.; Ko, W.C.; Chou, P.H.; Chen, Y.H.; Lin, H.J.; Liu, Y.H.; Tsai, H.W. , Lee, J.C.; Tsai, P.J. Proton-pump inhibitor exposure aggravates Clostridium difficile-associated colitis: evidence from a mouse model. J. Infect. Dis. 2015, 212(4), 654–663. [Google Scholar] [CrossRef]
- Granja, A.G.; Carillo-Salinas, F.; Pagani, A.; Gómez-Cañas, M.; Negri, R.; Navarrete, C.; Mecha, M.; Mestre, L.; Fiebich, B.L.; Cantarero, I.; Calzado, M.A.; Bellido, M.L.; Fernandez-Ruiz, J.F.; Appendino, G.; Guaza, C.; Muñoz, E. A cannabigerol quinone alleviates neuroinflammation in a chronic model of multiple sclerosis. J. Neuroimmune Pharmacol. 2021, 7, 1002–1016. [Google Scholar] [CrossRef]
- Hegde, V.L.; Singh, U.P.; Nagarkatti, P.S.; Nagarkatti, M. Critical Role of Mast Cells and Peroxisome Proliferator–Activated Receptor γ in the Induction of Myeloid-Derived Suppressor Cells by Marijuana Cannabidiol In Vivo. J. Immunol. 2015, 194(11), 5211–5222. [Google Scholar] [CrossRef]
- Martin, H. Role of PPAR-gamma in inflammation. Prospects for therapeutic intervention by food components. Mutat. Res. 2009, 669, 1–7. [Google Scholar] [CrossRef]
- Peng, J.; Fan, M.; An, C.; Ni, F.; Huang, W.; Luo, J. A narrative review of molecular mechanism and therapeutic effect of cannabidiol (CBD). BCPT 2022, 130(4), 130–456. [Google Scholar] [CrossRef]
- Fallahi, S.; Bobak, Ł.; Opaliński, S. Hemp in Animal Diets—Cannabidiol. Animals 2022, 12, 2541. [Google Scholar] [CrossRef] [PubMed]
- Chinetti, G.; Fruchart, J.C.; Staels, B. Peroxisome proliferator-activated receptors and inflammation: from basic science to clinical applications. Int. J. Obes. 2003, 27(3), S41–S45. [Google Scholar] [CrossRef] [PubMed]
- Meng, H.; Li, H.; Zhao, J.G.; Gu, Z.L. Differential expression of peroxisome proliferator-activated receptors alpha and gamma gene in various chicken tissues. Domest. Anim. Endocrinol. 2005, 28(1), 105–110. [Google Scholar] [CrossRef] [PubMed]
- Selvaraj, R.K.; Shanmugasundaram, R.; Klasing, K.C. Effects of dietary lutein and PUFA on PPAR and RXR isomer expression in chickens during an inflammatory response. CBPA 2010, 157(3), 198–203. [Google Scholar] [CrossRef]
- Cherian, G. Essential fatty acids and early life programming in meat-type birds. J. World’s Poult. Sci. 2011, 67, 599–614. [Google Scholar] [CrossRef]
- Thompson, E.A. PPARγ Physiology and Pathology in Gastrointestinal Epithelial Cells. Molecules and Cells 2007, 24(2), 167–176. [Google Scholar] [CrossRef]
- De Filippis, D.; Esposito, G.; Cirillo, C.; Cipriano, M.; De Winter, B.Y.; Scuderi, C.; Sarnelli, G.; Cuomo, R.; Steardo, L.; De Man, J.G. , Iuvone, T. Cannabidiol reduces intestinal inflammation throigh the control of neuroimmune axis. PLoS ONE 2011. [Google Scholar] [CrossRef]
- Kwak, M.J.; Choi, S.W.; Choi, Y.S.; Lee, H.; Park, M.Y.; Whang, K.Y. Effects of sophorolipid on growth performance, organ characteristics, lipid digestion markers, and gut functionality and integrity in broiler chickens. Animals 2022, 12(5), 635. [Google Scholar] [CrossRef]
- Fries-Craft, K.A.; Meyer, M.M.; Lindblom, S.C.; Kerr, B.J.; Bobeck, E.A. Lipid source and peroxidation status alter immune cell recruitment in broiler chicken ileum. J. Nutr. 2021, 151(1), 223–234. [Google Scholar] [CrossRef]
- Gharib-Naseri, K.; de Las Heras-Saldana, S.; Kheravii, S.; Qin, L.; Wang, J.; Wu, S.B. Necrotic enteritis challenge regulates peroxisome proliferator-1 activated receptors signaling and β-oxidation pathways in broiler chickens. Anim. Nutr. 2021, 7(1), 239–251. [Google Scholar] [CrossRef]
- Bougarne, N.; Weyers, B.; Desmet, S.J.; Deckers, J.; Ray, D.W.; Staels, B.; De Bosscher, K. Molecular Actions of PPARα in Lipid Metabolism and Inflammation, Endocr. Rev. 2018, 39(5), 760–802. [Google Scholar] [CrossRef]
- Vecchio, A.; Rathnayake, S.S.; Stroud, R.M. Structural basis for Clostridium perfringens enterotoxin targeting of claudins at tight junctions in mammalian gut. PNAS 2021, 118(15), e2024651118. [Google Scholar] [CrossRef] [PubMed]
- Ebnet, K.; Suzuki, A.; Ohno, S.; Vestweber, D. Junctional adhesion molecules (JAMs): more molecules with dual functions? J. Cell Sci. 2004, 117(1), 19–29. [Google Scholar] [CrossRef] [PubMed]
- Awad, W.A.; Hess, C.; Hess, M. Enteric pathogens and their toxin-induced disruption of the intestinal barrier through alteration of tight junctions in chickens. Toxins 2017, 9(2), 60. [Google Scholar] [CrossRef]
- Fawley, J.; Gourlay, D. Intestinal alkaline phosphatase: a summary of its role in clinical disease. J. Surg. Res. 2015, 202(1), 225–234. [Google Scholar] [CrossRef]
- Cani, P.D.; Possemiers, S.; Van de Wiele, T.; Guiot, Y.; Everard, A.; Rottier, O.; Geurts, L.; Naslain, D.; Neyrinck, A.; Lambert, D.M.; Muccioli, G.G.; Delzenne, N.M. Changes in gut microbiota control inflammation in obese mice through a mechanism involving GLP-2-driven improvement of gut permeability. Gut 2009, 58, 1044–1045. [Google Scholar] [CrossRef]
- Barekatain, R.; Chrystal, P.; Gilani, S.; McLaughlan, C. Expression of selected genes encoding mechanistic pathways, nutrient and amino acid transporters in jejunum and ileum of broiler chickens fed a reduced protein diet supplemented with arginine, glutamine and glycine under stress stimulated by dexamethasone. J. Anim. Physiol. Nutr. 2020, 105(1), 90–98. [Google Scholar] [CrossRef]
- O’Reilly, E.L.; Burchmore, R.J.; Sparks, N.H.; Eckersall, P.D. The effect of microbial challenge on the intestinal proteome of broiler chickens. Proteome Sci. 2016, 15, 10. [Google Scholar] [CrossRef]
- Hao, Y.; Gu, X.H.; Wang, X.L. Overexpression of heat shock protein 70 and its relationship to intestine under acute heat stress in broilers: 1. Intestinal structure and digestive function. Poult. Sci 2012, 91, 781–789. [Google Scholar] [CrossRef]
- Konieczka, P.; Tykałowski, B.; Ognik, K.; Kinsner, M.; Szkopek, D.; Wójcik, M.; Mikulski, D.; Jankowski, J. Increased arginine, lysine, and methionine levels can improve the performance, gut integrity and immune status of turkeys but the effect is interactive and depends on challenge conditions. Vet. Res. 2022, 53(1), 59. [Google Scholar] [CrossRef]
- Langie, S.A.; Kowalczyk, P.; Tomaszewski, B.; Vasilaki, A.; Maas, L.M.; Moonen, E.J.; Palagani, A.; Godschalk, R.W.L.; Tudek, B.; van Schooten, F.J.; Berghe, W.V.; Zabielski, R. , Mathers, JC. Redox and epigenetic regulation of the APE1 gene in the hippocampus of piglets: the effect of early life exposures. DNA Repair 2014, 18, 52–62. [Google Scholar] [CrossRef] [PubMed]
- Rehman, M.S.U.; Rehman, S.U.; Yousaf, W.; Hassan, F.U.; Ahmad, W.; Liu, Q.; Pan, H. The potential of toll-like receptors to modulate avian immune system: exploring the effects of genetic variants and phytonutrients. Front. Genet. 2021, 12, 671235. [Google Scholar] [CrossRef] [PubMed]
- Ghareeb, K.; Awad, W.A.; Bohm, J.; Zebeli, Q. Impact of luminal and systemic endotoxin exposure on gut function, immune response and performance of chickens. J. World’s Poult. Sci. 2016, 72, 367–380. [Google Scholar] [CrossRef]
- Lu, Y.; Sarson, A.J.; Gong, J.; Zhou, H.; Zhu, W.; Kang, Z.; Yu, H.; Sharif, S.; Han, Y. Expression Profiles of Genes in Toll-Like Receptor-Mediated Signaling of Broilers Infected with Clostridium perfringens. Clin. Vaccine Immunol. 2009, 16. [Google Scholar] [CrossRef]
- Tian, H.; Guo, Y.; Ding, M.; Su, A.; Li, W.; Tian, Y.; Li, K.; Sun, G.; Jiang, R.; Han, R.; Yan, F.; Kang, X. Identification of genes related to stress affecting thymus immune function in a chicken stress model using transcriptome analysis. Res. Vet. Sci. 2021, 138, 90–99. [Google Scholar] [CrossRef]
- Zanu, H.K.; Kheravii, S.K.; Morgan, N.K.; Bedford, M.R.; Swick, R.A. Interactive effect of dietary calcium and phytase on broilers challenges with subclinical necrotic enteritis: part 2. Gut permeability, phytate ester concentrations, jejunal gene expression, and intestinal morphology. Poult. Sci. 2020, 99, 4914–4928. [Google Scholar] [CrossRef]
- Grabacka, M.; Płonka, P.M.; Pierzchalska, M. The PPARα regulation of the gut physiology in regard to interaction with microbiota, intestinal immunity, metabolism, and permeability. Int. J. Mol. Sci. 2022, 23(22), 14156. [Google Scholar] [CrossRef]
- Şeren, N.; Dovinova, I.; Birim, D.; Kaftan, G.; Barancik, M.; Erdogan, M.A.; Armagan, G. Regulation of tight junction proteins and cell death by peroxisome proliferator-activated receptor γ agonist in brainstem of hypertensive rats. Naunyn-Schmiedeberg's Arch. Pharmacol. 2024, 397, 411–421. [Google Scholar] [CrossRef]
- Liu, J.; Teng, P.Y.; Kim, W.K.; Applegate, T.J. Assay considerations for fluorescein isothiocyanate-dextran (FITC-d): an indicator of intestinal permeability in broiler chickens. Poult. Sci. 2021, 100(7), 101202. [Google Scholar] [CrossRef]
- Gilani, S.; Howarth, G.S.; Kitessa, S.M.; Tran, C.D.; Forder, R.E.A.; Hughes, R.J. New biomarkers for increased intestinal permeability induced by dextran sodium sulphate and fasting in chickens. J. Anim. Physiol. Anim. Nutr. 2017, 101(5), e237–e245. [Google Scholar] [CrossRef]
- Bortoluzzi, C.; Lumpkins, B.; Mathis, G.F.; França, M.; King, W.D.; Graugnard, D.E.; Dawson, K.A.; Applegate, T.J. Zinc source modulates intestinal inflammation and intestinal integrity of broiler chickens challenged with coccidia and Clostridium perfringens. Poult. Sci. 2019, 98(5), 2211–2219. [Google Scholar] [CrossRef] [PubMed]
- Mazzon, E.; Cuzzocrea, S. Absence of functional peroxisome proliferator-activated receptor-alpha enhanced ileum permeabilty during experimental colitis. Shock 2007, 28(2), 192–201. [Google Scholar] [CrossRef] [PubMed]
- Gou, Z.; Abouelezz, K.F.M.; Fan, Q.; Li, L.; Lin, X.; Wang, Y.; Cui, X.; Ye, J.; Masoud, M.A.; Jiang, S.; Ma, X. Physiological effects of transport duration on stress biomarkers and meat quality of medium-growing Yellow broiler chickens. Animal 2021, 15(2), 100079. [Google Scholar] [CrossRef]
- Nawab, A.; Ibtisham, F.; Li, G.; Kieser, B.; Wu, J.; Liu, W.; Zhao, Y.; Nawab, Y.; Li, K.; Xiao, M.; An, L. Heat stress in poultry production: Mitigation strategies to overcome the future challenges facing the global poultry industry. J. Therm. Biol. 2018, 78, 131–139. [Google Scholar] [CrossRef]
- Wasti, S.; Sah, N.; Mishra, B. Impact of heat stress on poultry health and performances, and potential mitigation strategies. Animals 2020, 10(8), 1266. [Google Scholar] [CrossRef]
- Oladokun, S.; Adewole, D.I. Biomarkers of heat stress and mechanism of heat stress response in Avian species: Current insight and future perspectives from poultry science. J. Therm. Biol. 2022, 110, 103332. [Google Scholar] [CrossRef]
- Scanes, C.G. Biology of stress in poultry with emphasis on glucocorticoids and the heterophil to lymphocyte ratio. Poult. Sci. 2016, 95(9), 2208–2215. [Google Scholar] [CrossRef]
- Kim, D.W.; Mushtaq, M.M.H.; Parvin, R.; Kang, H.K.; Kim, J.H.; Na, J.C.; Hwangbo, J.; Kim, J.D.; Yang, C.B.; Park, B.J.; Choi, H.C. Various levels and forms of dietary α-lipoic acid in broiler chickens: Impact on blood biochemistry, stress response, liver enzymes, and antibody titers. Poult. Sci. 2015, 94(2), 226–231. [Google Scholar] [CrossRef]
- Li, W.; Yan, C.; Descovivh, K.; Phillips, C.J.C.; Chen, Y.; Huang, H.; Wu, X.; Liu, J.; Chen, S.; Zhao, X. The effects of preslaughter electrical stunning on serum cortisol and meat quality parameters of a slow-growing Chinese chicken breed. Animals 2022, 12(20), 2866. [Google Scholar] [CrossRef]
- Tetel, V.; Wyk, B.V.; Fraley, G.S. Sex differences in glucocorticoid responses to shipping stress in Pekin ducks. Poult. Sci. 2022, 101(1), 101534. [Google Scholar] [CrossRef]
- Konieczka, P.; Wojtasik-Kalinowska, I.; Półtorak, A.; Kinsner, M.; Szkopek, D.; Fotschki, B.; Juśkiewicz, J.; Banach, J.; Michalczuk, M. Cannabidiol affects breast meat volatile compounds in chickens subjected to different infection models. Sci. Rep. 2022, 12, 18940. [Google Scholar] [CrossRef]
- Barekatain, R.; Howarth, G.S.; Willson, N.L.; Cadogan, D.; Wilkinson, S. Excreta biomarkers in response to different gut barrier dysfunction models and probiotic supplementation in broiler chickens. PLoS ONE 2020, 15(8), e0237505. [Google Scholar] [CrossRef]
Figure 1.
The relative mRNA expression levels of PPARs in the jejunum of chickens. The relative mRNA expression levels (normalized to the β-actin and glyceraldehyde-3-phosphate dehydrogenase expression levels as the most accurate endogenous control gene) of A) peroxisome proliferator-activated receptor delta (PPARδ), B) peroxisome proliferator-activated receptor gamma (PPARγ) and C) peroxisome proliferator-activated receptor alpha (PPARα) in the gut tissue of chickens. The chickens were fed a control diet (CON), CON supplemented with 30 g of hemp extract/kg diet (CBD), CON diet and subjected to C. perfringens and E. coli LPS challenge (C. perfringens and LPS), CON diet supplemented with 30 g of hemp extract/kg diet and subjected to C. perfringens and E. coli LPS (CBD + C. perfringens and CBD + LPS). The different letters indicate significant differences (P<0.05). The error bars indicate the mean standard deviations for the eight chickens in each dietary treatment group.
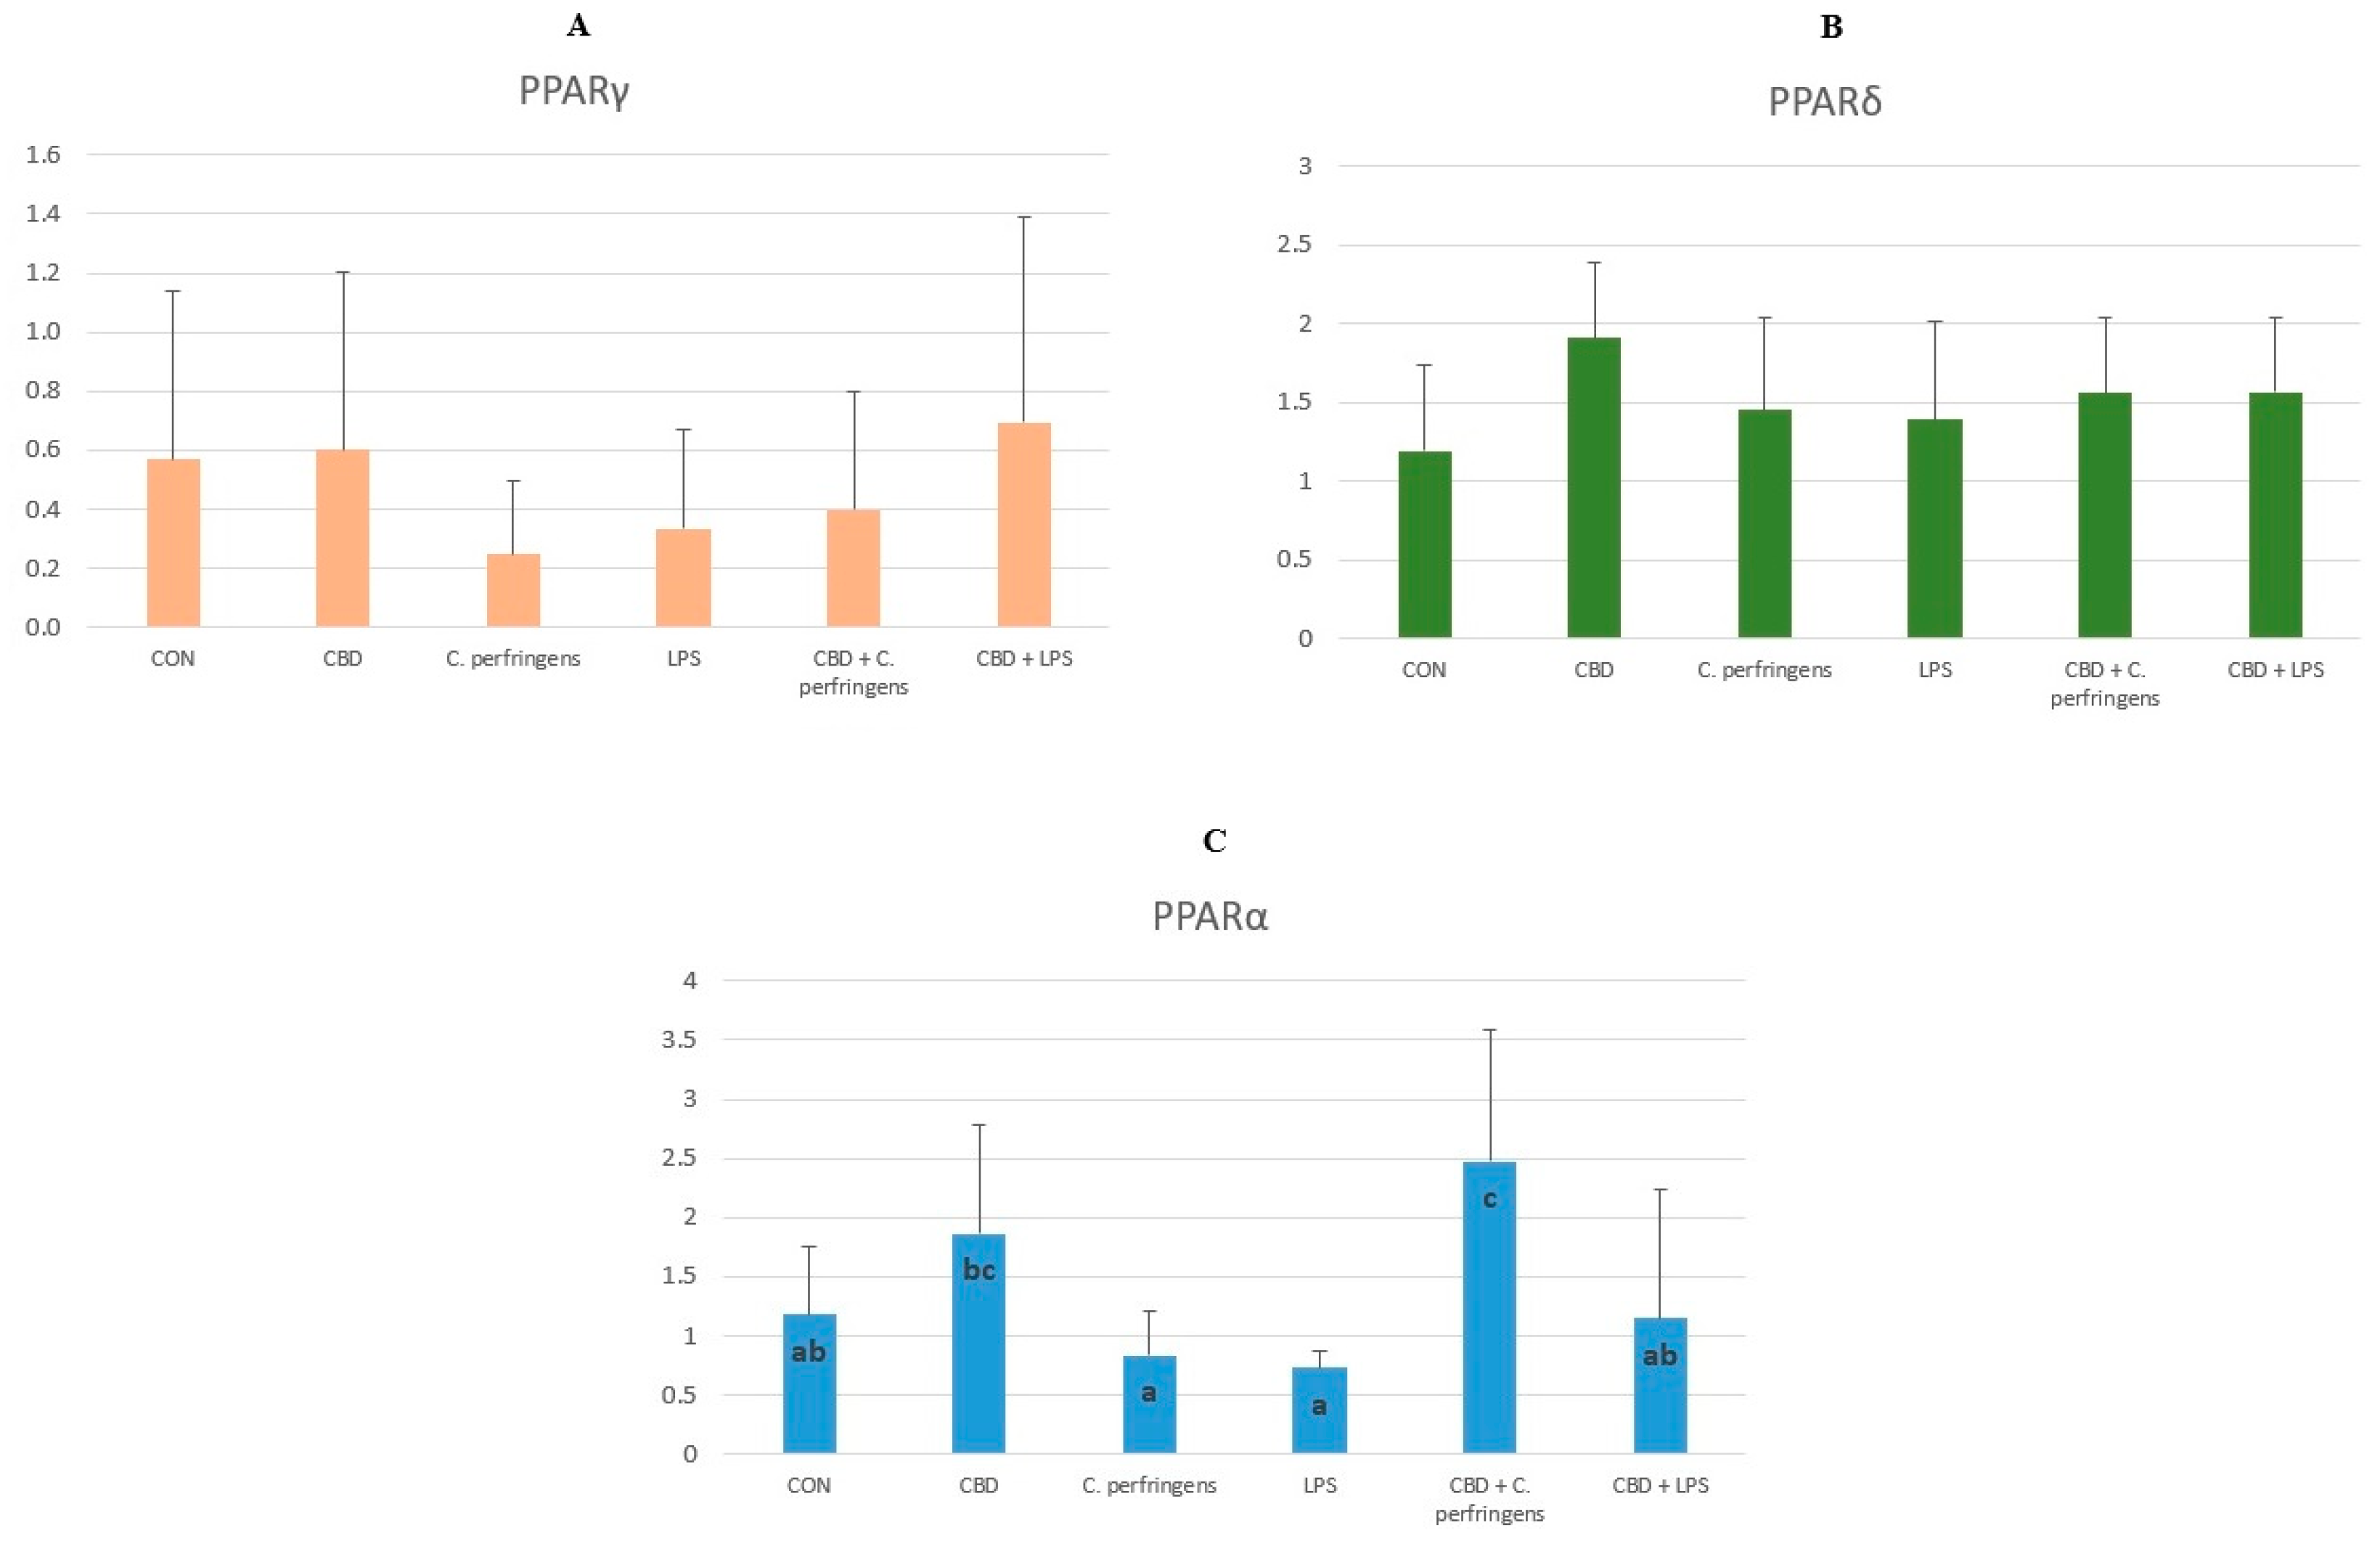
Figure 2.
The relative mRNA expression levels of genes involved in the formation of tight junctions in the gut tissue of chickens. The relative mRNA expression levels (normalized to the β-actin and glyceraldehyde-3-phosphate dehydrogenase expression levels as the most accurate endogenous control gene) of A) claudin (CLDN), B) claudin 3 (CLDN-3) and C) junctional adhesion molecule 2 (JAM-2) in the gut tissue of chickens. The chickens were fed a control diet (CON), CON supplemented with 30 g of hemp extract/kg diet (CBD), CON diet and subjected to C. perfringens and E. coli LPS challenge (C. perfringens and LPS), CON diet supplemented with 30 g of hemp extract/kg diet and subjected to C. perfringens and E. coli LPS (CBD + C. perfringens and CBD + LPS). The different letters indicate significant differences (P<0.05). The error bars indicate the mean standard deviations for the eight chickens in each dietary treatment group.
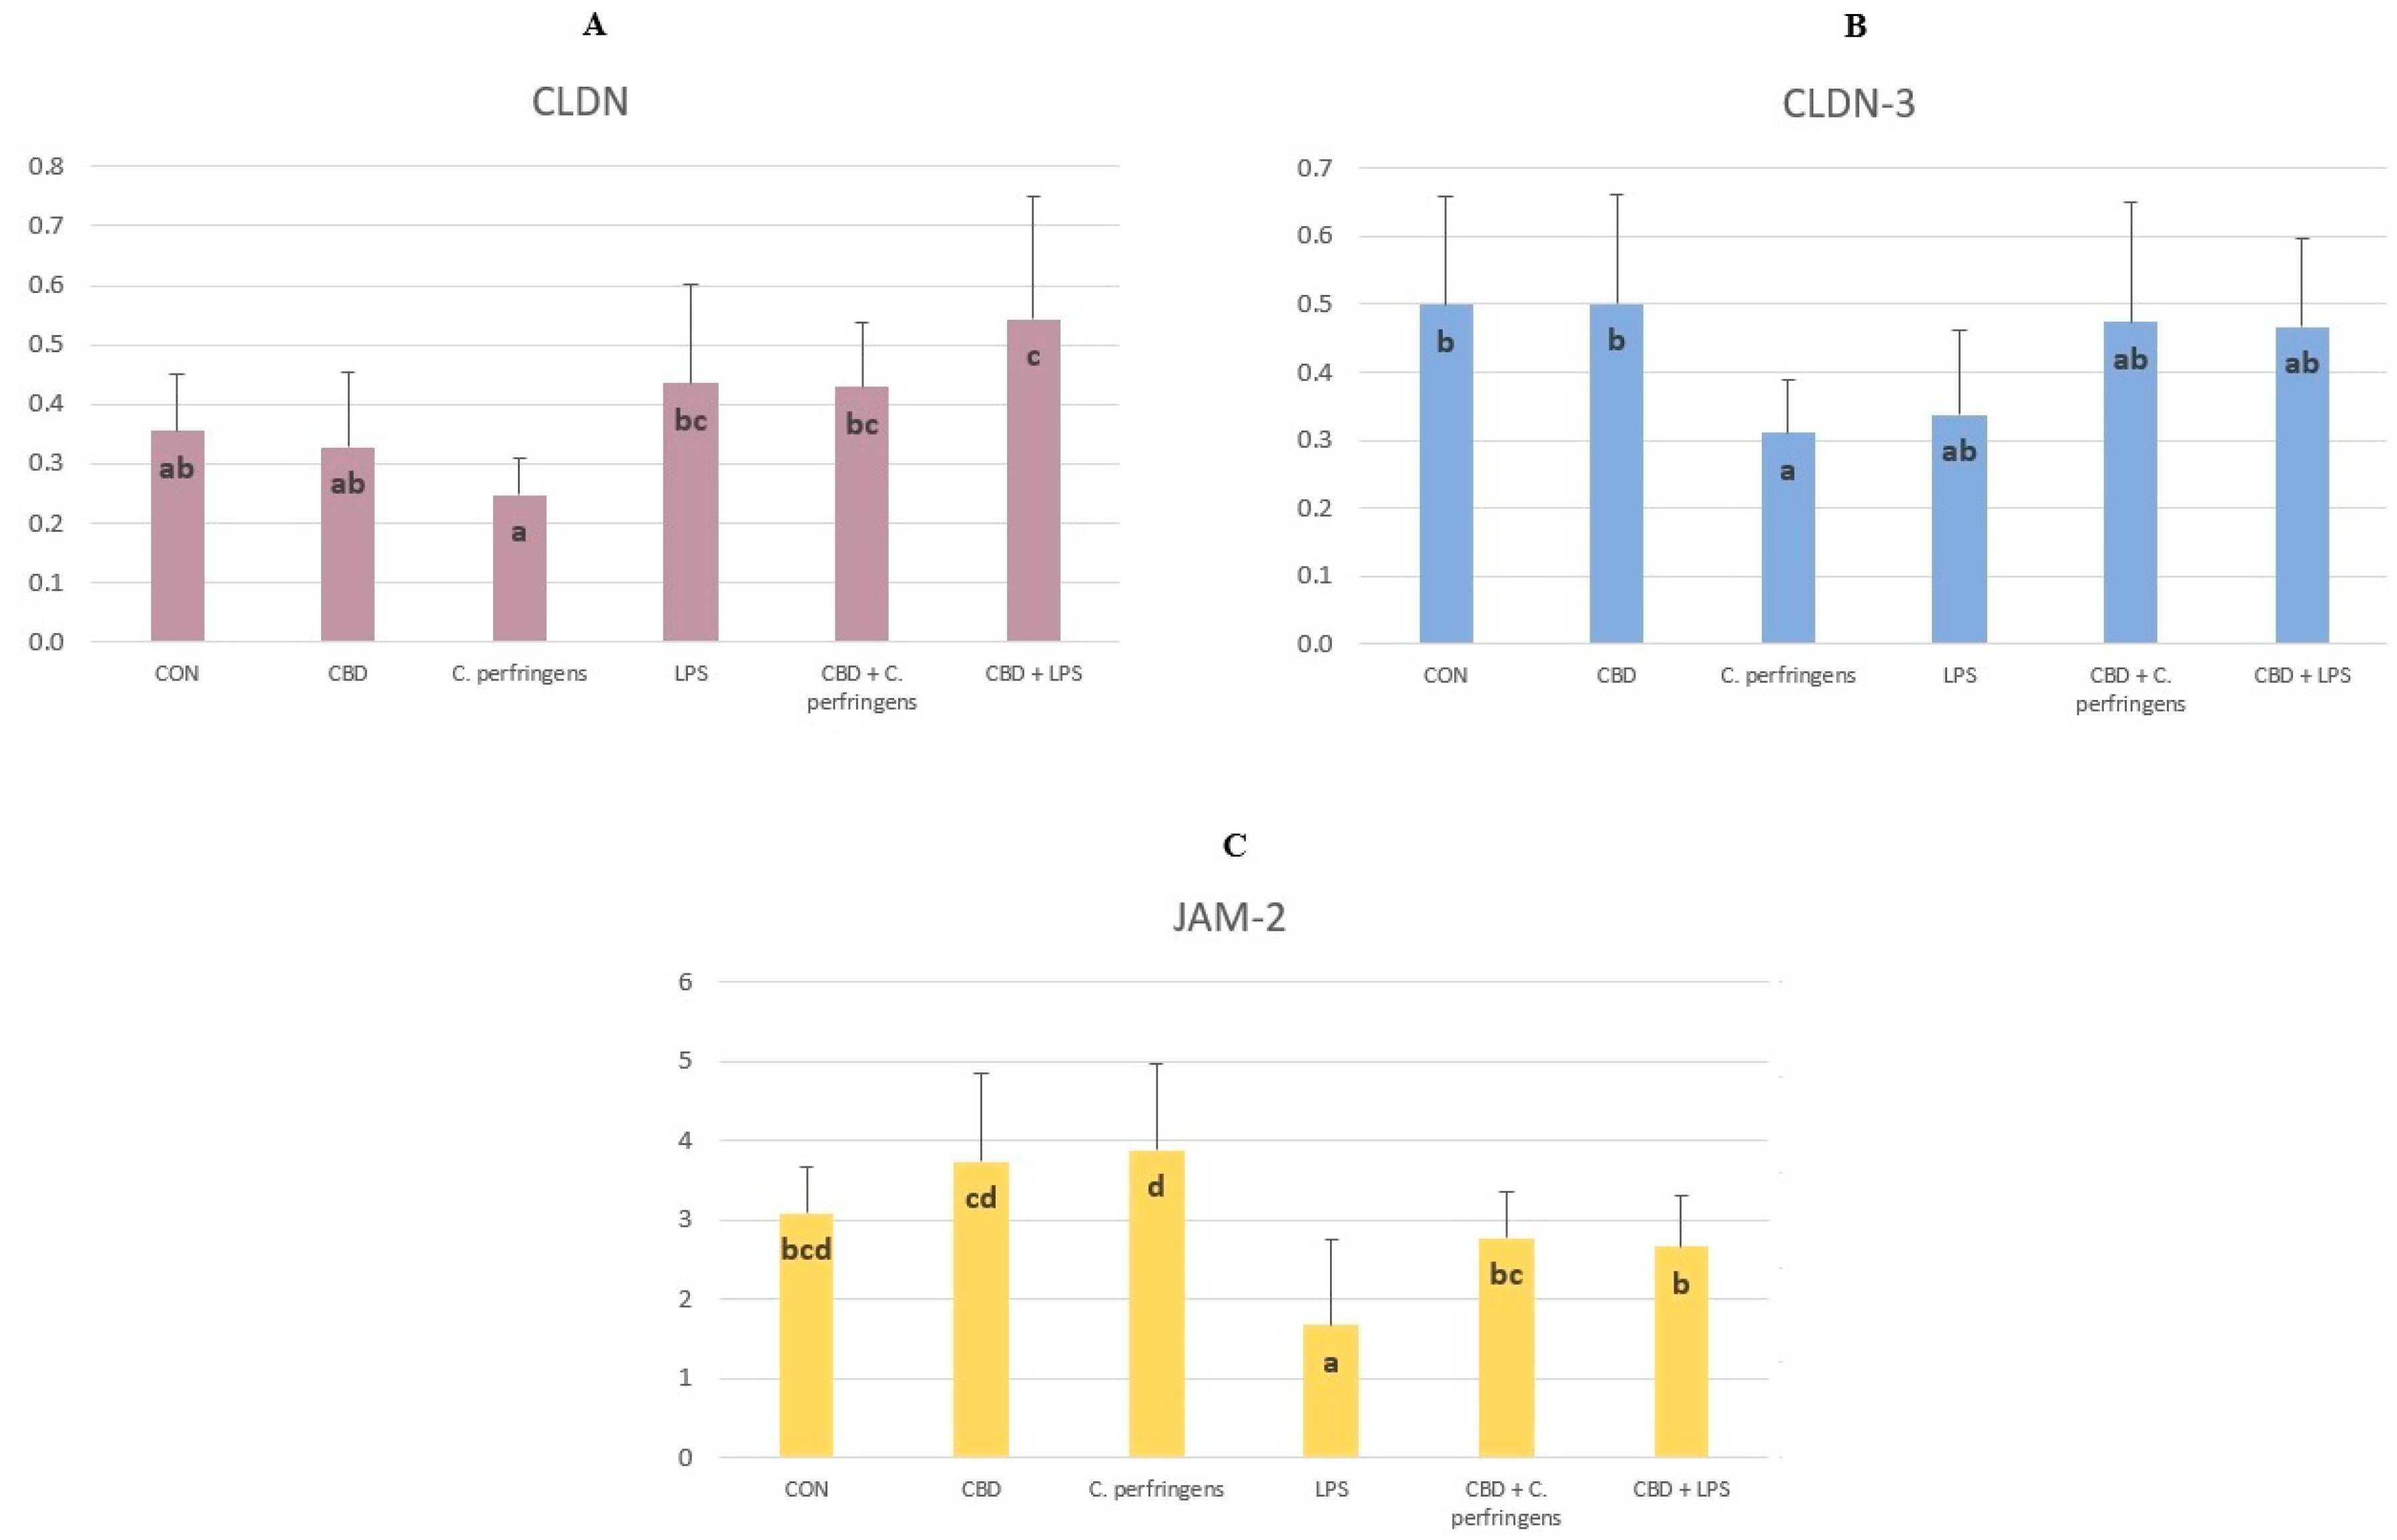
Figure 3.
The relative mRNA expression levels of genes involved in gut mucosal and gastrointestinal tract defense in inflammation. The relative mRNA expression levels of genes involved in gut mucosal and gastrointestinal tract defense in inflammation. The relative mRNA expression levels (normalized to the β-actin and glyceraldehyde-3-phosphate dehydrogenase expression levels as the most accurate endogenous control gene) of A) glucagon like peptide 2 (GLP-2), B) intestinal alkaline phosphatase (IAP)) and C) trefoil factor 2 (TFF2) in the gut tissue chickens. The chickens were fed a control diet (CON), CON supplemented with 30 g of hemp extract/kg diet (CBD), CON diet and subjected to C. perfringens and E. coli LPS challenge (C. perfringens and LPS), CON diet supplemented with 30 g of hemp extract/kg diet and subjected to C. perfringens and E. coli LPS (CBD + C. perfringens and CBD + LPS). The different letters indicate significant differences (P < 0.05). The error bars indicate the mean standard deviations for the 8 chickens in each dietary treatment group.
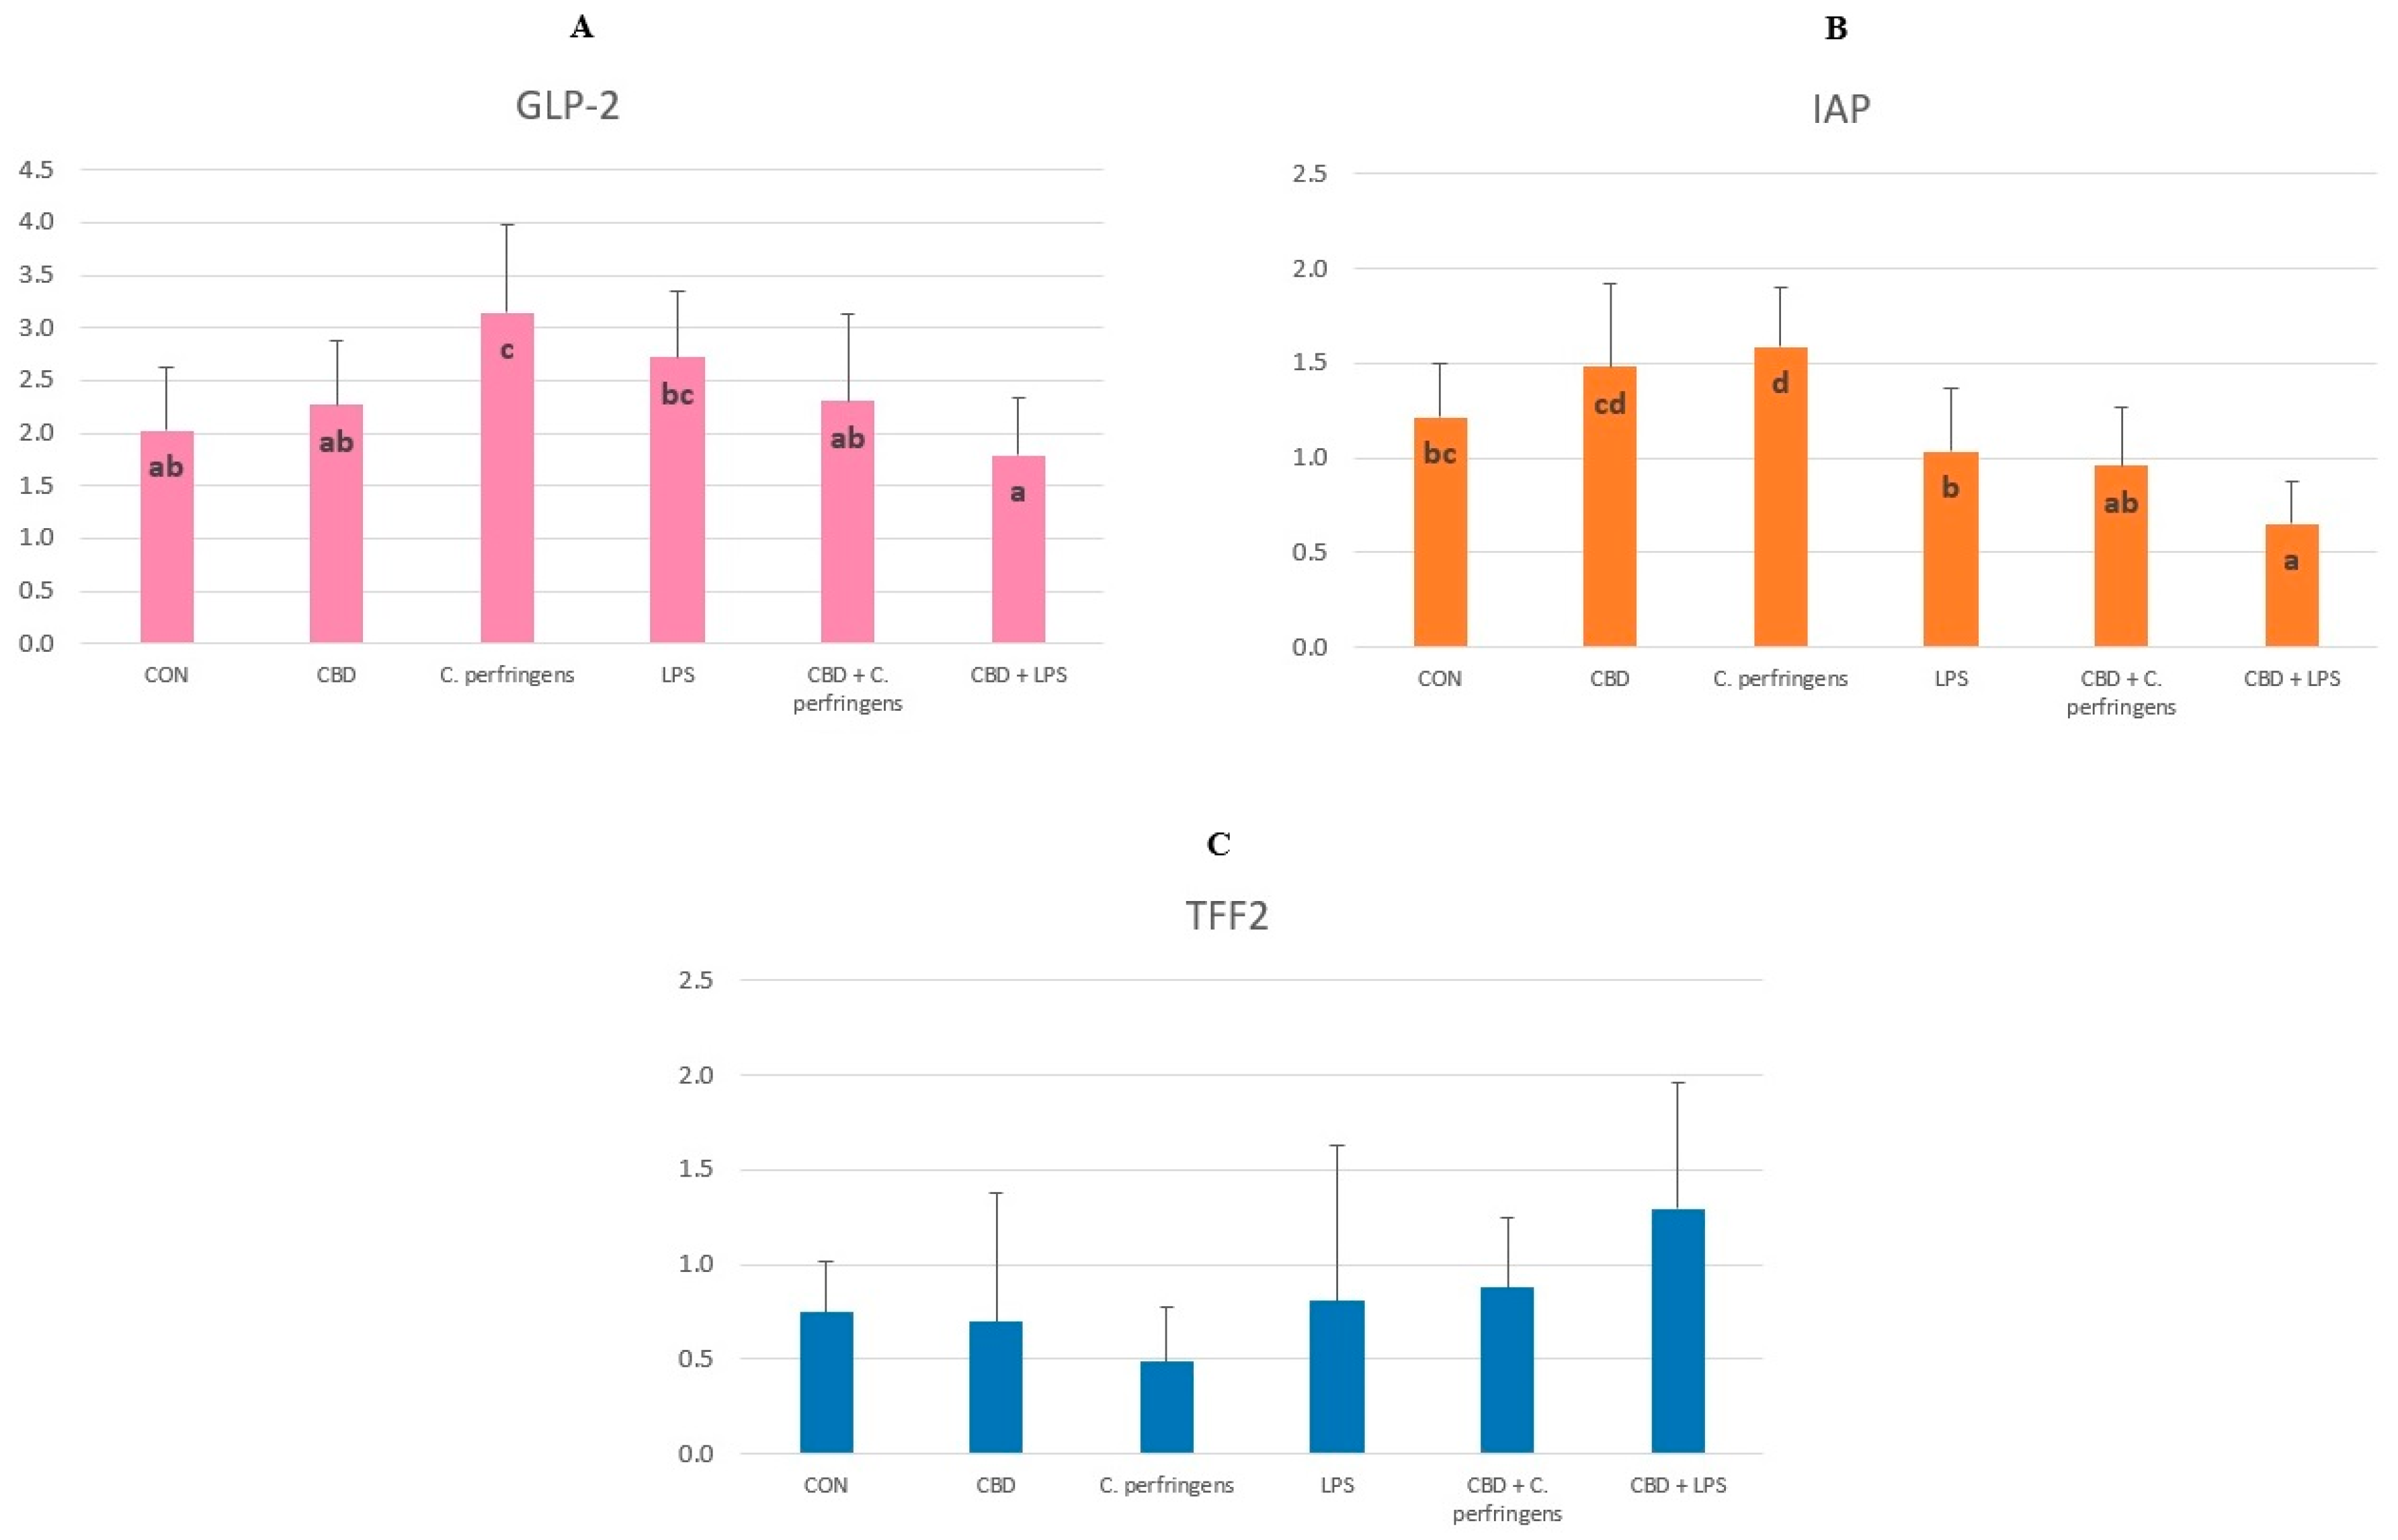
Figure 4.
The relative mRNA expression levels of genes involved in the oxidative stress. The relative mRNA expression levels (normalized to the β-actin and glyceraldehyde-3-phosphate dehydrogenase expression levels as the most accurate endogenous control gene) of A) heat shock protein 70 (HSP70) and B) 8-oxyguanine DNA glycosylase (OGG-1) in the gut tissue of chickens. The chickens were fed a control diet (CON), CON supplemented with 30 g of hemp extract/kg diet (CBD), CON diet and subjected to C. perfringens and E. coli LPS challenge (C. perfringens and LPS), CON diet supplemented with 30 g of hemp extract/kg diet and subjected to C. perfringens and E. coli LPS (CBD + C. perfringens and CBD + LPS). The different letters indicate significant differences (P<0.05). The error bars indicate the mean standard deviations for the eight chickens in each dietary treatment group.
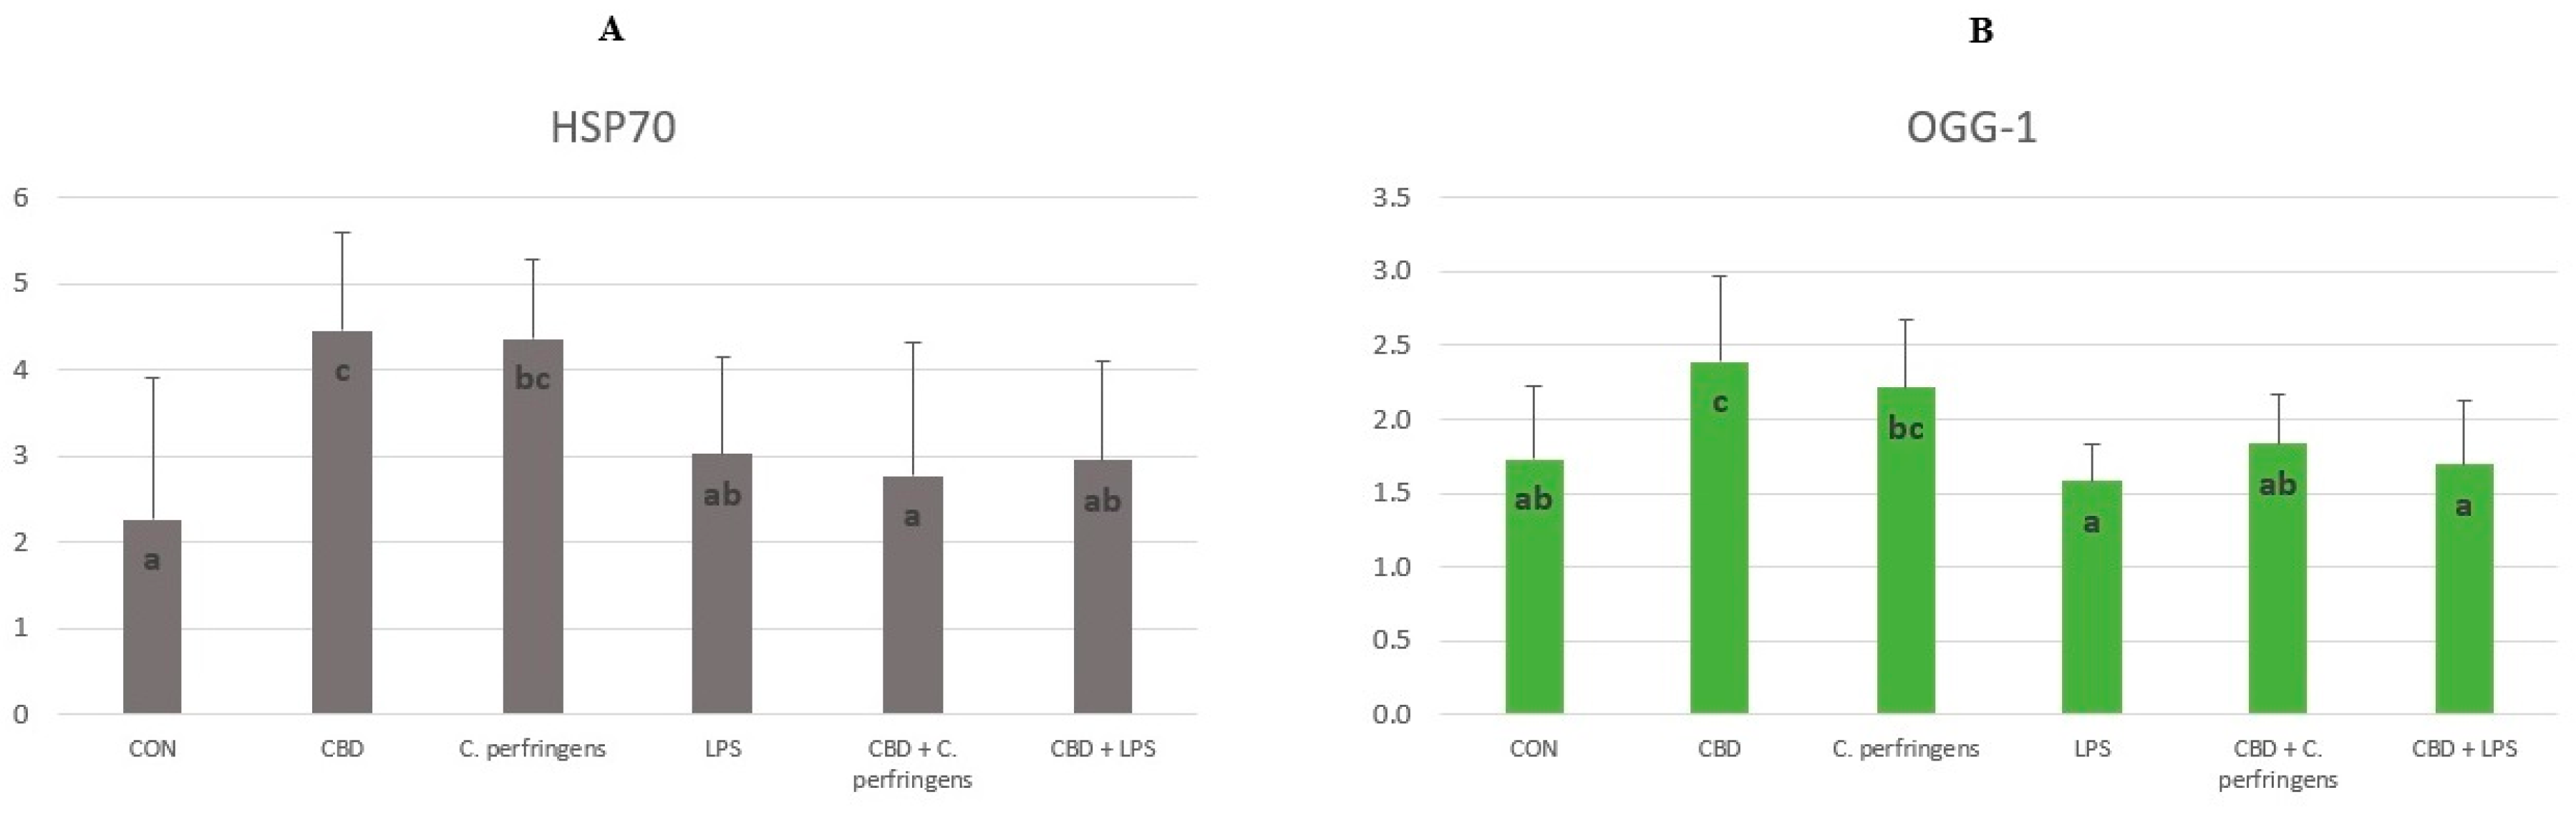
Figure 5.
The relative mRNA expression levels of genes involved in host immune response. The relative mRNA expression levels (normalized to the β-actin and glyceraldehyde-3-phosphate dehydrogenase expression levels as the most accurate endogenous control gene) of A) CD36 molecule (CD36) and B) toll-like receptor 4 (TLR4) in the gut tissue of chickens. The chickens were fed a control diet (CON), CON supplemented with 30 g of hemp extract/kg diet (CBD), CON diet and subjected to C. perfringens and E. coli LPS challenge (C. perfringens and LPS), CON diet supplemented with 30 g of hemp extract/kg diet and subjected to C. perfringens and E. coli LPS (CBD + C. perfringens and CBD + LPS). The different letters indicate significant differences (P<0.05). The error bars indicate the mean standard deviations for the eight chickens in each dietary treatment group.
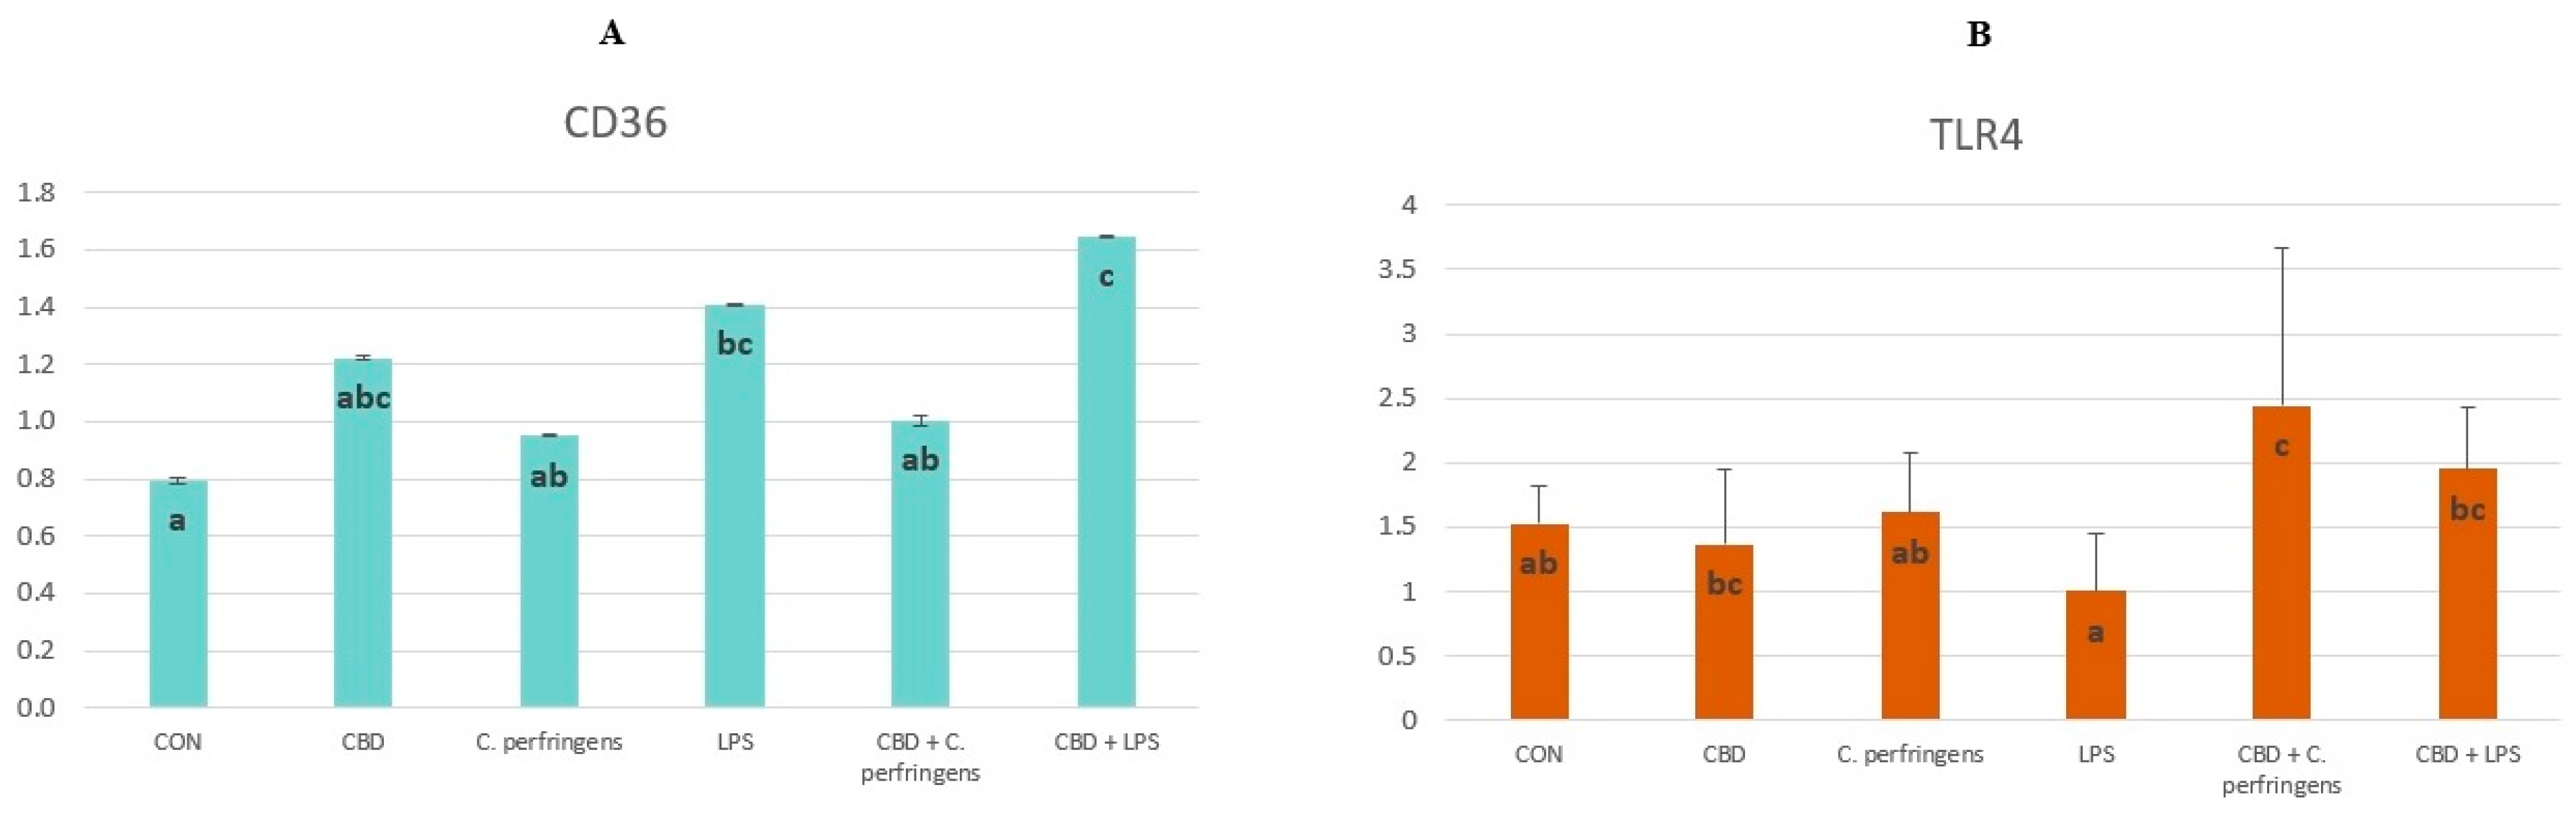
Figure 6.
Serum fluorescein isothiocyanate-dextran (FITC-d) concentrations (μg/mL) in chickens fed control diets or CBD supplemented diet and as a result of C. perfringens and E. coli LPS challenge or no challenge. The different letters indicate significant differences (P<0.05). The error bars indicate the mean standard deviations for the eight chickens in each dietary treatment group. The SEM is 49.45.
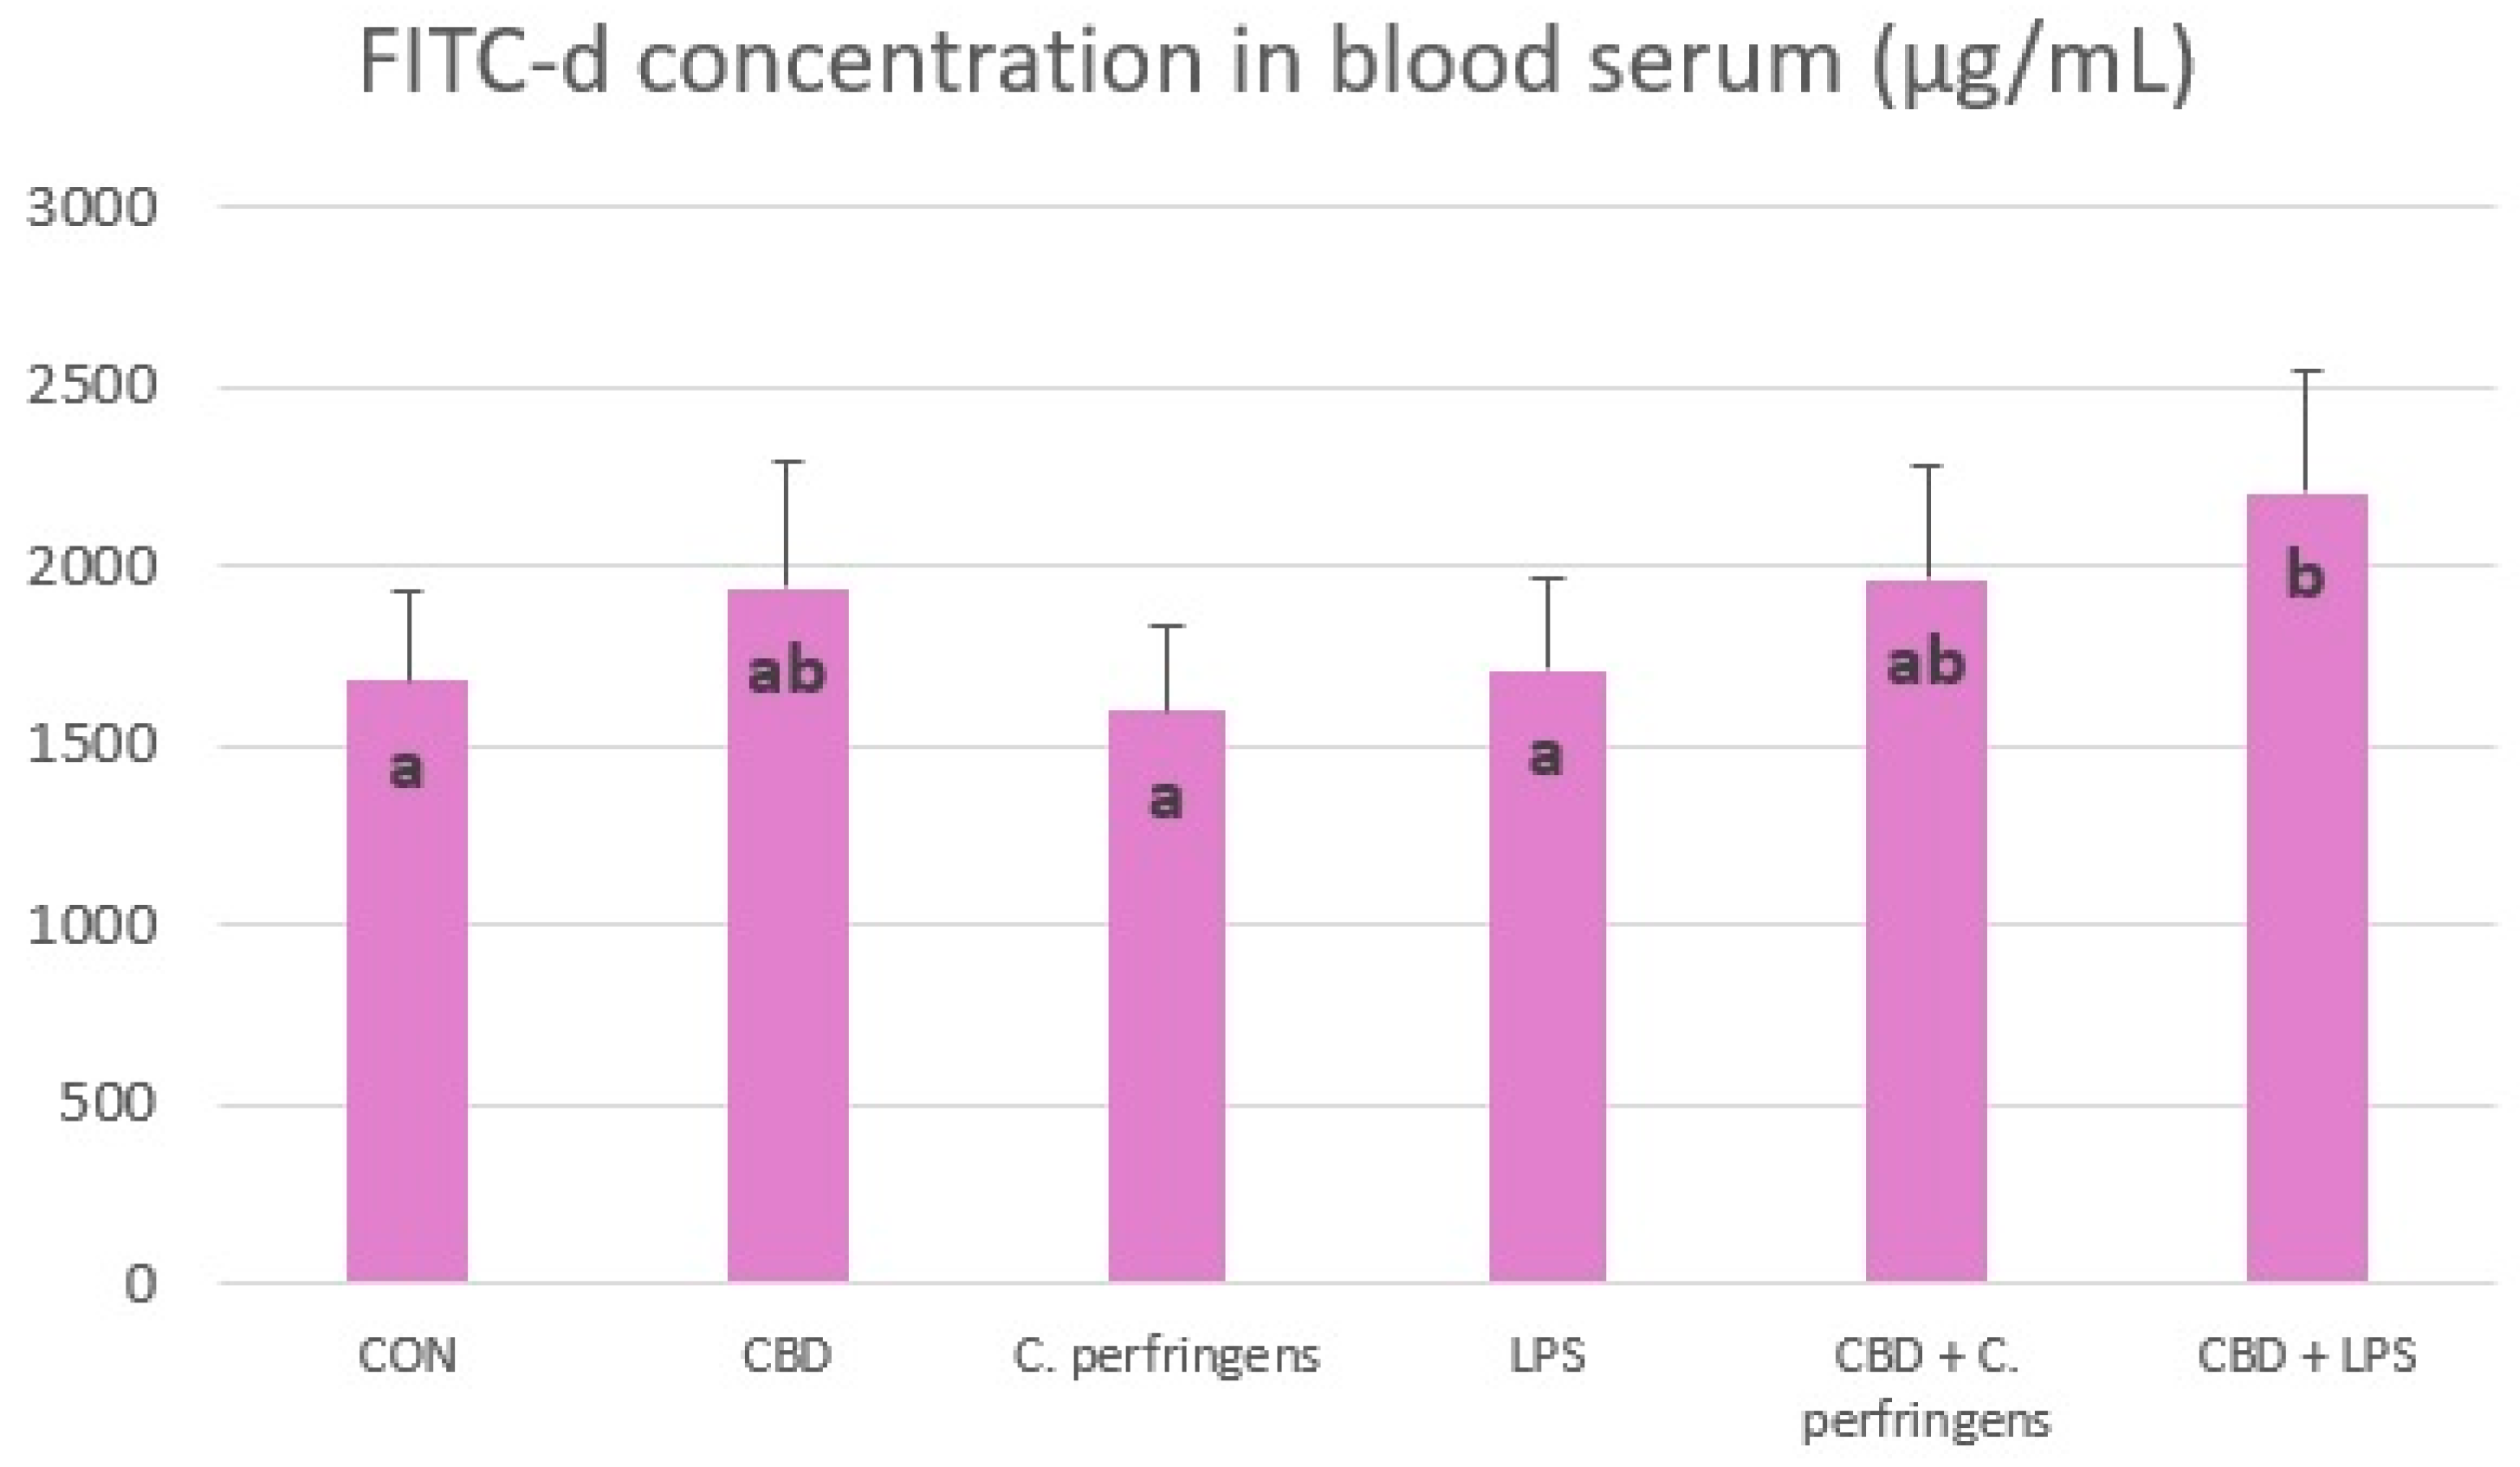
Figure 7.
A) Cortisol (ng/mL) and B) endotoxin (LPS, EU/mL (endotoxin units)) concentrations in chickens blood serum. The chickens were fed a control diet (CON), CON supplemented with 30 g of hemp extract/kg diet (CBD), CON diet and subjected to C. perfringens and E. coli LPS challenge (C. perfringens and LPS), CON diet supplemented with 30 g of hemp extract/kg diet and subjected to C. perfringens and E. coli LPS (CBD + C. perfringens and CBD + LPS). The error bars indicate the mean, standard deviations for the eight chickens in each dietary treatment group. The SEM for cortisol is 2.77, and for endotoxin is 0.023.
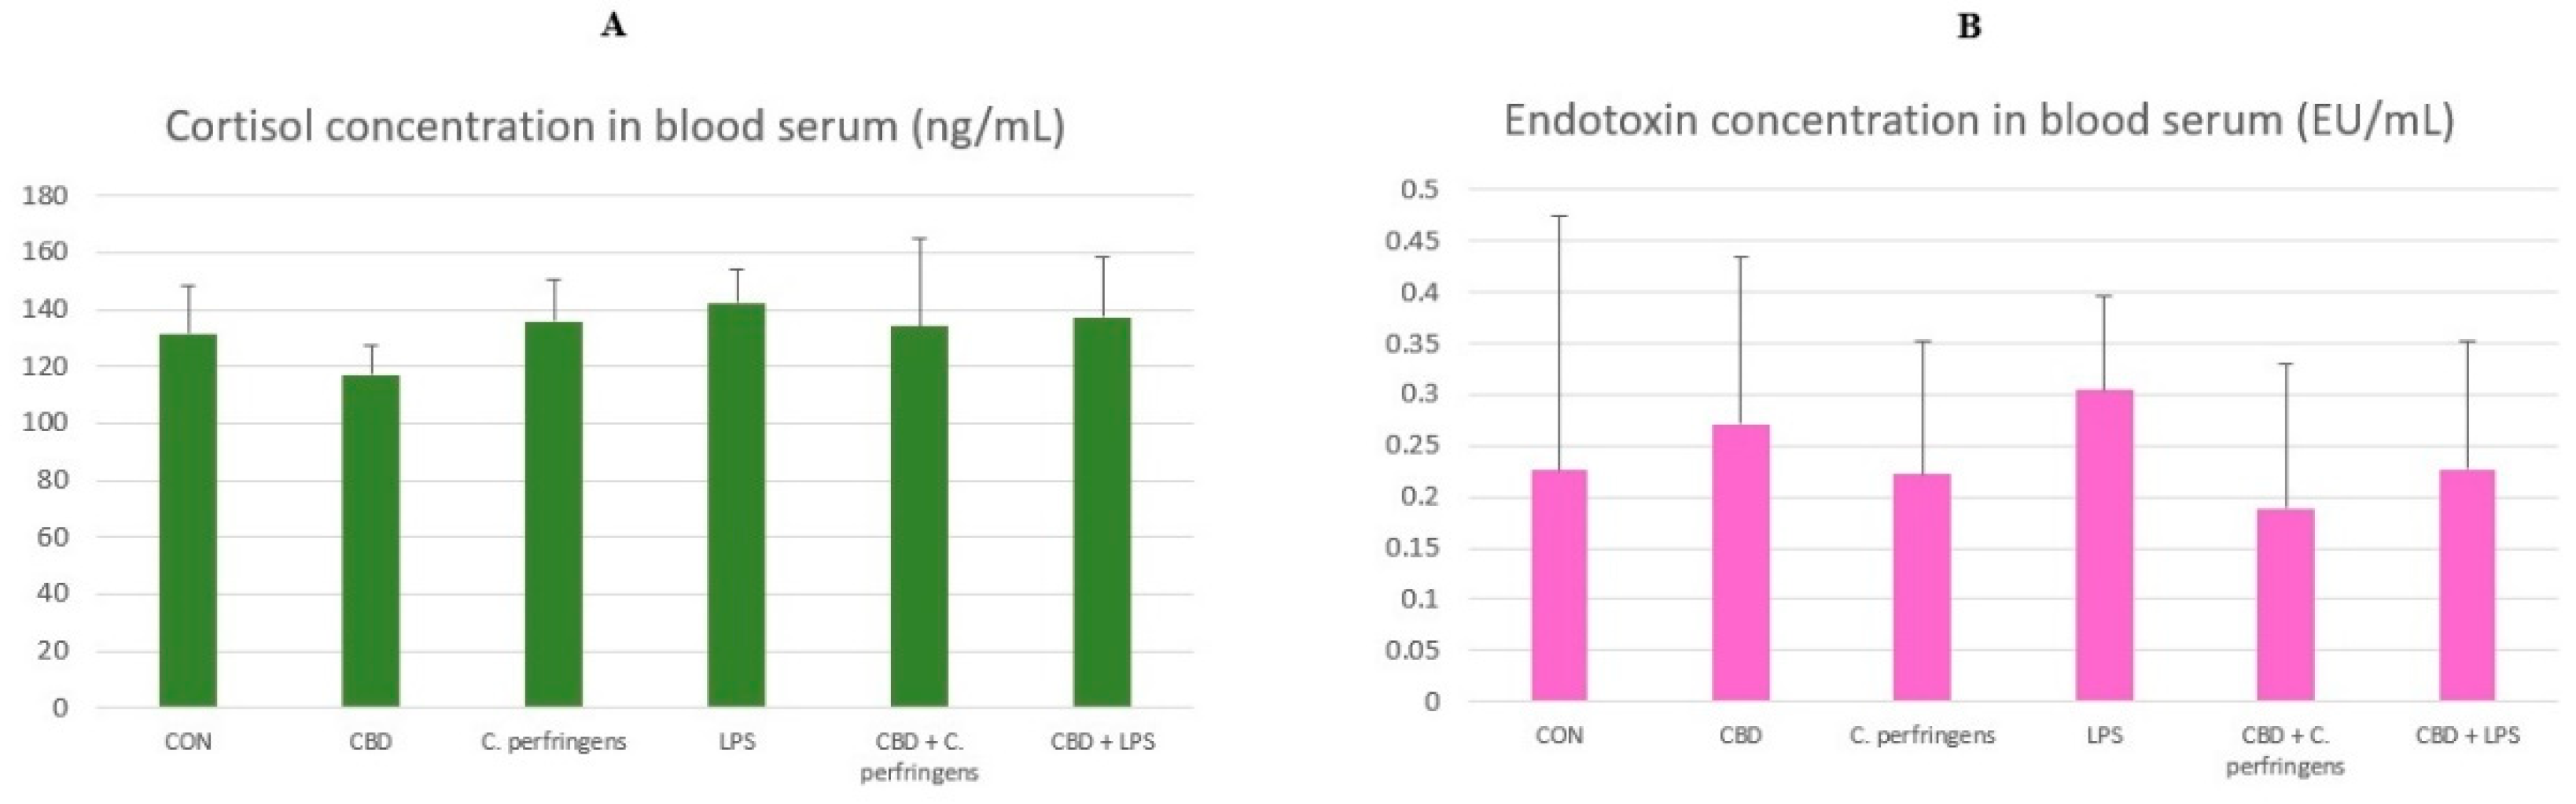
Figure 8.
Study design.
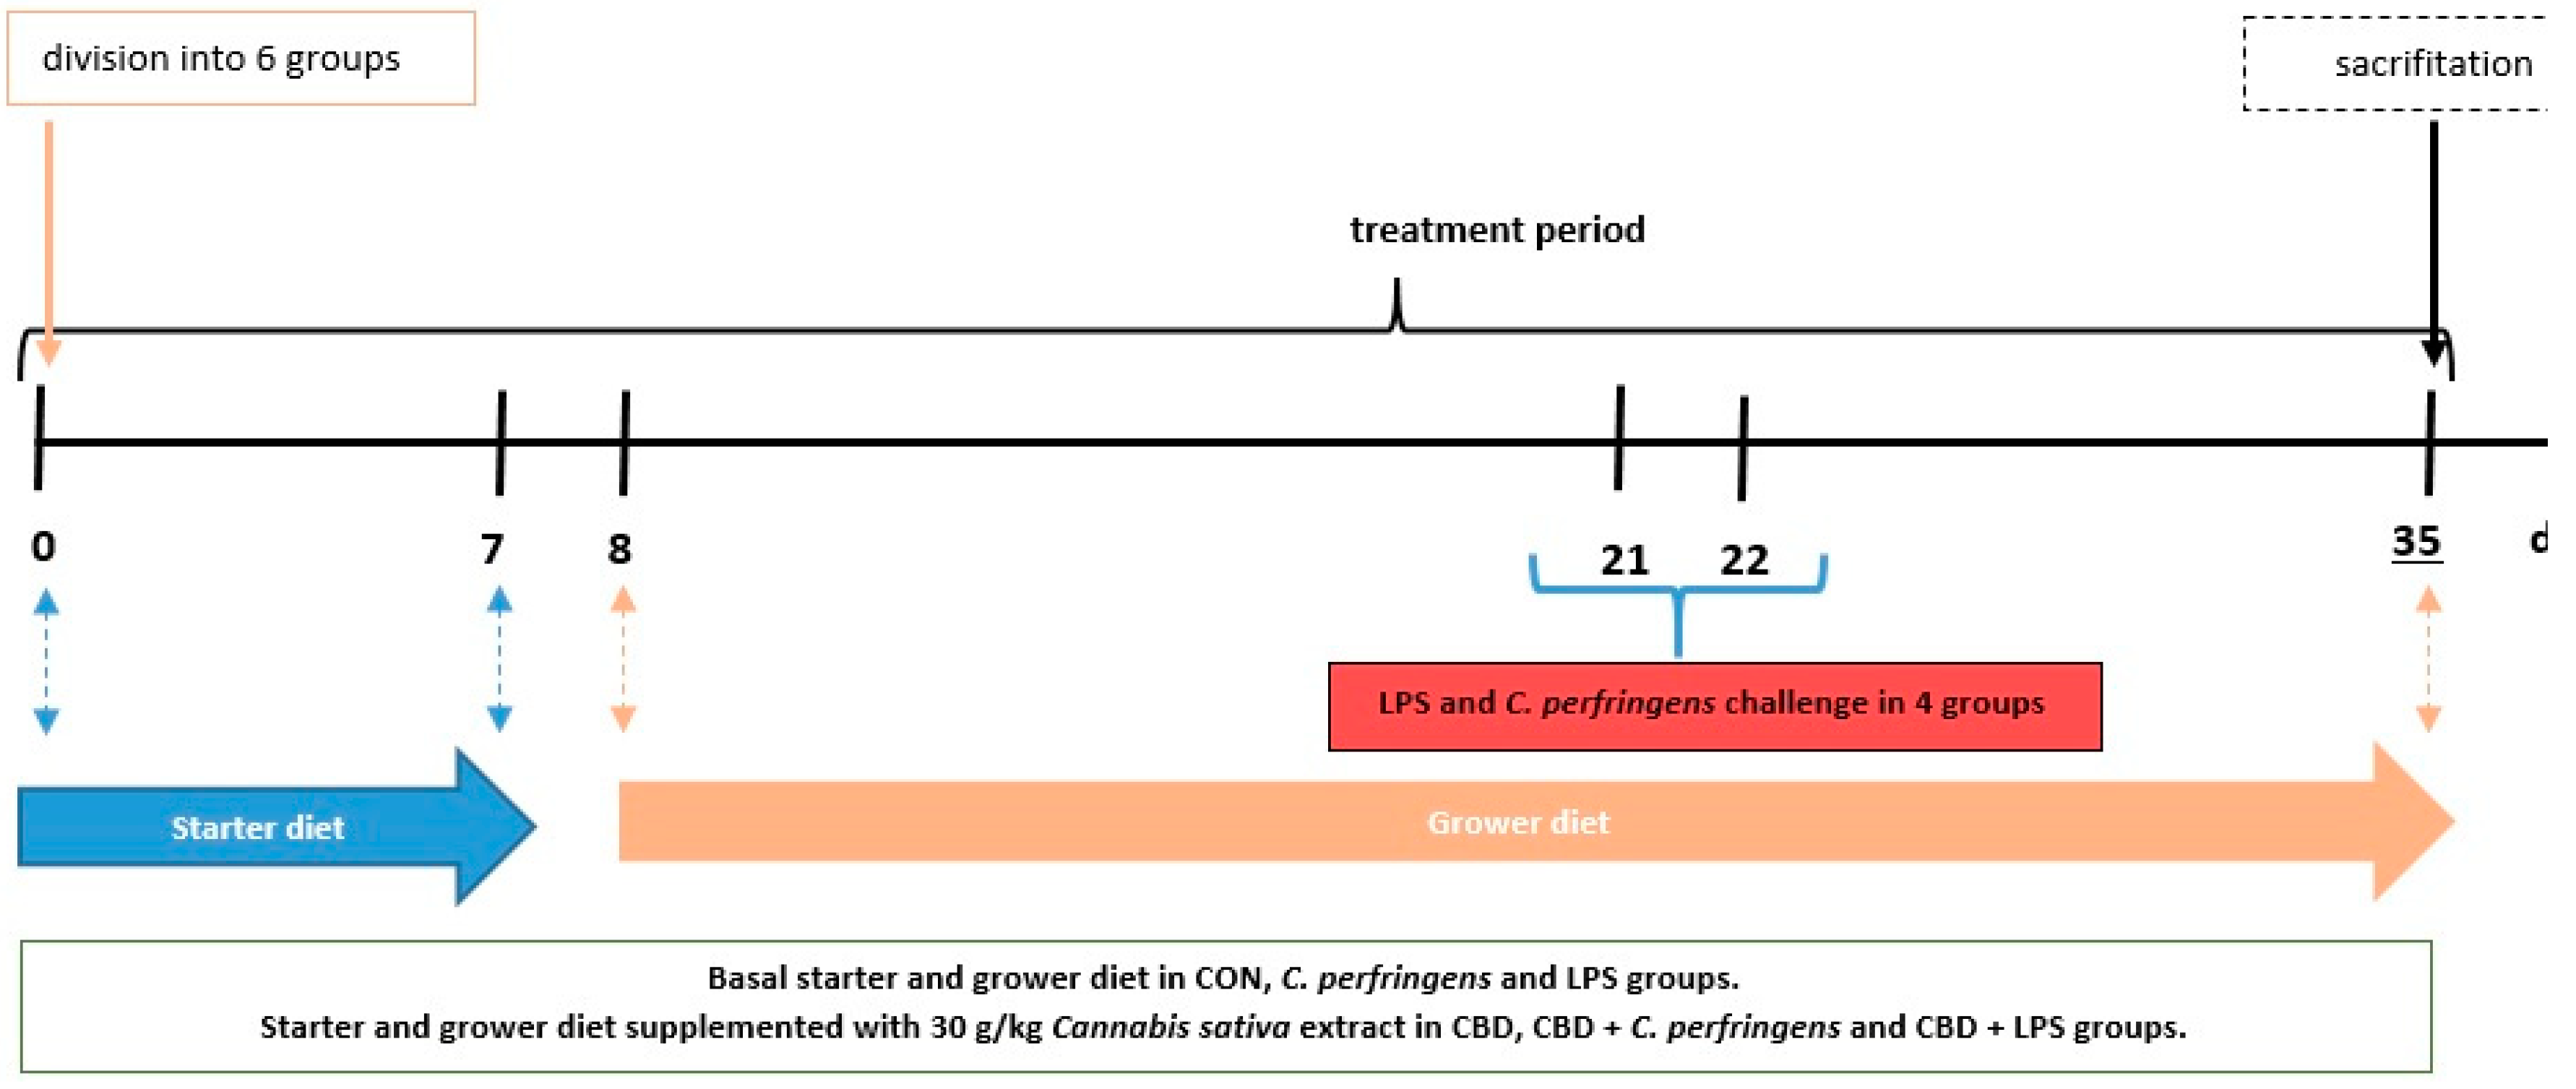
Table 1.
Correlations between gene expression in the jejunum.
| Gene | PPARγ | PPARα | PPARδ | |||
|---|---|---|---|---|---|---|
| r | p-value | r | p-value | r | p-value | |
| HSP70 | 0.083 | 0.598 | -0.171 | 0.262 | 0.134 | 0.387 |
| TFF2 | 0.109 | 0.477 | -0.015 | 0.092 | 0.064 | 0.672 |
| P53 | 0.22 | 0.152 | 0.247 | 0.097 | 0.228 | 0.132 |
| ZO-1 | 0.295 | 0.052* | 0.320 | 0.030* | 0.324 | 0.030* |
| ZO-2 | 0.559 | 0.001* | 0.411 | 0.007* | 0.657 | 0.001* |
| TLR4 | 0.044 | 0.776 | 0.323 | 0.027* | -0.02 | 0.896 |
| OCLN | 0.361 | 0.015* | 0.459 | 0.001* | 0.290 | 0.051* |
| MUC-5B | 0.194 | 0.203 | 0.404 | 0.005* | 0.056 | 0.71 |
| MUC-2 | 0.226 | 0.136 | 0.313 | 0.032* | 0.474 | 0.001* |
| JAM-2 | 0.339 | 0.026* | 0.220 | 0.152 | 0.325 | 0.033* |
| IAP | 0.069 | 0.651 | -0.085 | 0.567 | 0.014 | 0.923 |
| E-cad | 0.545 | 0.001* | 0.436 | 0.003* | 0.24 | 0.113 |
| CLDN-3 | 0.346 | 0.022* | 0.351 | 0.017* | 0.212 | 0.162 |
| GLP-2 | 0.021 | 0.89 | -0.043 | 0.755 | 0.21 | 0.161 |
| OGG-1 | 0.139 | 0.376 | 0.176 | 0.248 | 0.236 | 0.123 |
| GPX-1 | 0.01 | 0.954 | -0.085 | 0.605 | -0.196 | 0.233 |
| CLDN-1 | 0.622 | 0.001* | 0.366 | 0.014* | 0.25 | 0.102 |
| CD36 | 0.449 | 0.002* | 0.177 | 0.299 | 0.051 | 0.736 |
| CLDN | 0.101 | 0.526 | 0.209 | 0.173 | 0.1 | 0.518 |
| CNR1 | 0.197 | 0.194 | 0.459 | 0.001* | 0.06 | 0.687 |
* Calculated Pearson’s correlation coefficient between mRNA expression levels of PPARs and select genes determining gut integrity, involved in GIT inflammation defense, oxidative stress and immune response in the jejunum in chickens subjected to different challenges. * Significant correlation at P<0.05. Abbreviations: HSP70 heat shock protein 70, TFF2 trefoil factor 2, PPARγ peroxisome proliferator activated receptor gamma, PPARα peroxisome proliferator activated receptor alpha, PPARδ peroxisome proliferator activated receptor delta, P53 tumor protein 53, ZO-1 zonula occludens 1, ZO-2 zonula occludens 2, TLR4 toll like receptor 4, OCLD occludin, MUC-5B mucin 5B, MUC-2 mucin 2, JAM-2 junctional adhesion molecule 2, IAP intestinal alkaline phosphatase, E-cad e-cadherin, CLDN-3 claudin-3, GLP-2 glucagon like peptide 2, OGG-1 8-oxyguanine DNA glycosylase, GPX-1 glutathione peroxidase 1, CLDN-1 claudin 1, CD36 CD36 molecule, CLDN claudin, CNR1 cannabinoid receptor 1.
Table 5.
Division into experimental groups.
| Total of 204 Broiler Ross 308 | |||
|---|---|---|---|
| Group | Number of birds | Additives | Challenge |
| CON | 34 | none | None |
| CBD | 34 | 30 g/kg CBD | None |
| C. perfringens | 34 | none | C. perfringens |
| LPS | 34 | none | E. coli LPS |
| CBD + C. perfringens | 34 | 30 g/kg CBD | C. perfringens |
| CBD + LPS | 34 | 30 g/kg CBD | E. coli LPS |
Disclaimer/Publisher’s Note: The statements, opinions and data contained in all publications are solely those of the individual author(s) and contributor(s) and not of MDPI and/or the editor(s). MDPI and/or the editor(s) disclaim responsibility for any injury to people or property resulting from any ideas, methods, instructions or products referred to in the content. |
© 2024 by the authors. Licensee MDPI, Basel, Switzerland. This article is an open access article distributed under the terms and conditions of the Creative Commons Attribution (CC BY) license (https://creativecommons.org/licenses/by/4.0/).
Copyright: This open access article is published under a Creative Commons CC BY 4.0 license, which permit the free download, distribution, and reuse, provided that the author and preprint are cited in any reuse.


