

Submitted:
23 September 2024
Posted:
25 September 2024
You are already at the latest version
Abstract
Agriculture is the major economic source for the national GDP of Nepal, where the larger population of smallholder farmers engage in farming and grow few major crops using limited resources. According to recent data, agriculture production is declining gradually in contrast to the exponential population growth rate. Also, Rural populations are shifting towards urban areas resulting in numerous challenges and problems of food insecurity and malnutrition. However, the major reason behind malnutrition all over the globe is due to monocropping. Agriculture diversification is the strategic approach to overcome these challenges. We articulate two theories of Utility-Maximization theory and Entitlement theory to build a new theory of Utility-entitlement, which helps explain the relationship and causes related to agriculture diversification and food variety in Nepal. The secondary data were collected from the Nepal Household Risk and Vulnerability Panel Survey conducted over three years (2016-18). We use the Simpson diversification index, food consumption score, and linear regression model as a method of analysis. The result reveals that Agriculture diversification and dietary diversity have a highly positive significant relationship, and the major factor associated with this is Market access. Upland type, canal or rainfed irrigation, and market access are the factors for agriculture diversification. As a policy recommendation, the government and development sector should focus on a geographical approach- an upland area, especially during the dry cropping season facilitated with infrastructure and transportation for easy market access.
Keywords:
Agriculture diversification
; Dietary Diversity
; Smallholder farmers
; cropping seasonal variation
; Nepal
1. Introduction
Agriculture constitutes a cornerstone of Nepal's economy, accounting for approximately 27.6% of its GDP and engaging 66% of smallholder farmers in agricultural activities, with an emphasis on ensuring national food security (Karki et al., 2020). The country's agricultural portfolio is diverse, comprising staples such as rice, maize, wheat, millets, barley, pulses, oilseeds, and sugarcane. Despite substantial investments in agricultural research and extension services, there has been a decline in crop yield growth from 2.3% in the fiscal year 2022 to 2.0% in the fiscal year 2023 (ADB, 2023, Joshi, 2023). Concurrently, the population has been rising at a rate of 1.14% annually, accompanied by a significant expansion in both the number and size of urban areas. This decrease in agricultural productivity is occurring in the context of a 1.14% annual population growth and an expanding urban demographic, intensifying the challenges of food insecurity and hunger.
Globally, hunger and insufficient intake of essential micronutrients afflict 2 billion individuals, which equates to 30% of the world's populace, with 815 million, or one out of every nine people, facing chronic food scarcity daily (Gupta et al., 2021). Although Nepal has made strides, reducing its Global Hunger Index score from 37.4 in 2000 to 19.5 in 2020, persistent food and nutritional insecurity issues are evident (Pandey et al., 2021). Research from Tufts University and the Global Dietary Database indicates that in Nepal, the dietary intake of critical foods and nutrients for adults over the age of 20 falls below half of the advised daily consumption levels (Dizon et al., 2021). A predominant etiological factor for nutritional deficiency is attributed to inadequate dietary diversity or consumption patterns. This situation is partly due to the prevalence of monocultures producing staple foods with limited nutritional value and a decline in agricultural diversity among rural cultivators, contributing to elevated malnutrition and food insecurity rates (Liu et al., 2023, Baba and Abdulai, 2021). Despite the escalation in food production and caloric consumption attributed to monoculture practices, these methods correlate with nutritional imbalances and dietary deficits (Jones, 2017). In Nepal, the dominance of cereal cultivation, covering three-quarters of the agricultural terrain (Acharya et al., 2018), mirrors the widespread micronutrient scarcities and a uniform diet heavily dependent on staple grains. This pattern of reduced agricultural and food diversity could substantially influence global dietary trends. An estimated half a billion smallholder farms, located primarily in sub-Saharan Africa and parts of Asia, contribute to 80% of the region's food production, according to (Awazi and Tchamba, 2019). Despite this significant output, the potential of agriculture to alleviate malnutrition through the provision of nutrient-dense food remains inadequately tapped. Smallholder farmers often endure protracted phases of food insecurity, consuming less than optimal quantities of their own agricultural produce and facing restricted access to market-sourced foods, which exacerbates dietary deficiencies and undernutrition.
The government's focus on augmenting agricultural output is evident, and agricultural diversification has been identified as a strategic approach to achieve this enhancement. Agricultural diversification represents a tactical method pursued by agricultural stakeholders to augment the robustness, ecological persistence, and economic viability of their cultivation systems. This strategy mitigates the vulnerability associated with monocultural practices by providing a spectrum of advantages, including improved risk mitigation, economic equilibrium, environmental protection, and heightened nutritional sufficiency (Alam et al., 2023, Uddin, 2019). Global initiatives have deployed agricultural diversification strategies with the dual aim of augmenting household earnings and fostering nutritional adequacy in developing countries (Pellegrini and Tasciotti, 2014). The Agriculture Development Strategy (ADS) for the period 2015-2035, ratified by the Nepalese government, emphasizes the critical importance of diversifying agricultural output by promoting the cultivation of high-value crops and diminishing dependence on traditional agricultural practices (Khanal et al., 2020).
2. Literature Review
The literature posits that the extant food production system falls short in yielding adequate and timely food supplies for every social stratum (Tripathi and Kaini, 2023). Research in various developing nations has often isolated this complex relationship for scrutiny under a singular parameter, yielding noteworthy findings. However, there is a conspicuous paucity of studies investigating the nexus between agricultural diversification and nutrition in livelihoods, presenting a unique research avenue in the context of Nepal. This approach is designed to enhance agricultural income and encourage sustainable intensification by expanding the range of high-value crops, livestock, agroforestry, fisheries, and related activities, as described in the literature by (Cassman and Grassini, 2020, Thapa et al., 2017). Agricultural diversification is proposed as a strategy to address economic adversities, diminish reliance on monoculture, potentially increase earnings, and bolster resilience to market and climatic volatilities, as observed by (Ruel et al., 2018). Additionally, the scarcity of empirical evidence hinders understanding of the extent to which agricultural diversification could enhance the nutrition of smallholder farmers and their households in Nepal.
Agricultural diversification boosts rural earnings by optimizing resources, tapping market opportunities, and fostering agro-industrial employment, contingent on supportive policies, technology, and infrastructure. Market demands propel it, and it mitigates risk by spreading income sources for rural households. However, its effectiveness hinges on technology, support systems, irrigation, capital, and government backing, facing hurdles such as technology access, water control, market formation, research, extension services, and policy limitations (Barghouti et al., 1992).
This study investigates the correlation between agricultural diversification and dietary diversity, taking into account various elements that influence both agricultural variation and the range of dietary food group consume in a week. This study also elucidates the advantages of agricultural diversification as a tactical method for enhancing income and nutrition for small-scale farmers. Recommendations for policy to governmental and developmental agencies will provide insight into the most effective strategies and the impacts of incorporating agricultural diversification in Nepal.
3. Conceptual and Theoretical Framework
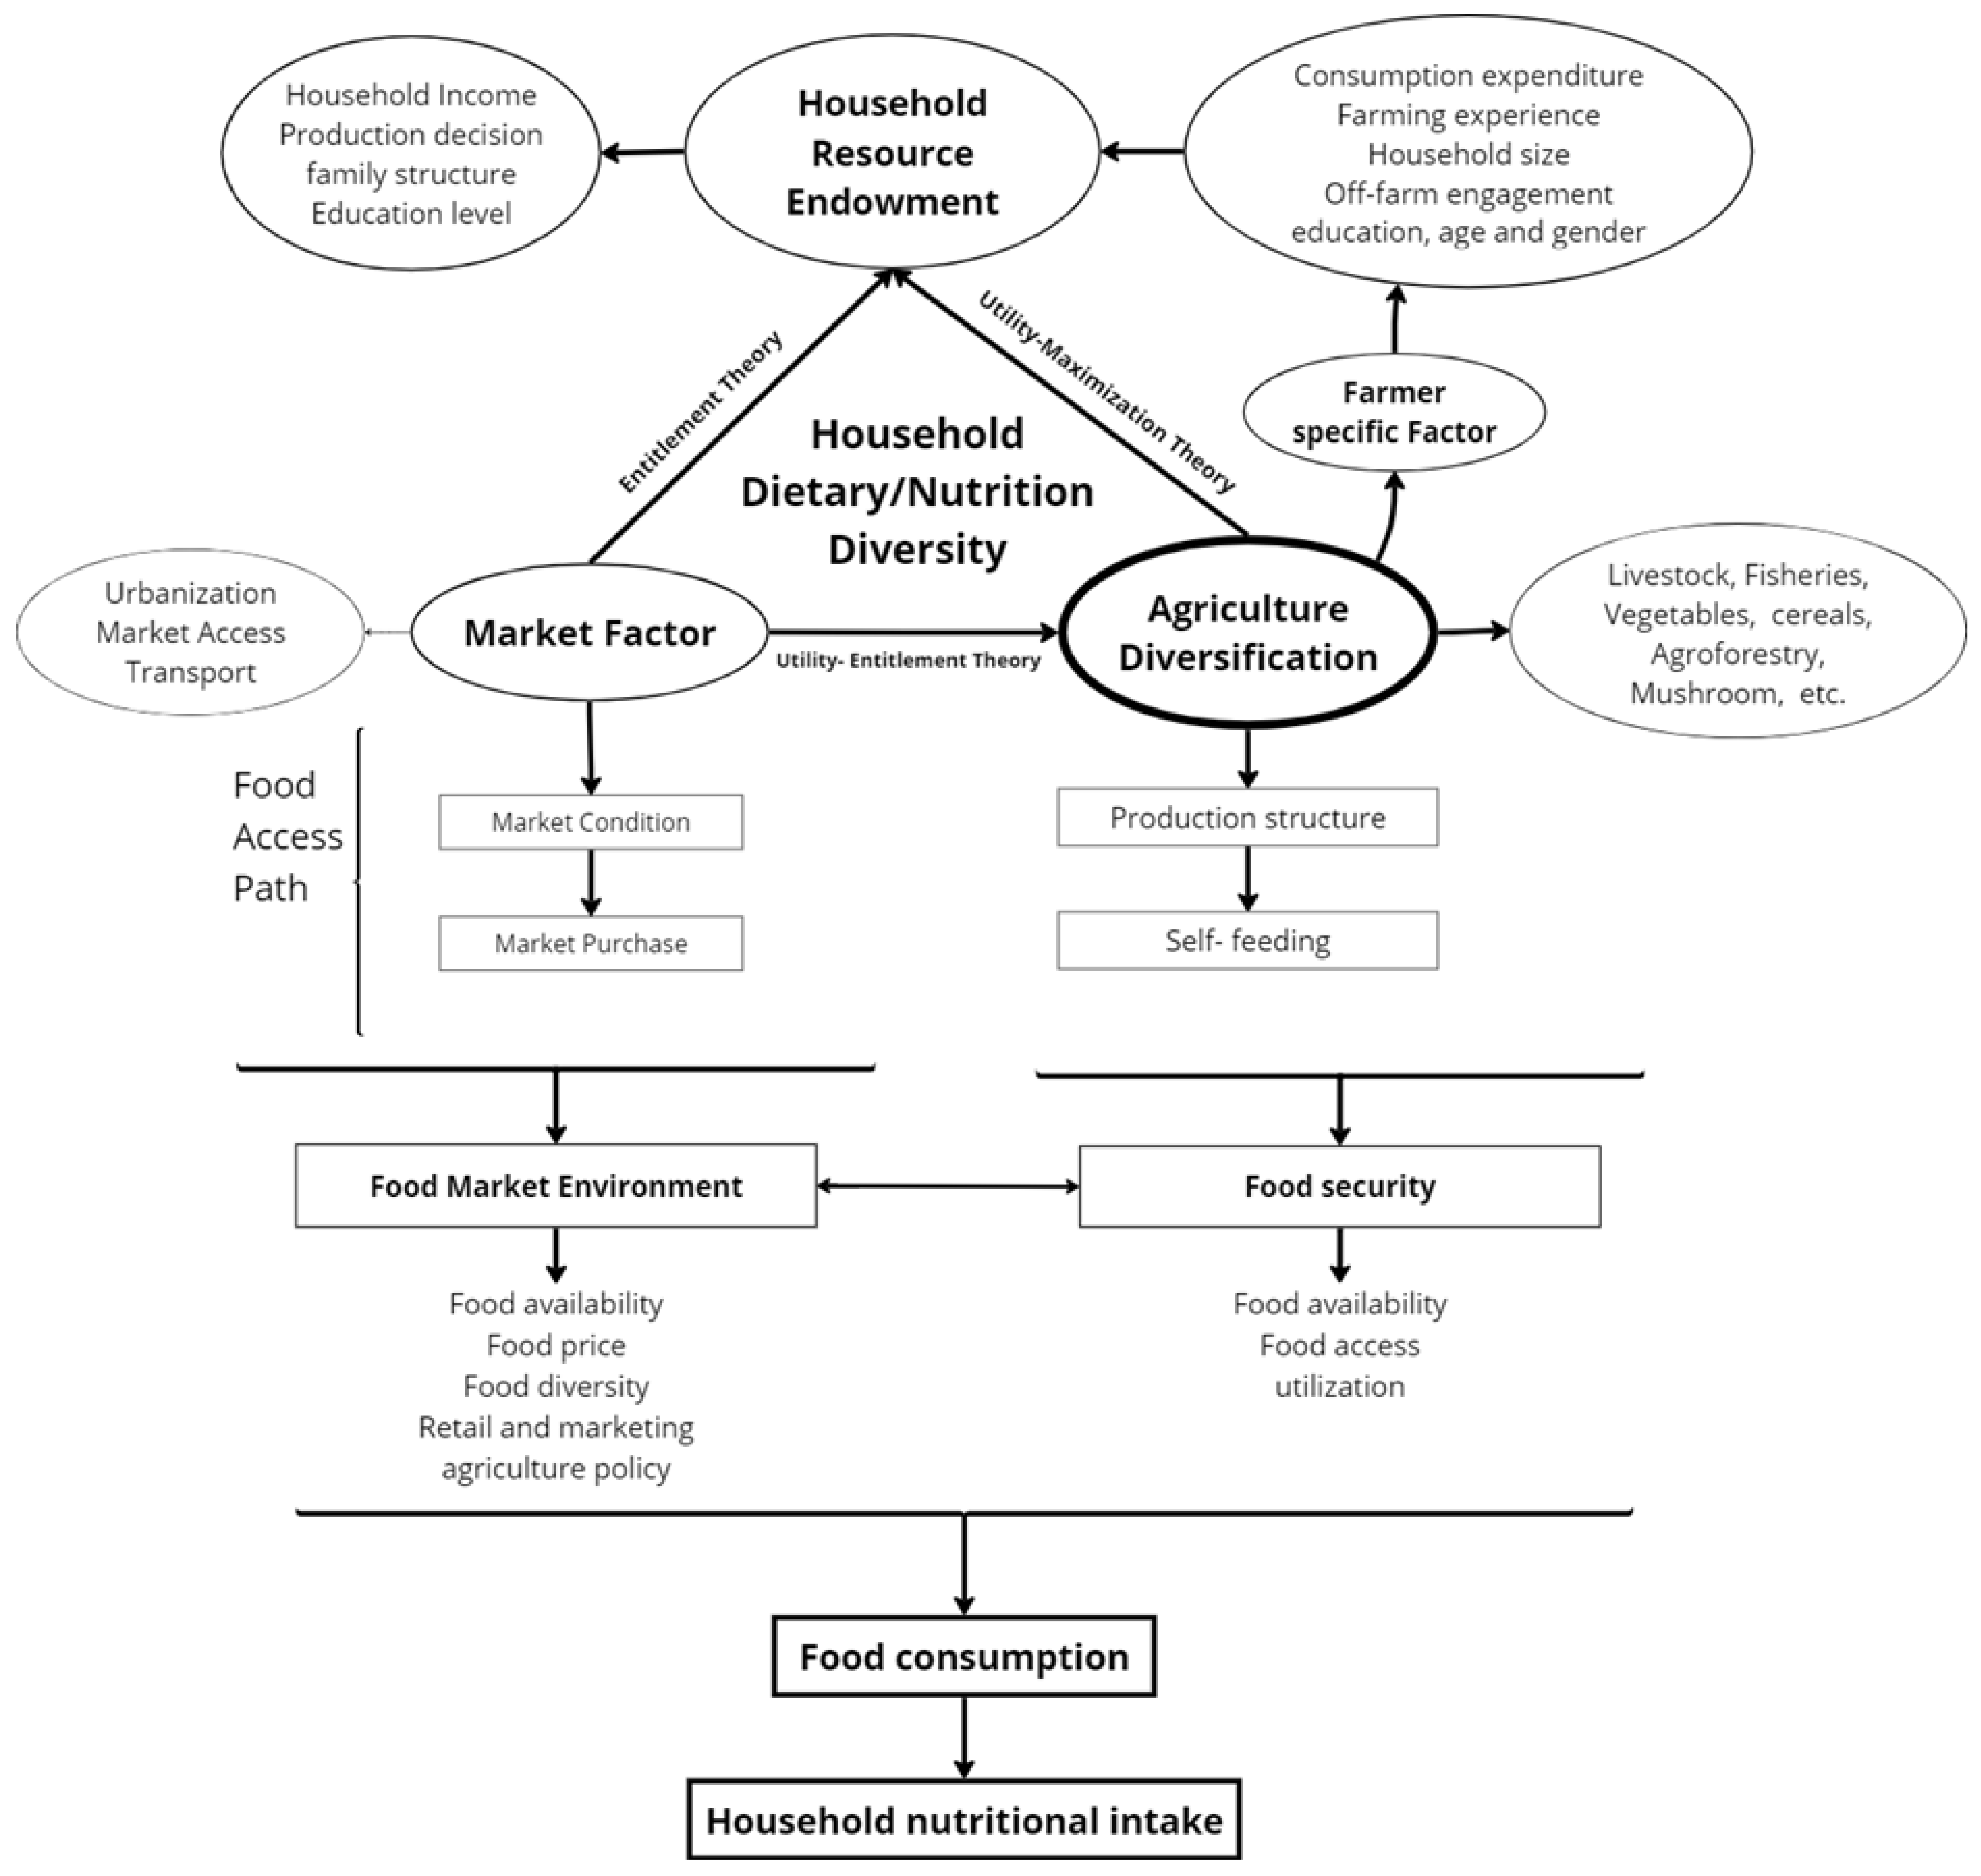
This research posits three hypotheses to elucidate its core concepts: the first posits a substantive correlation between agricultural diversification and dietary diversity during systemic transitions and development; the second suggests that farmers are likely to diversify their agricultural practices by incorporating various commodities into their current systems if it results in an income increase, thereby corroborating the Utility-Maximization theory (Rahm and Huffman, 1984, Appiah-Twumasi and Asale, 2022, Douyon et al., 2022b). Thirdly, uptake by households is also obtained through market purchases and household production- supporting the Entitlement theory (Sen, 1982, Yue et al., 2022). Combining these two theories a new theory, the Utility-Entitlement Theory suggests that nutritional dietary diversity in a household requires market-oriented agriculture diversification to generate income, which increases the range of food available to satisfy this demand. According to Figure 3, the various factors associated with household resources and characteristics affect agriculture diversification and dietary preferences which we further study in this research.
Figure 3.
Conceptual and theoretical Framework of Utility-Entitlement Theory (Yue et al., 2022, Romeo et al., 2016, Douyon et al., 2022a, Appiah-Twumasi and Asale, 2022).
Figure 3.
Conceptual and theoretical Framework of Utility-Entitlement Theory (Yue et al., 2022, Romeo et al., 2016, Douyon et al., 2022a, Appiah-Twumasi and Asale, 2022).
4. Material and Methodology
4.1. Data and Software
The research was conducted by using the Nepal Household Risk & Vulnerability (HRVS) Panel Survey data from the World Bank between 2016 and 2018, with funding provided by the UK Department for International Development (DfID). It encompasses 400 settlements and 6,000 families in rural and peri-urban locations around the country were included in the study. To enhance the proportion of surveyed households, probability proportional to size (PSU) was used to choose 50 out of 75 districts in Nepal (excluding homes in the districts of Bhaktapur, Lalitpur, and Kathmandu Valley).
Out of the 6,000 Wave 1 households, 5,654 (94%) took part in all three waves. 6,005 homes were questioned as part of Wave 2, among which 5,835 (97%) were Wave 1 households and 165 (3%) lacked additional households recruited to replace Wave 1 families that were unreachable. A representative group of 6,051 homes were questioned as part of Wave 3. The greater number resulted from certain homes that were contacted again in Wave 3 after being questioned in Wave 1 but not in Wave 2 Presented in Table 1 (Walker and Jacoby, 2016).
All these data were structured district-wise to articulate national-level study and analysis of the variables accordingly. Data analysis and visualization were performed in RStudio using the 'vegan' package for ecological diversity analysis and 'ggplot2' for graphical representation, applied to pre-processed and categorized comma-separated values (CSV) data exported from Excel 2016.
4.2. Measurement of Agriculture Diversification and Dietary Diversity Score
4.2.1. Simpson Diversification Index for Agriculture Diversification
In agriculture adding a wider variety of crop species rather than being specialized in a single crop indicates diversification. The Simpson Diversification Index (SDI) can be used to measure crop or product diversity within a particular region or farming system. We have categorized agriculture diversification into crop diversification and livestock diversification for this research. Furthermore, based on seasonal cropping in Nepal the crop diversification was separated into wet (kharif) season crop diversification and dry (Rabi) season crop diversification. SDI is the difference between one and the sum square of a variety of species in a specific area at a particular time. The SDI ranges from 0 to 1, where zero indicates less diversified and One means highly diversified.
The formula below is used to compute the Simpson Index:
SDI = 1 − ∑i(ni/N)2
ni = amount of crop species grown in a particular area at a given period of time.
N= denotes the total quantity of individual crop across all crop species.
4.2.2. Food Consumption Score (FCS) or Dietary Diversity Score (DDS)
The frequency of consumption of foods from nine distinct food categories by families during the preceding seven days is taken into consideration by the DDS. The World Food Program served as the inspiration for the mathematical method we used to obtain this score, called the Dietary Diversity Score (DDS) method as mentioned in Table 2 (Douyon et al., 2022b, Uddin, 2019). This score functioned as a proxy for the degree (0–21 = Poor; 21.5–35 = Borderline; and >35 = Acceptable.) to which households satisfied their requirements for micronutrients.
The DDS is calculated as follows:
DDS = AiXi + AinXin
Ai = weight according to the dietary category assigned by WFP for n number of food group.
Xi = the amount of food consumed over seven days concerning each n number of dietary category.
4.3. Econometric Model
We have three years of balance panel data from HRVS, Nepal to understand the effect of the independent variable on the dependent variable. We perform KMO and Bartlett’s tests for suitable factorial linear regression analysis. Based on this test, we assign two regression models to analyze the relationship between a dependent variable (Multivariable regression model) and various factors with a dependent variable (OLS regression model).
4.3.1. Multivariable Regression Model
This model is applied to understand the relationship between agriculture diversification as an independent variable and dietary diversity score as a dependent variable.
DDS
𝑖 =
𝛽0 +
𝛽1
∗ (
𝑆𝐷𝐼)
𝑖 + …. + E
𝑖
DDSi= Dietary Diversity Score for diverse i,
(SDI)i= agriculture diversification by Simpson index for diverse i,
Ei = error term
4.3.2. Ordinary Least Square (OLS) Regression Model
We used OLS model to estimate the linear relationship between dietary diversity score or agriculture diversification (dependent variable) and one or more household characteristics (independent variable). This OLS model tries to minimize the distance between the observed values and the values predicted by the linear model.
(DDS or SDI)
𝑖 =
𝛽0 +
𝛽1
∗ (HC)
𝑖 +
𝛽2
∗
𝑋𝑖 + E
𝑖
(DDS or SDI) i= Dietary Diversity Score or agriculture diversification for diverse i,
(HC)i= household characteristics for household i,
Ei = error term of household i
and Xi= vector of other characteristics of household i.
5. Result and Discussion
5.1. Result
5.1.1. Bartlett’s Test of Sphericity and the KMO Test
In Table 3, the suitability of the data for the Utility-Entitlement theory Analysis was checked using the Kaiser-Meyer-Olkin (KMO) measure and Bartlett's test of sphericity. The factor analysis's sample adequacy is modest, as shown by the KMO score of 0.66. Since the correlation matrix does not appear to be an identity matrix and is suited for factor analysis, Bartlett's test has a highly significant p-value (0.000). There are 28 degrees of freedom and a chi-square value of 396.2046.

Table 3.
Bartlett’s test of sphericity and the KMO test.
| KMO and Bartlett’s test | |
| Kaiser–Meyer–Olkin (KMO) measure of sampling adequacy | 0.66 |
| Bartlett’s test of sphericity | |
| Approx. Chi-Square | 396.2046 |
| df | 28 |
| Sig. | 0.000 |
5.1.2. Estimation of Kernel Density with the Agriculture Diversification Index
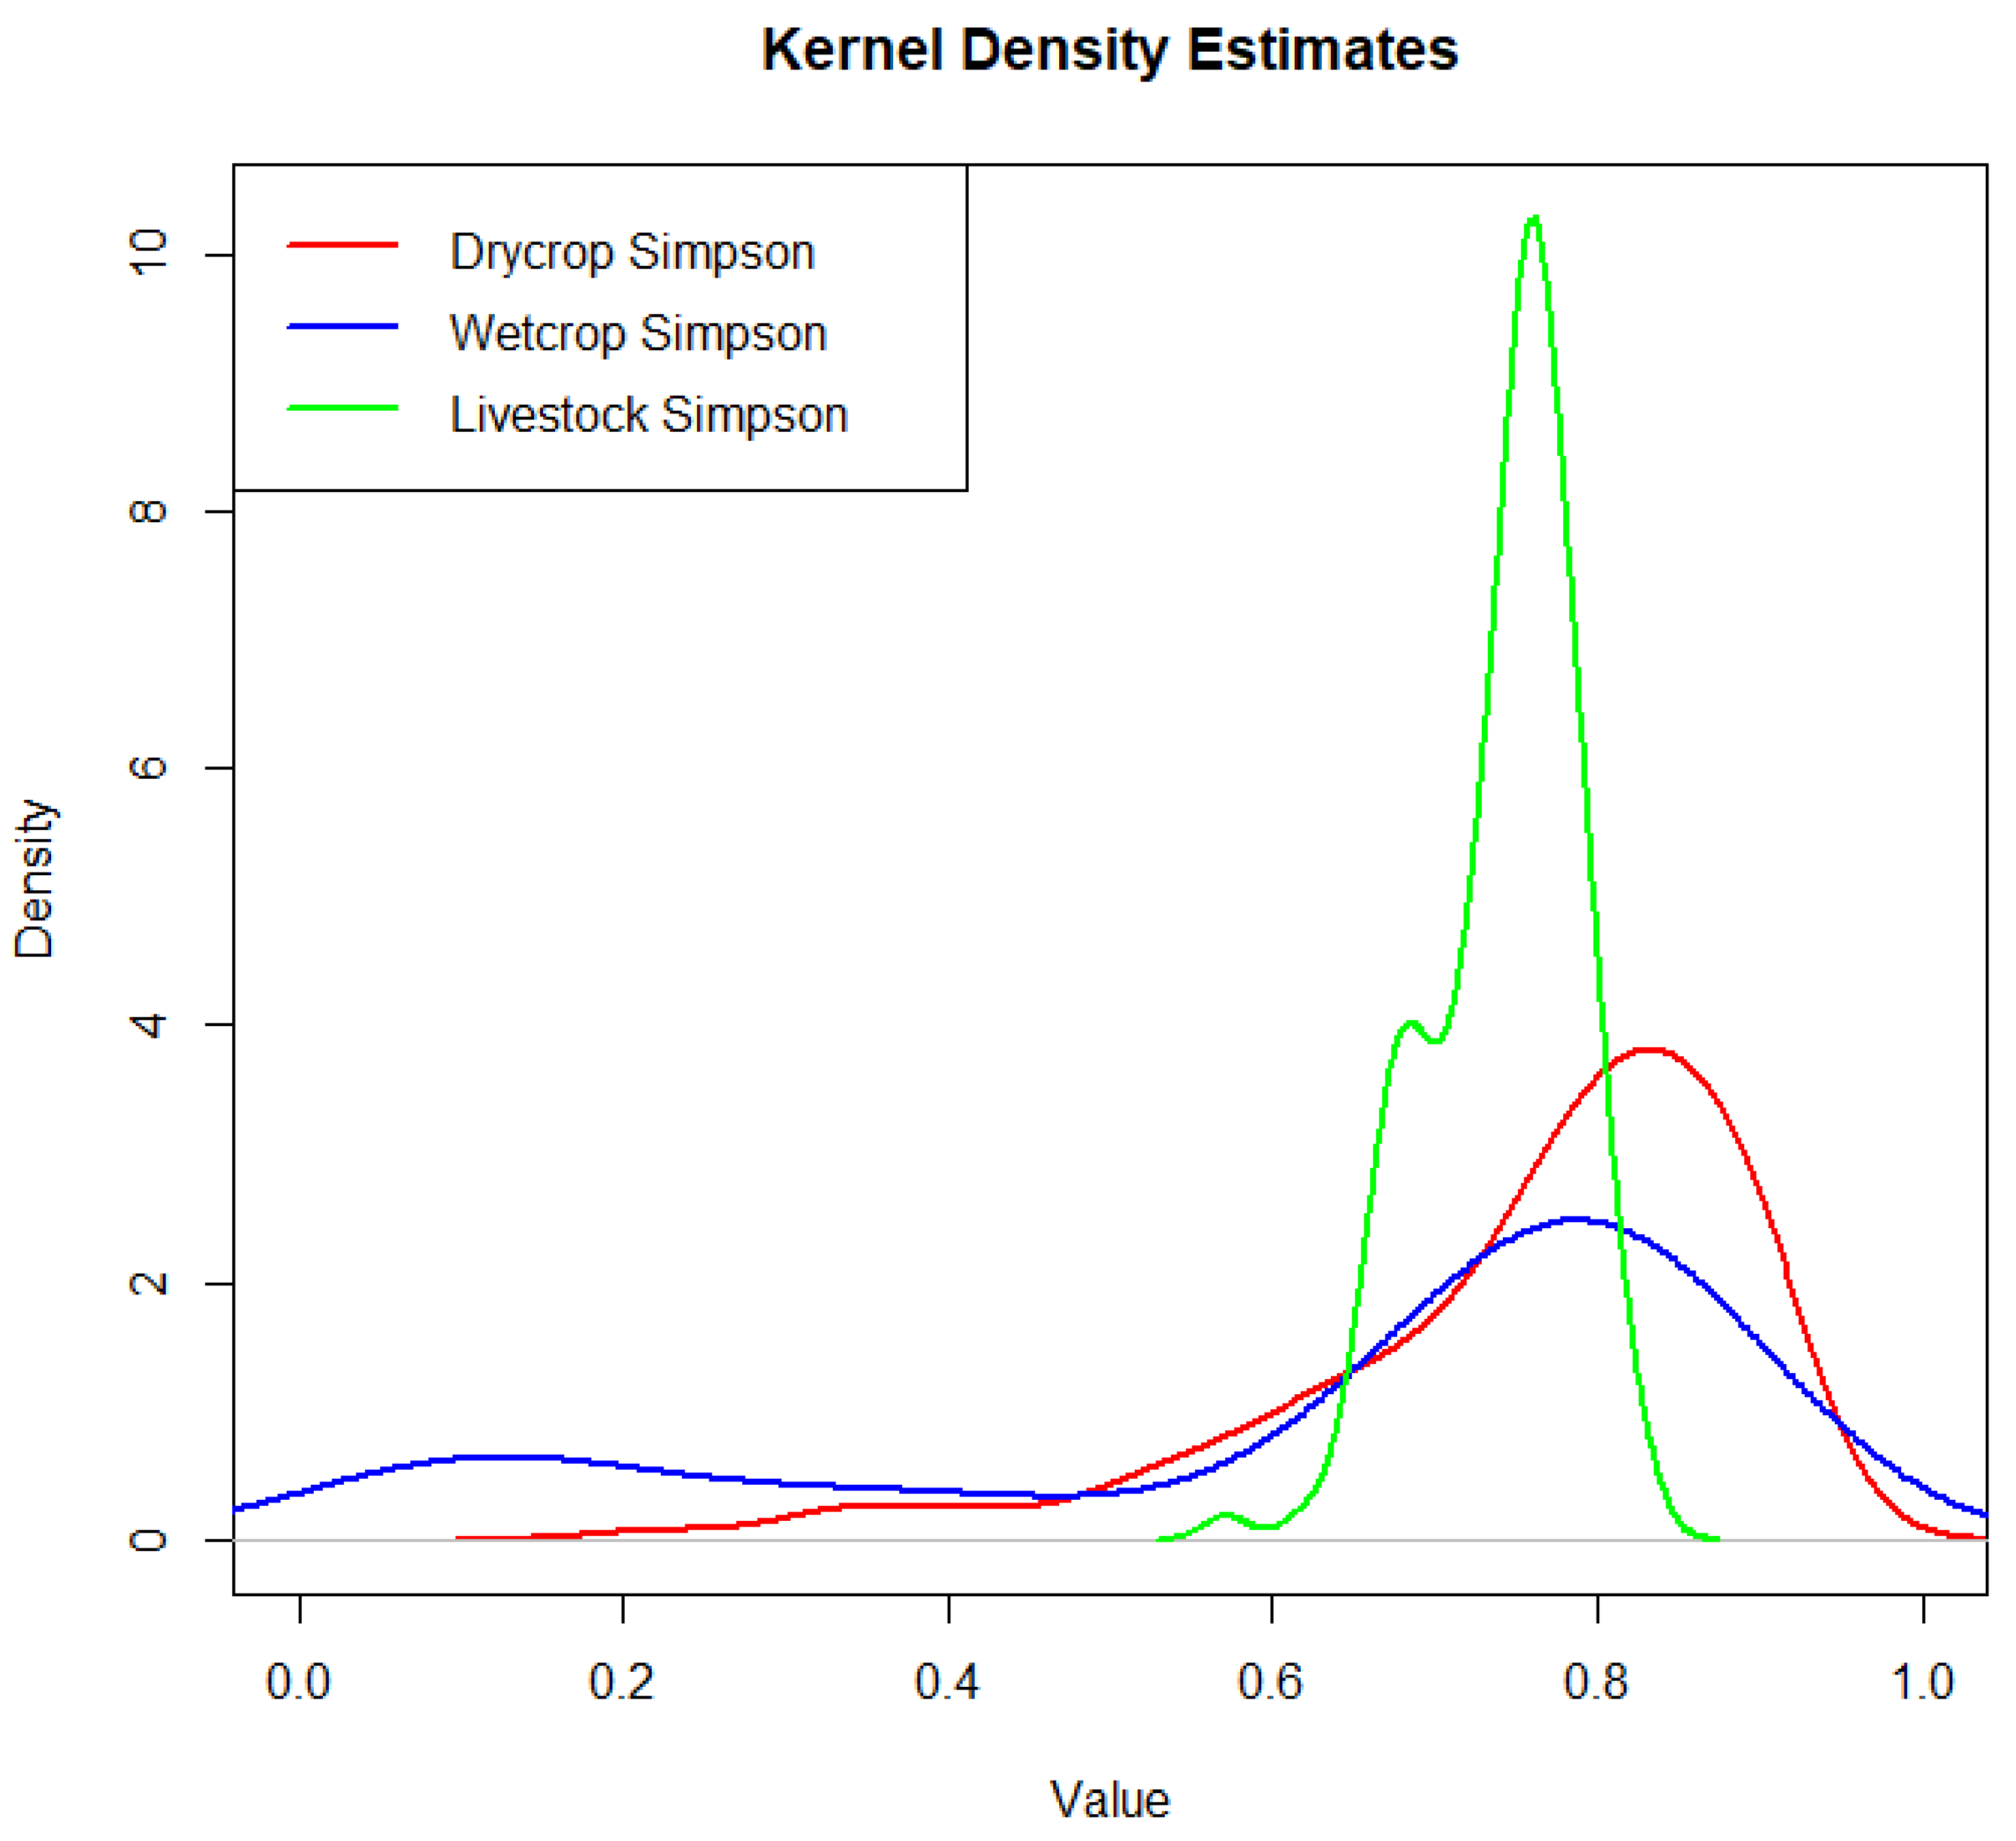
Simpson categories for Dry crop, Wet crop, and Livestock are compared on a kernel density estimation plot. The x-axis displays the value of the data and the y-axis displays the density, visualizing the distribution of data values for each category. In order to establish a binary variable that indicates whether a household varied their agricultural activities, the mean for the Simson Diversification Index of agricultural diversification was utilized as the cutoff threshold. A value of zero (not diversified) was given to households below the diversification index's mean, while a value of one (fully diversified) was given to those above it. Our econometric findings, which are detailed subsequently, are based on the selection equation, which uses this binary variable as a sub-dependent variable.
Figure 3.
Agriculture diversification distribution flow estimation from 0 to 1.
5.2. Estimation of Correlation among Diversification and Socioeconomic Variable in a Matrix
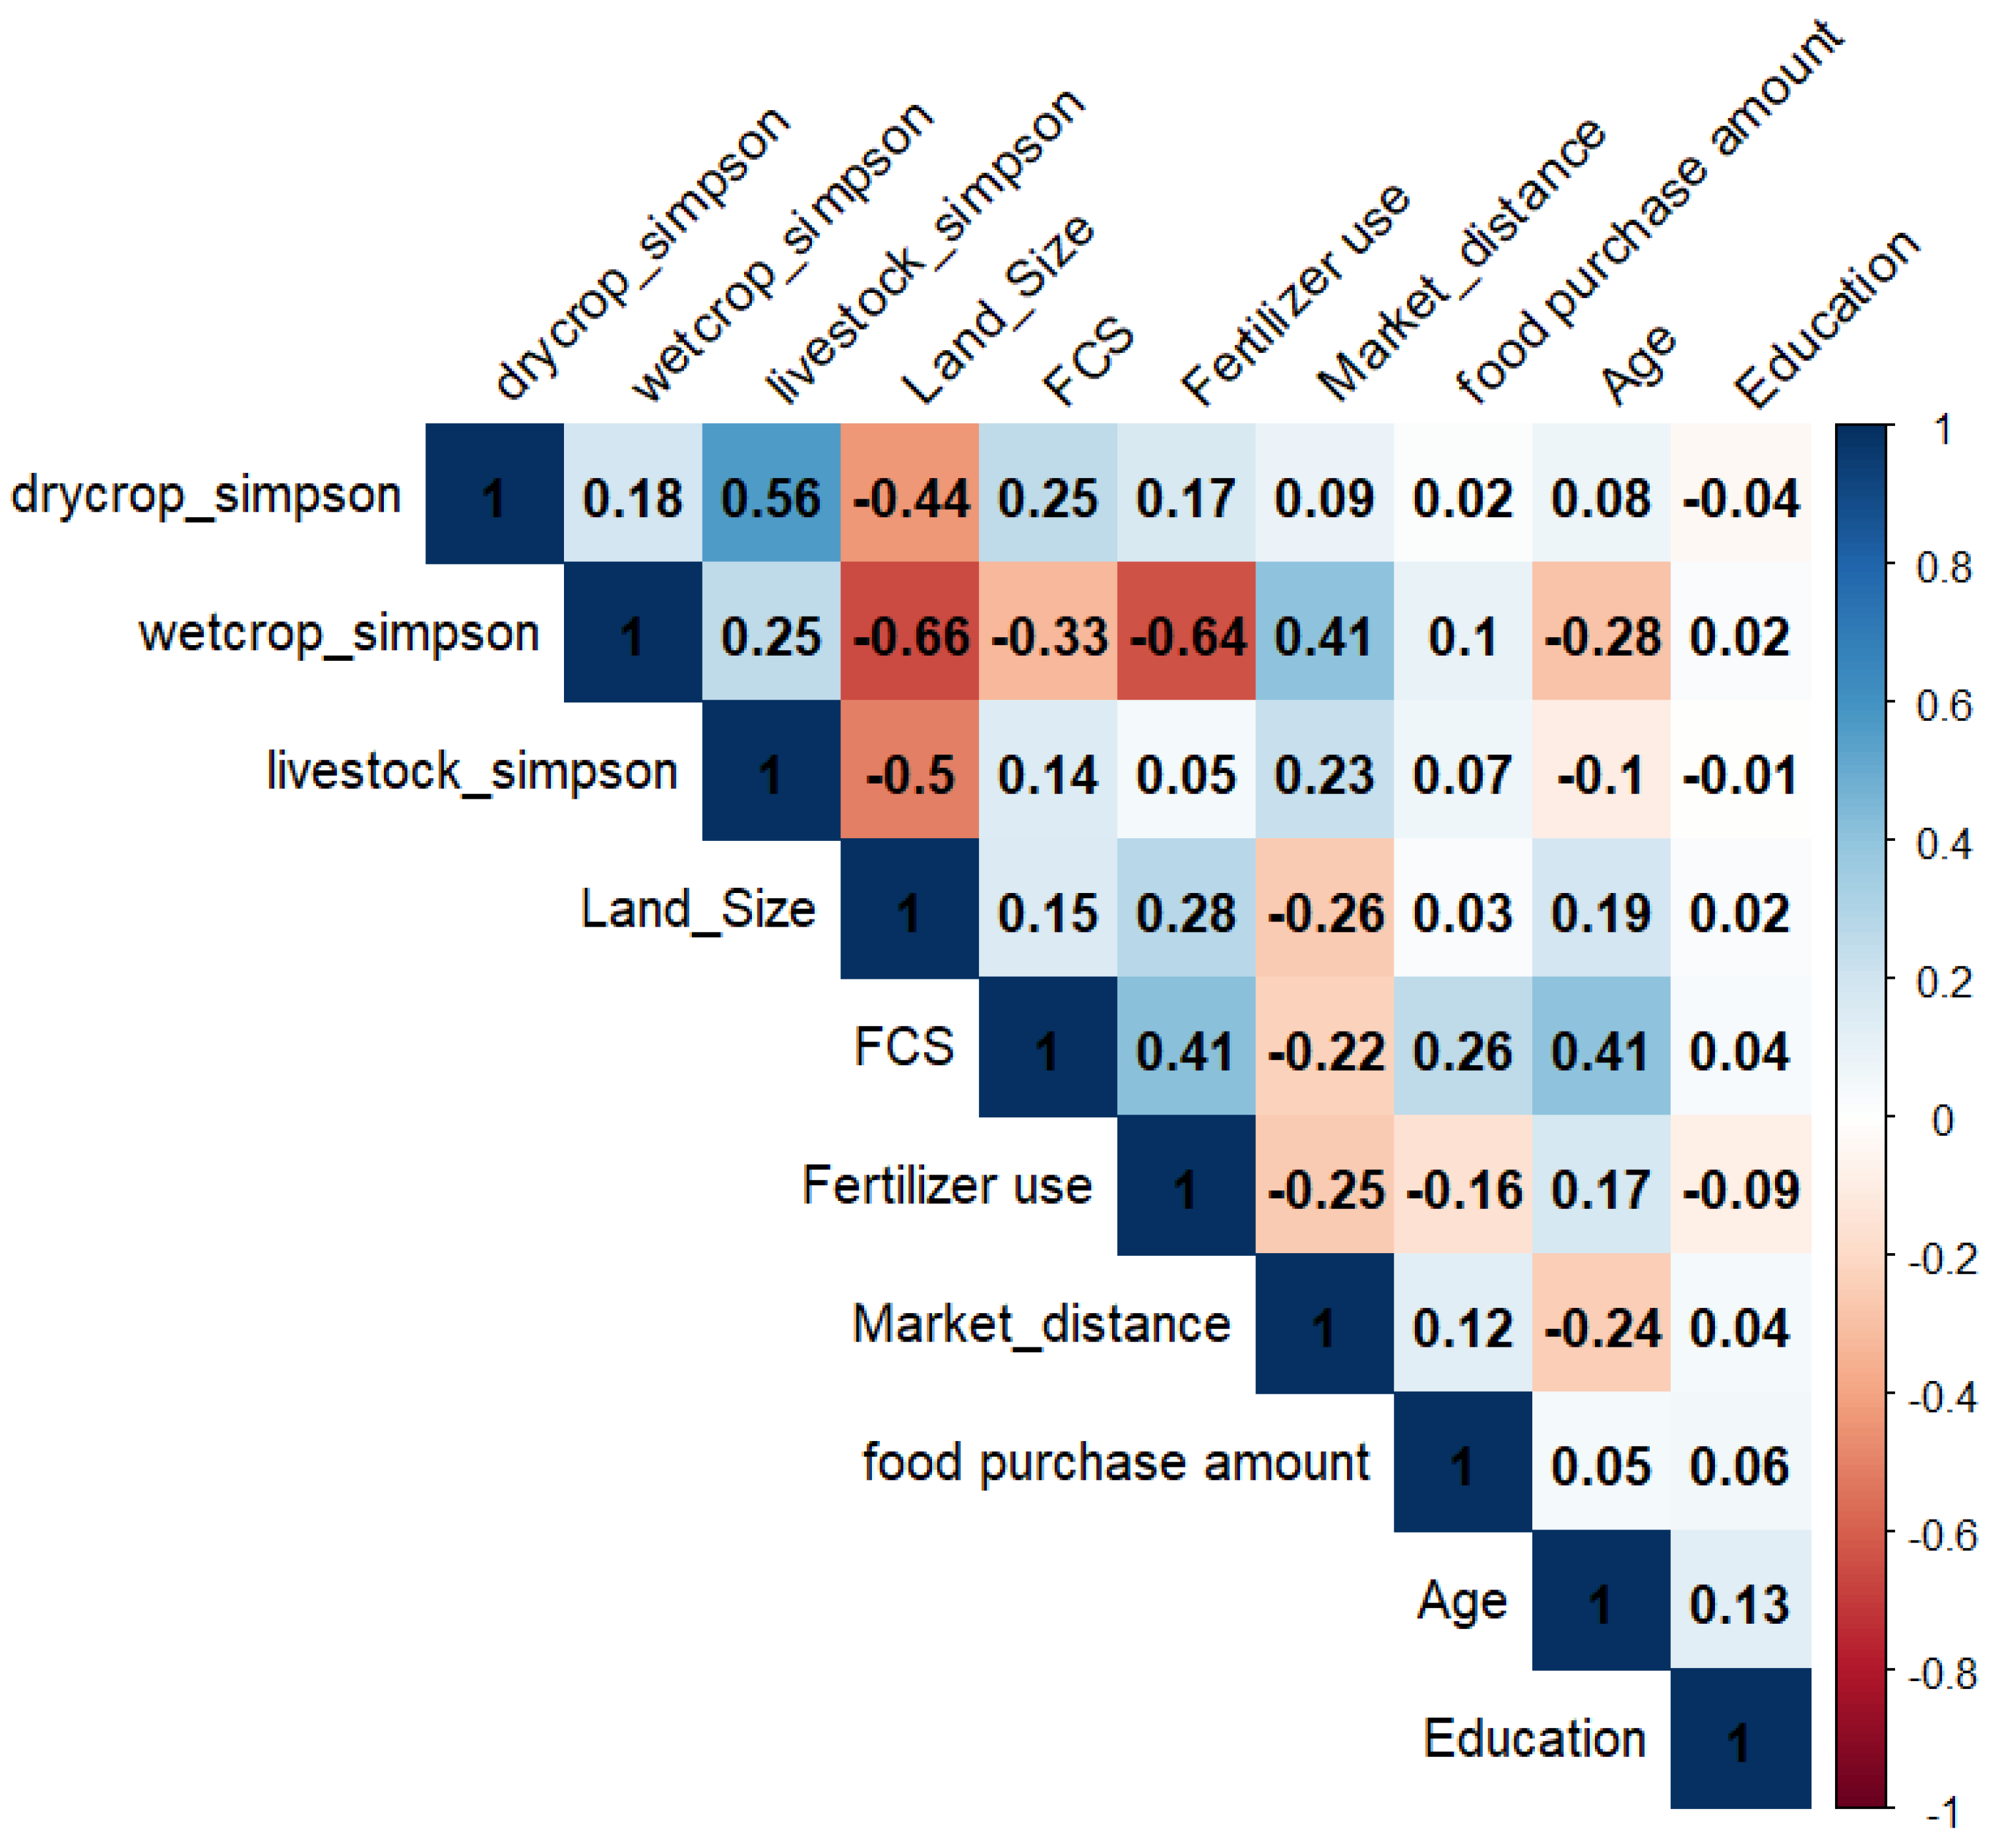
The correlation matrix heatmap visualizes the associative magnitudes among variables pertinent to socio-economic status and agricultural diversity. Coefficients within this matrix oscillate between -1 and 1, symbolizing a spectrum from negative to positive linear relationships, respectively. Notably, a pronounced positive linear relationship is observed between 'drycrop_simpson' and 'wetcrop_simpson', with a correlation coefficient of 0.56, suggesting a concurrent increase in both variables. Conversely, 'wetcrop_simpson' and 'Land_Size' exhibit a notable inverse relationship, with a correlation coefficient of -0.66. The heatmap employs gradations of blue to denote positive correlations and shades of red to denote negative correlations, with the depth of color intensity corresponding to the strength of the correlation.
Figure 2.
The heatmap depicts a correlation matrix focusing on agricultural diversification, household resources, and market-related factors. An asterisk (*) indicates that the correlation coefficient is statistically significant at the 5% level. Note: Land Size in Sq. Km, Fertilizer use in Kg per hector, Market distance in Km, Education in Count number, Income in Rupees.
Figure 2.
The heatmap depicts a correlation matrix focusing on agricultural diversification, household resources, and market-related factors. An asterisk (*) indicates that the correlation coefficient is statistically significant at the 5% level. Note: Land Size in Sq. Km, Fertilizer use in Kg per hector, Market distance in Km, Education in Count number, Income in Rupees.
5.3. Analysis of Agriculture Diversification and Dietary Diversity Score with Socioeconomic Variable
The table 2, presents the results of a regression analysis exploring the relationship between Dietary Diversity Score and three variable: Wet Season Crop Diversification, Dry Season Crop Diversification, and Livestock Diversification. The Wet Season Crop Diversification is significantly negatively associated with Dietary Diversity Score (Estimate = -13.008, p < 0.001), explaining approximately 21.58% of the variance in Dietary Diversity Score (R-square = 0.2158). Dry Season Crop Diversification is also significantly positively associated with Dietary Diversity Score (Estimate = 17.430, p = 0.00212). However, there is no significant association between Livestock Diversification and Dietary Diversity Score (p = 0.34618).
Larger food expenditures, nearby market access and higher agricultural income are positively connected with DDS, underscoring the significance of economic considerations in dietary variety. Males have a significantly higher estimate than females, as indicated by the t-value (2.89) and a significant p-value (0.00443**). Market Access (Distance KM) has a significant negative relationship with Dietary variety Score, according to the research (Estimate = -0.4305, p = 0.00623). This relationship shows that as market access distance grows, dietary variety declines. Food Purchase (NRs.) exhibits a statistically significant positive connection with Dietary Diversity Score (Estimate = 0.11179, p = 0.00163), indicating that dietary diversity and food spending are correlated. Agriculture-related income has a substantial positive impact on the Dietary Diversity Score as well (Estimate = 7.482e-05, p = 0.0036), however education, crop price, and non-agriculture-related income do not have a significant impact on the dietary score. The R-square values indicate that the model only adequately accounts for a small amount of the variation in the Dietary Diversity Score.
Table 3.
Various factor affecting the Food consumption patterns or Dietary Diversity score.
| Dietary Diversity Score | |||||||
|---|---|---|---|---|---|---|---|
| Category | Estimate | std. Error | t-value | P-Value | R-square | F-Value | |
| Gender | Male | 0.13328 | 0.04612 | 2.89 | 0.00443 ** | 0.05342 | 8.352 |
| Female | 0.03845 | 0.11318 | 0.34 | 0.735 | 0.000779 | 0.1154 | |
| Market access | Distance KM | -0.4305 | 0.1551 | -2.775 | 0.00623 ** | 0.04946 | 7.701 |
| Food purchase | NRs. | 0.11179 | 0.03482 | 3.210 | 0.00163 ** | 0.06511 | 10.31 |
| Income | Agriculture | 7.482e-05 | 2.529e-05 | 2.959 | 0.0036 ** | 0.0562 | 8.753 |
| Non-Agriculture | 7.028e-07 | 6.033e-06 | 0.116 | 0.907 | 9.167e-05 | 0.01357 | |
| Crop Price | NRs. | -0.001539 | 0.001869 | -0.824 | 0.411 | 0.6785 | 0.004564 |
| Education | Yes | 0.001755 | 0.004060 | 0.432 | 0.666 | 0.00126 | 0.1867 |
| No | 0.001551 | 0.008643 | 0.179 | 0.858 | 0.0002175 | 0.03219 | |
Analyzing the table for dry and wet season crop diversification, it appears Age has a significant negative correlation with wet season crop diversification (t = -3.61, p < 0.001) but not with dry season. Gender differences in crop diversification are significant in the dry season (p = 0.688) and wet season (p = 0.029), with males diversifying more in the latter. Land type shows a significant difference in diversification between lowland and upland, with upland showing strong positive correlation in both seasons. Irrigation mode is significant for rainfed and tube-well/boring with wet season diversification. Fertilizer use is significant in dry season (p < 0.05) and very significant in wet season (p < 0.001). Labor availability correlates significantly with diversification in both seasons, and market access shows a significant positive correlation with wet season diversification. Education, labor cost, and crop price does not show a significant correlation with crop diversification in either season.
Table 4.
Influence of various factors on Dry Season and Wet Season Crop Diversification in Nepal.
| Dry Season Crop Diversification | Wet Season Crop Diversification | ||||||||
| Variable | Categories | Mean | SD | t-value | P-value | F-Value | t-value | P-value | F-Value |
| Age | 43.478 | 3.869 | 0.930 | 0.354 | 0.8657 | -3.61 | 0.000*** | 13.06 | |
| Gender | Male | 27.87 | 15.16 | 0.402 | 0.688 | 0.1615 | -5.345 | 0.000 *** | 28.57 |
| Female | 6.79 | 6.35 | 2.198 | 0.029 * | 4.833 | -1.042 | 0.299 | 1.085 | |
| Land Type | Lowland | 88.38 | 63.207 | 0.318 | 0.751 | 0.1011 | -14.89 | 0.000*** | 221.7 |
| Upland | 100.95 | 78.047 | 3.502 | 0.0006 *** | 12.26 | 10.08 | 0.000*** | 101.6 | |
| Irrigation Mode | Canal | 37.05 | 24.181 | 1.908 | 0.0583. | 3.641 | -1.029 | 0.305 | 1.059 |
| Rainfed | 134.74 | 74.7996 | 3.49 | 0.0006 *** | 12.18 | 4.851 | 0.000*** | 23.53 | |
| Well | 0.4667 | 1.45937 | 1.501 | 0.136 | 2.253 | 0.11 | 0.912 | 0.01214 | |
| Pond/Tank | 0.5533 | 1.50853 | 0.191 | 0.849 | 0.03657 | 1.482 | 0.14 | 2.197 | |
| Tube-well/Boring | 15.967 | 30.5171 | -0.645 | 0.52 | 0.4163 | -18.22 | 0.000*** | 332.1 | |
| Fertilizer | Yes | 63.087 | 52.2349 | 2.083 | 0.039 * | 4.337 | -10.12 | 0.000*** | 102.4 |
| No | 57.04 | 28.4192 | -0.899 | 0.37 | 0.8073 | -2.524 | 0.0127 * | 6.37 | |
| Fertilizer cost | NRs. | 1124.2 | 1073.92 | 1.038 | 0.301 | 1.078 | -11.68 | 0.000*** | 136.5 |
| Pesticide | Yes | 23.88 | 31.0548 | 0.086 | 0.932 | 0.0073 | -11.56 | 0.000*** | 133.6 |
| No | 96.253 | 45.1027 | 1.771 | 0.0786. | 3.136 | -5.225 | 0.000*** | 27.3 | |
| Pesticide cost | NRs. | 153.74 | 228.699 | -0.099 | 0.922 | 0.009713 | -4.985 | 0.000*** | 24.85 |
| Labor availability | Yes | 46.893 | 33.3517 | 2.109 | 0.037 * | 4.45 | -6.475 | 0.000*** | 41.92 |
| No | 73.24 | 41.1260 | 0.301 | 0.764 | 0.0907 | -8.481 | 0.000*** | 71.93 | |
| Labor Cost | NRs. | 1481.0 | 1127.01 | 1.518 | 0.131 | 2.304 | -1.437 | 0.153 | 2.065 |
| Crop Price | NRs. | 228.51 | 383.856 | 0.957 | 0.34 | 0.9162 | 0.478 | 0.634 | 0.2281 |
| Market Access | Distance KM | 6.3405 | 4.51879 | 1.102 | 0.272 | 1.214 | 5.461 | 0.000*** | 29.82 |
| Education | Yes | 363.75 | 176.968 | -0.448 | 0.655 | 0.2004 | 0.275 | 0.783 | 0.07585 |
| No | 152.45 | 83.17916 | -0.562 | 0.575 | 0.3163 | 0.229 | 0.819 | 0.05237 | |
In the context of livestock diversification, gender exhibits significant differences, with females showing higher diversity (t-value = 2.003, p-value = 0.047*).Age and Land Type (Lowland) do not show a significant relationship. However, Land Type (Upland) demonstrates a significant positive effect (estimate = 0.0002019, t = 4.487, p < 0.001). Irrigation Mode (Canal) has a marginally significant positive effect (p < 0.05), and Rainfed shows a highly significant positive effect (p < 0.001) on livestock diversification. Labor availability does not significantly influence livestock diversification. Market Access, measured by distance in kilometers, has a significant positive effect on livestock diversification (estimate = 0.0023860, t = 2.965, p < 0.01). Labor Cost shows no significant effect.
Table 5.
Various factor associated with Livestock diversification in Nepal.
| Livestock Diversification | |||||||
| Variable | Categories | Mean | SD | Estimate | t-value | P-value | F-Value |
| Age | 43.478 | 3.869 | -0.00114 | -1.18 | 0.237 | 1.413 | |
| Gender | Male | 27.87 | 15.16 | -0.0001084 | -0.44 | 0.661 | 0.1933 |
| Female | 6.79 | 6.35 | 0.0011650 | 2.003 | 0.047 * | 4.013 | |
| Land Type | Lowland | 88.38 | 63.207 | -6.972e-05 | -1.183 | 0.239 | 1.399 |
| Upland | 100.953 | 78.047 | 2.019e-04 | 4.487 | 0.000*** | 20.13 | |
| Irrigation Mode | Canal | 37.05 | 24.181 | 0.0003093 | 2.026 | 0.0445 * | 4.105 |
| Rainfed | 134.74 | 74.79964 | 1.685e-04 | 3.504 | 0.000*** | 12.28 | |
| Labor availability | Yes | 46.8933 | 33.3517 | -5.166e-05 | -0.461 | 0.646 | 0.2123 |
| No | 73.24 | 41.1260 | -5.530e-05 | -0.608 | 0.544 | 0.3702 | |
| Labor Cost | NRs. | 1481.04 | 1127.01 | 5.497e-07 | 0.166 | 0.869 | 0.02741 |
| Market Access | Distance KM | 6.34048 | 4.51879 | 0.0023860 | 2.965 | 0.00353 ** | 8.792 |
| Education | Yes | 363.75 | 176.968 | -2.904e-06 | -0.137 | 0.891 | 0.01885 |
| No | 152.45 | 83.17916 | -5.941e-05 | -1.328 | 0.186 | 1.764 | |
5.4. Discussion
5.4.1. Season Crop and Livestock Diversification in Relationship with Dietary Diversity
The adverse correlation from table 2, may indicate that dietary diversity declines as wet-season crop diversification rises. This could be due to farmers focusing on a limited number of staple crops like rice and maize during the wet season, leading to a reduced assortment of foods being consumed. Also, image 3 and table 4 suggests that crop diversification during the wet season is lower in the Terai, or lowland areas, compared to the hilly or upland regions of Nepal. This trend is attributed to waterlogging in the Terai region, which compels farmers to predominantly cultivate rice. A decline in the production of some nutrient-rich crops that contribute to nutritional variety might, on the other hand, result from increasing diversification in wet season crops (Uddin, 2019, Sienso et al., 2022). The dry season might allow for the cultivation of alternative and nutritionally diverse crops like legumes, millets, and certain vegetables, which can enhance dietary diversity (Mustafa et al., 2019). In many Nepalese communities, livestock, especially larger animals like cattle and buffalo, are often seen as capital assets rather than food sources. Thus, even if there's livestock diversification, it might not translate directly into dietary diversity. The diversity of livestock products (such as milk, eggs, and meat) can have an impact on dietary diversity even if livestock diversification may not have a direct impact on it (Hoffmann and Baumung, 2013, Berti, 2015). The lack of significance between the two variables may suggest that dietary habits for livestock products are similar across various animal diversities (Waseem et al., 2023, Parvathi, 2018).
5.4.2. Factor Associated with Dietary Diversity in Consumption
Aging individuals often become more discerning regarding dietary choices and intake, yet alterations in consumption and variety may escalate the risk of nutrition-related disorders (Drewnowski and Shultz, 2001), with national-level data indicating a correlation between advancing age and enhanced Food Consumption Scores (FCS). Market proximity enhances dietary diversity by enabling easier access to assorted nutritious foods, including fresh produce and meats (Alam et al., 2023). Nutritional outcomes in smallholder farmers are contingent on market functionality and intra-household income management as shown in image 6. Access to nearby markets and the generation of high-income enable smallholder farmers to purchase a diverse array of food products (Sibhatu et al., 2015), which allows for a shift in consumption from homegrown produce to processed foods, potentially affecting human health. Lower household incomes, typically linked with poorer dietary quality, can inversely affect the diversity of food production and consumption. So, targeting household food expenditures could be a key strategy to enhance diet quality in low-income groups, contingent on the affordability of food items (French et al., 2019). Besides all this, education and gender aspects have a positive impact on household dietary decisions and food security because, female education and empowerment are pivotal in altering household dietary practices, improving nutrition, and thus influencing diet-related health outcomes in developing countries (Lufuke et al., 2022).
5.4.3. Effect of Variable in Agriculture Diversification
Geographic (Land type) and climatic variations significantly influence agricultural diversity, with the Bari (upland) region's farming in dry and wet seasons including livestock showing high diversification due to efficient natural resource use and lower input costs for fertilizers, pesticides, and labor, as Table 4 illustrates. Cropping diversification enhances the economic viability and social acceptability of sustainable upland agriculture but intensive use of agrochemicals and hybrid seeds is reducing soil fertility and increasing farmer reliance on external inputs, compromising long-term sustainability (Tiwari et al., 2008). In Khet (lowland) regions prone to waterlogging, crop diversity decreases during the wet season due to reliance on tube wells and rainfed irrigation, indicating that water management costs affect crop selection, resulting in farmers achieving only 76% of the maximum rice farming potential. (Bell and Seng, 2003, Choudhary et al., 2022). The diversification of crops and livestock on farms is largely attributed to female farmers, with evidence showing that over 74% of women actively participate in the decision-making processes related to farming practices (Tamang et al., 2014). Furthermore, Increased labor and farmer experience (older age farmer’s) enhance dry-season crop variety, whereas labor scarcity hampers diversification in wet seasons. However, few agricultural models consider labor supply as a decisive factor in farming choices, even though labor is crucial for producing many fruits and vegetables (Beal Cohen et al., 2020). These findings imply that farmers near markets tend to focus on a narrower range of high-demand crops, whereas those farther away choose diversification to mitigate risks. Proximity to markets is key for agricultural diversification; farmers tend to diversify when markets are within easy reach, easing the sale of produce and mitigating market competition risks (Alam et al., 2023). Diversification on farms can increase and stabilize income to a threshold, beyond which it may decrease income due to lost specialization advantages (Sibhatu et al., 2015). The limited influence of education suggests it may not be a critical factor in crop selection or that other factors outweigh its significance.
5.4.4. Important Correlation Matrix Factor of Agriculture Diversification and Dietary Diversity with Socioeconomic Variable
Access to nearby markets will lead farmers to engage in selling farm produce can enhance dietary variety by increasing household income and introducing a broader food selection. This can lead to better nutrition, particularly for women and children in low-income areas who often face restricted food diversity. Enhancing market access and income diversification for smallholder farmers is key to improving dietary quality and food security. Investments in rural infrastructure and market facilities are recommended to facilitate market access, reduce transportation costs, and save time (Alam et al., 2023). The fragmentation of agricultural land in Nepal presents a potential avenue for diversifying agriculture and utilizing a community or group-based approach is recommended to enhance agricultural performance. Farmland fragmentation is linked to diversified food sources, encompassing aspects such as food quality, acceptability, accessibility, and local community autonomy at the individual and household levels. Conversely, at broader scales like the community, region, and country, consolidating farmland often correlates with increased total food production and availability (Ntihinyurwa and de Vries, 2021). Furthermore, the enhancement of cropping intensity is influenced by both irrigation facilities and a diverse range of crops cultivated. For instance, shifting from water-intensive crops (e.g., paddy or sugarcane) to pulses in the Rabi (dry) season may not require many irrigation facilities leading to an inverse relationship between the two (Paria et al., 2021). In Nepal's context, diversifying the crop portfolio not only reduces the impact of drought in Upland regions but also improves water utilization efficiency and boosts crop yields.
6. Conclusions and Policy Recommendation
The findings of this research indicate that the strategic diversification of farming practices across seasons can substantially enhance dietary diversity, suggesting that adopting agricultural diversification models that prioritize resilience, sustainability, economic viability, maximized food output, and environmental conservation can contribute to resolving the dual global predicament of ensuring food security for an expanding population and alleviating severe malnutrition through improved dietary variety. The study indicates a requirement for enhanced market accessibility to augment the diversity of both production and dietary intake within small-scale farming households. It is recommended to prioritize agricultural diversification strategies that focus on geographical elevation variations, and gender sensitivity, adjust for seasonal changes, improve irrigation systems, and optimize fertilizer application. Furthermore, factors such as the age and income of household members, proximity to markets, and the cost of food purchases are key determinants of household dietary diversity. From a policy standpoint, government entities and development agencies must target geographically isolated upland regions in the dry season, providing adequate market infrastructure and technical support to optimize agricultural diversification and ensure nutritional variety. The findings reveal that while the relationship is not statistically significant, the provision of extension education and market price information to farming households is essential for diversifying agricultural outputs and securing access to nutritionally dense foods.
7. Limitation and Challenges
Despite the data's temporal limitations, they yielded pertinent insights for a newly proposed project; nonetheless, several constraints were encountered, including potential data bias, omission of critical variables linked to the theoretical framework, and measurement errors such as missing values assumed to be zero. Moreover, temporal variability, like seasonal shifts in dietary patterns, adds complexity and the novelty of analyzing this dataset with R statistical software and the vegan package introduces additional challenges and constraints.
Acknowledgments
Gratitude is extended to the Australian Centre for International Agricultural Research (ACIAR) for providing an internship opportunity, and profound appreciation is directed towards the principal supervisor Professor Craig Johns, mentor Dr. Tamara Jackson from the ACIAR project lead, as well as Professors Dr. Adam Loch and Dr. Di Zeng for their invaluable guidance and mentorship. Data were collected and available in The World Bank; https://microdata.worldbank.org/index.php/catalog/3705.
Appendix A
Table A2.
The World Food Program (WFP) designed the food group frequency weight to measure the dietary diversity Score (DDS) or Food consumption score (FCS) by an individual within a week.
Table A2.
The World Food Program (WFP) designed the food group frequency weight to measure the dietary diversity Score (DDS) or Food consumption score (FCS) by an individual within a week.
| S. No. | Food items | Food Group | weight |
| 1 | Rice, Beaten, flattened rice, Maize, Maize flour, Wheat flour, Millet, Barley | Cereals and field crops | 2 |
| 2 | Lentil (Black gram), Horse Gram, Beans (Greengram, masyaura) | Beans | 3 |
| 3 | Potatoes, Onions, Tomatoes, Green leafyvegetables , Other vegetables | Vegetable | 1 |
| 4 | Fruits , Dried fruits and nuts (coconut, cashew, dates etc) | Fruit | 1 |
| 5 | Fish, Mutton, Buffalo meat, Chicken, Other meats (Pig, Boar, Duck) | Fish and Meat | 4 |
| 6 | Eggs, Milk, Powder milk, Curd/Whey, Other milk products (cheese, paneer) | Egg and Milk | 4 |
| 7 | Sugar , Gur (Sakhar ), Sweets (Mithai ), Tea (dried leaves)/ Coffee (ground, instant), Other Non Alcohoblic (Fruit Juice,Coca cola, Pepsi) | Sugar | 0.5 |
| 8 | Ghees, Vegetable oil, Mustard oil, Other oil (soya, sunflower, corn etc) | Oils | 0.5 |
| 9 | All Type of Alcohol, Cigarettes , Tobacco, jarda, khaini, beetle, Misc. other food expenditures, None, Salt , Other spices and condiments (Coriander, nutmeg) | Condiments | 0 |
| (Douyon et al., 2022b) | |||
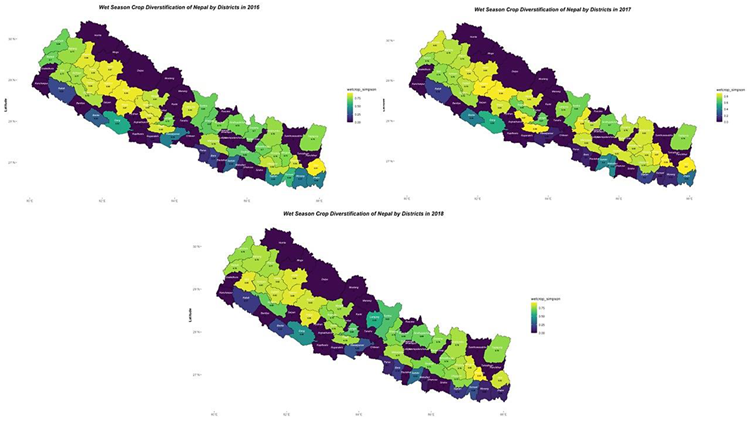
Image 3. Crop diversification in Nepal during wet-season from 2016-2018.
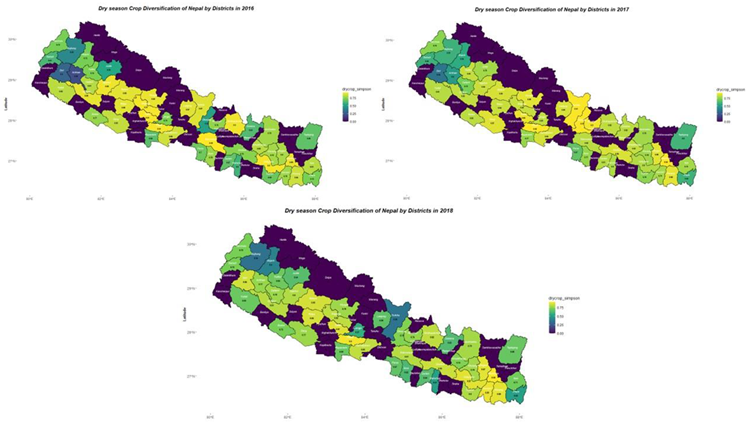
Image 4. Crop diversification in Nepal During Dry-season from 2016-2018.
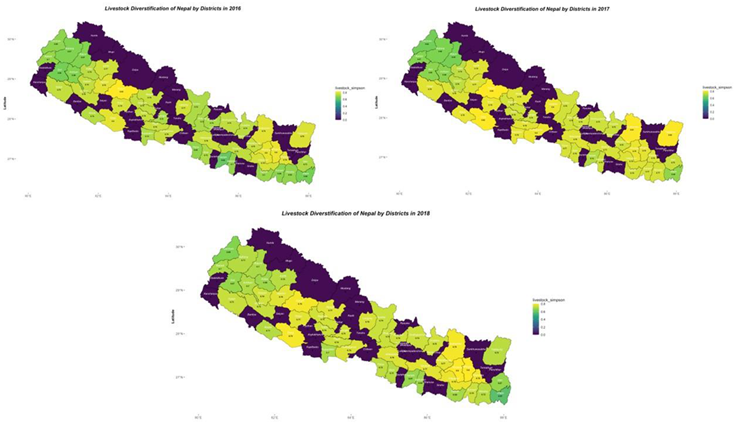
Image 5. Livestock diversification in Nepal from 2016-2018.
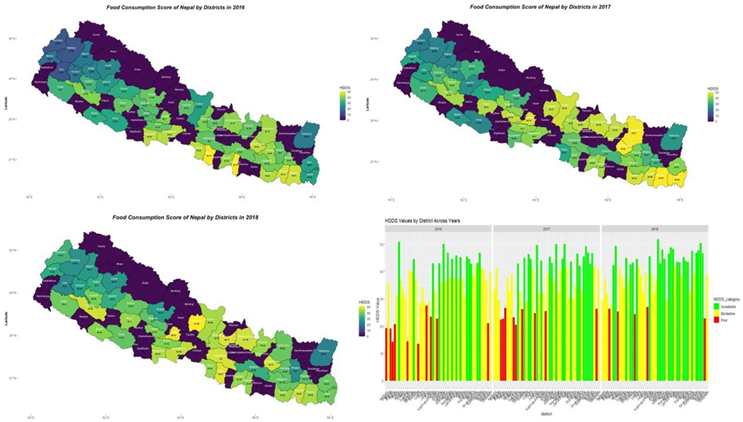
Image 6. Dietary diversity score pattern in Nepal from 2016-2018.
References
- ACHARYA, A. K., PAUDEL, M. P., WASTI, P. C., SHARMA, R. D. & DHITAL, S. 2018. Status Report on Food and Nutrition Security in Nepal. Ministry of Agriculture, Land Management and Cooperatives, Kathmandu, Nepal.
- ADB 2023. ADB Estimates Nepal’s Economy to Moderate in FY2023. Asian Development Bank.
- Alam, Mohammad Jahangir, Begum, Ismat Ara, Mastura, Tamanna, Kishore, Avinash, Woodhill, Jim, Chatterjee, Kuhu, and Tamara Jackson. 2023. Agricultural diversification and intra-household dietary diversity: Panel data analysis of farm households in Bangladesh. PLOS ONE 18: e0287321. [CrossRef]
- Appiah-Twumasi, Mark, and Maxwell Anamdare Asale. 2022. Crop diversification and farm household food and nutrition security in Northern Ghana. Environment, Development and Sustainability 26: 157–185. [CrossRef]
- AWAZI, N. P. & TCHAMBA, N. 2019. Enhancing agricultural sustainability and productivity under changing climate conditions through improved agroforestry practices in smallholder farming systems in sub-Saharan Africa. African Journal of Agricultural Research, 14, 379-388.
- Baba, Abdul Razak, and Abdul-Malik Abdulai. 2020. Determinants of Crop Diversification and Its Effects on Household Food Security in Northern Ghana. Arthaniti: Journal of Economic Theory and Practice 20: 227–245. [CrossRef]
- BARGHOUTI, S., GARBUS, L. & UMALI, D. L. 1992. Trands in Agricultural Diversification; Regional Perspectives.
- Cohen, Allegra A. Beal, Judge, Jasmeet, Muneepeerakul, Rachata, Rangarajan, Anand, and Zhengfei Guan. 2020. A model of crop diversification under labor shocks. PLOS ONE 15: e0229774. [CrossRef]
- BELL, R. & SENG, V. Rainfed lowland rice-growing soils of Cambodia, Laos, and North-east Thailand. CARDI International Conference on Research on Water in Agricultural Production in Asia for the 21st Century, 2003.
- Berti, Peter R.. 2015. Relationship between production diversity and dietary diversity depends on how number of foods is counted. Proceedings of the National Academy of Sciences 112: E5656–E5656. [CrossRef]
- Cassman, Kenneth G., and Patricio Grassini. 2020. A global perspective on sustainable intensification research. Nature Sustainability 3: 262–268. [CrossRef]
- Choudhary, Dyutiman, Banskota, Kamal, Khanal, Narayan Prasad, McDonald, Andrew James, Krupnik, Timothy J., and Olaf Erenstein. 2022. Rice Subsector Development and Farmer Efficiency in Nepal: Implications for Further Transformation and Food Security. Frontiers in Sustainable Food Systems, 5. [CrossRef]
- Dizon, Felipe, Wang, Zetianyu, and Prajula Mulmi. 2021. The Cost of a Nutritious Diet in Bangladesh, Bhutan, India, and Nepal.,. [CrossRef]
- Douyon, Adama, Worou, Omonlola Nadine, Diama, Agathe, Badolo, Felix, Denou, Richard Kibarou, Touré, Sidi, Sidibé, Amadou, Nebie, Baloua, and Ramadjita Tabo. 2022. Impact of Crop Diversification on Household Food and Nutrition Security in Southern and Central Mali. Frontiers in Sustainable Food Systems, 5. [CrossRef]
- Douyon, Adama, Worou, Omonlola Nadine, Diama, Agathe, Badolo, Felix, Denou, Richard Kibarou, Touré, Sidi, Sidibé, Amadou, Nebie, Baloua, and Ramadjita Tabo. 2022. Impact of Crop Diversification on Household Food and Nutrition Security in Southern and Central Mali. Frontiers in Sustainable Food Systems, 5. [CrossRef]
- Drewnowski, A, and J M Shultz. 2001. Impact of aging on eating behaviors, food choices, nutrition, and health status.. 5: 75–9.
- French, Simone A., Tangney, Christy C., Crane, Melissa M., Wang, Yamin, and Bradley M. Appelhans. 2019. Nutrition quality of food purchases varies by household income: the SHoPPER study. BMC Public Health 19: 1–7. [CrossRef]
- GUPTA, D., SUJATHA, H., SATYAPRIYA, S. B., PRAKASH, S. & CHATURVEDI, N. 2021. Agri-Nutri Strategies to Overcome Malnutrition.
- HOFFMANN, I. & BAUMUNG, R. 2013. The role of livestock and livestock diversity in sustainable diets. Diversifying food and diets: using agricultural biodiversity to improve nutrition and health, 68-87.
- Jones, Andrew D. 2017. Critical review of the emerging research evidence on agricultural biodiversity, diet diversity, and nutritional status in low- and middle-income countries. Nutrition Reviews 75: 769–782. [CrossRef]
- JOSHI, D. R. 2023. Urbanization Trend in Nepal. Contemporary Research: An Interdisciplinary Academic Journal, 6, 51-62.
- Karki, Sikha, Burton, Paul, and Brendan Mackey. 2020. Climate change adaptation by subsistence and smallholder farmers: Insights from three agro-ecological regions of Nepal. Cogent Social Sciences, 6. [CrossRef]
- Khanal, Narendra Raj, Nepal, Pashupati, Zhang, Yili, Nepal, Govind, Paudel, Basanta, Liu, Linshan, and Raju Rai. 2020. Policy provisions for agricultural development in Nepal: A review. Journal of Cleaner Production 261: 121241. [CrossRef]
- Liu, Ying, Yang, Yanzhao, Zhang, Chao, Xiao, Chiwei, and Xinzhe Song. 2023. Does Nepal Have the Agriculture to Feed Its Population with a Sustainable Diet? Evidence from the Perspective of Human–Land Relationship. Foods 12: 1076. [CrossRef]
- LUFUKE, M., BAI, Y., FAN, S. & TIAN, X. 2022. Women’s Empowerment, Food Security, and Nutrition Transition in Africa. International Journal of Environmental Research and Public Health, 20, 254.
- Mustafa, M. A., Mayes, S., and F. Massawe. 2019. Crop Diversification Through a Wider Use of Underutilised Crops: A Strategy to Ensure Food and Nutrition Security in the Face of Climate Change., 125–149. [CrossRef]
- NTIHINYURWA, P. D. & DE VRIES, W. T. 2021. Farmland fragmentation, farmland consolidation and food security: relationships, research lapses and future perspectives. Land, 10, 129.
- Pandey, A., Tripathi, K., and S. Devkota. 2021. Emigration and Feminization in Nepalese Agriculture: Implications for Food Security. Journal of Agriculture and Environment 22: 17–30. [CrossRef]
- Paria, Bidur, Pani, Amartya, Mishra, Pulak, and Bhagirath Behera. 2021. Irrigation-based agricultural intensification and future groundwater potentiality: experience of Indian states. SN Applied Sciences 3: 1–22. [CrossRef]
- Parvathi, Priyanka. 2018. Does mixed crop-livestock farming lead to less diversified diets among smallholders? Evidence from Laos. Agricultural Economics 49: 497–509. [CrossRef]
- Pellegrini, Lorenzo, and Luca Tasciotti. 2014. Crop diversification, dietary diversity and agricultural income: empirical evidence from eight developing countries. Canadian Journal of Development Studies / Revue canadienne d'études du développement 35: 211–227. [CrossRef]
- Rahm, Michael R., and Wallace E. Huffman. 1984. The Adoption of Reduced Tillage: The Role of Human Capital and Other Variables. American Journal of Agricultural Economics 66: 405–413. [CrossRef]
- Romeo, Alessandro, Meerman, Janice, Demeke, Mulat, Scognamillo, Antonio, and Solomon Asfaw. 2016. Linking farm diversification to household diet diversification: evidence from a sample of Kenyan ultra-poor farmers. Food Security 8: 1069–1085. [CrossRef]
- RUEL, M. T., QUISUMBING, A. R. & BALAGAMWALA, M. 2018. Nutrition-sensitive agriculture: what have we learned so far? Global food security, 17, 128-153.
- Kurien, C. T., and Amartya Sen. 1983. Poverty and Famines: An Essay on Entitlement and Deprivation. Social Scientist 11: 66. [CrossRef]
- Sibhatu, Kibrom T., Krishna, Vijesh V., and Matin Qaim. 2015. Production diversity and dietary diversity in smallholder farm households. Proceedings of the National Academy of Sciences 112: 10657–10662. [CrossRef]
- University for Development Studies,, Sienso, G, Lyford, C, Texas Tech University,, and W Oldewage-Theron. 2022. Using instrumental variables to establish the relationship between household production diversity and household dietary diversity in northern Ghana. THE AFRICAN JOURNAL OF FOOD, AGRICULTURE, NUTRITION AND DEVELOPMENT 22: 21036–21055. [CrossRef]
- TAMANG, S., PAUDEL, K. P. & SHRESTHA, K. K. 2014. Feminization of agriculture and its implications for food security in rural Nepal. Journal of Forest and Livelihood, 12, 20-32.
- THAPA, G., KUMAR, A. & JOSHI, P. K. 2017. Agricultural diversification in Nepal: Status, determinants, and its impact on rural poverty, Intl Food Policy Res Inst.
- Tiwari, Krishna R., Nyborg, Ingrid L.P., Sitaula, Bishal K., and Giridhari S. Paudel. 2008. Analysis of the sustainability of upland farming systems in the Middle Mountains region of Nepal. International Journal of Agricultural Sustainability 6: 289–306. [CrossRef]
- Tripathi, Damodar, and Tika Raj Kaini. 2023. Nepal: Need for an Alternative Food System. Asian Journal of Population Sciences, 80–89. [CrossRef]
- UDDIN, M. R. 2019. Crop Diversification, Dietary Diversity and Nutrition. The Bangladesh Development Studies, 42, 111-133.
- WALKER, T. & JACOBY, H. 2016. Nepal Household Risk and Vulnerability Survey (HRVS) Wave III. Dataset downloaded from Nepal-Household Risk and Vulnerability Survey, Full Panel, 2018, 2016-2018.
- Waseem, Muhammad, Li, Xiaoyun, Jamil, Ihsan, Islam, Abu Hayat Md. Saiful, Abbas, Qasir, Raza, Muhammad Haseeb, and Moataz Eliw. 2023. Do crop diversity and livestock production improve smallholder intra-household dietary diversity, nutrition and sustainable food production? Empirical evidence from Pakistan. Frontiers in Sustainable Food Systems, 7. [CrossRef]
- YUE, W., HAO, H. & WUYANG, H. 2022. Agricultural production structure, market conditions and farmers’ nutritional intake in rural China. Journal of Integrative Agriculture, 21, 1812-1824.
Table 1.
Household respondent data frame from 2016 and 2018.
| Years | Participants No. | Response Rate | Household Added |
|---|---|---|---|
| 2016 | 5,654 | 94% | |
| 2017 | 5,835 | 97% | 165 |
| 2018 | 6,051 | 100.84% | 192 |
Table 2.
Relationship between Dietary Diversity Score and Agriculture Diversification.
| Dietary Diversity Score | |||||||
|---|---|---|---|---|---|---|---|
| Median | Estimate | std. Error | t-value | P-Value | R-square | F-Value | |
| Wet season Crop Diversification | 1.120 | -13.008 | 2.449 | -5.312 | 3.97e-07 *** | 0.2158 | 13.39 |
| Dry Season Crop Diversification | 17.430 | 5.571 | 3.129 | 0.00212 ** | |||
| Livestock Diversification | 16.452 | 17.408 | 0.945 | 0.34618 | |||
Note: Significant codes: 0 ‘***’, 0.001 ‘**’, 0.01 ‘*’, 0.05 ‘.’, 0.1 ‘’, 1.
Disclaimer/Publisher’s Note: The statements, opinions and data contained in all publications are solely those of the individual author(s) and contributor(s) and not of MDPI and/or the editor(s). MDPI and/or the editor(s) disclaim responsibility for any injury to people or property resulting from any ideas, methods, instructions or products referred to in the content. |
© 2024 by the authors. Licensee MDPI, Basel, Switzerland. This article is an open access article distributed under the terms and conditions of the Creative Commons Attribution (CC BY) license (http://creativecommons.org/licenses/by/4.0/).
Copyright: This open access article is published under a Creative Commons CC BY 4.0 license, which permit the free download, distribution, and reuse, provided that the author and preprint are cited in any reuse.


