
Submitted:
24 September 2024
Posted:
24 September 2024
You are already at the latest version
Abstract
The URAT1 protein is crucial in absorbing urate in human kidneys. A recent study showed that that Xenopus tropicalis (tropical clawed frog) appears to lack renal urate transporters. This finding raises questions regarding the origin of the SLC22A12 gene which encodes URAT1. The origin of the SLC22A12 gene is being discussed through two hypotheses. The first hypothesis, termed the URAT1-early hypothesis, posits that SLC22A12 was present in the common ancestor of tetrapods and was subsequently lost in amphibian lineages. The second hypothesis, the URAT1-late hypothesis, suggests that the SLC22A12 gene arose uniquely within the lineage leading to mammals. The purpose of this study is to determine which hypothesis is more reasonable for describing the origin of SLC22A12. This study suggests that the SLC22A12 gene the SLC22A12 gene was generated via a fusion of the SLC22A6 and SLC22A20 genes. Thus, the URAT1-late hypothesis is more likely to explain the origin of the SLC22A12 gene. X. tropicalis lacks the SLC22A12 gene, probably because the emergence of SLC22A12 occurred after the divergence of the ancestors of mammals and amphibians. The evolutionary studies of the SLC22A12 will offer valuable insights on how to choose model organisms for studies of the uric acid transporter URAT1.

Keywords:
Uric acid transporter
; Gout
; Hyperuricemia
; Gene fusion
; Molecular Evolution
; Mammal
1. Introduction
Gout is one of the most common types of inflammatory arthritis caused by hyperuricemia. The balance between production of urate and urate excretion pathways determines an individual's serum urate levels [1]. URAT1 is urate-anion exchanger that affects serum urate level via urate reabsorption in human kidneys [2,3,4]. URAT1 is encoded by the SLC22A12 gene, which belongs to the SLC22 protein family [5]. The variants on the SLC22A12 gene have been tested for urate transport activity of URAT1 protein using an in vitro expression system in Xenopus laevis (African clawed frog) oocytes [6,7,8,9,10].
A recent study showed that that Xenopus tropicalis (tropical clawed frog), which is a close relative of X. laevis, appears to lack the full complement of renal urate transporters [11]. This finding raises questions regarding the origin of on the SLC22A12 gene. In this paper, two hypotheses are proposed about the evolutionary history of the SLC22A12 gene. The first hypothesis, termed the URAT1-early hypothesis, posits that SLC22A12 was present in the common ancestor of tetrapods and was subsequently lost in amphibian lineages. The second hypothesis, the URAT1-late hypothesis, suggests that the SLC22A12 gene arose uniquely within the lineage leading to mammals, potentially as a result of gene duplication or fusion events.
The objective of this study is to assess whether the URAT1-early hypothesis or the URAT1-late hypothesis is more plausible through a molecular evolutionary analysis of the SLC22 gene family.
2. Results
2.1. Homology Search and Window Analyses
Homology search revealed that SLC22A1–SLC22A17, SLC22A20P, SLC22A23, and SLC22A25 were homologous to SLC22A12 as shown by Mihaljevic et al. [5]. SLC22A6 and SLC22A20P were selected as the closest candidate genes to SLC22A12 based on the homology search results. SLC22A7 was chosen as an outgroup. SLC22A6 and SLC22A7 encode the OAT1 protein and the OAT2 protein, respectively. SLC22A20P is a pseudogene related to murine Slc22a20, which encodes the mOAT6 protein in mouse. OAT1, OAT2, and mOAT6 are members of a group of membrane proteins that have the function of transporting different organic anions across cell membranes, known as organic anion transporters (OATs).
According to the window analysis, SLC22A12 was found to be similar to different genes in exon 1 and exons 2-10. As shown in Table 1, the proportion of different sites (p-distance) between SLC22A12 and SLC22A6 in exon 1 was 0.398, while the p-distance between SLC22A12 and SLC22A20P in the same region was 0.387. This suggests that SLC22A12 is more closely related to SLC22A20P in this region than to SLC22A6. In exons 2-10, the p-distance between SLC22A12 and SLC22A6 was 0.413, suggesting that in this region, SLC22A12 is evolutionarily closer to SLC22A6 than to SLC22A20P. In exon 1 and exons 2-10, there was a significant difference in both the p-distance between SLC22A12 and SLC22A20P and the p-distance between SLC22A12 and SLC22A6 (Chi-square test, 1 degree of freedom, = 0.1%).
2.2. Phylogenetic Tree Analysis
The evolutionary history among SLC22A12, SLC22A20P, SLC22A6, and SLC22A7 was inferred by using the ML method. The trees with the highest log likelihood are shown in Figure 1. The bootstrap values are shown above branches.
The phylogenetic tree constructed based on the sequence of exon 1 is shown in Figure 1(a). When phylogenetic trees were constructed using the exon 1 region with the ML, NJ, and MP methods, the bootstrap values supporting the topology in Figure 1(a) were 94, 96, and 88, respectively. This suggests that the topology in Figure 1(a) was strongly supported in the exon 1 region.
The phylogenetic tree constructed based on the sequence of exons 2-10 is shown in Figure 1(b). In contrast, Figure 1(b) suggests that SLC22A12 is phylogenetically closer to SLC22A6 than to SLC22A20P in exons 2-10. When phylogenetic trees were constructed using exons 2-10 with the ML, NJ, and MP methods, the bootstrap values supporting the topology in Figure 1(b) were 50, 60, and 47, respectively. This suggests that the topology in Figure 1(b) was weakly supported.
3. Discussion
Most surprising finding of this study is SLC22A12 has distinct evolutionary histories in Exon 1 and Exons 2-10. This finding indicates that the SLC22A12 gene is derived from multiple genes with different origins, rather than from a single gene. Our findings in this study provide evidence to indicate that the SLC22A12 gene was generated via a fusion of the SLC22A6 and SLC22A20 genes, a schematic diagram of which is shown in Figure 3. Gene fusion is a phenomenon whereby a new gene emerges as a consequence of the fusion of multiple genes, thereby resulting in the generation of a protein with novel functions. This result suggests that the URAT1-late hypothesis is more plausible for the origin of on the SLC22A12 gene.
It can thus be speculated that the absence of the SLC22A12 gene in X. tropicalis reflects the fact that the putative gene fusion event generating SLC22A12 occurred after the divergence of the ancestors of mammals and amphibians.
In phylogenetic analysis SLC22A7 was used as an outgroup. According to Mihaljevic et al. [5], SLC22A6, SLC22A12, and SLC22A20P are located on human chromosome 11, and their orthologous gene in zebrafish (Danio rerio) is located on chromosome 21 of zebrafish. In contrast, SLC22A7 is located on human chromosome 7, and its orthologous genes in zebrafish are located on chromosomes 11 and 17. The fact that human SLC22A6 and SLC22A7 have different orthologs in zebrafish suggests that these two genes likely diverged before the divergence of tetrapods and bony fish.
In future studies, we will seek to estimate the time that has elapse since the appearance the SLC22A12 gene, which we anticipate will provide valuable insights regarding the selection of model organisms for studies of the uric acid transporter URAT1.
4. Materials and Methods
4.1. Homology Search and Window Analyses
NCBI blastn was used to identify homologous sequences of human SLC22A12. The MANE select cDNA [12] was chosen when multiple cDNA sequences from a single gene were found, except for SLC22A20P. Since SLC22A20P is a pseudogene and does not have a MANE Select cDNA, I chose the sequence from RefSeq. SLC22A7 was chosen as an outgroup. Accession numbers for SLC22A12, SLC22A6, SLC22A20P, and SLC22A7 are NM_144585.4, NM_153276.3, NR_033396.1, and NM_153320.2, respectively.
To examine the origin of the SLC22A12 gene, the proportions of different sites (p-distances) between the SLC22A12 gene and members of the SLC22 gene family. The p-distance of each region was calculated by performing window analyses. The window sizes used were 10, 20, 40, 80, and 160. In this study, only coding regions were used for calculating p-distances.
4.2. Phylogenetic Tree Reconstruction
Evolutionary analyses were conducted in MEGA11 [13,14]. All positions containing gaps were eliminated (complete deletion option). Only coding regions were used for phylogenetic tree reconstruction. There were 354 positions in the exon 1 region and 1245 positions in the exons 2-10 region.
Phylogenetic trees were reconstructed using the Maximum Likelihood (ML) method, the Maximum Parsimony (MP) method, and the Neighbor Joining (NJ) method. The bootstrap values is the percentage of replicate trees in which the associated taxa clustered [15].
The evolutionary history was inferred by using the ML method and Tamura-Nei model [16]. Initial tree(s) for the heuristic search were obtained automatically by applying Neighbor-Joining [17] and BioNJ [18] algorithms to a matrix of pairwise distances estimated using the Tamura-Nei model, and then selecting the topology with superior log likelihood value. A discrete Gamma distribution was used to model evolutionary rate differences among sites (5 categories (+G, parameter = 3.2412)). The rate variation model allowed for some sites to be evolutionarily invariable ([+I], 19.66% sites).
The MP tree was obtained using the Subtree-Pruning-Regrafting (SPR) algorithm [19] with search level 1 in which the initial trees were obtained by the random addition of sequences (10 replicates).
The evolutionary history was inferred using the Neighbor-Joining method [17]. The evolutionary distances were computed using the Tamura-Nei method [16] and are in the units of the number of base substitutions per site. The rate variation among sites was modeled with a gamma distribution (shape parameter = 1).
The bootstrap value represents the percentage of replicate trees in which the associated taxa clustered together in the bootstrap test. It provides a measure of the confidence or reliability of the inferred phylogenetic relationships [15].
Author Contributions
KM designed the research, d performed all data analyses, and was accountable for writing and revising the manuscript
Funding
This work was supported by the Japan Society for the Promotion of Science (JSPS) KAKENHI Grant Numbers JP17K08682, JP19K22647, JP20K07316 to K.M.
Institutional Review Board Statement
Not applicable.
Informed Consent Statement
Not applicable.
Data Availability Statement
The data presented in this study are available in ncbi nucleotide at https://www.ncbi.nlm.nih.gov/nucleotide/, accession number [NM_144585.4, NM_153276.3, NR_033396.1, and NM_153320.2,].
Acknowledgments
I thank my wife for her encouragement.
Conflicts of Interest
Not applicable.
References
- N. Dalbeth, T. R. Merriman, L. K. Stamp, Gout. Lancet 388, 2039-2052 (2016).
- T. R. Merriman, An update on the genetic architecture of hyperuricemia and gout. Arthritis Res Ther 17, 98 (2015). [CrossRef]
- T. J. Major, N. Dalbeth, E. A. Stahl, T. R. Merriman, An update on the genetics of hyperuricaemia and gout. Nat Rev Rheumatol 14, 341-353 (2018). [CrossRef]
- N. Otani, M. Ouchi, K. Misawa, I. Hisatome, N. Anzai, Hypouricemia and Urate Transporters. Biomedicines 10, (2022). [CrossRef]
- I. Mihaljevic, M. Popovic, R. Zaja, T. Smital, Phylogenetic, syntenic, and tissue expression analysis of slc22 genes in zebrafish (Danio rerio). BMC Genomics 17, 626 (2016). [CrossRef]
- A. Enomoto et al., Molecular identification of a renal urate anion exchanger that regulates blood urate levels. Nature 417, 447-452 (2002). [CrossRef]
- K. Ichida et al., Clinical and molecular analysis of patients with renal hypouricemia in Japan-influence of URAT1 gene on urinary urate excretion. J Am Soc Nephrol 15, 164-173 (2004). [CrossRef]
- N. Iwai et al., A high prevalence of renal hypouricemia caused by inactive SLC22A12 in Japanese. Kidney Int 66, 935-944 (2004). [CrossRef]
- A. Mancikova et al., Functional analysis of novel allelic variants in URAT1 and GLUT9 causing renal hypouricemia type 1 and 2. Clin Exp Nephrol 20, 578-584 (2016). [CrossRef]
- K. Misawa et al., Contribution of rare variants of the SLC22A12 gene to the missing heritability of serum urate levels. Genetics 214, 1079-1090 (2020). [CrossRef]
- D. Oliveira et al., Identification of a novel nucleobase-ascorbate transporter family member in fish and amphibians. Fishes 4, 1 (2019). [CrossRef]
- J. Morales et al., A joint NCBI and EMBL-EBI transcript set for clinical genomics and research. Nature 604, 310-315 (2022). [CrossRef]
- G. Stecher, K. Tamura, S. Kumar, Molecular Evolutionary Genetics Analysis (MEGA) for macOS. Mol Biol Evol 37, 1237-1239 (2020). [CrossRef]
- K. Tamura, G. Stecher, S. Kumar, MEGA11: Molecular Evolutionary Genetics Analysis Version 11. Mol Biol Evol 38, 3022-3027 (2021). [CrossRef]
- J. Felsenstein, Confidence limits on phylogenies: an approach using the bootstrap. Evolution 39, 783-791 (1985). [CrossRef]
- K. Tamura, M. Nei, Estimation of the number of nucleotide substitutions in the control region of mitochondrial DNA in humans and chimpanzees. Mol Biol Evol 10, 512-526 (1993). [CrossRef]
- N. Saitou, M. Nei, The neighbor-joining method: a new method for reconstructing phylogenetic trees. Mol Biol Evol 4, 406-425 (1987). [CrossRef]
- O. Gascuel, BIONJ: an improved version of the NJ algorithm based on a simple model of sequence data. Mol Biol Evol 14, 685-695 (1997). [CrossRef]
- M. Nei, S. Kumar, Molecular Evolution and Phylogenetics. (Oxford University Press, New York, 2000).
Figure 1.
Phylogenetic analysis among SLC22A12, SLC22A20P, SLC22A6, and SLC22A7 based on different regions. (a) A phylogenetic tree constructed based on the sequence of exon 1; (b) A phylogenetic tree constructed based on the sequence from exon 2 to exon 10. The bootstrap values are shown above branches.
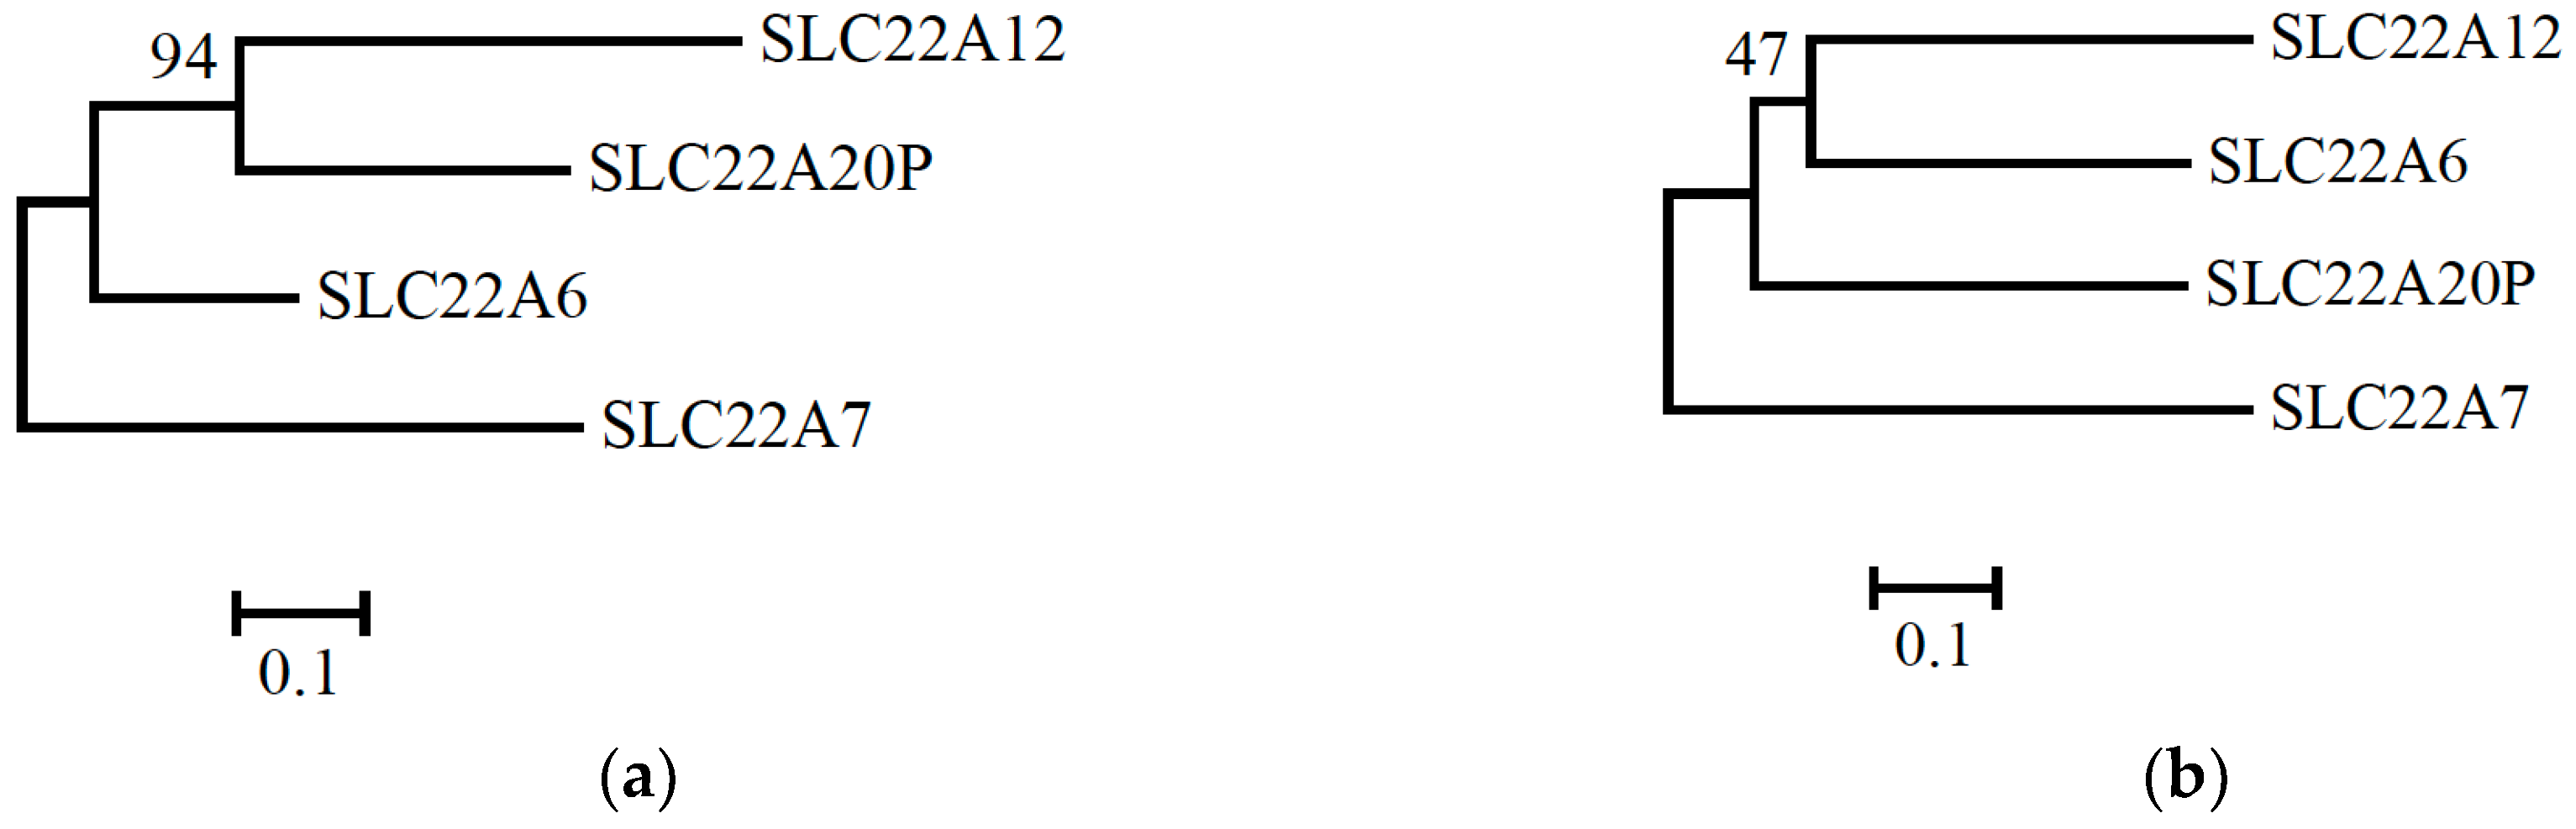
Figure 3.
The schematic view of evolutionary history of the SLC22A12 gene.
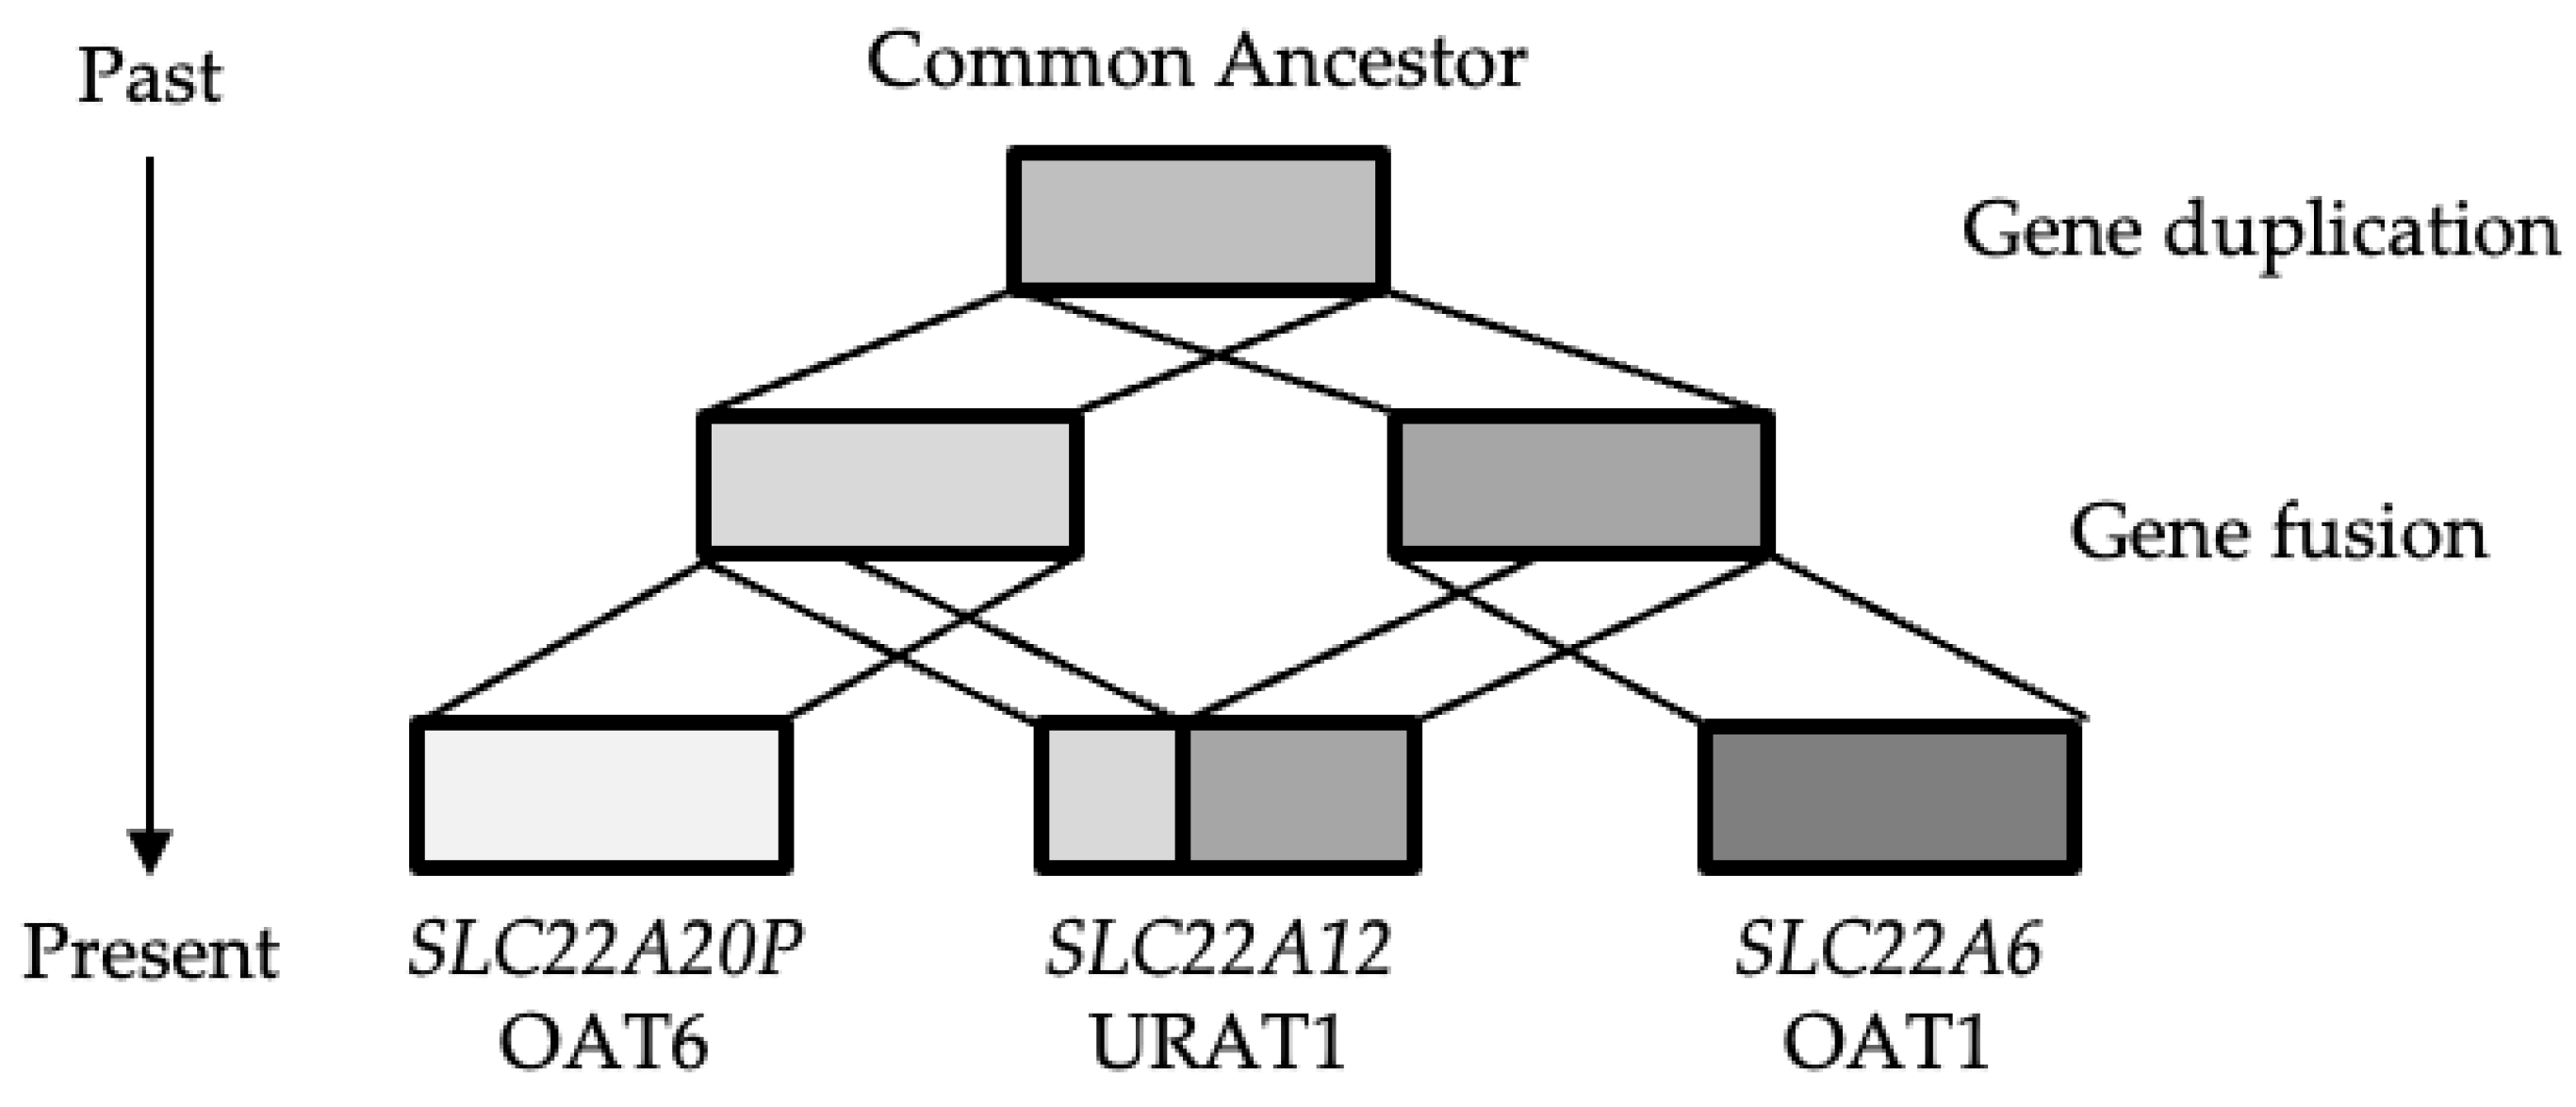

Table 1.
The proportions of different sites (p-distances) among SLC22A12, SLC22A20P, SLC22A6, and SLC22A7. The p-distances calculated from exon 1 are represented in the upper triangle, while the p-distances calculated from exons 2-10 are represented in the lower triangle.
Table 1.
The proportions of different sites (p-distances) among SLC22A12, SLC22A20P, SLC22A6, and SLC22A7. The p-distances calculated from exon 1 are represented in the upper triangle, while the p-distances calculated from exons 2-10 are represented in the lower triangle.
| SLC22A12 | SLC22A20P | SLC22A6 | SLC22A7 | |
| SLC22A12 | 0.387 | 0.398 | 0.497 | |
| SLC22A20P | 0.438 | 0.345 | 0.441 | |
| SLC22A6 | 0.413 | 0.424 | 0.393 | |
| SLC22A7 | 0.484 | 0.488 | 0.484 |
Disclaimer/Publisher’s Note: The statements, opinions and data contained in all publications are solely those of the individual author(s) and contributor(s) and not of MDPI and/or the editor(s). MDPI and/or the editor(s) disclaim responsibility for any injury to people or property resulting from any ideas, methods, instructions or products referred to in the content. |
© 2024 by the authors. Licensee MDPI, Basel, Switzerland. This article is an open access article distributed under the terms and conditions of the Creative Commons Attribution (CC BY) license (http://creativecommons.org/licenses/by/4.0/).
Copyright: This open access article is published under a Creative Commons CC BY 4.0 license, which permit the free download, distribution, and reuse, provided that the author and preprint are cited in any reuse.


