

Submitted:
18 September 2024
Posted:
20 September 2024
You are already at the latest version
Abstract
The increasing request of digitized data among several fields, including the built environment and Cultural Heritage (CH) one points out the need of proficient ways to access, archive and share 3D data and related information among users. The sector of reality capture produces accurate and reliable products that can support building management and CH maintenance, at the price of heavy and resource-demanding data. An emerging solution to this problem is represented by the web platforms for 3D data management, that promise to relieve users from the costs of archive and hardware, providing effective visualization, access and sharing tools. The panorama of commercial web platforms is analyzed according to the Software as a Service business model and the features of some representative platforms are exposed. The paper discusses the main advantages in terms of diffused access and collaboration and the potential issues concerning the long-term archive and data persistence. The future perspectives of the web platform sector are promising as, according to the current development path, could be able to empower the built environment and CH sector with a diffused, systematic and aware use of 3D data.
Keywords:
Web platforms
; data integration
; 3D information system
; Collaborative platform
; Cloud computing
; 3D survey
; 3D data
; Built environment
1. Introduction
The digital data are gaining an increasing, pivotal role and are becoming an unavoidable asset due to their characteristics of adaptability and shareability in every field. The digitization process, at the present state, concerns mostly the already available data, as the ones hosted in the archives (e.g., paper documents or any kind of written information) and the geometries (e.g., architectures, objects, paintings etc) that have been acquired with the Reality Capture (RC) techniques. These techniques, supported by the evolution of the survey instruments, are showing an increasing efficiency and significant advancements in terms of acquisition automation and product accuracy. At the present time, the digitization of the “tangible”, physical part of the built assets can rely on solid and consolidated techniques, while still remain significant challenges to be solved in particular when dealing with the real use of digital data in operative professional practices.
This article focuses and analyses the state of the art of the contemporary available tools for data and information management that are nowadays used or that can be possibly employed in many fields, e.g., the management of the built environment and Cultural Heritage (CH) documentation. These kinds of tools are information systems that ensure simultaneous, combined and synergic management of data and processes. The article examines the main and most significant experiences and tools that are available on the market of particular relevance and potential usefulness. The main focus of this article is to analyse the information management systems freely or commercially available, which data and processes they support, which problems they solve and what are the future perspectives they offer.
The most promising and emerging solution now available for data management is represented by the web platforms dedicated to the sharing of 3D data that, far from being an effective system for digitizing the whole process, represent an efficient system to share, access and present the data. Web platforms provide a contemporary mean of data fruition, as they are instruments designed for collaboration and contain all the data and algorithms for their effective access and processing, following the Software as a Service (SaaS) business model.
For “contemporary mean of data fruition” is here intended the fact that in everyday life any digital user has the experience of the interaction with a platform, a key concept of the sharing and platform economy. The access to the platform, in a general meaning, is device-independent and usually there are no strict software or hardware requirements to be fulfilled. As stated before, users generally experience this means of fruition in everyday life, but it appears to be particularly suitable to those sectors characterized by heterogeneous professional figures who might have limited access to powerful hardware, lack specific geomatics skills, and are not familiar with specific software, such as the CH field. However, they need to have access to geometrical and textual data and to interact and collaborate with other professionals.
A web platform is a digital instrument that allow different users to collaborate through defined profiles with different access and privileges, interacting between them and with the data through schemas and roles defined by the architecture of the platform, by its data model and, in general, its purpose, that means the real-world process that it is supporting and enhancing. This means that somehow the platform and its data and interaction model should have the “digital form” of the process they support, that might be more or less complex according to the activities performed and to the adopted technical solutions.
In this article some selected commercial solutions are examined, looking at the typology of data they host and manage, which information are present and can be uploaded and which is their main purpose and the process they address to.
The datasets used for the tests conducted for this review come from some case study of the CH world. This choice was made for two main reasons. The first concerns the fact that among that CH assets can vary significantly in terms of dimension and shape of the architecture, complexity and texture of the surfaces, as each considered case has its own needs, problems and requires specific solutions. The second reason it is related to the fact that among the professionals that work in the CH filed the IT skills and the familiarity with the geomatics pipeline and tools are different and might be scarce. All the professional figures involved in the CH management (e.g., superintendents, directors, conservators, historians, surveyors, contractors) carry its skills and knowledge and is experienced in the use of the specific tools of its field, but might lack proficiency with software for the management of survey data, both 2D and 3D representations. For the aforementioned reasons, the whole CH field and all the professionals involved can indeed benefit from an eased sharing of data finalized to support the planning of activities and interventions.
1.1. The Cloud Computing Framework
1.1.1. Definition of Web Platform
Web platforms, if observed from the perspective of the final user, have several features in common with the cloud computing business model known as Software as a Service (SaaS) [1].
In the SaaS business model, the software is owned, delivered, and managed remotely by its provider. The service is provided based on one set of common code and data definitions on a one-to-many model to the customers with a pay-for-use basis or as a subscription-based model [2].
According to this business model, a platform is, in the wide context of digital business, a product that serves or enables other products or services. Platforms can span from the high-level ones that enable a platform business model, to the low-level ones that provide a collection of business and technology capabilities that other products or services consume to deliver their own product or services. [3]. Görög (2018) [4] enlarges this definition, defining a web platform as an online structure that enables a wide range of human activities.
The concept of SaaS was developed as an alternative to the traditional way of implementing enterprise software, addressing the increasing cost of packaged software represented by licensing, implementation expenses, hardware and general maintenance fees. Is SaaS model the customer in fact does not own the software as in traditional licensing, but rents it from the service provider being relieved from installation, hosting and hardware costs, that are managed by the SaaS vendor, resulting in initially cheaper implementation cost if compared to on premise software [5].
Kenney & Zysman (2016) [6] identify with the term digital platform economy a growing number of digitally enable activities in business politics and social interaction, organized around digital platforms as drivers of economic change. They also enlarge the definition as “a set of online digital arrangements whose algorithms serve to organize and structure economic and social activity”.
Platforms have associated business ecosystems that deliver their services and tools to members of those ecosystems mainly via Application Programming Interfaces (API) [3].
Digital platforms are composed by software, hardware, operations, and networks. Platforms provide a set of shared techniques, technologies and interfaces to a broad set of users who can build what they want on a that stable substrate. Platforms might even grow in a nested way, building a platform (e.g., a service) on other platforms as a cloud computing services, constituting a digital ecosystem [6].
As the community of platform users and clients grows, the effect of network externalities [7] appears, increasing the usefulness of a technology as its user base enlarges. This improvement might appear, on client perspective, as a reduced price for the service, lower uncertainty about the future development and about the long-term support of the service, presence of complementary service and add-ons as well as third-party developed software within the platform, support by user community and a general increase on the quality of the product [8].
From this consideration is possible to focus on a key aspect of web platform and in general the digital-based business: the economic sustainability achieved towards the scale economy. Levinson (2007) [5] notices that the one of the problems of the Application Service Provider (ASP) business model developed from the 1990s, similar in the main features to the SaaS one, lost the economies of scale trying to deliver tailored application to every user, resulting in an unbearable weight of the hardware and software infrastructure by the service provider.
1.1.2. Applications and Perspectives
As seen in the previous paragraph, the platform business model and SaaS model in general are one of the main actors and drivers in the contemporary digital economy and are strongly related to the experience in digital life of the common users. In this article the present and potential role of web platforms is explored with particular focus on their ability to foster and support the dissemination and the support for the management of built assets.
According to the SaaS business model, it is the service provider that takes care of the hardware infrastructure, managing and updating all the software level and provide the storage space needed for the data. The SaaS cloud computing model applied to web platforms ensures that the user is not required to have specific software or dedicated hardware or even retain the data: everything is stored, processed and structured for efficient rendering within the cloud computing infrastructure.
For the purposes of this article, it can be assumed web platforms as a digital tool available through a website that delivers to final users (e.g., scholars, restorers, managers, general public) all the needed information for the fruition or management of an asset (e.g., a building, a piece of CH, a collection), that are determined by the scope of the platform [10]. On most of the cases, a web platform is a Web App that delivers visualization and interaction tools with 3D representations as models, meshes, and point clouds. These geometrical data can be already present in the platform or uploaded by the user, according to its role and privileges [11].
The main advantages related to the use of web platforms can be found in the possibility to deal with large point clouds or mesh models without using specific high-performance hardware and dedicated software, while is the platform that eventually provides the scaling of the resources dedicated to the virtual machine on the physical server it runs on. Since all the data are hosted and managed by the service provider, once the initial upload phase is terminated, the final user is relieved from using and storing a considerable amount of heavy data. Both advantages mentioned before can result in costs saved in hardware or in software. It must be considered that several platforms require a subscription which price varies according to the features available, the services provided and the storage available, that has to be considered carefully.
Another significant advantage is represented by the enhanced possibility of sharing up to date information and data between users, with significant reduction in terms of data duplication and version proliferation, as it is common working on-premises (on local machines). As the access to the platform is through a web browser and potentially from any digital device, the rendering of the visualizer usually adapts to the computational capabilities of the device, relying on the fact that, usually during the upload, the geometrical data (e.g., a point cloud) are processed and indexed for fast out-of-core rendering [12,13].
For the aforementioned reasons, web platforms for 3D data management ease the possibility of being used also by non-technical figures and occasional users that do not have at disposal hardware and software dedicated to 3D data visualization, a common working situation in the CH field, when dealing with high resolution data. Moreover, the use of web platforms fosters collaboration between users through the seamless and updated sharing of the same data, with the possibility of access management through specific user profiles and privileges.
The migration of data and processes into the various emerging cloud computing services stresses the urgency of a reflection on the topics of data stability, that deals with intellectual property and legal ownership of the information, with the long-term availability and the physical location of data. These aspects are crucial for sectors that deal with information concerning collective heritage and that can have great archival value and that need to be preserved.
In the previous paragraph was mentioned that one of the factors of the success and long-term sustainability of platforms is the ability to scale resources and avoid the user-specific customization that imply excessive resource deployment that affect the infrastructure. This aspect is crucial: some specific sector (e.g., the CH one) might lack of diffused standardization and it is possible to find specific needs for each asset, according to its peculiarity and uniqueness, which is inevitably reflected on the digital tools used for its management. A platform developer that operates in this field, must take into consideration this aspect as it is fundamental for the effectiveness of its product or service, but on the other hand it should be considered that to exceed in tailoring the platform to one of its possible users might result in an increase of costs and then affect its long-term adoption and its economic sustainability.
The primary key feature for the success of platforms across various domains, as their extensive adoption can initiate the previously mentioned network externalities effect, will likely reside in achieving a sustainable equilibrium between the particular requirements of individual asset management and the general applicability of the web platform tool to a multitude of scenarios.
In the industrial innovation management field, platforms are conceived as digital objects with “stable core and variable periphery”, that can develop in a distributed and innovate through recombination and modularization [8]. Within this perspective, considering that the ways of accessing and using specific type of data can be standardized even in very specific fields as the CH one, the modularization of web platform components developed for a recurrent operation might be a possible strategy to find the sustainability balance mentioned before.
1.2. Data for the Description of Assets
In this context the term “data” is used to indicate the ensemble of information of any kind that can be used for effective description of an asset to be managed and its status. For the sake of simplicity, in this context are divided in geometrical and non-geometrical data.
The geometrical data are distinguished by their metrological quality, as they represent in real scale or in a reduction scale the surveyed object with known accuracy. Classically this category comprises, among the others, vector drawings, orthophotos and 3D models. In this article, the main reference will be to 3D models, specifically the ones coming from the reality capture processes as direct or indirect product, in form of point cloud, mesh, NURBS or BIM model.
The non-geometrical data is a category that consists of any general information, short or long texts, media that describes some aspects, status and quality of the object, in the widest possible meaning.
1.2.1. Geometrical Data
For the geometrical data, at the present state of the art, the process of digitization is experiencing an increasing ease and speed of the on-field activities due to software, algorithm and instrument evolution. The average reality capture task is nowadays easy to achieve due to the achieved accuracy of the instruments and the increasing automation of both field and processing activities. The survey sector is far from being fully automated and presents still significant challenges and possible development paths, but the undeniable progress in terms of ease of access to capturing tools and techniques increases the volume of surveys of real objects, also on periodical and repeated basis, to assess progresses and changes, e.g., on a building site or for structural monitoring purposes. The increasing volume of digitization activities is proportional to the increase of the volume of produced data of increasing quality and resolution, with even increased heaviness of the final products. In this scenario is crucial to empower effective systems to store, access, share and retrieve such data, that are at the same time of critical importance but also difficult to be handled and managed.
A similar process of increase in quantity and resolution of the acquired data, is in progress -with some structural differences- for the non-geometrical data, that might be digitized from analogue support (as archive documents, pictures or similar) or natively digital.
The online visualization modules (frameworks) are responsible of delivering through rendering the appearance of 3D data stored in the system. They handle the most resource-consuming operations as point clouds or meshes can represent a massive amount of data and require to be rendered fast in order to provide usability and a satisfying user experience. Moreover, the data transmission between the platform visualizer and the client device is related to the available bandwidth of the network connection, with significant variability and limitation in the rate of data transfer. Champion & Rahaman (2020) [14] identify the release of the WebGL standard in 2009 [15] as a significant increase in the representation of 3D geometries in the web.
Fiorillo & Spettu (2023) [10] notice that the research on point cloud visualization through the web was driven by the need to find effective ways to index massive point clouds for out-of-core rendering [16,17], also adapting to the typology of data with semantic-dependent techniques [18], in order to get satisfying performances on most of the devices. The indexing of a point cloud is an operation that displays the most significant points for a specific rendering scene according to the portion of point cloud framed into the viewport, the zoom level and the type of visual projection. The goal of indexing is to provide the most efficient number of points to be broadcasted through the network and then rendered by the user device to ensure smooth user experience and fast loading. The main objective of these efforts is directed towards point clouds at a territorial scale, especially massive, country-size ones derived from LiDAR surveys [19], which with the actual average hardware resources, represent a real challenge for in-core rendering and in the absence of any system that optimizes the amount of visualized points.
A clear example of this tendency is represented by the USGS/Entwine project [20,21]. The project makes available a significant amount of point cloud data (around 65·1012 points) coming from LiDAR state-wide survey by the United States Geological Survey (USGS). The point clouds are indexed using the Entwine framework, a data organization library for massive point clouds, and made available through a web page hosted by the AWS Open Data Sponsorship Program [22]. The LiDAR territorial data are available for download and also for online visualization through Potree [23] and Cesium [24], linked in the web page (Figure 1). The USG & Entwine project can be seen as a very simple and clear example of the modular nature of the web platforms as defined by Gartner Inc (2024a): it can be seen as a low-level platform hosted by a general purpose high level platform (AWS). Moreover, according to the platform definition of [8], the “stable core” of the platform can be identified in the LiDAR data indexed with Entwine, as the fruition of such massive amount of points is crucial and it is the main purpose of the project, and the “variable periphery” can be identified in the visualizers (Cesium and Potree), that access to the core-data and might be substituted and integrated in the future.
Moreover, this example shows how the indexing and rendering algorithms are at the present time ready and effective in handling point cloud objects of enormous dimensions through efficient systems of the level of detail management. This aspect is crucial in dealing with territorial-scale point clouds, but its usefulness applies also to the architectural scale point clouds, considering the increasing resolution and point density achievable by the contemporary survey instruments and processing tools, if applied to extended architectural complexes.
1.2.2. Non-Geometrical Data
The nature of non-geometrical data can be very different, spanning from text and tabular data to images, videos and other medias. They usually do not require particular processing and computation abilities to be managed but they indeed require a thorough organization using database and information models and specific software tools and platforms to be accessed, used and shared.
Wynne (2018) [25] defines and classifies various typologies of Digital information and content management platforms, mainly dedicated to the CH sector, according to their objects and proposed solutions. The collection management systems are meant to be used to handle the lifecycle of physical and digital objects of a collection within an institution as a museum or an archive. The Content Management Systems can be used by various cultural institutions for the use of the specific digital material. The Asset Management Systems are intended to an organized repository to store and deliver media to other applications or websites. The previously described types of management systems address different needs, as handling groups of objects and their status and location, the management of cultural content that in some case can be the digital object itself, and the sharing and delivery of the content towards other applications. A Cultural Institution might adopt one or more of these solutions in order to pursue its objective and manage its assets and contents, with particular regard to the integration between the systems.
The platforms that handle mainly non-geometrical data can achieve various goals and purposes, spanning from dissemination and narrative purposes directed towards the general public to operational management systems dedicated to CH institutions and operators, also provided and developed by public institutions.
Access to Memory - AtoM [26] is an open-source collection management system for cultural institutions that are interested in cataloguing collection with internationally recognized standards [27] as the one developed by the International Council of Archives [28]. CONTENTdm [29] is a content management system that can be used to share with general public digitized archive material as library collections, publicly sharing also with comprehensive catalogues as WorldCat [30]. Omeka [31] is an open-source content manager system that allows users to create web exhibition of archive material. It is developed in two version, the “classic” one meant for single projects and the “S” one for multiple site management. Omeka.net [32] is the web platform developed on the Omeka framework addressed to institutions that do not want to deal with servers and hosting. Museo [33,34] is a web-based commercial collection management system that comes as a web platform for cataloguing and dissemination. Archiui [35] is a multi-purpose commercial collection manager that features web site creation tools for sharing and dissemination. ResourceSpace [36] is a commercial solution for asset management system developed for general purposes that is used by cultural and academic institutions as it features several plugins to connect to collection management systems.
3. Web Platforms: Types, Uses and Applications
Champion & Rahaman (2020) [14] examine several web platforms among commercial, free and institutional ones for the delivery and exhibition of 3D models. The authors address mainly the web platforms and frameworks for the Galleries, Libraries Archives and Museums (GLAM) sector, but their considerations are general and valid also for the AEC sector. The evolution of hardware and software in the world of CH digitization is opening new scenarios but at the same time some issues are not effectively addressed, as the persistence of digital data and the use of shared data format and metadata. It can be noticed that despite the UNESCO [37] recommended to Cultural Institutions to preserve the digitized CH and disseminate its use and importance, 3D models are rarely preserved for long time and usually they are lost together with the original projects that produced them. In most of the research project and online data archives examined, there is a lack of long-term data conservation strategy. Another issue identified is related to the rights of use of the digital models, that are owned by the institutions that host the real objects or manufacts, that might prevent a wide diffusion of their digitization. Moreover, it is identified a general lack of a description of the model reliability, namely how well the model is describing the reality, which parts are reconstruction hypotheses. This is a central issue in the archaeological field, as the reconstruction of 3D spaces and objects can be creative and interpretative, as pointed out by the London Charter [38]. Finally, they propose a list of features that a web platform for 3D data exhibition, mainly for dissemination and study purposes, should present such as navigation tools, annotation and measurement tools, different visualization modes and timeline function among the others. It is important to introduce a diffused use of a unique identifier for digital models, that will allow to reconstruct the origin and the reliability of the data.
Statham (2019) [39] examines several institutional documents about physical and digital CH, as for example, the London Charter and the Seville Principles [40]. The author states that it is important to separate the resolution and photorealism of a 3D model from its accuracy and reality, as the visual quality of the digital object could not reflect its metrological quality. It states that is important in this sense to make available to the users the original data, the support of historical sources and the nominal accuracy of the model. Moreover, Statham describes some platforms and frameworks available for Cultural Institutions, as well as the possibilities offered by game the engines as visualization tools for 3D models. It notices that the most diffused platforms are the ones that provide none or few tools for measurement. For most of the platforms, the origin and all the modifications of the model cannot be traced and is not available an explicative description of the model accuracy through metadata.
The 3D models hosted on the web usually do not present any information about their metrological accuracy, the origin of data and, in general, their reliability. This might be related to the fact that the characteristics of a model are known between who collaborates at the same project, but on a longer time span the information might be lost and will not be archived together with the model and thus not accessible to the public if the model is shared for dissemination purposes.
A major issue is represented by the long-term archiving of the great amount of digitized data that are produced now, both in terms of data collocation, data-formats and expected life of visualisation and analysis software. Moreover, the use of web platforms is related to a subscription and, according to the business model, the data are hosted generally by third party storage service providers and are transformed in the format used by the platform. In this context, the long-term preservation and accessibility appears as an issue to be addressed with structured internal policies by the cultural institutions or the data owners. For this reason, it is of crucial importance a thorough choice of the right platform or ensemble of platforms according to the realistic needs, as well as a clear plan and policy about data importance and backup routines.
3.1. Overview of Platforms and Frameworks
The panorama of commercial platforms is heterogeneous and in increasing development, as new actors, proposals and technologies are constantly emerging. Considered this continuous evolution and refresh of the offer and of possibilities available, a possible study path to follow to understand the main directions and future improvements in the sector is to categorize commercial platforms according to their business model and target users. This choice enables to avoid following the minor updates of commercial platforms, as the upgrade of a specific tool or the introduction of new ones, focusing on the main purposes of the platforms, that can be also seen as the main issues and needs that the developers intends to address according to the technology they have at disposal and use, and their target customers. These factors are the main ones that determine the cost and subscription plan of the platform. All these different aspects that contribute to shape the web platform can be comprised into the business model adopted by the developers.
In the following paragraphs are examined commercial, free, and open-source platforms. The main focus is related to platforms developed mainly by private or non-academic actors and that were not mainly driven by research purposes but were conceived as open and available on the market or freely on the web.
In the following paragraphs, the enquired platforms are divided into categories that are addressed to different sectors and applications. Most of them are directed towards the built environments, other are focused on survey data processing and some on 3D data visualization and management. Most of them do not target specifically a sector or application and for this reason might not provide dedicated tools for specific operation as built asset management. For some specific and unavoidable needs, several operators provide API for custom development of a target-specific platform.
It has to be noticed that these categories have to be intended as a main guide to read the most important and prominent features of a platform. Some of the described solutions could provide tools that belong to more than one category but are categorized under the most representative one. As an example, most of the platforms offer visualization and navigation, but can be comprised under other categories if they present distinctive features.
3.2. Cultural Dissemination Platforms
Cultural dissemination platforms act as repositories for heritage assets curated by museum, libraries and other cultural institutions. These platforms are driven by the goal of make media and resources accessible to the public, that can visualize and consult the assets but generally there is few or no interaction at all with the 3D models. The 3D geometry is one of the various media that are hosted and displayed by the platform and models are not the center of the service, that is rather build narratives and awareness.
A significant example of dissemination and cultural access platform not related to specific cultural institution is Google Arts and Culture [41], a non-profit initiative of Google that aggregates copyright-free contents from cultural institutions and proposes narratives and learning paths to its users about any kind of cultural content, using texts, images, videos, thematic games and virtual tours, also using 3D data in collaboration with Cyark [39] with the Open Heritage project [42]. Cyark [43] is a platform developed by a non-profit organization that started operating in 2003 with the purpose of promote digitization projects and provide the infrastructure archive the 3D reality capture data of CH sites. Nowadays the project is engaged with a more holistic approach to documentation and storytelling [44,45], hosting texts, videos, 3D models and multimedia virtual tours towards the its dedicated side platform, Tapestry [46]. A similar documentation project, led also by a private non-profit organization, promoting reality capture projects and the digital infrastructure for data showcase is the Global Digital Heritage initiative [47]. With similar documentation purposes, even though with a more specific goal, can be retrieved in the Scan UA project [48], a volunteer-based project to document through 3D data the war damages occurred to the Ukrainian CH [49]. The Smithsonian Open Access project [50] is an online open display catalogue of the digitized media that belong to the Smithsonian Institution, a cultural organization that gathers museums, research centers and education facilities. The number of available digital assets is significant and comprises heterogeneous fields. The Smithsonian 3D project [51] is the internal initiative that aims at populating the Open Access catalogue with the captured 3D data from the Institution collections. A similar project is Europeana [52], a European Community founded project of data sharing and aggregation from EU cultural institutions [53], that collects various type of media as text, images, videos, audio and 3D models. Europeana is fed by a network of aggregators that can be thematic (work within a specific domain) or local (national or regional). Aggregators are associated institutions and projects that gather digital objects and supervise their quality and fulfilment to Europeana standards for the upload on the platform [54].
3.3. Embedded Systems
Several companies are developing web platforms devoted to point clouds as a complementary service to their main products or as their core business. These companies are offering the web platform services as an additional one to the already established survey instruments and software they normally provide, to enhance the possibilities of data sharing and diffusion by their clients. These platforms might be available for free for customers or can be included in a subscription plan related to the proprietary software. The main target user can be identified in reality capture firms that want to share on the web their work with their clients, avoiding data transfer, complex export and conversion procedures and use of different software. The platforms as complementary services usually perform at best with the use of the proprietary data format of the producer, as they are part of a software-hardware ecosystem that embodies the reality capture hardware and several tools for captured data alignment, processing and refinement. This leads to the consideration that this kind of platform can be hardware or file-format dependent, as they are not conceived for general purpose use, but are targeted for expanding the offer of an already established and solid business.
Leica TrueView LIVE [55] is the web 3D collaborative visualizer developed by Leica Geosystem that allows point cloud visualization, project sharing and to perform virtual tours through the panoramic images acquired from the scanner (Figure 2). The platform is hardware-software dependent and is available also as a desktop on-premises application with some additional features, as the visualization mode through Virtual Reality (VR) headset. It works with structured and unstructured point clouds but also meshes, if loaded through the Cyclone Enterprise software. TrueView is part of the Leica software ecosystem and for most of the features needs the software Cyclone Enterprise [56] as project and data manager. Its main purpose is to display on the web and share scanning projects also for collaboration and review.
Autodesk Drive [57] (formerly A360 Drive) is the complementary service by Autodesk for its application suite. It works as a cloud Common Data Environment (CDE) for the on-premises software, but it integrates some self-standing web visualizers for data display available also from mobile devices, with some collaboration and labeling tools (Figure 3). It works mainly with proprietary file format (e.g., ReCap RCP projects, Revit RVT models) but allows also some interchange format as OBJ. The platform is mainly an additional cloud-based service that expands the offer of the Autodesk suite, that can be used occasionally for remote collaboration and data sharing. The same web tools are also made available as an Application Programming Interface (API) by Autodesk for platform developers, Autodesk Platform Services, formerly known as Forge [58].
FARO Sphere [59] is the collaboration platform for the Faro environment. Sphere is defined as a “cloud-based data management hub”, as it is intended to be used as a data and scan project manager for the Faro hardware and software ecosystem and acts as the core of the collaboration platform, together with the other application of the suite. Sphere embeds WebShare [60] as web 3D data visualizer that works with various data format but is mainly intended to perform at best with FARO scan projects. Inside the Sphere environment is available HoloBuilder [61], that expand functionalities trough 360° tours captured from panoramic cameras, meant especially for the progress management in construction sites.
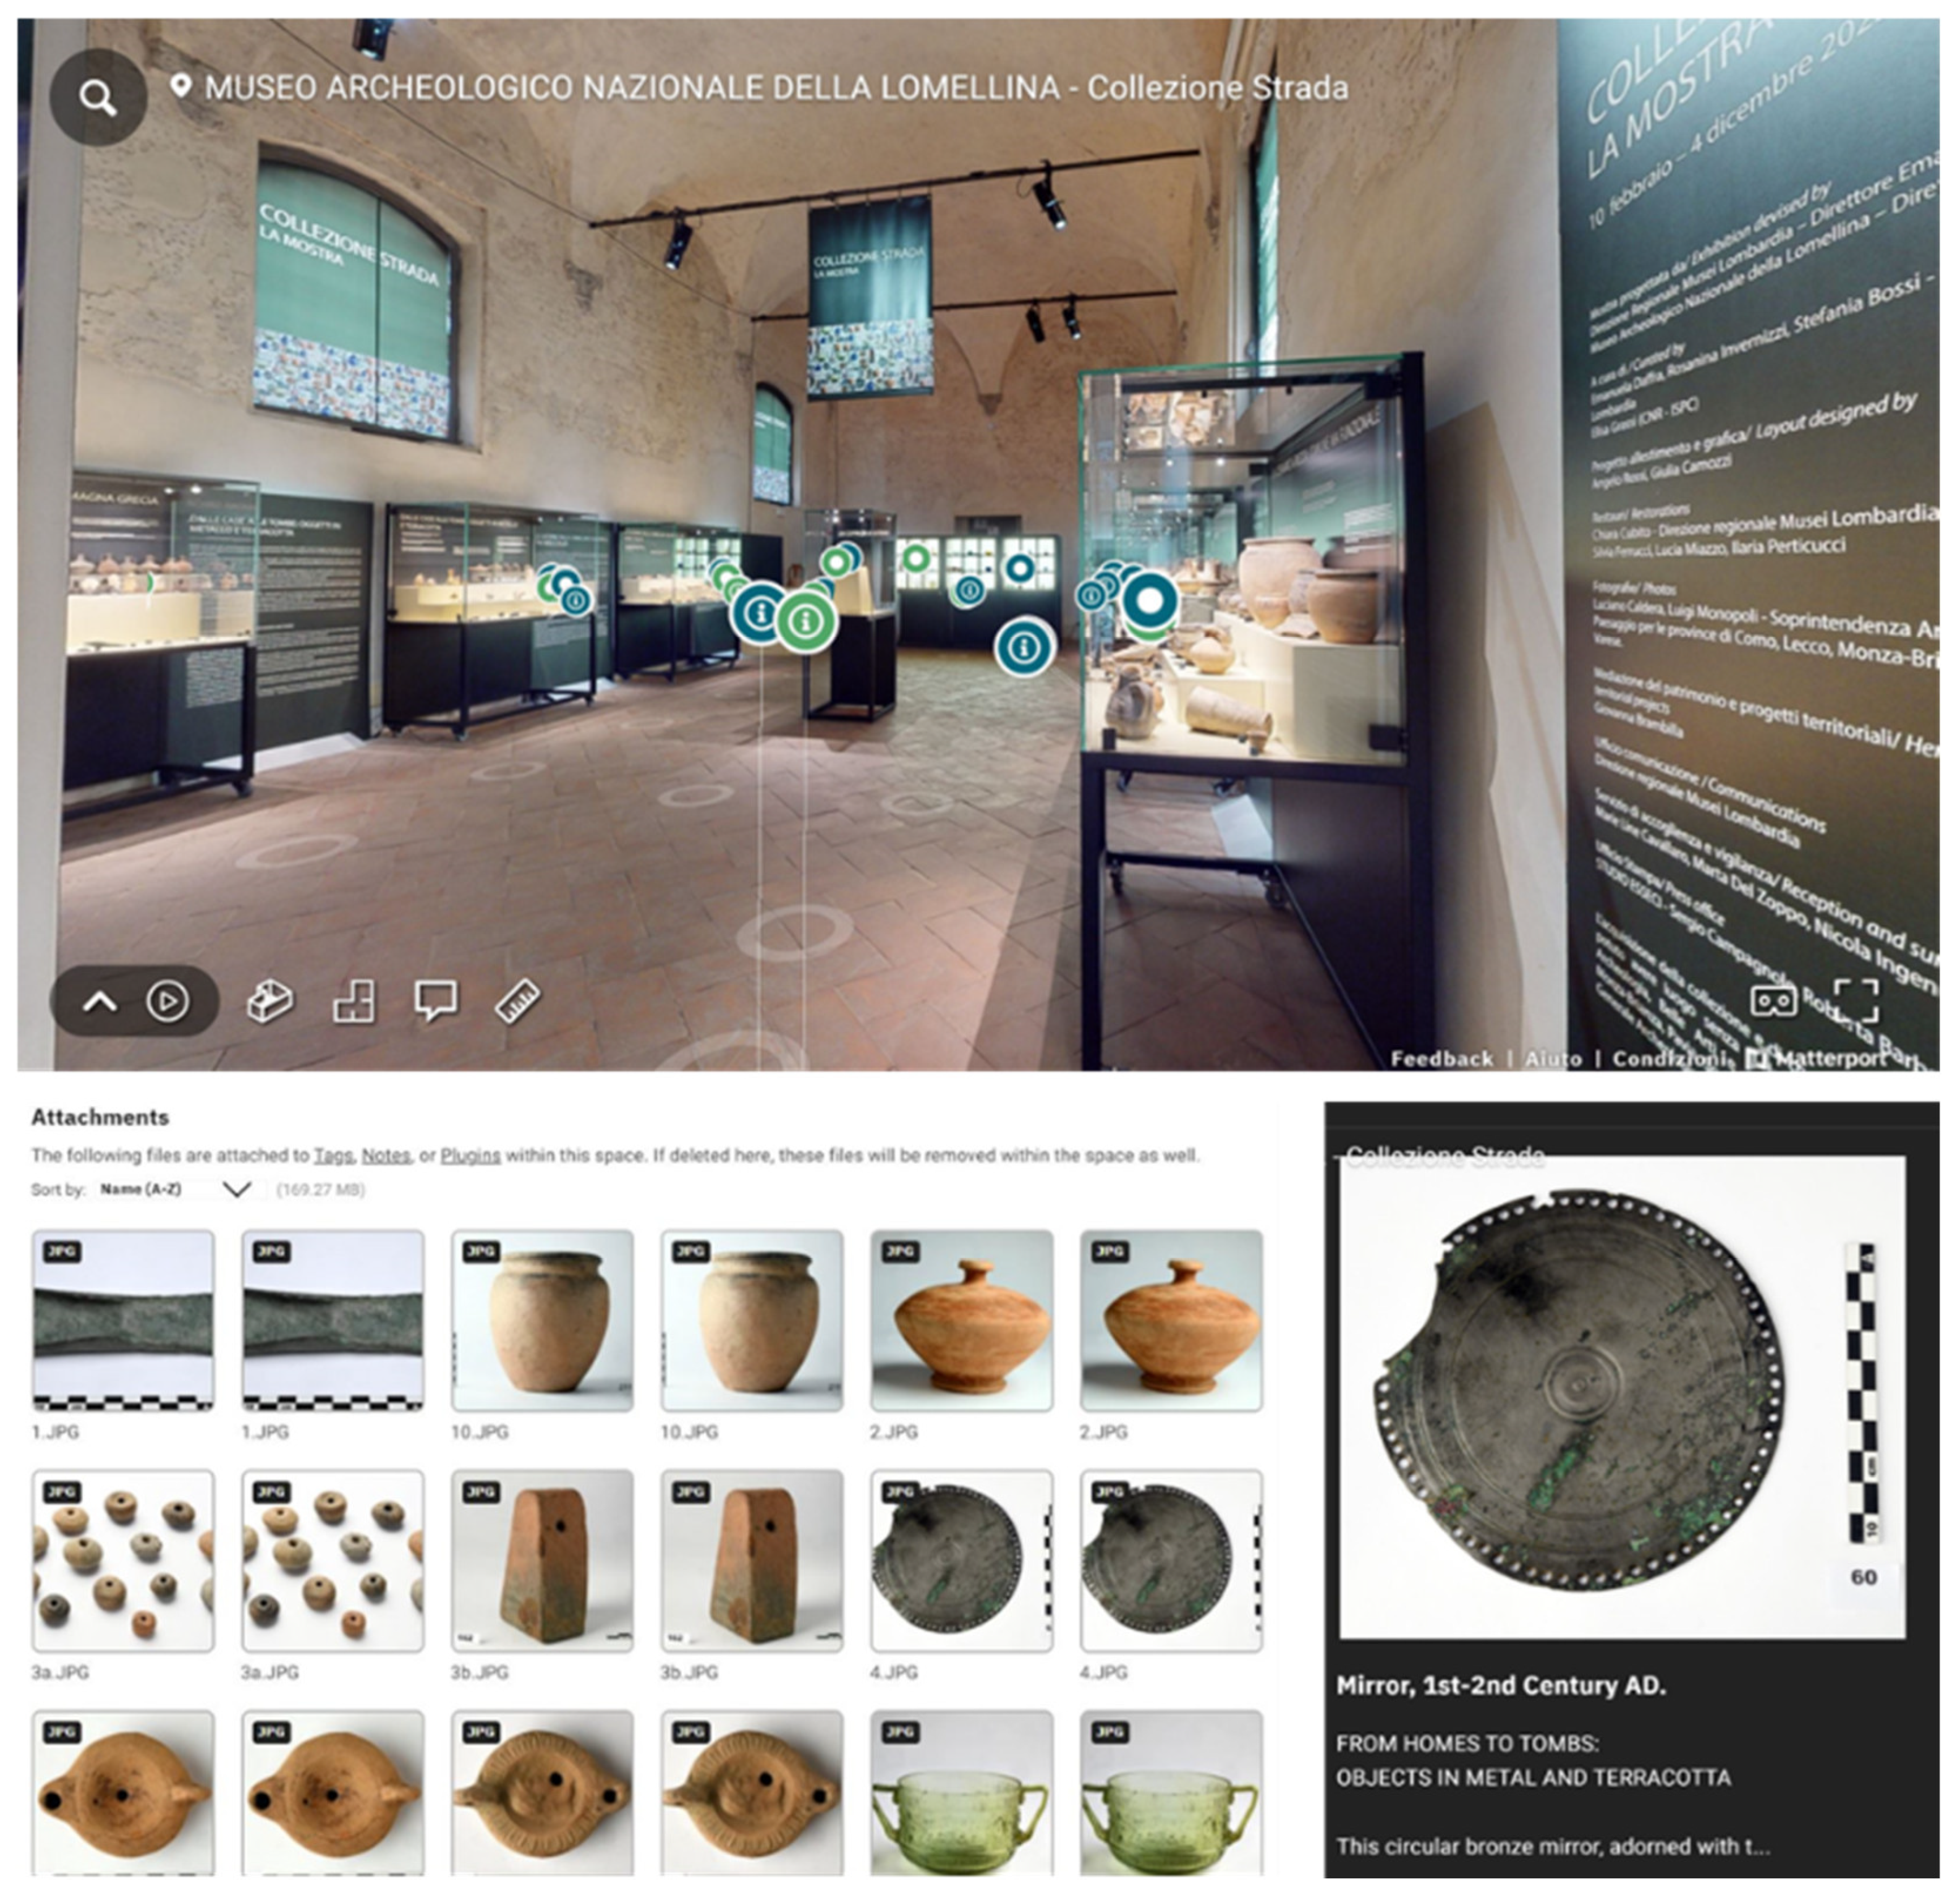
The Matterport platform [62] represents a peculiar case of exclusive web platform approach to reality capture and data processing and management solution. Matterport provides its own hardware (the Matterport Pro cameras), the support for some third-party panoramic cameras and features the capturing from smartphone cameras. The acquisition phase is managed through the mobile app that uploads the data directly on the platform for the processing from the field. From this phase on, almost everything is managed by the platform without barely any user intervention. The platform provides a 3D model with high quality texture of the captured space as well as the panoramic image tour. The model and the tour can be navigated by users also in VR, shared as links and embedded in web pages (Figure 4). The annotation tools comprise tags, text and media attachment to tags and various measurement tools. The platform provides also complementary services, generally billed separately, dedicated to the built environment and retail sector, as the automatic plan extraction, realization of Revit model, the download of e57 format point cloud, the upload on other platform (e.g., Google Maps) for marketing purposes. The main target user can be identified in the real estate and building management sector, as are provided intuitive navigation and annotation tools and aside from the capturing phase, no geomatic or IT skills are required to users. A recent development towards digital twinning is pursued partnership with AWS, aiming at integrating IoT sensors feed in the annotated 3D model.
NavVis IVION [63] is the web platform that manages capturing, processing and data access and sharing of the Mobile Mapping System (MMS) instrument produced by the company. It offers data storage and processing capabilities, as well as annotation and floor plan extraction. The main target users are building managers and surveyors, as well as factory owners, that have a dedicated Enterprise version, that offers improvements in archival space and security as encryption and single-tenant architecture.
Figure 2.
An overview of the Leica TruView LIVE platform. Top: the combined visualization of the structured point cloud from laser scanner and an IFC model that can be manually moved. Bottom, left: a photogrammetric unstructured point cloud visualized in the platform. Bottom, right: the 360-panorama of a scan view. The dataset is coming from Sacro Monte Calvario di Domodossola [64].
Figure 2.
An overview of the Leica TruView LIVE platform. Top: the combined visualization of the structured point cloud from laser scanner and an IFC model that can be manually moved. Bottom, left: a photogrammetric unstructured point cloud visualized in the platform. Bottom, right: the 360-panorama of a scan view. The dataset is coming from Sacro Monte Calvario di Domodossola [64].
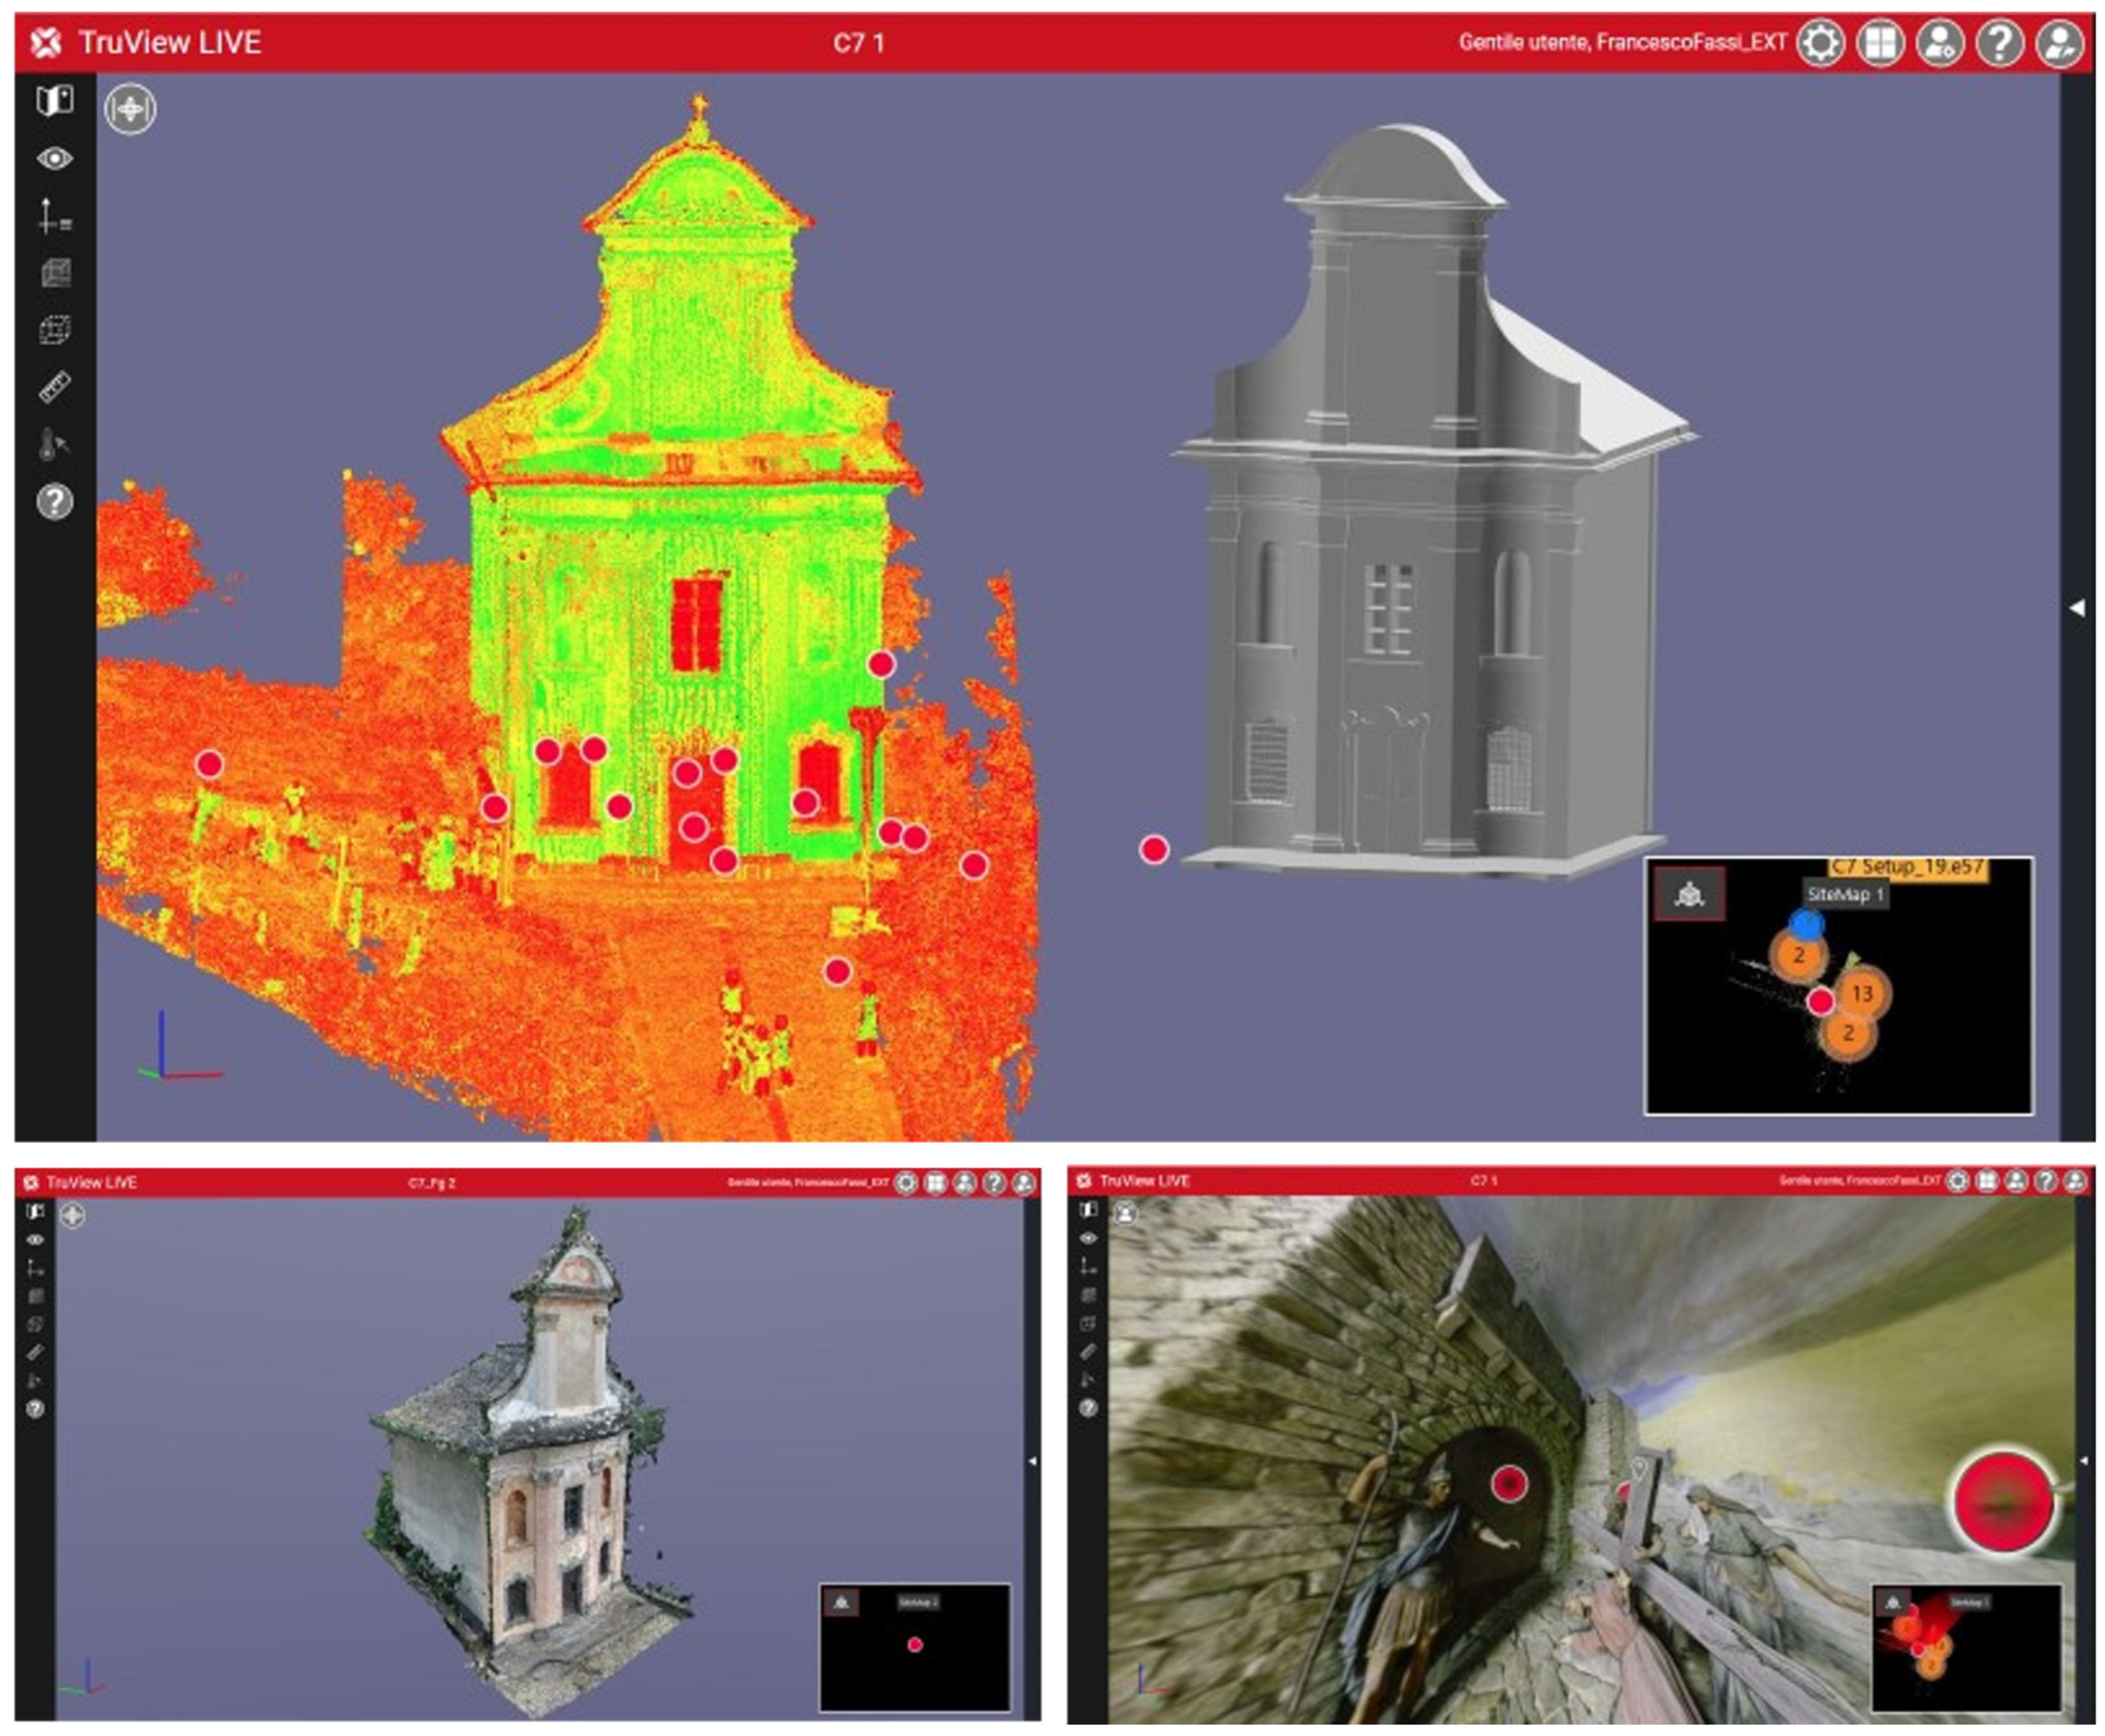
Figure 3.
An example of use of the Autodesk Drive platform, showing the scan navigation of the point cloud and the use of annotation function for information and media attachment. Dataset from [64].
Figure 3.
An example of use of the Autodesk Drive platform, showing the scan navigation of the point cloud and the use of annotation function for information and media attachment. Dataset from [64].
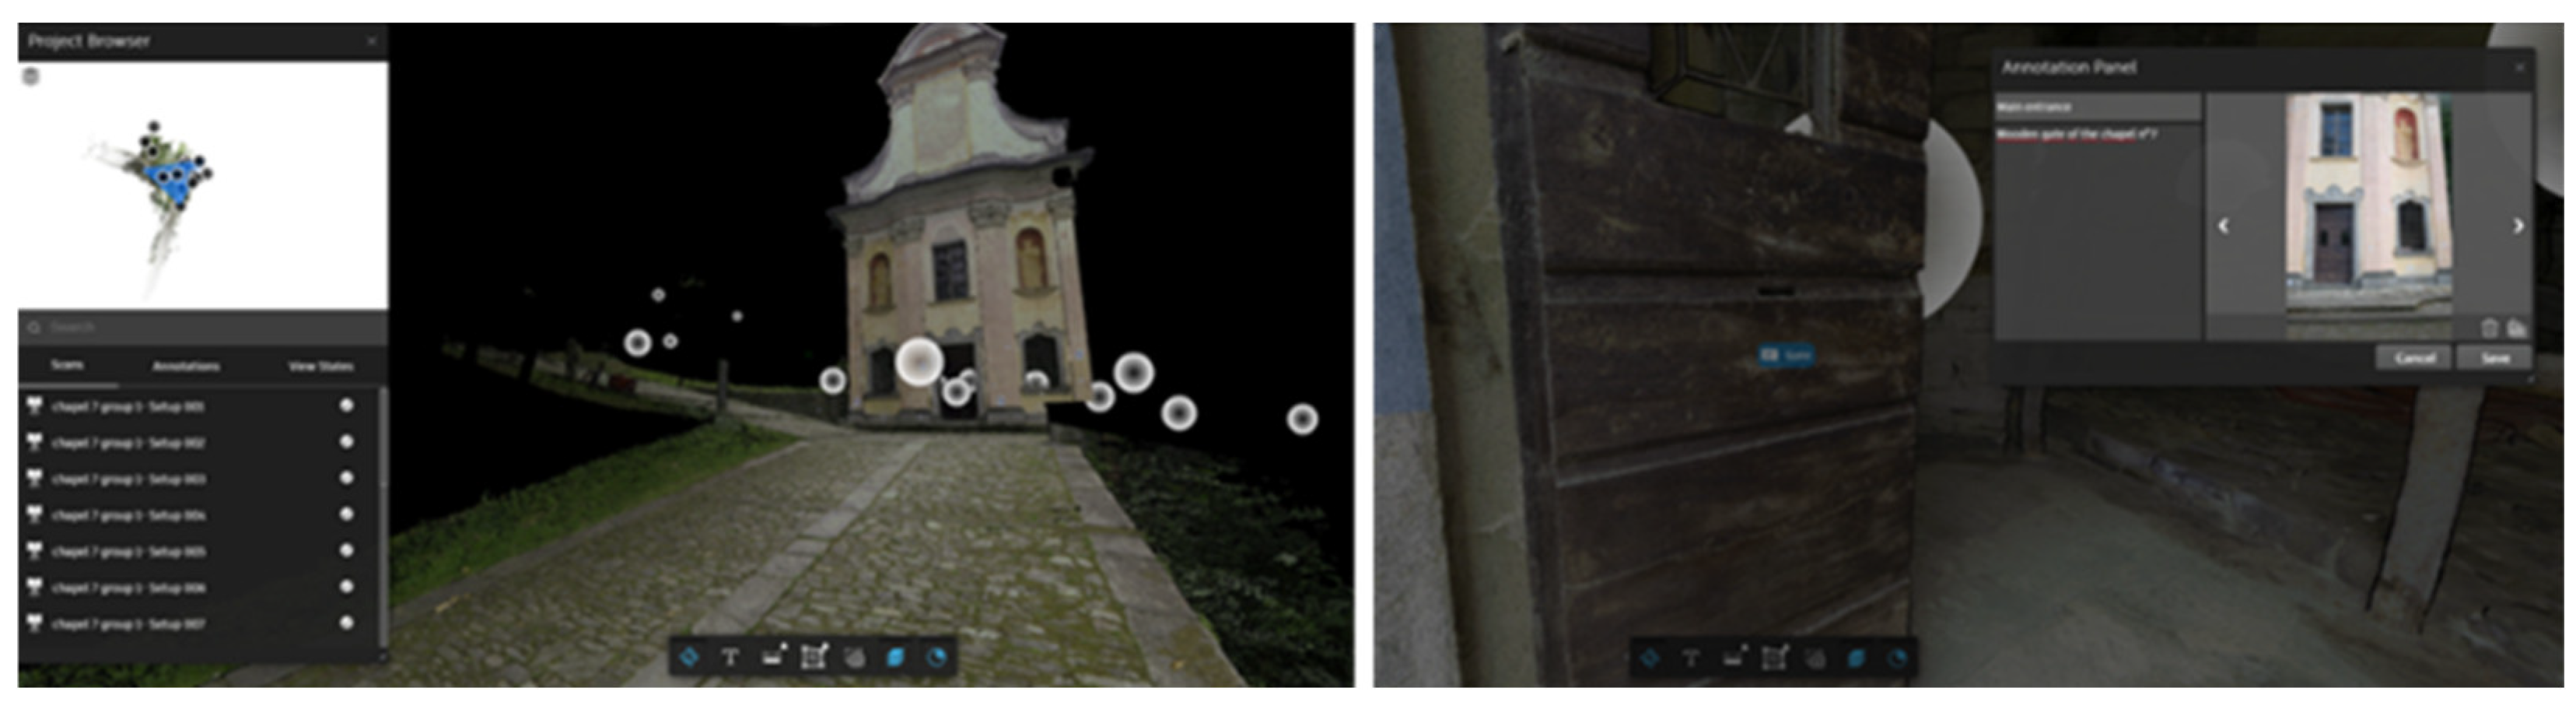
Figure 4.
An overview of the Matter platform on a cultural dissemination application. Courtesy of the Archaeological Museum of Lomellina [65].
Figure 4.
An overview of the Matter platform on a cultural dissemination application. Courtesy of the Archaeological Museum of Lomellina [65].
3.4. Processing-Oriented Platforms
As a complementary proposal from hardware and file-format dependent proprietary platforms, some platforms oriented their proposal towards the alignment, processing and analysis of survey data appeared. Processing-oriented platforms represent a clear example of the main aim of the cloud computing-based businesses, as described previously: relieve the final user of the up-front and constant cost of the processing infrastructure, rely on the performance of the network for data delivery and propose processing as a service to be subscribed or to pay for use. This type of platform is oriented towards users that occasionally deal with reality capture data but do not want to invest in dedicated hardware and on-premises software for data processing or users that need a shared collaborative environment to work remotely, without investing in dedicated server and backup.
An emerging trend in web platforms oriented towards processing is the integration of tools and services that are based on Artificial Intelligence (AI) both as part of a wider offer or even as main and specific purpose. The AI-based platforms are mainly directed towards automatic or semi-automatic segmentation and classification of 3D data as well as object-recognition capabilities, especially for point clouds.
HxDR (Hexagon Digital Reality) [66] is the core platform developed by Hexagon to build-on its web platform offer. HxDR was launched in 2020 [67] and it provides archival space, visualization, processing and collaboration tools to the Hexagon “powered by HxDR” ecosystem composed by the Reality Cloud Studio [68] platform for the reality capture data, LocLab Cloud [69] for the production of digital twins, HxGN GeoCloud [70] focused on the visualization and annotation of data at the territorial scale, and any application built using the HxDR API. Moreover, the Content Program [71] aims at deliver spatial data inside the HxDR environment, acting as a in-platform store for 3D and 2D geometrical data.
Reality Cloud Studio is a multi-purpose platform for reality capture developed from the HxDR core, that provides the that provides the main processing (e.g indexing, registration, meshing), visualization (e.g., sharing, virtual tour) and user management feature. The visualization engine provides the automatic meshing of the uploaded point cloud data for enhanced rendering. Reality Cloud Studio is data-agnostic and can work with several cloud and mesh format in input and output. The platform integrates processing workflow for data registration, meshing and cleaning, and is interoperable with various software of the Leica suite, importing or exporting projects, according to the intended uses and needs. The main aim of the platform is to move on the cloud some of the most common and requested features by average reality capture user, with pay-per-use or recurrent subscription available.
Vercator [72] is an exclusively processing-dedicated platform for registration of point clouds, classification and format conversion. It supports several structured and unstructured point cloud format, as well as some proprietary formats asl Faro, Z+F and Riegl. The Vercator project is developed by Correvate, an academic spin-out of the University College London, which licenses the patented core processing technology [73]. The platform proposes automatic targetless registration algorithms for point clouds coming from different sensors as well as the manual registration option It is possible to perform an automatic classification that uses several pre-trained models for different data coming from standard scenarios, as power line detection, highway and urban roads, railway recognition, aerial point cloud, ground extraction and some specific building object recognition. Moreover, the platform provides also a format conversion service for point clouds. The pricing model of Vercator is based on the processed number of points, usually billed for millions of points. The business model, considering the pricing method and the offered services is to propose the full reality capture processing pipeline (registration, classification, export) as a cloud service billed based on the use of resources.
Flai [74] is a platform that has as main offer AI tools for geospatial data processing and classification. Once the user has uploaded the data the platform offers several built-in processing modules to be combined in a pipeline though a drag-and-drop visual programming interface. The processing modules are pre-trained AI models for standard scenarios as tree segmentation in forestry point clouds, generic geospatial object extraction etc (Figure 5). In the same interface, is possible also to program for filtering, fine tuning and exporting, allowing users to build their specific workflow. After processing the users can manually re-collocate the misclassified points and create custom class, other than the LAS classification scheme. Flai adopts a hybrid subscription method with a fee that covers for storage and unlimited data retention, and a pay-per-download method for the data export., highlighting that the main business model is to propose a user-friendly service for geospatial data classification with pre-trained models, addressing also to non-specialized users.
Pointly [75] is devoted to the geospatial data annotation using AI-based classifiers. The platform proposes some pre-trained AI models for standard use-case scenarios as aerial lidar data, urban asset classification from Mobile Mapping Scans (MMS) or highway classification. It is also provided a user-specific classification service based on a custom sample dataset. Pointly supports the default LAS classification scheme and allows users to use custom labels for the classes if needed (Figure 6). Aside from the significative AI processing tools and a visualization module, no other significant tools are present even for measuring and annotation. Pointly is mainly a processing platform directed towards users that need digital twins at urban or territorial scale but are not interested in investing internal resource in the data processing and classification, and rather prefer buying it as a service. In this perspective, the use of a web platform allows users and vendors to interact and refine the data classes working in the same environment.
3.5. Framework and Visualizers
The most diffused type of platforms is represented by the visualizers, that allow users to navigate and explore with a smooth experience the geometrical data, thanks to efficient indexing algorithms for fast rendering of the 3D geometry. Visualizer could also provide some additional annotation tools for tagging and media attachment, improving the experience. For simplification reason, in this category are comprised also not standalone platforms but modules and frameworks that can be sued to build a custom platform. Inside this category it is worth to mention the platforms devoted to 360-tour platforms that, even if not displaying usually any 3D geometry, allow users to navigate captured space and eventually take annotations and measures on the panoramic images. Considered the effectiveness and resolution of the images, this typology of solution can be useful also in the field of CH.
FlyVast [76] is a platform for advanced visualization of unstructured point clouds and meshes. Allows users to create projects with various datasets and different clouds and meshes. 3D geometries can be measured and annotated using the various available tools. Among the others, it is particularly effective the section tool that allow to slice the point cloud and draw on the section and place annotations also with attachments (Figure 7). FlyVast proposes also the possibility to share entire projects or specific views or representations (e.g a section of the cloud with annotations), enriching the possibilities of collaboration and sharing. Another distinctive feature is the presence of unsupervised segmentation of the point cloud [77] that extracts distinctive features from point cloud objects. This last feature is potentially very powerful as can allow users to add semantic meaning to the point cloud but now seems to be challenged by geometrically complex architectural datasets (Figure 8). FlyVast is a platform suitable for users that need to deal with generic unstructured point clouds for any source and with mesh models in an intuitive environment that provides tools for 3D annotation and possibility to extract 2D representations, that are still of common use in some sectors.
Atis.cloud [78] is an advanced visualizer with balanced features and a rich set of tools. It supports both unstructured and structured point clouds, and various mesh format. For the structured point clouds is available the 360-tour navigation of the scan stations, as well as VR visualization. Atis.cloud supports and visualizes custom scalar fields for point clouds, coming from processing in external software (Figure 9, bottom left) as well as point cloud classification both in LAS class scheme [79] and custom class scheme. Also, 3D models are supported and displayed. Users can manually align models called “resources” to reference objects, called “sources” and perform dimensional tolerance analysis, which is an interesting feature for architectural design and planning, reconstruction and digital anastylosis (Figure 9. top). The platform provides the common annotation and measurement tools that can be used for issue and note reports, with tagging and attachment functions, a feature potentially useful in the building management sector and collaborating with other users. Moreover, it is available an orthophoto generation feature (Figure 9, bottom right) that can be particularly useful in some context and is able to exploit the potential of the 3D geometry present on the platform.
Benaco [80] is a platform that proposes 360° panoramic tours using static scans, panorama images and photogrammetry projects. The platform processes the input data and realizes the tour and a 3D model for image projection. The user can orbit the model or navigate through the way points, in which can use the annotation tools, that comprise labeling and measurement tools. Benaco is simple in its use and can be used for inspection and annotation on panoramas.
3DUserNet Vision [81] manages various type of survey data and CAD models. The platform scheme is oriented for share survey data and user collaboration. It supports also classification display for point clouds. Each project is structured in tasks, that are work sessions with dedicated representation of the data with specific views and annotation meant for a predefined purpose. The platform supports versioning of the projects. It provides advanced annotation and measurement tools, a sectioning tool for 3D geometry and a document repository that supports any type of data.
Euclideon udCloud [82] is the platform based on the Unlimited Detail (UD) technology by Euclideon, that features a powerful and efficient indexing search engine for massive point clouds that builds a voxel for each pixel of the screen [83], with the goal of using efficiently the same dataset for any global and detailed visualization. This feature is particularly effective in large geospatial datasets coming from several detailed surveys. The udCloud platform features a powerful rendering engine and several annotation and measurement tools as well as section, bounding box and elevation profile tools. The same UD technology is present in an on-premises desktop application, udStream [84] and also a SDK is available as framework for custom platform development.
Xeokit [85] is an open-source visualizer distributed for free with some limitations, and with commercial license with full features. It supports various 3D data format as meshes, IFC models and point clouds in LAS format. It features various annotation and measurement tools. It is provided as a Software Development Kit (SDK) and its functionalities can be expanded working on the code. The Xeokit main interesting feature is related to the wide range of file format for several types of 3D data, from point clouds to BIM models in IFC format: this aspect is particularly suitable for developers that aim at building a web platform able to display geometries from various origin and in different format.
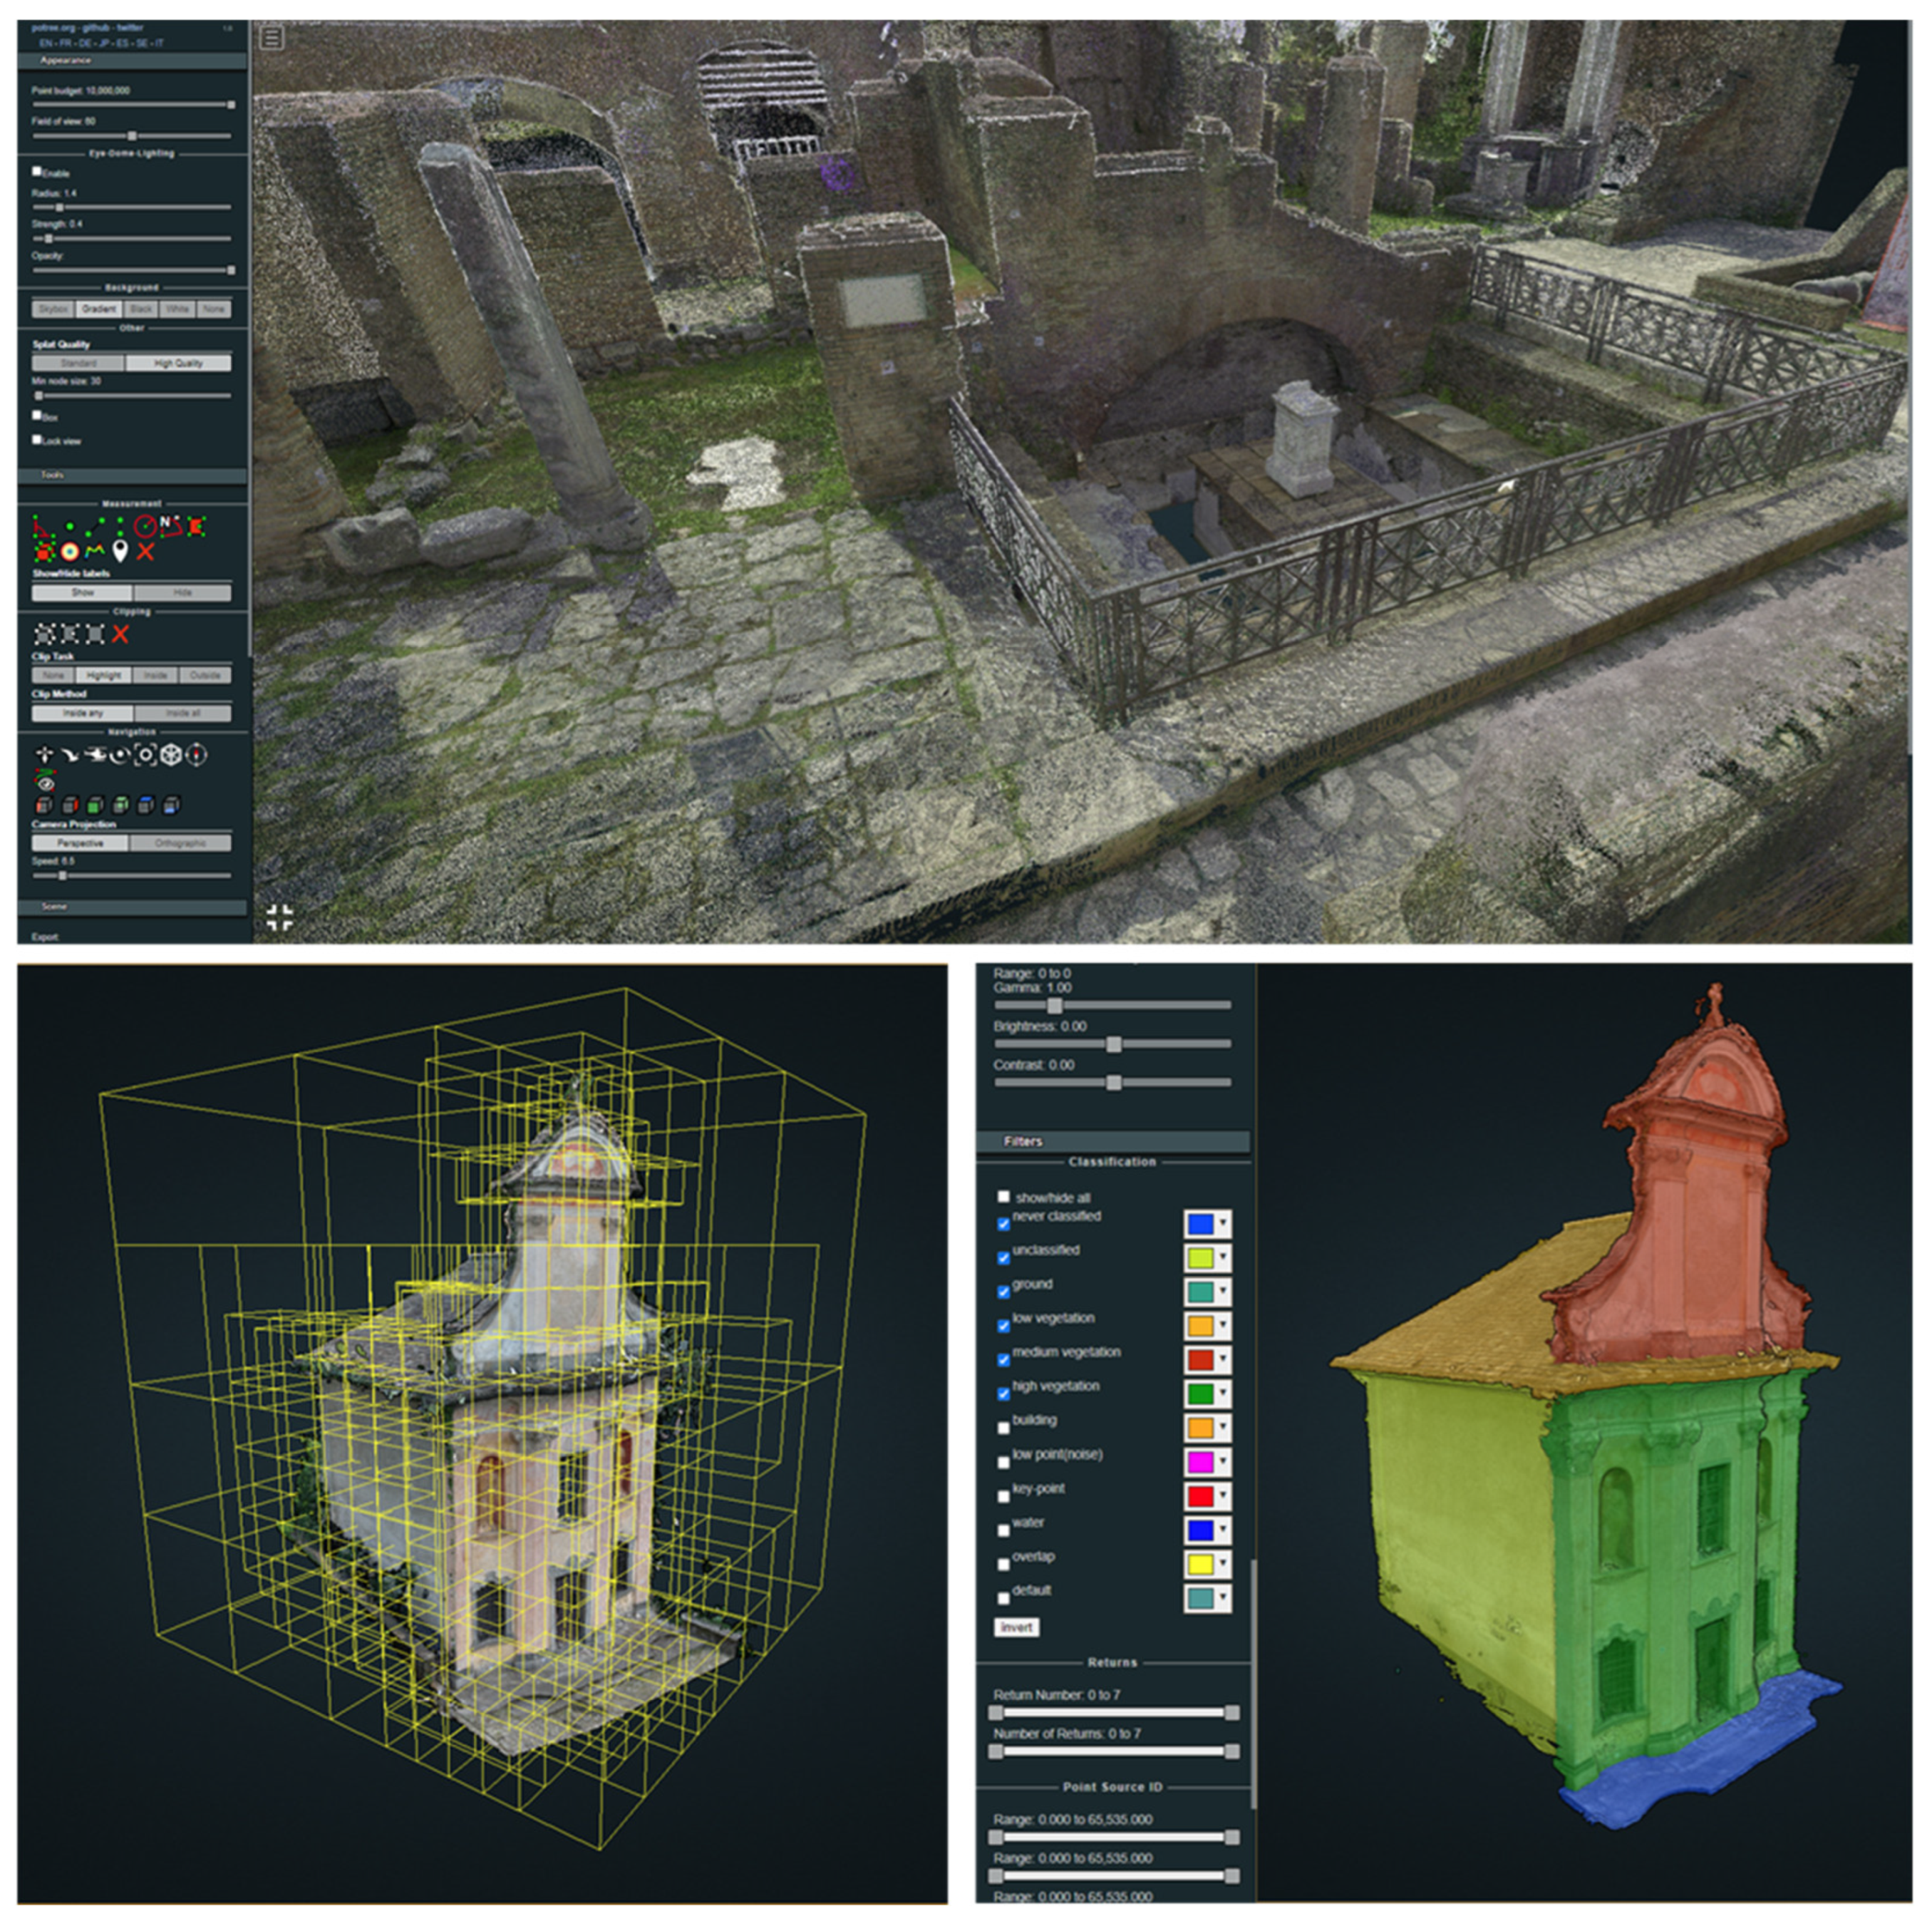
Potree [23] is one of the most diffused point cloud visualizer. The project [86] originated from the SCANOPY one [87] and is still under constant development. Potree is an open-source converter and visualizer based on WebGL that can be used both as a standalone desktop application built through Electron framework [88] as well as an embedded tool in websites. The use of Potree for web applications is a common choice both for use cases that involve data at a territorial scale and for experiences at an architectural scale [10]. Potree presents various rendering modes of the point cloud and supports also the visualization of point cloud classes from LAS scheme. It integrates various annotation tools that allow users to take several measurements on the point cloud (distance, area, volume), put point labels with textual description, cut dynamic sections of the cloud and create tours through waypoints. Potree is a powerful multi-scale visualizer as it features an octree-based indexing of the point cloud, that creates several levels of detail with double resolution between each in the same dataset, that are rendered according to the required visualization, as shown in Figure 10 [12].
Sketchfab [89] is a platform that acts as an online repository for 3D models, both mesh and point clouds. It is at the same time a visualization and dissemination platform and a showcase and online shop of models. Users can upload their models and share them with the community, can embed the visualizer in their website or sell the downloadable model to interested customer through the Sketchfab shop. The main focus of the platform is on rendering and scene building for models, that makes it suitable for effective dissemination of CH assets.
3DHOP (3D Heritage Online Presenter) [90,91,92,93] is a visualizer for 3D data distributed as SDK for building custom platforms. It works mainly with high resolution meshes but it supports also point clouds in PLY format. 3DHOP is widely used and adopted especially in the CH dissemination field, as it provides a performative visualization environment and various annotation and representation tools. It features a points of interest tool that allow users to identify specific points on the model that act as a bookmark and can be enriched with some narrative and pictures of the real objects. It is present also a tool for changing the illumination of the scene which is particularly useful to increase the readability of engraved or decorated surfaces.
Cesium Ion [24] is a platform with a strong geospatial focus, that provides an effective rendering based on 3D tiles [94] of massive datasets. The platform supports a large number of 3D data format, including point clouds and features an internal repository of geodata as satellite imagery, terrain and building models worldwide. Ion is a stand-alone web platform, but the general business model of Cesium is directed towards companies and developers that need a geospatial data management framework to integrate in their applications. Cesium provides to developers the CesiumJS Javascript library, the SDK of the Ion platform and several open-source environment and resources for major 3D software and formats, as Unity, Unreal Engine and Open 3D Engine (O3DE). The main business model of Cesium appears to be, on one hand to build a solid commercial offer based on high-performance and versatile geospatial data visualization, on the other hand to be recognized as a main player in the open geospatial data field, empowering in this way the commercial enterprise.
Entwine [20] is a framework for point cloud indexing released as free software under LGPL license. It is based on a octree-based storage format, the Entwine Point Tile [95] and its main purpose is to render massive point cloud from aerial survey. Entwine is only a data organization library and it needs a viewer module in order to display its data, like Potree, Cesium or Plas.io [96,97], a drag-and-drop browser visualizer based on LAS file format and its derivations.
Figure 7.
An example of the section and crop tools in the FlyVast platform that allows user to enlight and isolate parts of the point clouds and to cut 2D sections, vectorialize, attach labels with information and measure, on the dataset of Aosta Cathedral [98].
Figure 7.
An example of the section and crop tools in the FlyVast platform that allows user to enlight and isolate parts of the point clouds and to cut 2D sections, vectorialize, attach labels with information and measure, on the dataset of Aosta Cathedral [98].
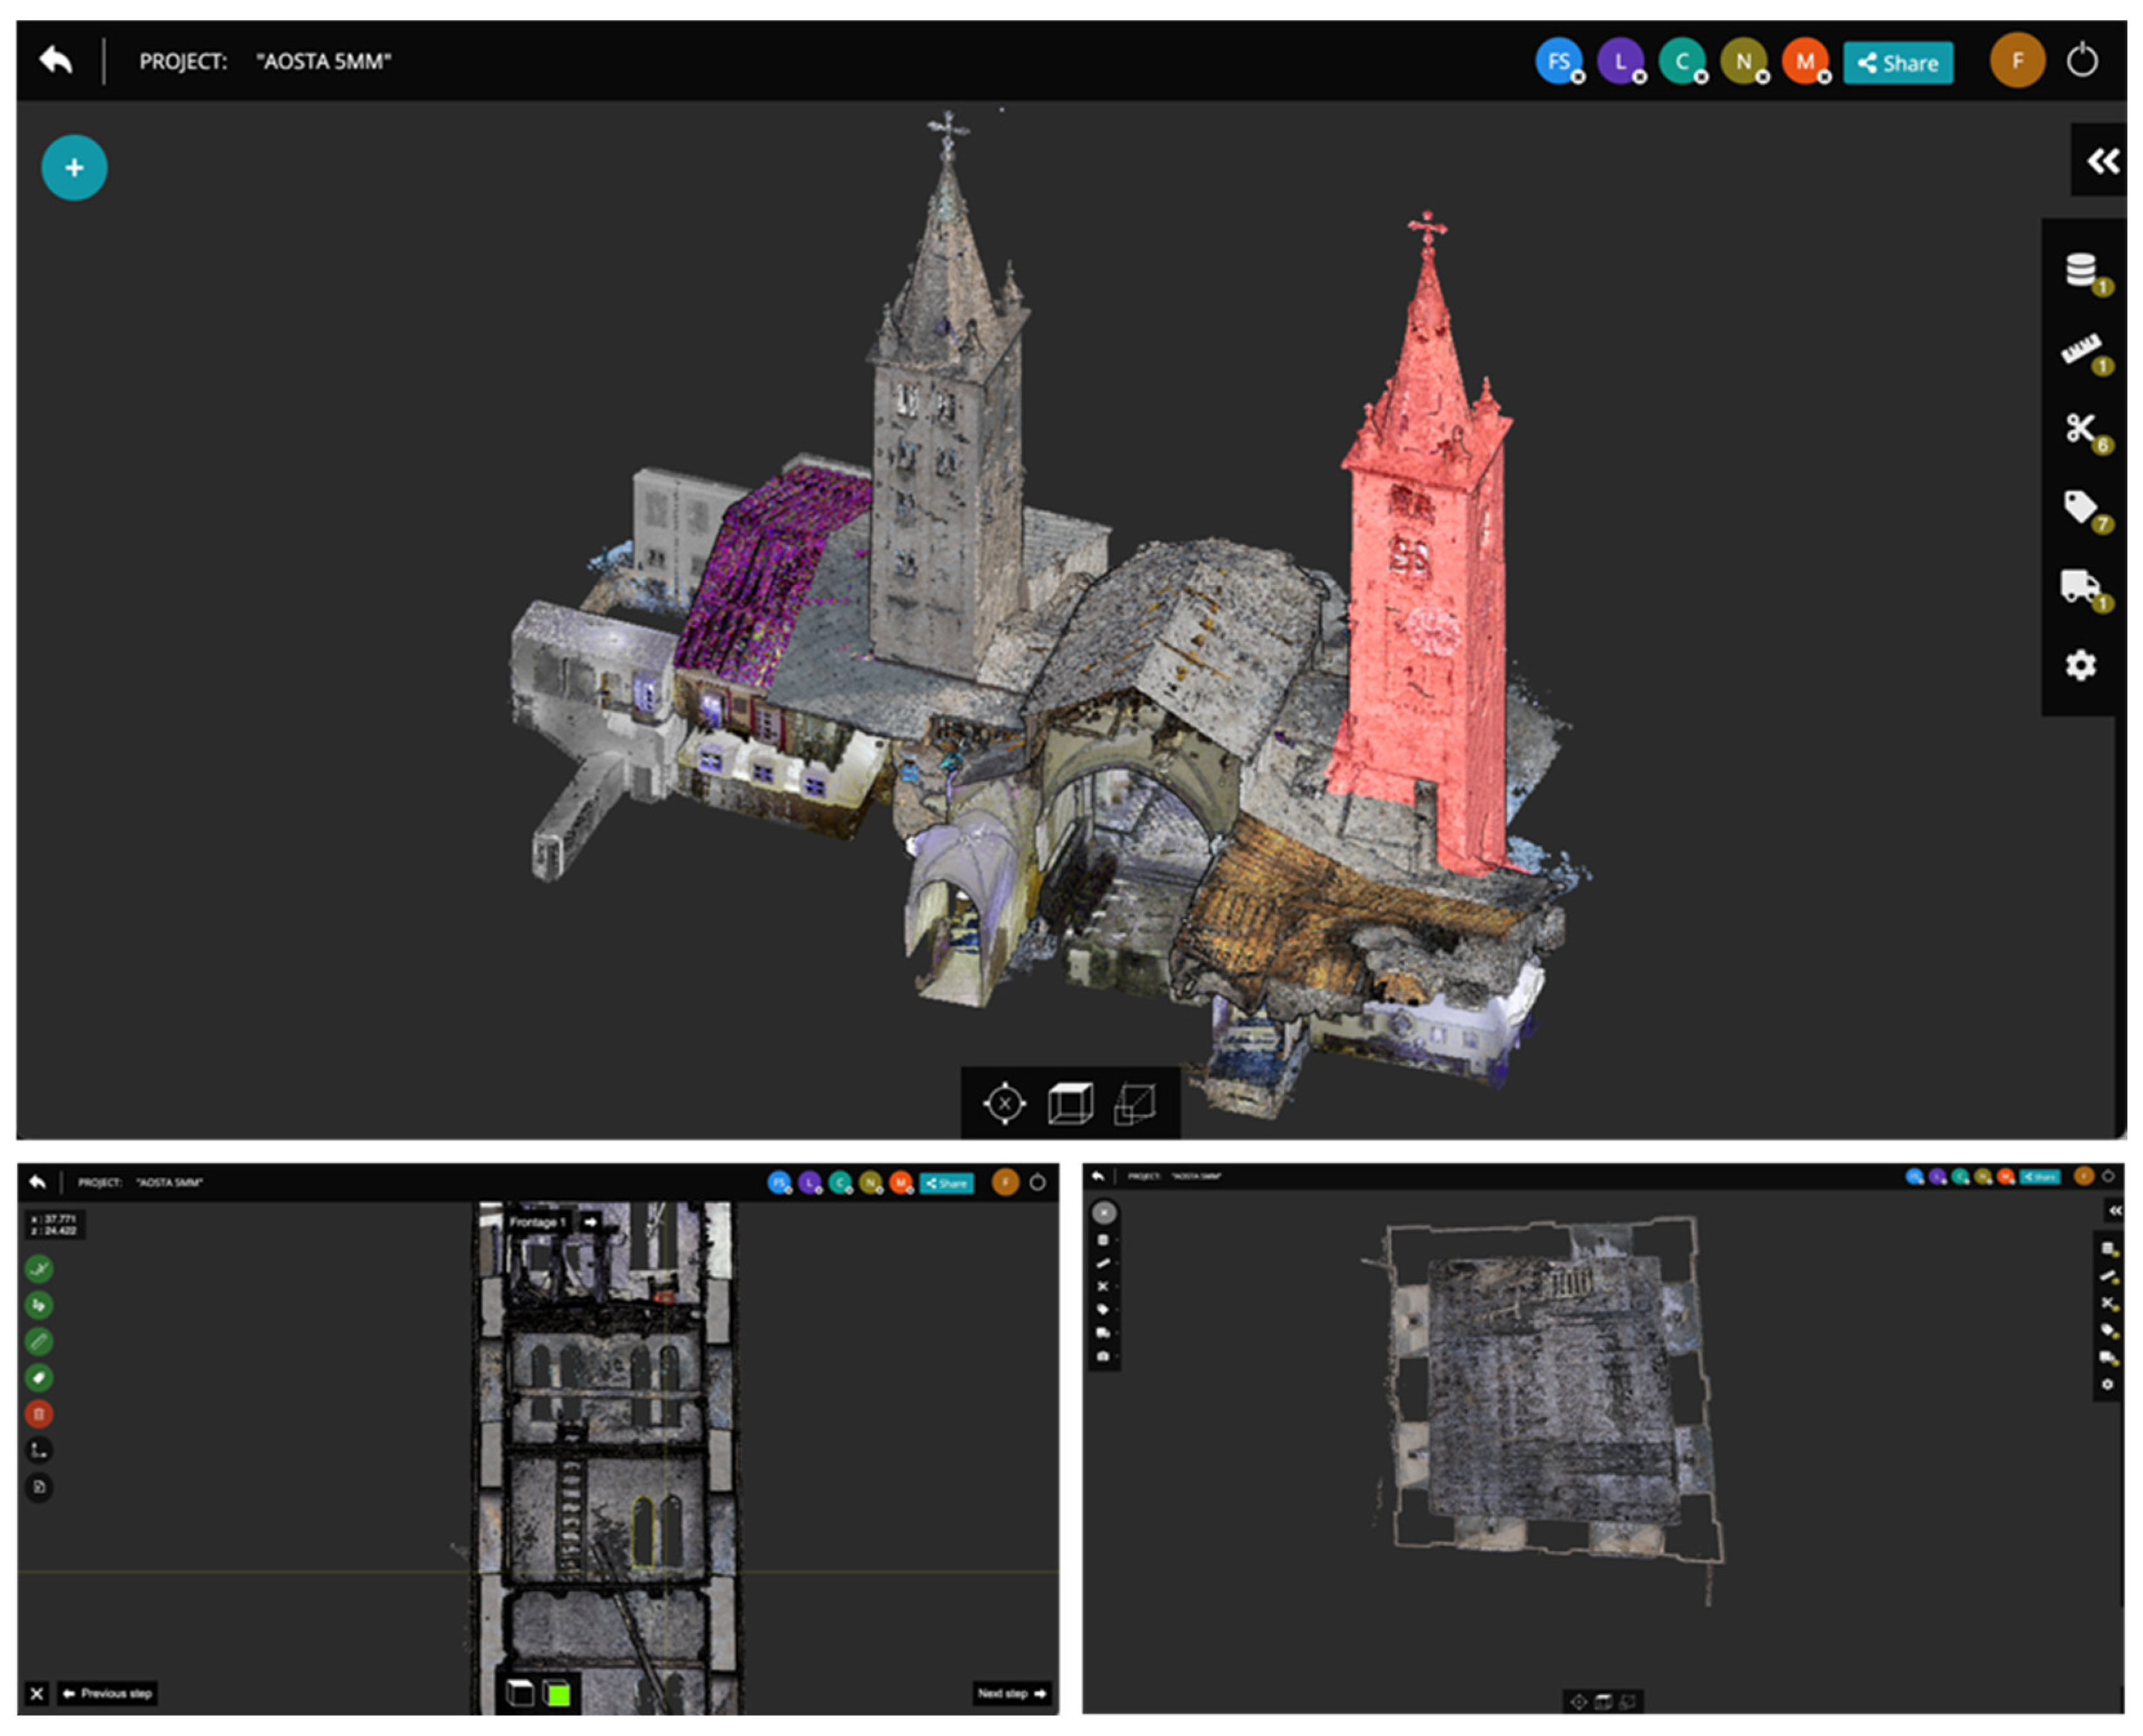
Figure 8.
Example of automatic unsupervised segmentation on the FlyVast platform, applied to a CH case study. The panel on the right shows the geometrical properties of the segment. The dataset is coming from Summer School activities in Ghesc, Ossola Valley [99].
Figure 8.
Example of automatic unsupervised segmentation on the FlyVast platform, applied to a CH case study. The panel on the right shows the geometrical properties of the segment. The dataset is coming from Summer School activities in Ghesc, Ossola Valley [99].
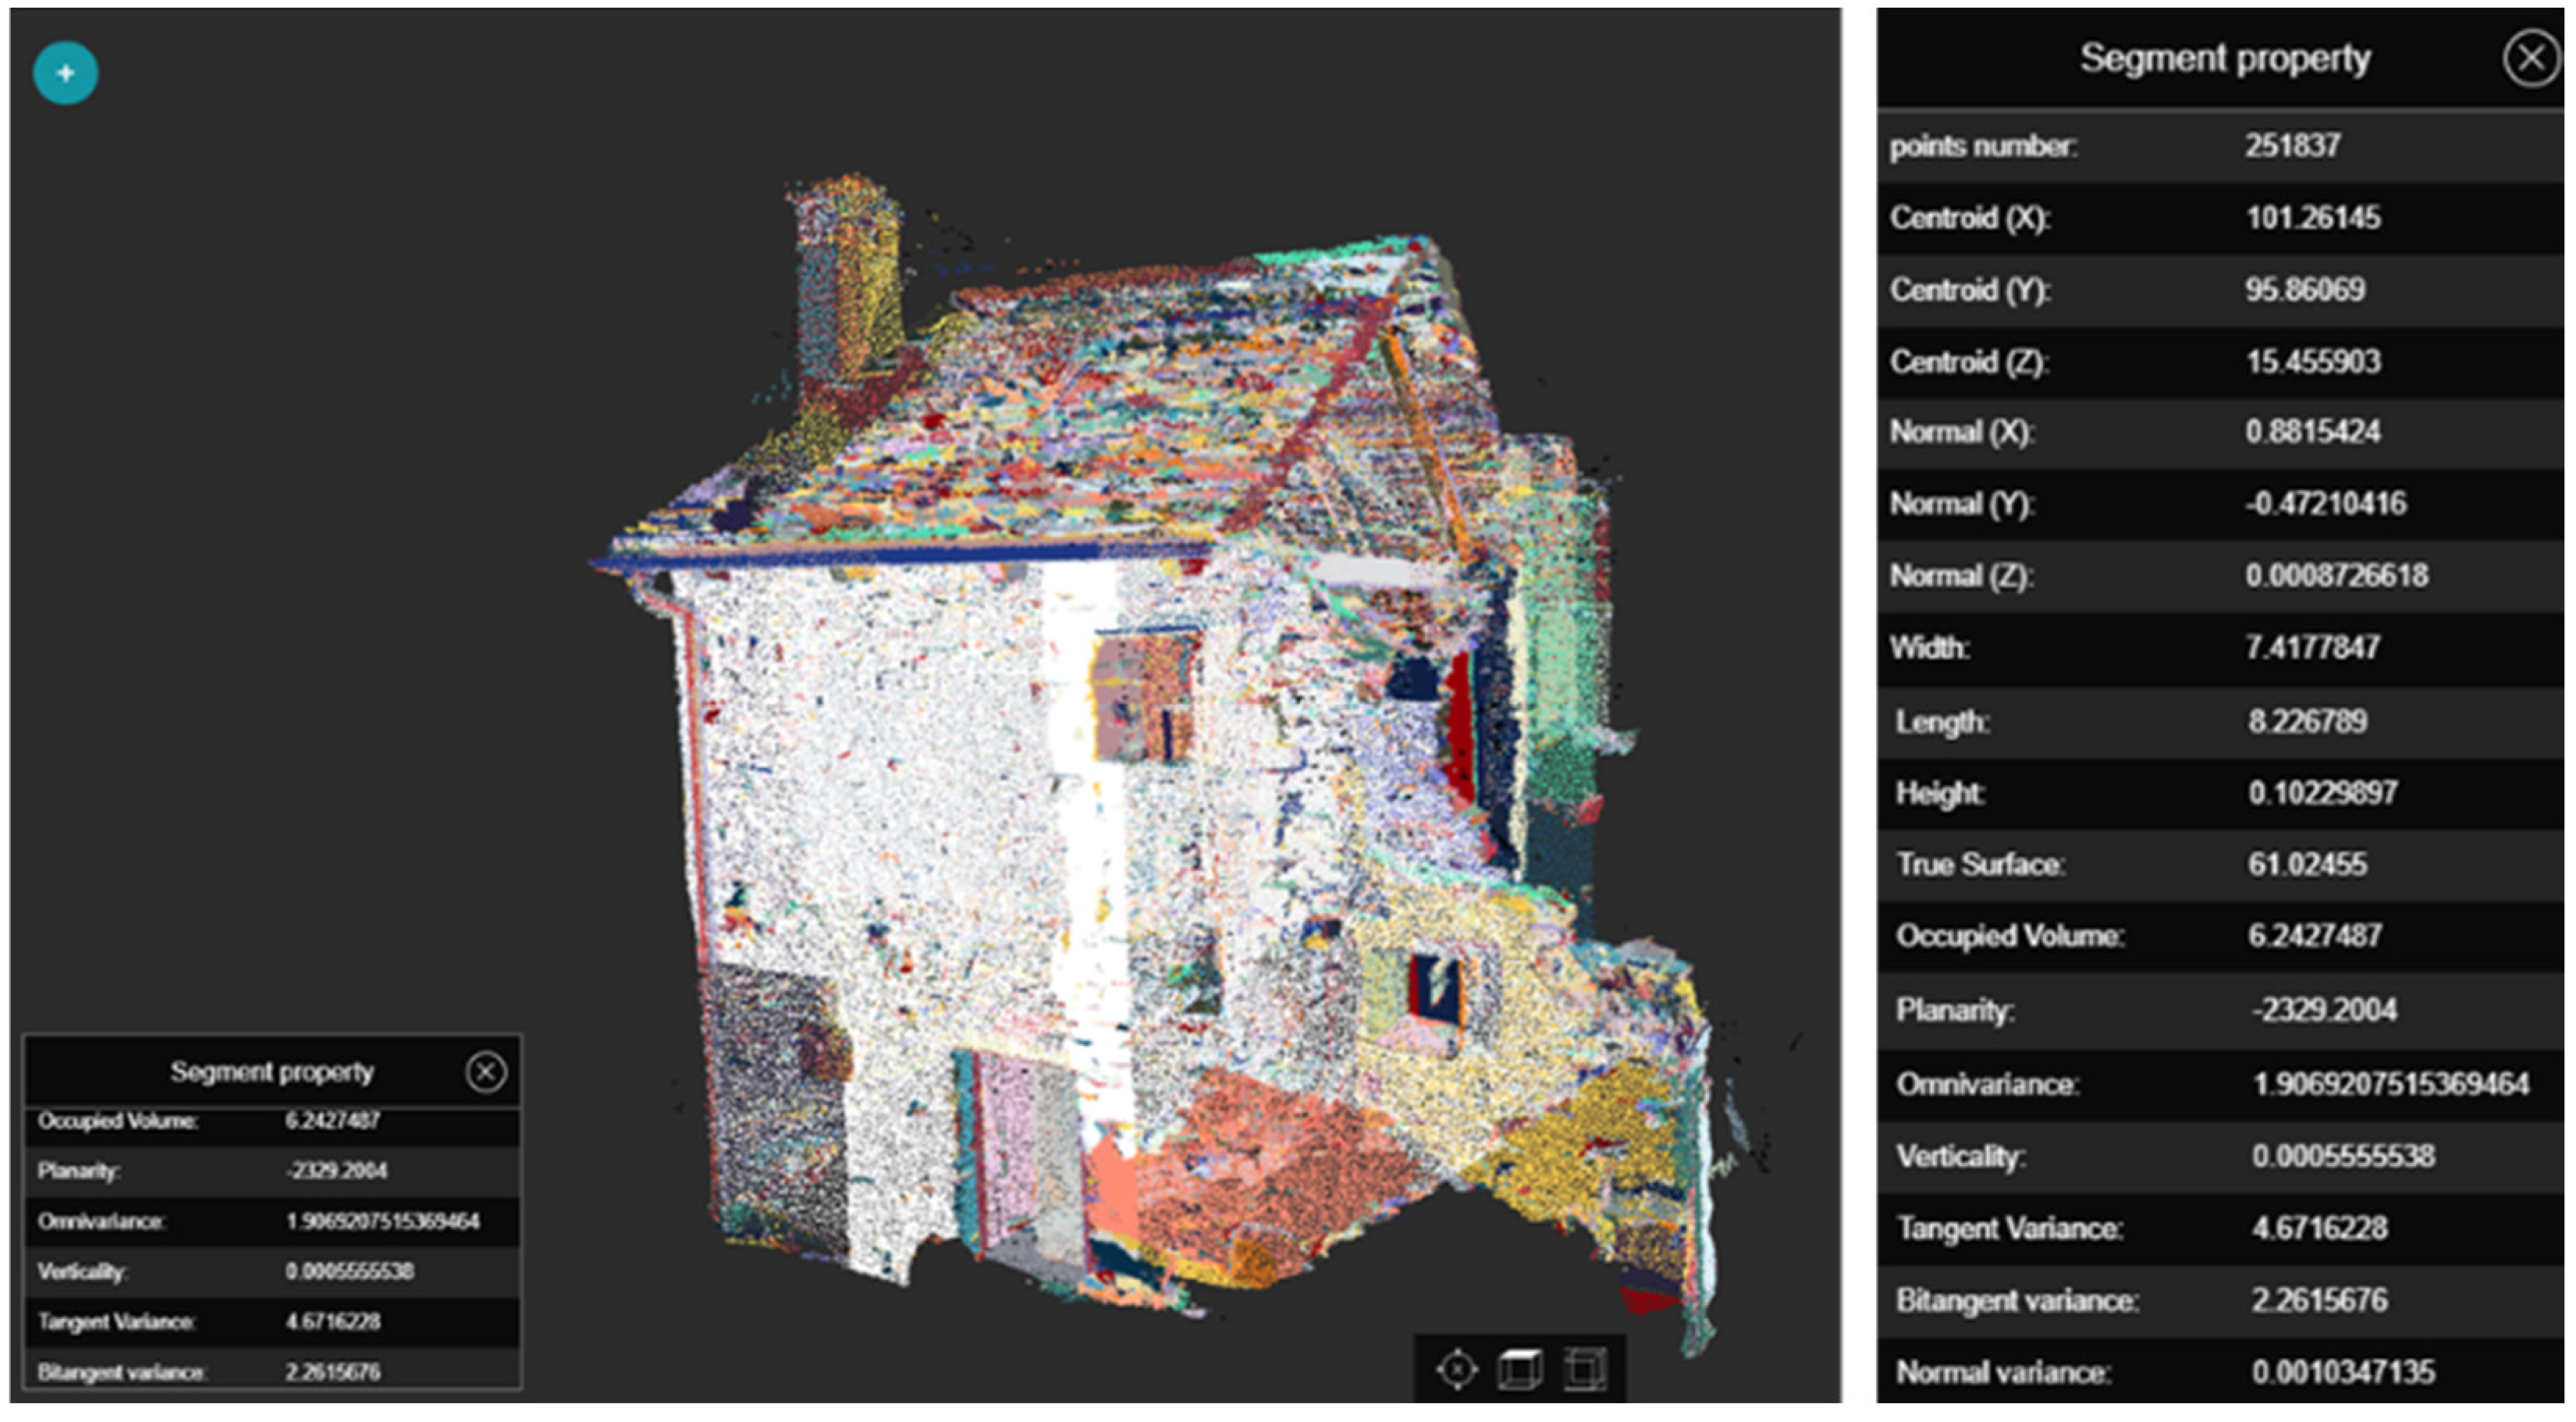
Figure 9.
Example of workflow in the Atis.cloud platform. Top: visualization of structured point cloud and manual alignment of a movable object, an IFC model. Bottom, left: a visualization comparison between colour and a custom scalar field (planarity with 0.1m radius, calculated on an external software). Bottom, right: orthophoto of the colored point cloud, processed inside the platform. Dataset from [64].
Figure 9.
Example of workflow in the Atis.cloud platform. Top: visualization of structured point cloud and manual alignment of a movable object, an IFC model. Bottom, left: a visualization comparison between colour and a custom scalar field (planarity with 0.1m radius, calculated on an external software). Bottom, right: orthophoto of the colored point cloud, processed inside the platform. Dataset from [64].
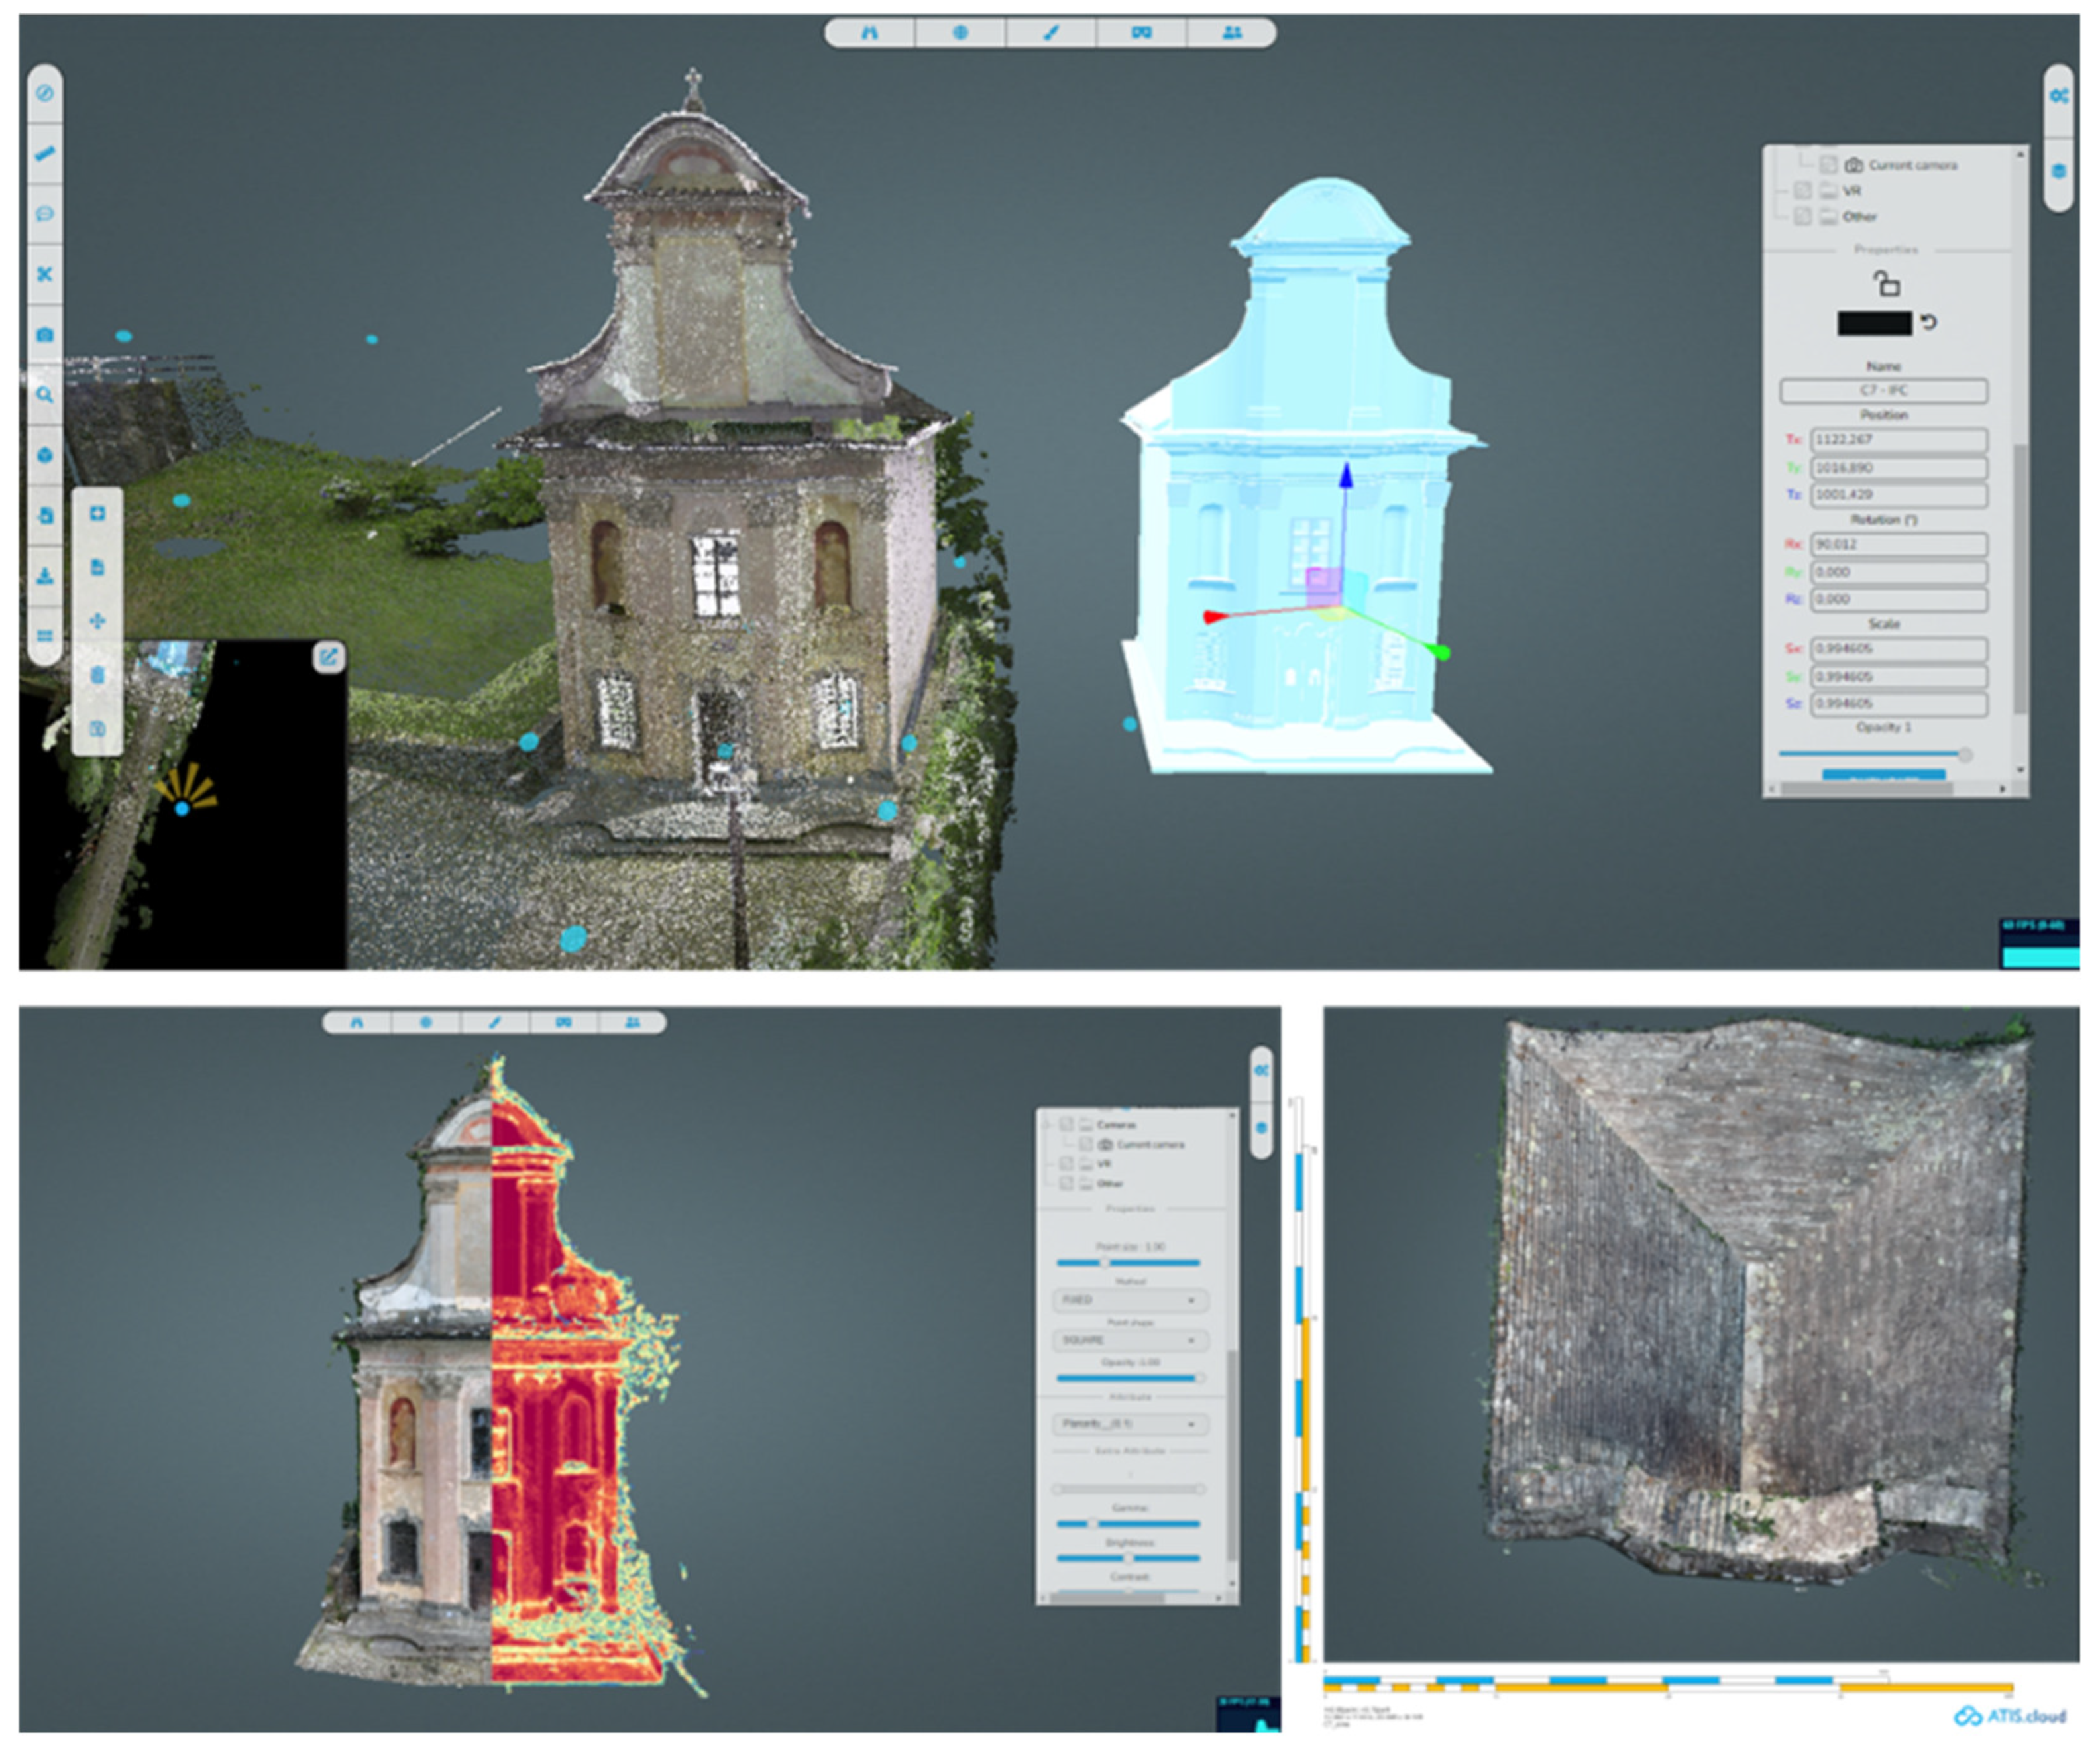
Figure 10.
Examples of point clouds displayed in Potree. On top: the point cloud of the Fonte Giuturna in the Roman Forum, Archaeological Park of Colosseum, Rome displayed from the Potree viewer of the SyPEAH platform [100].Bottom left, the full octree structure of a point cloud in Potree. Bottom right the point cloud classes visualization with the LAS schema, that fosters labels from geospatial semantics. Dataset from [64].
Figure 10.
Examples of point clouds displayed in Potree. On top: the point cloud of the Fonte Giuturna in the Roman Forum, Archaeological Park of Colosseum, Rome displayed from the Potree viewer of the SyPEAH platform [100].Bottom left, the full octree structure of a point cloud in Potree. Bottom right the point cloud classes visualization with the LAS schema, that fosters labels from geospatial semantics. Dataset from [64].
3.6. Facility Management Platforms
A consistent and structured proposal for the built environment sector is represented by the platforms for facility management and BIM-like solutions. These platforms are oriented towards building managers, real-estate operators and construction companies. They provide a shared environment in which the three-dimensional data is displayed and navigable by the users, that have at disposal annotation, tags and in some cases a document repository to be used as tools for facility management e.g., to mark criticalities and assign tasks.
Cintoo [101,102] is a platform devoted to the construction sector with a clear building and infrastructure management approach. It works mainly with structured scans, mobile mapping scanning, UAV and generic unstructured point clouds. Unstructured point clouds are processed to appear as structured by Cintoo to obtain virtual waypoints for the 360-tour. Other than the panoramic tour, the platform has an effective 3D viewer for point clouds, models and user-uploaded meshes. Cintoo automatically processes a mesh from the input data that is used for improving the rendering capabilities through a feature called TurboMesh [103]. Several annotation, slicing and measurement tools are available, as well as tagging abilities. Moreover, CAD and BIM models are supported and can be uploaded, visualized and manually aligned by the user to the survey data and vice versa (Figure 11, top left), displaying a heat map with the deviation analysis of the alignment (Figure 11, top right). The platform appears to be BIM- and facility management-oriented as it completes its features with a data repository that supports some of the most common file format for image, drawing and documents. Users can annotate the geometry and assign tasks to other users with description and media (Figure 11, bottom). Cintoo embodies various useful features for users that plan to manage reality capture data, CAD, models and documents in a single environment.
Bloom Explorer [104] is directed towards the construction management sector. It supports structured and unstructured point clouds, CAD and IFC models, that can be displayed together. The uploaded geometries can be registered together and clashed in order to check for interferences. For structured point clouds, is available the 360-tour exploration. It features a clear interface and several advanced tools for annotation, measurement, point cloud slicing and cropping, as well as floor surface evaluation and demolition and construction tools, specifically dedicated for the AEC sector. Bloom proposes also an Autodesk product plugin for data sharing with on-premises application.
4. Discussion
In this article, several solutions and methods for managing and sharing geometrical and non-geometrical data have been enquired. The results are summarized on the following tables. It must be considered that the summarized data have been tested at the moment of the writing and might change due to evolution and further development of the platforms. Moreover, for some frameworks, the presence of a feature depends on the specific implementation by the final developers. In these cases, the field is marked with a footnote.
In Table 2 the input section describes how the data are uploaded on the platform (by the user or automatically) and of which type. The automated column takes into account the feature offered by some platforms in which the upload is made automatically from the capturing software. The output section describes which data can be downloaded from the platform (e.g., for backup or to be used in other software). The original data column refers to the possibility to download the data that were uploaded by the user in the input phase. Full takes into account the possibility of downloading the geometrical data that have been processed by the platform as a whole entity, while part takes into account the possibility of downloading a user-defined portion of the data (e.g., through the use of a bounding box). Annotations refers to the possibility of downloading the user-produced non-geometrical data that have been inserted as labels, tag and annotations localized on the geometry.
What emerges from the research as a global consideration is that the platforms and the tools used to manage data are radically different for purpose and kind of user. For non-geometrical data, most of the tools available at the present time have been developed with the specific goal of managing archives and collections, namely aggregation within the care of a cultural institutions of physical and digital heritage objects that have been gathered by topic or for historical reasons. For the management of a collection, it is important to have a solid data structure that must be adequate to the nature of the objects and their curatorship needs, which is the core of any database. The available software solutions are widely consolidated in their field and on the market are present several tools available as commercial and open-source or for free, meeting most of the needs of cultural institutions.
The platforms that are intended for dissemination can be considered as in-between a collection management system and a visualization platform. They are open to public and embed visualization tools according to the hosted media, that can be also 3D models of manufacts or architectures. In this case the role of geometrical data is the representation of a database record and the interaction between users and geometries is usually low. These platforms set as main goal to archive and preserve a collection of data and to grant access to the extended public for knowledge, education and dissemination purposes.
The panorama of the platforms oriented towards the management of geometrical data is wide and heterogeneous as it offers multiple solutions for hosting, visualizing, sharing and processing 3D data from reality capture processes. In this article was analysed a selection of commercial platforms for 3D data management focusing on the business model, that determines which kind of users and specific tools they offer.
Most of the examined platforms propose themself as tools able to solve specific problems within the 3D data management domain. For these platforms the geometrical data is used as unitary and rigid, not being subdivided into components. Even the platforms dedicated to the point cloud classification and object recognition handle the clouds as a monolithic, annotated object, as their main goal is to process the data to identify in it the classes for further uses in other software environment.
From the conducted analysis emerges that within the domain of web platforms, the possibility to manage the 3D data coming from Reality Capture structure using a semantic structure as data model it is not available at the moment. At the present time it is possible to manage single architectural components attaching information and data through labeling and annotation functions offered by several platforms.
Assuming a holistic point of view on the subject of data management, the forthcoming evolution of the web platforms can be directed towards the development of tools able to manage the geometrical data as a collection of components constituting a building or an architectural object using a data structure, that can be standardized or user determined.
Within a structured and building-oriented database model, is possible to manage the information related to the building management and restoration, that can be located in the 3D model, allowing users to navigate the data and information from the database and from the 3D. Assuming that the captured data is the most accurate representation of the physical space and real object, the possibility of using it directly within a database structure adequate to support the maintenance and management process for the built environment without losing geometrical or non-geometrical information is promising and could improve the efficiency and possibilities of the building management sector.
As mentioned before, at the present time this possibility is not commercially available as ready-made and the information management within the 3D model require users to adapt with the available tools e.g., annotations, labels, point of interest etc. Considering the panorama of the available tools and frameworks for rendering and visualizing 3D objects, and considering the availability of consolidated database managers, the possibility that developers can structure existing components in order to obtain a platform with the described characteristics is concrete.

Table 1.
Synthesis of the main features of the Cultural Dissemination platforms.
| Name | Website | Initiative | Multimedia | 3D | Virtual tour | Narrative |
|---|---|---|---|---|---|---|
| Cyark | https://www.cyark.org/ | private | X | X | - | X |
| Europeana | https://www.europeana.eu/ | public | X | X | - | X |
| Global Digital Heritage | https://globaldigitalheritage.org/ | private | X | - | - | - |
| Google Arts and Culture | https://artsandculture.google.com/ | private | X | X | X | X |
| Scan UA | http://scanua.com/ | private | - | X | - | - |
| Smithsonian Open Access | https://www.si.edu/openaccess | public | X | X | - | - |
| Tapestry | https://tapestry.cyark.org/ | private | - | - | X | X |
Table 2.
General information and input-output features of the examined market-available platforms.
| General information | Input | Output | ||||||||||
|---|---|---|---|---|---|---|---|---|---|---|---|---|
| Point Cloud | 3D Model | Geometrical | ||||||||||
| Platform | Category | Availability | Automated | Structured | Non struct. | Mesh | BIM/IFC | 360 img | Original data | Full | Part | Annotations |
| Leica TruView LIVE | Dig. ecosys. | Commercial | - | X | X | X | X | - | - | - | - | - |
| Autodesk Drive | Dig. ecosys | Commercial | - | X | X | X | X | - | X | X | - | - |
| FARO WebShare | Dig. ecosys | Commercial | - | X | X | - | - | - | - | X | X | - |
| FARO HoloBuilder | Dig. ecosys | Commercial | - | - | - | - | - | X | - | X | - | X |
| Matterport | Dig. ecosys | Commercial | X | - | - | - | - | X | - | X | - | - |
| NavVis IVION | Dig. ecosys | Commercial | - | X | X | - | - | - | X | X | X | - |
| Reality Cloud Studio | Processing | Commercial | - | X | - | X | - | - | X | X | - | - |
| Vercator | Processing | Commercial | - | X | X | - | - | - | X | X | - | - |
| Flai | Processing | Commercial | - | - | X | - | - | - | X | X | X | - |
| Pointly | Processing | Commercial | - | - | X | - | - | - | X | X | - | - |
| FlyVast | Visualizer | Commercial | - | - | X | X | - | - | X | X | X | X |
| Atis.cloud | Visualizer | Commercial | - | X | X | X | X | X | X | X | X | - |
| Benaco | Visualizer | Commercial | - | X | - | - | - | X | X | X | - | X |
| 3DUserNet Vision | Visualizer | Commercial | - | - | X | X | - | X | X | X | X | X |
| Euclideon udCloud | Visualizer | Commercial | - | - | X | X | X | - | - | X | - | - |
| Xeokit | Framework | Open-source and comm. | - | - | X | X | X | - | -1 | -1 | -1 | -1 |
| Potree | Framework | Open-source | - | - | X | - | - | - | - | X | X | X |
| Sketchfab | Visualizer | Commercial | - | - | X | X | - | - | X | X | - | - |
| 3DHOP | Framework | Open-source | - | - | X | X | - | - | -1 | -1 | -1 | -1 |
| Cesium Ion | Visualizer | Free, commercial | - | - | X | X | - | - | X | X | - | - |
| Entwine | Framework | Open-source | - | - | X | - | - | - | -1 | -1 | -1 | -1 |
| Cintoo | Facility mgt | Commercial | - | X | X | - | X | X | X | X | X | - |
| Bloom Explorer | Facility mgt | Commercial | - | X | X | - | X | - | X | X | X | - |
1This feature might depend on the framework implementation by final developers.
Table 3.
Visualization, annotation and processing features of the examined web platforms.
| General Information | Visualization | Annotation | Processing | |||||||||||
|---|---|---|---|---|---|---|---|---|---|---|---|---|---|---|
| Classification | Registration | |||||||||||||
| Platform | Category | 3D | Orthophoto/Section | Panoramic view | VR ready | Measure | Label | Crop/Bound. box | Supported | Manual | AI | Manual | Automatic | Mesh creation |
| Leica TruView LIVE | Dig. ecosys | X | - | X | X2 | X | X | X | - | - | - | - | - | - |
| Autodesk Drive | Dig. ecosys | - | - | X | - | X | X | X | - | - | - | - | - | - |
| FARO WebShare | Dig. ecosys | X | X | X | X | X | X | X | - | - | - | - | - | - |
| FARO HoloBuilder | Dig. ecosys | - | - | X | X3 | X | X | - | - | - | - | - | - | - |
| Matterport | Dig. ecosys | X | X | X | X | X | X | X | - | - | - | X | X | X |
| NavVis IVION | Dig. ecosys | X | - | X | - | X | X | X | - | - | - | X | X | - |
| Reality Cloud Studio | Processing | X | - | X | - | X | X | X | - | - | - | - | X | X |
| Vercator | Processing | X | - | - | - | X | - | - | X | X | X | X | X | - |
| Flai | Processing | X | - | - | - | - | - | X | X | X | X | - | - | - |
| Pointly | Processing | X | - | - | - | - | - | - | X | X | X | - | - | - |
| FlyVast | Visualizer | X | X | - | - | X | X | X | X | - | X | - | - | - |
| Atis.cloud | Visualizer | X | X | X | X | X | X | X | X | - | - | X | - | - |
| Benaco | Visualizer | X | X | X | X | X | X | - | - | - | - | - | X | - |
| 3DUserNet Vision | Visualizer | X | - | - | - | X | - | X | - | - | - | - | - | - |
| Euclideon udCloud | Visualizer | X | X | - | - | X | X | X | - | - | - | - | - | - |
| Xeokit | Framework | X | - | - | -1 | X | X | X | -1 | - | - | - | - | - |
| Potree | Framework | X | X | - | - | X | X | X | X | - | - | - | - | - |
| Sketchfab | Visualizer | X | - | - | - | - | X | - | - | - | - | - | - | - |
| 3DHOP | Framework | X | - | - | - | X | X | - | - | - | - | - | - | - |
| Cesium Ion | Visualizer | X | - | - | - | X | - | - | X | - | - | - | - | - |
| Entwine | Framework | -1 | -1 | -1 | -1 | -1 | -1 | -1 | X | - | - | - | - | - |
| Cintoo | Facility mgt | X | - | X | X | X | X | X | - | - | - | X | - | X |
| Bloom Explorer | Facility mgt | X | - | X | - | X | X | X | - | - | - | X | X | - |
1This feature might depend on the framework implementation by final developers. 2This feature is available on the desktop software. 3Present as legacy feature.
Conclusions
The field of digitization underwent a significant evolution in terms of automation and usability of survey instruments, software tools, processing algorithms and ways to manage and share the data. Web platforms that are widely available and accessible at the present time, represent an efficient way for managing, archiving and sharing the 3D data and their related information. On one side, such web-based tools relieve users from the costs of providing powerful hardware and from the system maintenance, easing the access to the reality capture data to potentially any institution or subject through a reduction of the initial investment needed. On the other side, the issues of data ownership, long term archive and accessibility, system migration and any other topic related to the data lifecycle has to be addressed carefully establishing shared and solid data management policies. The significant advancement in the accessibility of 3D data is accustoming professionals of various sector to the advantages of reality capture and of the use of geometrical data, increasing awareness and then empowering the request and the availability of more advanced tools to manage all the building or heritage lifecycle and maintenance with a strong support of reliable geometrical data from reality capture.
The emerging challenge that will be faced is related to the management of the significant amount of data that are digitized right now and that will be in the future, with increasing request by final user and data quality and accuracy delivered by the instruments. In this context, the development of efficient web platforms for data sharing will be a fundamental resource if they will be able to be a valid alternative to standalone software and enable generic users to access and work with the data without any specific training and dedicated hardware.
Acknowledgments
Authors would like to thank all the platform developers that provided specific access to their products for evaluation purposes and support: Hexagon with Simone Oppici, Flai, Atis.cloud, Bloom Explorer, Benaco and many others. Authors are also grateful for allowing the use of geometrical and non-geometrical data as well as maintenance information to: the Ente di Gestione dei Sacri Monti and in particular to architect Roberto Ottone and Elena Bellazzi, the Diocese of Aosta and architects Carlo Navillod and Chiara Cerutti from cNarc, the Archaeological Park of Colosseum of Rome with dr. Irma della Giovanpaola and arch. Alessandra Petretto. Special thanks also to the Archaeological Museum of Lomellina with the director Stefania Bossi for the access to data.
References
- Gao, R.; Wang, L.; Teti, R.; Dornfeld, D.; Kumara, S.; Mori, M.; Helu, M. Cloud-Enabled Prognosis for Manufacturing. CIRP Annals 2015, 64, 749–772. [Google Scholar] [CrossRef]
- Gartner Inc Definition of Software as a Service (SaaS). Available online: https://www.gartner.com/en/information-technology/glossary/software-as-a-service-saas (accessed on 23 July 2024).
- Gartner Inc Definition of Platform (Digital Business). Available online: https://www.gartner.com/en/information-technology/glossary/platform-digital-business (accessed on 23 July 2024).
- Görög, G. The Definitions of Sharing Economy: A Systematic Literature Review. Management 2018, 175–189. [Google Scholar] [CrossRef]
- Levinson, M. Software as a Service (SaaS) Definition and Solutions. Available online: https://www.cio.com/article/272086/web-services-software-as-a-service-saas-definition-and-solutions.html (accessed on 23 July 2024).
- Kenney, M.; Zysman, J. The Rise of the Platform Economy. Issues in Science and Technology 2016, 32. [Google Scholar]
- Katz, M.L.; Shapiro, C. Network Externalities, Competition, and Compatibility. The American Economic Review 1985, 75, 424–440. [Google Scholar]
- De Reuver, M.; Sørensen, C.; Basole, R.C. The Digital Platform: A Research Agenda. Journal of Information Technology 2018, 33, 124–135. [Google Scholar] [CrossRef]
- Kushida, K.E.; Murray, J.; Scaglia, P.; Zysman, J. The Implications of Cloud Computing for Integrated Research and Innovation Strategy. 2014.
- Fiorillo, F.; Spettu, F. Data Management, Efficient Use, and Smart Access to Reality Capture Data via Web Platforms. In Proceedings of the Digital & Documentation. From Virtual space to Information database; Picchio, F., Ed.; Pavia University Press: Pavia, 2023; Vol. 5, pp. 163–177.
- Spettu, F.; Parri, S.; Quaroni, P.; Achille, C.; Fassi, F. Towards Master Data Management for Cultural Heritage: The Sacri Monti Web Platform. The International Archives of the Photogrammetry, Remote Sensing and Spatial Information Sciences 2024, XLVIII-2-W4-2024, 421–428. [CrossRef]
- Schütz, M.; Ohrhallinger, S.; Wimmer, M. Fast Out-of-Core Octree Generation for Massive Point Clouds. Computer Graphics Forum 2020, 39, 155–167. [Google Scholar] [CrossRef]
- Teijeiro, D.; Amor, M.; Doallo, R.; Deibe, D. Interactive Visualization of Large Point Clouds Using an Autotuning Multiresolution Out-Of-Core Strategy. The Computer Journal 2022. [Google Scholar] [CrossRef]
- Champion, E.; Rahaman, H. Survey of 3D Digital Heritage Repositories and Platforms. Virtual Archaeology Review 2020, 11, 1–15. [Google Scholar] [CrossRef]
- Khronos Group WebGL. Available online: https://www.khronos.org// (accessed on 21 March 2023).
- Axaridou, A.; Chrysakis, I.; Georgis, C.; Theodoridou, M.; Doerr, M.; Konstantaras, A.; Maravelakis, E. 3D-SYSTEK: Recording and Exploiting the Production Workflow of 3D-Models in Cultural Heritage.; Chania, Greece, July 7 2014.
- Bormann, P.; Krämer, M. A System for Fast and Scalable Point Cloud Indexing Using Task Parallelism. Smart Tools and Apps for Graphics - Eurographics Italian Chapter Conference 2020. [CrossRef]
- Discher, S.; Richter, R.; Döllner, J. A Scalable webGL-Based Approach for Visualizing Massive 3D Point Clouds Using Semantics-Dependent Rendering Techniques. In Proceedings of the Proceedings of the 23rd International ACM Conference on 3D Web Technology; ACM: Poznań Poland, June 20 2018; pp. 1–9.
- Martinez-Rubi, O.; Verhoeven, S.; Meersbergen, M.V.; Schütz, M.; Oosterom, P.V.; Romulo Goncalves; Tijssen, T. Taming the Beast: Free and Open-Source Massive Point Cloud Web Visualization.; Salzburg, Austria, 2015.
- Hobu Inc Entwine. Available online: https://entwine.io/ (accessed on 9 August 2024).
- USGS; Entwine USGS & Entwine Repository. Available online: https://usgs.entwine.io/ (accessed on 22 March 2023).
- AWS Open Data Sponsorship Program. Available online: https://aws.amazon.com/opendata/open-data-sponsorship-program/ (accessed on 6 August 2024).
- Potree Potree. Available online: https://potree.github.io/ (accessed on 9 August 2024).
- Cesium GS Cesium Ion. Available online: https://cesium.com/ (accessed on 9 August 2024).
- Wynne, M. Introduction to Digital Cultural Heritage Management Platforms 2018.
- Artefactual Systems Inc. AtoM. Available online: https://www.accesstomemory.org/en/ (accessed on 28 August 2024).
- Nullman, S. Access to Memory (AToM). Available online: https://collectionmanagementsystems.wordpress.com/access-to-memory-atom/ (accessed on 29 August 2024).
- ICA International Council on Archives. Available online: https://www.ica.org/ (accessed on 30 August 2024).
- OCLC CONTENTdm. Available online: https://www.oclc.org/en/contentdm.html (accessed on 28 August 2024).
- OCLC WorldCat.org. Available online: https://search.worldcat.org (accessed on 30 August 2024).
- Digital Scholar Omeka. Available online: https://omeka.org/ (accessed on 28 August 2024).
- Corporation for Digital Scholarship Omeka.Net. Available online: https://www.omeka.net/ (accessed on 29 August 2024).
- Keep Solutions Museo - Cultural Heritage Management Software. Available online: https://www.keep.pt/en/products/museo-inventory-and-management-of-cultural-assets/ (accessed on 30 August 2024).
- Keep Solutions Museo Whitepaper 2024.
- Promemoria Group Archiui. Available online: https://www.archiui.com (accessed on 26 August 2024).
- Montala ltd ResourceSpace. Available online: https://www.resourcespace.com/sectors/academic (accessed on 28 August 2024).
- UNESCO Charter on the Preservation of the Digital Heritage 2003.
- The London Charter for the Computer-Based Visualisation of Cultural Heritage 2009.
- Statham, N. Scientific Rigour of Online Platforms for 3D Visualisation of Heritage. Virtual Archaeology Review 2019, 10, 1–16. [Google Scholar] [CrossRef]
- ICOMOS The Seville Principles, International Principles of Virtual Archaeology 2017.
- Google Inc Google Arts & Culture. Available online: https://artsandculture.google.com/ (accessed on 28 August 2024).
- Google Inc Open Heritage. Available online: https://artsandculture.google.com/project/openheritage (accessed on 12 September 2024).
- CyArk and partners CyArk. Available online: https://www.cyark.org/ (accessed on 3 July 2024).
- Kendall Epstein, J. CyArk: Protecting Cultural Heritage through Digital Preservation. Ars Orientalis 2016, 46. [Google Scholar] [CrossRef]
- van Wegen, W. The Power of 3D: CyArk’s Journey in Preserving Cultural Heritage. Available online: https://www.gim-international.com/content/article/the-power-of-3d-cyark-s-journey-in-preserving-cultural-heritage (accessed on 28 August 2024).
- CyArk and partners Tapestry. Available online: https://tapestry.cyark.org/ (accessed on 28 August 2024).
- GDH Global Digital Heritage. Available online: https://globaldigitalheritage.org/ (accessed on 28 August 2024).
- Revenko, S.; Solopov, N. Scan UA. Available online: http://scanua.com/ (accessed on 27 August 2024).
- Karpinskyi, Y.; Lazorenko, N.; Kin, D.; Maksymova, Y.; Nesterenko, O.; Zhao, H.; Borowczyk, J. Geoinformation Support of the Decision-Making Support System for the Reconstruction of Cultural Heritage Objects. International Journal of Conservation Science 2024, 15, 119–128. [Google Scholar] [CrossRef]
- Smithsonian Institution Smithsonian Open Access. Available online: https://www.si.edu/openaccess (accessed on 28 August 2024).
- Smithsonian Institution Smithsonian 3D. Available online: https://3d.si.edu (accessed on 4 July 2024).
- Europeana Foundation Europeana. Available online: https://www.europeana.eu/ (accessed on 29 August 2024).
- Petras, V.; Hill, T.; Stiller, J.; Gäde, M. Europeana – a Search Engine for Digitised Cultural Heritage Material. Datenbank Spektrum 2017, 17, 41–46. [Google Scholar] [CrossRef]
- Europeana Foundation Europeana Task Force Final Recommendations 2020.
- Leica Geosystems AG Leica TruView LIVE. Available online: https://leica-geosystems.com/en-us/products/laser-scanners/software/leica-truview/leica-truview-live (accessed on 8 August 2024).
- Leica Geosystems AG Leica Cyclone ENTERPRISE. Available online: https://leica-geosystems.com/en-us/products/laser-scanners/software/leica-cyclone/leica-cyclone-enterprise (accessed on 8 August 2024).
- Autodesk Autodesk Drive. Available online: https://drive.autodesk.com/ (accessed on 8 August 2024).
- Autodesk Autodesk Platform Services. Available online: https://aps.autodesk.com/ (accessed on 12 January 2024).
- FARO FARO Sphere. Available online: https://www.faro.com/en/Products/FARO-Sphere (accessed on 8 August 2024).
- FARO FARO WebShare. Available online: https://www.faro.com/en/Products/Software/WebShare (accessed on 8 August 2024).
- FARO HoloBuilder. Available online: https://www.holobuilder.com/ (accessed on 8 August 2024).
- Matterport Inc Matterport - Capture, Share, and Collaborate the Built World in Immersive 3D. Available online: https://matterport.com/ (accessed on 8 August 2024).
- NavVis NavVis IVION. Available online: https://www.navvis.com/ivion (accessed on 8 August 2024).
- Tommasi, C.; Fiorillo, F.; Jiménez Fernández-Palacios, B.; Achille, C. Access and Web-Sharing of 3D Digital Documentation of Environmental and Architectural Heritage. In Proceedings of the ISPRS Annals of the Photogrammetry, Remote Sensing and Spatial Information Sciences; Copernicus GmbH, 2019; Vol. 42, pp. 707–714.
- Bossi, S.; Portaluppi, S.; Cazzulani, V.; Achille, C. Fruizione digitale di ambienti e oggetti digitali: una buona pratica tra museo e università. Viglevanum 2024, XXXIV. [Google Scholar]
- Hexagon HxDR - Manage Digital Twins. Available online: https://hxdr.com/ (accessed on 8 August 2024).
- Day, M. Leica Geosystems: HxDR for Reality Capture. AEC Magazine 2022.
- Hexagon Reality Cloud Studio – Reality Capture Software. Available online: https://hxdr.com/reality-cloud-studio/ (accessed on 8 August 2024).
- Hexagon LocLab Cloud. Available online: https://hxdr.com/loclab-cloud/ (accessed on 16 September 2024).
- Hexagon HxGN GeoCloud. Available online: https://hexagon.com/products/hxgn-geocloud (accessed on 16 September 2024).
- Hexagon HxGN Content Program. Available online: https://hxdr.com/contentprogram/ (accessed on 16 September 2024).
- Correvate Ltd. Vercator. Available online: https://vercator.com/ (accessed on 9 August 2024).
- Selviah, D.R. Robust Automatic 3D Point Cloud Registration and Object Detection. Geomatics World 2018. [Google Scholar]
- Flai Flai. Available online: https://www.flai.ai (accessed on 9 August 2024).
- Pointly GmbH Pointly. Available online: https://pointly.ai/ (accessed on 15 August 2024).
- Geovast 3D FlyVast. Available online: https://flyvast.com/ (accessed on 8 August 2024).
- Poux, F.; Mattes, C.; Selman, Z.; Kobbelt, L. Automatic Region-Growing System for the Segmentation of Large Point Clouds. Automation in Construction 2022, 138, 104250. [Google Scholar] [CrossRef]
- ATIS.cloud ATIS.Cloud. Available online: https://www.atis.cloud/ (accessed on 8 August 2024).
- ASPRS LAS Specification v1.4-R15 2019.
- Benaco Ltd. Benaco. Available online: https://benaco.com/ (accessed on 15 August 2024).
- 3DUserNet Ltd. 3DUserNetVISION. Available online: https://www.3dusernet.com/ (accessed on 9 August 2024).
- Euclideon udCloud. Available online: https://www.euclideon.com/udcloud.html (accessed on 8 August 2024).
- Euclideon What Is Unlimited Detail. Available online: https://web.archive.org/web/20170519111717/http://www.euclideon.com:80/technology-2/ (accessed on 12 August 2024).
- Euclideon udStream. Available online: https://www.euclideon.com/udstream.html (accessed on 8 August 2024).
- Xeolabs Xeokit - 3D Web Programming Toolkit for BIM and Engineering Visualization. Available online: https://xeokit.io/ (accessed on 9 August 2024).
- Schütz, M. Potree: Rendering Large Point Clouds in Web Browsers. Master thesis, TU Wien: Wien, 2016.
- SCANOPY. Available online: https://www.cg.tuwien.ac.at/research/projects/Scanopy/ (accessed on 27 February 2023).
- OpenJS Foundation; Electron contributors Electron. Available online: https://www.electronjs.org/ (accessed on 6 August 2024).
- Sketchfab Inc Sketchfab. Available online: https://sketchfab.com (accessed on 15 August 2024).
- Visual Computing Lab CNR-ISTI 3DHOP. Available online: https://3dhop.net/index.php (accessed on 12 August 2024).
- Potenziani, M.; Callieri, M.; Scopigno, R. 3DHOP: A Novel Technological Solution for the Development of Online Virtual Museums. ERCIM News 2014, 52–53. [Google Scholar]
- Potenziani, M.; Callieri, M.; Dellepiane, M.; Corsini, M.; Scopigno, R. 3DHOP: 3D Heritage Online Presenter. Computers & Graphics 2015, 52. [Google Scholar] [CrossRef]
- Potenziani, M.; Callieri, M.; Scopigno, R. Developing and Maintaining a Web 3D Viewer for the CH Community: An Evaluation of the 3DHOP Framework; 2018.
- Cozzi, P. Cesium - Introducing 3D Tiles. Available online: https://cesium.com/blog/2015/08/10/introducing-3d-tiles/ (accessed on 23 March 2023).
- Hobu Inc Entwine Point Tile. Available online: https://entwine.io/en/latest/entwine-point-tile.html (accessed on 12 August 2024).
- Plas.Io contributors Plas.Io. Available online: https://plas.io/ (accessed on 12 August 2024).
- Verma, U. Plasio GitHub. Available online: https://github.com/verma/plasio (accessed on 12 August 2024).
- Perfetti, L.; Spettu, F.; Achille, C.; Fassi, F.; Navillod, C.; Cerutti, C. A Multi-Sensor Approach to Survey Complex Architectures Supported by Multi-Camera Photogrammetry. Int. Arch. Photogramm. Remote Sens. Spatial Inf. Sci. 2023, XLVIII-M-2–2023, 1209–1216. [Google Scholar] [CrossRef]
- Achille, C.; Fassi, F.; Mandelli, A.; Fiorillo, F. Surveying Cultural Heritage: Summer School for Conservation Activities. Applied Geomatics 2018, 10. [Google Scholar] [CrossRef]
- Spettu, F.; Achille, C.; Fassi, F.; Della Giovampaola, I. Web Platforms for Cultural Heritage Management: The Parco Archeologico Del Colosseo Case Study. Int. Arch. Photogramm. Remote Sens. Spatial Inf. Sci. 2023, XLVIII-M-2–2023, 1493–1500. [Google Scholar] [CrossRef]
- Cintoo The Cintoo White Paper 2022.
- Cintoo Cintoo Cloud. Available online: https://cintoo.com/ (accessed on 8 August 2024).
- Medensky, A.M. TurboMesh. Available online: https://cintoo.com/turbomesh-2/ (accessed on 15 August 2024).
- Bloom Technologies Bloom Explorer. Available online: https://bloomce.com/ (accessed on 9 August 2024).
Figure 1.
The Iowa US state full point cloud, displayed as its full extension (left) and with its building-scale detail (right).
Figure 1.
The Iowa US state full point cloud, displayed as its full extension (left) and with its building-scale detail (right).
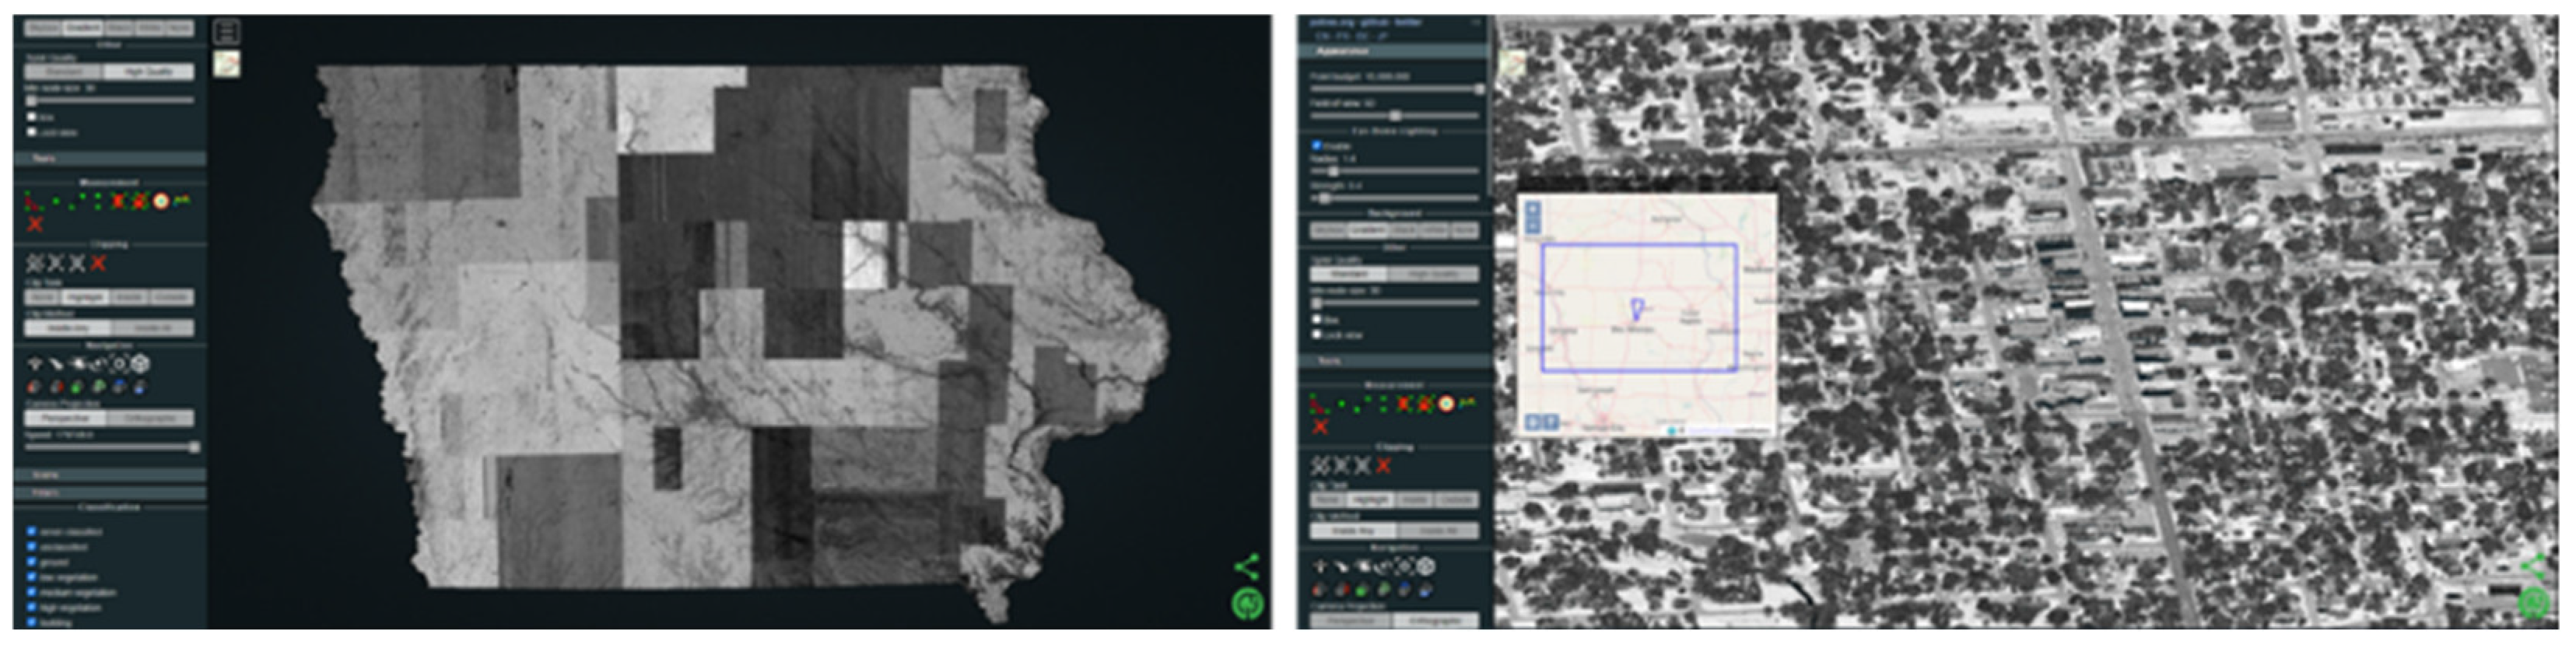
Figure 5.
An overview of the Flai platform, showing a point cloud classified with the FlaiNet Dynamic AI model. Dataset from [64].
Figure 5.
An overview of the Flai platform, showing a point cloud classified with the FlaiNet Dynamic AI model. Dataset from [64].
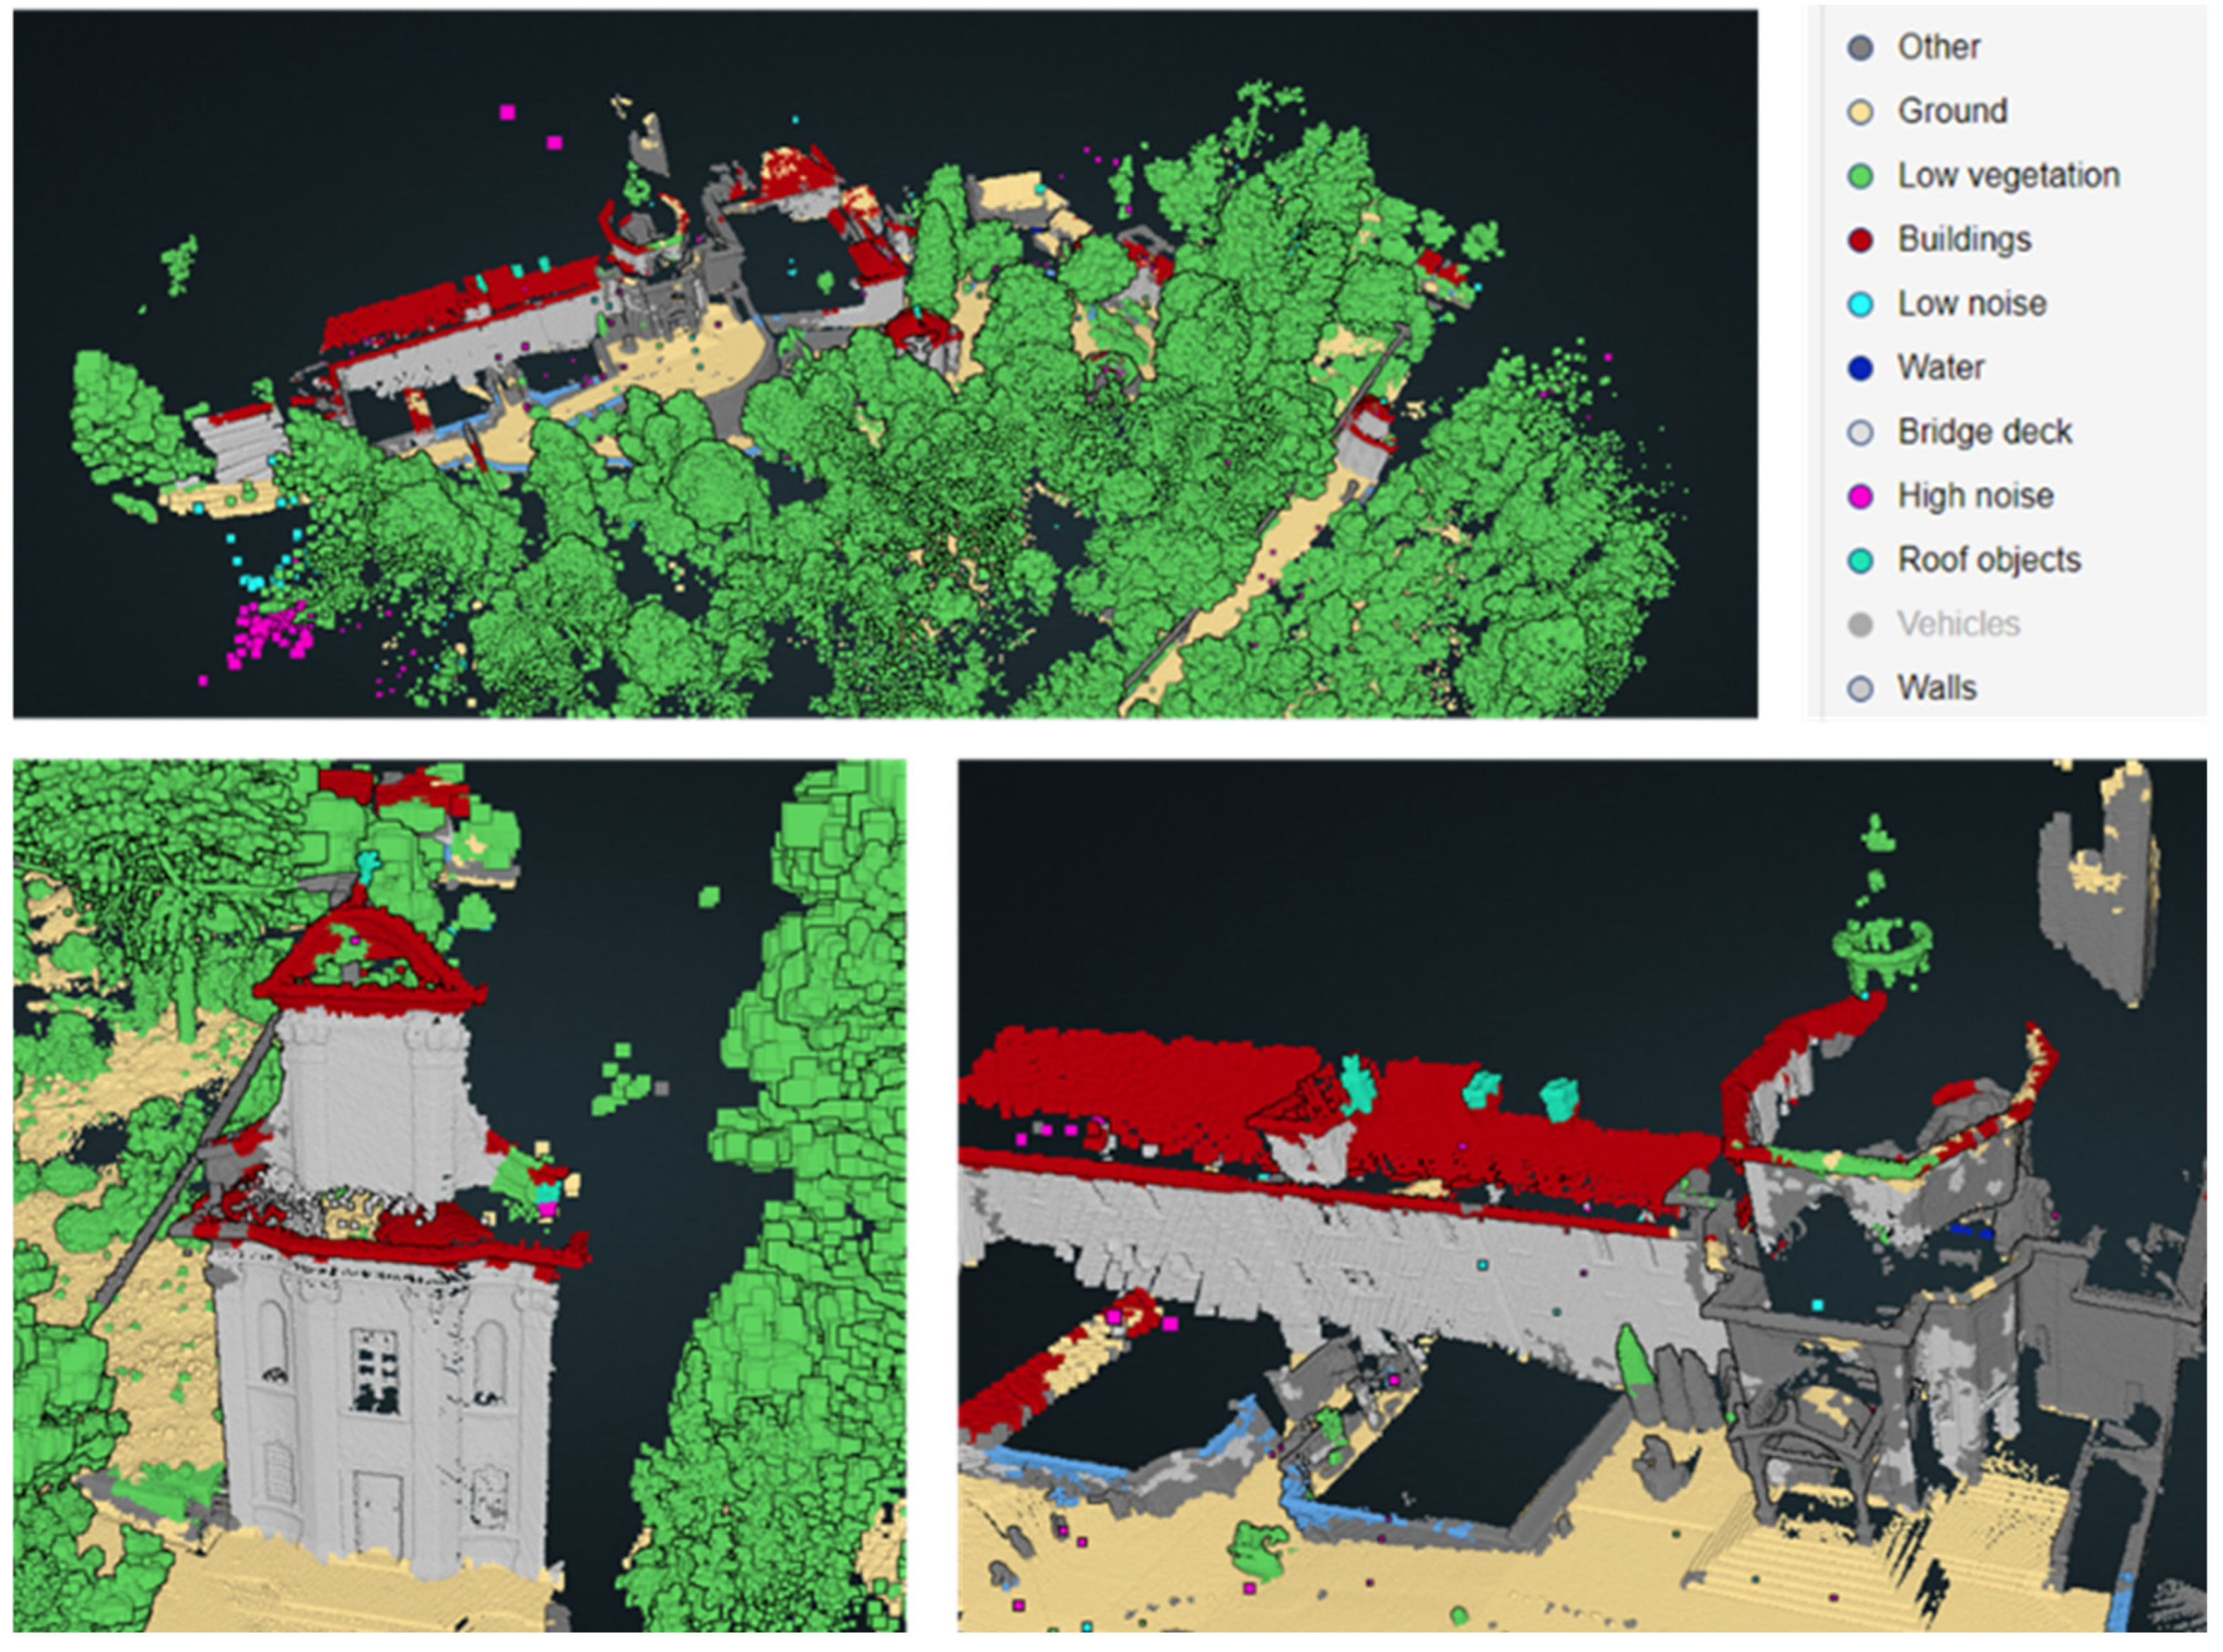
Figure 6.
An overview of the Pointly platform. On the left, the visualization of a classified point cloud (manually classified outside the platform) with custom labes. On the right, an example of the automatic feature recognition provided by the processing algorithms. Dataset from [64].
Figure 6.
An overview of the Pointly platform. On the left, the visualization of a classified point cloud (manually classified outside the platform) with custom labes. On the right, an example of the automatic feature recognition provided by the processing algorithms. Dataset from [64].
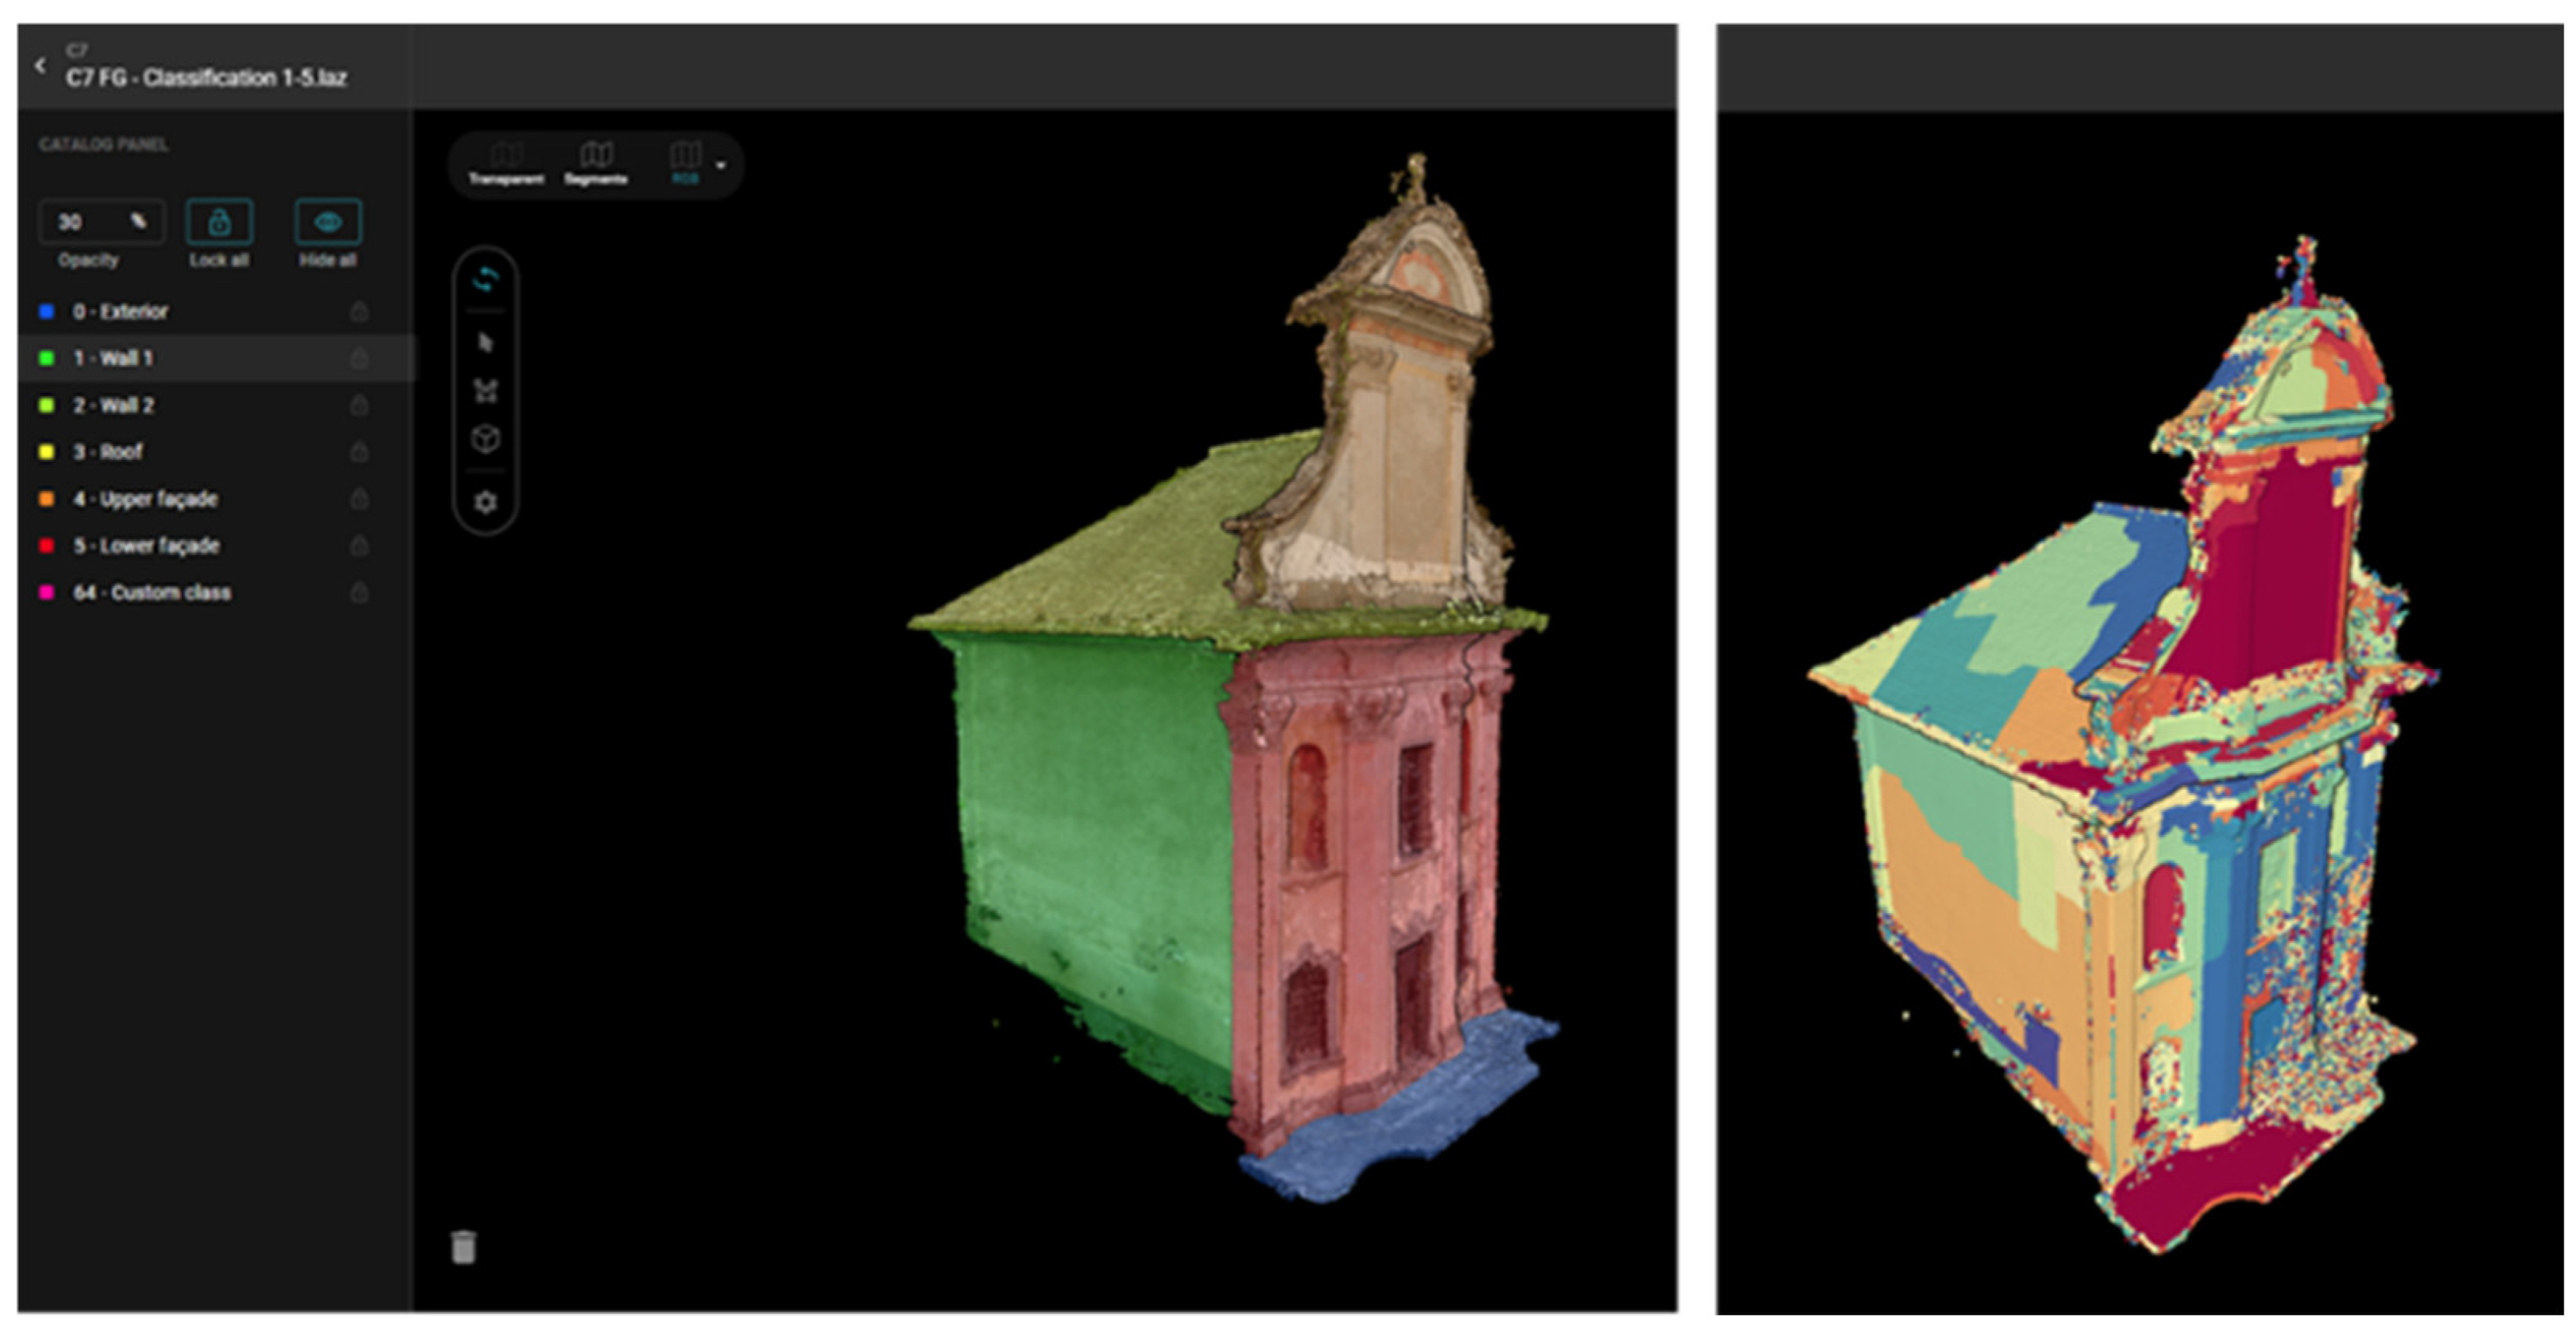
Figure 11.
The Cintoo platform. Top, left: the manual alignment tool of an IFC model and a point cloud. Top, right: the deviation analysis tool operated between two laser scans. Dataset from [64]. Bottom: an example of the data repository provided by the platform. Dataset from Torre Degli Zoppi, Bergamo [10].
Figure 11.
The Cintoo platform. Top, left: the manual alignment tool of an IFC model and a point cloud. Top, right: the deviation analysis tool operated between two laser scans. Dataset from [64]. Bottom: an example of the data repository provided by the platform. Dataset from Torre Degli Zoppi, Bergamo [10].
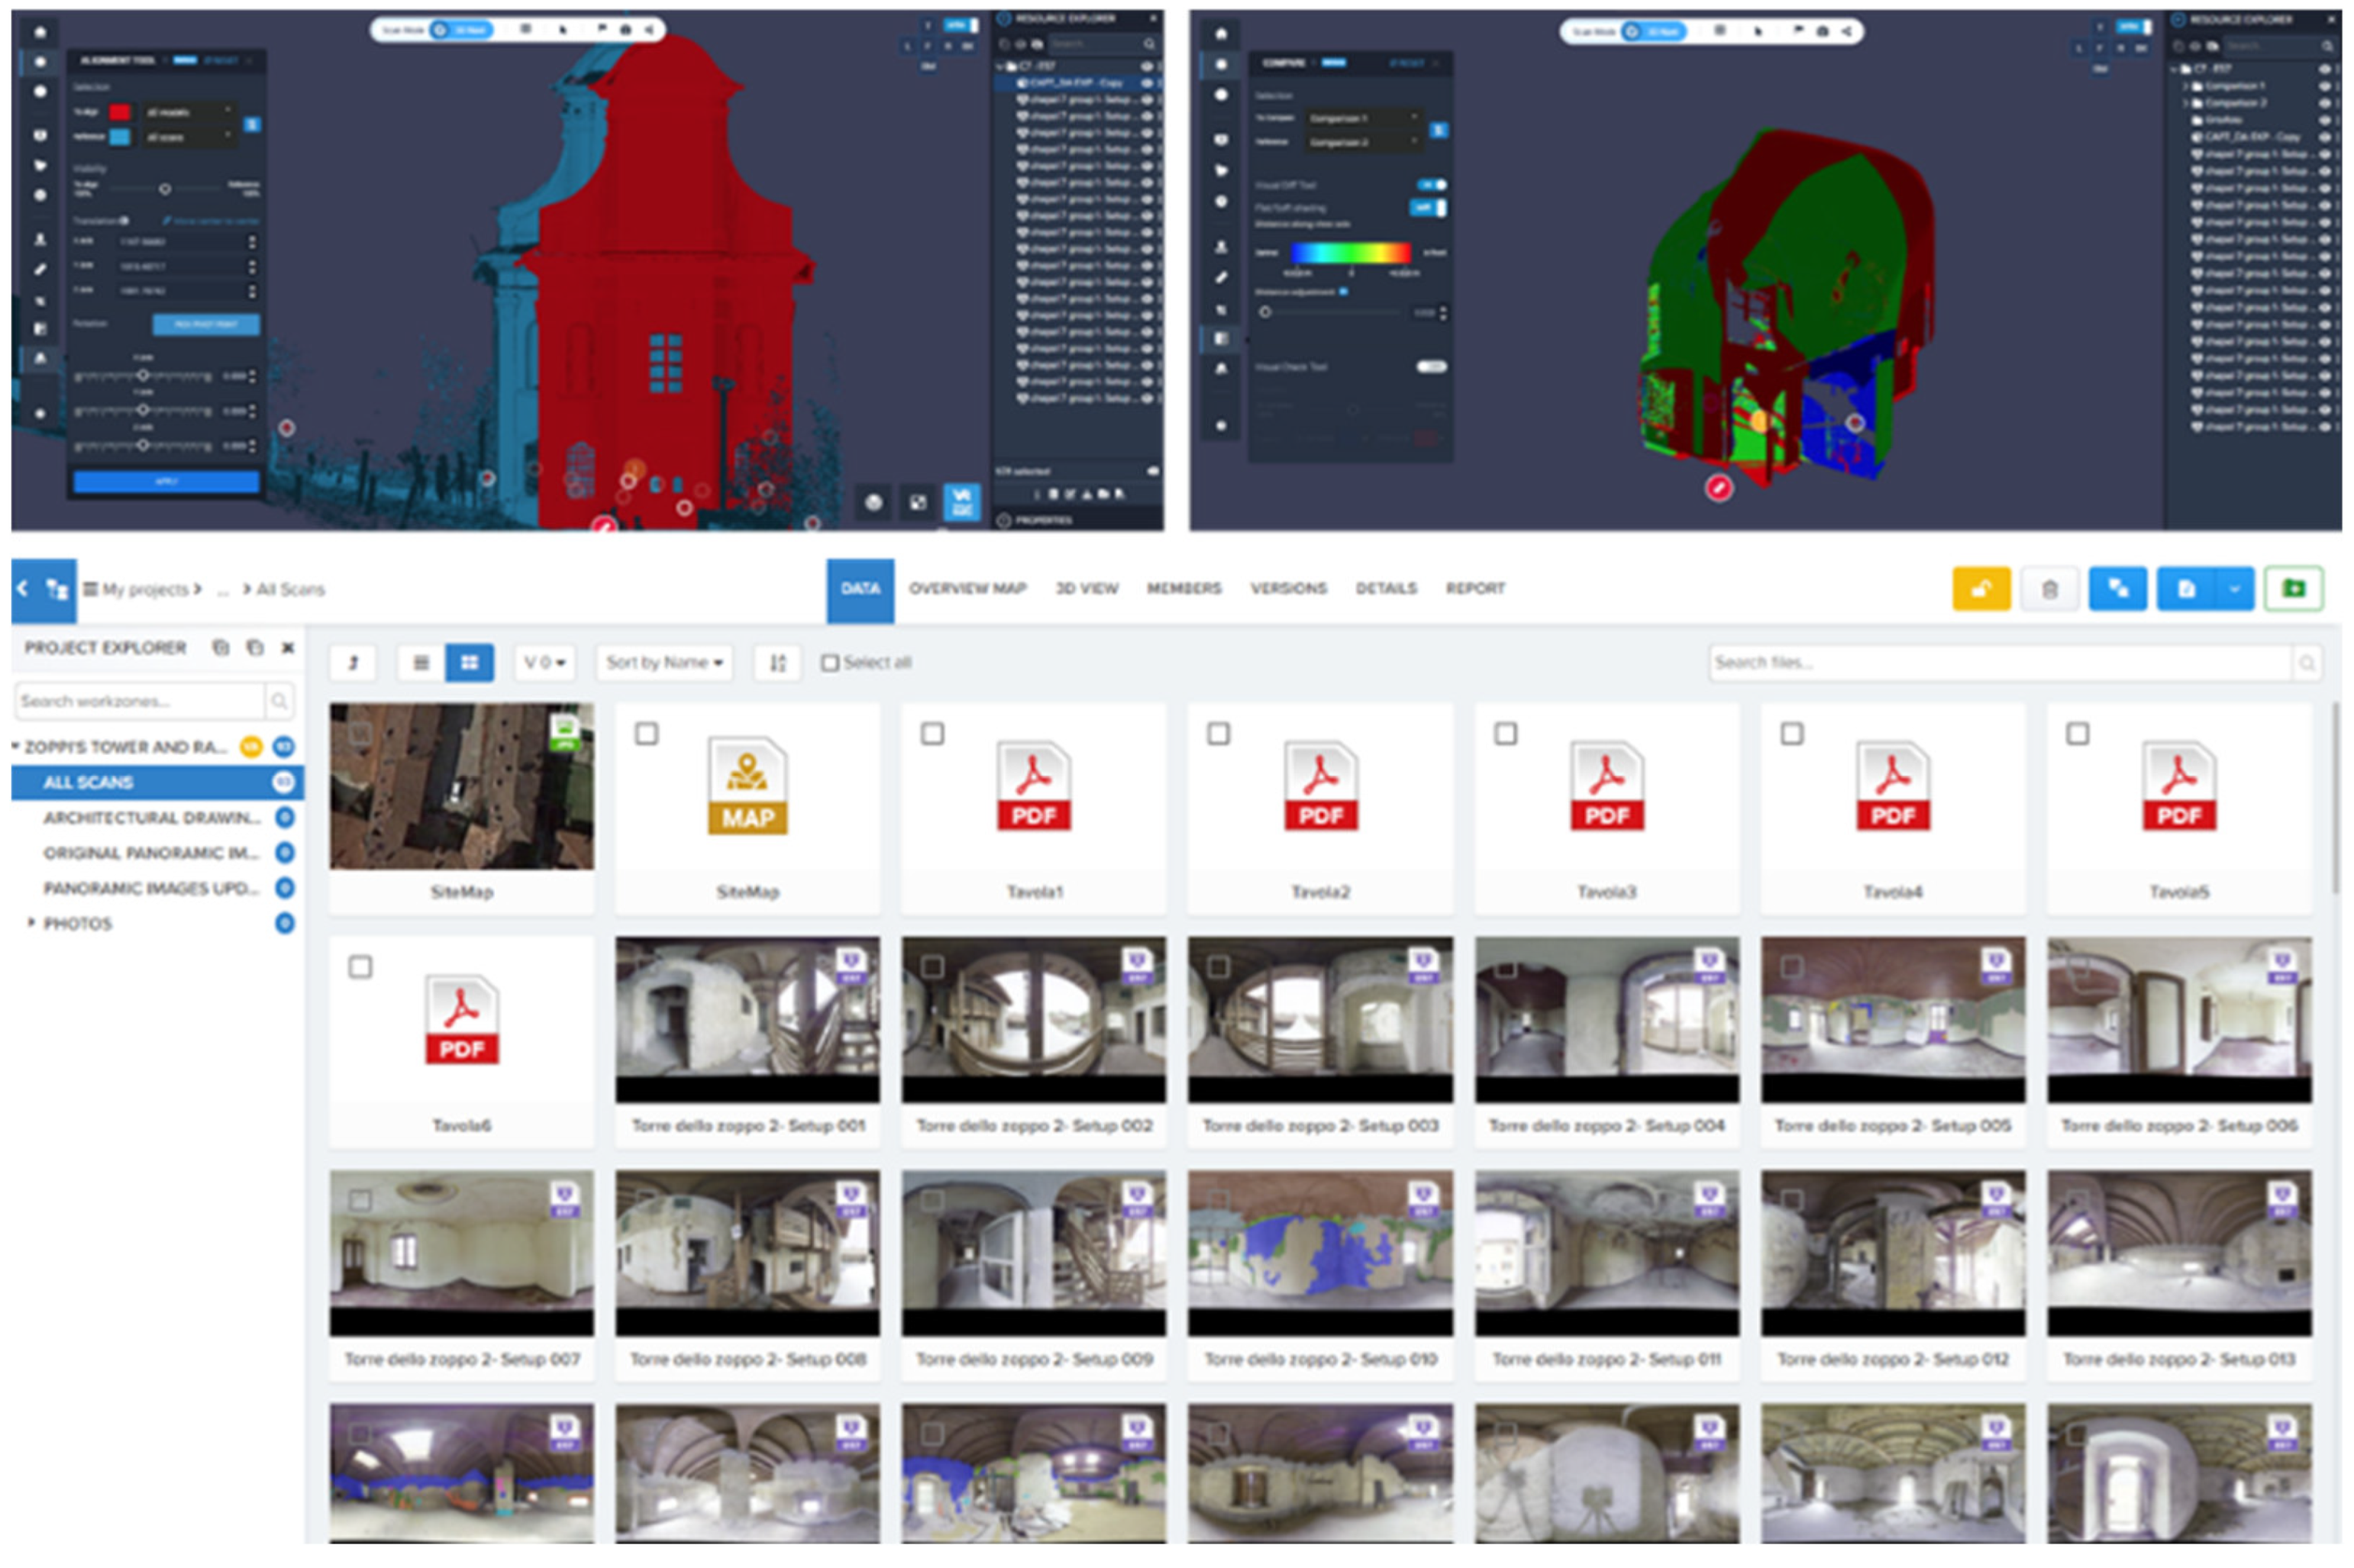
Disclaimer/Publisher’s Note: The statements, opinions and data contained in all publications are solely those of the individual author(s) and contributor(s) and not of MDPI and/or the editor(s). MDPI and/or the editor(s) disclaim responsibility for any injury to people or property resulting from any ideas, methods, instructions or products referred to in the content. |
© 2024 by the authors. Licensee MDPI, Basel, Switzerland. This article is an open access article distributed under the terms and conditions of the Creative Commons Attribution (CC BY) license (http://creativecommons.org/licenses/by/4.0/).
Copyright: This open access article is published under a Creative Commons CC BY 4.0 license, which permit the free download, distribution, and reuse, provided that the author and preprint are cited in any reuse.


