
Submitted:
13 September 2024
Posted:
14 September 2024
You are already at the latest version
Abstract
In 2004, a significant portion of the spruce-dominated forests in the Tatra National Park (northern Slovakia) was destroyed by an exceptionally strong windstorm. Our study focused on the status of deadwood and its influence on post-disturbance forest regeneration 18 years after the destruction. Since some disturbed areas were salvaged and others were not, we could compare the situations between these two management approaches. In total, 40 research sites (20 salvaged and 20 unsalvaged) were measured, each represented by four satellite-like plots with a radius of 4 m. We measured the diameters of deadwood and its decay status (classes 1 – 5). At the same time, we recorded the sizes (stem base diameter and height) and species of young trees. The results showed that while salvage conditions and contact with soil stimulated deadwood decomposition, the diameter of logs was not a significant factor. The highest decay class (3.83) was found in deadwood on salvaged areas and attached to the soil, while the lowest decay class (3.10) was found in deadwood on unsalvaged areas and in the case of logs unattached to the soil. While carbon content (based on percentage of wood mass) did not change with decay class, wood density decreased sharply with decay class. Water moisture showed an increasing tendency with decay class. Moreover, our results showed that post-disturbance management influenced forest regeneration. Significantly higher tree diversity was observed in salvaged areas (5.40 species per plot) compared to unsalvaged areas (3.85 species per plot). While areas with logging were predominantly covered by broadleaved species, those without logging were typically dominated by Norway spruce (Picea abies L. Karst). We concluded that although salvage logging decreased the total carbon and water content in deadwood, it can stimulate tree species diversity. Thus, the currently prevailing opinion about the exclusively negative ecological effects of salvage logging should be accepted with caution, and local conditions must be considered before making broad judgments.
Keywords:
wind destruction
; salvaged vs unsalvaged areas
; decay class
; deadwood moisture
; carbon content
; volume to carbon conversion factor
1. Introduction
Ongoing climate change and its inherent phenomena increase the frequency and extent of disturbances and tree mortality in forest ecosystems, including temperate forests in Europe [1]. At the same time, increasing forest disturbances negatively impact carbon storage in both tree biomass and soil [2]. This phenomenon is also evident in Slovak forests, where especially wind disturbances and rather recent bark beetle outbreaks have shown sharp increasing tendencies [3,4]. As a consequence of raising forest disturbances (mainly wind-throws, bark beetle outbreaks, and fires), the amount of deadwood material increases considerably [5]. Thus, deadwood likely increases its share in the total carbon pool in forest ecosystems. Here, it should be explained that some authors (e.g., [6,7,8]) use the term “coarse woody debris”. Harmon et al. [9] defined coarse woody debris to include standing dead trees, downed woody debris, and stumps. We use deadwood in the subsequent text, although most references pertain to downed woody debris, as this type of coarse woody debris is the most frequent fragment after windstorm disturbances. This is in contrast to forest damage caused by bark beetles, where standing dead trees typically prevail for some years or even a few decades [10].
Rather recently, many researchers have proven the high ecological value of deadwood in a variety of forest ecosystems (e.g., [11,12]). For instance, deadwood provides specific habitats for a number of saproxylic, i.e., wood-dependent, species (e.g., [13]). Moreover, it plays a crucial role in ecosystem functions such as forest regeneration and recovery [14] as well as biochemical cycles including carbon [15], nutrients, and water [16]. Deadwood is known for its high water retention capacity, which is significantly larger than that of living trees [17]. Thus, the presence of deadwood in forests may increase water storage during drought periods.
The decomposition of deadwood is a natural process primarily performed by microbes using extracellular enzymes [18] which require moisture to deliver the enzymes to the substrates. Therefore, the activity of microbes is enhanced when more moisture is available [19]). Findings by Jomura et al. [20] also showed that deadwood traits, such as tree species, size, and position (downed versus standing), affect deadwood chemical properties, microbial biomass, moisture conditions, and enzyme activity through changes in fungal communities, strongly influencing the decomposition rate of deadwood. Moreover, deadwood decomposition is significantly controlled by temperature [21]. All these factors can change within one site, causing the decomposition rate to vary within the same plot. As a consequence, deadwood of different decay stages can usually be found on the same site [22]. The decomposition status of deadwood can be classified within decay classes, which commonly include five stages in addition to fresh wood status [23]. As deadwood decomposes, its structure changes because the cell walls are composed of varying amounts of cellulose, hemi-cellulose, and lignin, each with different resistance to degradation [24]. Therefore, deadwood density [25] and chemical properties [26] change considerably with decomposition status. Additionally, some studies have shown that the water retention capacity of deadwood changes dramatically with decay class [17,22].
Since deadwood is important for carbon and water retention, it is often crucial to quantify both substances at certain sites, such as post-disturbance areas without salvage logging. The most easily measurable variable for deadwood, specifically for stems, is volume, which can be calculated from diameters at certain stem spots and log length [27]. Input variables can be measured terrestrially [28] or from the air [29]. However, wood volume alone is insufficient if estimation on the amount of carbon in deadwood is needed. Therefore, a tool for converting dead volume to carbon amount (weight) was introduced (e.g. [25]). This deadwood volume to carbon conversion factor (VCCF) is sensitive to tree species and decay class, making these two additional characteristics necessary for precise estimates of carbon at either and individual log or area level.
As we mentioned, the amount of deadwood in Europe has been rising with extensive forest disturbances (in the case of excluding or only partial salvage logging). This is in contrast to the trend in intensively managed forests without occurrences of destruction or enhanced mortality [30]. According to Palleto et al. [30], intensively managed forests are characterized by significantly lower mean levels of deadwood than other forms of management. They stated that multifunctional management resulted in the highest level of carbon fixed mainly in logs and snags.
Issues related to salvage logging, which tends to remove most of the deadwood, substantially reducing the overall deadwood amount, remain questionable [31]. Here, ecological aspects and economic interests usually conflict and must consider the main functions of specific forest stands. This means different approaches are needed for commercial forests compared to those with predominantly non-productive roles. Besides other consequences, salvage logging (full or partial wood processing) also significantly affects forest regeneration and the further development of post-disturbance forests. Scientific opinions are not uniform in this field (e.g. [32,33], versus [8,34]), and more definitive outcomes or recommendations for optimal post-disturbance management, including successful forest regeneration, demand further research activities (see also [35]).
The main aims of this work were to estimate the quantity and quality of deadwood in the High Tatra Mountains, specifically in the areas 18 years after extensive wind destruction. For deadwood quantity, we attempted to quantify fragments in specific decay classes and identify wood density, carbon content, and moisture at various stages of decomposition. These analyses were conducted considering contrasting post-disturbance management, i.e., with and without salvage logging. Moreover, we studied the influence of the two contrasting post-disturbance management approaches (or different amounts of present deadwood) on forest regeneration, considering tree species compositions, stand densities, and tree sizes (height and basal area).
2. Results
2.1. Deadwood Quantity and Decay Status
We found 0.35 m³ (standard error of ±0.10) per are of deadwood in the salvaged area and 2.94 m³ (±0.97) of deadwood per are in the unsalvaged area. This represented 91.00 ±27.10 kg of deadwood mass per are in the salvaged area and 766.58 ±60.18 kg of deadwood mass per are in the unsalvaged area (Table 1). Hence, the differences between the salvaged and unsalvaged areas were over eightfold for both the volume and mass of deadwood.
We recorded 135 and 584 logs of deadwood in the plots with and without salvaged logging, respectively. Deadwood covered 2.04% of the ground surface in the salvaged area and 17.78% in the unsalvaged area (Table 1). Therefore, the reduction of ground surface area covered by deadwood was eight times greater in the unsalvaged area compared to the salvaged area.
We calculated that the average decay class was 3.62 ±0.06 in the salvaged area and 3.31 ±0.02 in the unsalvaged area (Figure 1). In the salvaged area, the most frequent decay class was the fourth, representing 44.2% of all deadwood, followed by the third class (37.4%). Meanwhile, 68.4% of deadwood in the unsalvaged area belonged to the third decay class, followed by the fourth class (27.6%). Deadwood in the first decay class was completely absent in both types of areas, and the proportion of deadwood in the second and fifth classes was rare (up to 10% of the total deadwood volume in all cases).
The amount of carbon stored in deadwood was up to eight times greater in unsalvaged areas (383.3 ±30.1 kg per are) compared to salvaged areas (45.5 ±13.6 kg per are; Table 2).
2.2. Factors Influencing Deadwood Decay
We found that two of the three observed factors significantly influenced the decay rate (current decay class; Table 3). Specifically, the logging of calamity wood stimulated the decay rate of wood remaining on the site (Figure 1a). Additionally, contact with soil enhanced the process of deadwood decomposition (Figure 1b). The factor of contact with or without soil surface appears to have a greater influence on deadwood decay than post-disturbance management, and the combination of these two factors is also significant (Table 3). Hence, deadwood in contact with soil in salvaged areas had a mean decay class of 3.83 ±0.06, while deadwood without soil contact in unsalvaged areas had a mean decay class of 3.10 ±0.02 (Figure 1c). Thickness (distinguishing two diameter class) did not show any clear influence on deadwood decay (Table 3).
2.3. Deadwood Traits
Wood density, considering two conditions—dry matter and fresh (field) moisture differed among decay classes (Figure 2). The differences were most pronounced in dry wood matter. For instance, the 1st decay class had a density of 382.7 (±13.7) kg per m³, while the 5th decay class had a density of 150.2 (±14.9) kg per m³. Naturally, the density of deadwood under fresh moisture was higher than that of dry matter (Figure 2). Interestingly, while the density of deadwood in dry matter decreased with increasing decay class, the opposite trend occurred in deadwood under fresh moisture. The lowest value for fresh moisture of deadwood was 542.0 (±32.0) kg per m³, while the highest was 669.9 (±82.5) kg per m³.
Regarding carbon content in the dry matter of deadwood, the differences were not substantial (Figure 3). Significant differences were only found between deadwood in the 1st decay class (49.02 ±0.68%) and the 4th decay class (50.90 ±0.39%). In fact, the results showed neither a clear increasing nor decreasing trend with decay intensity. The volume to carbon conversion factor (VCCF) in deadwood sharply decreased with decay class (Figure 4). Statistical analyses (one-way ANOVA; p < 0.001) revealed significant differences among all decay classes. The highest value (187.6 ±7.5 kg per m³) was found in the 1st decay class, while the lowest value (74.8 ±7.2 kg per m³) was observed in the 5th decay class.
Moisture levels differed among decay classes, specifically increasing with decomposition intensity in both types of deadwood—field moisture wood and water-saturated wood (Figure 5). Although moisture content was higher in water-saturated deadwood than in field-moisture deadwood, the differences diminished as decay progressed. For instance, in the 1st decay class, water content under field conditions was 28.4 ±3.8%, while in water-saturated conditions, it was 62.4 ±1.8%. By the 5th decay class, moisture content reached 76.6 ±1.7% in field conditions and 78.5 ±0.8% in water-saturated conditions (Figure 5).
3.4. Deadwood Influence on Forest Regeneration
Finally, we attempted to quantify the influence of post-disturbance management (i.e., contrasting amounts of deadwood between areas with and without the logging of calamity wood) on forest regeneration. The results suggest that post-disturbance management had a greater influence on tree species diversity than on tree biomass production (Table 4 and Table 5). A statistically significant difference (one-way ANOVA; p < 0.001) between salvaged and unsalvaged areas was found for the number of tree species per plot (5.40 ±0.28 species in the salvaged area vs. 3.85 ±0.27 species in the unsalvaged area). As for other forest stand characteristics, while basal areas and Lorey's heights showed near-significant differences (p = 0.097 and p = 0.086), stand densities (number of trees per unit area) did not show notable differences.
Since we assumed that deadwood reduced the ground surface available for forest regeneration (deadwood covered 2.04% of the ground in the salvaged area and 17.78% in the unsalvaged area), the number of trees as well as the basal area of young forest stands were also calculated for these reduced areas. Although the differences were not statistically significant, the effect of deadwood was more evident in the basal area (1,724 ±389 cm² per are vs. 1,367 ±187 cm² per are) than in stand density (79.43 ±14.07 trees per plot vs. 84.63 ±12.63 trees per plot).
The salvaged areas were characterized by a relatively low proportion of Norway spruce (33.6% of the total number of trees and 34.1% of the total basal area), whereas the unsalvaged areas were dominated by this species (66.9% of the total number of trees and 75.6% of the total basal area, respectively; Table 5). Logging clearly supported the regeneration of goat willow and silver fir, but this trend was not observed for common rowan. Additionally, some other broadleaved and coniferous species were more frequent in the salvaged areas than in the unsalvaged areas, which may be related to the inhibitive effects of logging on Norway spruce.
3. Discussion
3.1. Deadwood Decay Status
Our results indicate that the mean decay class in the post-disturbance area, 18 years after the windstorm, was approximately 3.5. The wood density of Norway spruce with a mean decay class of 3.5 was about 225 kg per m³, compared to approximately 388 kg per m³ for the 1st decay class. This represents a decrease in wood density by about 41%, reflecting the extent of decomposition. It is important to note that these findings pertain specifically to coarse woody debris (originating from Norway spruce), such as stems with diameters greater than 7 cm. Thin material, like branches, was not included in this study due to its advanced decomposition, fragmentation, and resulting difficulty in measurement. The rate of deadwood decomposition over time is a critical consideration. While a comprehensive assessment would require longer-term measurements, our simplified mathematical estimation suggests an annual decomposition rate of about 2.3% of the original mass. Therefore, full decomposition of deadwood (i.e., the point at which no wood or carbon remains) might take around 45 years. However, this estimate assumes a constant annual decomposition rate throughout the entire decay period. Given that decomposition rates are likely to accelerate with higher decay classes, 45 years might an overestimate for the complete decomposition of Norway spruce in the large-scale post-disturbance conditions of the High Tatra Mountains.
On the other hand, our estimates appear to be lower compared to findings from Switzerland and Czechia. For example, Hararuk et al. [36] reported that deadwood from European beech decayed the fastest, with residence times ranging from 27 to 54 years at the warmest and coldest sites in Switzerland, respectively. In contrast, deadwood from softwood species had longer residence times, ranging from 58 to 191 years at wetter sites and 78 to 286 years at drier sites. Similarly, in Czechia, Přívětivý et al. [37] found that the residence time of deadwood from European beech ranged between 38 and 48 years. They also reported that complete decomposition of Norway spruce at cold sites in Czechia could take up to 81 years [38]. They emphasized that to maintain a continuous presence of Norway spruce deadwood—essential for various organisms and thus for maintaining biodiversity—deadwood needs to be replenished at least once every 25–40 years. This time frame is required for approximately 50% of logs to fully decompose and for the remaining 50% to reach the final decay stage.
In Sweden, the relative decay rate for Norway spruce stumps and roots was estimated at about 4.6% [39], nearly twice as fast as our estimates for the aboveground parts of stems. This discrepancy may be attributed to better contact of belowground tree parts with soil, exposing them to microbes and fungal hyphae that decompose wood (see also [40]), as well as to higher humidity conditions (e.g., [41]). Based on these observations, we can infer that the order of decay rates among tree components, from fastest to slowest, is likely as follows: foliage > branches > roots > stem.
Our analyses further revealed that while carbon content decreases with decay class when calculated based on wood volume, it remains stable when expressed on a wood weight basis. Specifically, carbon content based on wood volume is directly related to the decrease in wood density, which drops from 383 kg per m³ in the 1st decay class to 150 kg per m³ in the 5th decay class, representing a reduction of nearly 60%. A similar decrease in carbon content, calculated on a wood volume basis, was observed across decay classes, as indicated by the volume-to-carbon content conversion factor (e.g., [25]). When carbon content was calculated based on wood weight, the variation across decay classes was minimal, except for a noticeable difference between the first and fourth decay classes.
The relationship between wood density and carbon content across decay classes has been demonstrated by various authors [22,25,26,42,43]. All these studies observed a decrease in wood density and carbon content based on wood volume with increasing decay class. However, for carbon content calculated on a wood weight basis, most studies reported no significant changes, although Noh et al. [43] did find a decrease between the first and second decay classes in Pinus densiflora.
Additionally, we demonstrated that both field water content and saturated water content increase with decay class. This trend is consistent with other studies (e.g., [17,22,44]). Our results showed that while the differences between field moisture and saturated moisture values were about twofold in deadwood of the first decay class, these differences were minimal in deadwood of the fifth decay class. This suggests that deadwood in higher decay classes retains significantly more water under real field conditions than deadwood in earlier decay stages. Klamerus-Iwan et al. [17] reported similar findings, noting that deadwood serves as a significant water reservoir in forest ecosystems, with increasing water storage capacity across decay classes observed in laboratory experiments.
3.2. Factors Influencing Deadwood Decomposition
Our results indicated that while post-disturbance management and the contact of deadwood with the soil significantly influenced the decomposition rate, the diameter of coarse wood debris had a weak and insignificant effect. We found that post-disturbance management plays a major role in determining the amount of deadwood present at a site, with deadwood stock differing by more than eightfold between managed and unmanaged areas. This suggests that a greater amount of deadwood provides more shading, which leads to lower temperatures on both the deadwood and the ground surface. Since temperature is recognized as a key factor in wood decay (e.g., [20,36,45]), this likely explains the differing decomposition rates observed between logged and unlogged sites following the wind disaster. Additionally, we found that the contact of deadwood with the ground accelerates decay. This effect is primarily due to two factors: moisture status [7,46] and the availability of microorganisms and fungi from the soil [20]. A significant difference in decay rate related to soil contact has also been observed in comparisons between downed and standing deadwood [20].
Additionally, our findings revealed that the combination of post-disturbance management and soil contact had a stronger effect on deadwood decay than either factor alone. This enhanced decay could be attributed to the synergistic influence of specific moisture and temperature conditions. These climatic factors are recognized as critical in governing deadwood decomposition (e.g. [45]). An "optimal" combination of moisture and temperature can significantly accelerate the decay rate [47]. Other external factors, such as topographic variables, also influence wood decomposition. For example, Ma et al. [48] found that among factors such as aspect, convexity, elevation, and slope, elevation had the most substantial positive effect on deadwood decay rate.
Another important factor influencing the decay rate is tree species, as demonstrated by numerous studies [7,25,26]. However, results are sometimes contradictory. For instance, Klamerus-Iwan et al. [17] found that Norway spruce wood samples had a significantly higher decomposition rate compared to beech wood samples. In contrast, Hararuk et al. [36] reported that deadwood from European beech decayed faster than that from most softwood, broadleaved, and coniferous species. These discrepancies suggest that interspecific differences in deadwood decay rates are not yet fully understood. Certain interspecific (and to some extent intraspecific) differences in decay rate are closely related to factors such as resin content in the wood [49] and morphological properties like wood porosity [50].
3.3. Effects of Deadwood to Forest Regeneration
Our research in the High Tatra Mountains revealed that areas where calamity wood was logged had higher tree species richness, larger basal areas, and taller trees compared to those without logging. However, stand densities (number of trees per unit area) were similar between the two site types. Notably, a more pronounced dominance of spruce was observed in unsalvaged plots compared to salvaged ones. In both site types, common rowan was frequently present alongside Norway spruce. The main difference was that birch was much less frequent in unsalvaged sites compared to salvaged ones. We attribute these differences primarily to the contrasting amounts of deadwood. At unsalvaged sites, the greater volume of deadwood, which had not decomposed sufficiently to create a suitable growth surface, resulted in less space for forest regeneration. Specifically, while deadwood reduced the space for regeneration minimally at salvaged sites, it occupied nearly 1/5 of the total ground space at unsalvaged sites. A related study by Michalová et al. [31] in the High Tatra Mountains suggested that wood logging likely promoted tree species diversity by disrupting ground surfaces covered by spruce saplings, thus freeing space for other tree species. Similarly, a field survey in temperate forests in North America [51] found that post-disturbance logging increased seedling diversity a few years after wood processing, although the overall impact on tree species composition was minimal.
According to Holeksa [52], the full decomposition of spruce deadwood in mountainous conditions can take over 100 years, with the stage suitable for regeneration typically being reached only after 35–40 years. At the time of our field measurements, the lying wood and stumps had not undergone significant decomposition. We estimated that most deadwood was in the third to fourth decay class, indicating a middle stage of decay. This suggests that the deadwood had not yet reached optimal conditions for forest regeneration. Consequently, at the time of our study, the presence of deadwood at the sites was more retarding than stimulating for forest regeneration and further growth. It is important to note that while forest cover in salvaged areas was slightly more developed and richer in tree species composition than in unsalvaged areas, these results reflect the current situation, which is not permanent or definitive. Our observations were made in relatively young forests, approximately 18 years old. Trees and forest stands typically continue to grow and develop for over 100 years, and in areas with high levels of nature conservation, some may persist for several hundred years. Over such timescales, tree species composition and forest structures are dynamic and can change considerably. This variability is influenced by the differing lifespans of tree species; for instance, softwood broadleaves (e.g., birches, goat willow, and rowan) have much shorter lifespans compared to coniferous species (e.g., Norway spruce, European larch, and Scots pine; see [53]).
Many previous studies (e.g. [32,54,55]) have highlighted the positive effects of deadwood on biodiversity, noting its crucial role in supporting flora and fauna and mitigating forest degradation caused by human activities [56]. Despite these benefits, wood remains a primary product in commercial forests and is one of the few renewable resources. It represents a major (often the sole) source of income for forest stakeholders and is essential for various industries and utilities serving human needs. Therefore, the balance between managed and unmanaged post-disturbance areas will continue to be shaped by forest management objectives, which are typically categorized as either commercial or conservation-focused.
4. Materials and Methods
4.1. Description of Study Area
Our work focused on the territory of the High Tatra Mountains, located in the northern part of Slovakia, close to the border with Poland. The mountains are part of the Tatra National Park, which is the oldest and most attractive protected area in the country. The bedrock is predominantly composed of granodiorite sediments. The soils are mostly lithic leptosols and podzols. The climate is rather cold (with an annual mean temperature near 5.0 °C) and moist (with an annual precipitation exceeding 1,000 mm), and snow cover lasts for over 100 days.
Before the wind destruction on November 19th, 2004 (called “Alžbeta”), the High Tatra Mountains area was mostly covered by old, dense forests up to approximately 1,600 meters above sea level (a.s.l.). The forests at lower altitudes were predominantly dominated by Norway spruce (Picea abies L. Karst), sporadically with European larch (Larix decidua Mill.), Scots pine (Pinus sylvestris L.) and scattered individuals of rowan (Sorbus aucuparia L.), aged between 61 and 120 years. These forests transitioned into low stands composed of dwarfed, multi-stemmed mountain pine (Pinus mugo Turra), which occurred up to almost 2,000 meters a.s.l.
A significant portion of the spruce-dominated forests in this region was destroyed by the exceptionally strong windstorm “Alžbeta” in 2004. The majority of the forest damage occurred between 700 and 1,200 meters a.s.l. Most of the trees were uprooted (2/3 of all damaged trees), with stem breakage occurring less frequently (1/3). Undamaged trees remained very sporadically in the epicenter of the wind destruction and were usually represented by European larch and Scots pine, as they are more resistant to wind load than Norway spruce.
Here, we briefly explain post-disturbance forest management in the area. The post-disturbance area was managed in contrasting ways regarding the degree of nature protection: a) salvaged area (approximately 90% of the total post-disturbance area) and b) area with fully excluding wood logging (10%). We use the terms "salvaged" and "unsalvaged" areas hereinafter. The majority of the wood was processed up to two years after the disturbance (2005 – 2006), with the remainder processed in the third year (2007). During that time, different approaches to reforestation were implemented, respecting, among other aspects, the level of nature protection. Approximately one third of the recovered area was reforested within five years after the wind destruction, primarily by planting European larch, Norway spruce, Scots pine, sycamore (Acer pseudoplatanus L.), and silver fir (Abies alba L.; see [57]). This reforestation occurred within salvaged areas, but only at lower altitudes. At higher altitudes (where our research plots were situated), artificial reforestation was very rare, even in areas where calamity wood was processed. At the same time, unsalvaged areas were characterized exclusively by natural succession regardless of altitude. Hence, we can state that all our research plots were covered by nearly 100% naturally regenerated young stands.
4.2. Design of the Plots
To monitor the development of post-disturbance forest stands, employees of the National Forest Centre – Forest Research Institute Zvolen established a systematic grid of nineteen monitoring plots (MP) in a regular 1.0 x 1.0 km grid. The grid was derived from the design of the National Forest Inventory system [58]. The MPs were established in 2007, with tree inventories conducted in 2007, 2010, 2016, and 2019 [59,60]. This paper exclusively presents results from field measurements performed later, specifically in 2022.
Our analyses of the data collected in 2019 revealed that the number of MPs located in the unsalvaged area was insufficient. Therefore, in 2022, we decided to intensify the inventory with a denser grid of MPs, specifically 0.25 x 0.25 km. Consequently, we obtained 20 MPs (6 former and 14 new) in the unsalvaged area and an additional 20 MPs in the salvaged area (Figure 6). The MPs in areas with post-windthrow logging were selected under very similar altitudinal conditions as those without logging. Specifically, the MP plots in the salvaged area were located at altitudes ranging from 856 to 1348 m a.s.l., while those in the unsalvaged area ranged from 853 to 1388 m a.s.l. The dense cluster of MPs (small sub-figure in Figure 6) with unsalvaged calamity wood relates to the limited range of fully excluded post-disturbance management.
The first step in the 2022 measurements was to identify the MP centers in the field based on their coordinates using a GPS device with an accuracy of 3–4 meters. Next, four circular satellite plots (SPs), each with a radius of 3 meters, were established around the center of the MPs. These SPs were placed in the directions of north (0°), east (90°), south (180°), and west (270°) at a horizontal distance of 8 meters between the central point of each SP and the MP center (Figure 7). This approach resulted in a total of 80 SPs representing salvaged areas and 80 SPs located within unsalvaged areas included in our survey.
4.3. Field Measurements of Live Trees and Deadwood
A complete inventory of all regenerating individuals, specifically trees with a height of 0.1 m or more, was conducted in each SP. We measured stem diameter at ground level (diameter at base; DAB) using a digital micrometer with a precision of ±0.01 mm, recorded tree height using a wooden measuring stick with a precision of ±1.0 mm, and identified tree species. In addition to live trees, we also assessed the amount of deadwood within each SP. This approach was chosen because conducting a terrestrial survey of the entire MP area for deadwood was extremely time-consuming (see Figure 7).
The position of each piece of deadwood was recorded using Field-Map technology (see IFER; https://www.fieldmap.cz/). The survey included logs (primarily downed deadwood) with a minimum diameter of 7 cm, measured at the thinner end. The diameter of the deadwood was measured at both ends using an electronic caliper with an accuracy of 1 mm, and the volume was calculated using Smalian's formula (e.g., [61]).
For each piece of deadwood (nearly all logs originated from Norway spruce), the decay class was visually estimated and classified into one of five categories (i.e. decay classes) based on its condition: 1st – recently dead, 2nd – weakly decayed, 3rd – moderately decayed, 4th – very decayed, and 5th – almost decomposed (see [42] for detailed class descriptions). If the decomposition of a log varied, both stages were recorded, and the proportion of each stage was estimated based on the log's length (if there was only one decay class, it was considered 100%). Additionally, we distinguished whether the downed log was lying directly on the ground surface (attached to the soil) or if it was elevated (unattached to the soil), either situated on other deadwood or suspended in the air.
4.4. Deadwood Sampling and Laboratory Measurements
In addition to measuring deadwood in the SP, we also collected samples (all originated from Norway spruce) for further laboratory analyses. To precisely shape of the discs, we used a cordless drywall drill with a specialized attachment, enabling us to drill into the wood with a constant radius of 40 mm. The procedure was as follows: randomly selected pieces of deadwood were cut using a cordless saw, making a sharp cut perpendicular to the trunk axis (see Figure 8). A hole was then drilled into a straight cross-section with a cordless drill, producing a hole with a radius of 40 mm and a depth of 50 mm. After drilling, the attachment was removed, and the drilled disc was sawn off at the drilled depth, maintaining the same perpendicular orientation to the trunk axis. This method ensured a consistent volume for each sample, which was calculated as the volume of a cylinder with a radius of 40 mm and a height of 50 mm.
For this purpose, samples were collected from the unprocessed section of the Alžbeta windthrow area in May, June, and August 2022, 18 years after the windthrow occurred. A total of 100 disks were gathered from this site. In 2023, additional samples were taken from the unprocessed part of the Žofia windthrow, a subsequent disaster that followed the Alžbeta event and occurred in May 2014. Thus, sampling from Žofia took place 9 years after the disaster. Between June and August 2023, 100 disks were collected from this site as well. Our objective was to collect samples from lower decay classes (1st and 2nd) compared to those from the Alžbeta windthrow, enabling us to study deadwood traits across all decay classes.
A total of 200 deadwood samples, representing the full spectrum of decay classes, were collected. The samples were packed in microtene bags, labeled, and transported to the Central Forestry Laboratories at the National Forest Centre in Zvolen. Further analyses focused on the physical properties of the samples (volume, mass, density, and water content) as well as their chemical traits (carbon content).
To determine density, two input parameters were used: mass (i.e., weight) and volume. The volume was calculated using the formula for the volume of a cylinder, as the drilled discs had a known radius of 4.0 cm and a thickness of 5.0 cm. Fresh mass was estimated by weighing the samples immediately after the field survey. To estimate dry mass, the samples were oven-dried at 105°C for 48 hours to reach a stable weight, after which they were weighed using laboratory scales with a precision of ±0.01 g.
Afterwards, the deadwood samples were water-saturated by submerging their full volume in water. The samples were weighed repeatedly and kept submerged until they reached a constant weight, indicating full saturation. In practice, maximum saturation was achieved after nearly 10 weeks. Once the samples were fully saturated, their final weights were recorded. The carbon content in the deadwood samples (after oven-drying) was then determined in the chemical laboratory using the spectral element method.
4.5. Data Processing and Statistical Analyses
The measured and recorded characteristics of live trees in forest regeneration and deadwood were calculated per SP and then averaged for each MP. These averages were used to characterize conditions in both salvaged and unsalvaged sites, presented as means and standard errors to reflect variability among MPs. For the deadwood samples, basic traits were summarized for each decay class as mean values and standard errors.
Data archiving and processing were conducted using MS Excel and MS Access, while calculations and analyses were performed with MS SQL Server, Visual Studio 2008, and ArcGIS Desktop. Statistical analyses, including one-way, two-way, and three-way ANOVA followed by a Fisher's LSD test (p < 0.001), were carried out using Statistica 10.0 and R programs.
5. Conclusions
Our study demonstrated that post-disturbance management not only affects the quantity of deadwood but also its characteristics, particularly the decay rate. The amount of deadwood significantly influenced forest regeneration and subsequent development. We found that logging reduced the amount of deadwood and accelerated the decay rate of the coarse woody debris remaining on-site, which represents an ecologically negative effect. Conversely, logging increased species richness and productivity in young forest stands, presenting a positive effect.
Deadwood serves as a critical reservoir of carbon and water in forests. While carbon content in deadwood decreases with the stage of decay, its water storage potential increases. Forest management is not limited to two extremes: intensive commercial management versus complete protection. Instead, a range of management intensities and varying amounts of deadwood left on-site can be applied, tailored to local ecological conditions and human needs. We believe that diversified post-disturbance management practices can enhance sustainability by balancing multiple ecosystem services and species diversity.
Unfortunately, our research covers only a relatively short period of forest development in large-scale post-disturbance areas. A comparative study examining deadwood status and forest development in salvaged versus unsalvaged areas over a longer period would offer more relevant insights. Long-term field measurements and observations are necessary to better understand the impacts of post-disturbance management on forest development across various growth stages. This knowledge would provide a theoretical foundation for ensuring the sustainability of forest cover under changing climatic conditions and incidental disturbances. This need is underscored by the expectation that large-scale disturbances, such as windstorms, forest fires, droughts, and pests, will increasingly affect temperate forests.
Author Contributions
Conceptualisation, B.K. and V.Š.; data curation, V.Š.; funding acquisition, B.K. and V.Š.; investigation, B.K. and V.Š.; methodology, B.K,.V.Š, and J.P., visualisation, V.Š.; supervision, B.K.; writing—original draft preparation, B.K. and V.Š.; writing—review and editing, all authors. All authors have read and agreed to the published version of the manuscript.
Funding
This research was funded within the projects: APVV–18–0086, APVV-20-0168, APVV-20-0215, and APVV–22–0056 from the Slovak Research and Development Agency. A part of research activities was conducted within fulfilling the goals of the project “Progressive methods of forest protection in changing ecological conditions (PROMOLES)”: financed from the budget of the Ministry of Agriculture and Rural Development of the Slovak Republic (No. 08V0301).
Conflicts of Interest
The authors declare no conflict of interest.
References
- Lindner, M.; Maroschek, M.; Netherer, S.; Kremer, A.; Barbati, A.; et al. Climate change impacts, adaptive capacity, and vulnerability of European forest ecosystems. For. Ecol. Manage. 2010, 259, 698–709. [Google Scholar] [CrossRef]
- Seidl, R.; Schelhaas, M.-J.; Rammer, W.; Verkerk, P.J. Increasing forest disturbances in Europe and their impact on carbon storage. Nat. Clim. Chang. 2014, 4, 806–810. [Google Scholar] [CrossRef] [PubMed]
- Kunca, A.; Zúbrik, M.; Vakula, J.; Leontovyč, R.; Konôpka, B.; Nikolov, Ch.; Gubka, A.; Longauerová, V.; Maľová, M.; Kaštier, P.; Rell, S. Salvage felling in the Slovak forests in the period 2004–2013. Lesn. Čas. – For. J. 2015, 61, 188–195. [Google Scholar] [CrossRef]
- Kunca, A.; Zúbrik, M.; Vakula, J.; Leontovyč, R.; Konôpka, B.; Nikolov, Ch.; Gubka, A.; Longauerová, V.; Maľová, M.; Rell, S.; Lalík, M. Salvage felling in the Slovak Republic’s forests during the last twenty years (1998–2017). Cent. Eur. For. J. 2019, 65, 3–11. [Google Scholar] [CrossRef]
- Bebi, P.; Seidl, R.; Motta, R.; Fuhr, M.; Firm, D.; Krumm, F.; Conedera, M.; Ginzler, C.; Wohlgemuth, T.; Kulakowski, D. Changes of forest cover and disturbance regimes in the mountain forests of the Alps. For. Ecol. Manag. 2017, 388, 43–56. [Google Scholar] [CrossRef]
- Hermann, S.; Kahl, T.; Bauhus, J. Decomposition dynamics of coarse wood debris of three important central European tree species. For. Ecosyst. 2015, 2, 27. [Google Scholar] [CrossRef]
- Shorohova, E.; Kapitsa, E. The decomposition rate of non-stem components of coarse woody debris (CWD) in European boreal forests mainly depends on site moisture and tree species. Eur. J. For. Res. 2016, 135, 593–606. [Google Scholar] [CrossRef]
- Konôpka, B.; Šebeň, V.; Merganičová, K. Forest Regeneration Patterns Differ Considerably between Sites with and without Wood Logging in the High Tatra Mountains. Forests 2021, 12, 1349. [Google Scholar] [CrossRef]
- Harmon, M.E.; Franklin, J.F.; Swanson, F.J.; Sollins, P.; Gregory, S.V.; Lattin, J.D.; Anderson, N.H.; Cline, S.P.; Aumen, N.G.; Sedell, J.R.; Liencamper, G.W.; Cromack, K.; Cummins, K.W. Ecology of coarse woody debris in temperate ecosystems. Adv. Ecol. Res. 1986, 15, 133–202. [Google Scholar]
- Gärtner, A.; Jönsson, A.M.; Metcalfe, D.B.; Pugh, T.A.M.; Tagesson, T.; Alhström, A. Temperature and Tree Size Explain the Mean Time to Fall of Dead Standing Trees across Large Scales. Forests 2023, 14, 1017. [Google Scholar] [CrossRef]
- Seibold, S.; Bässler, C.; Brandl, R.; Gossner, M. M.; Thorn, S.; Ulyshen, M. D.; Müller, J. Experimental studies of dead-wood biodiversity—A review identifying global gaps in knowledge. Biol. Conserv. 2015, 191, 139–149. [Google Scholar] [CrossRef]
- Sandström, J.; Bernes, C.; Junninen, K.; Lohmus, A.; Macdonald, E.; Müller, J.; Jonsson, B.G. Impacts of dead wood manipulation on the biodiversity of temperate and boreal forests. A systematic review. J. Appl. Ecol. 2019, 56, 1770–1781. [Google Scholar] [CrossRef]
- Sebek, P.; Altman, J.; Platek, M.; Cizek, L. Is active management the key to the conservation of saproxylic biodiversity? Pollarding promotes the formation of tree hollows. PlosOne 2013, 8, e60456. [Google Scholar] [CrossRef] [PubMed]
- Svoboda, M.; Fraver, S.; Janda, P.; Bace, R.; Zenahlikova, J. Natural development and regeneration of a Central European montane spruce forest. For. Ecol. Manag. 2010, 260, 707–714. [Google Scholar] [CrossRef]
- Wellbrock, N. , Grueneberg, E., Riedel, T., Polley, H. Carbon stocks in tree biomass and soils of German forests. Cent. Eur. For. J. 2017, 63, 105–112. [Google Scholar]
- Floriancic, M.G.; Allen, S.T. , Meier, R.; Truniger, L.; Kirchner, AJ.W.; Molnar, P. Potential for significant precipitation cycling by forest-floor litter and deadwood. Ecohydrology 2022, 16, e2493. [Google Scholar] [CrossRef]
- Klamerus-Iwan, A.; Lasota, J.; Blonska, E. Interspecific Variability of Water Storage Capacity and Absorbability of Deadwood. Forests 2020, 11, 575. [Google Scholar] [CrossRef]
- Allison, S. D.; Gartner, T. B.; Holland, K.; Weintraub, M.; Sinsabaugh, R. L. Soil enzymes: Linking proteomics and ecological processes. Manual of Environmental Microbiology 2007, 58, 704–711. [Google Scholar]
- Brischke, C.; Alfredsen, G. Wood-water relationships and their role for wood susceptibility to fungal decay. Appl. Microbiol. Biotechnol. 2020, 104, 3781–3795. [Google Scholar] [CrossRef]
- Jomura, M.; Yoshida, R.; Michlačíková, L.; Tláskal, V.; Baldrian, D. Factors Controlling Dead Wood Decomposition in an Old-Growth Temperate Forest in Central Europe. J. Fungi 2022, 8, 673. [Google Scholar] [CrossRef]
- Pietsch, K.A.; Eichenberg, D.; Nadrowski, K.; Bauhus, J.; Buscot, F.; Purahong, W.; Wipfler, B.; Wubet, T.; Yu, M.; Wirth, Ch. Wood decomposition is more strongly controlled by temperature than by tree species and decomposer diversity in highly species rich subtropical forests. Oikos 2019, 128, 701–715. [Google Scholar] [CrossRef]
- Shorohova, E.; Kapitsa, E.; Kuznetsov, A.; Kuznetsova, S.; de Gerenyu, V.L.; Kaganov, V.; Kurganova, I. Coarse wood debris density and carbon content concentration by decay classes in mixed montane wet tropical forests. Biotropica 2021, 54, 635–644. [Google Scholar] [CrossRef]
- Harmon, M.E.; Whigham, D.F.; Sexton, J.; Olmsted, I. Decomposition and mass of woody detritus in the dry tropical forests of the Northeastern Yucatan Peninsula, Mexico. Biotropica 1995, 27, 305–316. [Google Scholar] [CrossRef]
- Blanchette, R.A. A review of microbial deterioration found in archaeological wood from different environments. Int. Biodeter. Biodegr. 2000, 46, 189–204. [Google Scholar] [CrossRef]
- Bitunjac, D.; Ostrogovic Sever, M.Z.; Sever, K. , Merganičová, K.; Marjanovic, H.; Dead wood volume-to-carbon conversion factors by decay class for ten tree species in Croatia and eight tree genera globally. For. Ecol. Manag. 2023, 549, 121431. [Google Scholar] [CrossRef]
- Khanina, L.; Bobrovsky, M.; Smirnov, V.; Romanov, M. Wood decomposition, carbon, nitrogen, and pH values in logs of 8 tree species 14 and 15 years after a catastrophic windthrow in a mesic broad-leaved forest in the East European plain. For. Ecol. Manag. 2023, 545, 121275. [Google Scholar] [CrossRef]
- West, P.W. Tree and Forest Measurement. Second edition, Heildelberg, Springer, 2009, 192 p.
- Yrttimaa, T.; Saarinen, N.; Luoma, V.; Tanhuanpää, T.; Kankare, V.; Liang, X.; Hyyppä, J.; Holopainen, M.; Vastaranta, M. Detecting and characterizing downed dead wood using terrestrial laser scanning. ISPRS J. Photogramm. Remote Sens 2019, 151, 76–9. [Google Scholar] [CrossRef]
- Panagiotidis, D.; Abdollahnejad, A.; Surový, P.; Kuželka, K. Detection of Fallen Logs from High-Resolution UAV Images. N. Z. J. For. Sci. 2019, 49, 2. [Google Scholar] [CrossRef]
- Palleto, A.; De Meo, I.; Cantiani, P.; Ferretti, F. Effects of forest management on the amount of deadwood in Mediterranean oak ecosystems. Ann. For. Sci. 2014, 71, 791–800. [Google Scholar] [CrossRef]
- Michalová, Z.; Morrissey, R.C.; Wohlgemuth, T.; Bače, R.; Fleischer, P.; Svoboda, M. Salvage-logging after windstorm leads to structural and functional homogenization of understory layer and delayed spruce tree recovery in Tatra Mts., Slovakia. Forests 2017, 8, 88. [Google Scholar] [CrossRef]
- Vítková, L; Bače, R. ; Kjučukov, P.; Svoboda, M. Deadwood management in Central European forests: Key considerations for practical implementation. For. Ecol. Manag. 2018, 429, 394–405. [Google Scholar] [CrossRef]
- Cerioni, M.; Brabec, M.; Bače, R.; Bāders, E.; Bončina, A.; Brůna, J. ;... & Nagel, T. A. Recovery of European temperate forests after large and severe disturbances. Glob. Chang. Biol, 1715. [Google Scholar]
- Senf, C.; Müller, J.; Seidl, R. Post-disturbance recovery of forest cover and tree height differ with management in Central Europe. Landsc. Ecol. 2019, 34, 2837–2850. [Google Scholar] [CrossRef]
- Kramer, K.; Brang, P.; Bachofen, H.; Bugmann, H.; Wohlgemuth, T. Site factors are more important than salvage logging for tree regeneration after wind disturbance in Central European forests. For. Ecol. Manag. 2014, 331, 116–128. [Google Scholar] [CrossRef]
- Hararuk, O.; Kurz, W.A.; Didion, M. Dynamics of dead wood decay in Swiss forests. For. Ecosyst. 2020, 7, 36. [Google Scholar] [CrossRef]
- Přívětivý, T.; Janík, D.; Unar, P.; Adam, D.; Král, K.; Vrška, T. How do environmental conditions affect the deadwood decomposition of European beech (Fagus sylvatica L.)? For. Ecol. Manag. 2016, 381, 177–187. [Google Scholar] [CrossRef]
- Přívětivý, T.; Adam, D.; Vrška, T. Decay dynamics of Abies alba and Picea abies deadwood in relation to environmental conditions. For. Ecol. Manag. 2018, 427, 250–259. [Google Scholar] [CrossRef]
- Melin, Y.; Petersson, H.; Nordfjell, T. Decomposition of stump and root systems of Norway spruce in Sweden—A modelling approach. For. Ecol. Manag. 2009, 257, 1445–1451. [Google Scholar] [CrossRef]
- Embacher, J.; Zeilinger, S.; Kirchmair, M.; Rodriguez, L.M.; Neuhauser, S. Wood decay fungi and their bacterial interaction partners in the built environment – A systematic review on fungal bacteria interactions in dead wood and timber. Fungal Biol. Rev. 2023, 45, 100305. [Google Scholar] [CrossRef]
- Piaszczyk, W.; Lasota, J.; Blonska, E.; Foremnik, K. How habitat moisture condition affects the decomposition of fine woody debris from different species. Catena 2022, 208, 105765. [Google Scholar] [CrossRef]
- Köster, K.; Metslaid, M.; Engelhart, J.; Köster, E. Dead wood basic density, and the concentration of carbon and nitrogen for main tree species in managed hemiborela forests. For. Ecol. Manag. 2015, 354, 35–42. [Google Scholar] [CrossRef]
- Noh, N.J.; Yoon, T.K.; Kim, R.-H.; Bolton, N.W.; Kim, Ch.; Son, Y. Carbon and Nitrogen Accumulation and Decomposition from Coarse Woody Debris in Naturally Regenerated Korean Red Pine (Pinus densiflora S. et Z.) Forests. Forests 2017, 8, 8060214. [Google Scholar] [CrossRef]
- Přívětivý, T.; Šamonil, P. Variation in Downed Deadwood Density, Biomass, and Moisture during Decomposition in Natural Temperate Forest. Forests 2021, 12, 12101352. [Google Scholar] [CrossRef]
- Hermann, S.; Bauhus, J. Effects of Moisture, Temperature and Decomposition Stage on Respirational Carbon Loss from Coarse Woody Debris (CWD) of Important European Tree Species. Scand. J. For. Res. 2012, 28, 346–357. [Google Scholar] [CrossRef]
- Blonska, E.; Górski, A.; Lasota, J. The rate of deadwood decomposition processes in tree stand gaps resulting from bark beetle infestation spots in mountain forests. For. Ecosyst. 2024, 11, 100195. [Google Scholar] [CrossRef]
- Brischke, C.; Rapp, A.O. Influence of wood moisture content and wood temperature on fungal decay in the field: Observations in different micro-climates. Wood Sci. Technol. 2008, 42, 663–677. [Google Scholar] [CrossRef]
- Ma, F.; Wang, S.; Sang, W.; Ma, K. Spatial Pattern of Living Woody and Coarse Woody Debris in Warm-Temperate Broad-Leaved Secondary Forest in North China. Plants 2024, 13, 2339. [Google Scholar] [CrossRef] [PubMed]
- Hassan, B.; Francis, L.; Hayes, R.A.; Shirmohammadi, M. Decay resistance of southern pine wood containing varying amounts of resin against Fomitopsis ostreiformis (Berk.) T. Hatt. Holzforschung 2024, 78, 154–166. [Google Scholar] [CrossRef]
- Gaskell, J.; Blanchette, R.A.; Steward, P.E.; BonDurant, S.S.; Adams, M.; Sabat, M.; Kersten, P.; Cullen, D. Transcriptome and Secretome Analyses of the Wood Decay Fungus Wolfiporia cocos Support Alternative Mechanisms of Lignocellulose Conversion. Appl. Environ. Microbial. 2016, 82, 00639. [Google Scholar] [CrossRef]
- Slyder, J.B.; Wenzel, J.W.; Royo, A.A.; Spicer, M.E.; Carson, W.P. Post-windthrow salvage logging increases seedling and understory diversity with little impact on composition immediately after logging. New For. 2019, 51, 409–420. [Google Scholar] [CrossRef]
- Holeksa, J. Rozpad drzewostanu i odnowienie swierka a struktura i dynamika karpackiego boru gornoreglowego. Monogr. Bot. Lodz 1998, 82, 210. (In Polish) [Google Scholar]
- San-Miguel-Ayanz, J.; de Rigo, D.; Caudullo, G.; Durrant, T.H.; Mauri, A.; et al. European Atlas of Forest Tree Species. Publications Office of the European Union, Luxembourg, 2016, 200 p.
- Bouget, C.; Nusillard, B.; Pineau, X.; Ricou, C. Effect of deadwood position on saproxylic beetles in temperate forests and conservation interest of oak snags. Insect Conserv. Divers. 2012, 5, 264–278. [Google Scholar] [CrossRef]
- Tillon, L.; Bouget, C.; Paillet, Y.; Aulagnier, S. How does deadwood structure temperate forest bat assemblages? Eur. J. For. Res. 2016, 135, 433–449. [Google Scholar] [CrossRef]
- Thorn, S.; Seibold, S.; Leverkus, A.B.; Michler, T.; Müller, J.; Noss, R.F.; Stork, N.; Vogel, S.; Lindenmayer, D.B. The living dead: Acknowledging life after tree death to stop forest degradation. Front. Ecol. Environ. 2020, 18, 505–512. [Google Scholar] [CrossRef]
- Marhefka, J. Forest revitalization after the windstorm calamity on November 19th 2004. TANAP Stud. 2015, 11, 83–94. [Google Scholar]
- Šebeň, V. Národná Inventarizácia a Monitoring Lesov Slovenskej Republiky 2015–2016; Lesnícke štúdie 65; Národné Lesnícke Centrum, Slovakia: Zvolen, Slovakia, 2017; p. 256. (In Slovak) [Google Scholar]
- Konôpka, B.; Šebeň, V.; Pajtík, J. Species Composition and Carbon Stock of Tree Cover at Postdisturbance Area in Tatra National Park, Western Carpathians. MRD 2019, 39, 71–80. [Google Scholar] [CrossRef]
- Šebeň, V.; Konôpka, B. Tree height and species composition of young forest stands fifteen years after the large scale wind disturbance in Tatra National Park. Cent. Eur. For. J. 2020, 66, 131–140. [Google Scholar] [CrossRef]
- Li, C., Barclay, H., Hans, H., Sidders, D. Estimation of Log Volumes: A Comparative Study. Information Report, FI-X-11, Natural Resources Canada, Edmonton, 2015, 11 p.
Figure 1.
Factors significantly influencing the decay rate of deadwood in Norway spruce: post-disturbance management (a), contact with soil (b), and the combination of both factors (c). Error bars are standard errors; different letters indicate significant differences (two-way ANOVA, followed by Fisher's LSD test; p < 0.001).
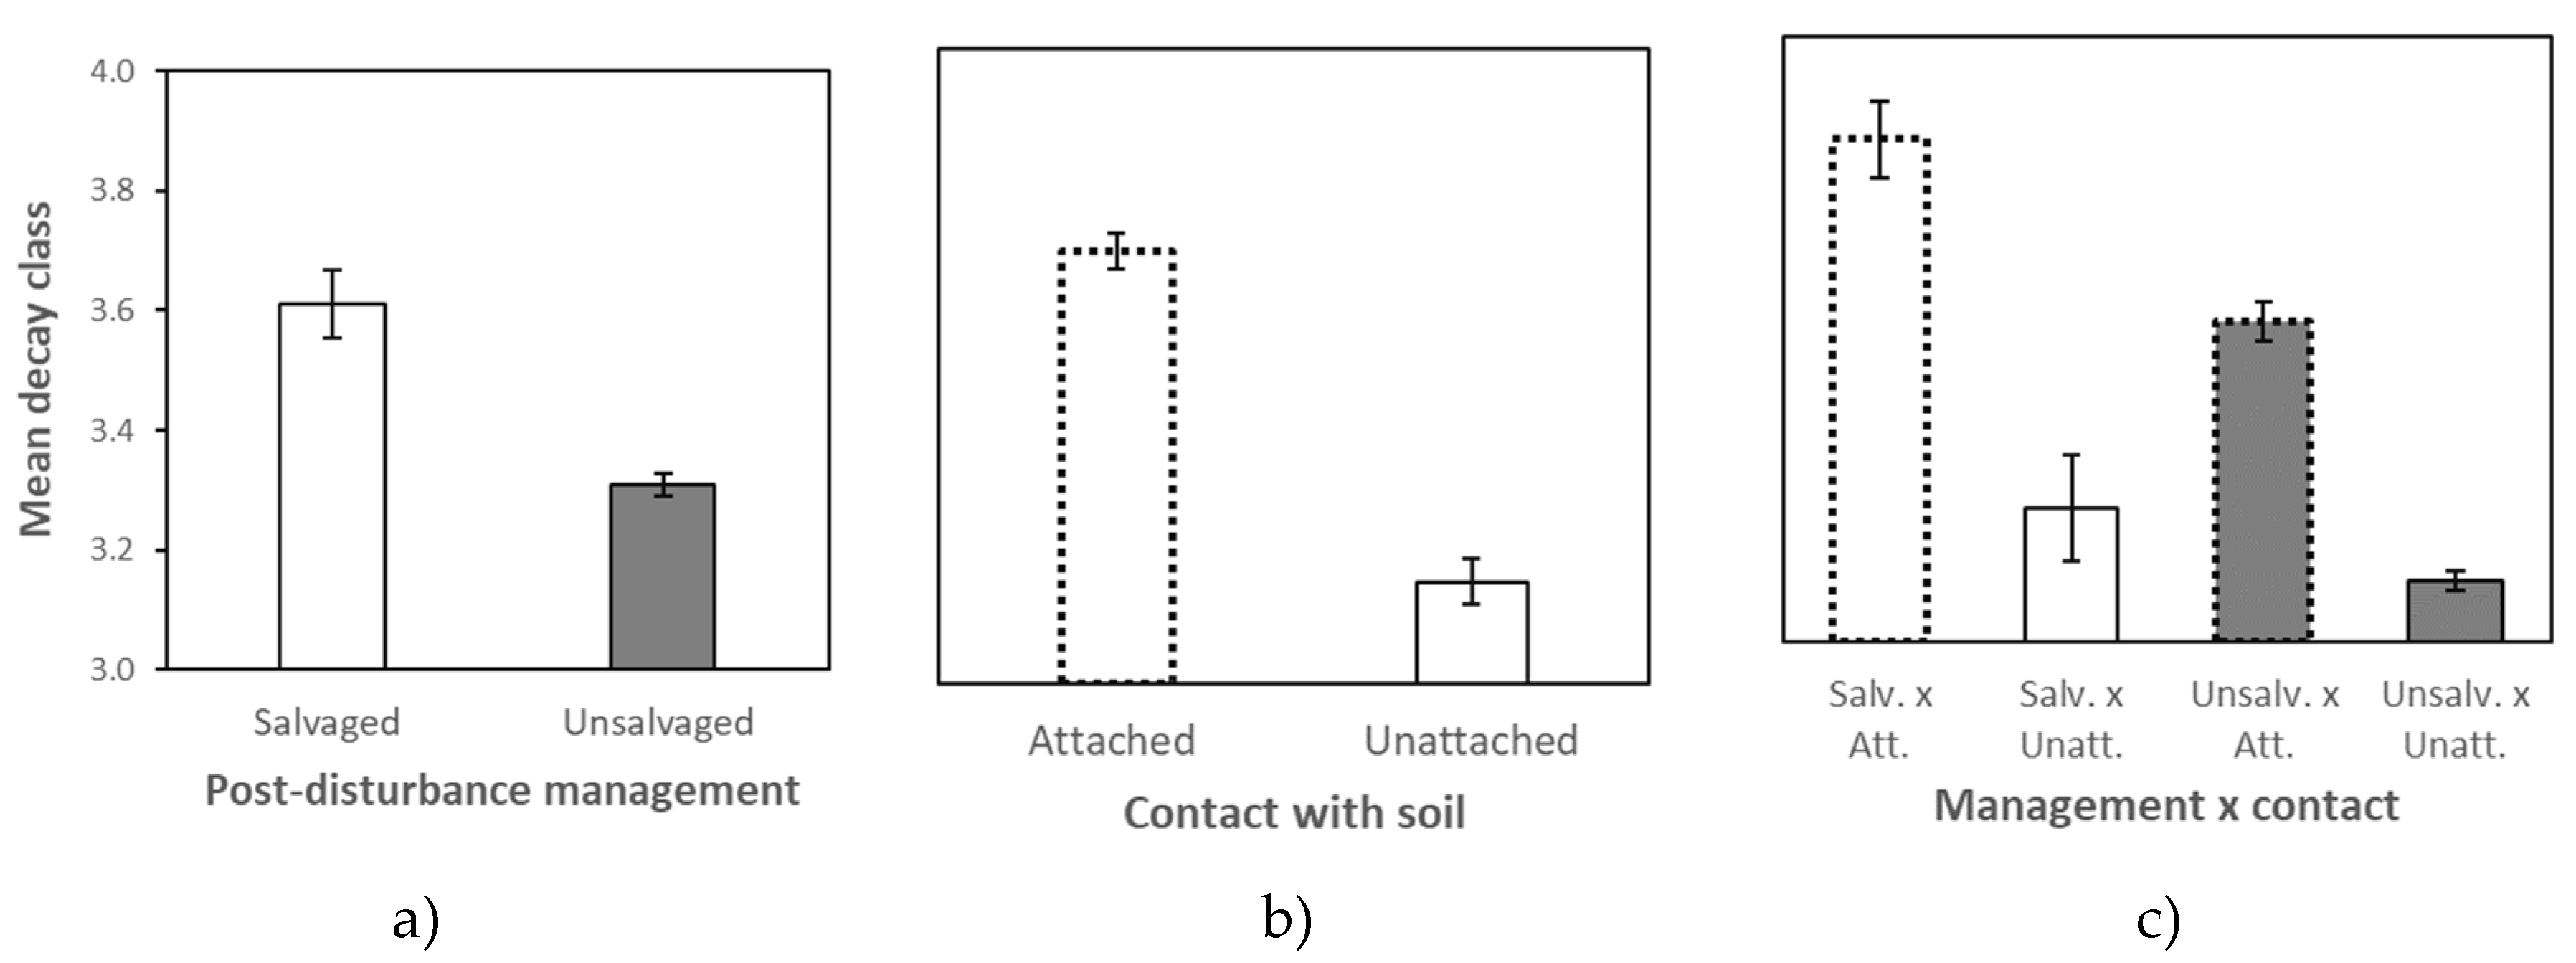
Figure 2.
Deadwood density in Norway spruce, considering dry and fresh (i.e., under field conditions) states according to decay classes. Error bars are standard errors; different letters indicate statistically significant differences (one-way ANOVA followed by Fisher's LSD test; p < 0.001).
Figure 2.
Deadwood density in Norway spruce, considering dry and fresh (i.e., under field conditions) states according to decay classes. Error bars are standard errors; different letters indicate statistically significant differences (one-way ANOVA followed by Fisher's LSD test; p < 0.001).
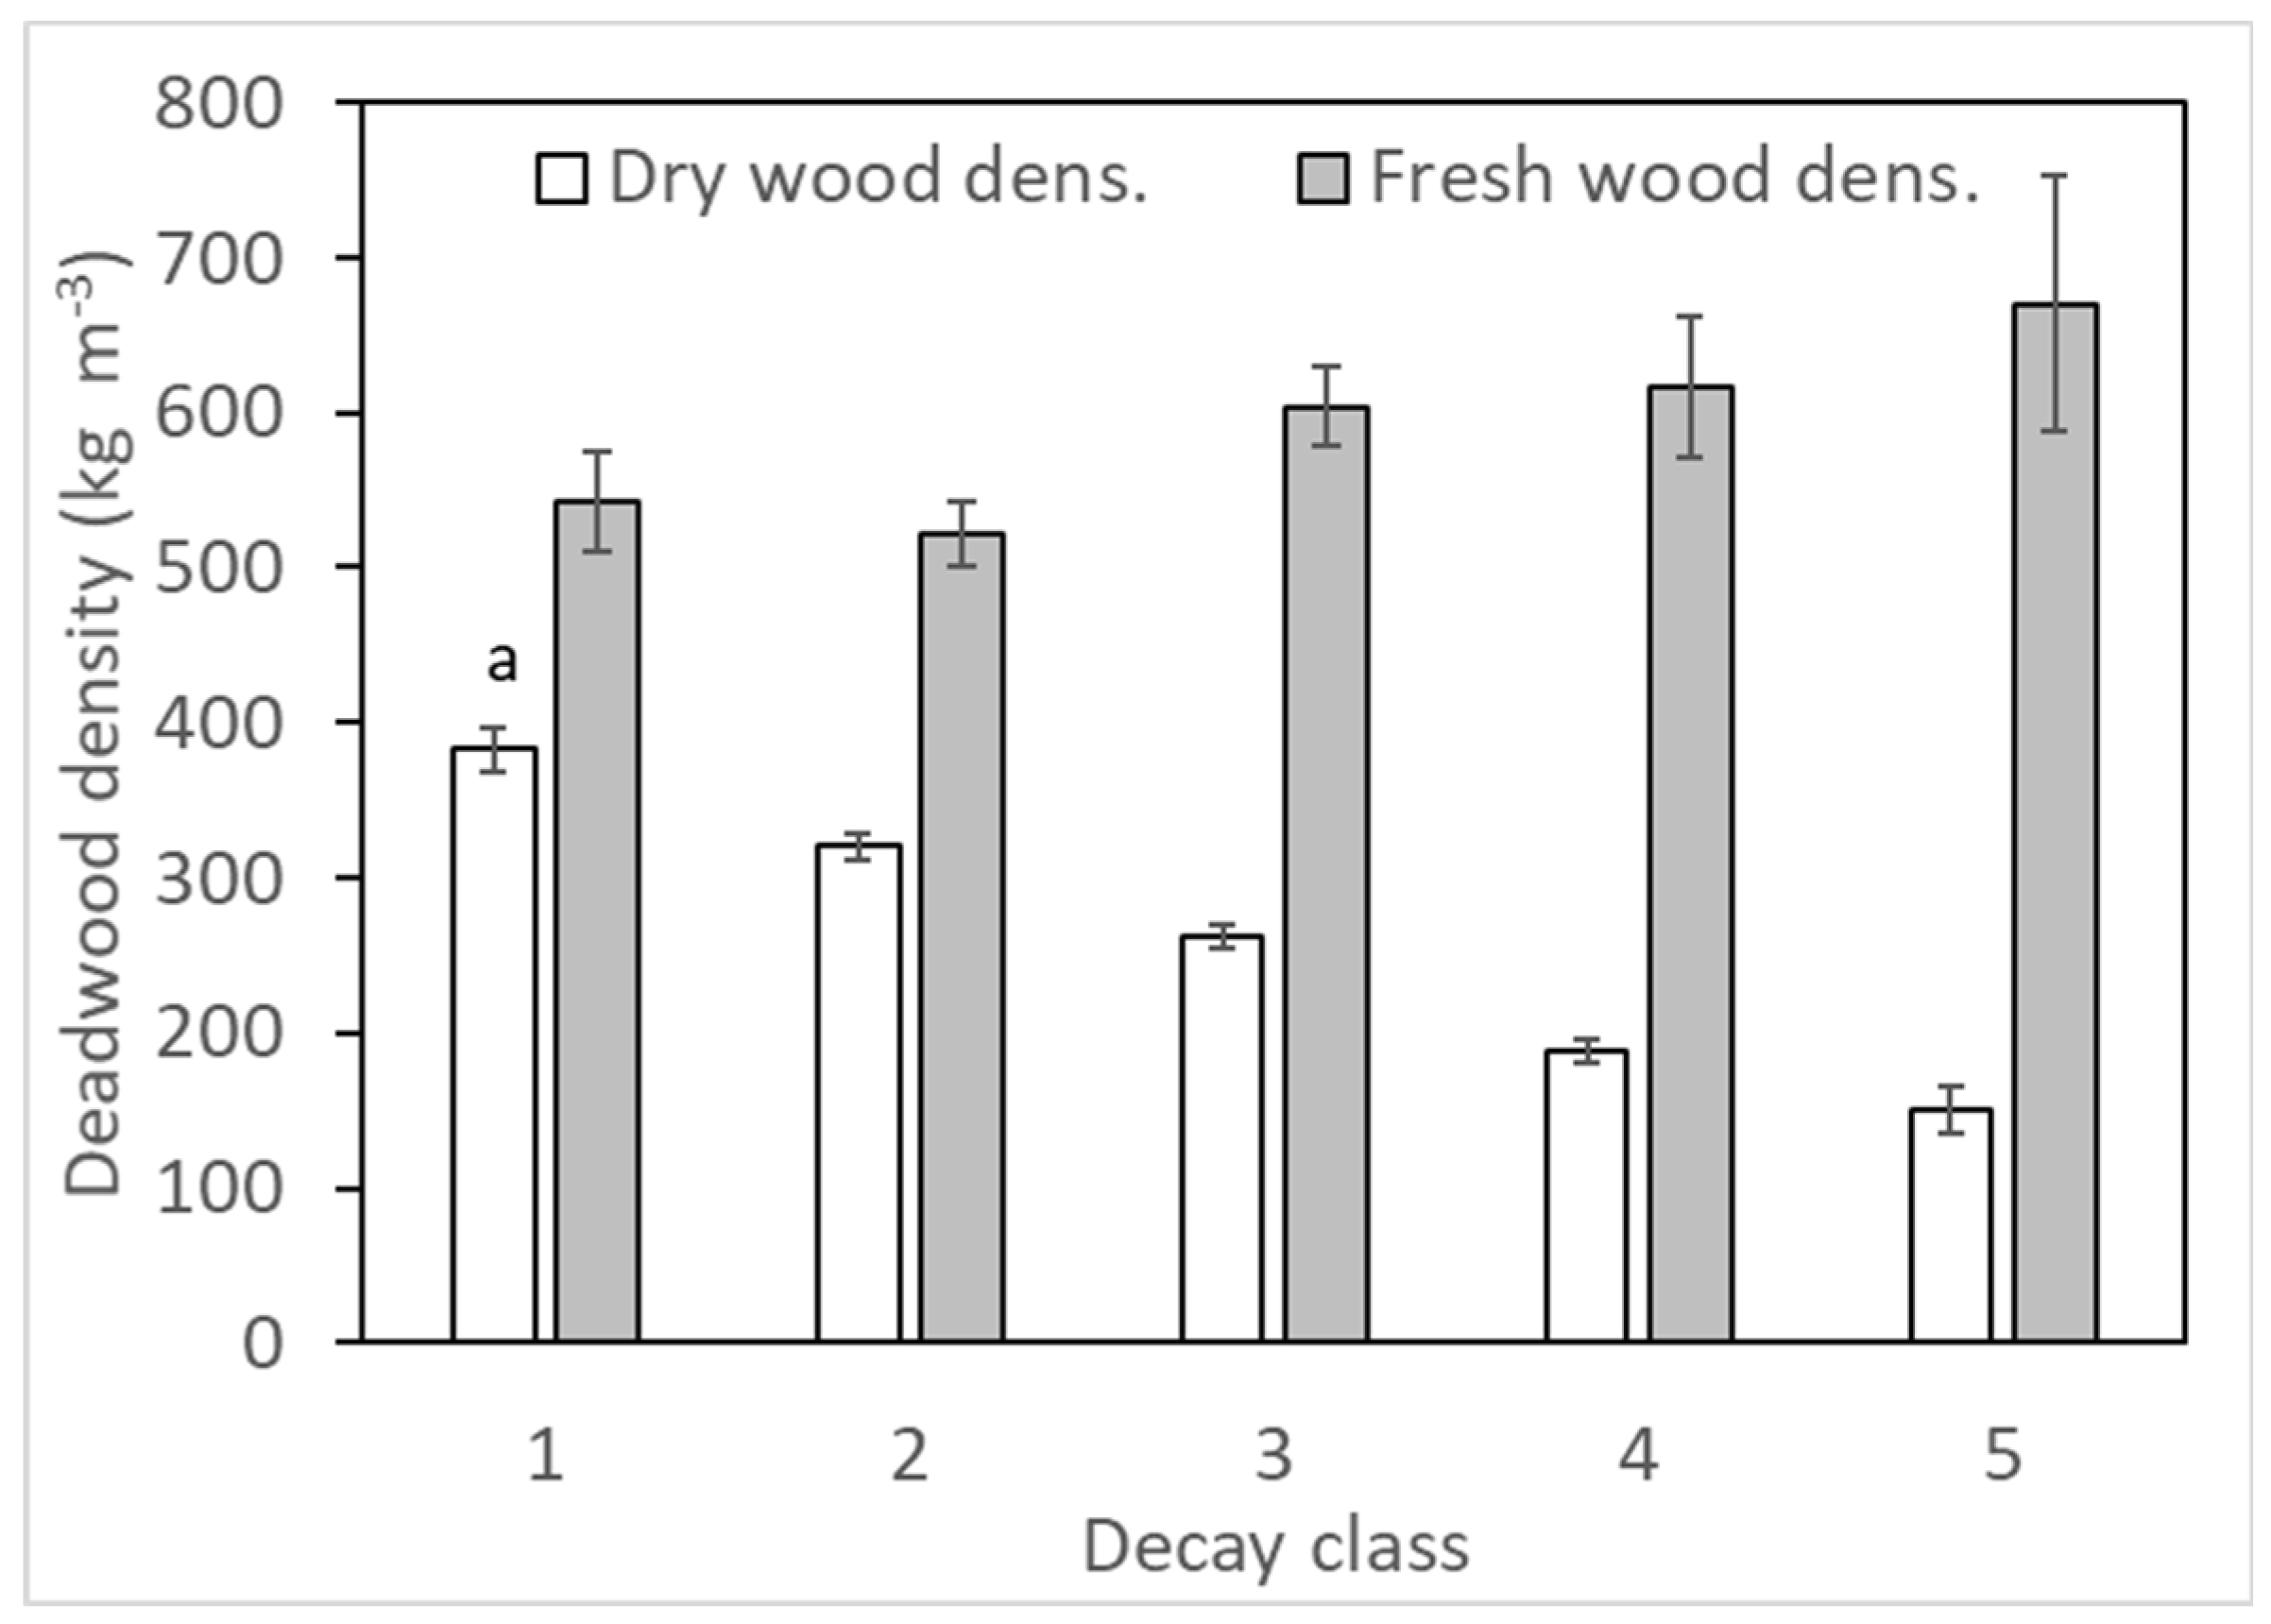
Figure 3.
Carbon content in deadwood of Norway spruce, considering dry matter according to decay classes. . Error bars are standard errors; different letters indicate statistically significant differences (one-way ANOVA followed by Fisher's LSD test; p < 0.001).
Figure 3.
Carbon content in deadwood of Norway spruce, considering dry matter according to decay classes. . Error bars are standard errors; different letters indicate statistically significant differences (one-way ANOVA followed by Fisher's LSD test; p < 0.001).
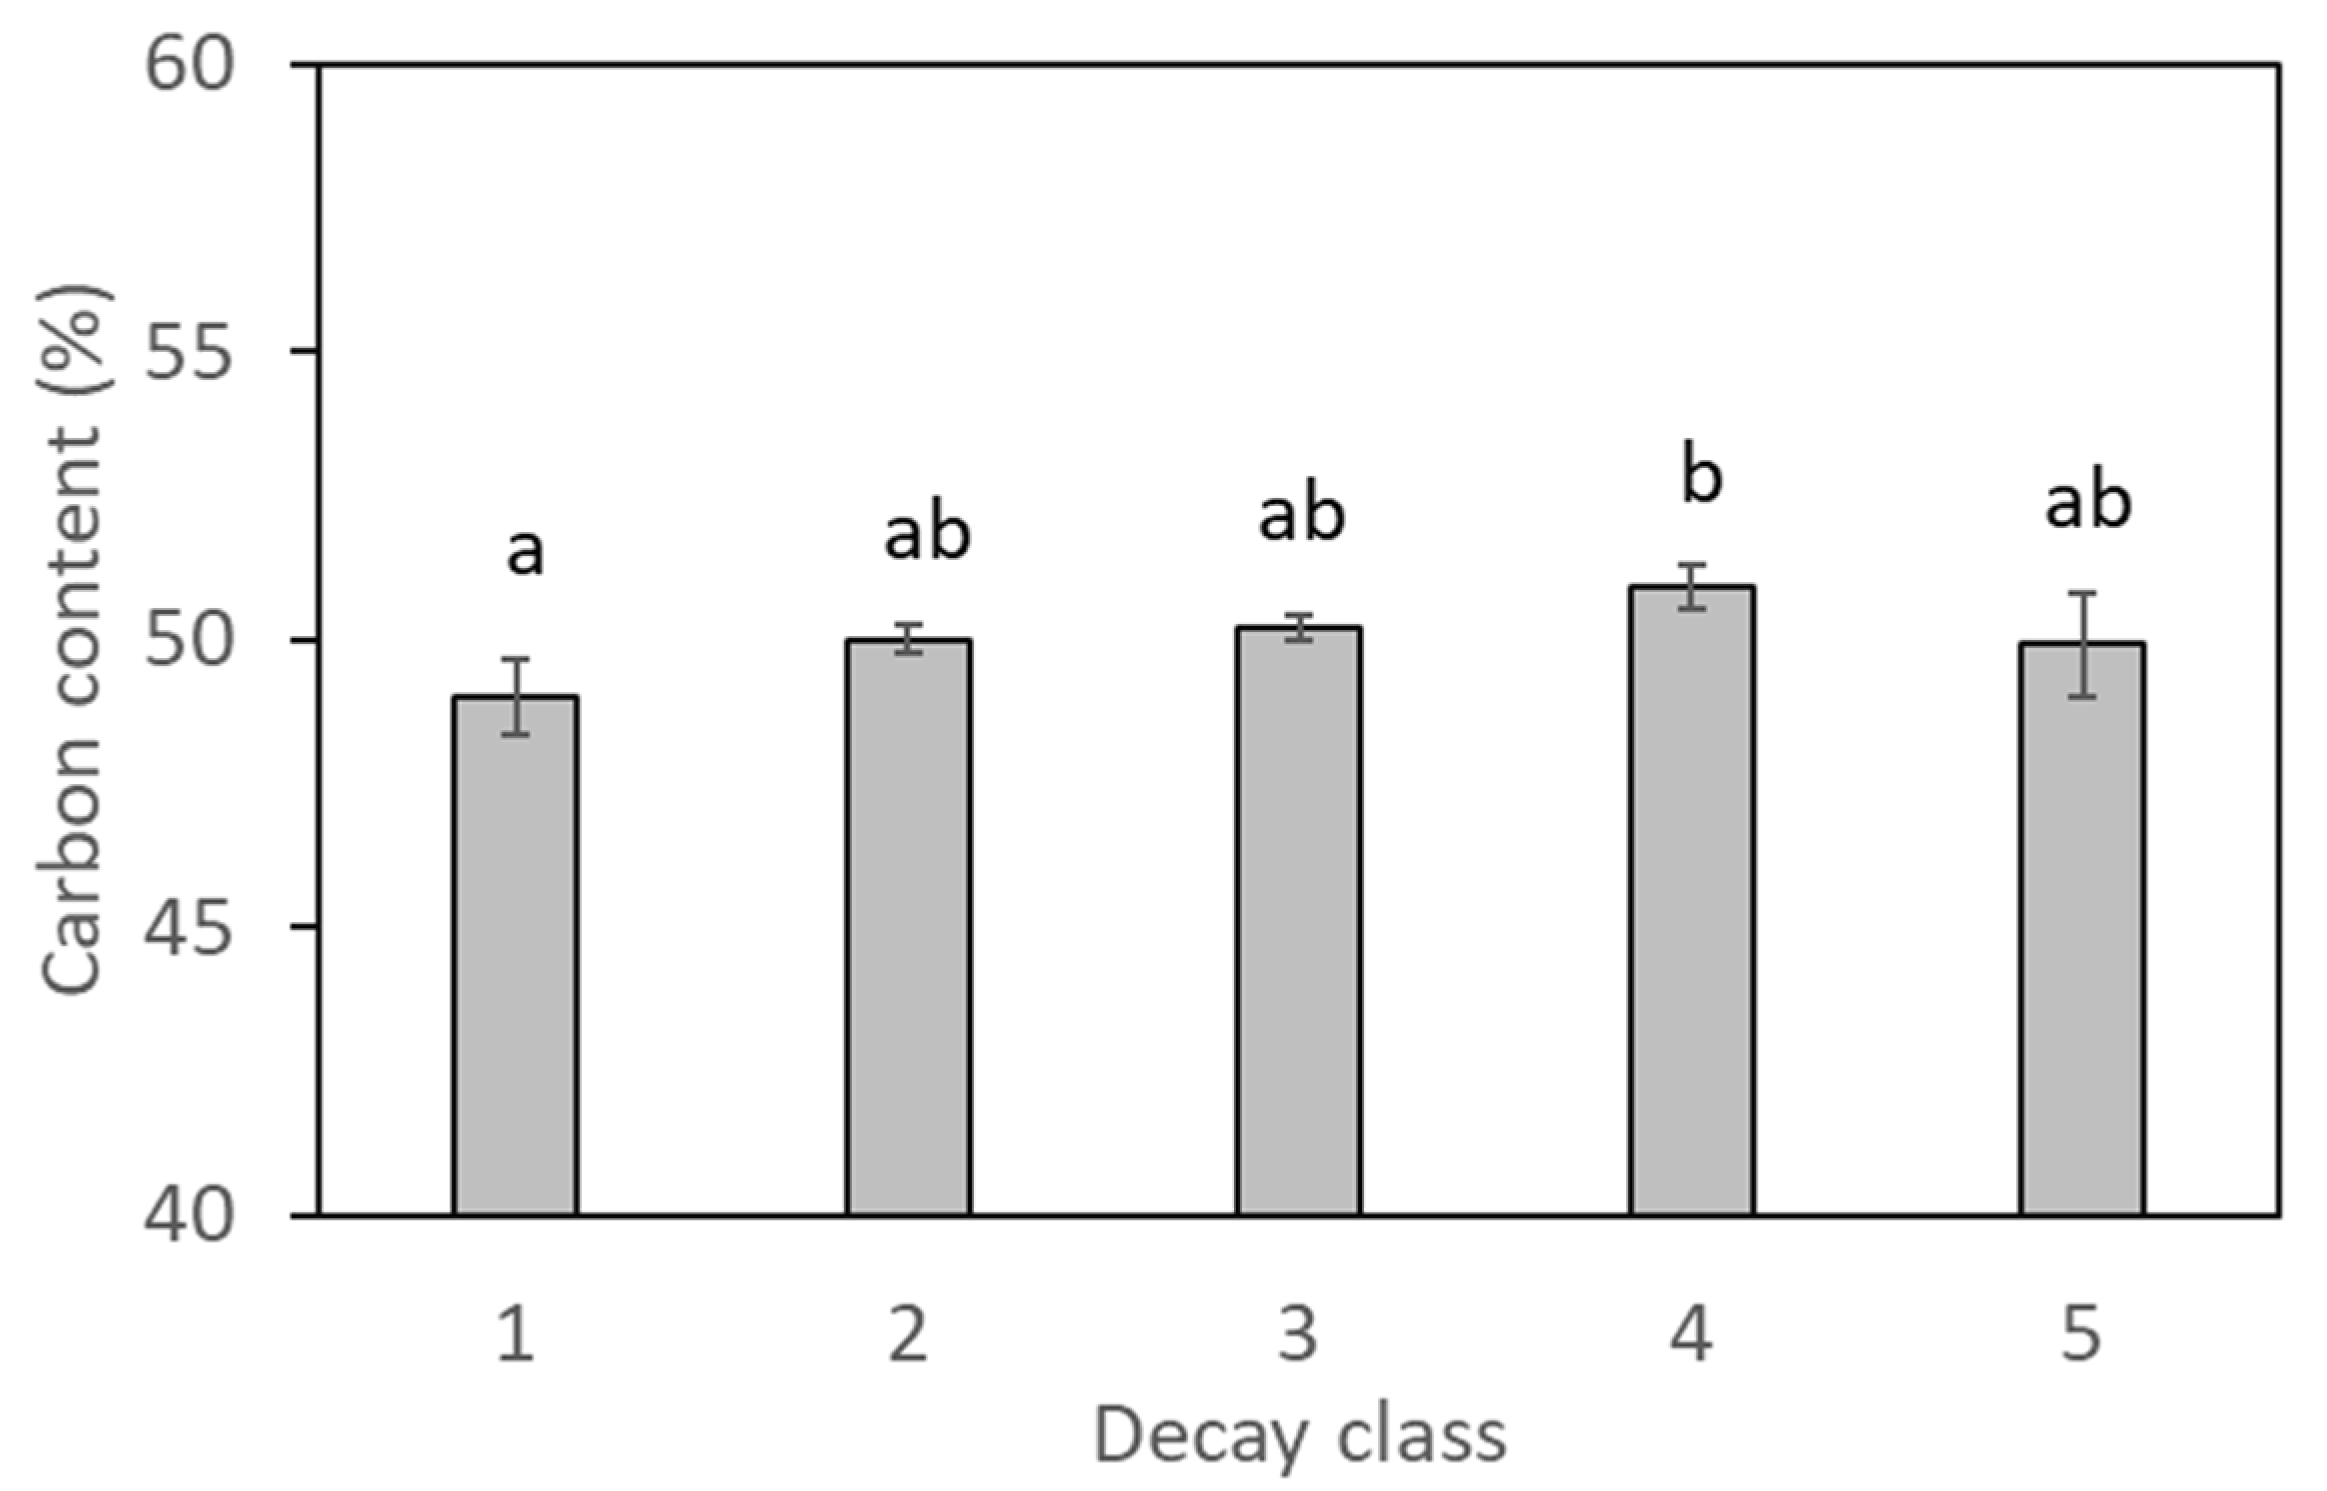
Figure 4.
Volume to carbon conversion factor (VCCF) in deadwood of Norway spruce according to decay classes. Error bars are standard errors; different letters indicate statistically significant differences (one-way ANOVA followed by Fisher's LSD test; p < 0.001).
Figure 4.
Volume to carbon conversion factor (VCCF) in deadwood of Norway spruce according to decay classes. Error bars are standard errors; different letters indicate statistically significant differences (one-way ANOVA followed by Fisher's LSD test; p < 0.001).
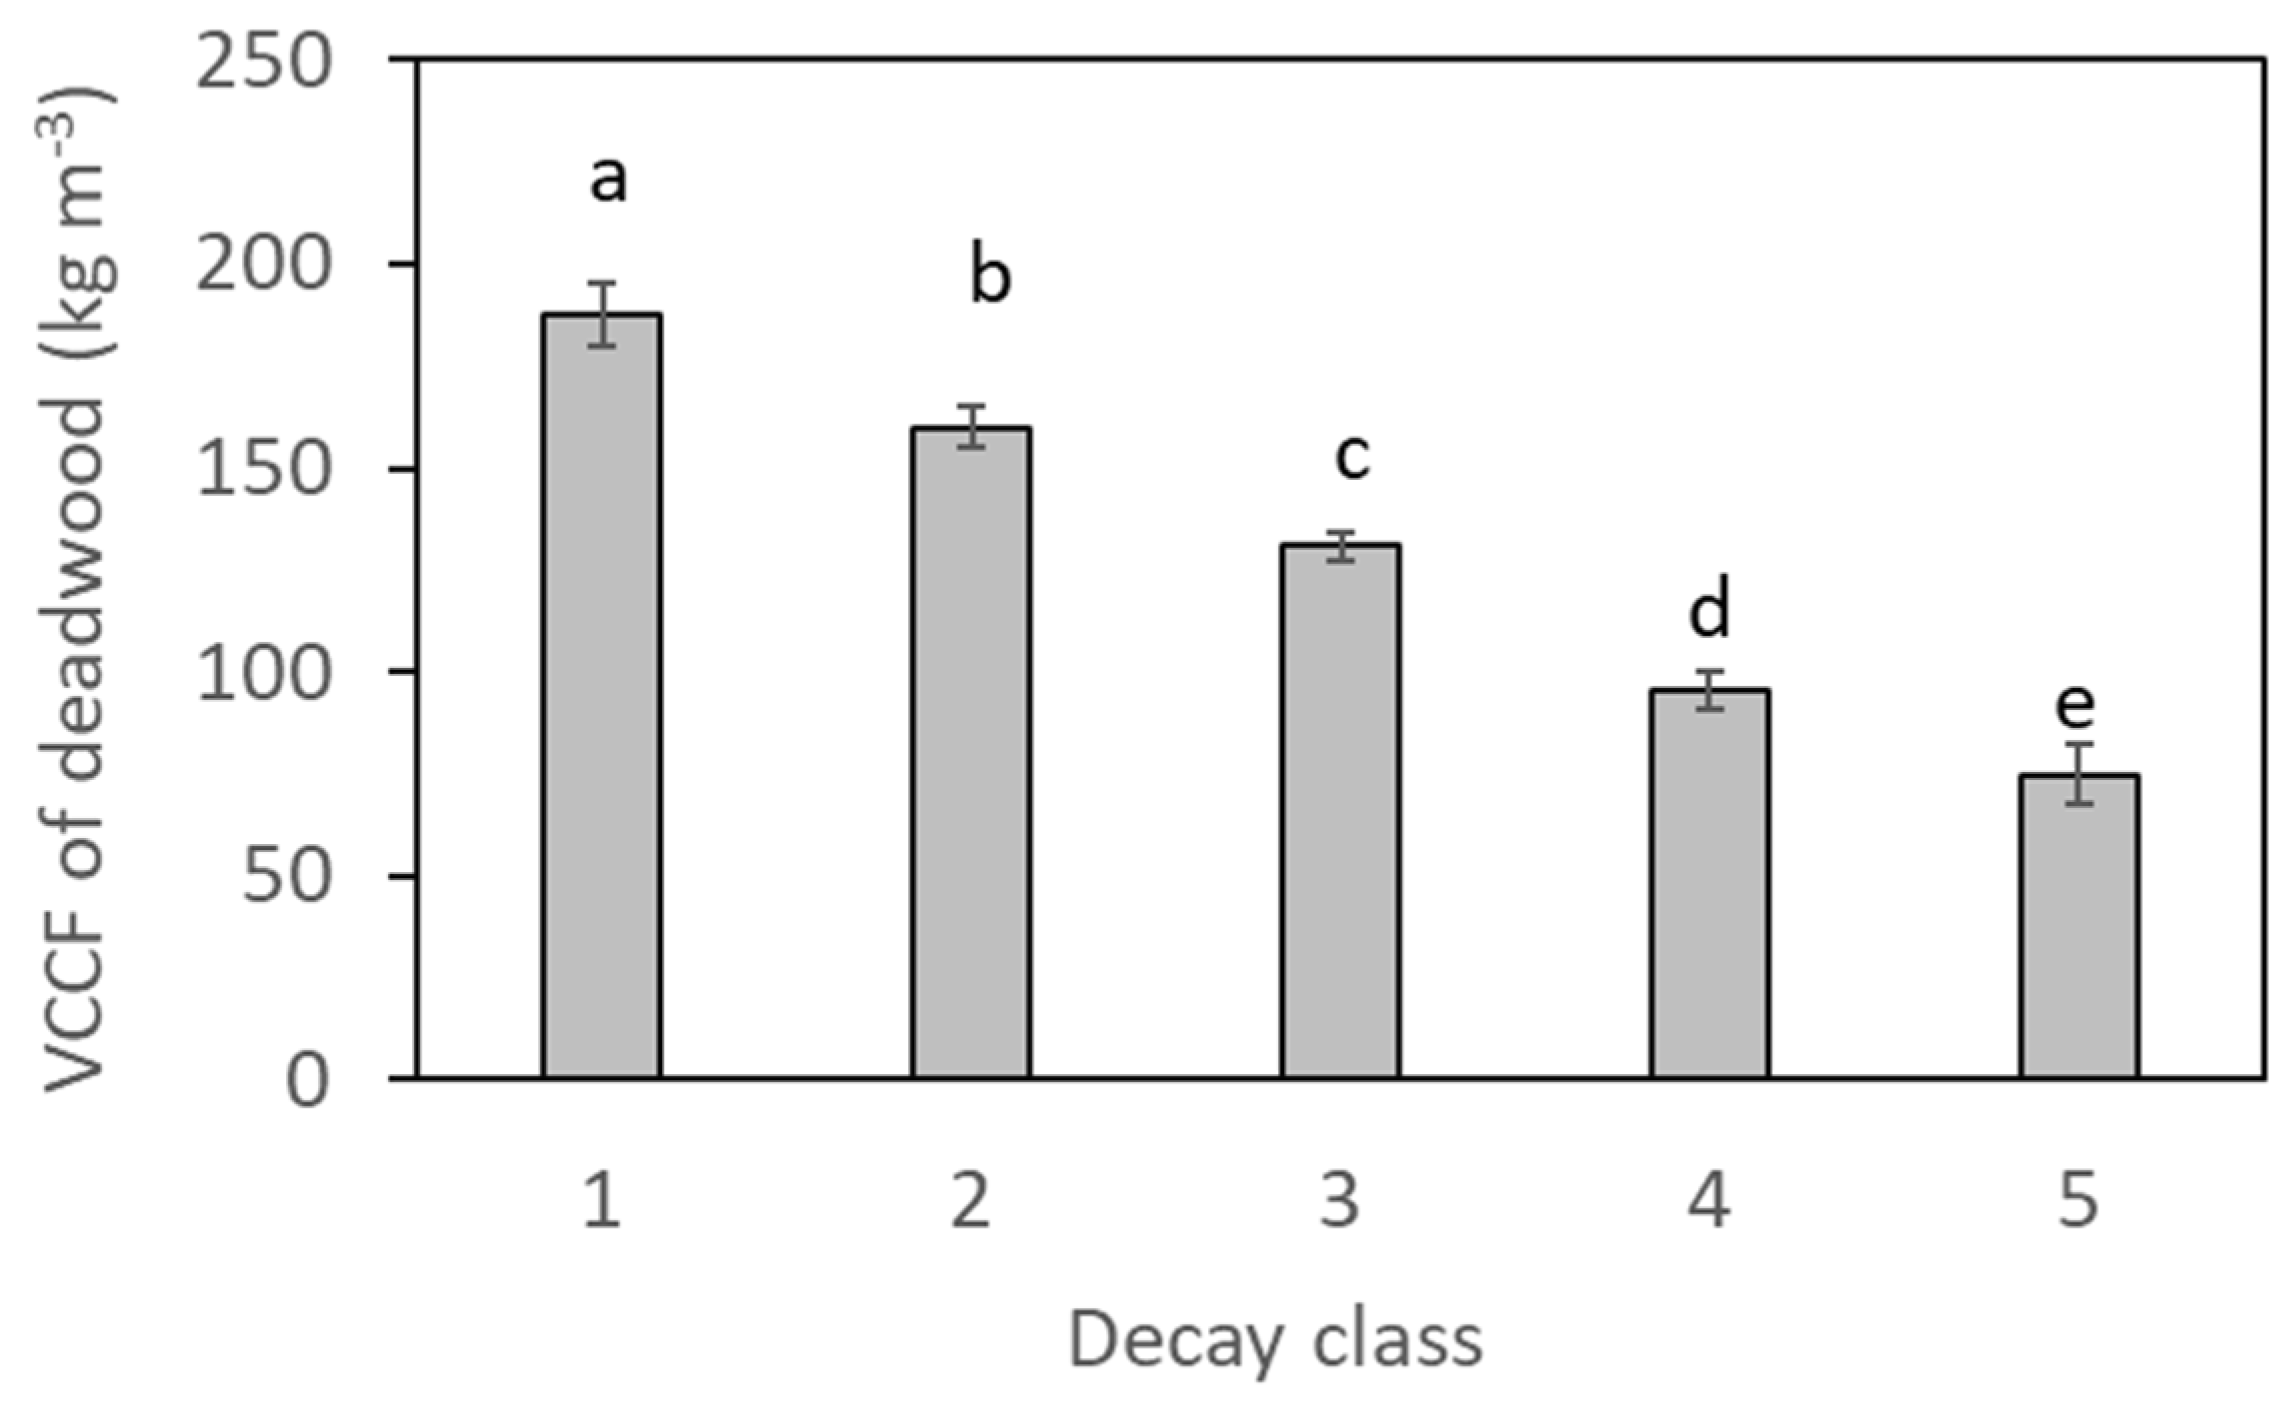
Figure 5.
Moisture in deadwood of Norway spruce, considering fresh (i.e., under field conditions) and fully water-saturated states according to decay classes. Error bars are standard errors; different letters indicate statistically significant differences (one-way ANOVA followed by Fisher's LSD test; p < 0.001).
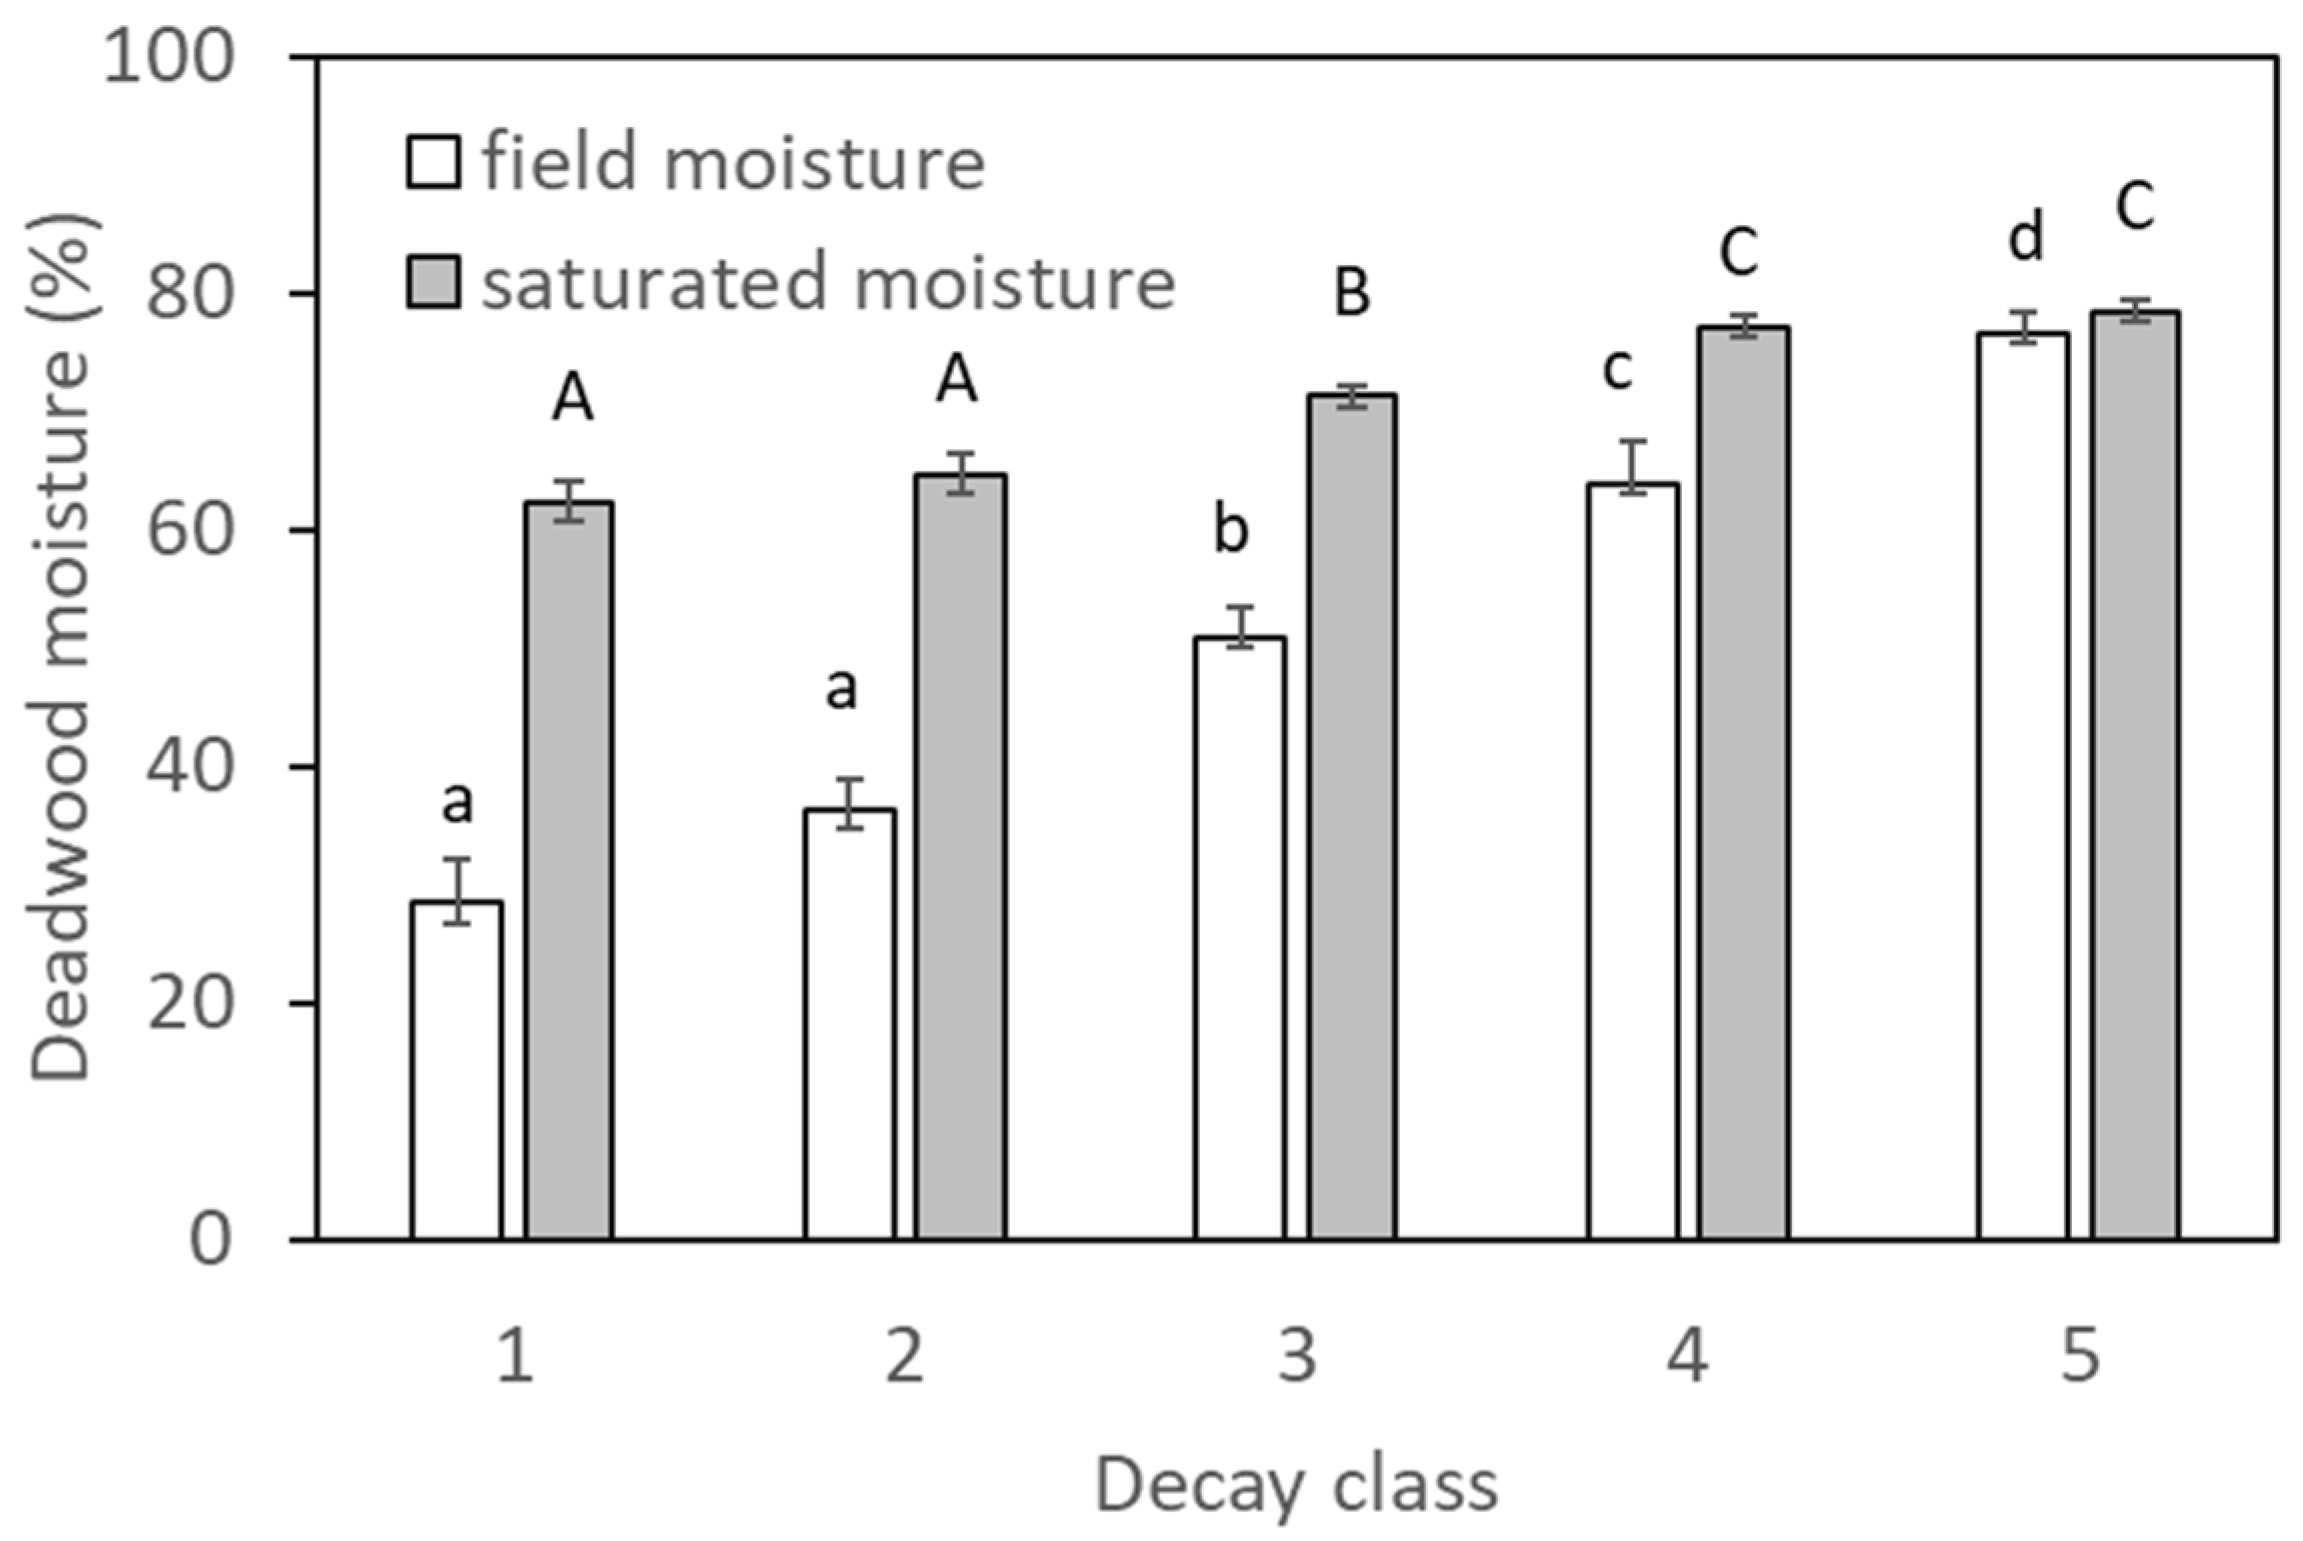
Figure 6.
Monitoring plots in salvaged and unsalvaged sites established for deadwood research in post-disturbance areas of the High Tatra Mountains, Slovakia.
Figure 6.
Monitoring plots in salvaged and unsalvaged sites established for deadwood research in post-disturbance areas of the High Tatra Mountains, Slovakia.
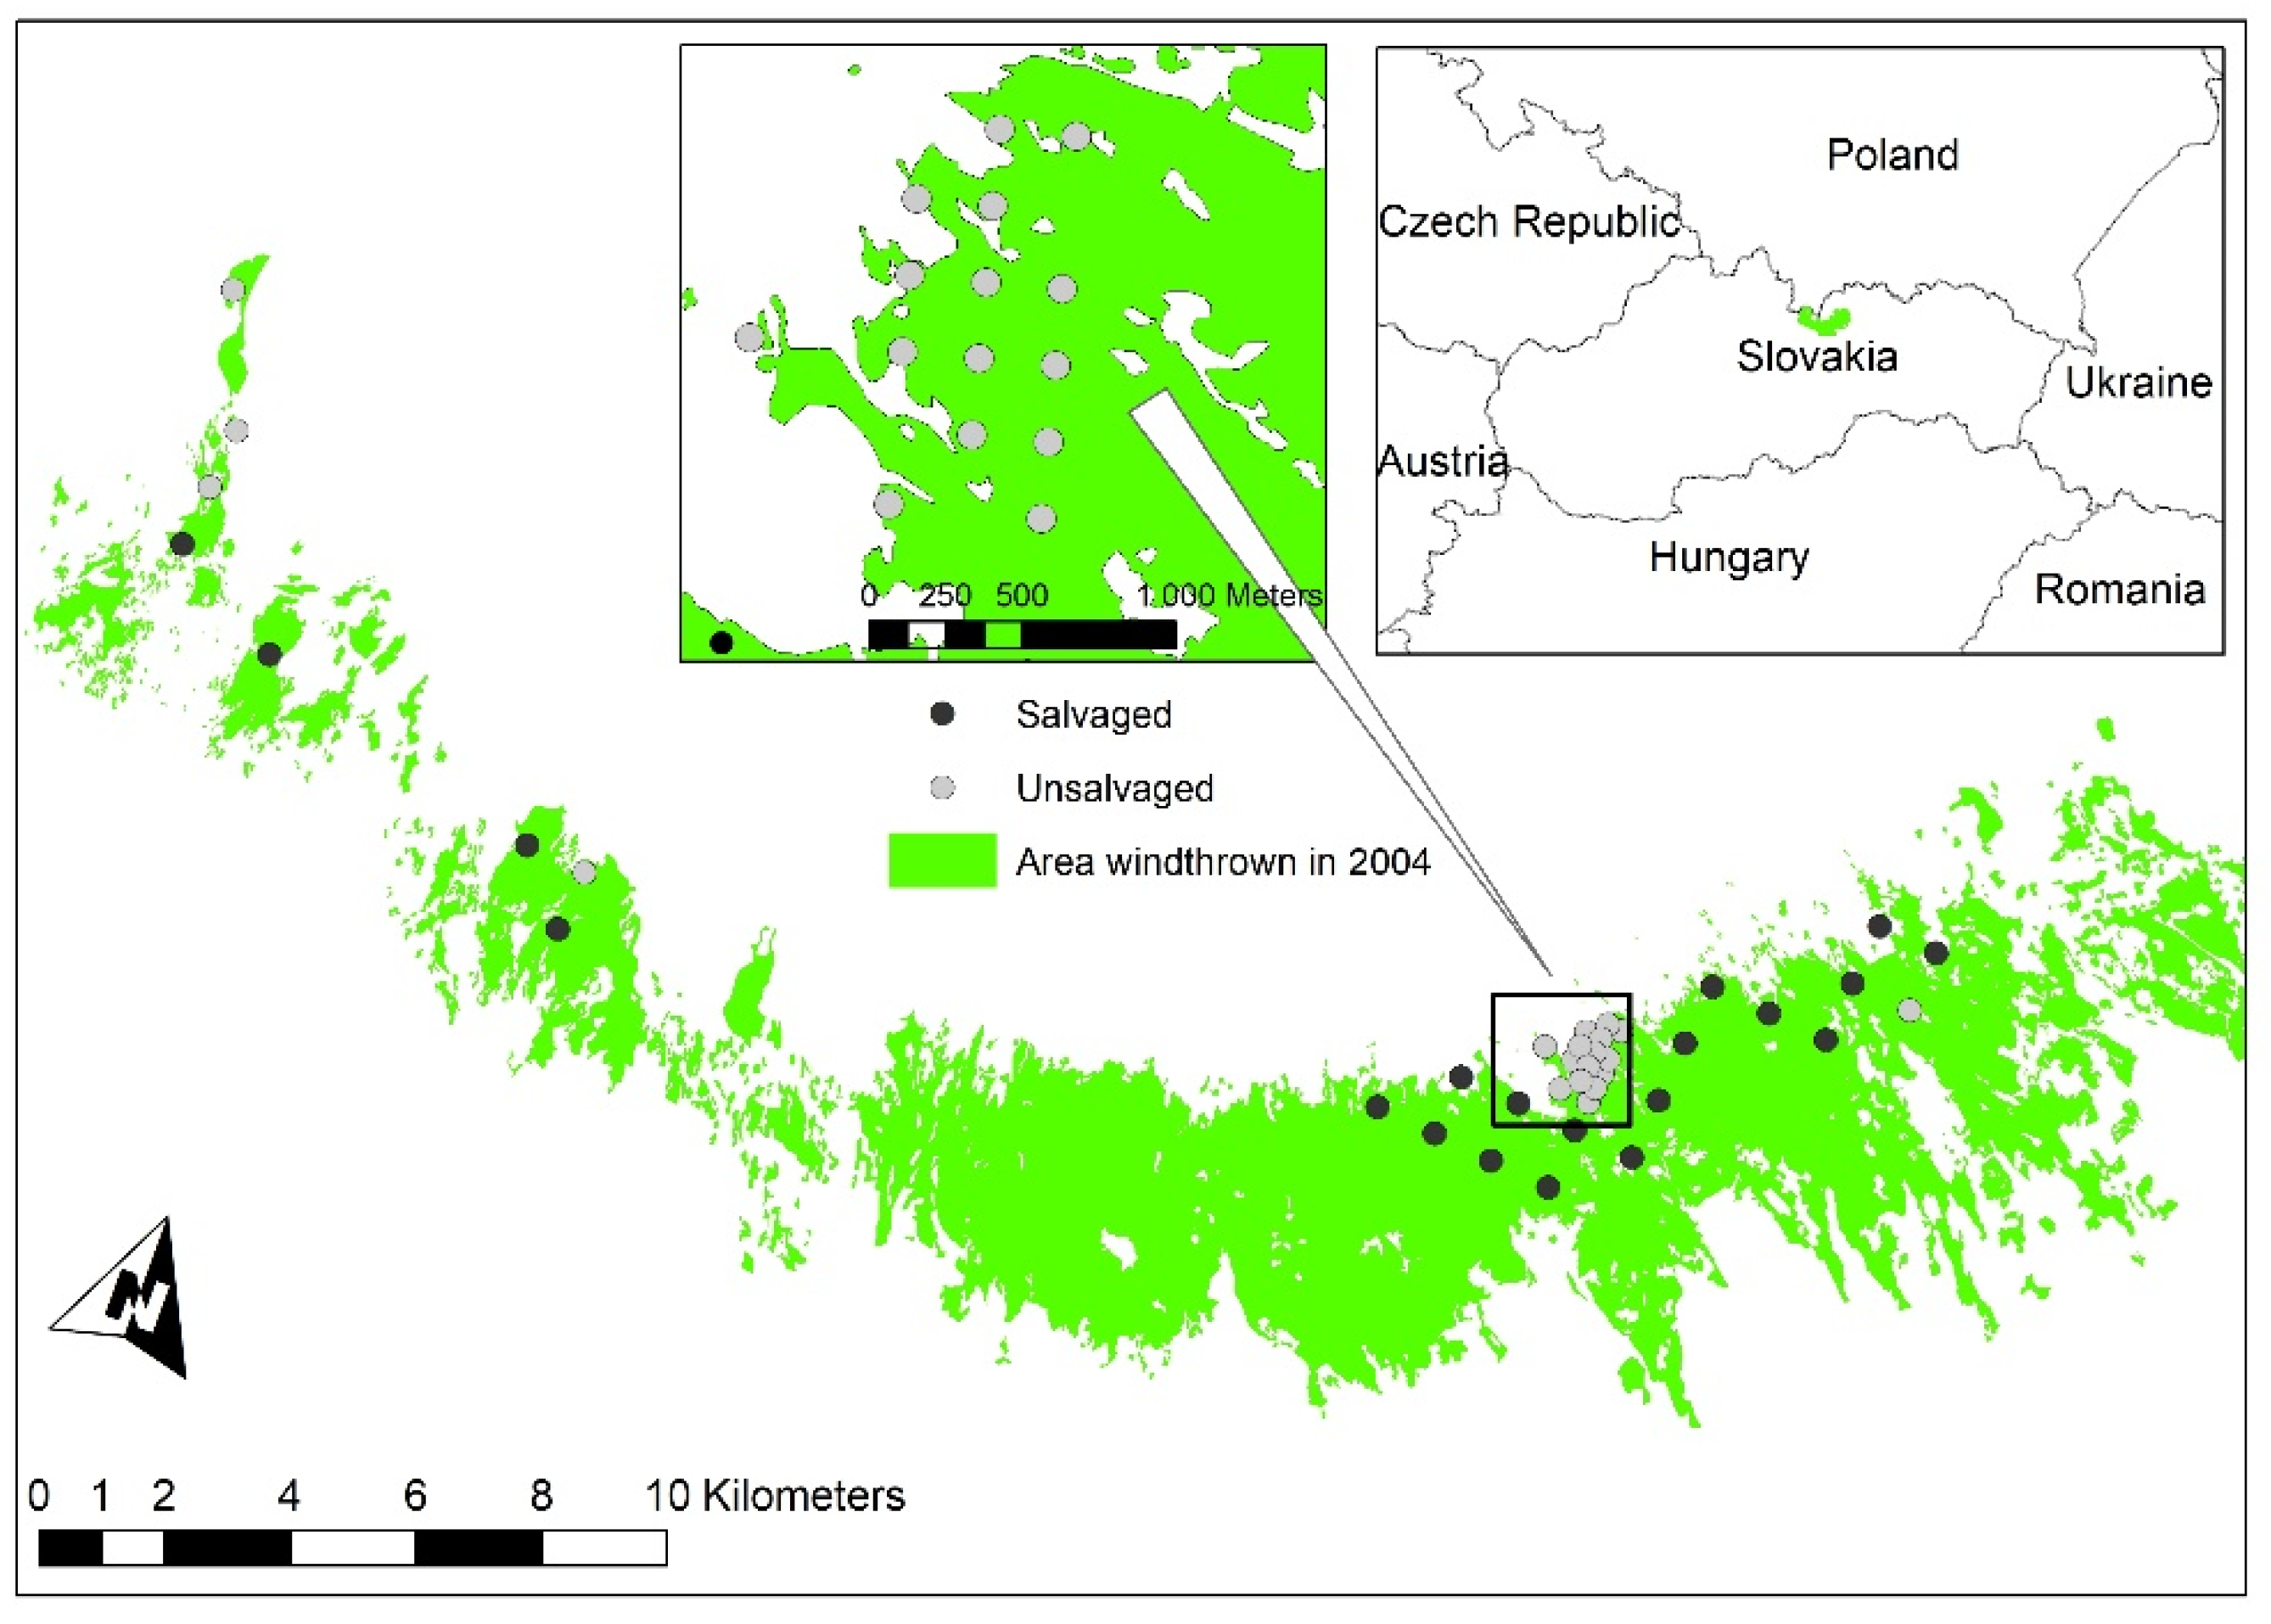
Figure 7.
Scheme of monitoring plots with four satellite plots and an example of downed deadwood in the High Tatra Mountains, Slovakia. Only deadwood within the satellite plots (red lines) was included in our measurements and analyses.
Figure 7.
Scheme of monitoring plots with four satellite plots and an example of downed deadwood in the High Tatra Mountains, Slovakia. Only deadwood within the satellite plots (red lines) was included in our measurements and analyses.
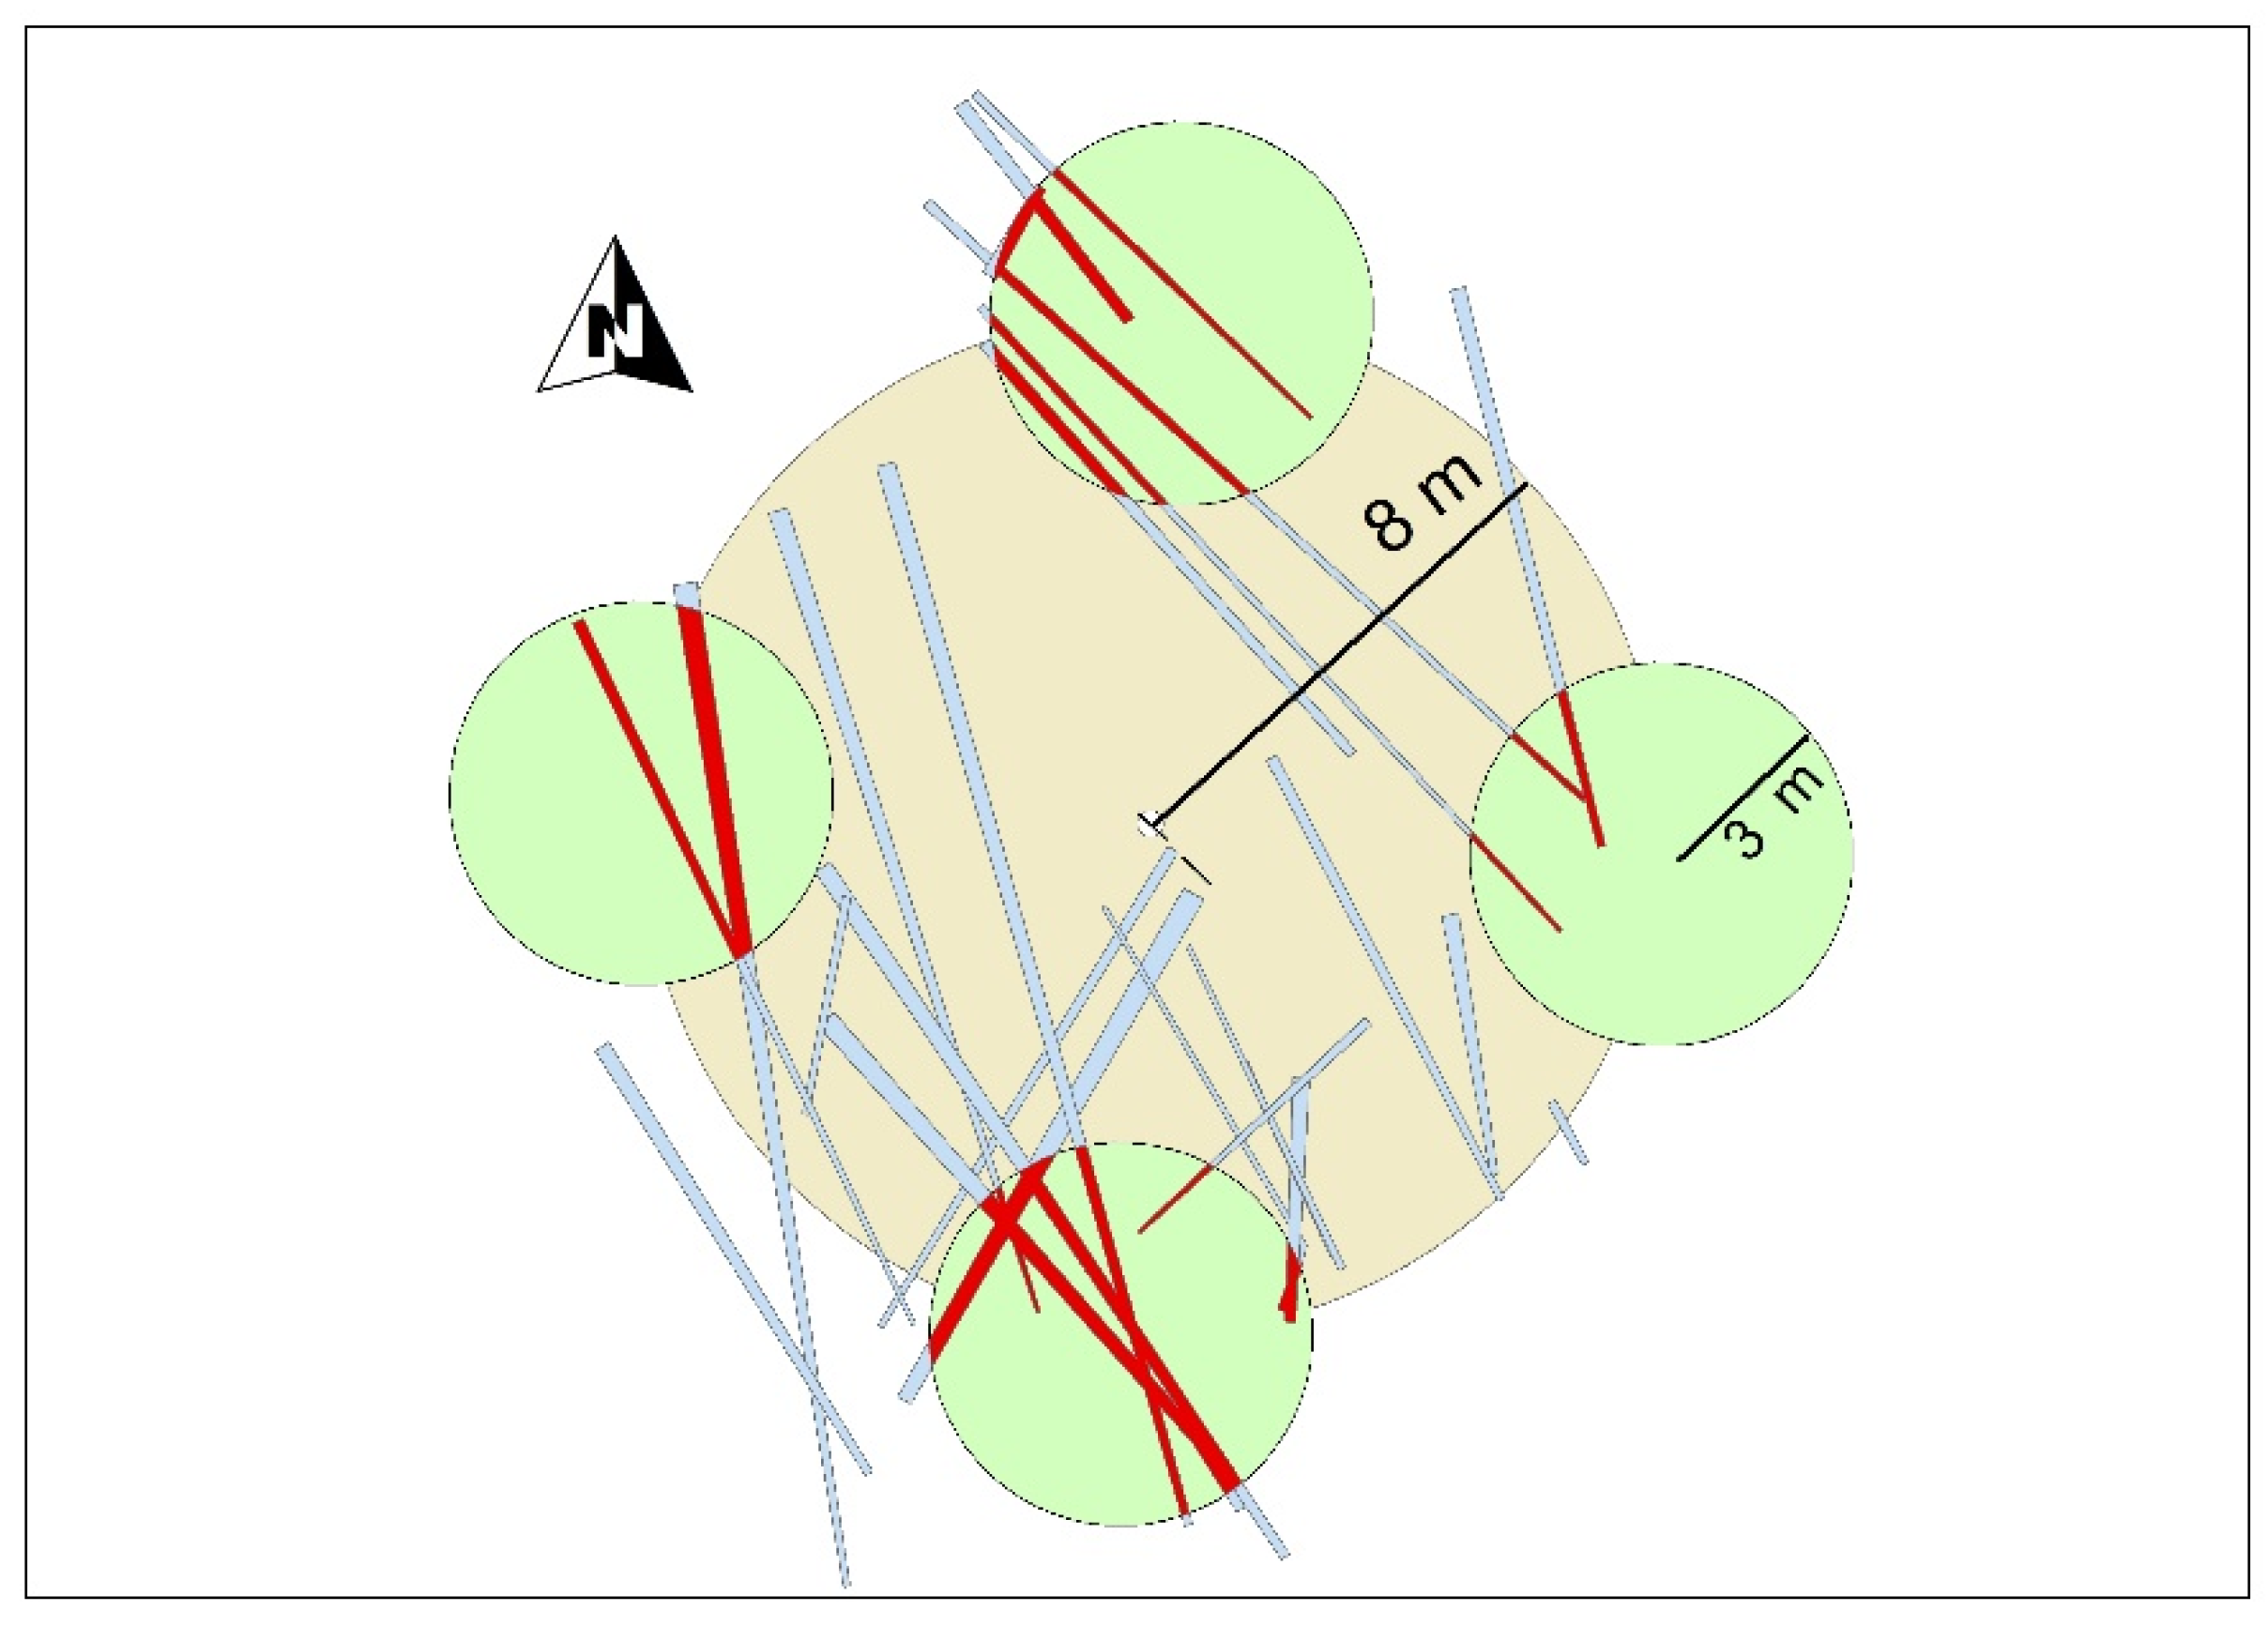
Figure 8.
Procedure for deadwood sampling in downed logs of Norway spruce. We present the sampling devices (a), the process of drilling out a sample (b), an example of a deadwood sample (c), and the packing of a sample, prepared for transport and laboratory analyses (d).
Figure 8.
Procedure for deadwood sampling in downed logs of Norway spruce. We present the sampling devices (a), the process of drilling out a sample (b), an example of a deadwood sample (c), and the packing of a sample, prepared for transport and laboratory analyses (d).
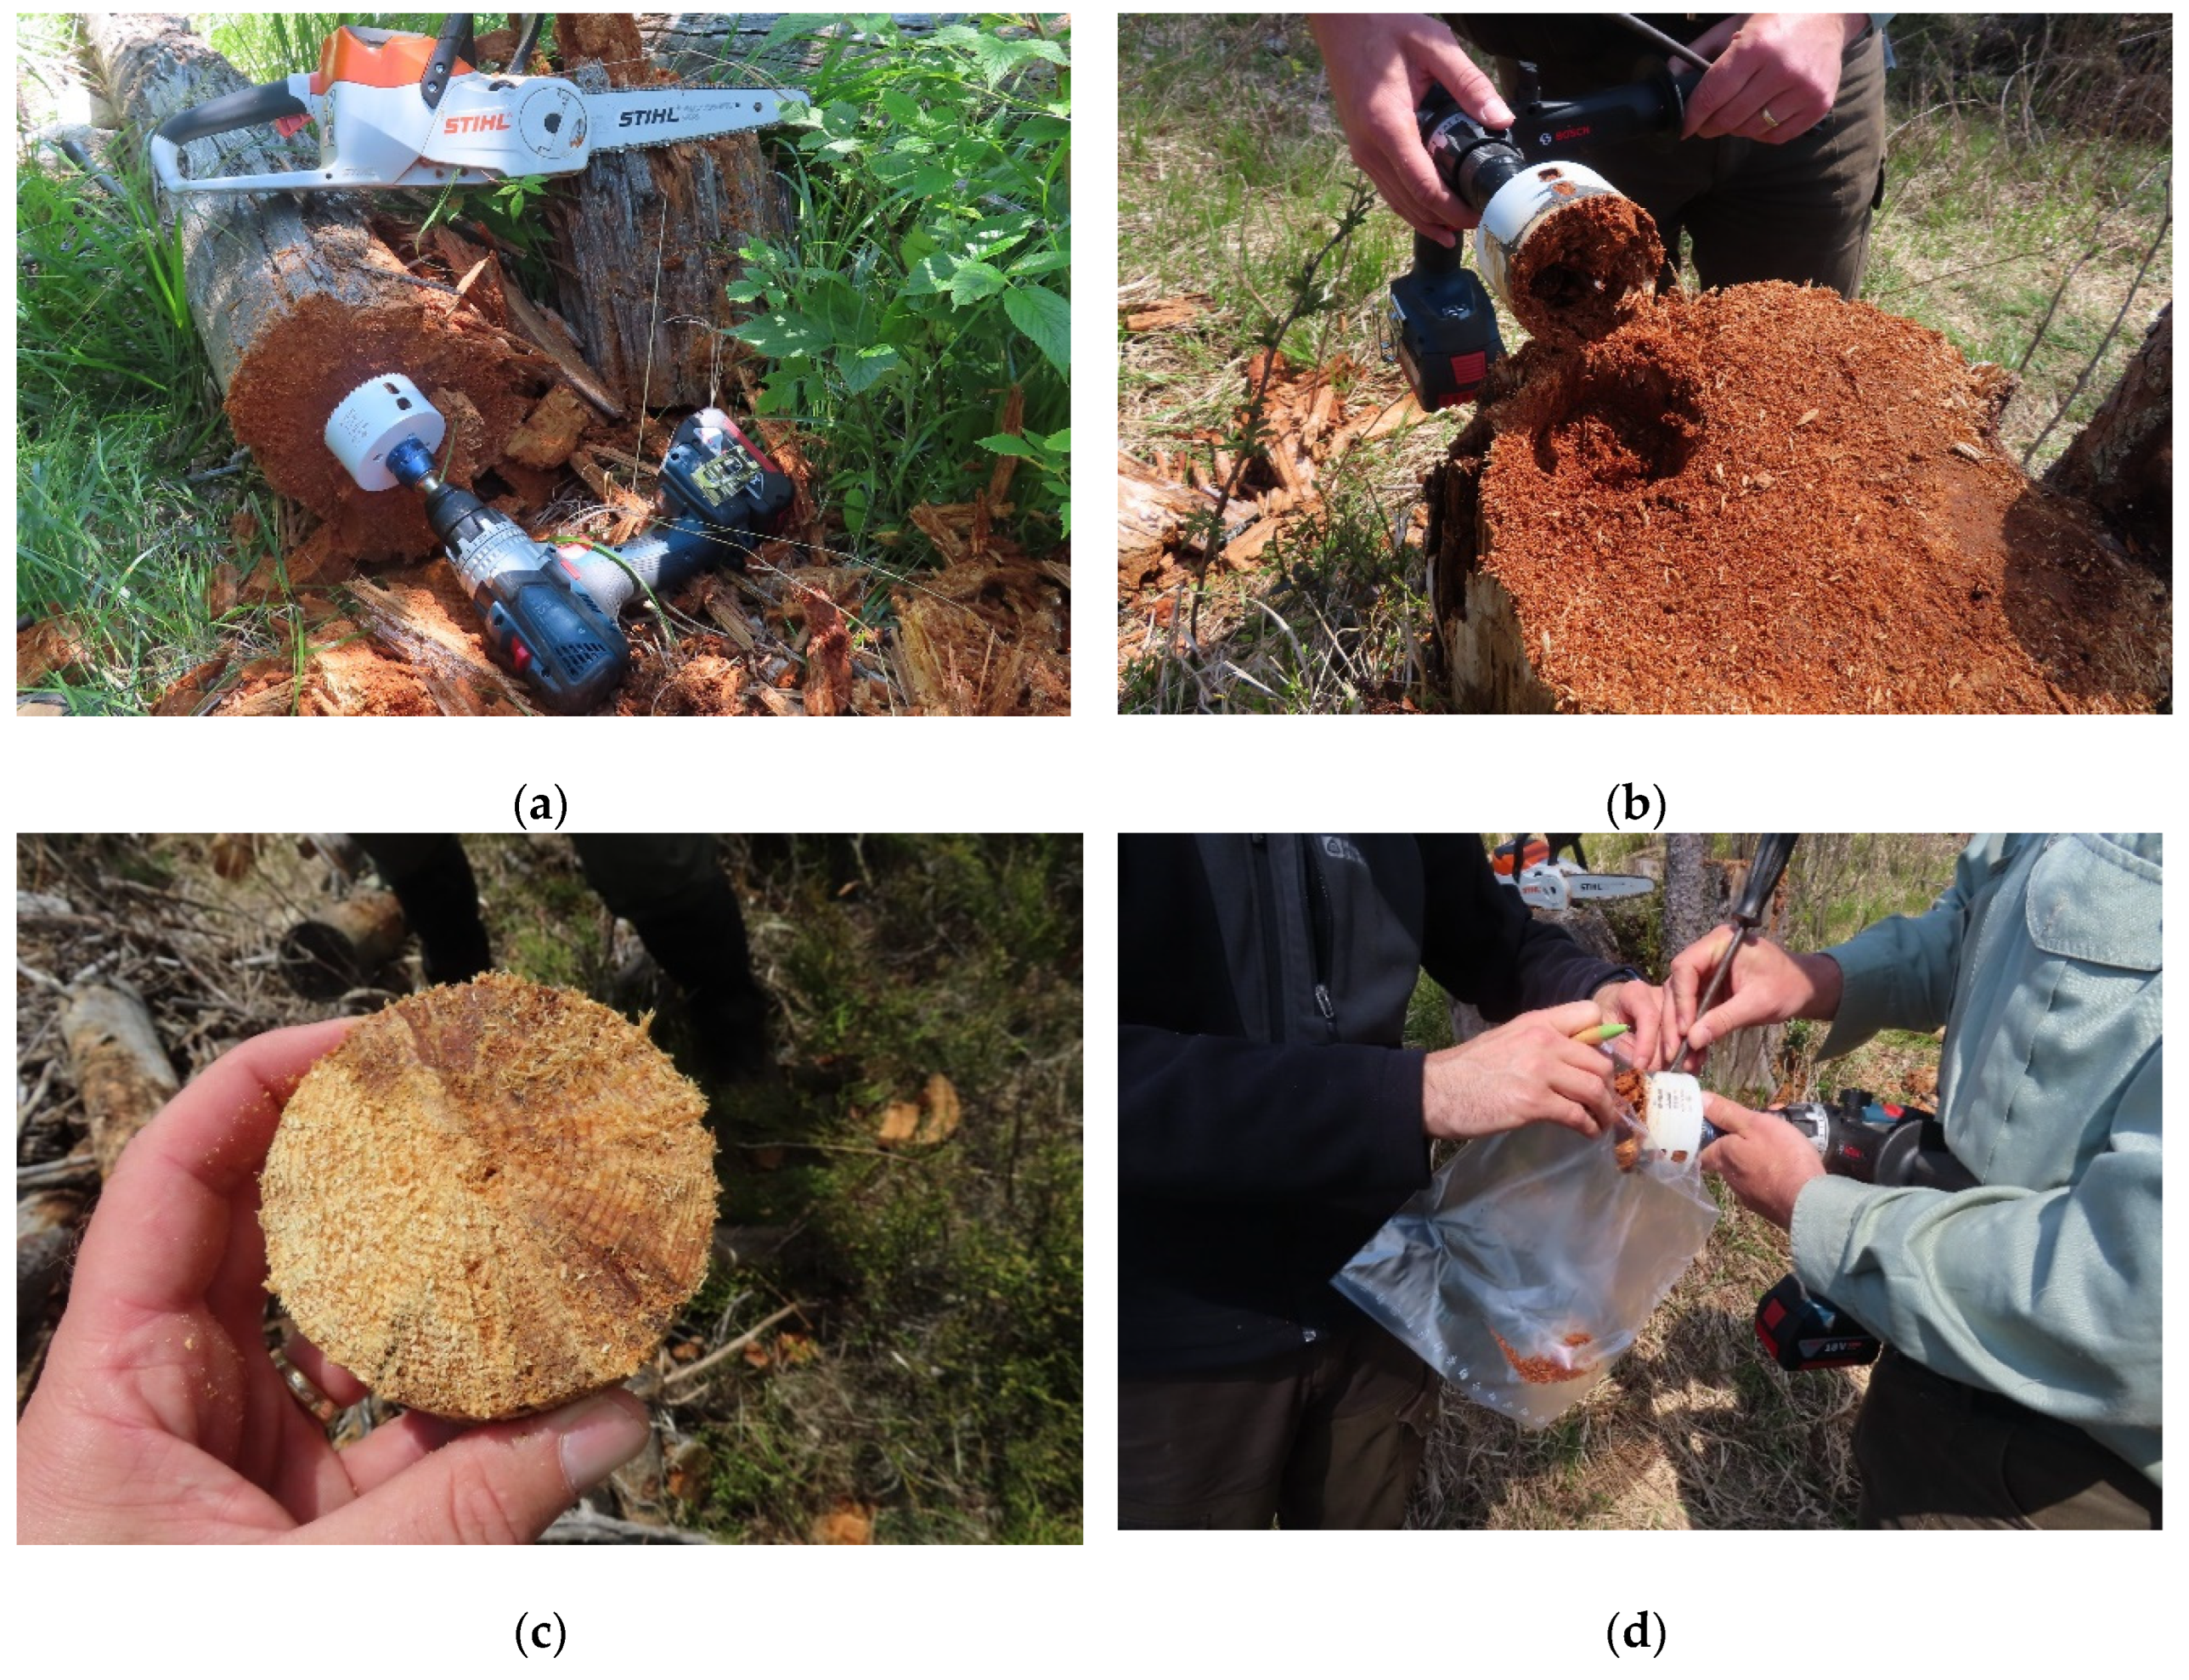

Table 1.
Volume, mass, and ground surface projection (expressed on entire surface of ground) of dead wood in salvaged and unsalvaged sites of the post-disturbance area in the High Tatra Mountains, Slovakia.
Table 1.
Volume, mass, and ground surface projection (expressed on entire surface of ground) of dead wood in salvaged and unsalvaged sites of the post-disturbance area in the High Tatra Mountains, Slovakia.
| Type of plot | Dead wood volume (m3 per are) | Dead wood mass (kg per are) | Dead wood projection (%) | |||
|---|---|---|---|---|---|---|
| Mean value | Standard err. | Mean value | Standard err. | Total | Reduced | |
| Salvaged Unsalvaged |
0.35 | 0.10 | 91.00 | 27.10 | 2.14 | 2.04 |
| 2.94 | 0.97 | 766.58 | 60.18 | 19.37 | 17.78 | |
Table 2.
Amounts of carbon and water (under field conditions and fully saturated) in deadwood from salvaged and unsalvaged sites in the post-disturbance area of the High Tatra Mountains, Slovakia.
Table 2.
Amounts of carbon and water (under field conditions and fully saturated) in deadwood from salvaged and unsalvaged sites in the post-disturbance area of the High Tatra Mountains, Slovakia.
| Type of plot | Carbon amount (kg per are) |
Field water amount (l per are) |
Saturated water amount (l per are) |
|||
|---|---|---|---|---|---|---|
| Mean value | Standard err. | Mean value | Standard err. | Mean value | Standard err. | |
| Salvaged Unsalvaged |
45.45 | 13.55 | 114.41 | 33.89 | 173.98 | 52.98 |
| 383.20 | 30.09 | 859.79 | 65.49 | 1572.99 | 127.21 | |
Table 3.
Results of statistical analyses (three-way ANOVA) related to factors influencing mean decay class in deadwood.
Table 3.
Results of statistical analyses (three-way ANOVA) related to factors influencing mean decay class in deadwood.
| Factors and their combinations | Mean decay class | |
|---|---|---|
| F value | p vaule | |
| PM | 14.94 | < 0.001 |
| DWP | 104.61 | < 0.001 |
| DC | 0.563 | 0.340 |
| PM x DWP | 3.88 | 0.049 |
| PM x DC | 0.35 | 0.554 |
| DWP x DC | 0.27 | 0.604 |
Meaning of the abbreviations: PM – post-disturbance management (salvaged vs unsalvaged sites). DWP - dead wood position (attached vs unattached to soil). DC - diameter class (up to 20 cm vs over 20 cm).
Table 4.
Basic tree and stand characteristics in salvaged and unsalvaged sites within the post-disturbance area of the High Tatra Mountains, Slovakia.
Table 4.
Basic tree and stand characteristics in salvaged and unsalvaged sites within the post-disturbance area of the High Tatra Mountains, Slovakia.
| Type of plot | Number of trees per plot |
Number of species per plot |
Basal area+ (cm2 per are) |
Lorey's height (m) |
|||
|---|---|---|---|---|---|---|---|
| Mean value | Standard error |
Mean value |
Standard error |
Mean value |
Standard error | Mean value | |
| Salvaged Unsalvaged |
77.75n.s. | 13.79 | 5.40* | 0.28 | 1690° | 376 | 4.32• |
| 69.40 | 10.36 | 3.85 | 0.27 | 1121 | 153 | 3.77 | |
1 Explanatory note: +Expressed on diameter at stem base (d0). n.s. not significant; * p<0.001; °p=0.097; • p=0.086.
Table 5.
Basic tree characteristics in salvaged and unsalvaged sites in the post-disturbance area of the High Tatra Mountains, Slovakia.
Table 5.
Basic tree characteristics in salvaged and unsalvaged sites in the post-disturbance area of the High Tatra Mountains, Slovakia.
| Tree species (abbreviation) |
Plot | Number of measured trees | Share to total number (%) | Basal area ( cm2 per are) |
Share to total basal area (%) | Lorey's height(m) |
|---|---|---|---|---|---|---|
| Common rowan (CR) |
salvaged | 253 | 16.3 | 154.7 | 9.2 | 2.55 |
| unsalvaged | 288 | 20.7 | 168.5 | 15.0 | 2.60 | |
| Goat willow (GW) |
salvaged | 155 | 10.0 | 132.6 | 7.8 | 3.27 |
| unsalvaged | 31 | 2.2 | 26.9 | 2.4 | 2.87 | |
| Silver birch (SB) |
salvaged | 310 | 19.9 | 436.1 | 25.8 | 4.25 |
| unsalvaged | 64 | 4.6 | 33.4 | 3.0 | 2.56 | |
| Other broadleaves (OB) |
salvaged | 100 | 6.4 | 61.6 | 3.6 | 2.39 |
| unsalvaged | 7 | 0.5 | 0.3 | 0.0 | 1.00 | |
| European larch (EL) |
salvaged | 117 | 7.5 | 214.4 | 12.7 | 5.19 |
| unsalvaged | 52 | 3.7 | 37.8 | 3.4 | 3.43 | |
| Norway spruce (NS) |
salvaged | 522 | 33.6 | 575.8 | 34.1 | 4.27 |
| unsalvaged | 928 | 66.9 | 847.2 | 75.6 | 4.07 | |
| Other coniferous (OC) |
salvaged | 98 | 6.3 | 114.5 | 6.8 | 2.59 |
| unsalvaged | 18 | 1.3 | 6.7 | 0.6 | 1.73 |
Disclaimer/Publisher’s Note: The statements, opinions and data contained in all publications are solely those of the individual author(s) and contributor(s) and not of MDPI and/or the editor(s). MDPI and/or the editor(s) disclaim responsibility for any injury to people or property resulting from any ideas, methods, instructions or products referred to in the content. |
© 2024 by the authors. Licensee MDPI, Basel, Switzerland. This article is an open access article distributed under the terms and conditions of the Creative Commons Attribution (CC BY) license (http://creativecommons.org/licenses/by/4.0/).
Copyright: This open access article is published under a Creative Commons CC BY 4.0 license, which permit the free download, distribution, and reuse, provided that the author and preprint are cited in any reuse.


