Submitted:
12 September 2024
Posted:
13 September 2024
You are already at the latest version
Abstract
Global demand for food shows an increasing trend, which implies that volumes of food waste also increase. These wastes contain bioactive compounds that are not properly utilized or valorized. It was reported that ginger waste contains phenolic compounds with high antioxidant activity. Thus, this study aimed to evaluate the effect of temperature, time, and particle size on the total phenolic content (TPC) and antioxidant activity (AA) of ginger (Zingiber officinale R.) waste aqueous extract using the Pressurized Liquid Extraction (PLE) method with water as the sole solvent. Box-Behnken design was used. The sample was 1.60 kg of dried ginger peel powder. Data analysis was performed with Minitab ® 19.1 (64-bit). TPC ranged from 10.42 to 14.1 mg GAE/g, and AA (DPPH method) ranged from 72.9 to 111.9 μmol TE/g. The model explained 81.07% of AA’s total variability. Positive correlation was found between TPC and AA (Pearson's ρ = 0.58, p < 0.05). Response optimization values were 126 °C and 38 min. Temperature was a significant factor (p < 0.05) influencing AA, while time and particle size were not significant. Higher temperatures, longer extraction times and smaller particle sizes increase TPC and AA of the ginger waste aqueous extract.
Keywords:
antioxidant activity
; aqueous extract
; ginger
; phenolic compounds
; pressurized liquid extraction
1. Introduction
Global food industry generates approximately 1.6 billion tons of food waste annually, creating significant economic, environmental, and social impacts [1,2]. Despite the food system's success in increasing per-capita food supply by over 30% since 1961, this growth has led to substantial waste and by-products, posing ethical, social, economic, and environmental challenges. Addressing food waste is crucial, as it can be repurposed as natural sources of bioactive compounds, organic fertilizers, animal feed, biopesticides or bioplastics [3]. Therefore, due to the significant global impact of the increasing demand for food, a larger volume of food waste is generated; however, these wastes are not properly utilized.
Ginger (Zingiber officinale Roscoe), a member of the Zingiberaceae family, has many biologically active compounds with antioxidant properties. Gingerols, shogaols, and zingerone were found in ginger waste [4]. In 2016, global ginger production reached 3.3 million tons, resulting in a substantial volume of ginger waste generated by industry [5]. Ginger waste is typically either burned, discarded in landfills, or processed into ginger waste meal, which serves as a low-quality feed for animals [4].
Ginger is renowned for its bioactive compounds, including phenolic compounds, which exhibit potent antioxidant activity [6]. Antioxidants present in ginger waste can help shield the body from oxidative stress and reduce the risk of chronic diseases such as cancer, diabetes, and heart conditions. Notably, ginger peels demonstrate higher antioxidant activity compared to the root, leaf, and stem of the ginger plant [4]. Oxidative stress, primarily caused by reactive oxygen species (ROS), can damage nucleic acids, proteins, and lipids, leading to diseases such as cancer and aging [7]. Phenolic compounds play a crucial role in plant defense and human health owing to their antioxidant properties [8,9]. They help prevent lipid and protein oxidation and protect against microbial activity, thereby extending the shelf life of food and beverages [2,10]. Given the increasing preference for natural antioxidants over synthetic ones due to carcinogenic concerns [11], exploring effective extraction methods for these bioactive compounds is of great interest. Polyphenols are traditionally extracted using solvents like water, methanol, ethanol, or their mixtures [8,9].
A particular extraction method from PLE is Subcritical Water Extraction (SWE) method. SWE emerges as an extraction method that employs liquid water under temperature between 100°C and 374°C and high-pressure conditions, enhancing mass transfer rates, absorption into the particle-matrix, and selectivity [12]. Under these conditions, water’s properties shift, resembling non-polar solvents like acetone, ethanol, or DMSO, significantly reducing its dielectric constant and increasing its diffusivity [6]. This distinct property of subcritical water enables it to be used as the sole extraction fluid, eliminating the need for any co-solvents like acids, alkalis, catalysts, or organic solvents [8]. These changes promote faster and higher-yield extractions [13]. SWE has been widely recognized for its effectiveness in extracting various bioactive compounds from plant-based raw materials [14]. SWE's advantages include short extraction times, minimal downstream processing, solvent recyclability, non-requirement of catalysts, and preservation of functional groups [15]. Thus, SWE offers high selectivity, high extraction efficiency, low economic costs, sustainability and a reduced environmental footprint compared to traditional extraction methods [16,17,18,19]. Furthermore, response surface methodology (RSM) can optimize the extraction process, reducing the number of experiments, solvent usage, and saving time, while also revealing the relationships between experimental factors and responses [20].
Thus, the study aimed to evaluate the effect of temperature, time, and particle size on the antioxidant activity of ginger (Zingiber officinale R.) waste extract trough PLE method. This research seeks to address the growing demand for natural antioxidants, leveraging green extraction techniques to minimize environmental impact and maximize the yield and efficiency of antioxidants compound extraction from ginger.
2. Materials and Methods
2.1. Materials
The equipment utilized throughout the procedural and analytical stages of the research included: multisolvent extractor (Top Industrie, series 2802.0000, France), sonicator (VWR International, SymphonyTM, 97043-942, China), spectrophotometer (Perkin Elmer®, LAMBDA 950, USA), analytical balance (Ohaus®, Discovery DV 214C, Switzerland; RADWAG, model PS 6000.R2, Poland), water bath (Thermo Scientific™, AquaBath™, USA), muffle furnace (Thermolync, Type 1300 Furnace, USA), convection oven (POL-EKO, SLW 115, Poland), water purifier (Barnstead, model D 11911, Germany), tube shaker (Thermolyne, model 16700 Maxi-Mix I, USA), magnetic stirrer (IKA, C-MAG HS 7, Brazil), and electric sieve (RICELI, motor ½ HP, Peru).
Raw materials and supplies included powdered ginger peels processed from fresh ginger purchased in a local supermarket located in 02804 Chimbote, Peru. Reagents used were chromatographic grade methanol (J.T. Baker, USA), gallic acid monohydrate ≥ 98.5% ACS (Sigma-Aldrich, China), 2,2-diphenyl-1-picrylhydrazyl (DPPH) 95% (Alfa Aesar, Germany), 6-hydroxy-2,5,7,8-tetramethylchroman-2-carboxylic acid (Trolox) 97% (Sigma-Aldrich, China), sodium carbonate, Folin-Ciocalteu reagent, and ultrapure water.
Laboratory materials included magnetic bars, 10 and 20 mL graduated cylinders, 125 and 250 mL volumetric flasks, crucibles, 10 and 50 mL volumetric pipettes, Petri dishes, micropipettes (100 μL, 250 μL, 500 μL, 1,000 μL, and 5,000 μL), mortars, Whatman No. 40 filter paper (90 mm), pipettes, 250 and 500 mL graduated cylinders, 500 mL precipitation tubes, test tubes, vials, and flasks.
Common-use materials comprised 4% sodium hypochlorite (bleach), kitchen knives, potato peelers, latex gloves, aluminum foil, paper towels, harvest crates, buckets, volumetric pitchers, zip-lock bags, food cooler boxes, porcelain supports, metal spatulas, 250 mL glass containers, steel knives, coolers, gel packs, and permanent markers.
Raw material (ginger) processing to obtain the sample (ginger peel powder), was conducted at the Laboratory of Microbiology and Toxicology of the Universidad Nacional del Santa located in 02712 Nuevo Chimbote, Ancash. Experiments for obtaining the aqueous extract and performing chemical analyses, took place at Laboratory of Bioactive Compounds and Chemistry Laboratory of the Instituto Tecnologico de la Produccion (ITP), 07046 Ventanilla, Callao.
2.2. Sample
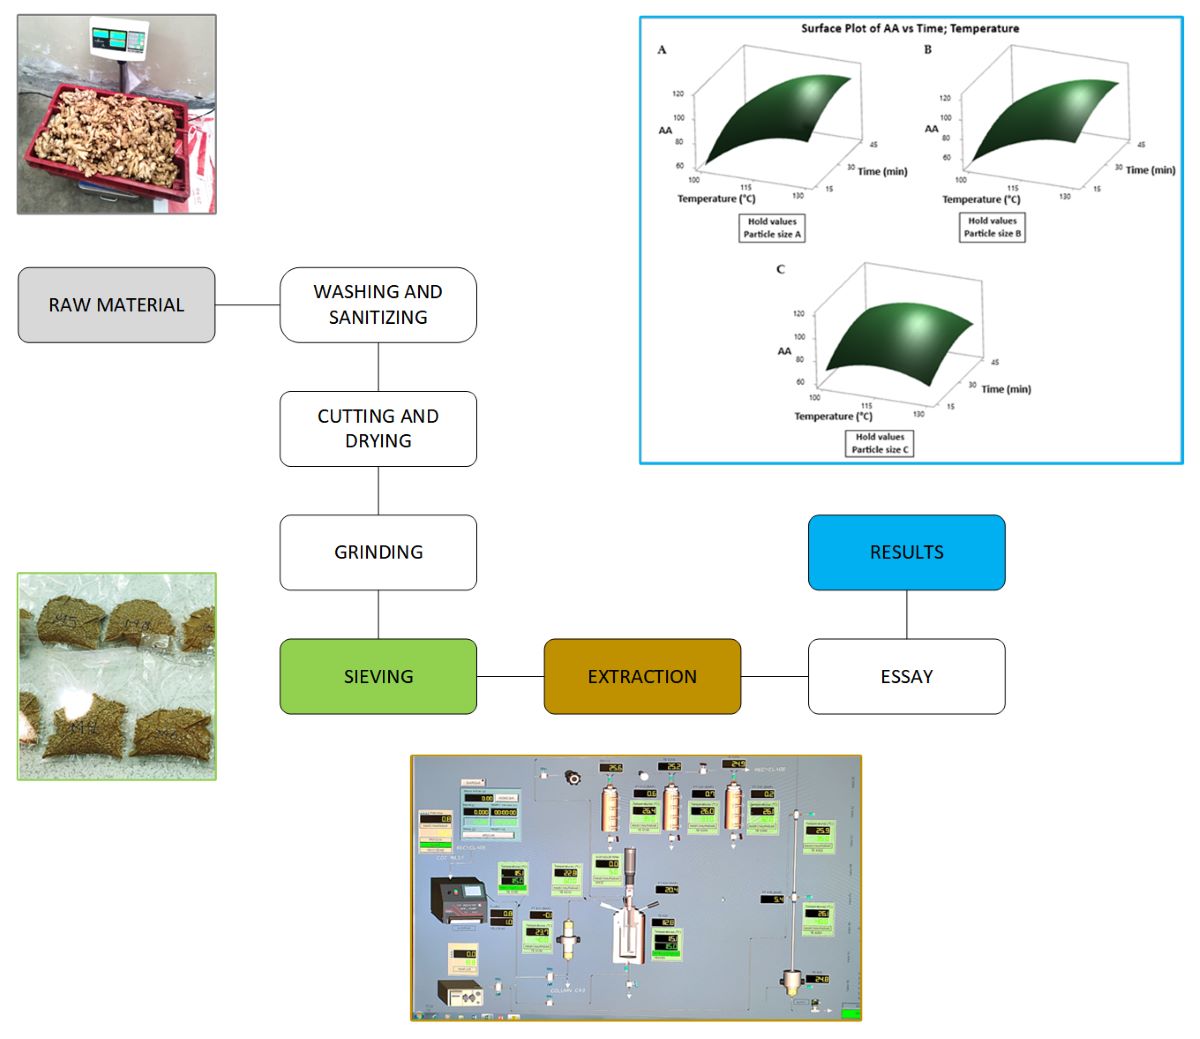
The sample was 1.60 kg ginger peels powder obtained from 60.00 kg fresh ginger. The sample obtaining process included washing raw material, sanitizing, cutting, drying, grinding and sieving (see Figure 1).
2.3. Pressurized Liquid Extraction (PLE)
This procedure was performed using the high-pressure and high-temperature liquid water extraction technique with a 1.70 L capacity multi-solvent extractor (Top Industrie series 2802.0000, France), according to the method reported by Barriga-Sánchez & Rosales-Hartshorn [21].
2.3.1. Step 1: Loading the Extraction Cell in the Extractor
The extraction cell is a detachable hollow piece in which the sample (solute) is placed and the solvent is added. The cell was loaded with glass microspheres and the sample. Approximately 40 g of the sample was added in four layers, along with five alternating layers of 5 mm glass microspheres (approximately 525 g). Then, the extraction cell was placed in the equipment and filled with sonicated water up to the level indicated by the manufacturer (approximately 1,080 mL).
2.3.2. Step 2: Establishing Operating Conditions
The control software of the equipment allowed the establishment of temperature (°C), pressure (20 bar, constant in all runs), and solvent flow rate (mL/min). The solvent was distilled water, sonicated for 30 min at 25°C in a sonicator (VWR International, SymphonyTM, 97043-942, China). The general procedure consisted of programming the preheater (coil type) and reactor temperature according to the conditions of each run of the experimental design. Then, the co-solvent pump of the equipment was used to introduce the solvent into the cell (18 mL/min) until the operating conditions were reached.
2.3.3. Step 3: Operation and Control
From the equipment's software, once the operating parameters were configured, the equipment was allowed to reach appropriate temperature and pressure conditions, verifying this information from the sensors and the software graphs. Time was manually controlled.
2.3.4. Step 4: Extract Discharge
Upon completion of the extraction time (for each of the experimental runs), the extract was discharged and cooled in an ice bath for 10 min. Each extract was stored at 4 ± 1 °C until further analysis.
2.4. Total Phenolic Content (TPC) Assay
TPC were determined using a modified Singleton et al. (1999) method.
2.5. Antioxidant Activity (AA) Assay
2.6. Experimental Design
A Box-Behnken 33 design with four center points and 16 runs was created using Minitab® 19.1 (64-bit). The design included three independent variables (factors): temperature (100–130 °C), extraction time (15–45 min), and particle size (A, B and C, according to sieves ASTM #35, #20 and #10, respectively). Response variables were TPC (mg GAE/g sample) and AA (μmol TE/g sample) from aqueous extracts of ginger peels powder.
2.7. Data Analysis
Analysis of variance (ANOVA) was used to evaluate the effect of factors on the response variables. Then standardized effects, response surface diagrams, and correlating response variables with Pearson's product-moment test were performed. Minitab ® 19.1 (64-bit) software was used for analysis.
3. Results
3.1. Extraction, TPC and AA Essay Results
Average volume of extracts obtained from experimental procedures were 867.0 ± 18.6 mL. Table 1 shows extract volume according to each sample out of 16.
3.2. TPC and AA Responses ANOVA
Values of R2 and adjusted R2 for TPC were 92.15% and 79.58%, respectively. Values of R2 and adjusted R2 for AA were 81.07% and 50.78%, respectively. ANOVA showed that the variation in the temperature had a significant effect (α = 0.05) on the TPC and AA values (see Table 2).
3.3. TPC and AA Responses Graphical Analysis
Figure 2 shows a Pareto chart used to determine the magnitude and importance of the effects in the model. In the displayed charts, the bars that cross the reference line (2.57) are statistically significant. Therefore, temperature is significant with the current model terms for TPC and AA.
Figure 3 shows the main factors effects on TPC and AA. For TPC, temperature and time levels have a greater magnitude effect than particle size. Moreover, higher levels of temperature and time and small particle size produced higher AA values. For AA, temperature and time levels have a greater magnitude of effect than particle size. Intermediate levels of temperature and time are those that maximize antioxidant activity values, while the smallest particle size produced higher antioxidant activity values.
Figure 4 shows the interaction plot for TPC. There was no interaction between factors.
Figure 5 shows the interaction plot for AA. The interaction among the evaluated factors indicates the relationship between particle size and AA depends on temperature. Higher values of temperature and particle size produce lower AA values.
Figure 6 shows 3D surface plots for TPC response at different particle sizes (A, B, and C), where A represents the smallest particle size and C the largest. Particle size A yielded the highest TPC, followed by size B, and lastly size C. Furthermore, increasing the levels of temperature and time enhances the response, regardless of the selected particle size.
Figure 7 shows 3D surface plots for AA response at different particle sizes (A, B, and C), with A being the smallest particle size and C the largest. Particle size A yielded the highest antioxidant activity, followed by size B, and lastly size C. All plots depict a response surface with a single maximum.
3.4. TPC and AA Correlation
A positive and significant correlation between TPC and AA responses were found (see Table 3).
3.5. Response Optimization
Optimized values for temperature and time factors were 126.36 °C and 37.73 min. Adjusted values show that the model predicts a TPC value of 112.44 and AA value of 14.20. However, the standard error of the fit is higher for TPC compared to AA, indicating that the TPC predictions are less precise. The confidence and prediction intervals for TPC are also wider than those for AA, suggesting greater variability and uncertainty in the TPC estimates. This is further reflected in the broad prediction interval for TPC, which indicates a significant range in potential future observations (see Table 4).
4. Discussion
Regarding the experimental factors, previous studies indicate the importance of temperature in the extraction of phenolic compounds and antioxidant activity in plant extracts, as it affects both the solubility of the compounds and the diffusion rate of solutes in the solvent [6,24,25]. Additionally, Siti Nur Khairunisa et al. [26] emphasize that maintaining adequate pressure is essential to ensure that water remains in a liquid state during extraction. Concerning extraction time, Nourbakhsh Amiri et al. [24] suggest that excessive prolongation can reduce the release of bioactive compounds due to their instability at high temperatures. Regarding particle size, a smaller size increases solute/solvent contact and extraction efficiency, although a size too small can cause channeling effects that reduce mass transfer [24,27].
Regarding the valorization of the sample used, ginger peels exhibit antioxidant properties that could surpass those of conventional synthetic antioxidants [28]. Mao et al. [29] pointed out that the health benefits of ginger are primarily due to the presence of phenolic compounds. Moreover, numerous authors have conducted experiments with ginger (Zingiber officinale Roscoe) [30,31,32,33,34], as well as other ginger species such as Zingiber zerumbet [26,35,36], Zingiber montanum [37], Zingiber officinale rubrum, and Zingiber officinale amarum [32]. Other raw materials used include avocado (Persea americana) [38], cherimoya leaves (Annona cherimola Mill) [27] and grape seeds (Vitis vinifera) [21].
Regarding the results obtained with other ginger varieties, Mahmudati et al. [32] achieved maximum TPC values through the decoction method (22.97 mg GAE/g) in red ginger (rubrum), but maximum antioxidant activity through infusion method (79.83% inhibition). Additionally, various authors have experimented with other raw materials. Barriga-Sánchez and Rosales-Hartshorn [21] analyzed extracts from cherimoya leaves (Annona cherimola Mill), obtaining maximum TPC values of 5.6 g GAE/100 g dry leaf through hot water extraction at high pressure and temperature (130 °C), but maximum antioxidant activity values of 0.86 mg TE/mg dry ethanolic extract (70% v/v). Similarly, Sánchez-Gonzáles et al. [27] worked with grape seeds (Vitis vinifera), achieving antioxidant activity values of 1,628.15 ± 80.32 μmol TE/g dry weight using high-pressure and temperature water extraction.
However, the results of TPC and AA quantification are dependent on the extraction method and conditions used. Various authors have employed high-pressure and temperature water extraction [21,26,27,34,35,36,38]. Ultrasound-assisted extraction has also been widely used [30,31,33,37], along with infusion and decoction methods [32] and organic solvent extraction [21,27,31,35].
Regarding the findings in previous studies using high-pressure and temperature water extraction: Razak et al. [34] reported AA values of 71.46 ± 2.44% inhibition. Similarly, Siti Nur Khairunisa et al. [36] found maximum AA values of 63.26% inhibition at 170°C, 20 minutes, and 20 mL/g extract of Zingiber zerumbet.
On the other hand, using the ultrasound-assisted extraction method: Murphy et al. [33] reported maximum values of TPC of 1,039.64 mg GAE/g dry weight and AA values of 54.50% in ethanolic extract. Similarly, Contreras-López et al. [30] obtained maximum TPC values of 17.11 mg GAE/100 g and AA values of 157.15 mg TE/100 g. Additionally, in extracts of Zingiber montanum, Thepthong et al. [37] achieved a maximum TPC of 71.45 ± 1.45 mg GAE/g methanolic extract and a maximum AA value with an IC50 of 38.89 ± 0.27 μg/mL ethanolic extract.
Similarly, Jorge-Montalvo et al. [31] obtained higher TPC values using the maceration method, with 10.03 ± 0.14 mg GAE/g sample (25°C for 24 hours), and higher AA values using the reflux method, with an IC50 of 0.72 ± 0.05 mg dry matter/mL (85°C for 12 hours).
Thus, conventional methods face challenges such as low yield, longer extraction times, and solvent loss. In this context, high-pressure and high-temperature water extraction emerges as a less polluting, faster, and more cost-effective alternative.
Despite the promising results, the study faced some limitations related to the extraction equipment used. Due to the thermal fragility of some components, the operational conditions were restricted, with a maximum operating temperature of 130°C. This limitation prevented a more thorough investigation of temperature effects over a broader range. Additionally, the presence of starch in the dried ginger rhizome formed a cake that hindered the complete recovery of the operating water volume, reducing the extract yield (w/v). Therefore, these factors should be considered when designing future experiments.
This article contributes to scientific knowledge on the extraction of bioactive compounds from ginger by demonstrating the effectiveness of using water at high pressure and temperature. It provides a foundation for future research and applications in the pharmaceutical and food industries for the development of supplements and functional foods. This approach also supports the valorization of agricultural by-products and the development of high-value natural products. Furthermore, by using sole water as the extraction solvent, we promote a sustainable and pollution-free industry.
5. Conclusions
Considering that temperature was found to be the significant factor in the extraction process and acknowledging that temperature constraints were a limiting factor in this research due to equipment operational conditions, further studies are recommended to optimize temperature for the extraction of bioactive compounds with antioxidant activity. Additionally, precise control of storage conditions is advised to maintain the stability of sample composition and preserve product quality for subsequent analysis.
Continuous monitoring of these parameters is suggested to ensure consistency and quality in future experiments. Although particle size was not significant, further investigation into its impact could provide insights and potential improvements in extraction efficiency.
Finally, future directions could include more detailed investigations into the compounds and toxicity of the extracts, as well as sensory and nutritional studies to evaluate the impact on food products. Additionally, exploring other parameters in PLE extraction method could provide additional insights and improve extraction efficiency.
Author Contributions
Conceptualization, Marlon Saldaña-Olguin and Elza Aguirre-Vargas; Data curation, Marlon Saldaña-Olguin; Formal analysis, Marlon Saldaña-Olguin; Funding acquisition, Marlon Saldaña-Olguin; Investigation, Marlon Saldaña-Olguin and Bernardo Quispe-Ciudad; Methodology, Marlon Saldaña-Olguin; Project administration, Marlon Saldaña-Olguin; Resources, Marlon Saldaña-Olguin; Software, Marlon Saldaña-Olguin; Supervision, Elza Aguirre-Vargas; Validation, Marlon Saldaña-Olguin and Elza Aguirre-Vargas; Visualization, Bernardo Quispe-Ciudad; Writing – original draft, Marlon Saldaña-Olguin; Writing – review & editing, Marlon Saldaña-Olguin.
Funding
The APC was funded by the Vicerrectorado de Investigacion (VRIN) of the Universidad Nacional del Santa, Peru.
Data Availability Statement
The original contributions presented in the study are included in the article/supplementary material, further inquiries can be directed to the corresponding author/s.
Acknowledgments
The authors gratefully acknowledge the support and contributions of various individuals and institutions that made this research possible. We extend our sincere appreciation to Dr. Maritza Barriga Sanchez and the personnel of the Instituto Tecnologico de la Produccion (ITP) for their invaluable assistance during the experimental work. Special thanks are due to the Vicerrectorado de Investigacion (VRIN) of the Universidad Nacional del Santa for providing financial support through a research scholarship, which facilitated the execution of this study. We also extend our gratitude to Dr. Elza Berta Aguirre Vargas for her expert guidance and invaluable advice throughout this research.
Conflicts of Interest
The authors declare no conflicts of interest. The funders had no role in the design of the study; in the collection, analyses, or interpretation of data; in the writing of the manuscript; or in the decision to publish the results.
References
- Sulejmanović, M.; Milić, N.; Mourtzinos, I.; Nastić, N.; Kyriakoudi, A.; Drljača, J.; Vidović, S. Ultrasound-assisted and subcritical water extraction techniques for maximal recovery of phenolic compounds from raw ginger herbal dust toward in vitro biological activity investigation. Food Chem. 2024, 437, 137774. [Google Scholar] [CrossRef] [PubMed]
- Yilmaz-Turan, S.; Gál, T.; Lopez-Sanchez, P.; Martinez, M.M.; Menzel, C.; Vilaplana, F. Modulating temperature and pH during subcritical water extraction tunes the molecular properties of apple pomace pectin as food gels and emulsifiers. Food Hydrocoll. 2023, 145, 109148. [Google Scholar] [CrossRef]
- Ferreira, C.; Moreira, M.M.; Delerue-Matos, C.; Sarraguça, M. Subcritical water extraction to valorize grape biomass—A step closer to circular economy. Molecules 2023, 28, 7538. [Google Scholar] [CrossRef] [PubMed]
- Gulzar, R.; Afzaal, M.; Saeed, F.; Samar, N.; Shahbaz, A.; Ateeq, H.; Farooq, M.U.; Akram, N.; Asghar, A.; Rasheed, A.; Teferi Asres, D. Bio valorization and industrial applications of ginger waste: a review. Int. J. Food Prop. 2023, 26, 2772–2780. [Google Scholar] [CrossRef]
- Gao, Y.; Ozel, M.Z.; Dugmore, T.; Sulaeman, A.; Matharu, A.S. A biorefinery strategy for spent industrial ginger waste. J. Hazard. Mater. 2021, 401, 123400. [Google Scholar] [CrossRef]
- Ko, M.-J.; Nam, H.-H.; Chung, M.-S. Conversion of 6-gingerol to 6-shogaol in ginger (Zingiber officinale) pulp and peel during subcritical water extraction. Food Chem. 2019, 270, 149–155. [Google Scholar] [CrossRef]
- Aimone, C.; Calcio Gaudino, E.; Brncic, M.; Barba, F.J.; Grillo, G.; Cravotto, G. Sorbus spp. berries extraction in subcritical water: Bioactives recovery and antioxidant activity. Appl. Food Res. 2024, 4, 100391. [Google Scholar] [CrossRef]
- Cheng, Y.; Xue, F.; Yu, S.; Du, S.; Yang, Y. Subcritical water extraction of natural products. Molecules 2021, 26, 4004. [Google Scholar] [CrossRef]
- Kamiński, P.; Gruba, M.; Fekner, Z.; Tyśkiewicz, K.; Kobus, Z. The influence of water extraction parameters in subcritical conditions and the shape of the reactor on the quality of extracts obtained from Norway maple (Acer platanoides L.). Processes 2023, 11, 3395. [Google Scholar] [CrossRef]
- Freitas, P.A.V.; Martín-Pérez, L.; Gil-Guillén, I.; González-Martínez, C.; Chiralt, A. Subcritical water extraction for valorisation of almond skin from almond industrial processing. Foods 2023, 12, 3759. [Google Scholar] [CrossRef]
- Alibekov, R.S.; Mustapa Kamal, S.M.; Taip, F.S.; Sulaiman, A.; Azimov, A.M.; Urazbayeva, K.A. Recovery of phenolic compounds from jackfruit seeds using subcritical water extraction. Foods 2023, 12, 3296. [Google Scholar] [CrossRef] [PubMed]
- Endy Yulianto, M.; Paramita, V.; Amalia, R.; Wahyuningsih, N.; Dwi Nyamiati, R. Production of bioactive compounds from ginger (Zingiber officianale) dregs through subcritical water extraction. Mater. Today Proc. 2022, 63, S188–S194. [Google Scholar] [CrossRef]
- Pinto, D.; Vieira, E.F.; Peixoto, A.F.; Freire, C.; Freitas, V.; Costa, P.; Delerue-Matos, C.; Rodrigues, F. Optimizing the extraction of phenolic antioxidants from chestnut shells by subcritical water extraction using response surface methodology. Food Chem. 2021, 334, 127521. [Google Scholar] [CrossRef] [PubMed]
- Trigueros, E.; Benito-Román, Ó.; Oliveira, A.P.; Videira, R.A.; Andrade, P.B.; Sanz, M.T.; Beltrán, S. Onion (Allium cepa L.) skin waste valorization: Unveiling the phenolic profile and biological potential for the creation of bioactive agents through subcritical water extraction. Antioxidants 2024, 13, 205. [Google Scholar] [CrossRef] [PubMed]
- Rudjito, R.C.; Matute, A.C.; Jiménez-Quero, A.; Olsson, L.; Stringer, M.A.; Krogh, K.B.R.M.; Eklöf, J.; Vilaplana, F. Integration of subcritical water extraction and treatment with xylanases and feruloyl esterases maximises release of feruloylated arabinoxylans from wheat bran. Bioresour. Technol. 2024, 395, 130387. [Google Scholar] [CrossRef] [PubMed]
- Krishnamoorthy, R.; Hai, A.; Banat, F. Subcritical water extraction of mango seed kernels and its application for cow ghee preservation. Processes 2023, 11, 1379. [Google Scholar] [CrossRef]
- Pereira, S.G.; Gomes-Dias, J.S.; Pereira, R.N.; Teixeira, J.A.; Rocha, C.M.R. Innovative processing technology in agar recovery: Combination of subcritical water extraction and moderate electric fields. Innov. Food Sci. Emerg. Technol. 2023, 84, 103306. [Google Scholar] [CrossRef]
- Silva, S.P.; Ferreira-Santos, P.; Lopes, G.R.; Reis, S.F.; González, A.; Nobre, C.; Freitas, V.; Coimbra, M.A.; Coelho, E. Industrial byproduct pine nut skin factorial design optimization for production of subcritical water extracts rich in pectic polysaccharides, xyloglucans, and phenolic compounds by microwave extraction. Carbohydr. Polym. Technol. Appl. 2024, 7, 100508. [Google Scholar] [CrossRef]
- Yabalak, E.; Aminzai, M.T.; Gizir, A.M.; Yang, Y. A review: Subcritical water extraction of organic pollutants from environmental matrices. Molecules 2024, 29, 258. [Google Scholar] [CrossRef]
- Çalhan, S.D.; Meryemoğlu, B.; Eroğlu, P.; Saçlı, B.; Kalderis, D. Subcritical water extraction of Onosma mutabilis: Process optimization and chemical profile of the extracts. Molecules 2023, 28, 2314. [Google Scholar] [CrossRef]
- Barriga-Sánchez, M.; Rosales-Hartshorn, M. Effects of subcritical water extraction and cultivar geographical location on the phenolic compounds and antioxidant capacity of Quebranta (Vitis vinifera) grape seeds from the Peruvian pisco industry by-product. Food Sci. Technol. 2022, 42, e107321. [Google Scholar] [CrossRef]
- Brand-Williams, W.; Cuvelier, M.E.; Berset, C. Use of a free radical method to evaluate antioxidant activity. LWT - Food Sci. Technol. 1995, 28, 25–30. [Google Scholar] [CrossRef]
- Kim, J.-K.; Noh, J.; Lee, S.; Choi, J.-S.; Suh, H.; Chung, H.-Y.; Song, Y.-O.; Choi, W.-C. The first total synthesis of 2,3,6-tribromo-4,5-dihydroxybenzyl methyl ether (TDB) and its antioxidant activity. Bull. Korean Chem. Soc. 2002, 23, 661–662. [Google Scholar] [CrossRef]
- Nourbakhsh Amiri, Z.; Najafpour, G.D.; Mohammadi, M.; Moghadamnia, A.A. Subcritical Water Extraction of Bioactive Compounds from Ginger (Zingiber officinale Roscoe). Int. J. Eng. 2018, 31, 1991–2000. [Google Scholar] [CrossRef]
- Zhang, Q.-W.; Lin, L.-G.; Ye, W.-C. Techniques for extraction and isolation of natural products: a comprehensive review. Chin. Med. 2018, 13. [Google Scholar] [CrossRef]
- Siti Nur Khairunisa, M.A.; Mad Nordin, M.F.; Shameli, K.; Mohamad Abdul Wahab, I.; Abdul Hamid, M. Evaluation of parameters for subcritical water extraction of Zingiber zerumbet using fractional factorial design. J. Teknol. 2021, 83, 143–150. [Google Scholar] [CrossRef]
- Sanchez-Gonzales, G. , Castro-Rumiche, C., Alvarez-Guzman, G., Flores-García, J., & Barriga-Sánchez, M. Compuestos fenólicos y actividad antioxidante de los extractos de la hoja de chirimoya (Annona cherimola Mill). Rev. Colomb. Quím. 2019, 48, 21–26. [Google Scholar] [CrossRef]
- Beristain-Bauza, S.D.; Hernández-Carranza, P.; Cid-Pérez, T.S.; Ávila-Sosa, R.; Ruiz-López, I.I.; Ochoa-Velasco, C.E. Antimicrobial Activity of Ginger (Zingiber officinale) and Its Application in Food Products. Food Rev. Int. 2019, 35. [Google Scholar] [CrossRef]
- Mao, Q.-Q.; Xu, X.-Y.; Cao, S.-Y.; Gan, R.-Y.; Corke, H.; Beta, T.; Li, H.-B. Bioactive Compounds and Bioactivities of Ginger (Zingiber officinale Roscoe). Foods 2019, 8, 185. [Google Scholar] [CrossRef]
- Contreras-López, E.; Castañeda-Ovando, A.; Jaimez-Ordaz, J.; Cruz-Cansino, N. del S.; González-Olivares, L.G.; Rodríguez-Martínez, J.S.; Ramírez-Godínez, J. Release of antioxidant compounds of Zingiber officinale by ultrasound-assisted aqueous extraction and evaluation of their in vitro bioaccessibility. Appl. Sci. 2020, 10, 4987. [Google Scholar] [CrossRef]
- Jorge-Montalvo, P.; Vílchez-Perales, C.; Visitación-Figueroa, L. Evaluation of antioxidant capacity, structure, and surface morphology of ginger (Zingiber officinale) using different extraction methods. Heliyon 2023, 9, e16516. [Google Scholar] [CrossRef] [PubMed]
- Mahmudati, N.; Wahyono, P.; Djunaedi, D. Antioxidant activity and total phenolic content of three varieties of Ginger (Zingiber officinale) in decoction and infusion extraction method. J. Phys. Conf. Ser. 2020, 1567, 22028. [Google Scholar] [CrossRef]
- Murphy, A.; Norton, E.; Montgomery, F.; Jaiswal, A.K.; Jaiswal, S. Ultrasound-Assisted Extraction of Polyphenols from Ginger (Zingiber officinale) and Evaluation of its Antioxidant and Antimicrobial Properties. J. Food Chem. Nanotechnol. 2020, 6. [Google Scholar] [CrossRef]
- Razak, A.M.; Zakaria, S.N.A.; Abdul Sani, N.F.; Ab Rani, N.; Hakimi, N.H.; Mohd Said, M.; Tan, J.K.; Gan, H.K.; Mad Nordin, M.F.; Makpol, S. A subcritical water extract of soil grown Zingiber officinale Roscoe: Comparative analysis of antioxidant and anti-inflammatory effects and evaluation of bioactive metabolites. Front. Pharmacol. 2023, 14. [Google Scholar] [CrossRef]
- Mokhtar, N.; Nordin, M.F.M.; Morad, N. Total Phenolic Content, Total Flavonoid Content and Radical Scavenging Activity from Zingiber zerumbet Rhizome using Subcritical Water Extraction. Int. J. Eng. 2018, 31, 1421–1429. https://www.ije.ir/article_73263_a2c983d8d7e9dd24f79c6eb632e9a19e.pdf.
- Siti Nur Khairunisa, M.A.; Mad Nordin, M.F.; Shameli, K.; Mohamad Abdul Wahab, I.; Abdul Hamid, M. Modeling and optimization of pilot-scale subcritical water extraction on Zingiber zerumbet by central composite design. IOP Conf. Ser. Mater. Sci. Eng. 2020, 778, 12077. [Google Scholar] [CrossRef]
- Thepthong, P.; Rattakarn, K.; Ritchaiyaphum, N.; Intachai, S.; Chanasit, W. Effect of extraction solvents on antioxidant and antibacterial activity of Zingiber montanum rhizomes. ASEAN J. Sci. Technol. Rep. 2023, 26, 1–9. [Google Scholar] [CrossRef]
- Mazyan, W.I.; O’Connor, E.; Martin, E.; Vogt, A.; Charter, E.; Ahmadi, A. Effects of temperature and extraction time on avocado flesh (Persea americana) total phenolic yields using subcritical water extraction. Processes 2021, 9, 159. [Google Scholar] [CrossRef]
Figure 1.
General scheme of the experimental procedure.
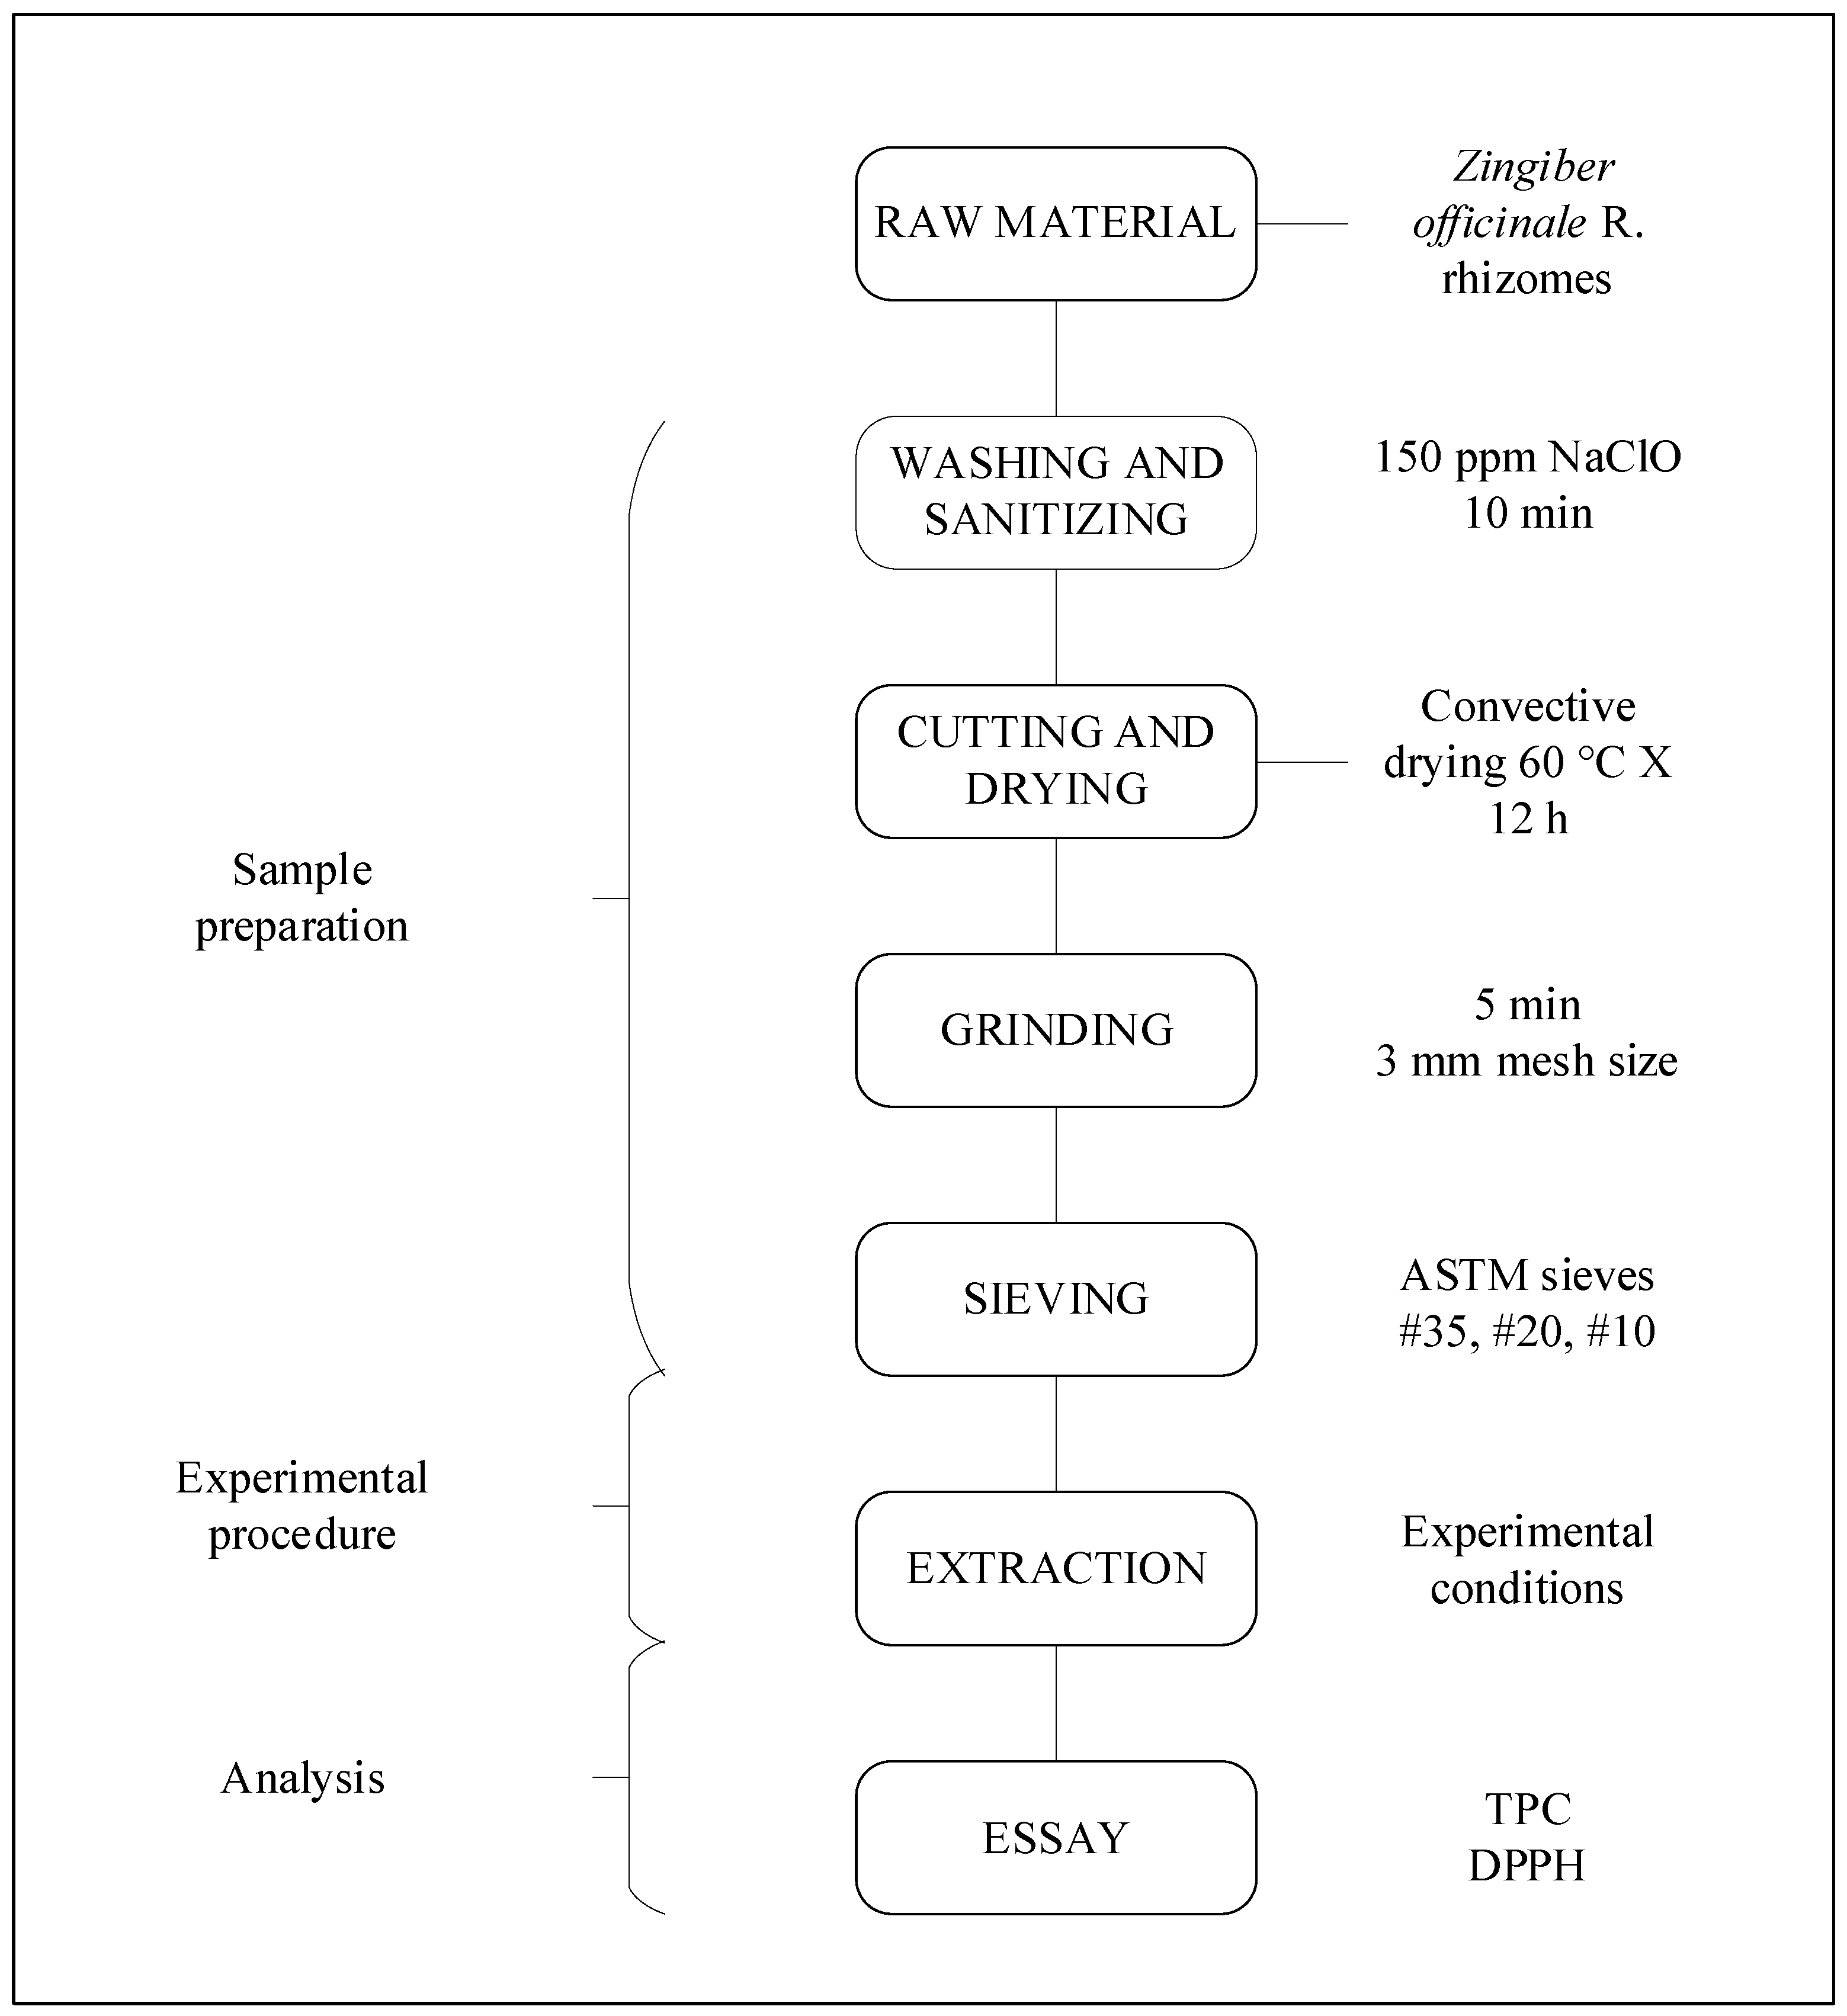
Figure 2.
Pareto chart of standardized effects for: (a) TPC response; (b) AA response.
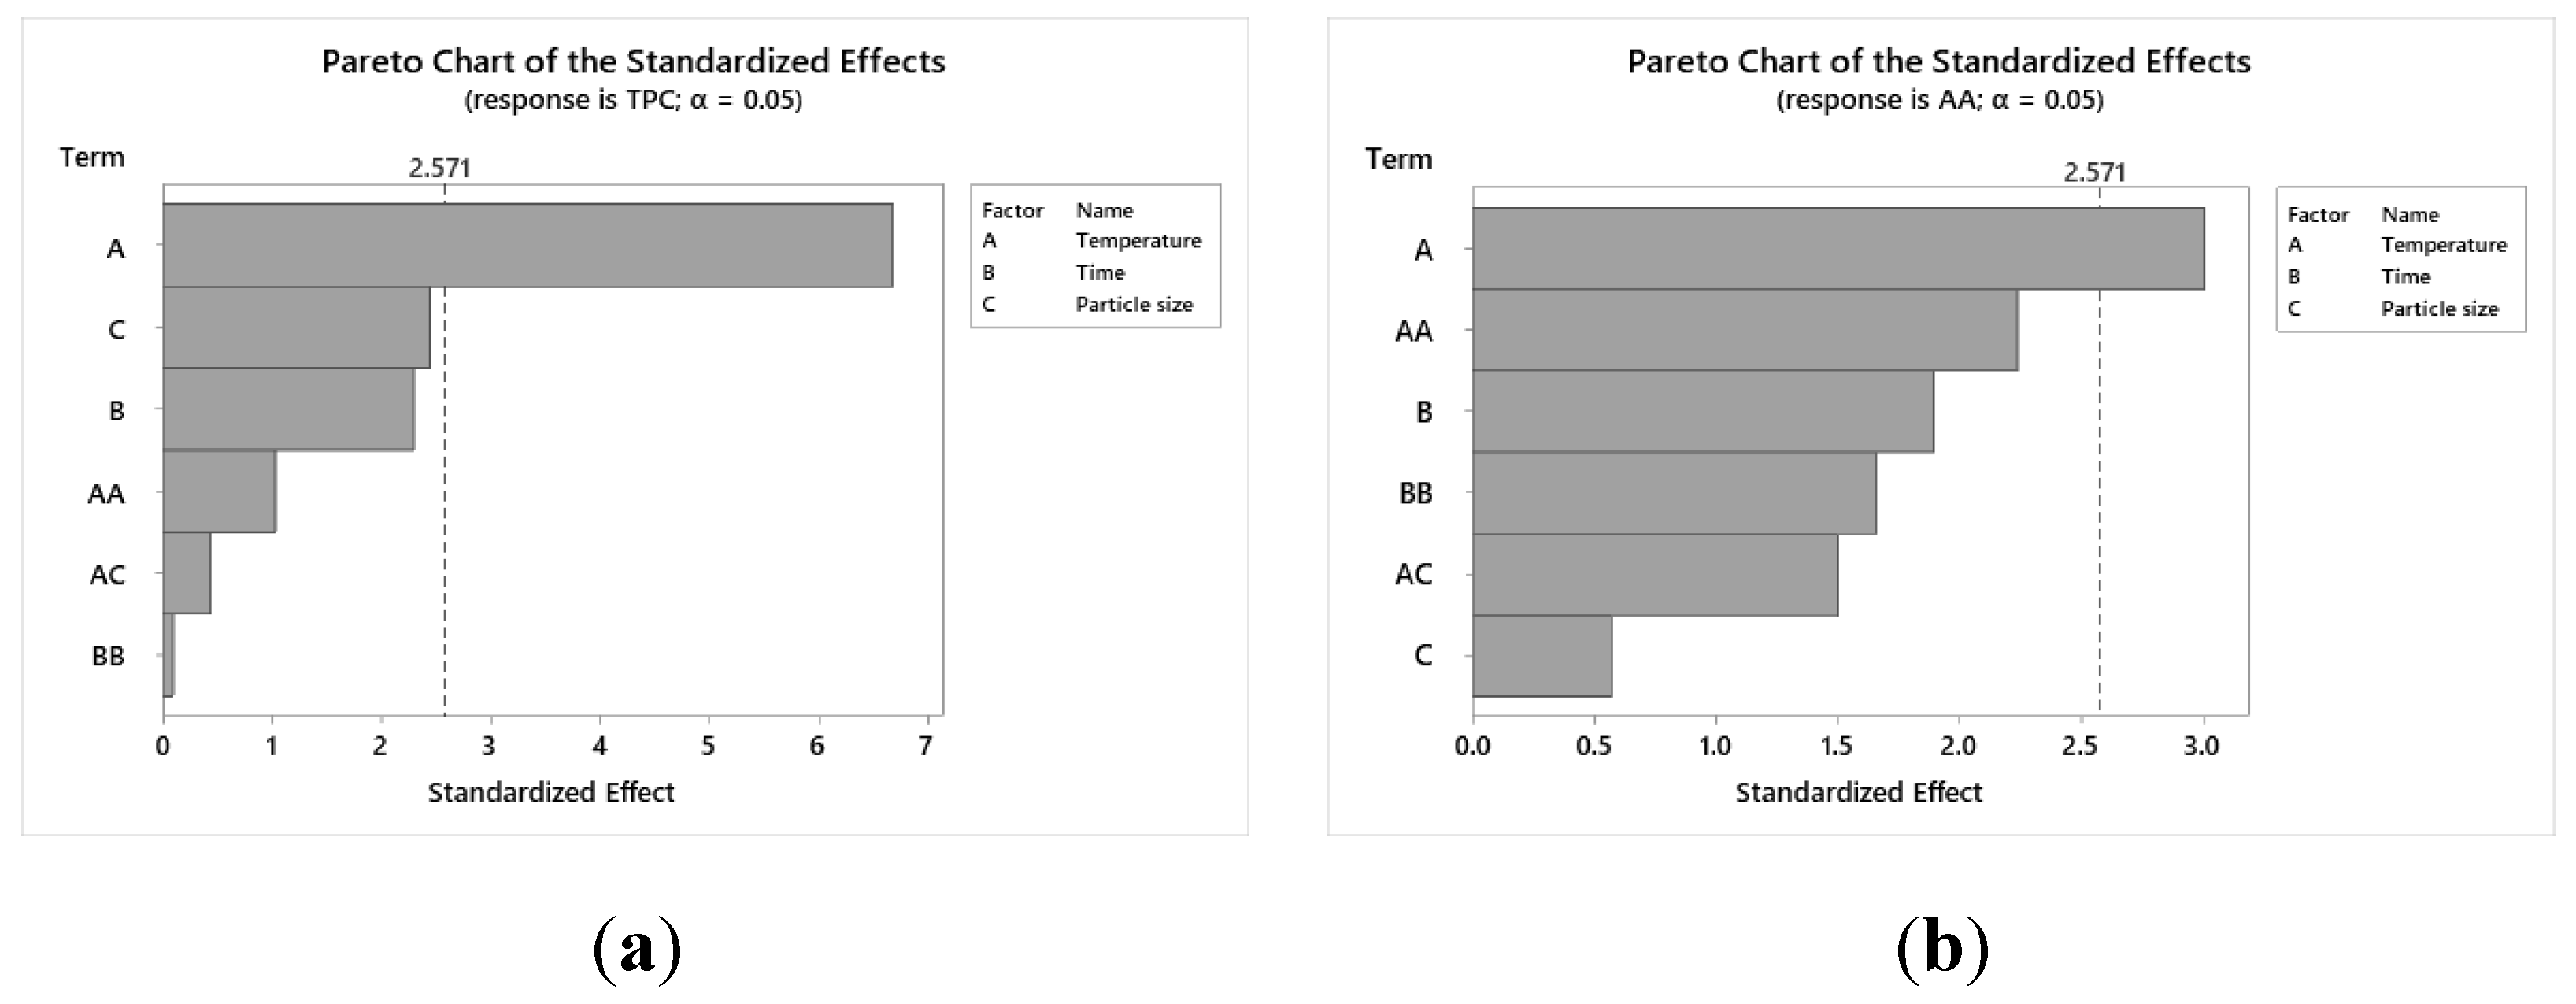
Figure 3.
Main effects plot for: (a) TPC response; (b) AA response.
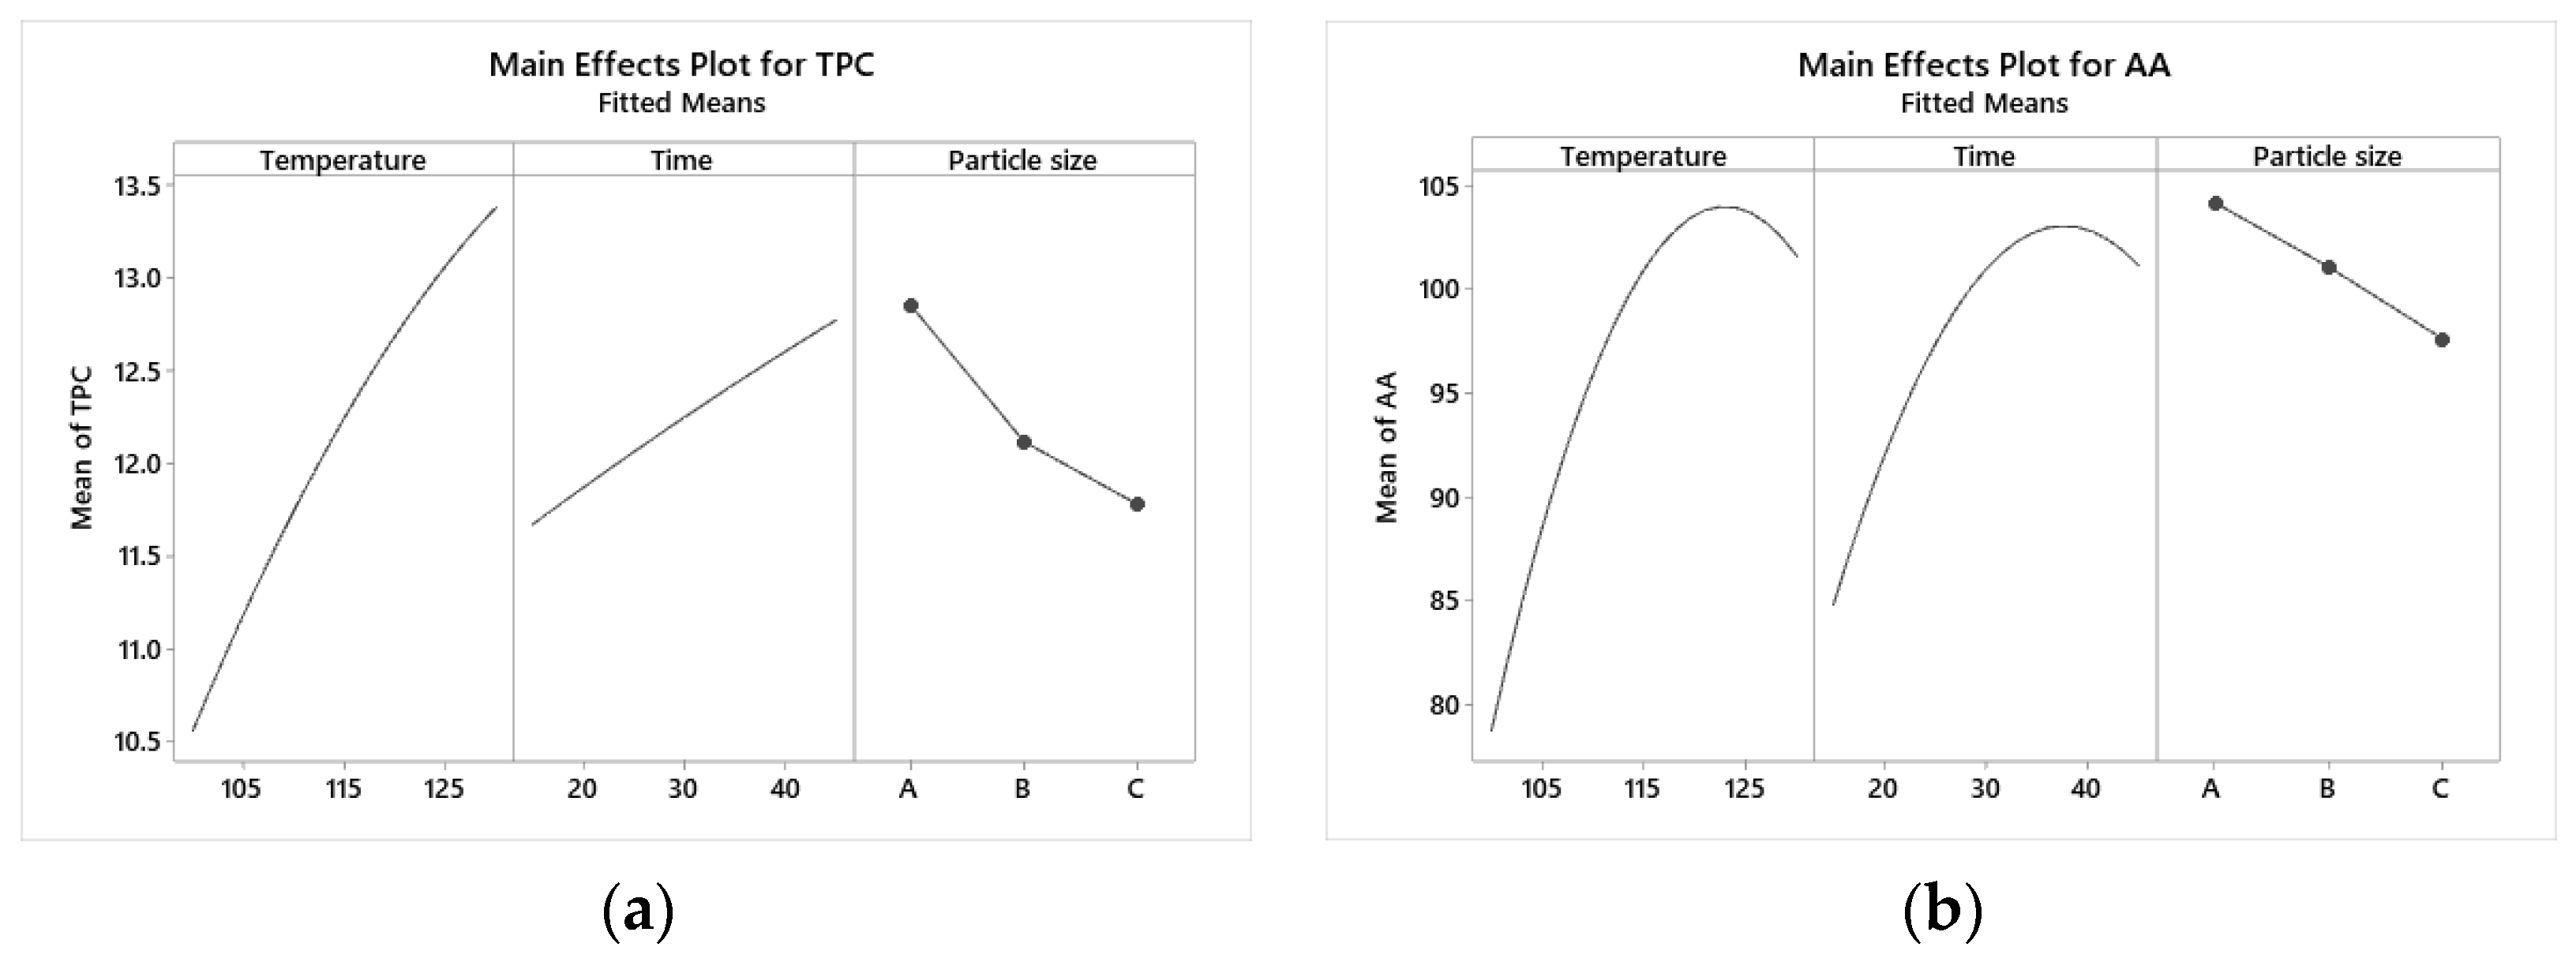
Figure 4.
Interaction plot for TPC response.
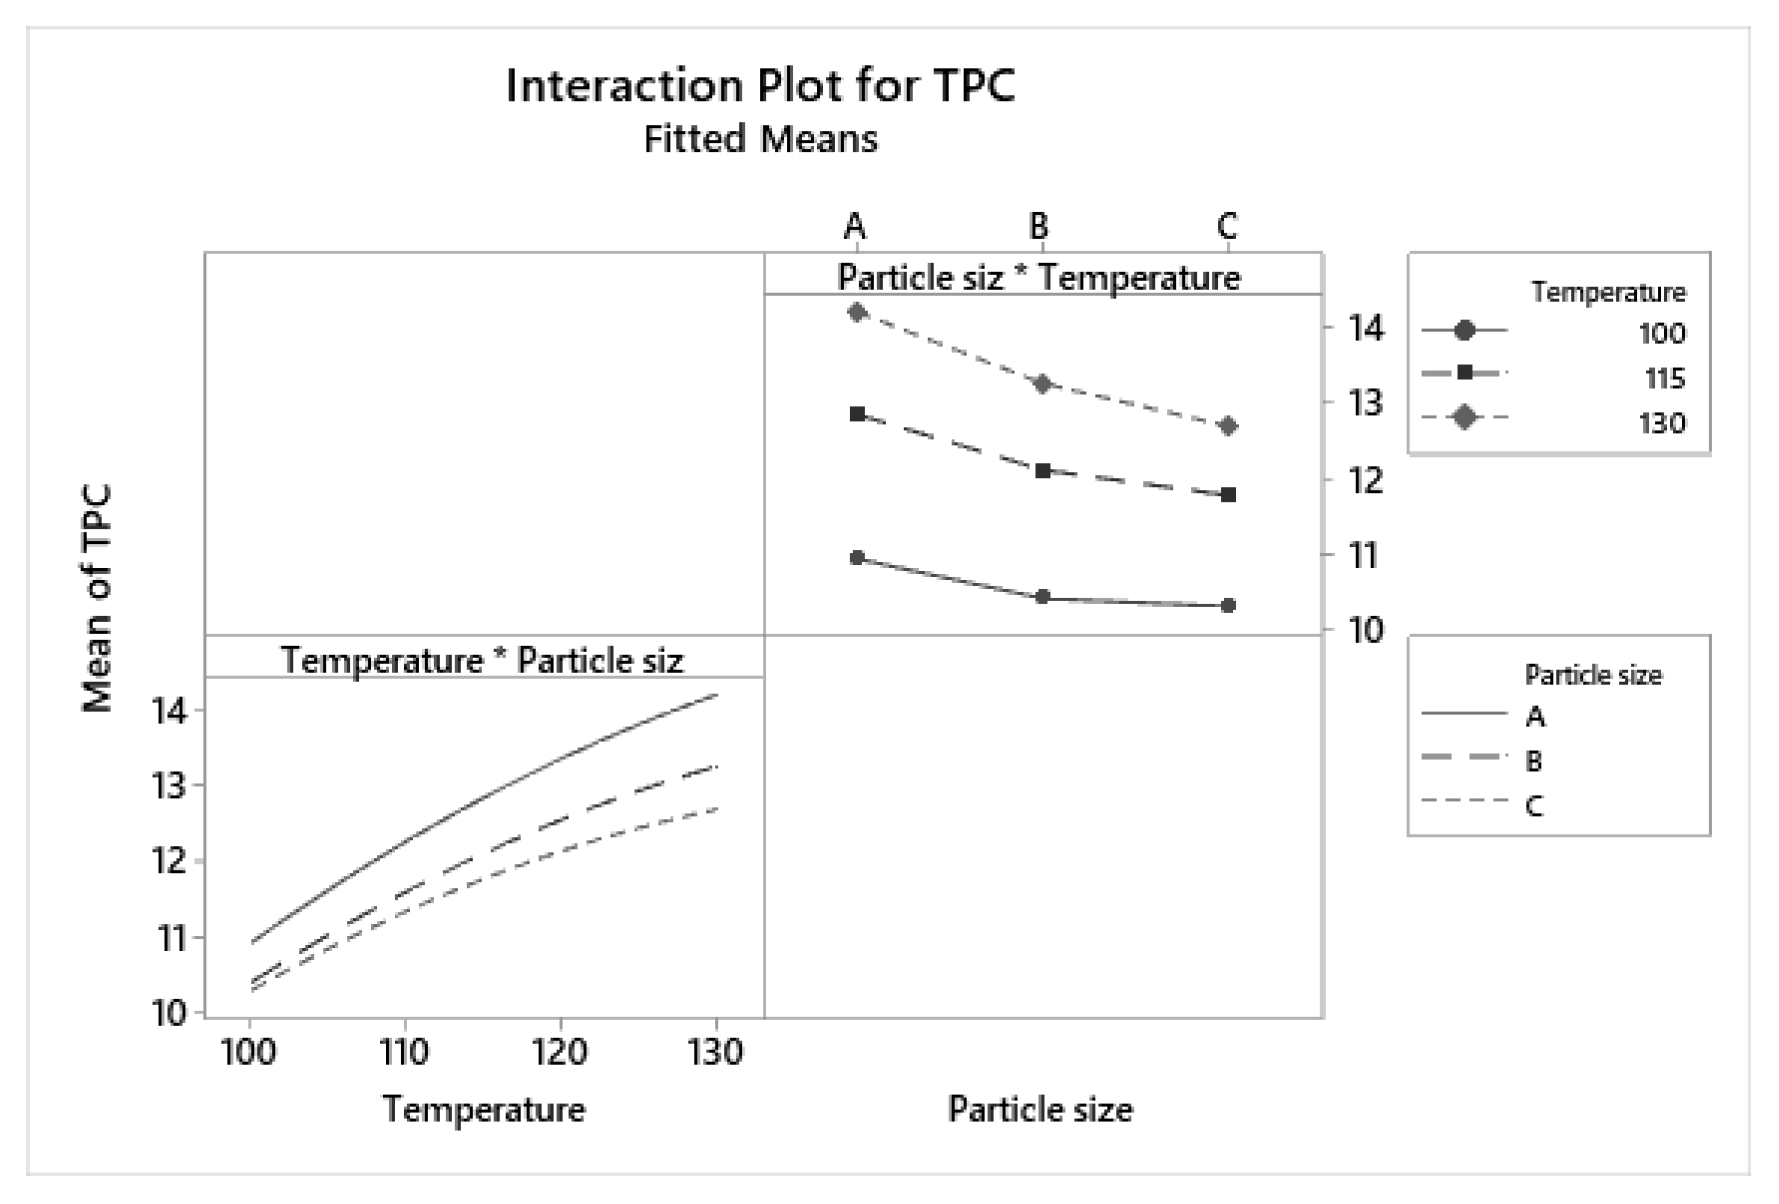
Figure 5.
Interaction plot for AA response.
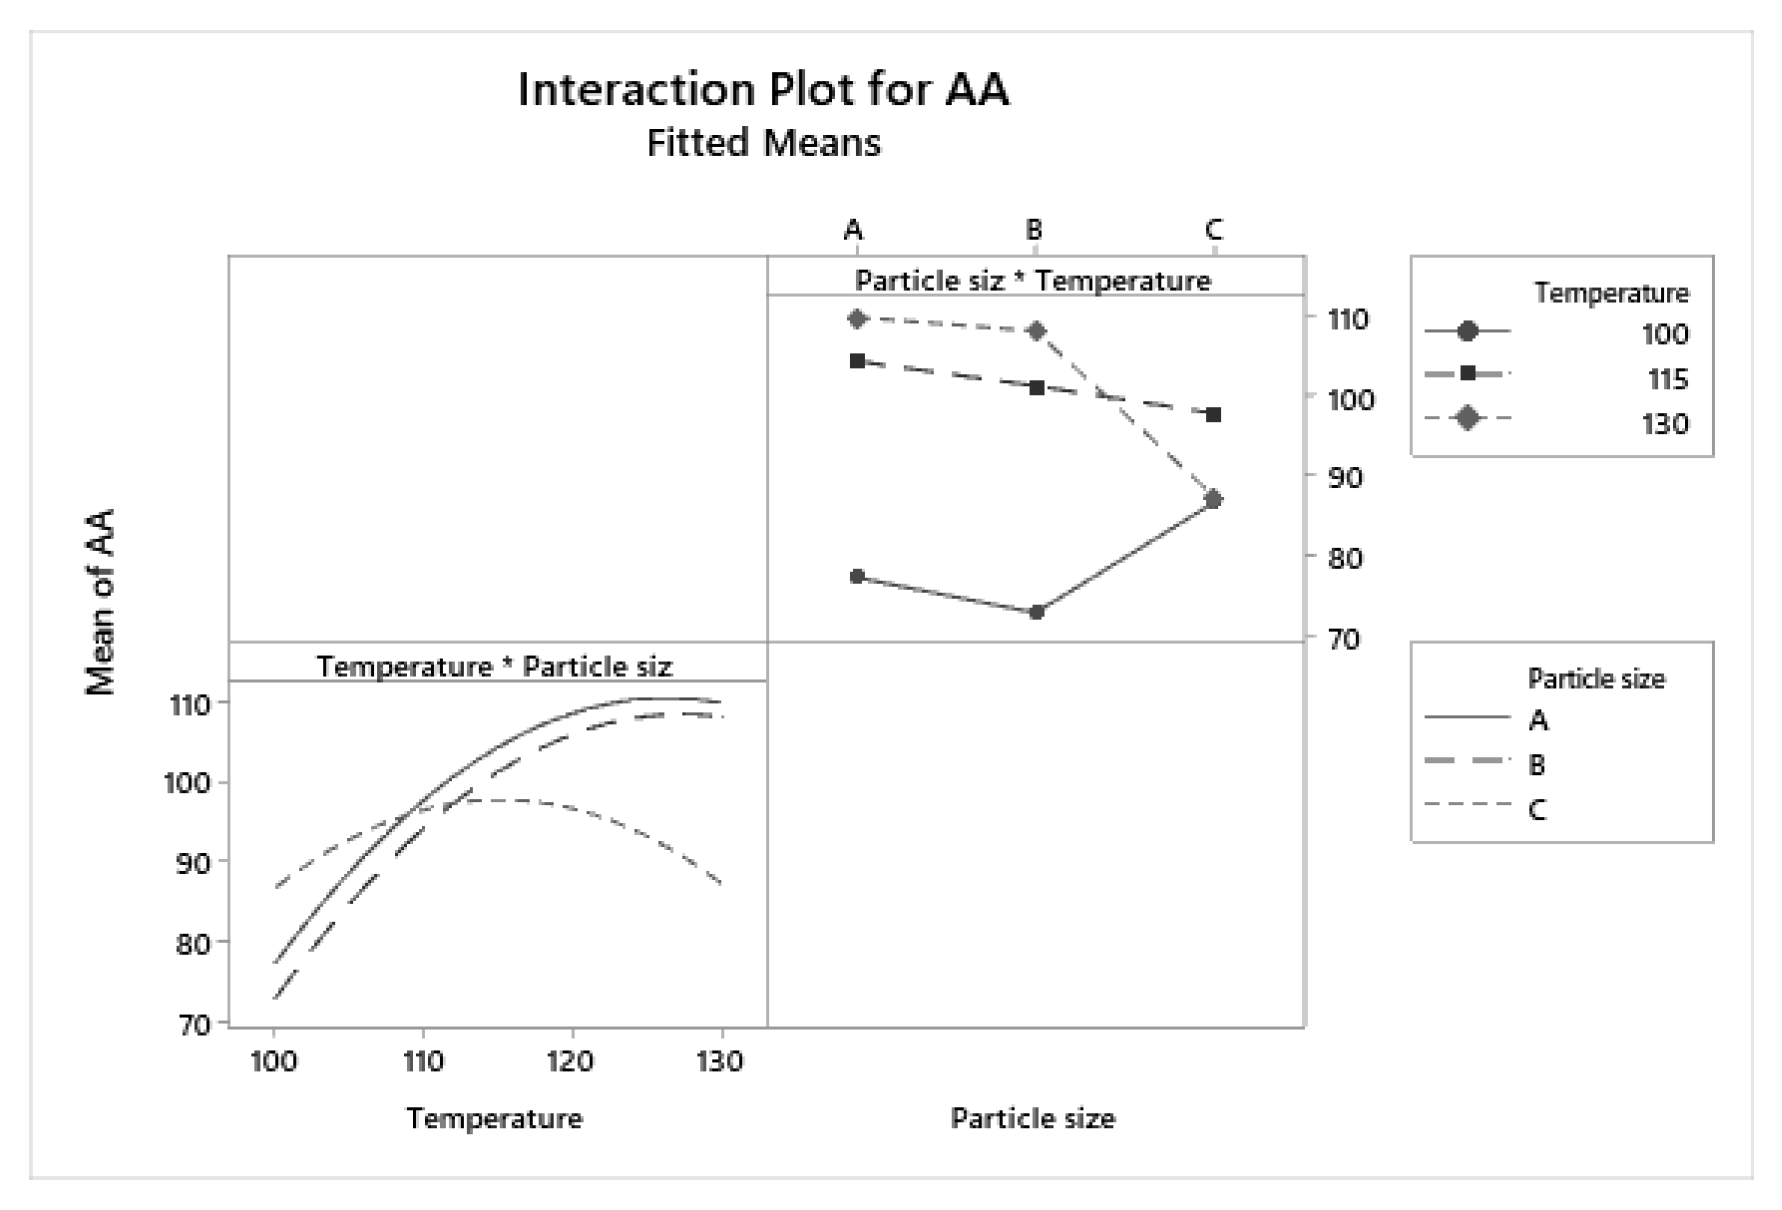
Figure 6.
3D surface plots of TPC response for: (a) particle size A; (b) particle size B; (c) particle size C.
Figure 6.
3D surface plots of TPC response for: (a) particle size A; (b) particle size B; (c) particle size C.
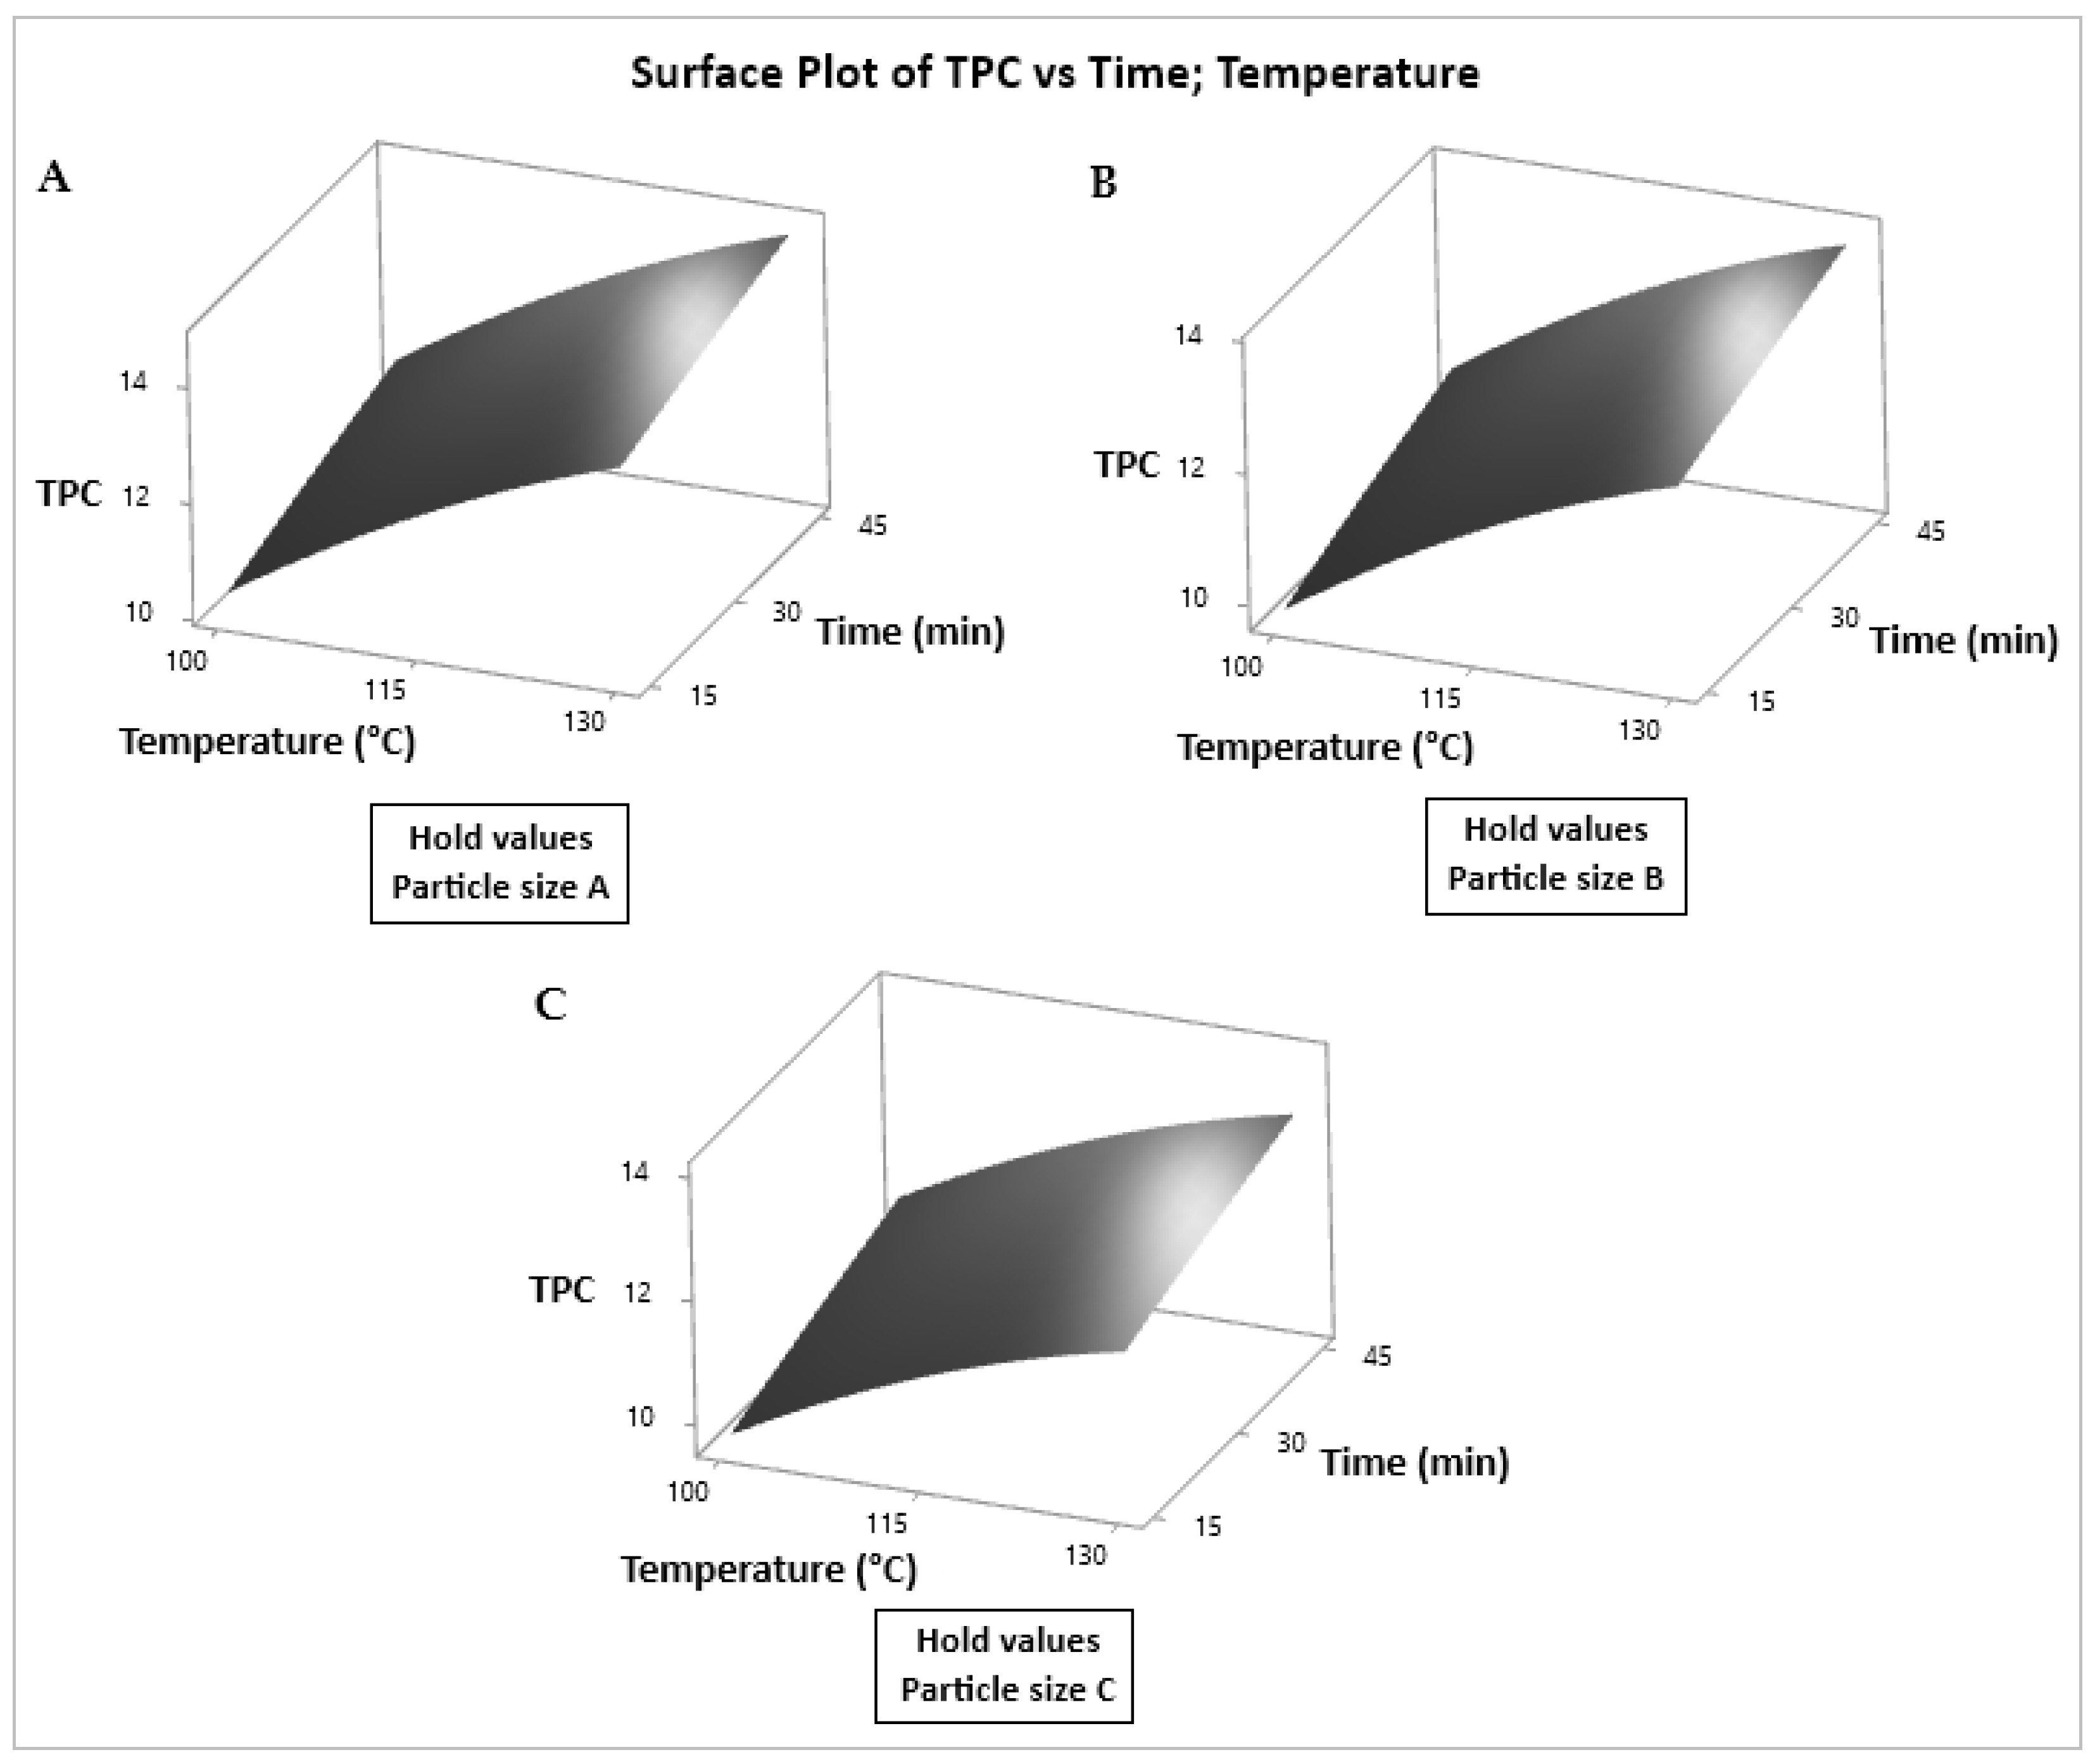
Figure 7.
Figure 7. 3D surface plots of AA response for: (a) particle size A; (b) particle size B; (c) particle size C.
Figure 7.
Figure 7. 3D surface plots of AA response for: (a) particle size A; (b) particle size B; (c) particle size C.
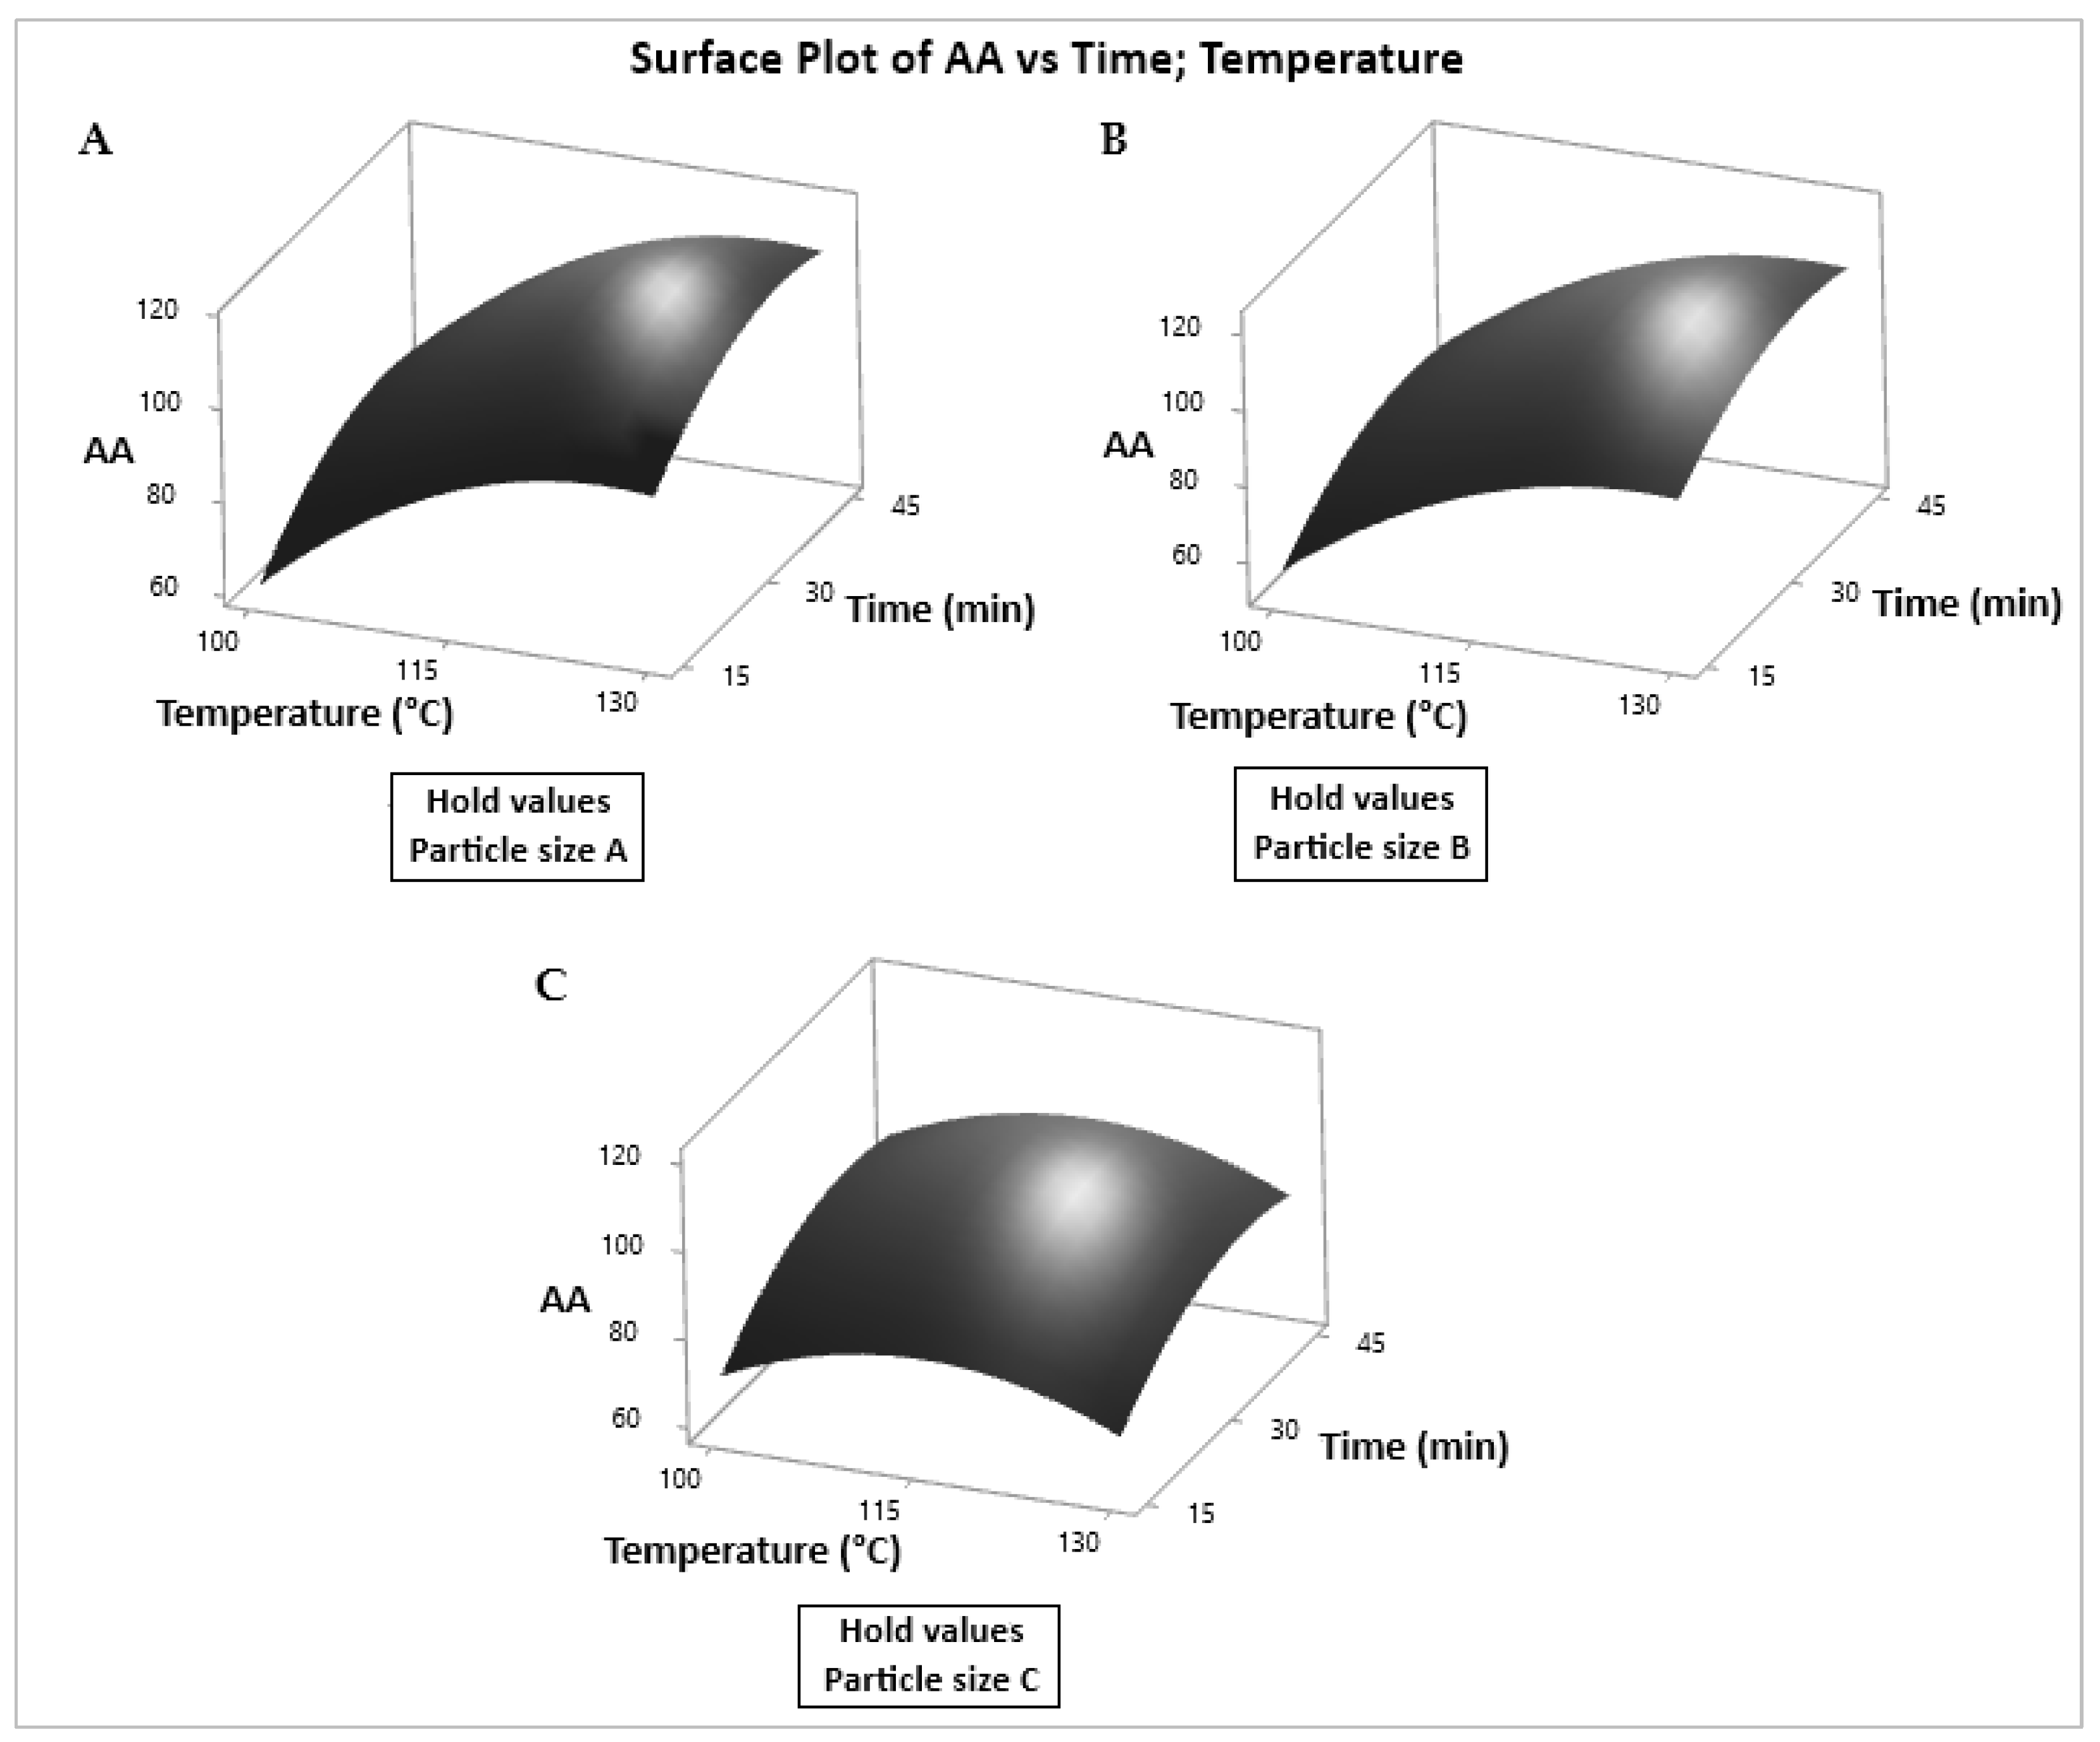

Table 1.
Essay results.
| SampleExtracts | Conditions | Responses 2 | |||||
|---|---|---|---|---|---|---|---|
| Temperature (°C) | Time (min) | Particle size (μm) 1 | TPC (mg GAE/g sample) | AA (μmol TE/g sample) | |||
| M1 | 100 | 15 | B | 10.84 | 11.28 | 117.46 | 117.90 |
| M2 | 115 | 30 | B | 11.27 | 10.89 | 111.94 | 112.02 |
| M3 | 115 | 30 | B | 12.43 | 12.76 | 106.70 | 104.83 |
| M4 | 100 | 30 | C | 10.29 | 10.42 | 89.80 | 89.53 |
| M5 | 115 | 30 | B | 12.16 | 12.32 | 98.19 | 98.87 |
| M6 | 115 | 45 | A | 13.22 | 13.45 | 107.85 | 109.16 |
| M7 | 130 | 30 | A | 13.73 | 14.10 | 106.52 | 106.12 |
| M8 | 130 | 15 | B | 12.68 | 12.36 | 91.83 | 91.66 |
| M9 | 115 | 45 | C | 12.53 | 12.23 | 94.33 | 93.99 |
| M10 | 115 | 15 | A | 12.06 | 12.40 | 90.98 | 95.68 |
| M11 | 130 | 30 | C | 12.93 | 12.79 | 90.36 | 90.26 |
| M12 | 100 | 45 | B | 10.95 | 11.02 | 72.88 | 72.30 |
| M13 | 115 | 30 | B | 13.06 | 12.61 | 88.12 | 88.80 |
| M14 | 115 | 15 | C | 10.96 | 11.08 | 78.60 | 79.07 |
| M15 | 130 | 45 | B | 12.90 | 13.07 | 88.79 | 89.72 |
| M16 | 100 | 30 | A | 10.40 | 10.85 | 73.95 | 73.34 |
1 Retained powder (μm): 350 < size A < 500; 500 < size B < 850; 850 < size C < 2,000. 2 Duplicate measures.
Table 2.
ANOVA results of TPC and AA.
| Variation source | TPC | AA | ||
|---|---|---|---|---|
| Contribution | p | Contribution | p | |
| Model | 92.15% | 0.02 | 81.07% | 0.15 |
| Lineal | 89.12% | 0.01 | 38.69% | 0.15 |
| Temperature | 61.88% | 0.00 | 23.14% | 0.03 |
| Time | 10.99% | 0.07 | 9.23% | 0.12 |
| Particle | 16.25% | 0.06 | 6.32% | 0.59 |
| Quadratic | 1.70% | 0.61 | 24.80% | 0.12 |
| Temperature*Temperature | 1.68% | 0.35 | 14.35% | 0.07 |
| Time*Time | 0.02% | 0.93 | 10.45% | 0.16 |
| Two-factor interaction | 1.33% | 0.68 | 17.58% | 0.19 |
| Temperature*Particle | 1.33% | 0.68 | 17.58% | 0.19 |
| Error | 7.85% | - | 18.93% | - |
| Lack of fit | 0.57% | 0.89 | 4.21% | 0.69 |
| Pure error | 7.29% | - | 14.73% | - |
| Total | 100.00% | - | 100.00% | - |
Table 3.
Pearson correlation output.
| Response 1 | Response 2 | ρ | 95% CI | p |
|---|---|---|---|---|
| TPC | AA | 0.58 | (0.07; 0.85) | 0.03 |
Table 4.
Multiple response optimization.
| Response | Fit | SE Fit | 95% CI | 95% PI |
|---|---|---|---|---|
| TPC | 112.44 | 6.77 | (95.03; 129.85) | (84.30; 140.58) |
| AA | 14.20 | 0.38 | (13.23; 15.17) | (12.64; 15.76) |
Disclaimer/Publisher’s Note: The statements, opinions and data contained in all publications are solely those of the individual author(s) and contributor(s) and not of MDPI and/or the editor(s). MDPI and/or the editor(s) disclaim responsibility for any injury to people or property resulting from any ideas, methods, instructions or products referred to in the content. |
© 2024 by the authors. Licensee MDPI, Basel, Switzerland. This article is an open access article distributed under the terms and conditions of the Creative Commons Attribution (CC BY) license (http://creativecommons.org/licenses/by/4.0/).
Copyright: This open access article is published under a Creative Commons CC BY 4.0 license, which permit the free download, distribution, and reuse, provided that the author and preprint are cited in any reuse.


