
Submitted:
31 March 2025
Posted:
01 April 2025
You are already at the latest version
Abstract
The paper presents two procedures for creating 3D discrete models of apple using the finite element method (FEM). The study focused on a new Polish apple variety, Chopin at development, ripening, and senescence maturity stages. The analysis of the results allowed for the determination that, depending on the desired outcomes, the parenchymal tissue can be considered as a material with either elastic or elastoplastic properties. Model validation was performed using displacement-force relationships and changes in contact area as a function of loading force obtained from compression tests. Elastoplastic models reflected empirical studies much better. The fit of the elastic models, based on force vs. displacement curves, ranged from 79% to 83%, while the fit of the elastoplastic models to empirical data ranged from 91% to 96%. Elastic models, on the other hand, were well-suited to the modified force vs. displacement curves, which reflected the elastic behavior of apples under compression test. Contour plots of pressures for elastoplastic models aligned much better with the test results than those for elastic models. Similarly, in the case of contact area values, the elastoplastic models outperformed the elastic models, achieving a fit between 92% and 96%, while the elastic models reached only 82% to 83% compliance.
Keywords:
apple tissue biomechanics
; Finite element modeling in fruits
; Micro-CT bruise analysis
; mechanical properties of fruits
; fruit ripeness and mechanical properties
1. Introduction
Apples consist of various structural elements with differing mechanical properties, but the majority of their composition comprises edible parenchymatous tissue. It is precisely the quality of this tissue that primarily determines the suitability of fruit for consumption. The primary factors influencing the mechanical properties of apple parenchyma, which change during their ripening process, are the content of pectin and cellulose compounds. From a mechanical perspective, the plant cell wall can be regarded as a robust fibrous network that imparts a stable shape to each cell: a cellulose network resistant to tensile forces, a hemicellulose network resistant to shearing forces, and a pectin network resistant to compressive forces [1,2,3,4,5,6,7,8,9]. Moreover, the preservation of fruit freshness is significantly influenced by the content of malic and citric acids, with citric acid serving as a natural antioxidant that safeguards apples against the oxidation process, which results in a loss of quality. Moreover, the sugar degradation and water loss also contribute to the firmness and, consequently, the mechanical resistance of apples. [10,11,12,13,14,15,16,17,18]. Hence, it is of paramount importance to be aware of the physiological stage of the examined fruit when determining their mechanical properties for the construction and validation of FEM models. The most prevalent, straightforward, and cost-effective method for assessing the fruit's maturity stage of apples is the Streif Index, although it is gradually being replaced by the examination of ethylene concentration in seed chambers.
Numerical modelling is becoming increasingly popular tool in the field of fruit research. The Finite Element Method (FEM) is a numerical technique that enables the analysis of the fruit behaviour under variable loads and also to predict their damage. Numerical models are based on physical models that take into account various factors such as fruit geometry and the mechanical properties. Pascoal-Faria and Alves (2017) calculated the average elastic modulus, yield stress, and ultimate stress of apples by conducting compression tests. Unfortunately, the authors didn’t present the model validation. Celik, (2017) presented very interesting approach for identifying bruises through the application of a dynamic Finite Element Analysis (FEA) model, demonstrated using a pear as an example. The material data for the model were based on elastic modulus, Poisson's ratio, the yield point, and ultimate stress. However, the drop test modelling results in this article were not validated, and the mechanical properties of the fruit were determined based on quasi-static tests - according to the author with a measuring head speed ranging from 2.5 to 30 mm/min, without indicating a real value. Du et al., (2019) conducted an analysis for predicting bruising in kiwi fruit using a numerical method. They validated their results based on initial velocity, maximum deformation length, contact surface area, and simulated bruise volumes. Szyjewicz et al. (2021) developed a dynamic model of an apple with material properties resembling crushable foam (typically used for modelling low-density polymer foams). Furthermore, they opted to employ a volume-based material reinforcement procedure. In the material stiffening process, they set the yield point at 3 MPa with a deformation value of 1. The values for elastic modulus and Poisson's ratio were adapted from a different study [23], where authors subjected the models to drop tests on various types of surfaces. The model results underwent validation based on empirical data, including surface pressures, and force measurements.
To summarize, the Finite Element Method (FEM) enables the identification of factors influencing the mechanical properties of fruit, such as their shape, size, density, or stiffness, which is highly valuable in the process of designing new fruit processing equipment. However, it is essential to remember that simulation results can be considered reliable only after validation and confirmation that appropriate strength measurement techniques were used for the specific type of analysis (static/dynamic). Additionally, it is crucial to be aware of the ripeness stage of the fruit subjected to the study or to create models for multiple ripeness stages commonly found in the market right from the outset [24].
2. Materials and Methods
2.1. Material
The research material consisted of Chopin variety apples bred and harvested at the Experimental Orchards of the Warsaw University of Life Sciences in Wilanów. Both the description of the variety, its physicochemical properties, as well as the description of the method and the results of determining its strength properties are provided in another scientific article dedicated to studying the impact of fruit maturity stages on the mechanical properties of fruit for the purpose of building FEM models [24].
2.2. FEM Modelling
Using the Abaqus CAE program, a model of the apple compression process in quasi-static conditions was designed.
2.2.1. Model Geometry
Based on the averaged measurements of apple geometry, a fruit model consisting of three 3D geometric elements was designed - the core, flesh, and skin. The fruit had a diameter of 77.5 mm, a height of 64 mm, skin thickness of 0.6 mm, core diameter of 32 mm, and a core height of 39 mm. The model also included two steel plates, which served as a holder and a load cell. Both plates had dimensions of 100 × 50 mm and were 3D shell-type components with a thickness of 2 mm. The aforementioned elements of the model are described in Figure 1.
2.2.2. Defining Elastic Material Properties
The Young Modulus’ values of the flesh and skin were determined through strength tests, the same as Poisson’s Ratio values of the flesh. The mechanical testing methodology has been described in detail in another paper [24]. Due to the choice of a static method and, consequently, the lack of significant impact of the difference in the density of the peel and core on the model results, the density of whole fruit determined in the tests was assumed for both the peel, core and flesh. The elastic properties of the core were adopted from the article on finite element analysis of the dynamic collision of apple fruit [25], the same as value of Poisson’s ratio for skin. For the holder and the load cell, material properties characteristic of steel was adopted to reflect real measurement conditions. The elastic properties of both elastic and elastoplastic models are presented in Table 1.
2.2.3. Modeling Elastoplastic Material Behaviour
Elastoplastic models required the use of calibration of stress-strain curves obtained in the empirical research on the flesh (Figure 2) [24]. Then, the graphs calibrated (Figure 2b) in Abaqus CAE, based on the original stress-strain plots (Figure 2a), were used to determine the plastic points, using the calibration method: Elastic Plastic Isotropic Material Calibration Behaviour. The plastic points determined by the program are presented in Table 2. The results of elastic properties obtained during this procedure coincided with the values determined in tests with an accuracy of thousandths.
2.2.4. Configuration of Analysis in the Step Module
The model analysis type was set to static general; the properties were as follows time period: 1, NIgeom: on, initial increment size: 0.01, minimum increment size: 1·10-8, maximum increment size: 0.01, maximum number of increments 15,000.
2.2.5. Defining Contact in the Interaction Module
In the interaction module, the contact between steel plates and the fruit was determined. The interaction type was defined as "surface-to-surface contact (Standard)", while the discretization method was set as "node-to-surface". On the loading side, the plate surface was defined as the Master surface, while the fruit surface was defined as the Slave surface. On the passive side, the skin was assigned the Master surface, while the base was assigned the Slave surface (Figure 3). A value of 0.2 was assumed for the degree of smoothing for master surface. For tangential behaviour, a friction coefficient of 0.7 was set. Normal behaviour was defined as hard contact.
2.2.6. Boundary Conditions in the Load Module
Figure 4 contains a description of the sets to which boundary conditions have been assigned, while Table 3 contains their parameters.
The base was fixed in all directions. A concentrated force of 0.09 N was assigned to each node of the working element, allowing displacement only in the X-axis direction. The cross-section of the fruit was restricted from moving in the Z-axis direction and from rotating around the X and Y axes (Table 3).
2.2.7. Configuration of the Computational Mesh
The parenchyma tissue consisted of 91,908 elements of the C3D8 type and 1,656 elements of the C3D6 type. The epidermal tissue consisted of 11,983 elements of the C3D8 type and 216 elements of the C3D6 type. The seed nest consisted of 50,256 elements of the C3D8 type, 3,528 elements of the C3D6 type and 3,024 elements of the C3D4 type. To discretize both plates, 3,444 S4 elements were used.
2.3. Models’ Validation
2.3.1. Validation Based on Force vs. Displacement Graphs
The static analysis generated displacement and force versus time curves for specific model nodes, with time increments determined in the STEP module. To obtain direct force-displacement relationships, the time variable was eliminated using the "combine" command in Abaqus, assigning displacement to the X-axis and force to the Y-axis. The processed data were then transferred to Excel for comparison with experimental results.
Figure 5 presents the force vs. displacement curves for elastic and elastoplastic models at all stages of fruit maturity. These curves were used for validating the discrete models.
Elastic models were compared with both unprocessed test data and modified data (generated according to the methodology described by Słupska et al. (2024) [24]). Elastoplastic models were validated solely based on unprocessed test data.
2.3.2. Validation Based on the Change of Contact Area as a Function of Load
Pressure contours were determined at intervals of 50 N (± 2.5 N). This process required prior verification of the frame number assigned to a specific force. Due to the elliptical shape of the contours, pressure radii were measured along the Y and Z axes. The area was calculated using the formula for the area of an ellipse.
3. Results
3.1. Validation Based on Force vs. Displacement Graphs
As a result of the static analysis, data was obtained that allowed for the generation of displacement and force graphs as a function of time (for individual frames representing analysis increments) at the specified nodes of the model. Next, the graphs were combined by eliminating the X variable (time) and replacing it with displacement, while force was assigned to the Y axis. The data from the resulting graphs was copied into Excel sheets to compare it with test data.
3.1.1. Elastic Models
Figure 8 presents force-displacement graphs used in the initial validation process of elastic models. Solid lines represent the graphs obtained from model tests, while the dotted line represents the modified load-displacement graphs. The numerical calculation results for the elastic models were compared with the elastic properties of the material derived from the modified graphs. For both model data and processed test results, the development maturity stage is marked in green, the ripening maturity stage in orange, and the senescence maturity stage in blue. The processed graphs are labeled as "Modified test”.
The correlation analysis between the processed test data and the model results obtained for elastic models was conducted based on a scatter plot for displacement as a function of force (Figure 9). Force was the independent variable, while displacement was the dependent variable. The grouping variable was the individual stages of fruit maturity. The fit analysis of the models was based on the average deviation ranges of the model data from the test data, calculated in Excel. The averages of the deviations for all maturity stages were plotted on the scatter plots, while the average deviation values and model fit values for each maturity stage are presented in Table 4.
The average fit of the elastic models to the modified test results was 89%. The elastic model for the development maturity stage achieved the highest fit value of 91%. The model for the senescence maturity stage achieved the lowest value of 87%. The model for the ripening maturity stage achieved a fit value of 89%.
Figure 10 presents the force vs. displacement curves used for the second validation process of elastic models. Solid lines represent curves obtained from model studies, while markers indicate actual data from tests. For both model data and empirical results, green denotes the development maturity stage, orange represents the consumptive maturity stage, and blue denotes the physiological maturity stage.
Figure 11 shows the validation of elastic models based on empirical data, with the validation results summarized in Table 5.
The average fit of the elastic models to the actual test results was 80%. The highest fit value of 81% was achieved by the elastic model for the senescence maturity stage. The lowest fit value of 79% was achieved by the model for the ripening maturity stage. The model for the development maturity stage achieved a fit value of 80%.
3.1.1. Elastoplastic Models
Figure 12 presents force vs. displacement curves used in the validation process of elastoplastic models. Solid lines represent the curves obtained from model studies, while markers denote data from tests. For both model data and empirical results, the green color indicates the stage of development maturity, orange represents the stage of ripening maturity, and blue denotes the stage of senescence maturity.
Figure 13 presents the validation of elastoplastic models based on test data. The validation results, including average deviation values and model fit values, are summarized in Table 6.
The average fit of the elastoplastic models to the test results was 92%. The highest fit value of 94%was achieved by the elastoplastic model for the development maturity stage. The lowest value of 91% was achieved by the model for the senescence maturity stage. The model for the ripening maturity stage achieved a fit value of 93%.
3.1. Validation Based on the Change of Contact Area as a Function of Load
3.1.1. Elastic Models
Figure 14 shows example contour plots of pressures for both model results and empirical data.
Based on Figure 14, it can be concluded that the pressure distribution for elastic models does not match the test results. In empirical studies, at the initial stage of compression, the highest stress values were observed in the center of the contact area. In the subsequent stage (which followed the first local decrease in force, indicating the first permanent damage to the material), the highest stress values were observed at the edges of the contact area. This trend continued until the end of the test and was observed for all stages of fruit maturity. Figure 15 shows the contact area vs. force curves used in the validation process of elastic models. Solid lines represent curves obtained from model studies, while markers indicate empirical test results. For both model data and empirical results, green denotes the development maturity stage, orange represents the ripening maturity stage, and blue denotes the senescence maturity stage. Figure 16 presents the validation of elastic models based on test data. The validation results, including average deviation values and model fit values, are summarized in Table 7.
In Figure 15, it can be observed that the contact area results for models corresponding to development and ripening maturity stages were similar.
3.1.1. Elastoplastic Models
Figure 17 presents example contour plots of pressures for both model and empirical results.
Based on Figure 17, it can be concluded that the contour plots of pressures for elastoplastic models align much better with the test results. Similar to the empirical studies, at the initial stage of compression, the highest stress values are observed in the center of the contact area, while in the subsequent stage, the highest stress values are observed at the edges of the contact area. This trend continued until the end of the test and was observed for all stages of fruit maturity.
Figure 18 shows the contact area vs. force curves used for the validation process of elastoplastic models. Solid lines represent curves obtained from model studies, while markers indicate empirical test results. Figure 19 presents the validation of elastoplastic models based on test data. The validation results, including average deviation values and model fit values, are summarized in Table 8.
The average fit of the elastoplastic models to the test results was 95%. The highest fit value of 96% was achieved by the elastoplastic models for the development and ripening maturity stages. The lowest fit value of 82% was achieved by the model for the senescence maturity stage.
Conclusions
- Elastoplastic models reflect empirical studies much better. The fit of the elastic models, based on force vs. displacement curves, ranged from 79% to 83%, while the fit of the elastoplastic models to empirical data ranged from 91% to 96%.
- Elastic models, on the other hand, are well-suited to the modified force vs. displacement values, which reflect the elastic behavior of apples during compression. The fit values for these models, based on force vs. displacement curves, ranged from 87% to 91%.
- Contour plots of pressures for elastoplastic models align much better with the test results than those for elastic models.
- Similarly, in the case of contact area values, the elastoplastic models outperformed the elastic models, achieving a fit between 92% and 96%, while the elastic models reached only 82% to 83% compliance.
Author Contributions
Conceptualization, M.S. and R.S.; methodology, M.S.; software, M.S.; validation, M.S.; formal analysis, M.S.; investigation, M.S.; resources, M.S.; data curation, M.S.; writing—original draft preparation, M.S. and A.F.; writing—review and editing, M.S and A.F..; visualization, M.S.; supervision, R.S.; project administration, M.S.; funding acquisition, M.S and A.F. All authors have read and agreed to the published version of the manuscript.”.
Funding
This work was supported by the Polish National Science Centre [2021/41/N/NZ9/02874].
Data Availability Statement
Data will be made available on request.
Conflicts of Interest
The authors declare no conflicts of interest.
References
- Bich, L.; Pradeu, T.; Moreau, J.F. Understanding Multicellularity: The Functional Organization of the Intercellular Space. Front Physiol 2019, 10. [CrossRef]
- Billy, L.; Mehinagic, E.; Royer, G.; Renard, C.M.G.C.; Arvisenet, G.; Prost, C.; Jourjon, F. Relationship between Texture and Pectin Composition of Two Apple Cultivars during Storage. Postharvest Biol Technol 2008. [CrossRef]
- Mccann1, M.C.; Roberts, K. Changes in Cell Wall Architecture during Cell Elongation; 1994; Vol. 45. [CrossRef]
- Willats, W.G.T.; Mccartney, L.; Mackie, W.; Knox, J.P. Pectin: Cell Biology and Prospects for Functional Analysis; 2001; Vol. 47. [CrossRef]
- Renard, C.M.G.C.; Voragen, A.G.J.; Thibault, J.-E.; Pilnik, & W. Studies on Apple Protopeetin. IV: Apple Xyloglueans and Influence of Pectin Extraction Treatments on Their Solubility; 1991; Vol. 15. [CrossRef]
- Videcoq, P.; Barbacci, A.; Assor, C.; Magnenet, V.; Arnould, O.; Le Gall, S.; Lahaye, M. Examining the Contribution of Cell Wall Polysaccharides to the Mechanical Properties of Apple Parenchyma Tissue Using Exogenous Enzymes. J Exp Bot 2017, 68, 5137–5146. [CrossRef]
- Oey, M.; Vanstreels, E.; Debaerdemaeker, J.; Tijskens, B.; Ramon, H.; Nicolaï, B.M. Influence of Turgor on Micromechanical and Structural Properties of Apple Tissue. In Proceedings of the 13th World Congress of Food Science & Technology; EDP Sciences: Les Ulis, France, 2006. [CrossRef]
- Matas, A.J.; López-Casado, G.; Cuartero, J.; Heredia, A. Relative Humidity and Temperature Modify the Mechanical Properties of Isolated Tomato Fruit Cuticles. Am J Bot 2005, 92, 462–468. [CrossRef]
- Perini, M.A.; Sin, I.N.; Martinez, G.A.; Civello, P.M. Measurement of Expansin Activity and Plant Cell Wall Creep by Using a Commercial Texture Analyzer. Electronic Journal of Biotechnology 2017, 26, 12–19. [CrossRef]
- Alamar, M.C.; Vanstreels, E.; Oey, M.L.; Moltó, E.; Nicolaï, B.M. Micromechanical Behaviour of Apple Tissue in Tensile and Compression Tests: Storage Conditions and Cultivar Effect. J Food Eng 2008, 86, 324–333. [CrossRef]
- Wei, J.; Ma, F.; Shi, S.; Qi, X.; Zhu, X.; Yuan, J. Changes and Postharvest Regulation of Activity and Gene Expression of Enzymes Related to Cell Wall Degradation in Ripening Apple Fruit. Postharvest Biol Technol 2010, 56, 147–154. [CrossRef]
- Opara, L.U. Bruise Susceptibilities of “Gala” Apples as Affected by Orchard Management Practices and Harvest Date. Postharvest Biol Technol 2007, 43. [CrossRef]
- Winisdorffer, G.; Musse, M.; Quellec, S.; Barbacci, A.; Gall, S. Le; Mariette, F.; Lahaye, M. Analysis of the Dynamic Mechanical Properties of Apple Tissue and Relationships with the Intracellular Water Status, Gas Distribution, Histological Properties and Chemical Composition. Postharvest Biol Technol 2015, 104, 1–16. [CrossRef]
- Konopacka, D.; Plocharski, W.J. Effect of Storage Conditions on the Relationship between Apple Firmness and Texture Acceptability. Postharvest Biol Technol 2004, 32, 205–211. [CrossRef]
- Singh, F.; Katiyar, V.K.; Singh, B.P. Analytical Study of Turgor Pressure in Apple and Potato Tissues. Postharvest Biol Technol 2014, 89, 44–48. [CrossRef]
- Mayorga-Martínez, A.A.; Olvera-Trejo, D.; Elías-Zúñiga, A.; Parra-Saldívar, R.; Chuck-Hernández, C. Non-Destructive Assessment of Guava (Psidium Guajava L.) Maturity and Firmness Based on Mechanical Vibration Response. Food Bioproc Tech 2016, 9, 1471–1480. [CrossRef]
- Contigiani, E. V.; Jaramillo-Sánchez, G.; Castro, M.A.; Gómez, P.L.; Alzamora, S.M. Postharvest Quality of Strawberry Fruit (Fragaria x Ananassa Duch Cv. Albion) as Affected by Ozone Washing: Fungal Spoilage, Mechanical Properties, and Structure. Food Bioproc Tech 2018, 11, 1639–1650. [CrossRef]
- Pathare, P.B.; Opara, U.L.; Vigneault, C.; Delele, M.A.; Al-Said, F.A.J. Design of Packaging Vents for Cooling Fresh Horticultural Produce. Food Bioproc Tech 2012, 5, 2031–2045. [CrossRef]
- Pascoal-Faria, P.; Alves, N. Studying Apple Bruise Using a Finite Element Method Analysis. In Proceedings of the AIP Conference Proceedings; American Institute of Physics Inc., July 21 2017; Vol. 1863. [CrossRef]
- Celik, H.K. Determination of Bruise Susceptibility of Pears (Ankara Variety) to Impact Load by Means of FEM-Based Explicit Dynamics Simulation. Postharvest Biol Technol 2017, 128, 83–97. [CrossRef]
- Du, D.; Wang, B.; Wang, J.; Yao, F.; Hong, X. Prediction of Bruise Susceptibility of Harvested Kiwifruit (Actinidia Chinensis) Using Finite Element Method. Postharvest Biol Technol 2019, 152, 36–44. [CrossRef]
- Szyjewicz, D.; Kuta, Ł.; Działak, P.; Stopa, R. An Attempt to Model the Surface Pressures of Apples Using the Finite Element Method. Applied Sciences (Switzerland) 2021, 11. [CrossRef]
- Komarnicki, P.; Stopa, R.; Szyjewicz, D.; Kuta, Ł.; Klimza, T. Influence of Contact Surface Type on the Mechanical Damages of Apples Under Impact Loads. Food Bioproc Tech 2017, 10, 1479–1494. [CrossRef]
- Słupska, M.; Stopa, R.; Figiel, A. Ripening Stage in Mechanical Properties of Chopin Apples for FEM Model Construction. [CrossRef]
- Dintwa, E.; Van Zeebroeck, M.; Ramon, H.; Tijskens, E. Finite Element Analysis of the Dynamic Collision of Apple Fruit. Postharvest Biol Technol 2008, 49, 260–276. [CrossRef]
Figure 1.
Parts included in the discrete model assembly.
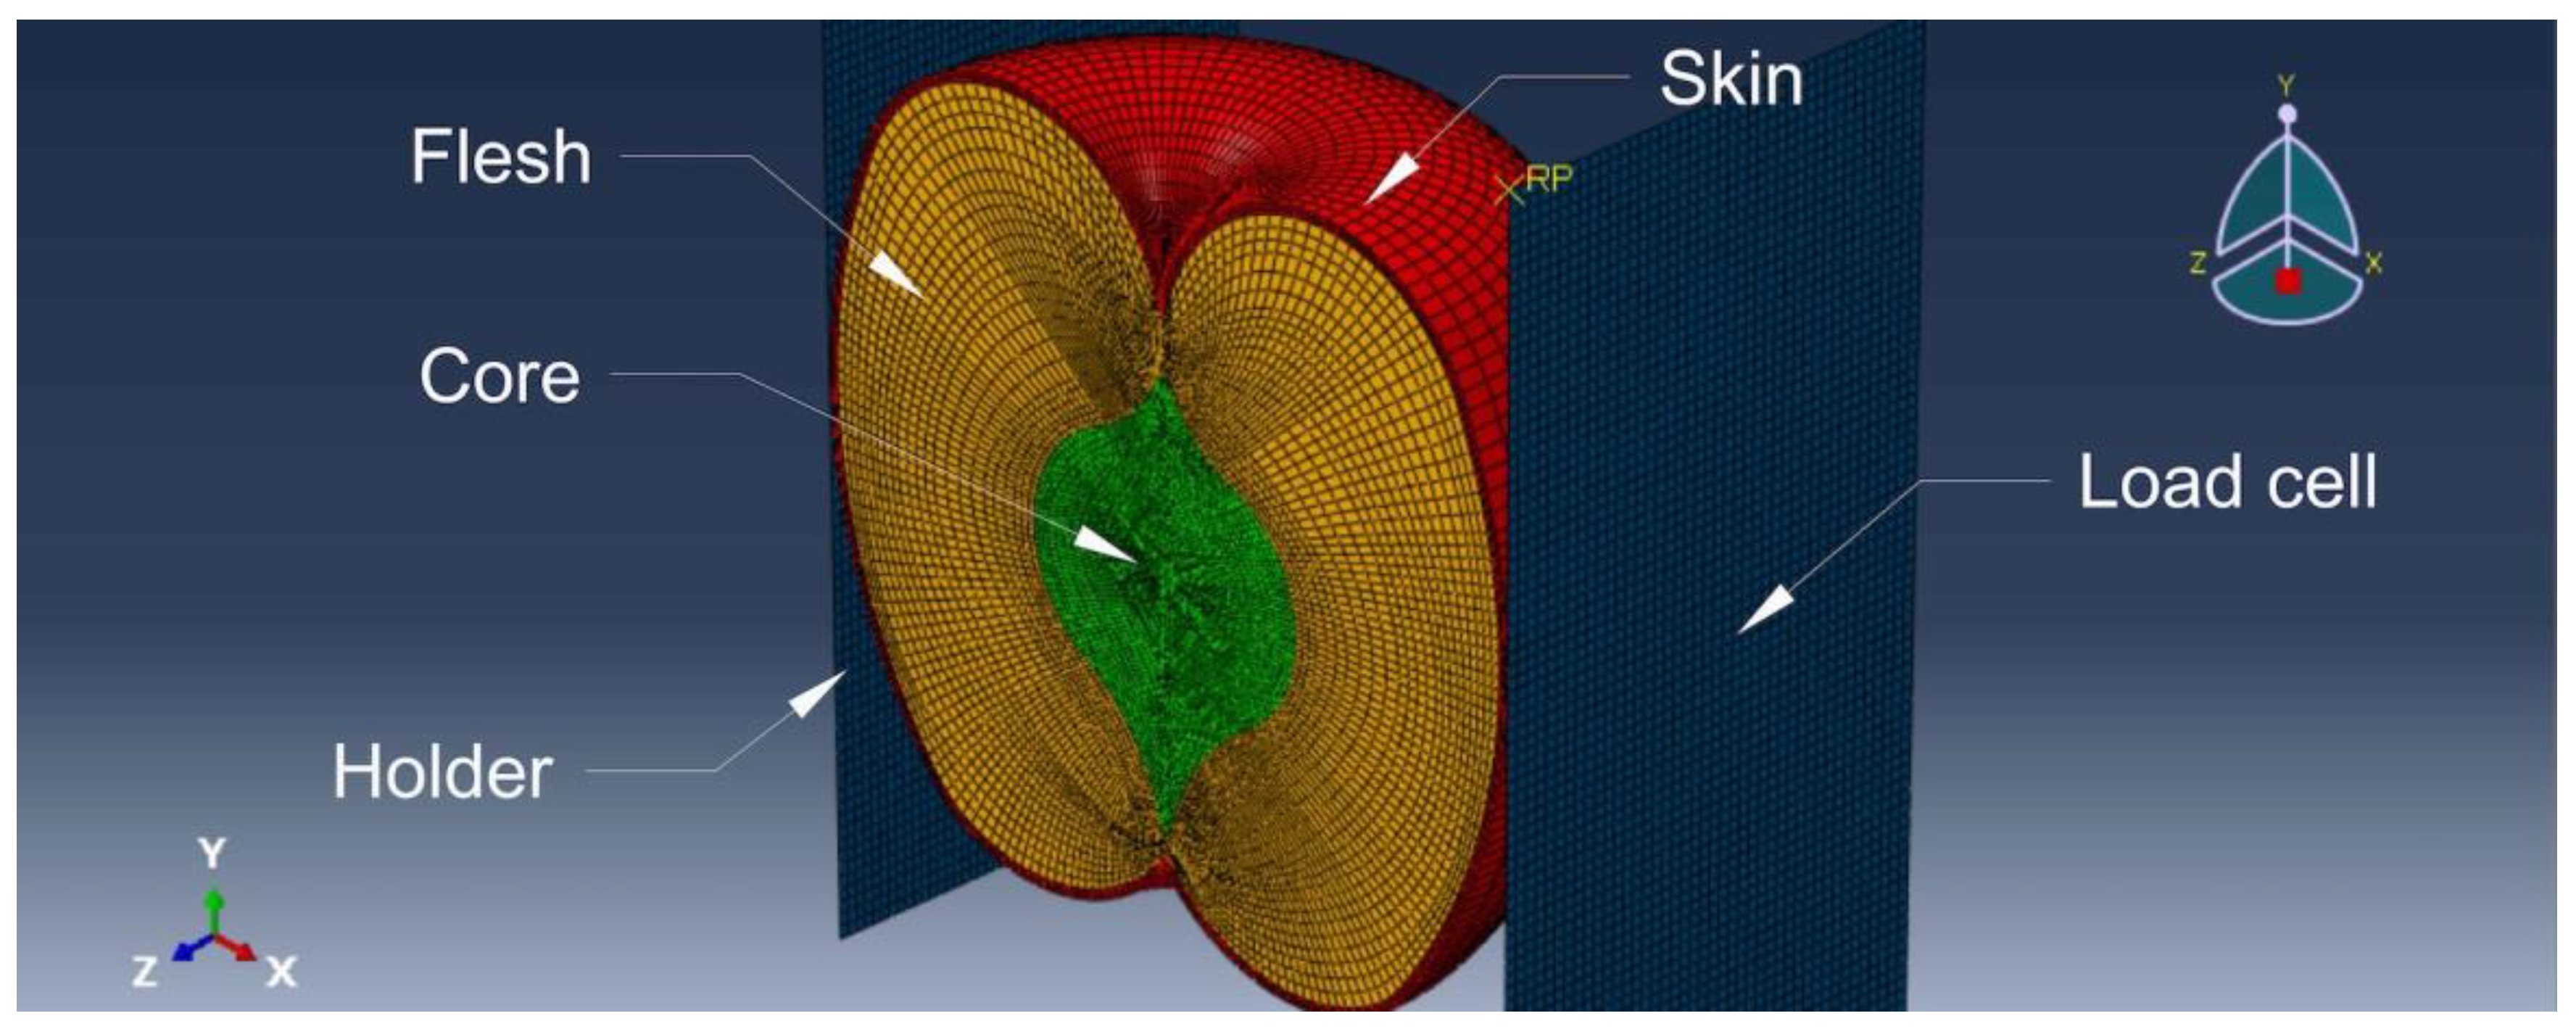
Figure 2.
Stress vs. strain graphs: (a) graphs of average stress values as a function of parenchyma tissue strain at individual stages of fruit physiological development, (b) graphs calibrated by the program using the Elastic Plastic Isotropic Material Calibration Behaviour method.
Figure 2.
Stress vs. strain graphs: (a) graphs of average stress values as a function of parenchyma tissue strain at individual stages of fruit physiological development, (b) graphs calibrated by the program using the Elastic Plastic Isotropic Material Calibration Behaviour method.
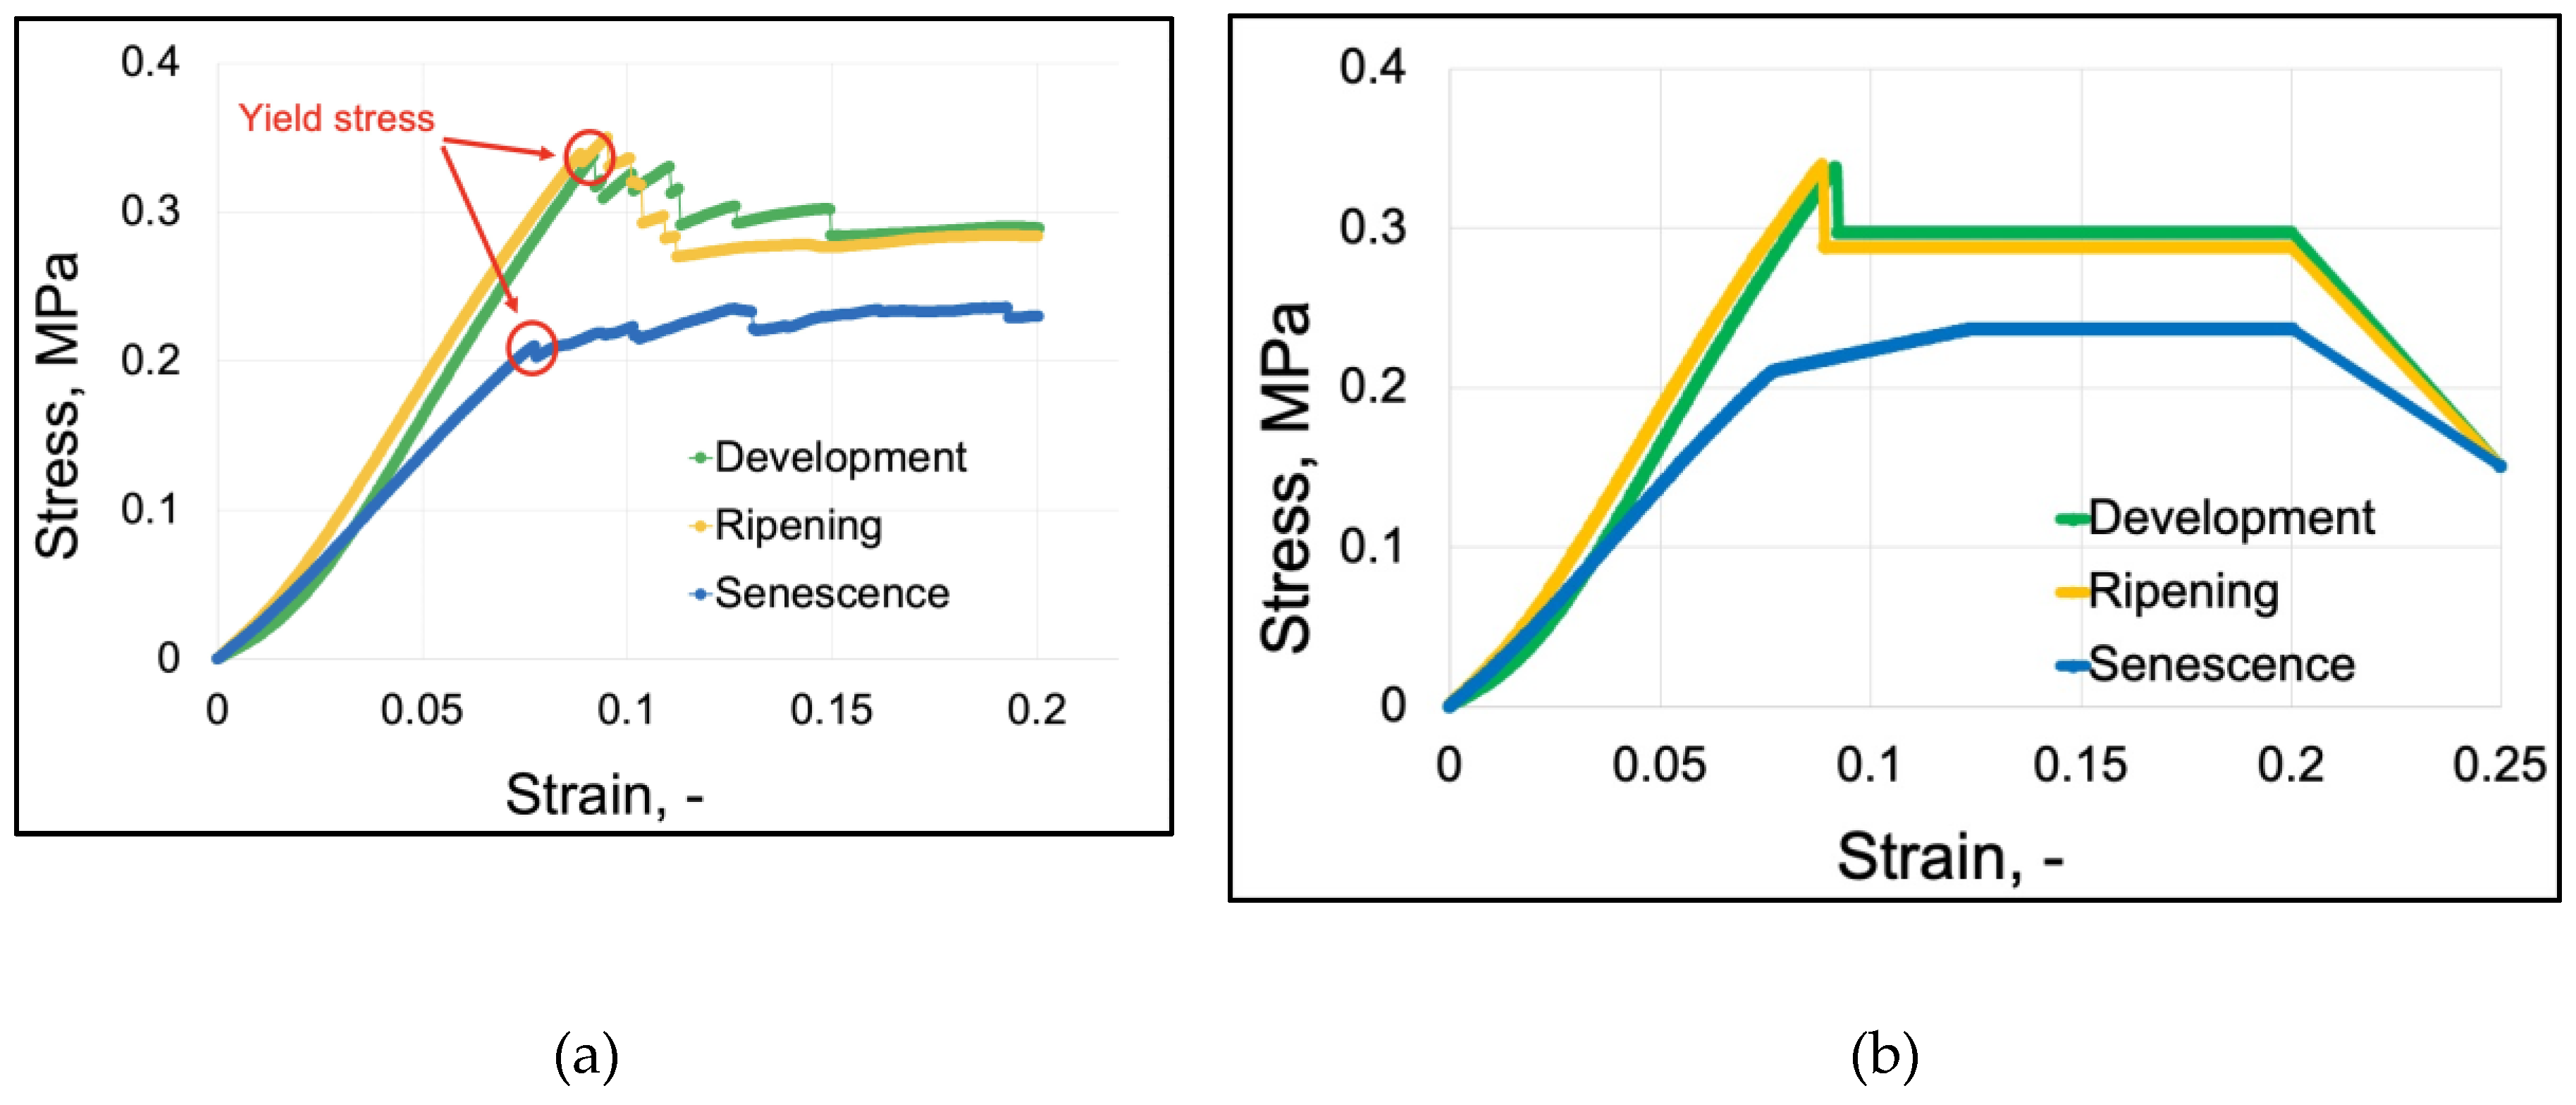
Figure 3.
Diagram of the contact modelling method.
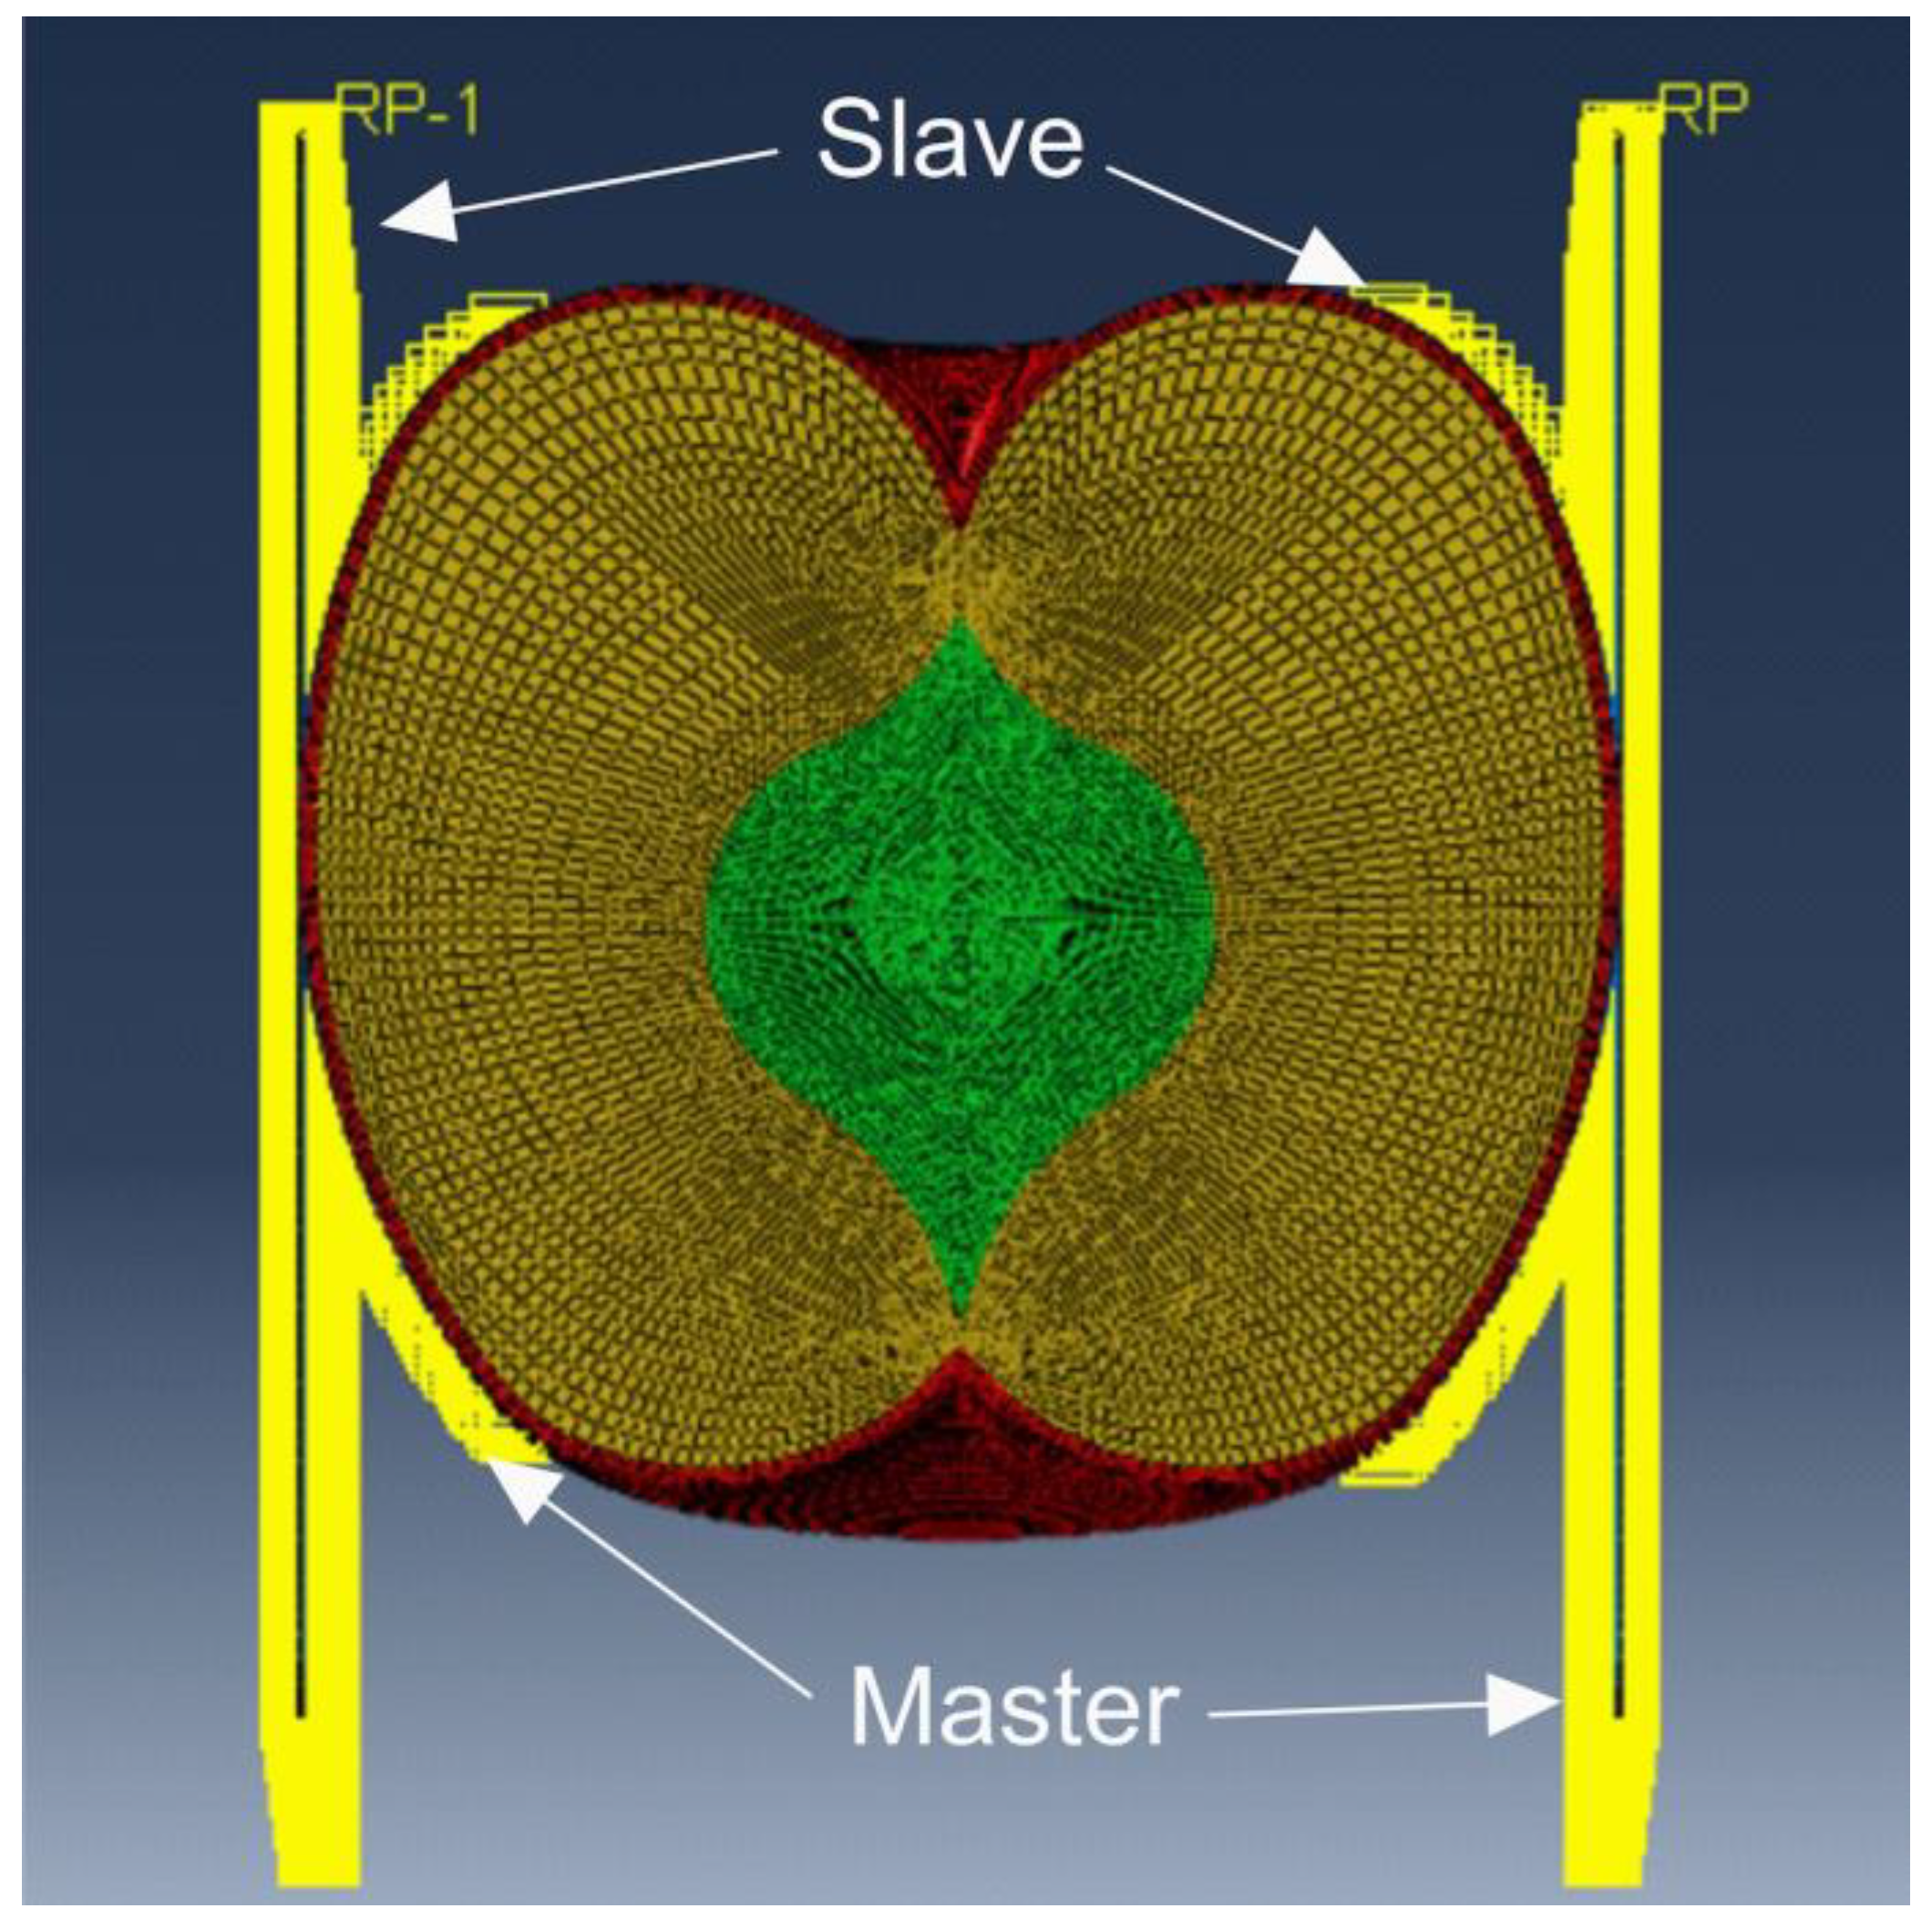
Figure 4.
Description of the sets used to model the boundary conditions.
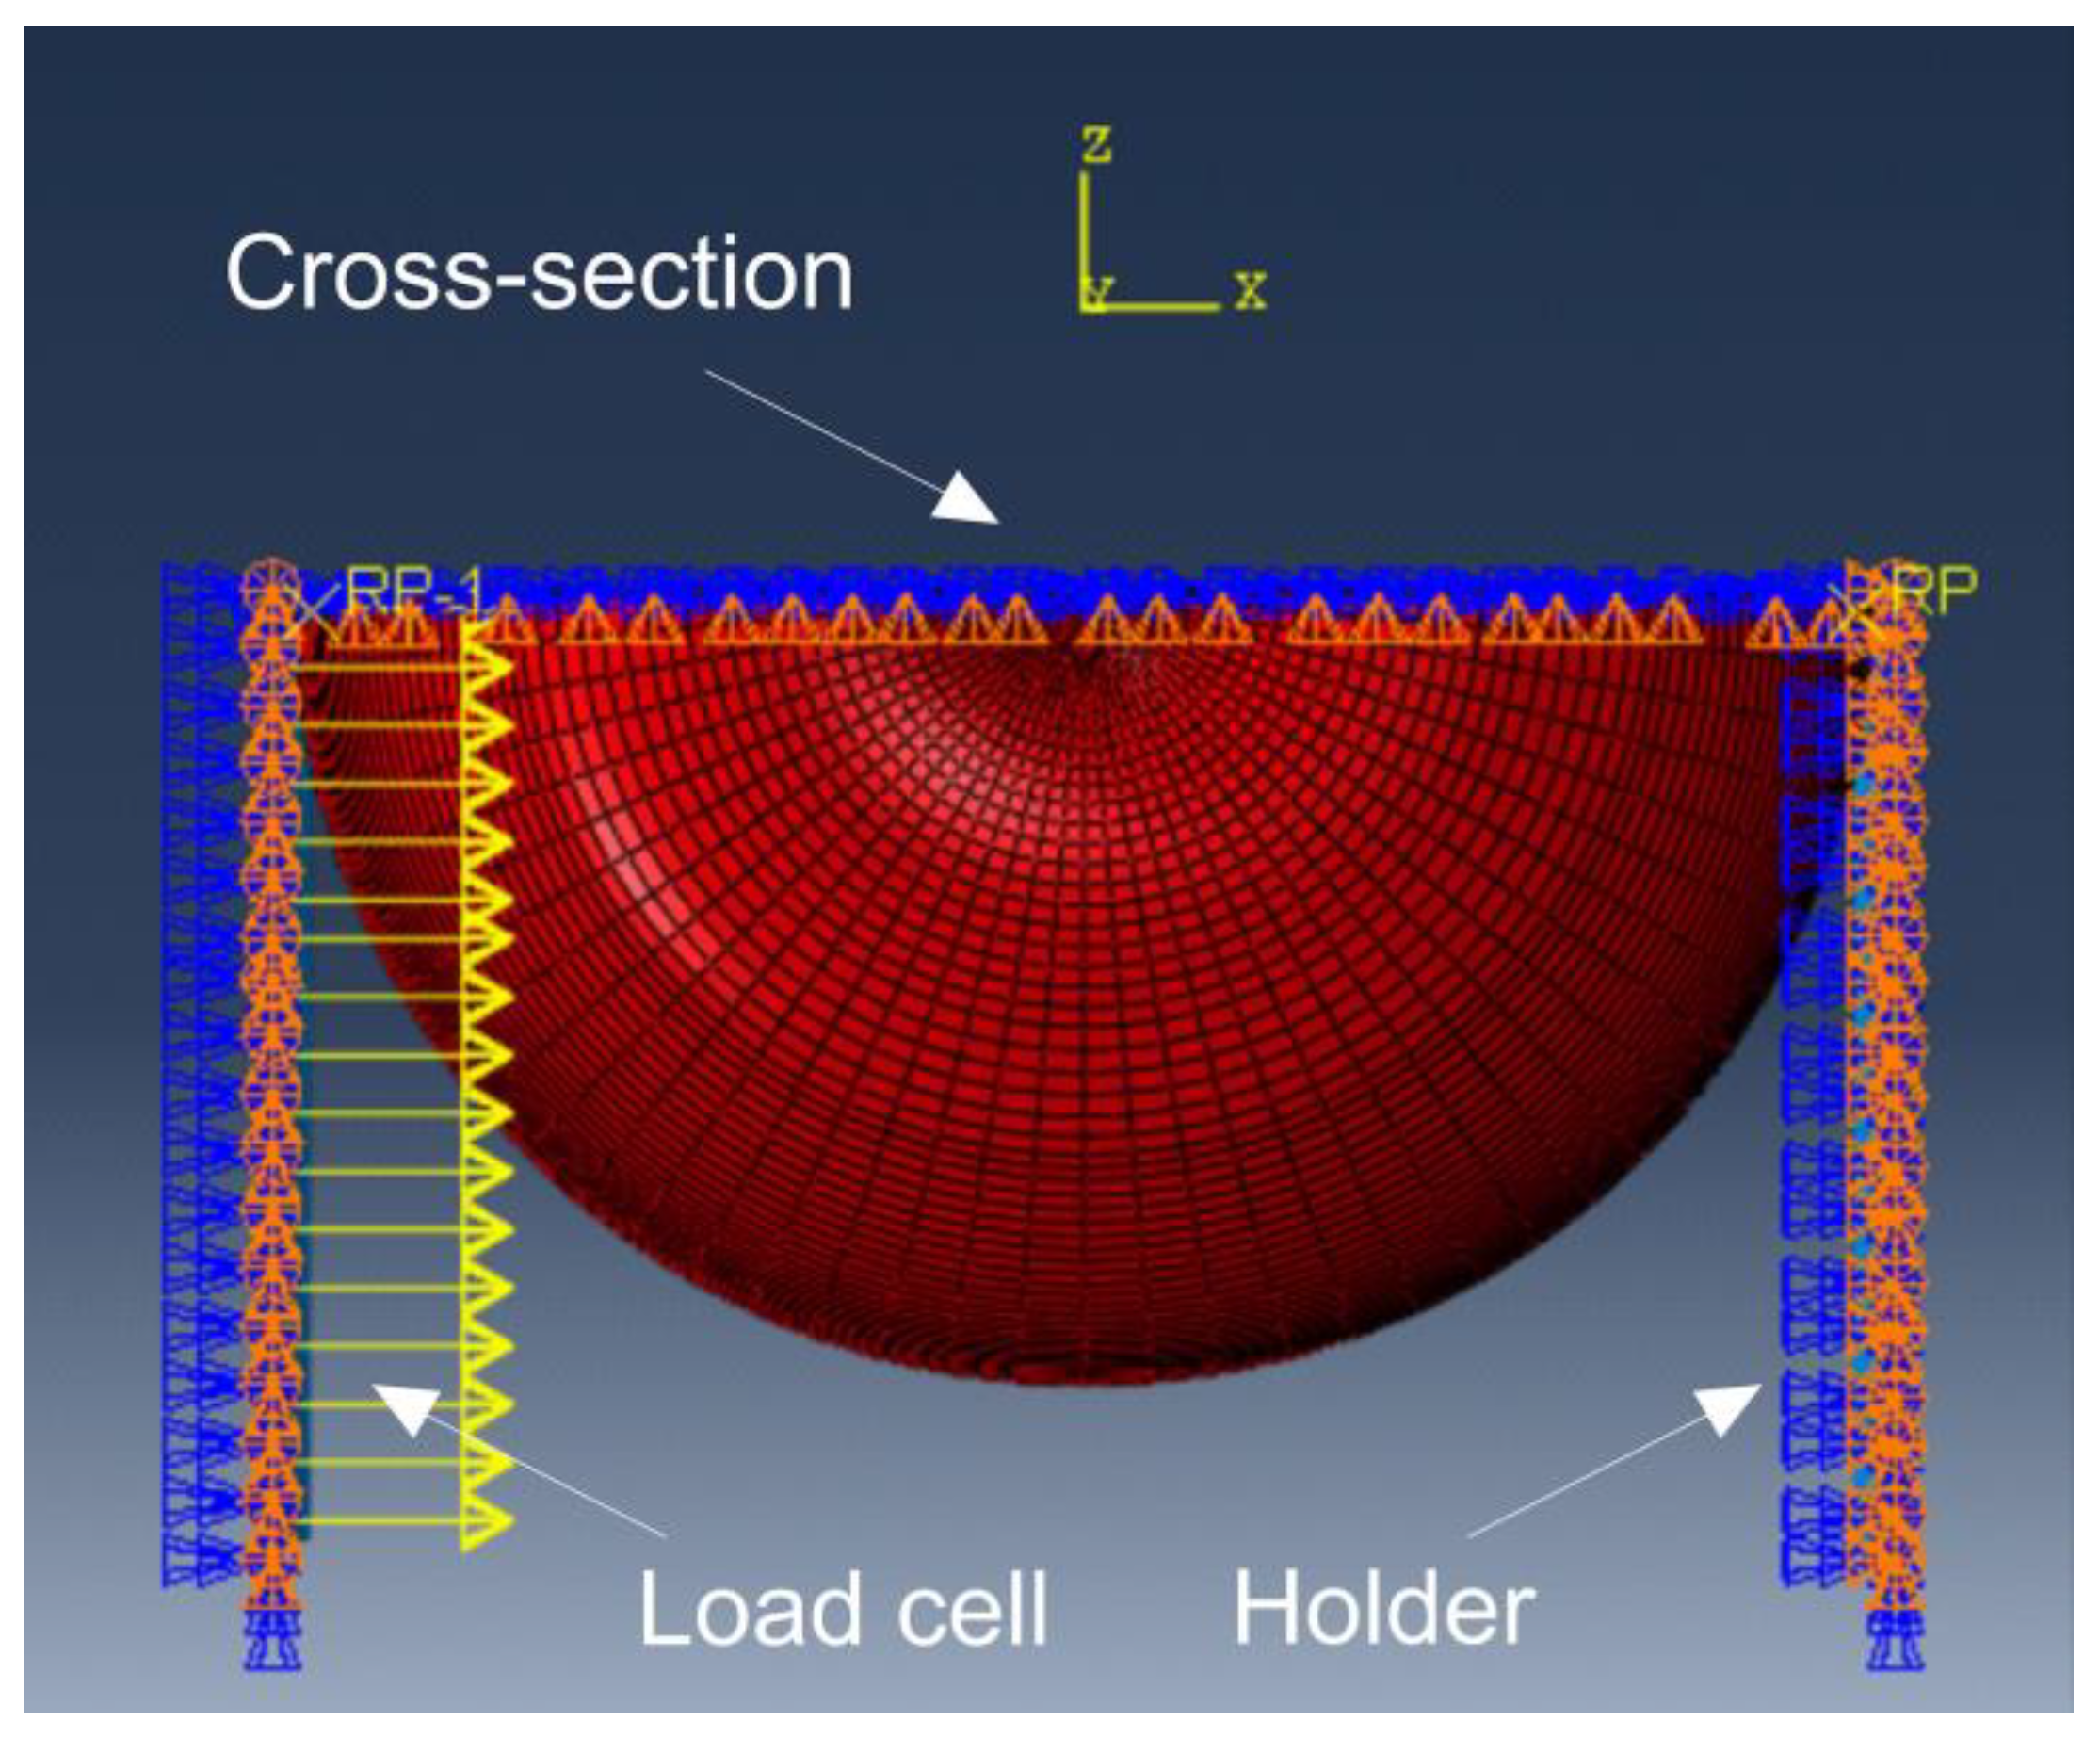
Figure 5.
Force vs. displacement curves for all model variants.
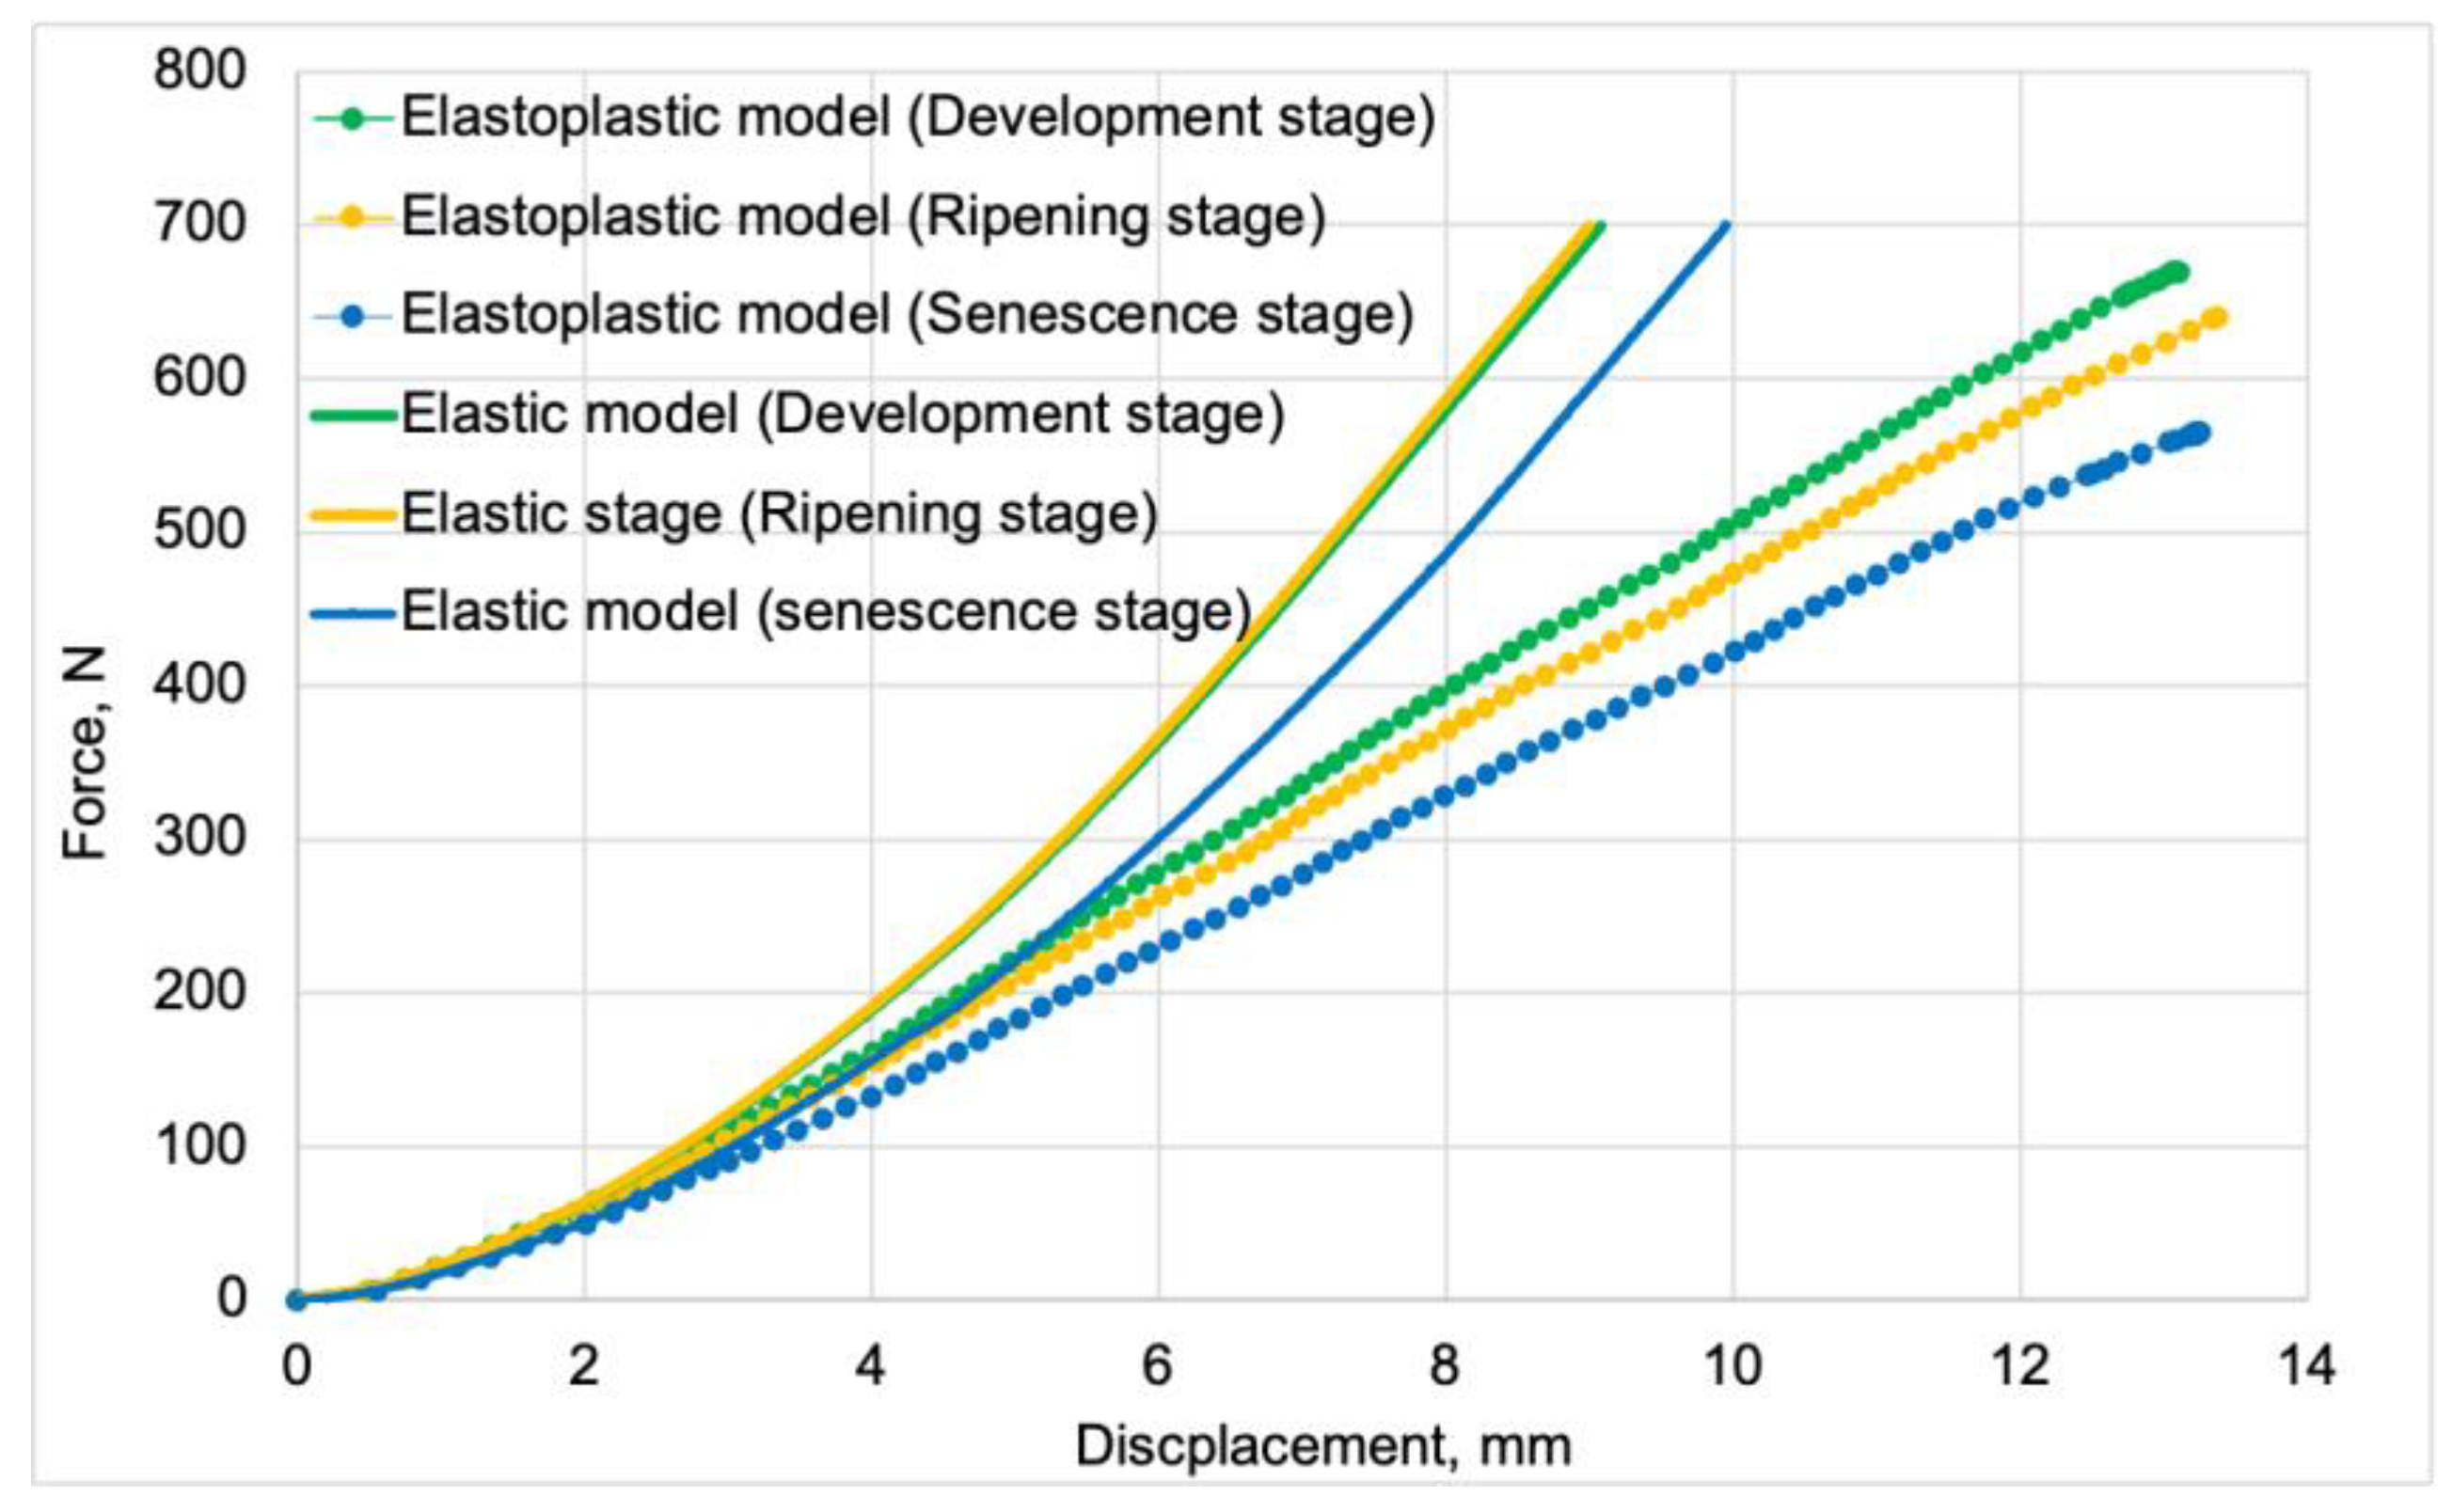
Figure 6.
Example contour plots of pressures obtained for the validation of discrete models.
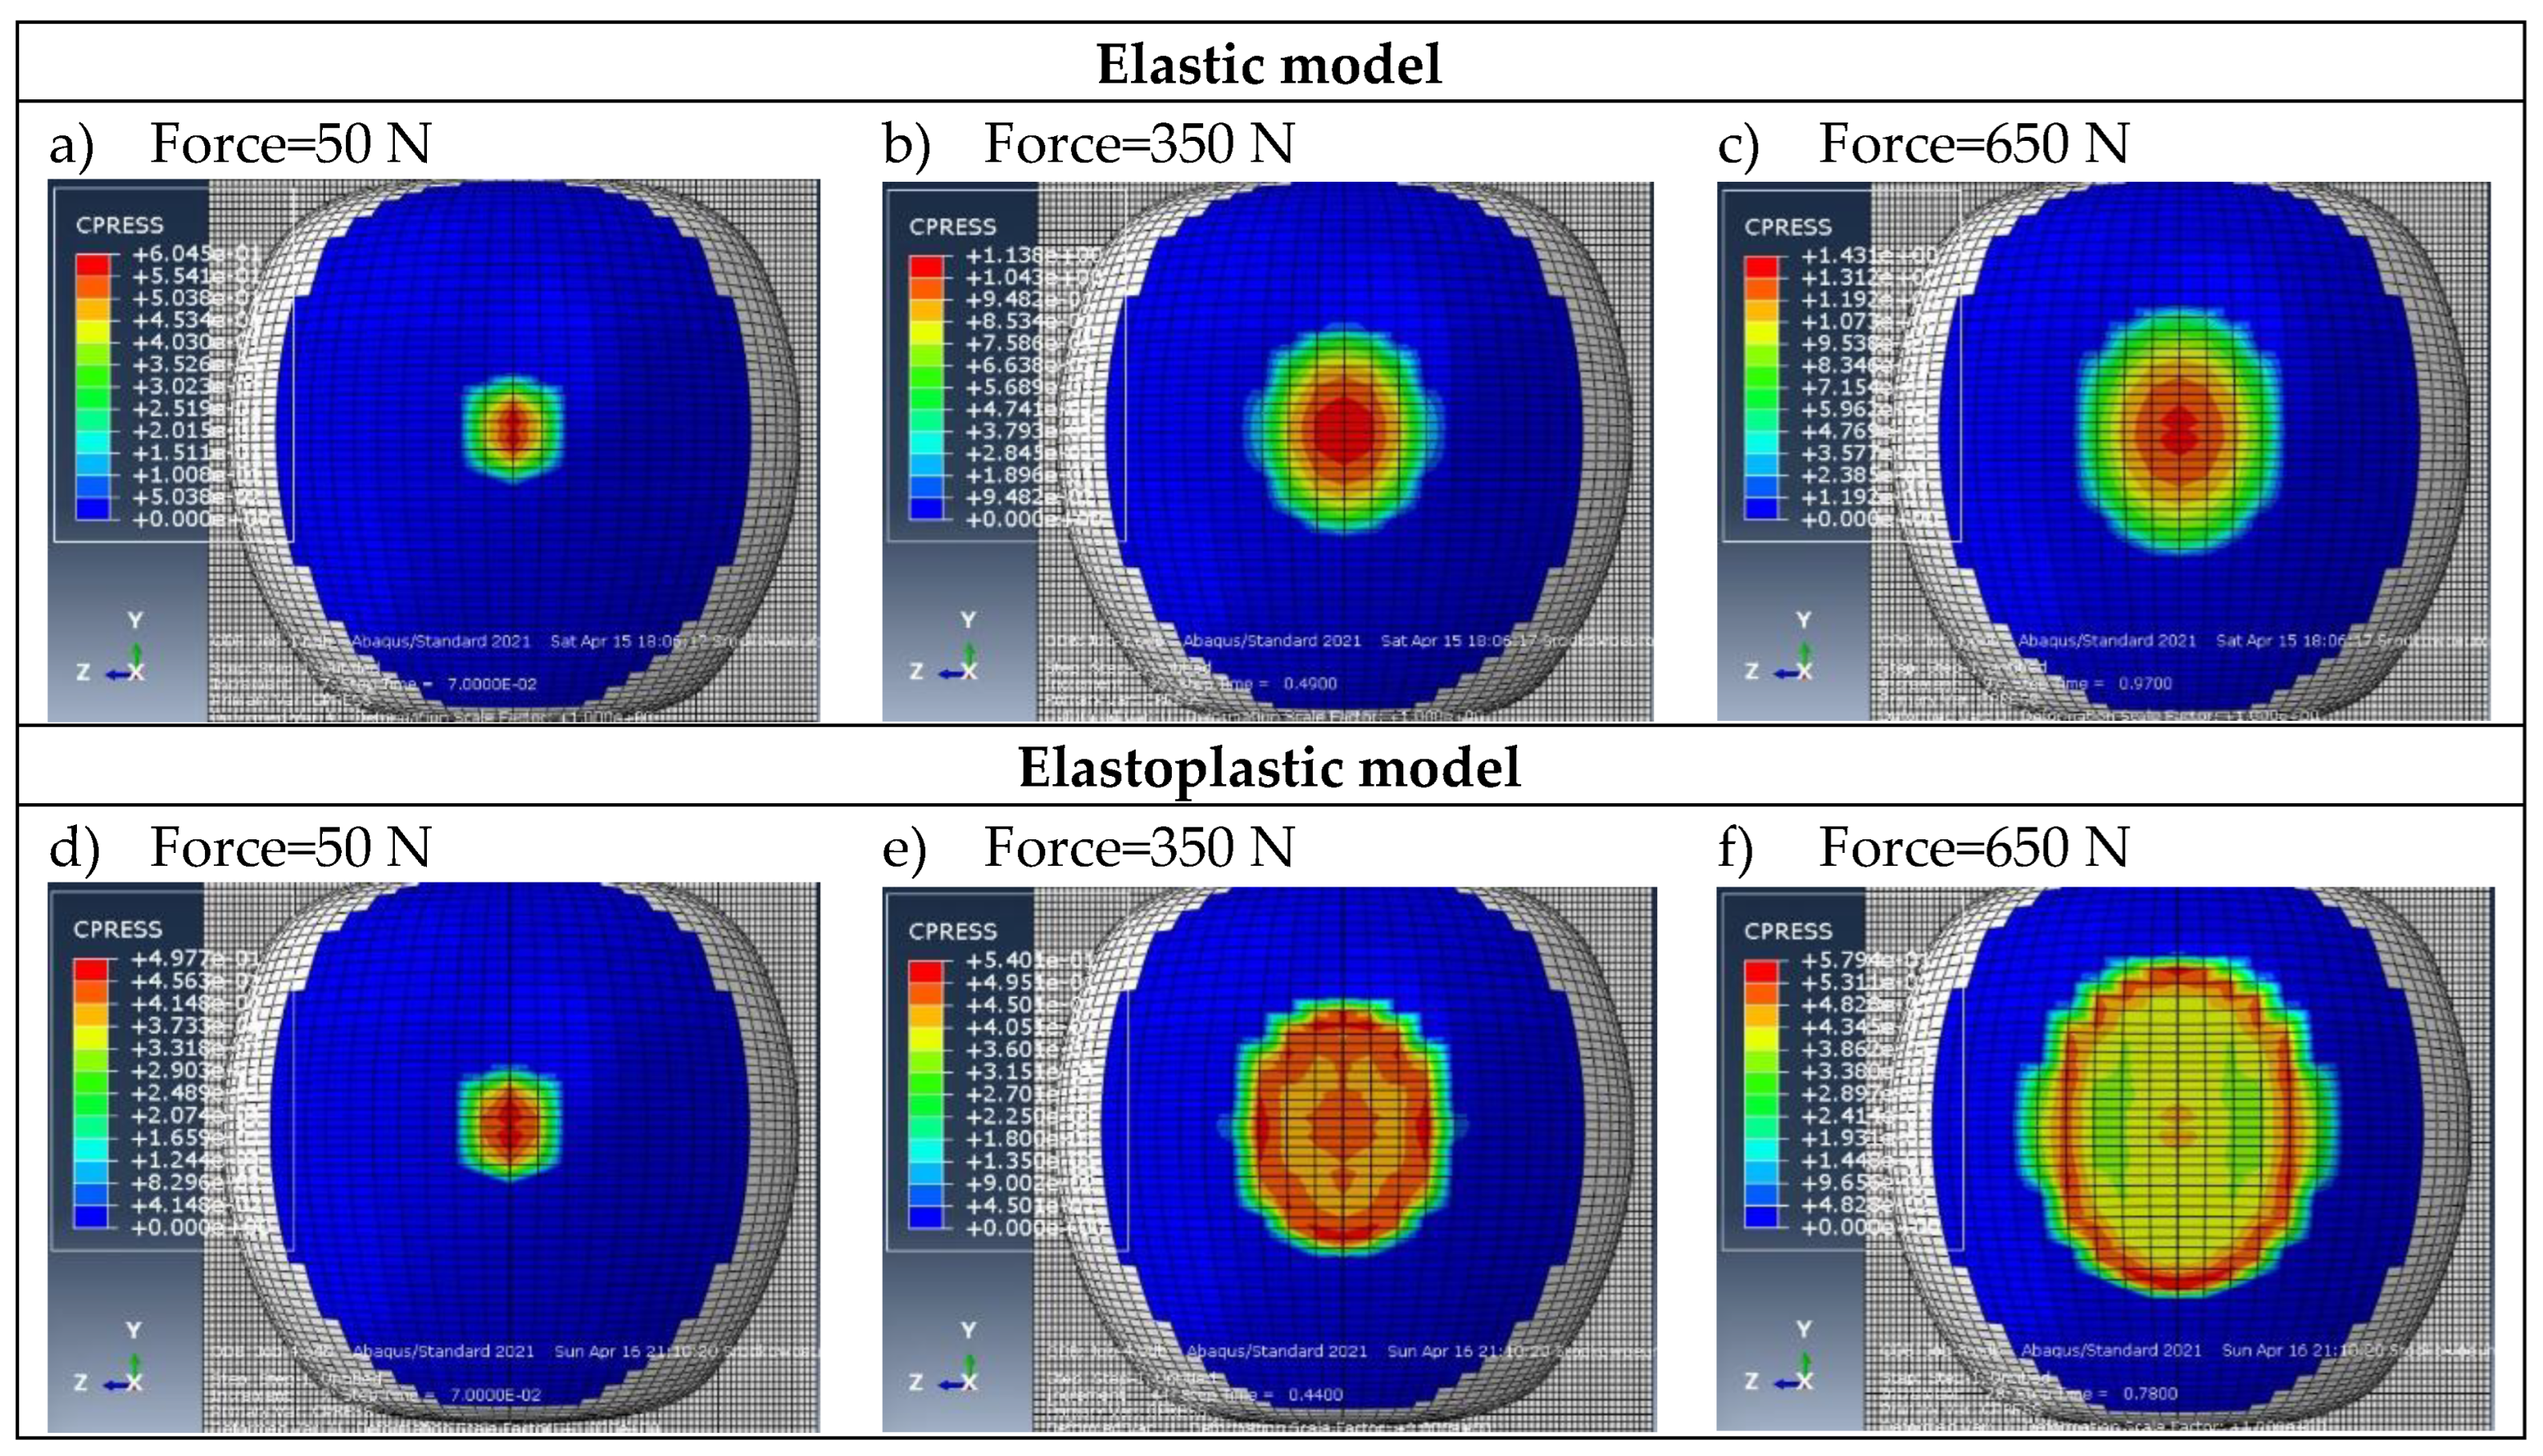
Figure 7.
Contact area vs. force curves obtained for the validation of elastic models.
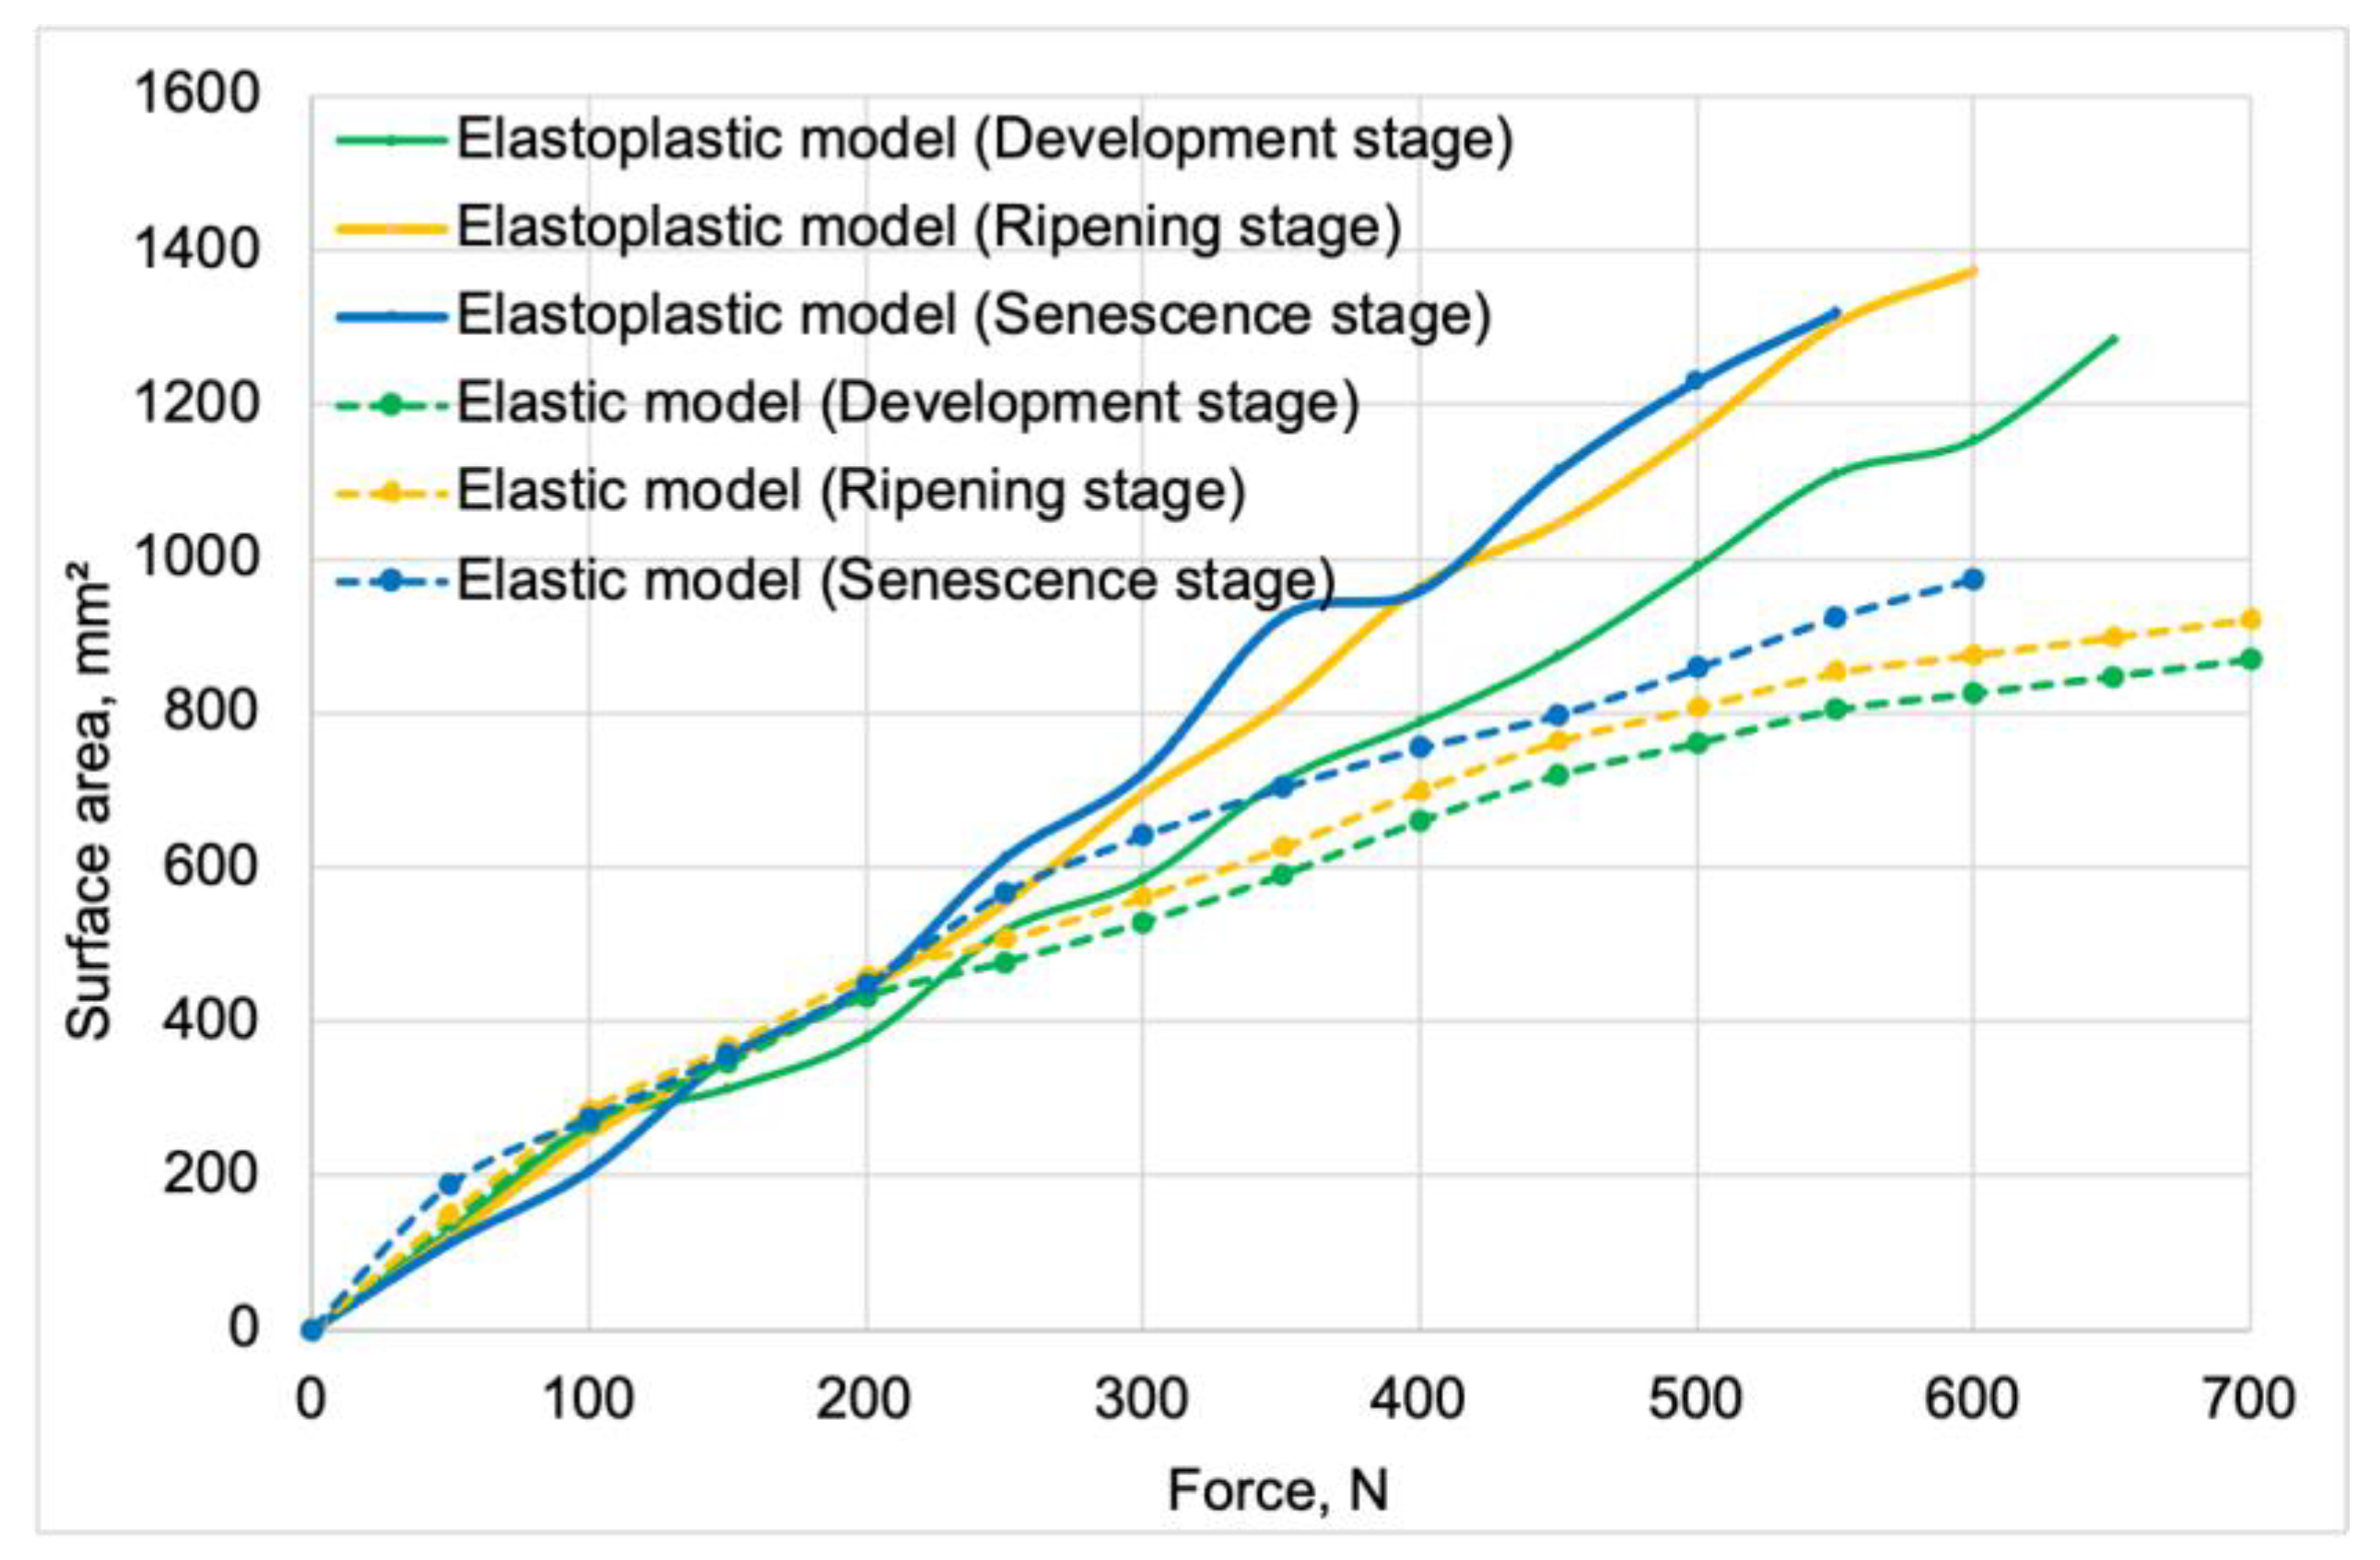
Figure 8.
Force-displacement graphs used for the validation of elastic models based on modified test results.
Figure 8.
Force-displacement graphs used for the validation of elastic models based on modified test results.
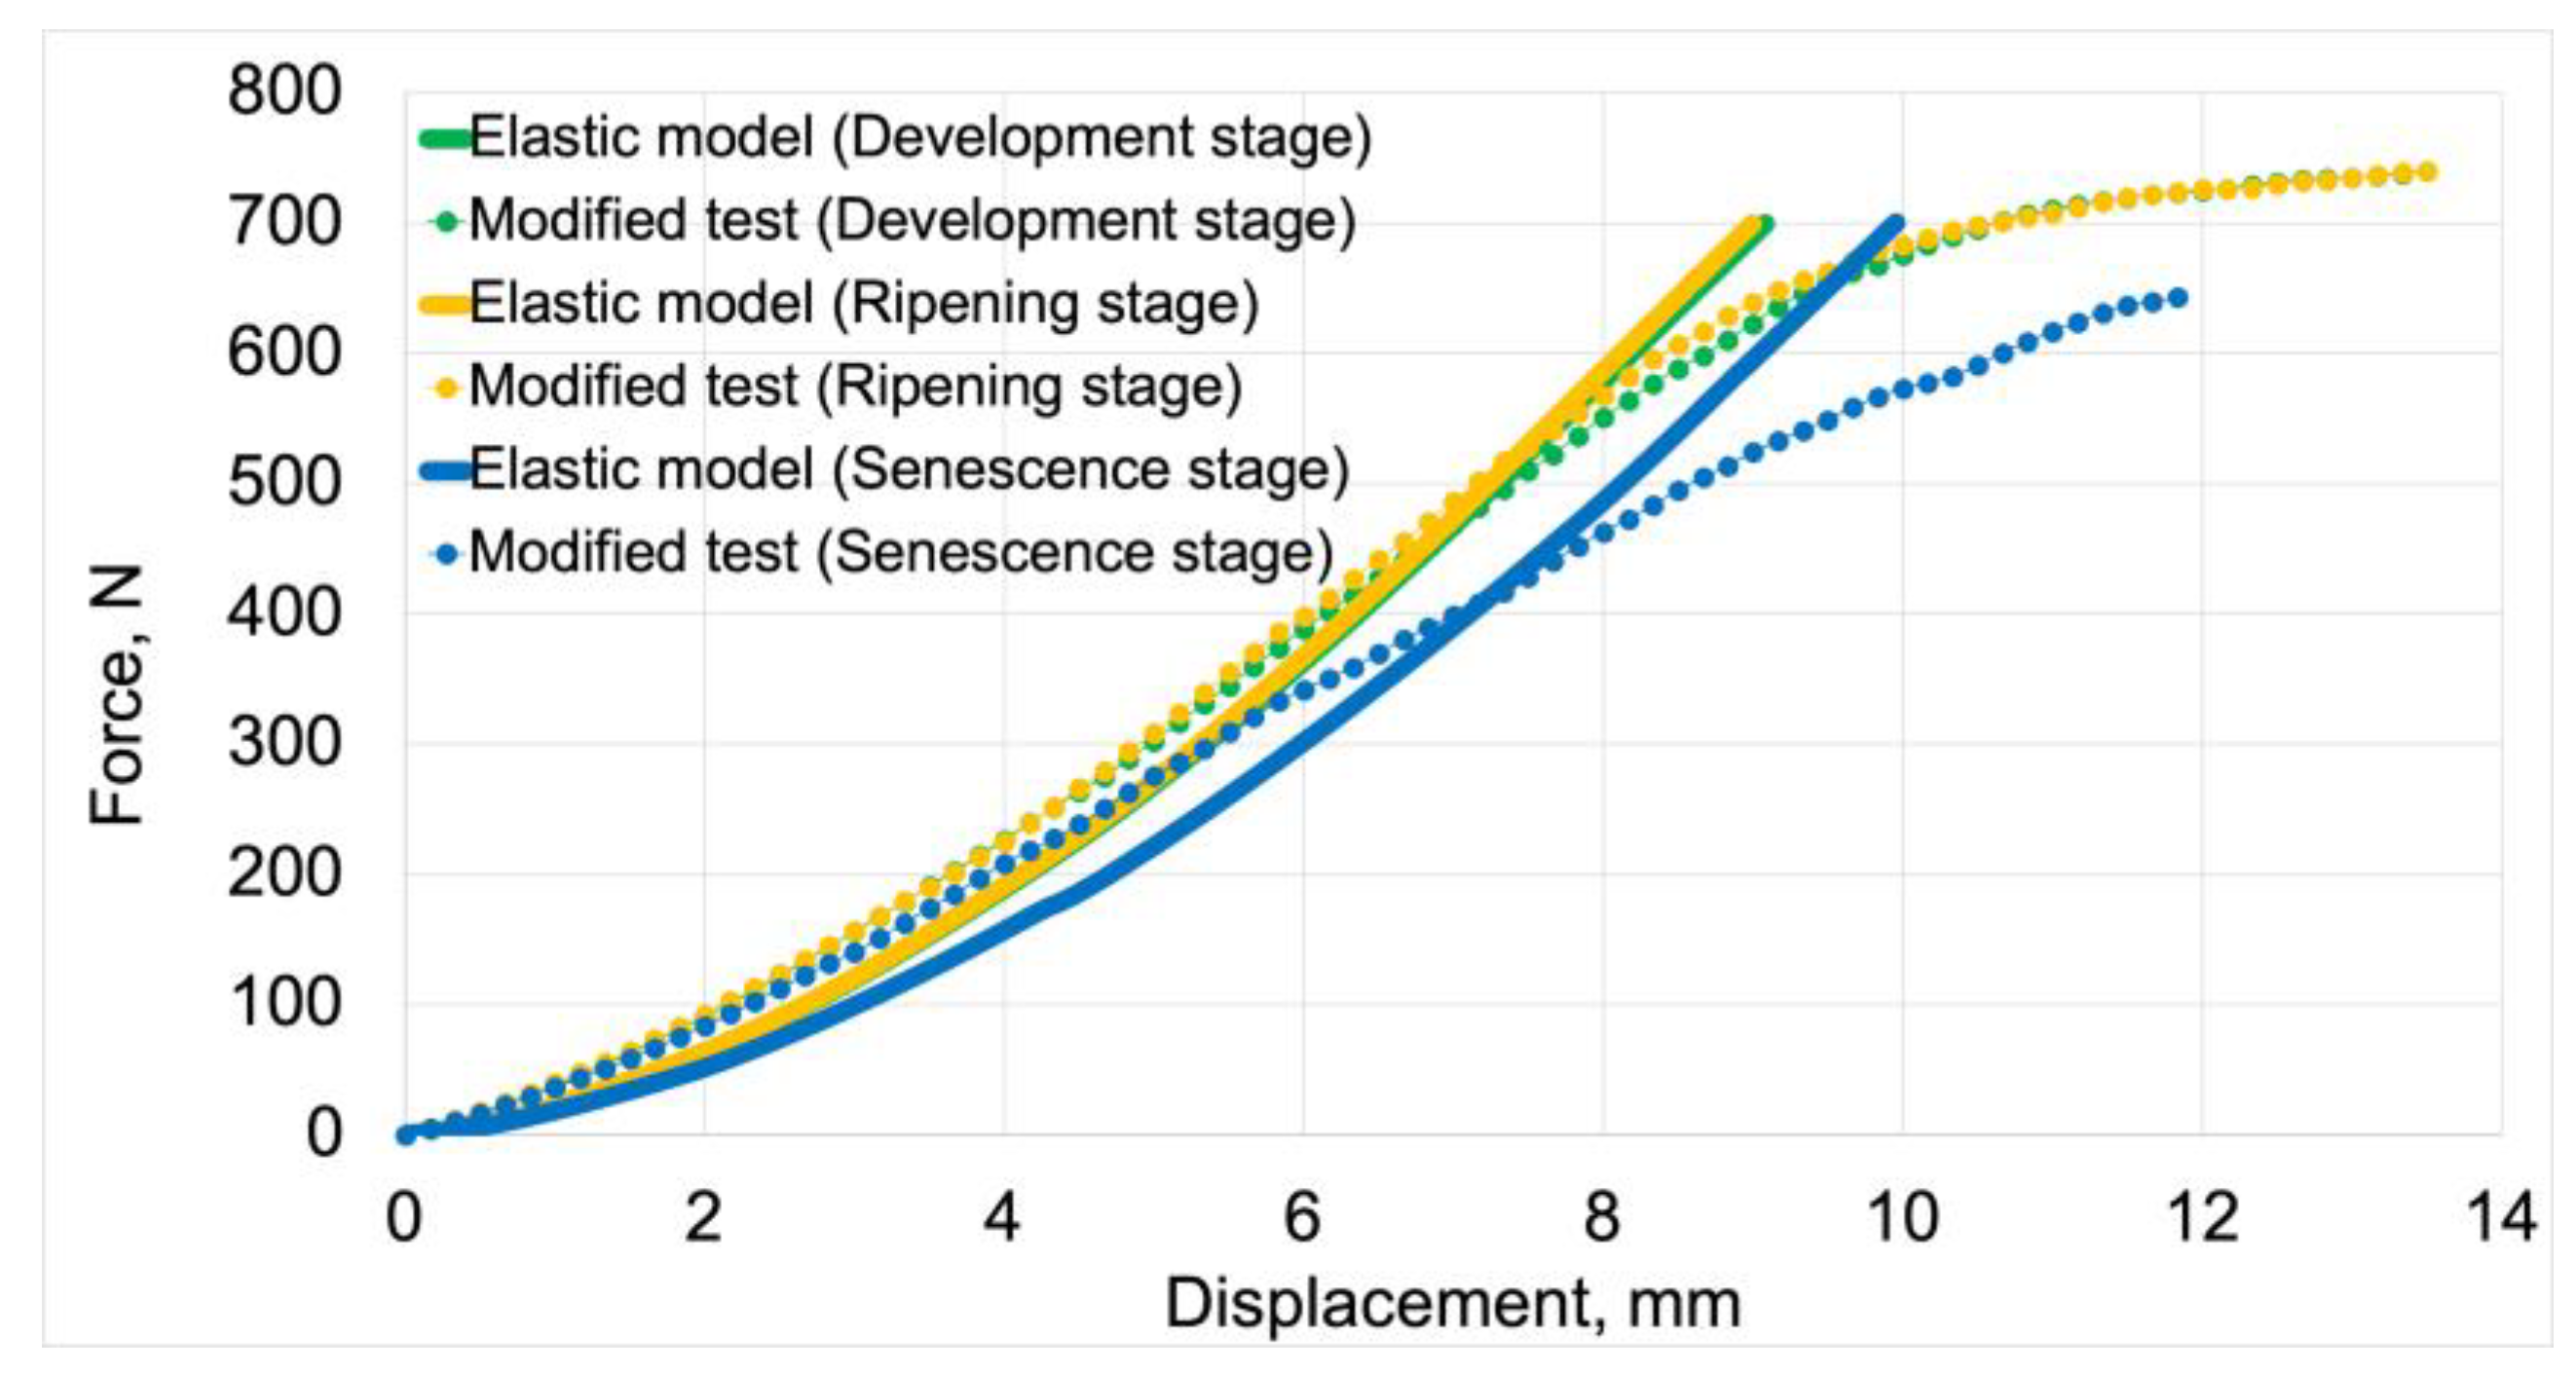
Figure 9.
Scatter plot of displacement values for elastic models compared with modified test results.
Figure 9.
Scatter plot of displacement values for elastic models compared with modified test results.
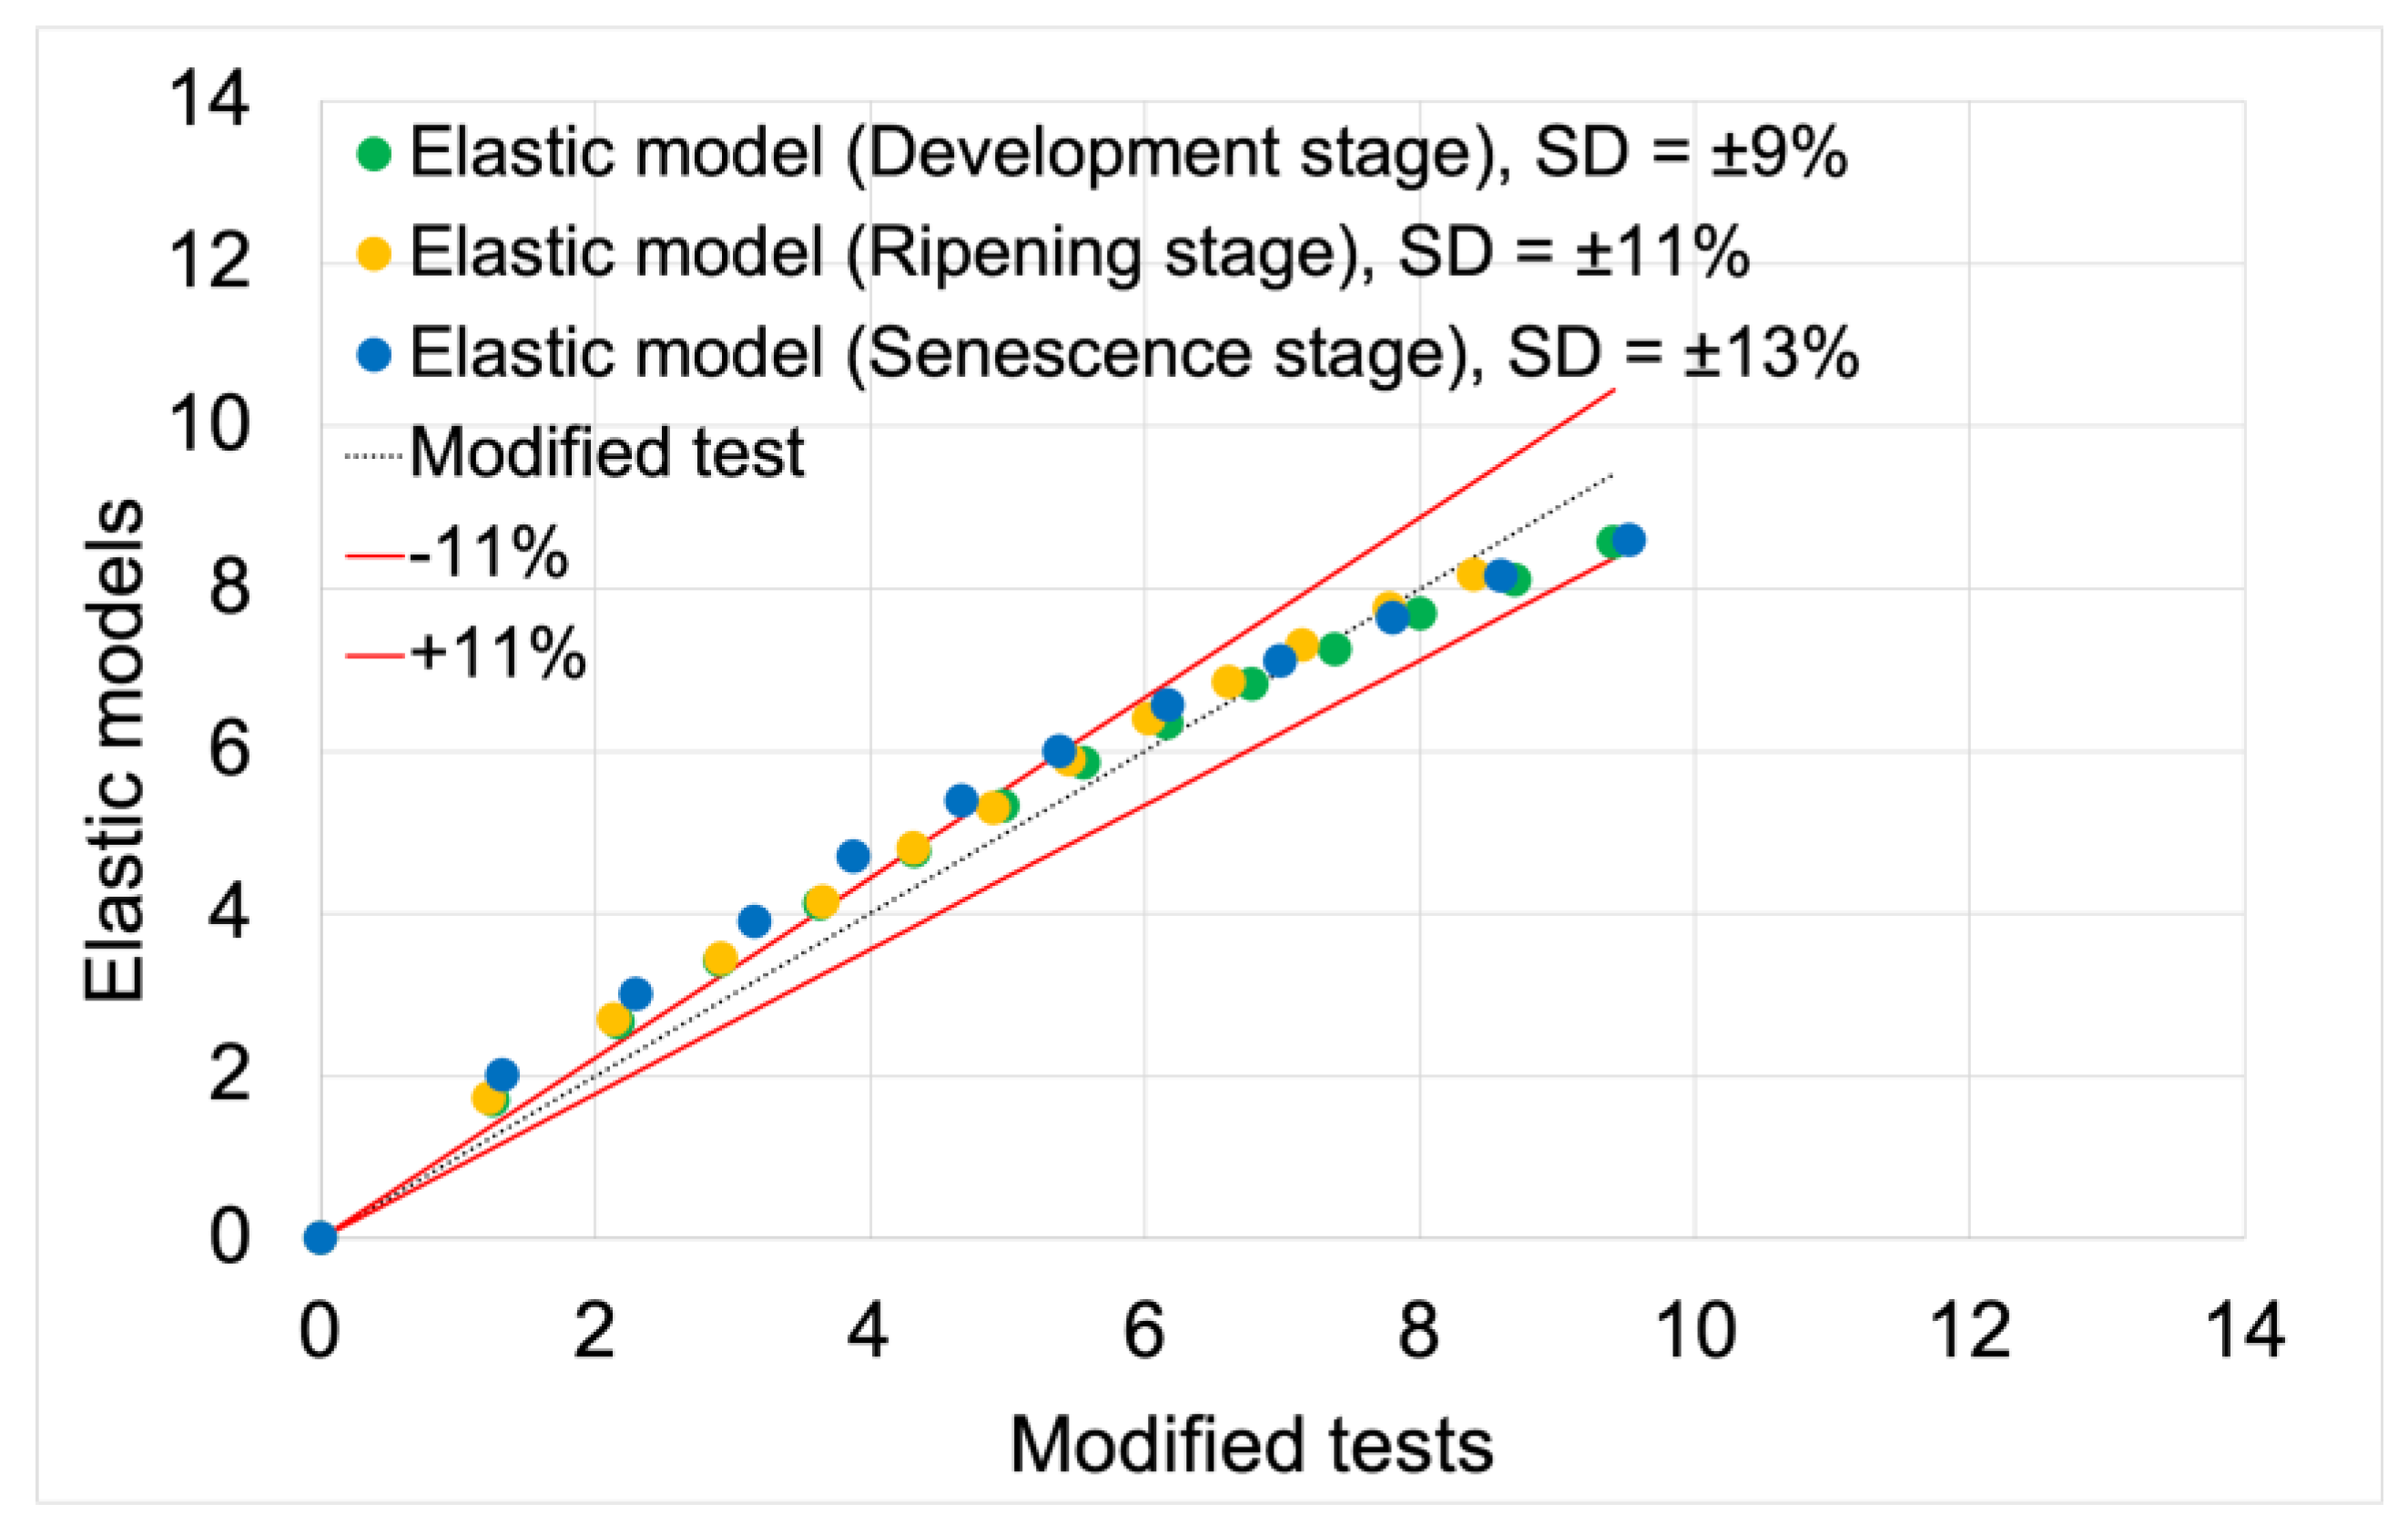
Figure 10.
Force vs. displacement curves used for validating elastic models based on test results.
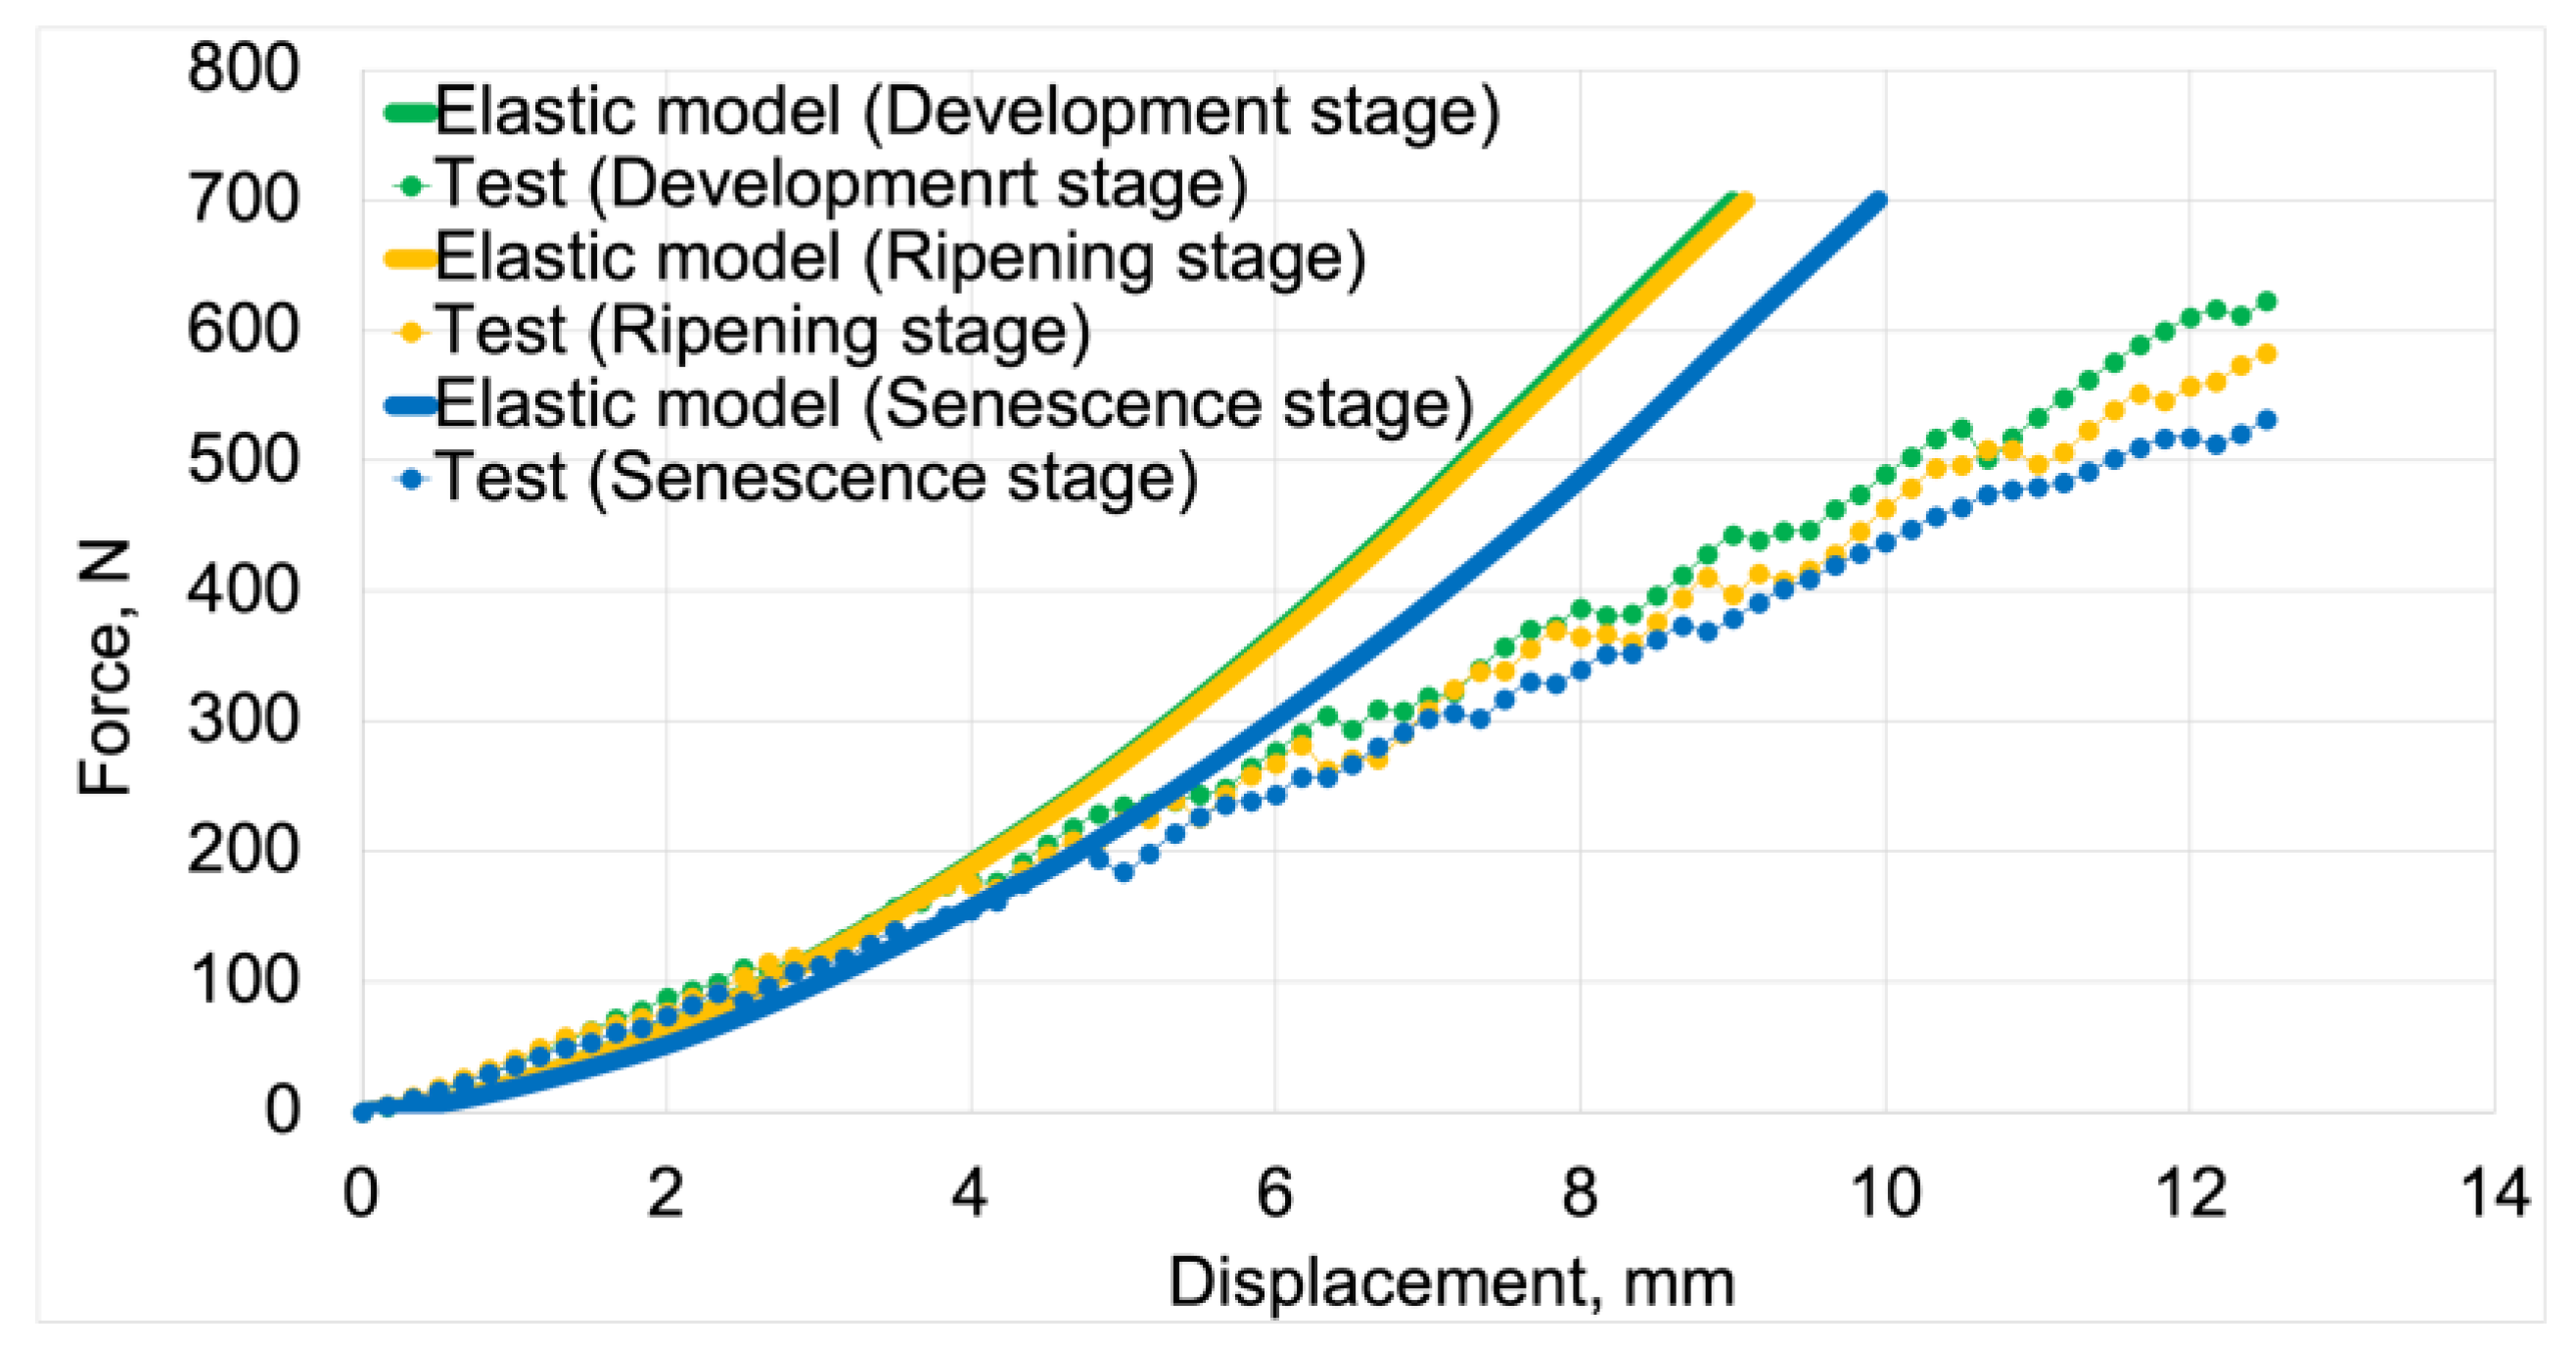
Figure 11.
Scatter plot of displacement values of elastic models compared to test results.
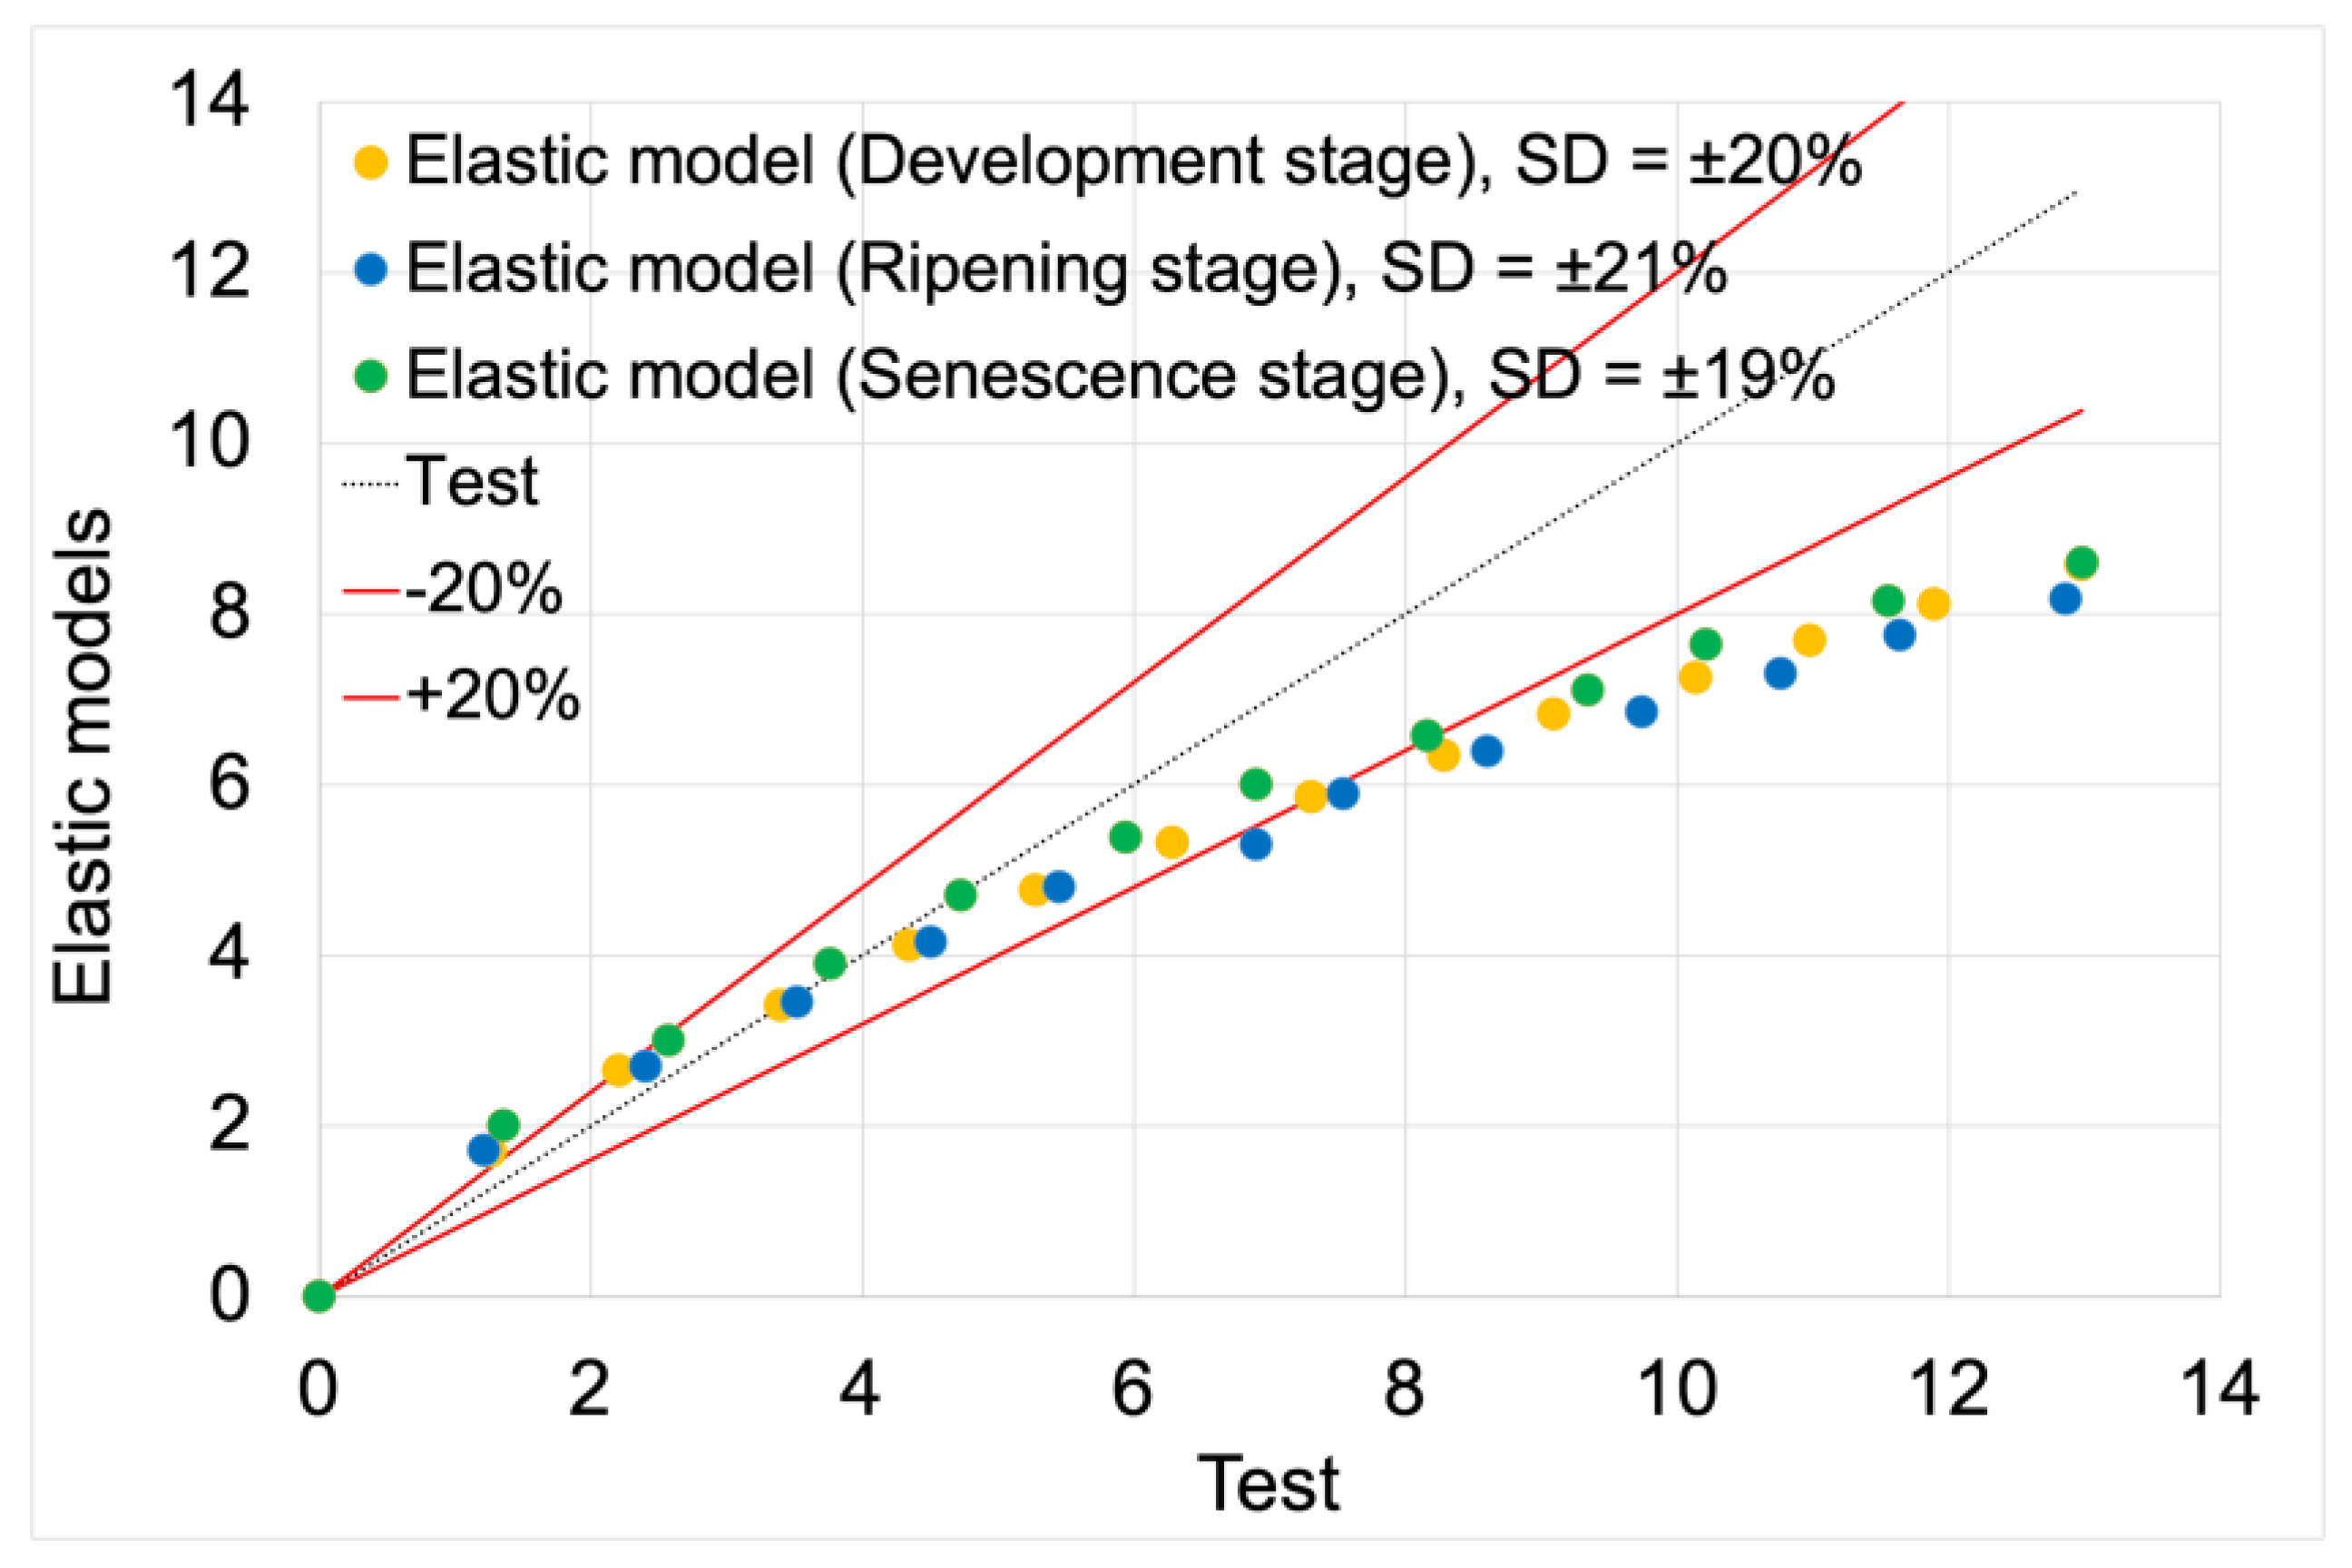
Figure 12.
Force vs. displacement curves used for validating elastoplastic models based on test results.
Figure 12.
Force vs. displacement curves used for validating elastoplastic models based on test results.
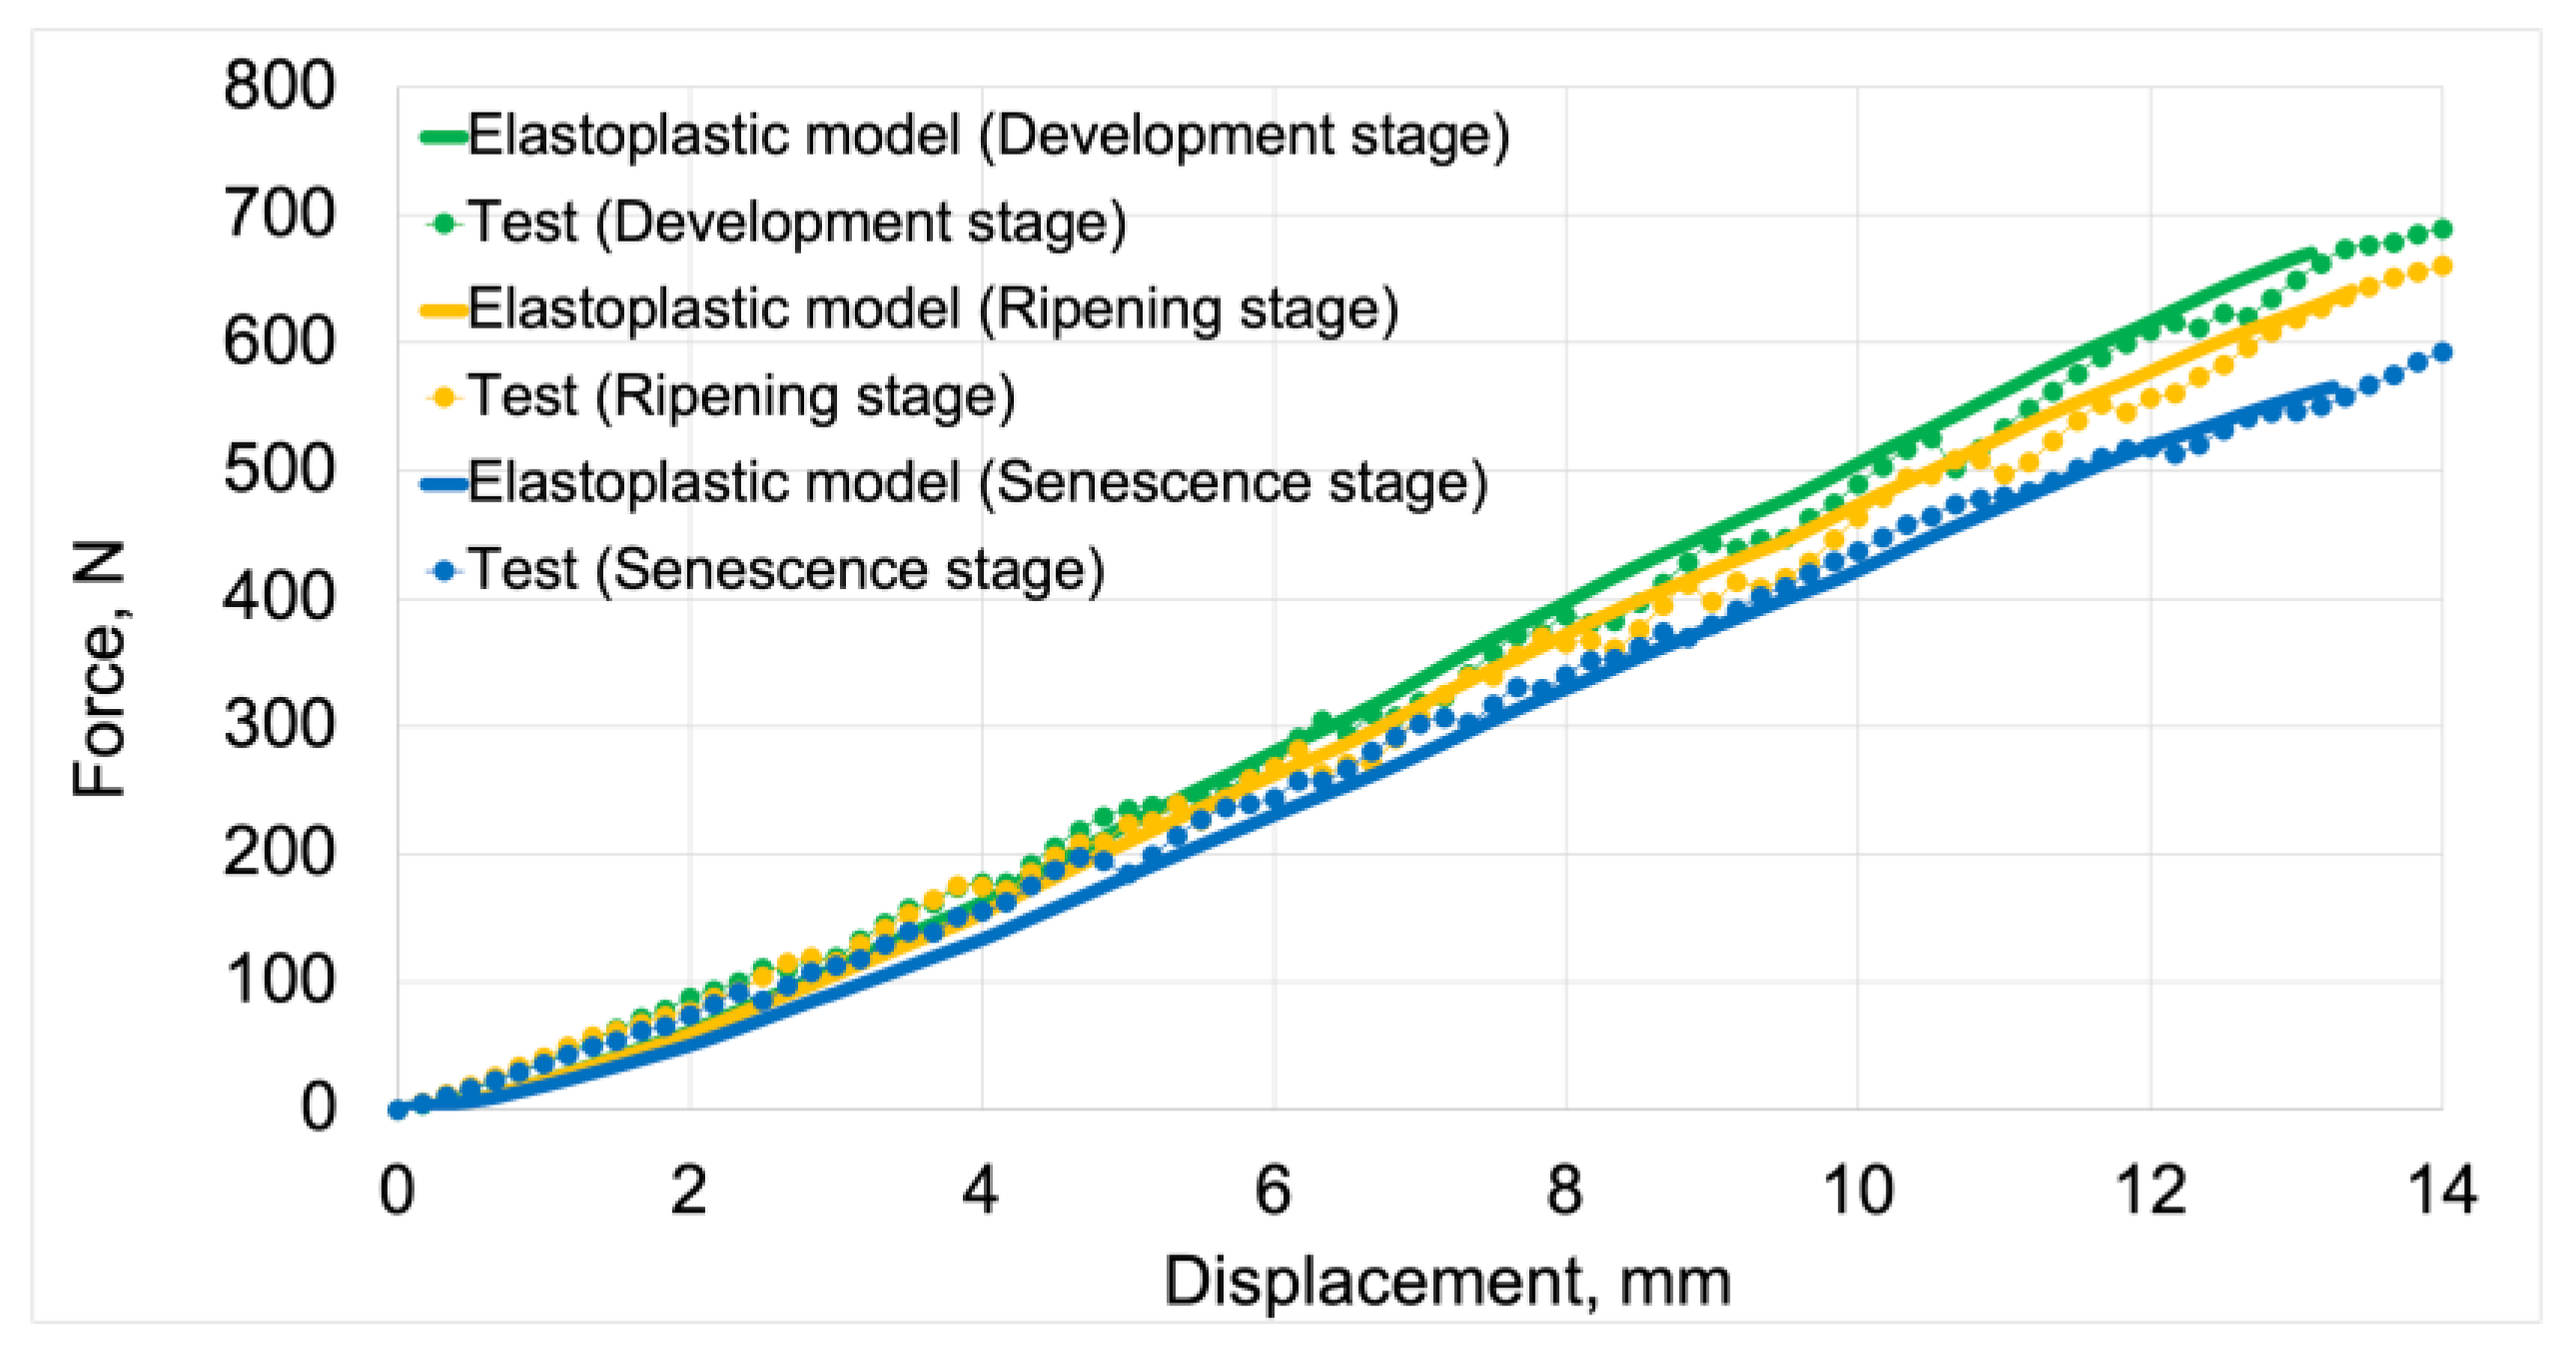
Figure 13.
Scatter plot of displacement values for elastoplastic models compared to test results.
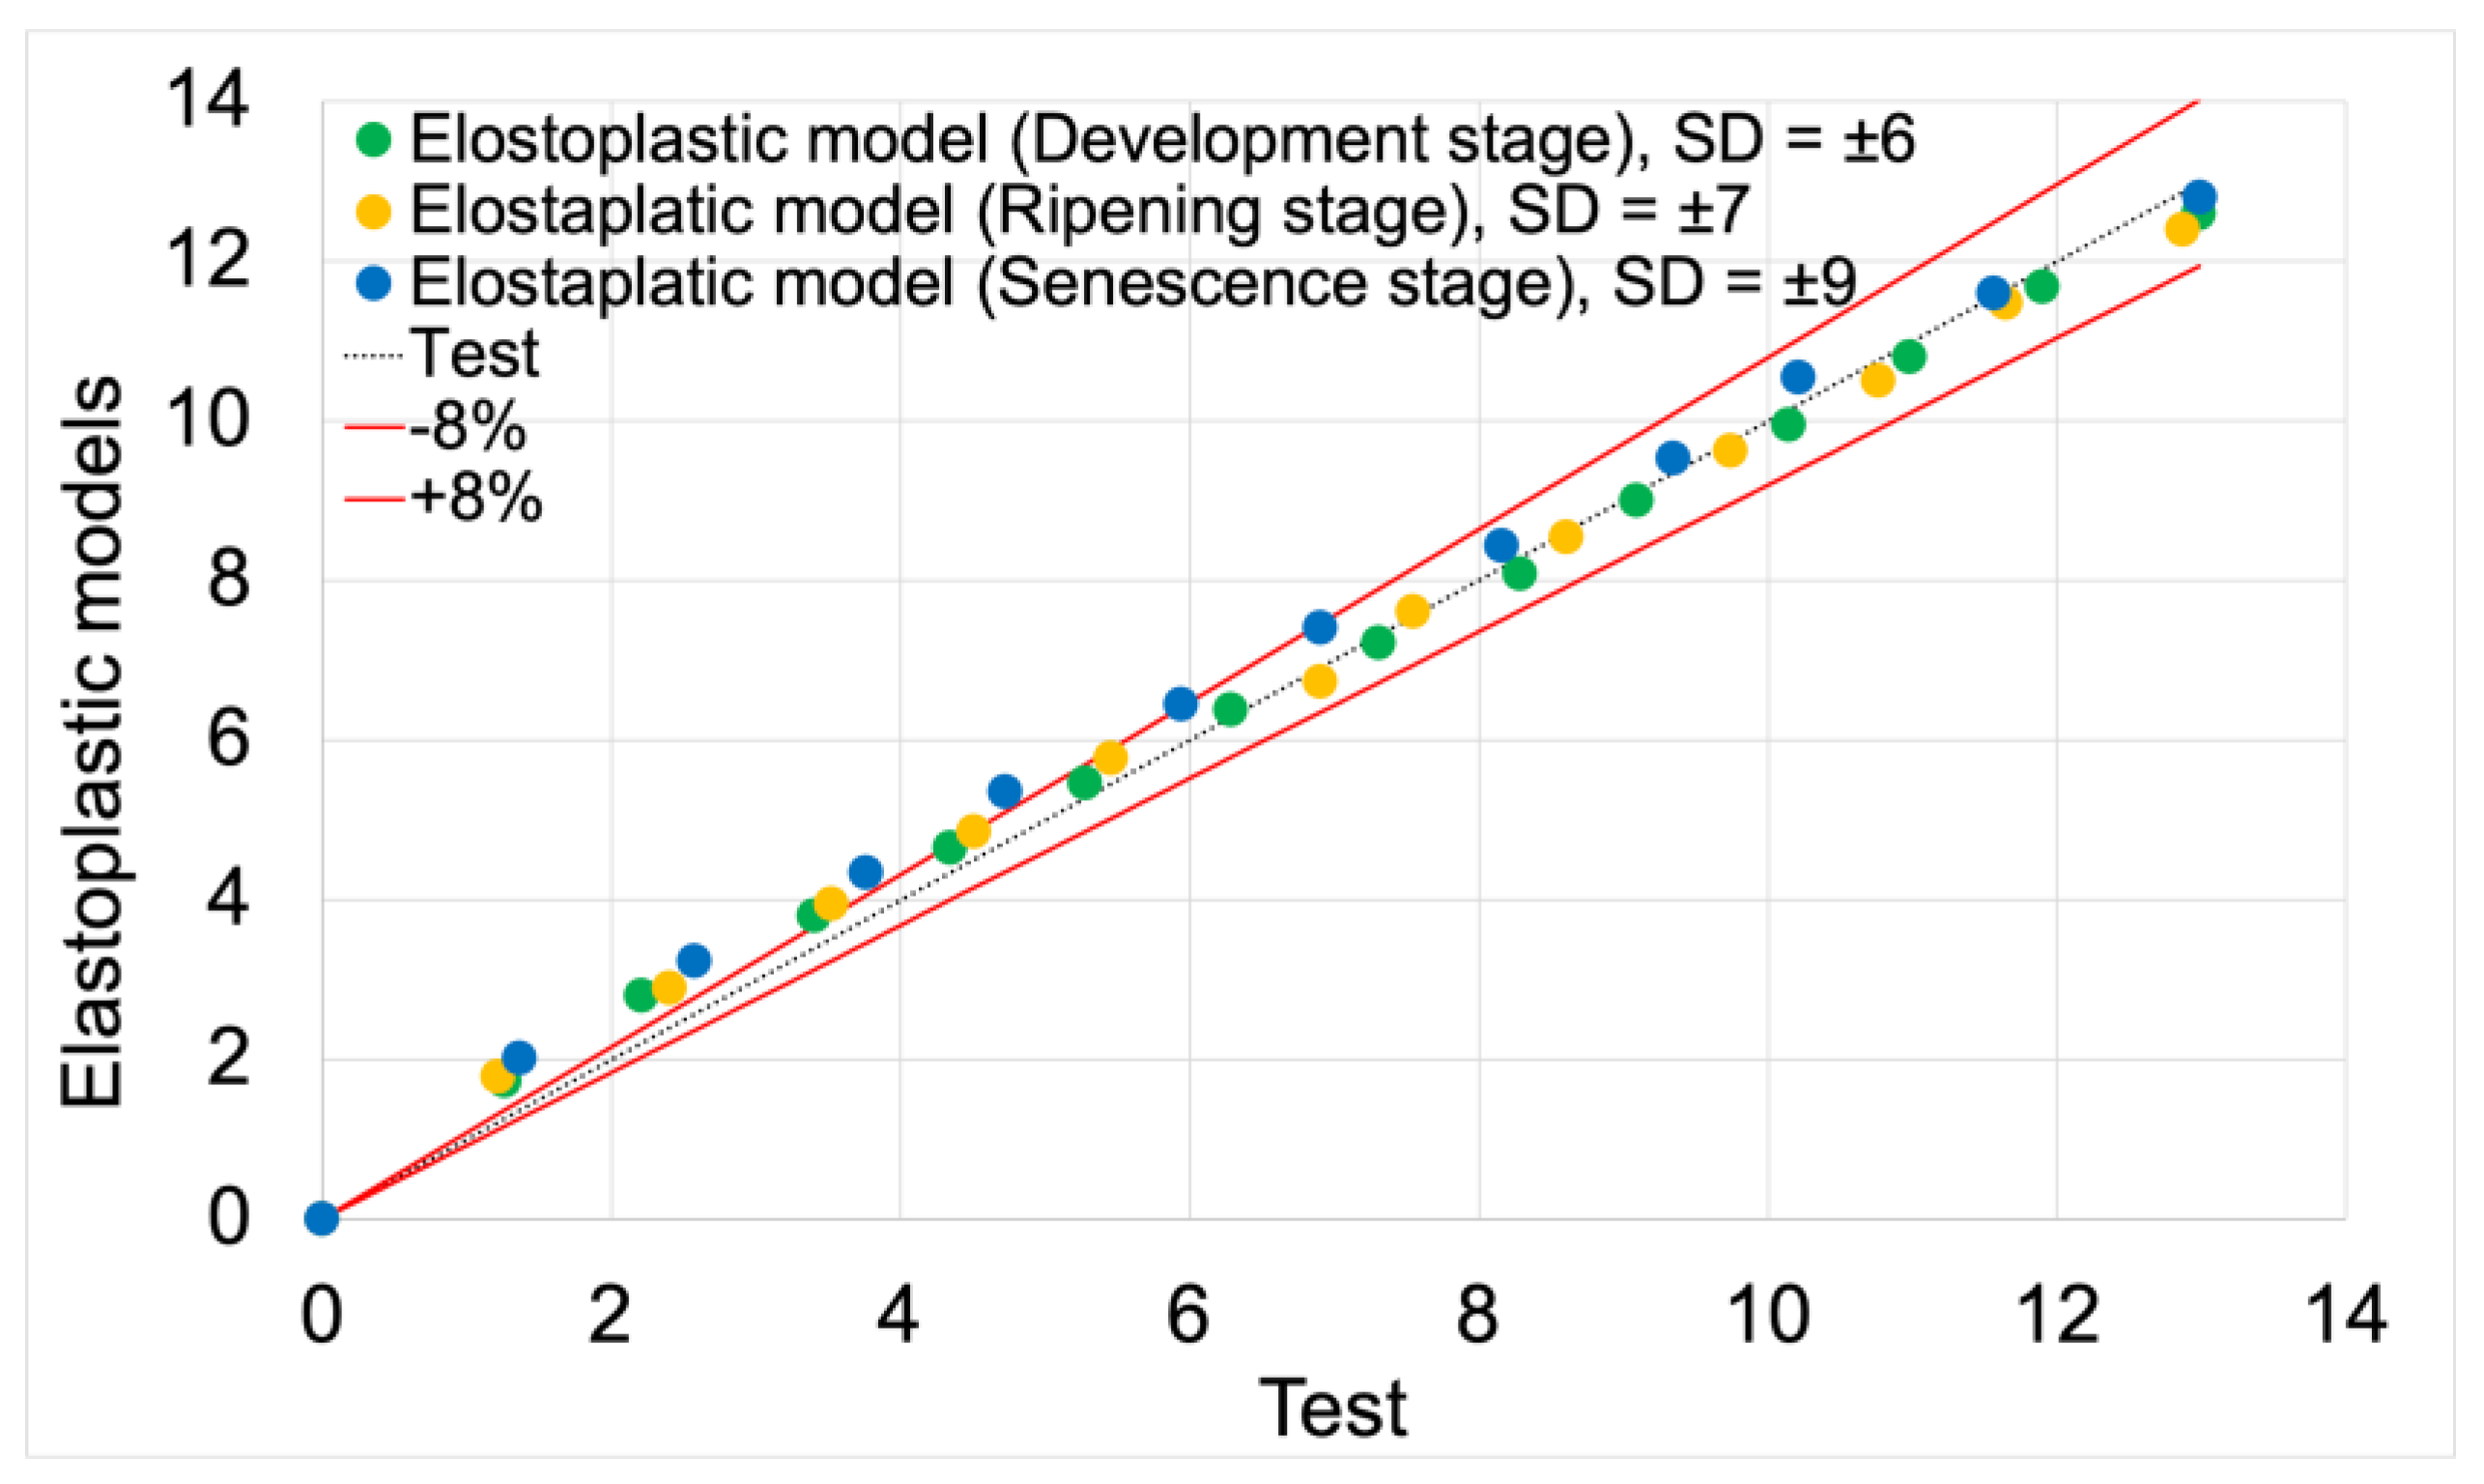
Figure 14.
Example contour plots of pressures used for validating elastic models.
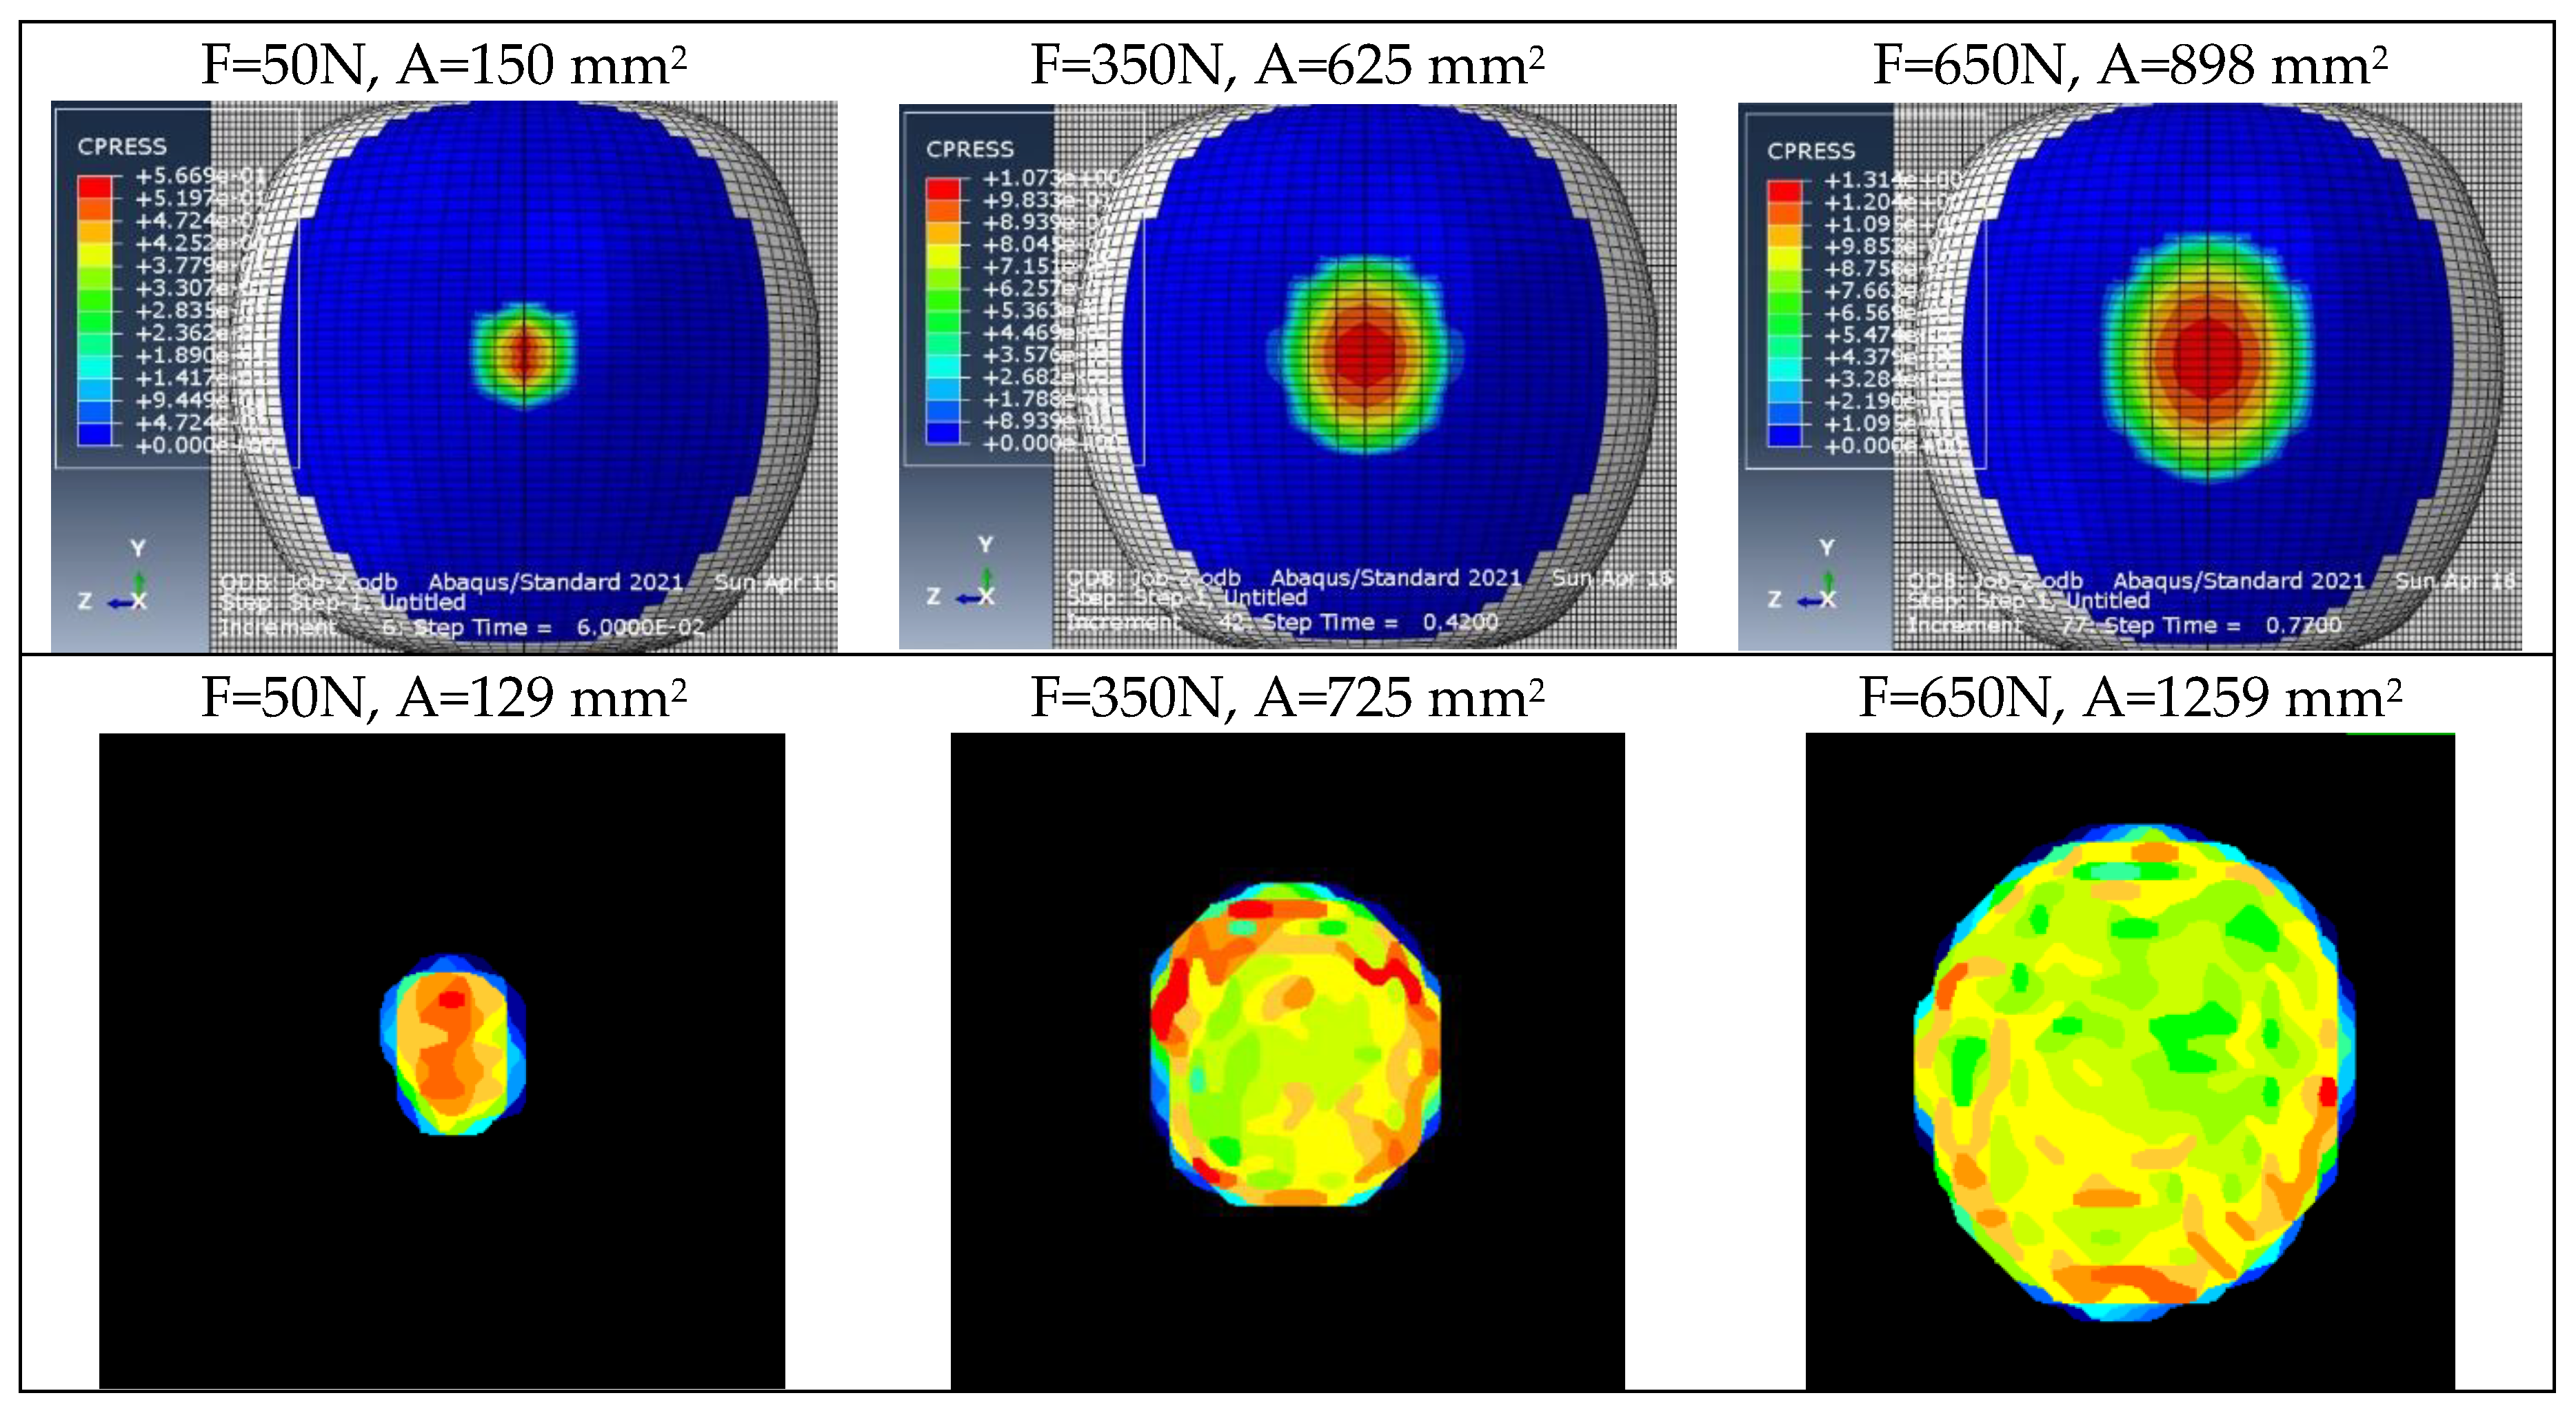
Figure 15.
Contact area vs. force curves used for validating elastic models.

Figure 16.
Scatter plot of contact area values obtained from elastic models.
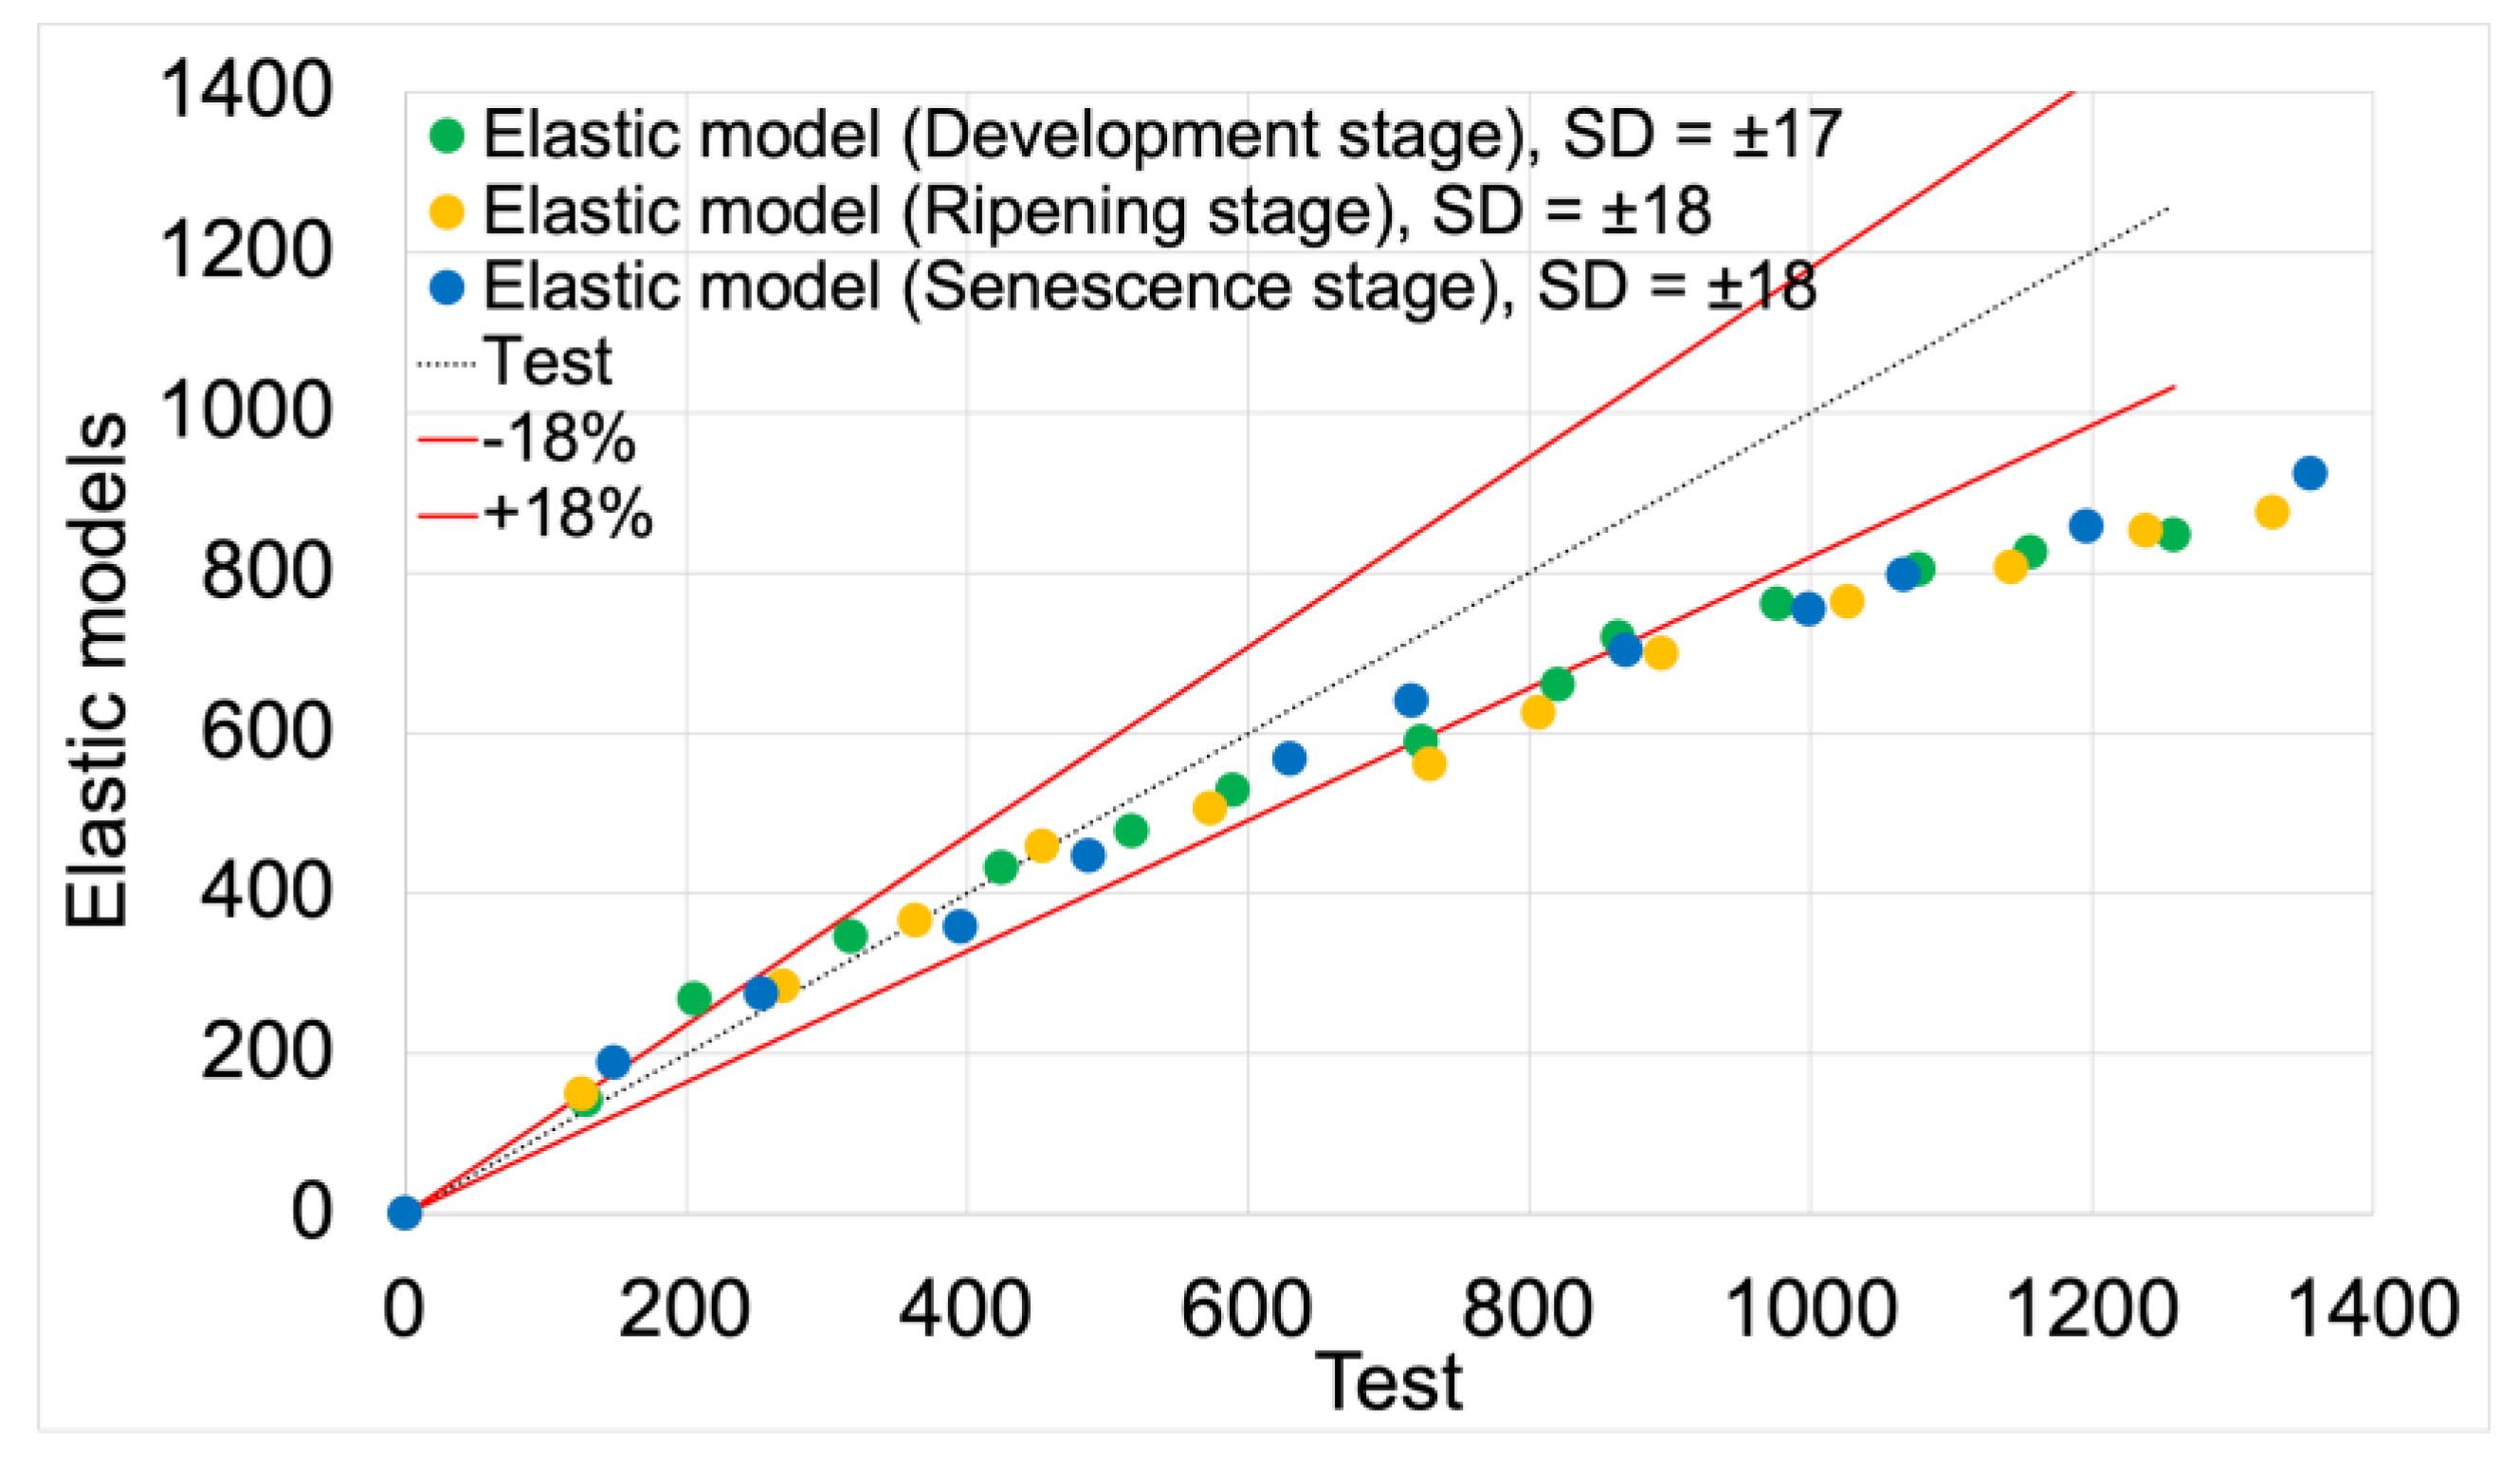
Figure 17.
Example contour plots of pressures used for validating elastoplastic models.
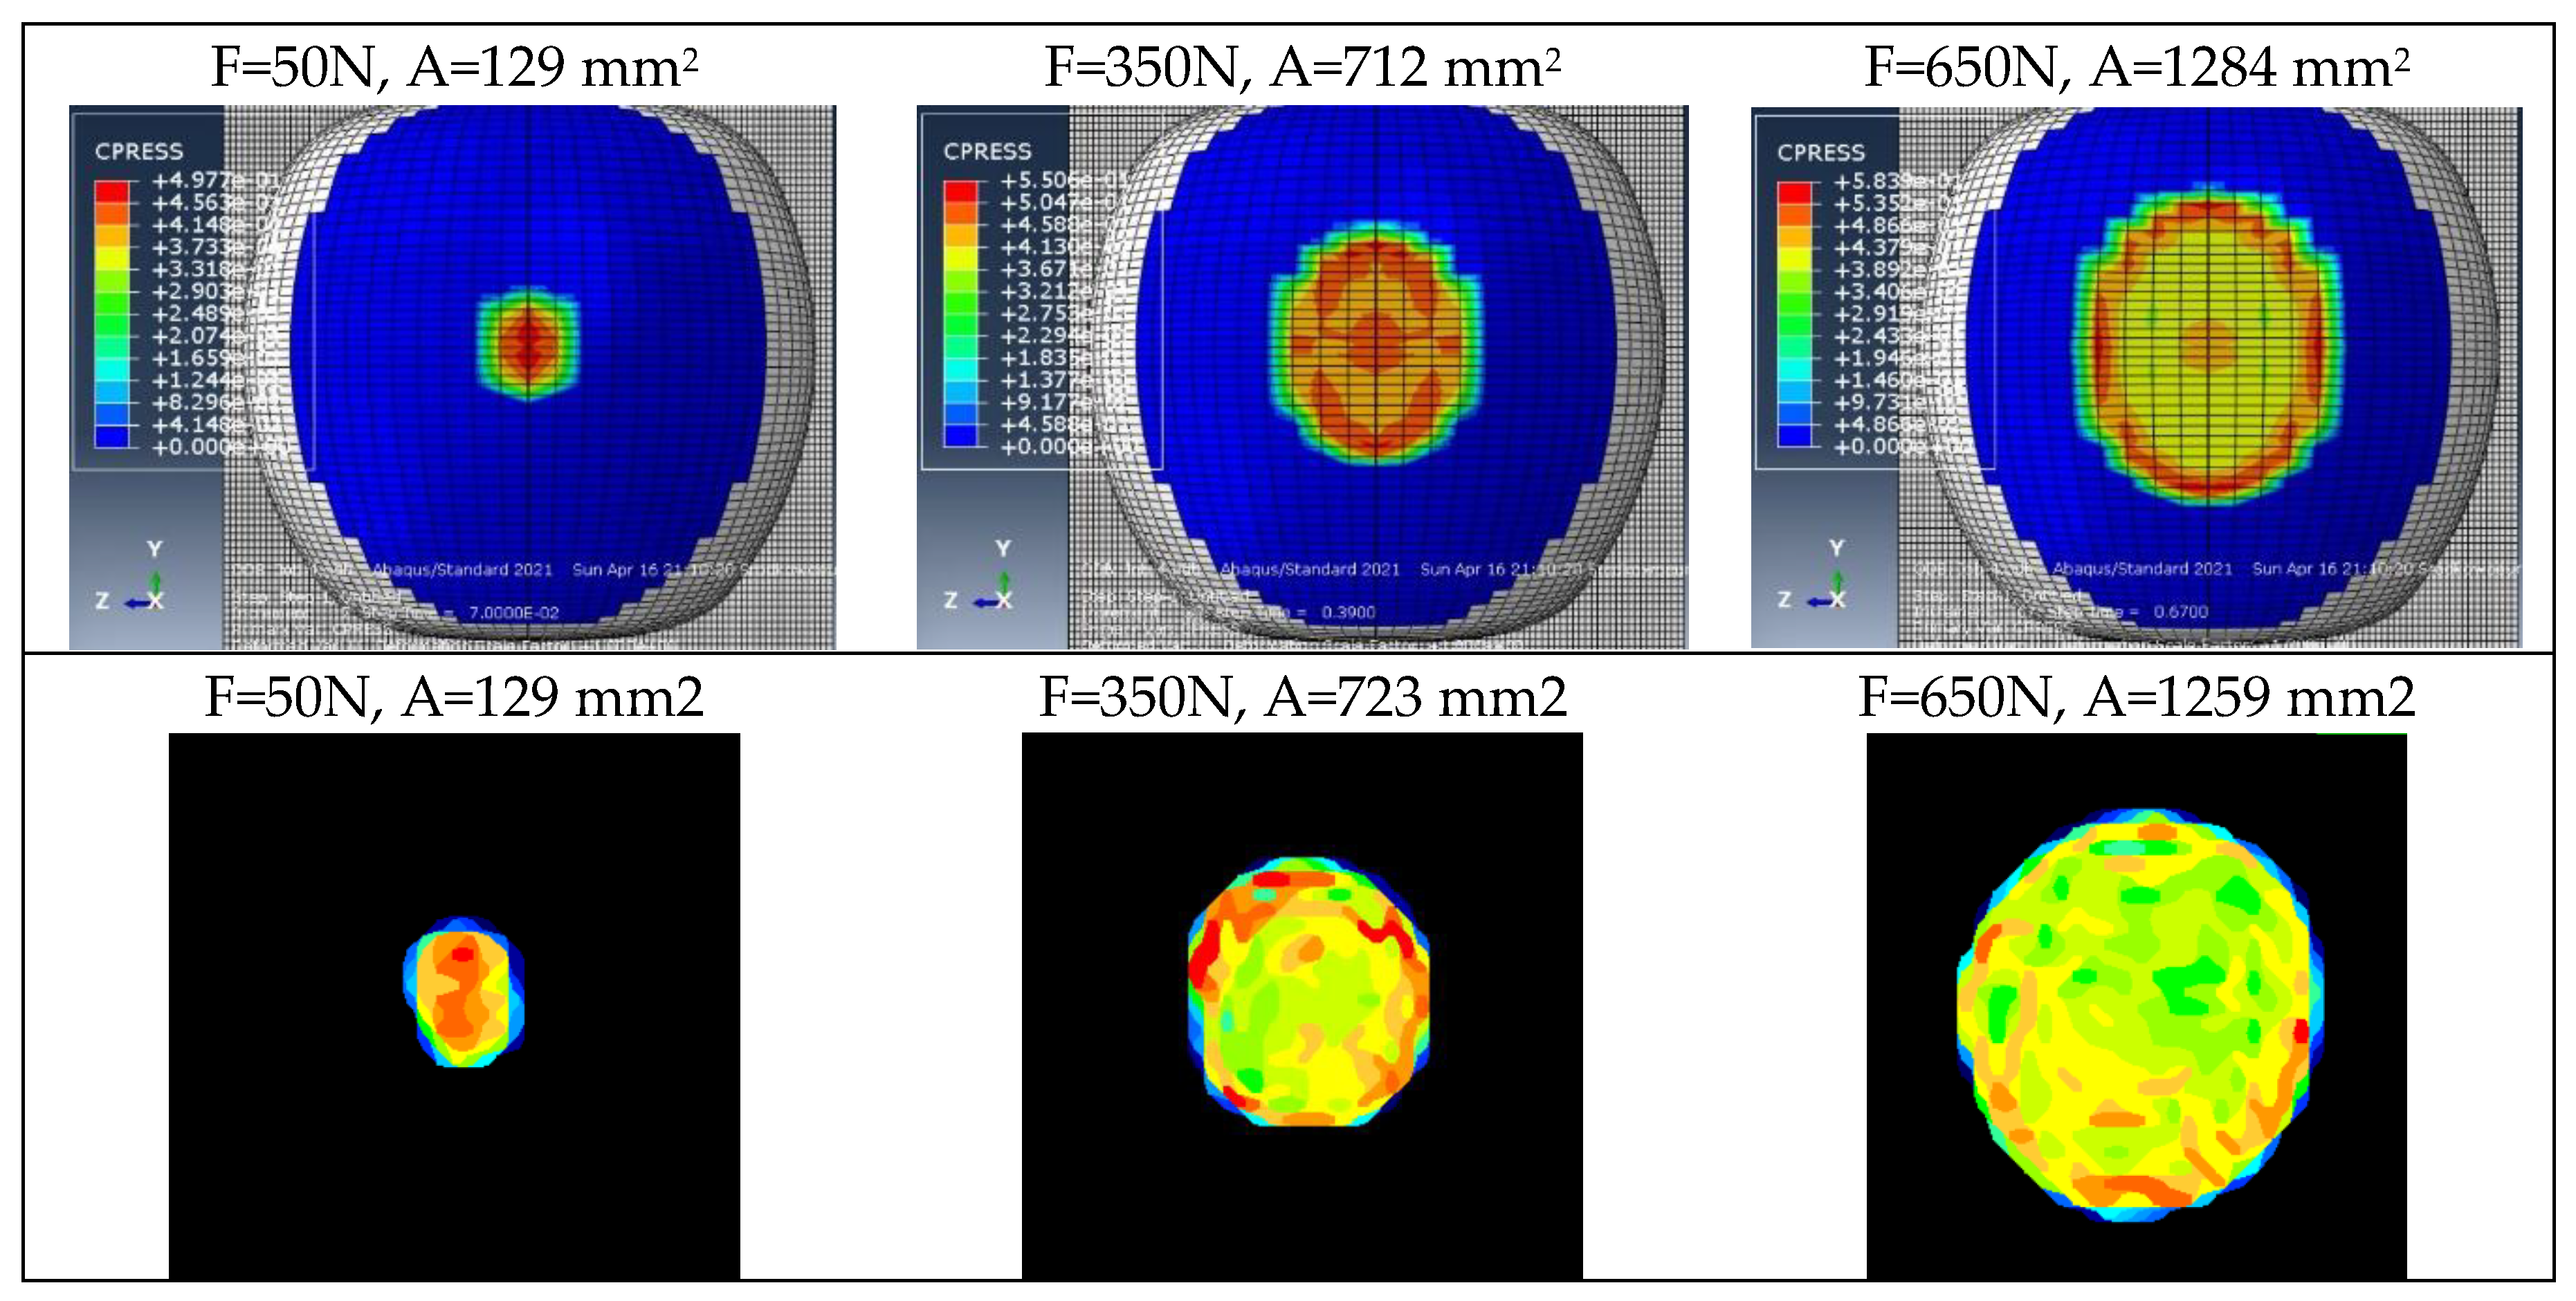
Figure 18.
Contact area vs. force curves used for validating elastoplastic models.
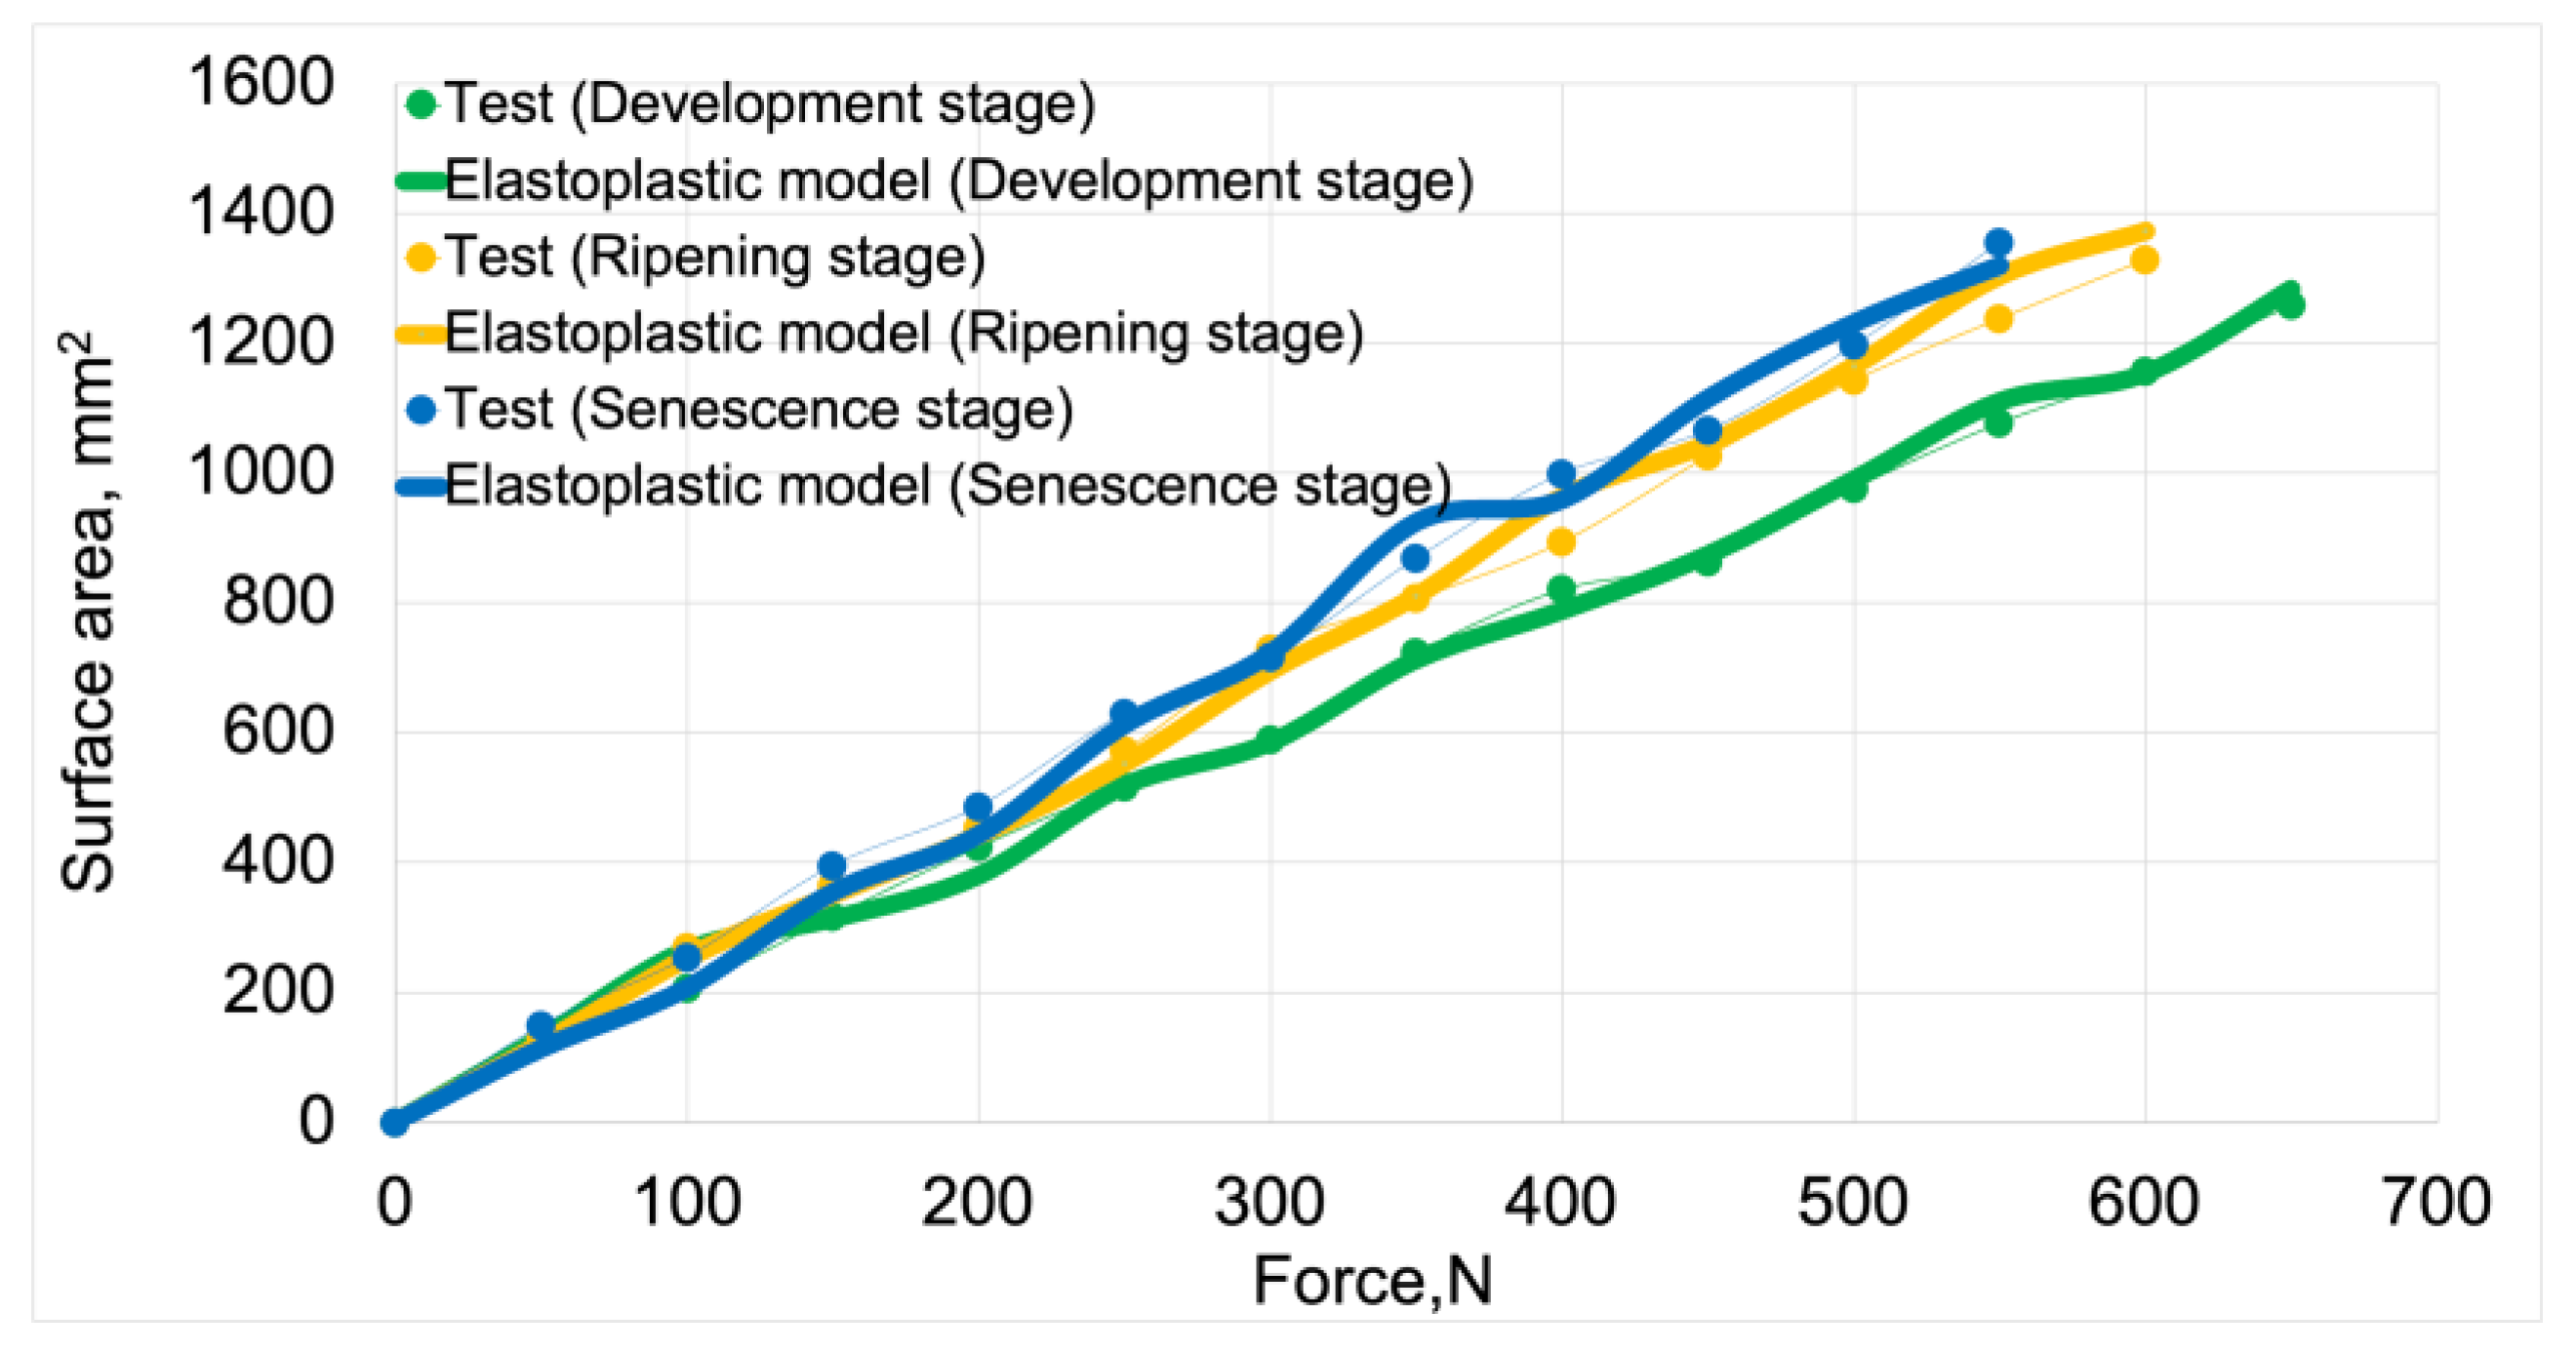
Figure 19.
Scatter plot of contact area values obtained from elastoplastic models.
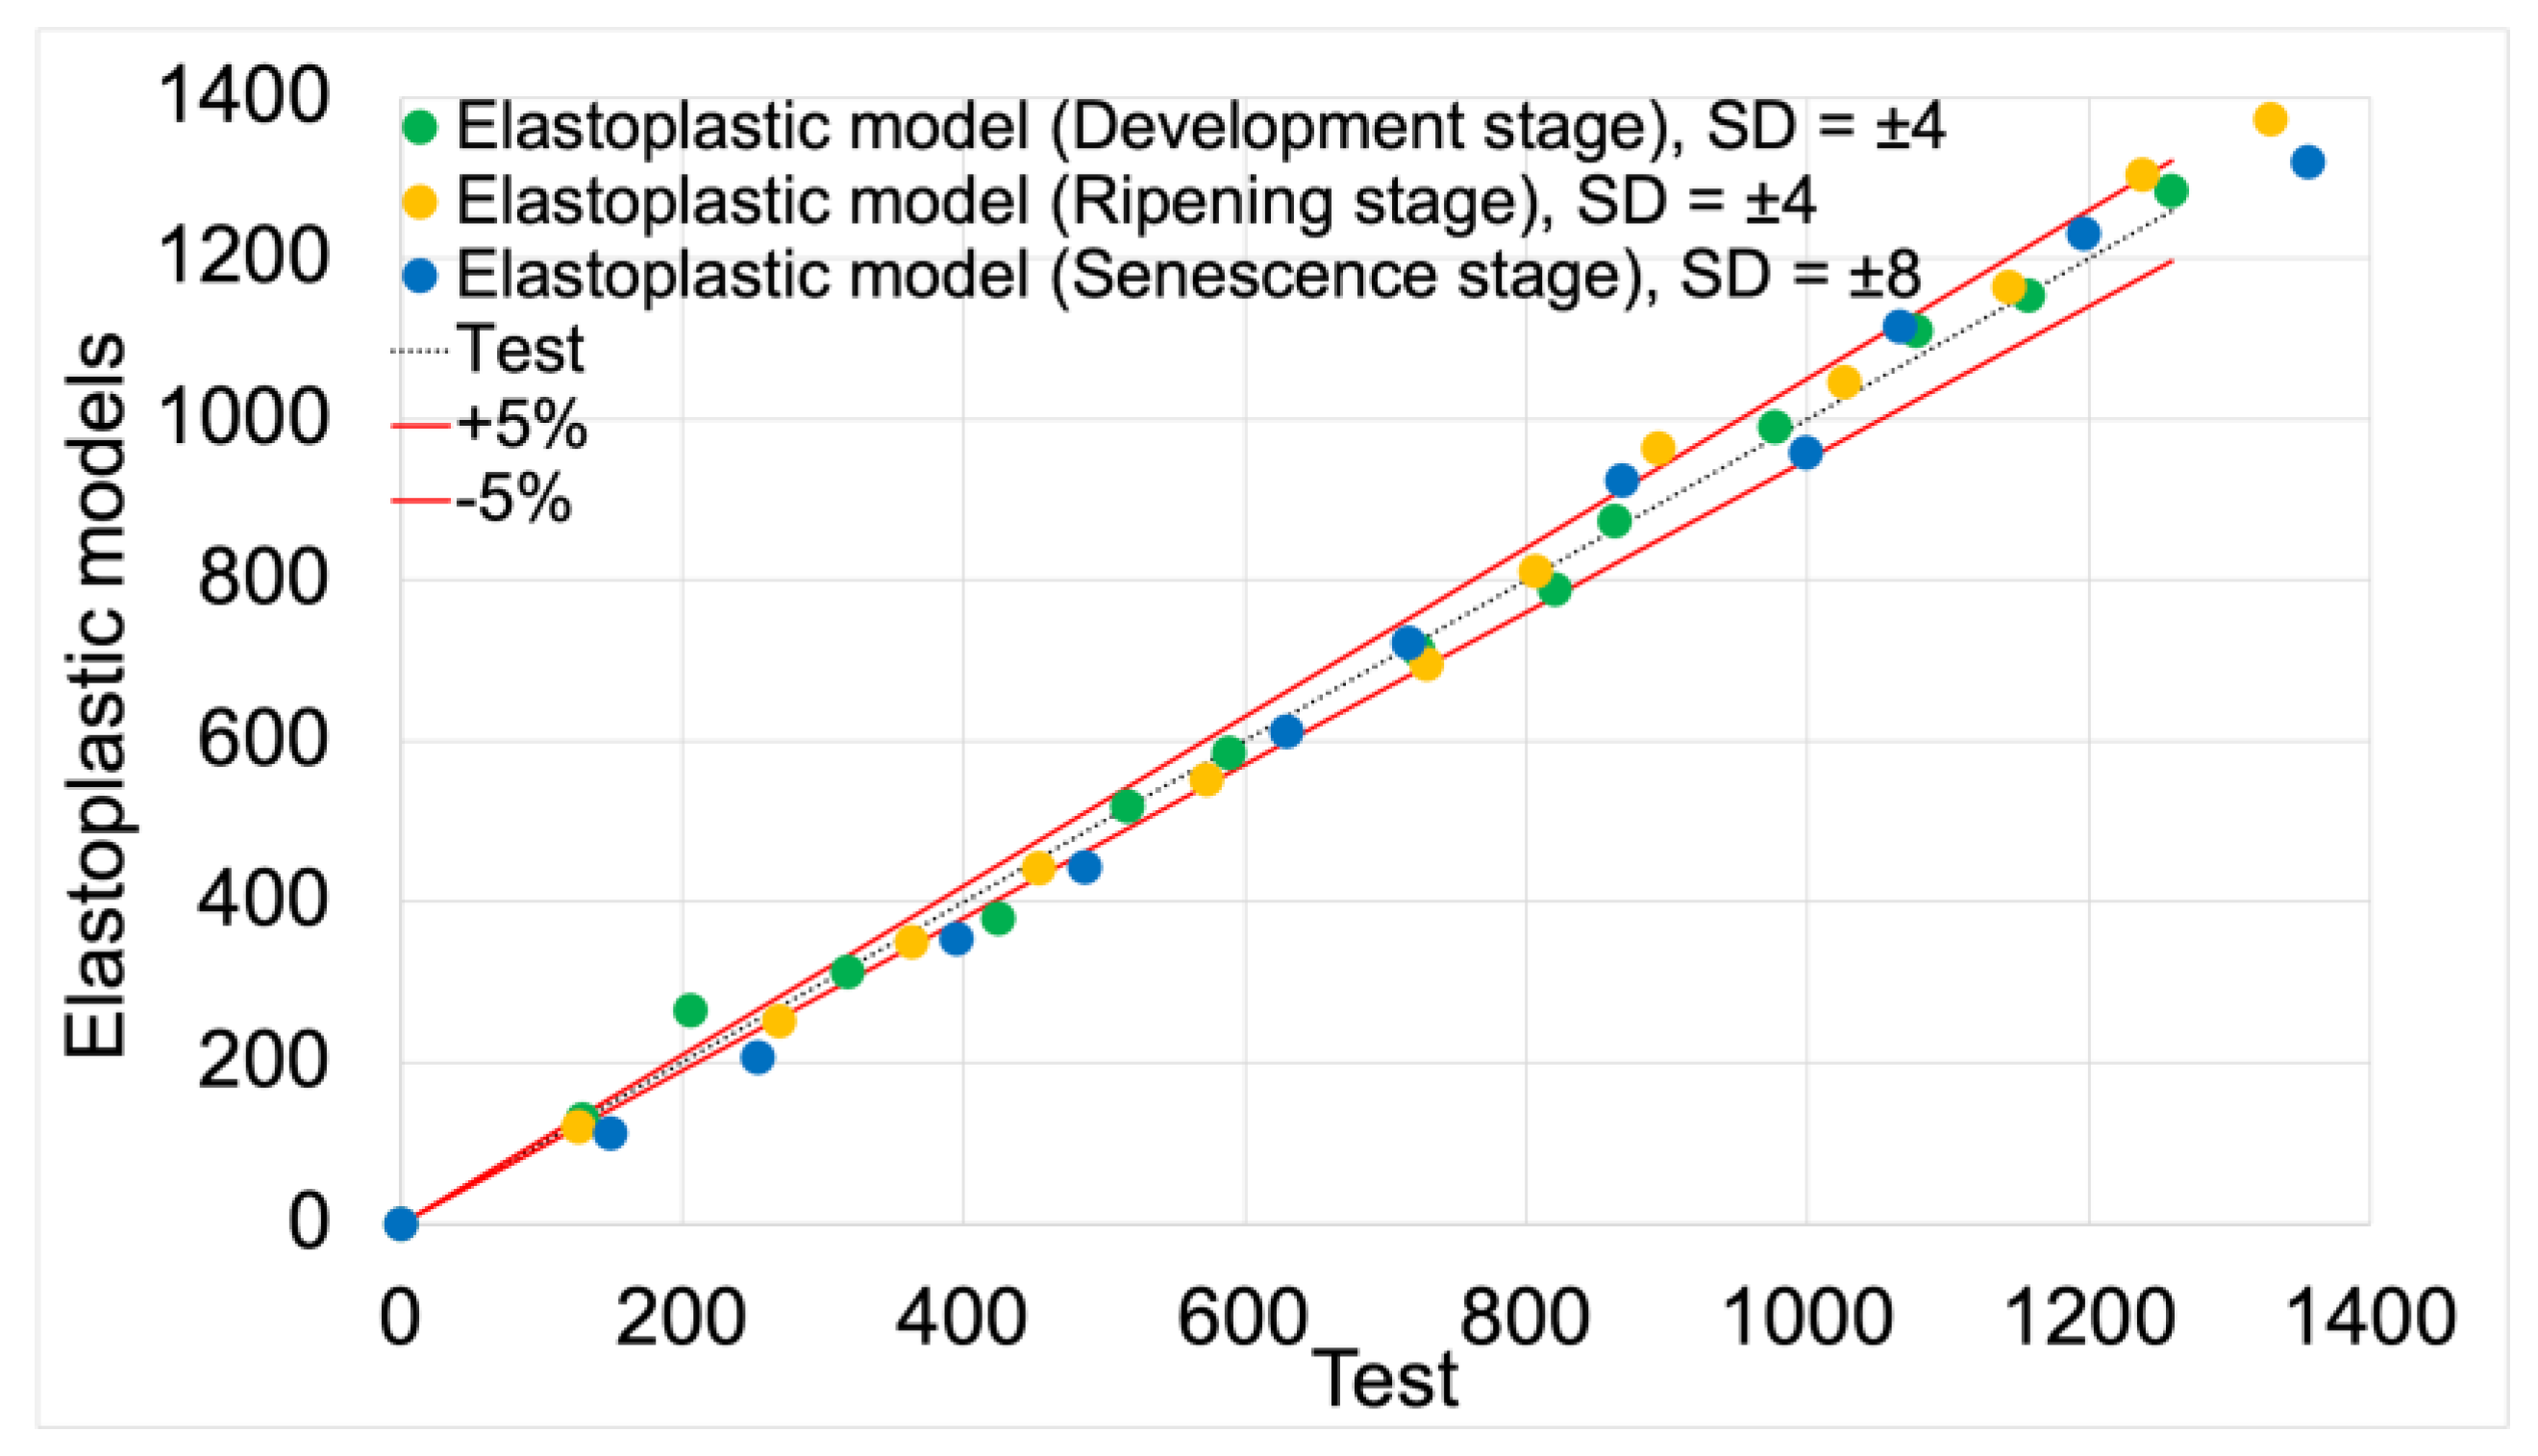

Table 1.
Elastic properties of materials assigned to individual model parts.
| Flesh | |||
| Stage of ripening | Modulus of elasticity, MPa | Poisson's ratio, - | Density, kg·m3 |
| Development | 5.04 | 0.25 | 995 |
| Ripening | 5.12 | 0.21 | 1037 |
| Senescence | 3.85 | 0.35 | 1047 |
| Skin | |||
| Stage of ripening | Modulus of elasticity, MPa | Poisson's ratio, - | Density, kg·m3 |
| Development | 10.78 | 0.35 | 995 |
| Ripening | 7.18 | 0.35 | 1037 |
| Senescence | 5.23 | 0.35 | 1047 |
| Core | |||
| Stage of ripening | Modulus of elasticity, MPa | Poisson's ratio, - | Density, kg·m3 |
| Development | 20 | 0.35 | 995 |
| Ripening | 20 | 0.35 | 1037 |
| Senescence | 20 | 0.35 | 1047 |
| Plates | |||
| Modulus of elasticity, MPa | Poisson's ratio, - | Density, kg·m3 | |
| Steel | 210 000 | 0.3 | 8000 |
Table 2.
Plastic points calculated by the program based on stress versus strain diagrams.
| Development stage | |
| Stress, MPa | Strain, - |
| 0.29 | 0 |
| 0.29 | 2.81·10-4 |
| 0.15 | 0.21 |
| Ripening stage | |
| Stress, MPa | Strain, - |
| 0.27 | 0 |
| 0.27 | 2.62·10-6 |
| 0.15 | 0.21 |
| Senescence stage | |
| Stress, MPa | Strain, - |
| 0.21 | 0 |
| 0.21 | 1.30·10-4 |
| 0.15 | 0.21 |
Table 3.
Parameters of boundary conditions assigned to individual sets of the model.
| Holder | U1=U2=U3=0 UR1=UR2=UR3=0 |
| Load cell | Concentrated Force 0.09 N ·3965 nodes = 35685 N U2=U3=0 UR1=UR2=UR3=0 |
| Cross-section | U3=0 UR1=UR2=0 |
Table 4.
Deviation and fit values of elastic models to the modified displacement-force test results.
Table 4.
Deviation and fit values of elastic models to the modified displacement-force test results.
| Ripening stage | SD, % | Model fit, % |
|---|---|---|
| Development stage | ±9 | 91 |
| Ripening stage | ±11 | 89 |
| Senescence stage | ±13 | 87 |
| Average | ±11 | 89 |
Table 5.
Deviation values and fit of elastic models to displacement results as a function of force obtained during tests.
Table 5.
Deviation values and fit of elastic models to displacement results as a function of force obtained during tests.
| Ripening stage | SD, % | Model fit, % |
|---|---|---|
| Development stage | ±20 | 80 |
| Ripening stage | ±21 | 79 |
| Senescence stage | ±19 | 81 |
| Average | ±20 | 80 |
Table 6.
Deviation values and fit of elastoplastic models to displacement results as a function of force obtained during tests.
Table 6.
Deviation values and fit of elastoplastic models to displacement results as a function of force obtained during tests.
| Ripening stage | SD, % | Model fit, % |
|---|---|---|
| Development stage | ±6 | 94 |
| Ripening stage | ±7 | 93 |
| Senescence stage | ±9 | 91 |
| Average | ±8 | 92 |
Table 7.
Deviation values and fit of elastic models to contact area results obtained from tests.
| Ripening stage | SD, % | Model fit, % |
|---|---|---|
| Development stage | ±17 | 83 |
| Ripening stage | ±18 | 82 |
| Senescence stage | ±18 | 82 |
| Average | ±18 | 82 |
Table 8.
Deviation values and fit of elastoplastic models to contact area results obtained from tests.
Table 8.
Deviation values and fit of elastoplastic models to contact area results obtained from tests.
| Ripening stage | SD, % | Model fit, % |
|---|---|---|
| Development stage | 4 | 96 |
| Ripening stage | 4 | 96 |
| Senescence stage | 8 | 92 |
| Average | 5 | 95 |
Disclaimer/Publisher’s Note: The statements, opinions and data contained in all publications are solely those of the individual author(s) and contributor(s) and not of MDPI and/or the editor(s). MDPI and/or the editor(s) disclaim responsibility for any injury to people or property resulting from any ideas, methods, instructions or products referred to in the content. |
© 2025 by the authors. Licensee MDPI, Basel, Switzerland. This article is an open access article distributed under the terms and conditions of the Creative Commons Attribution (CC BY) license (http://creativecommons.org/licenses/by/4.0/).
Copyright: This open access article is published under a Creative Commons CC BY 4.0 license, which permit the free download, distribution, and reuse, provided that the author and preprint are cited in any reuse.


