
Submitted:
10 September 2024
Posted:
11 September 2024
You are already at the latest version
Abstract
The spread of false information can significantly harm public opinion, underscoring the importance of accurately identifying untrustworthy news. This paper presents an innovative machine learning (ML) tool, TMining, designed to evaluate news credibility and facilitate various text-mining tasks. By examining a range of ML methodologies alongside preprocessing techniques, we aim to boost the system's effectiveness. Our research meticulously assesses different datasets, highlights the impact of applying stemming techniques, and employs Local Interpretable Model-Agnostic Explanations (LIMEs) to shed light on the rationale behind model predictions. The outcomes reveal a notable enhancement in both the precision and clarity of the news verification process. The ultimate version of the model has been made available as an Application Program Interface (API), and its source code has been shared openly, encouraging further exploration and collaboration within the scientific community. This initiative advances our ability to discern manipulative context from fictitious content and promotes transparency and understanding in the domain of ML applications.
Keywords:
Text Mining
; Fake News
; Model Explanation
; Machine Learning
1. Introduction
Today, traditional newspapers, television broadcasting, and even social media feeds on top of instant messaging platforms [2] have transformed how we learn about current affairs, giving people immediate access to world happenings and issues using gadgets. Worldwide, interconnectedness increases the risk of the fast dissemination of misinformation [1]. Fake news [3], a widely categorized phenomenon, has significant social, political, and economic impact, demanding that it be detected promptly [4].
Simply put, fake news can appear when news organizations do not adequately verify information or even artificially create it. In contrast to satire and parody news sites, fake news sites generate hoaxes, propaganda, and disinformation that are subsequently disseminated through social media to increase website views and impact. They can be motivated to influence voters’ decisions to support a particular candidate, manipulate public perception to benefit them in one way or another or make money through online advertisement schemes. Such information often spreads very quickly, thus leading to incorrect conjectures among people, which also affects their actions and sometimes baffles state governments.
The conventional approach for tackling fake news is fact-checking [5]. When necessary, journalists and committed organizations check the accuracy of the information provided and make corrections or retractions. However, manual verification is not feasible due to the high volume of new online content added daily. Therefore, automatic mechanisms are needed to screen, assess, and filter out likely hoaxes.
Using supervised ML techniques, we cannot accurately ascertain the authenticity of the data. However, it is possible to detect manipulative contexts with these techniques. Verifying the authenticity of the data requires utilizing fact-checking tools and credible sources, as well as contextual analysis, which will be addressed in further research.
Сonstructing an ML model to identify news reliability is extremely difficult. This implies that the language can be pretty nuanced; false information may sometimes be not so explicit in its presentation, and fake news producers’ techniques continue to evolve. There are instances where the black-box model, despite its accuracy, might be unable to instill the necessary trust for broad acceptance. This is where our research positions itself; we are building an accurate ML model and one that explains its decisions using visualizations.
Such a model and application, called TMining (text mining), was developed, as outlined in this paper, and it includes data retrieval, preprocessing, model training, testing, and final adjustments/optimizations. By combining the hands of different ML algorithms and local interpretable model-agnostic explainers (LIME) [6], the presented model is armed to fight against fraudulent news dissemination in social networks. The tool was developed and is publicly available for empirical testing and further scientific research.
This paper is a continuation of the author’s previous research in text mining within the context of news media; it has predominantly utilized support vector machines (SVMs). For instance, “The identification of authorship of Ukrainian language texts of journalistic style using neural networks” [17]. This study, which specifically targeted the media outlet “Politeka”, employed ML techniques for text mining. Another notable study, “Analyzing Ukrainian Media Texts by Means of SVM: Aspects of Language and Copyright” [18], expanded the scope of related research encompassing three distinct newspapers: “Ukrainska Pravda” and “Censor.NET”, and “Zakarpattya Online”.
2. Related Works
The growing threat of fake news has generated increased amounts of attention among researchers, resulting in a wealth of research focusing on the detection, origin, dissemination, and impact [7] of false data. This section surveys the modern literature, which outlines our understanding of the approaches to fake news detection through ML techniques [9].
Initially, efforts in fake news detection research gravitated toward understanding the production of fake news. Therefore, Castillo et al. (2011) provided insights into the reliability of tweets based on propaganda in important news [8], which shapes our understanding of social media platforms as information dissemination tools. Vlachos & Riedel (2014) provided a benchmarked fact-checking dataset, a tool for training patterns for early detection [5].
Early ML techniques for detecting fake news relied heavily on manual input. Zhou and Zafrani (2020) considered various factors that commonly reveal fake news [11] and identified linguists, images, and promoters’ social network structures as contributing factors to fake news detection.
The advent of deep learning has completely changed how fake news is detected. Tang and other researchers (2015) [12], Zhang et al. (2019) [13], and Chen et al. (2019) [14] developed a model that used recurrent neural networks (RNNs), convolutional neural networks (CNNs) and transformer architectures to capture local and global context patterns in a text for pseudo information.
Acknowledging that false information is not created in a vacuum, Shu et al. (2019) emphasized the role of social context in its detection, a model that analyzes news content and user behavior on social media platforms [15].
The increasing complexity of the models has necessitated the investigation of model decision strategies. For example, Ribeiro et al. (2016) proposed the LIME method for a local surrogate model to predict any black-box classifier [6].
Monti and others admit the dynamic strategies employed by the media. (2019) investigated the effectiveness of adversarial training via graph neural networks (GNNs) in enhancing the detection performance for fraudulent cases [16].
As the above overview highlights, the literature on misinformation detection is rich and diverse.
3. Methodology
A total of three datasets were utilized: the LIAR dataset [10] (id 1), which is followed by a smaller set of parsed article titles from Politifact (id 2), and a bigger set of parsed article bodies from Politifact (id 3). Some Politifact subsets were sourced from social networks such as Twitter and Facebook, which presented more concise news. This section describes how these three datasets are employed in building a data reliability-checking ML model.
It is impossible to detect whether the information is true or false by supervised ML methods without a source of truth. For the first dataset (LIAR; id 1), the three classes “true”, “half-true”, and “mostly true” were rated among the “mostly reliable” sources, while the classes “false”, “pants-fire”, and “barely true” were among the “mostly unreliable”. The second dataset (id 2) followed a similar pattern, simplifying the six classes into two categories: mostly reliable at one and mostly unreliable at zero. For the third dataset (id 3), we used a mostly reliable value of 1 and a mostly unreliable value of 0, simplifying the nine classes into two categories.
Every dataset includes all the normalized textual transformed data. This implies transforming all texts into small letters, excluding punctuation, unique signs, and digits, and reducing unnecessary gaps between words as much as possible.
Figure 1.
The figure depicts the first step of the TMining application. It outlines four key steps: loading data from a CSV file, tokenization to break text into words or phrases, data cleaning to remove noise such as stopwords and unnecessary characters, and stemming and lemmatization to simplify words to their base or root forms. This process is essential for preparing raw text for ML models.
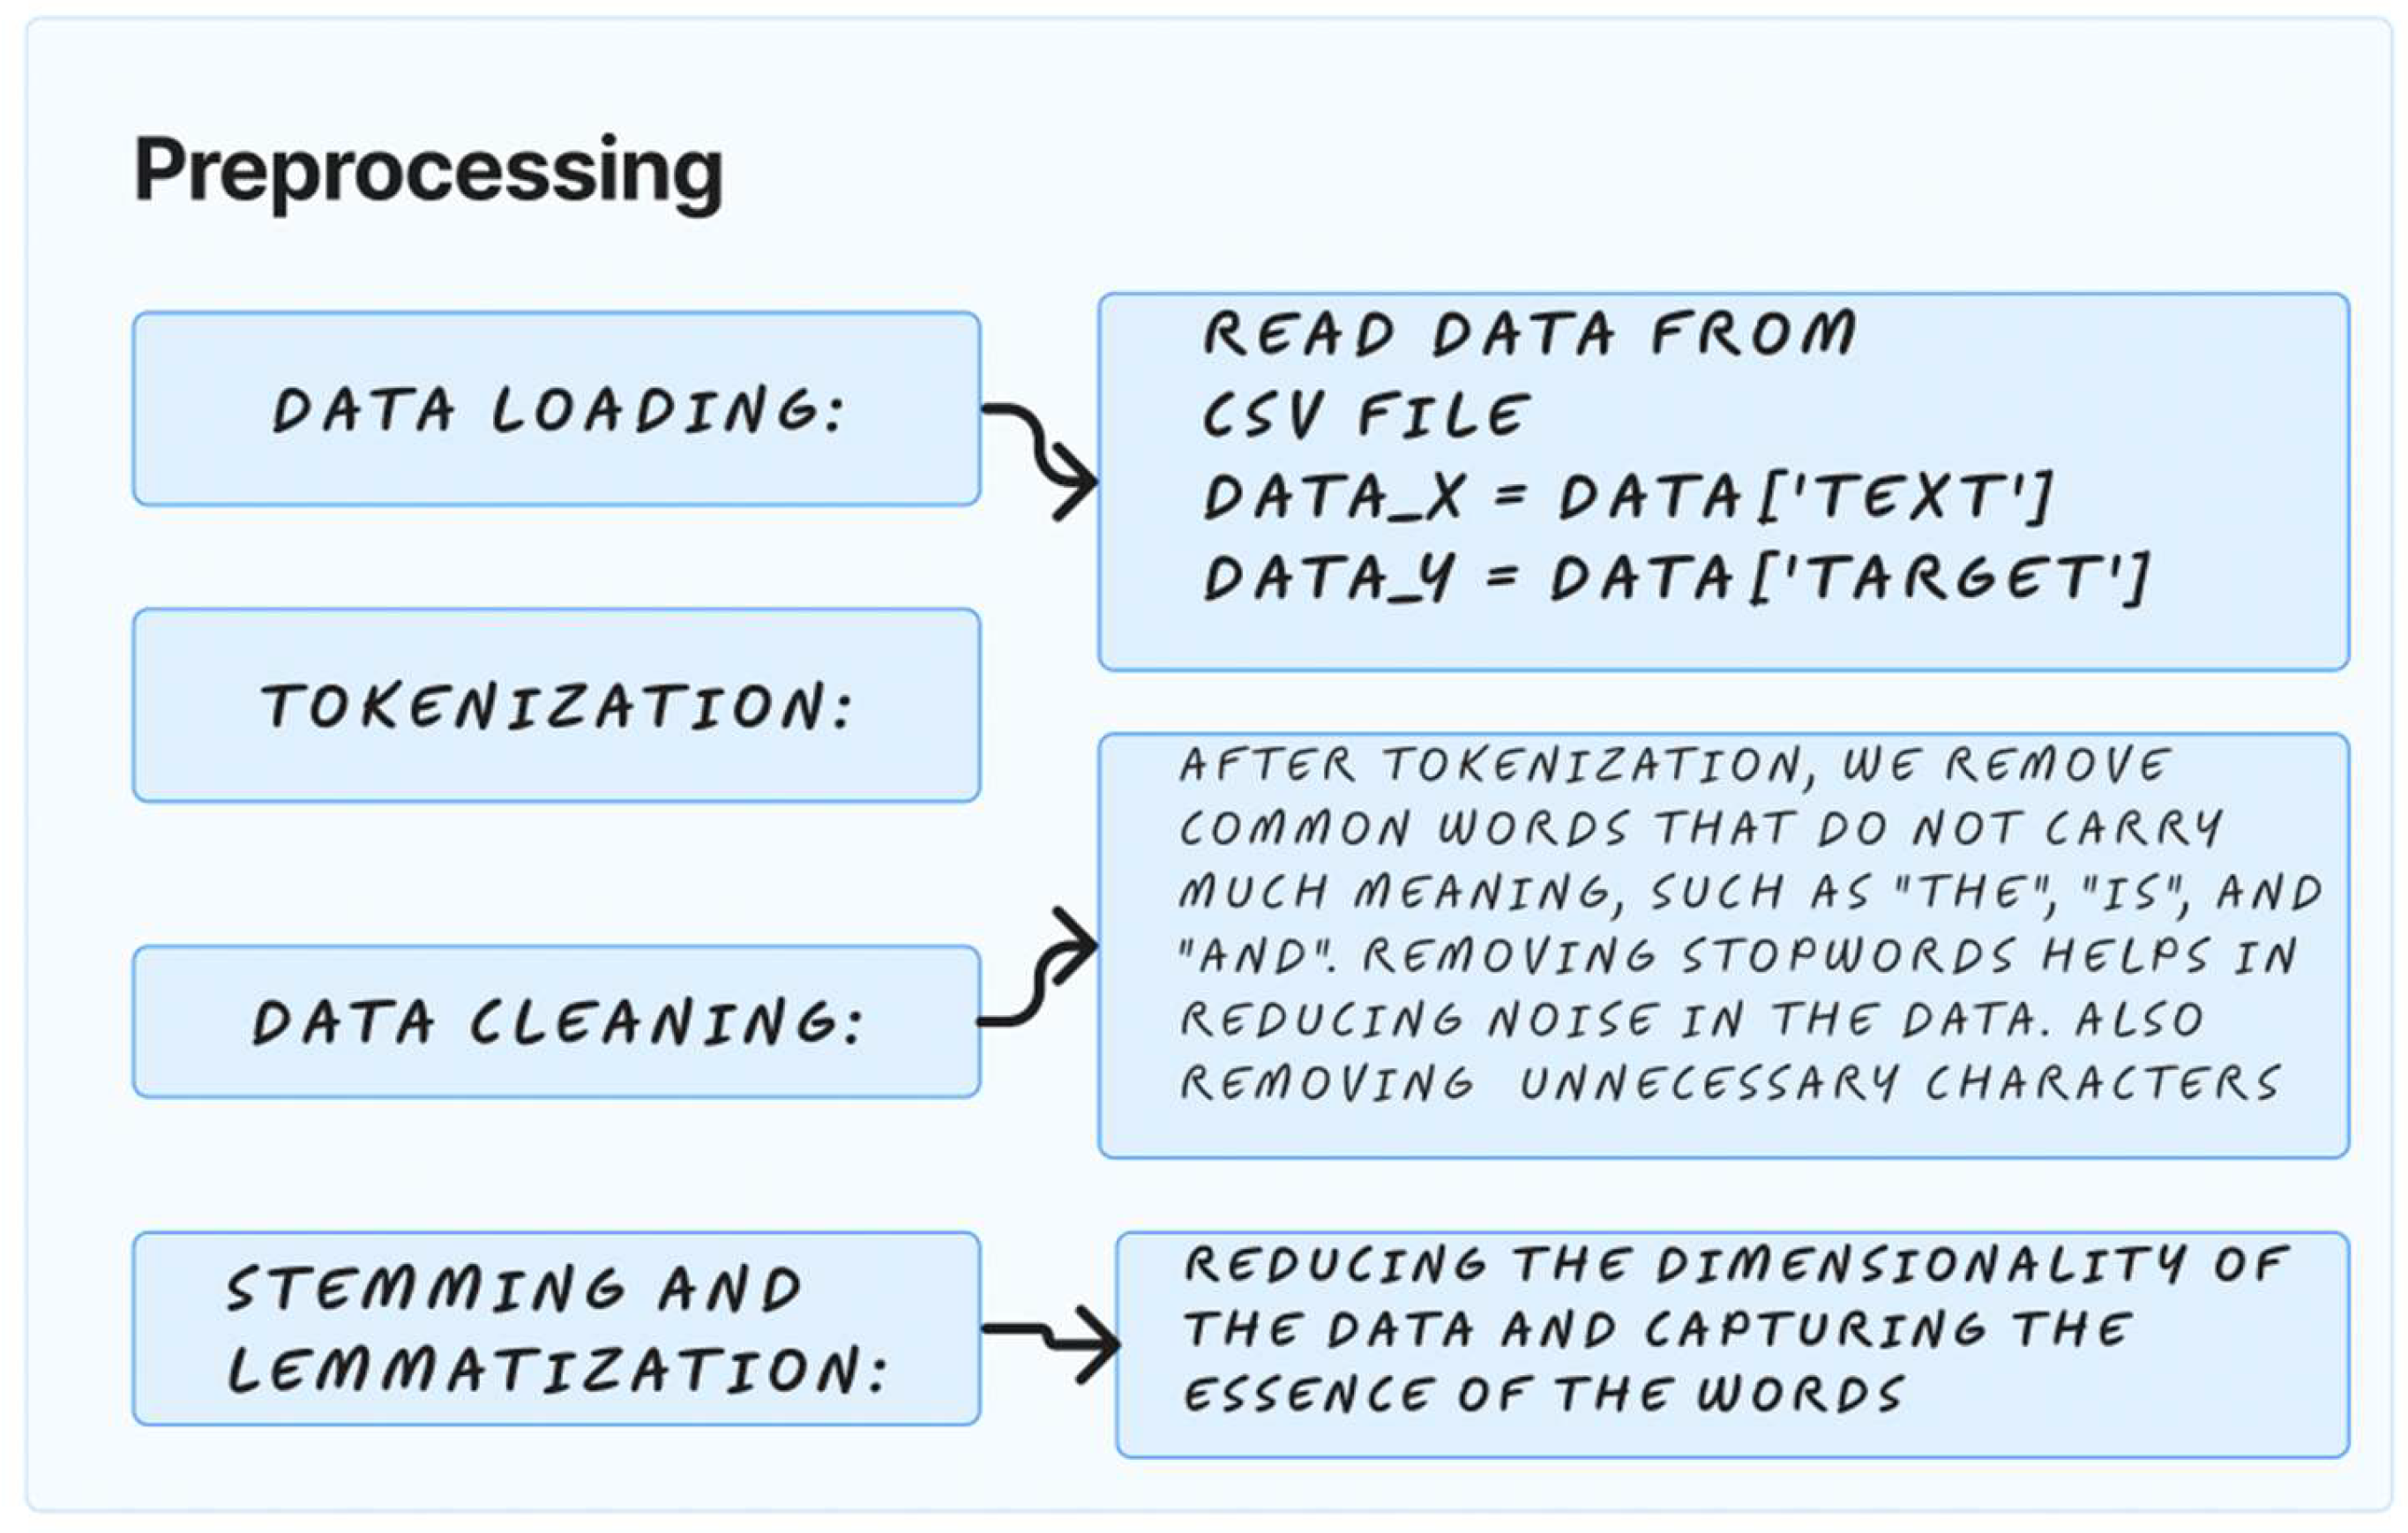
Figure 2.
The figure depicts the second step of the TMining application. It shows a collection of parameter settings for various components of the ML pipeline. The TF-IDF Vectorizer is set to not convert to lowercase and to consider terms that appear in at least 0.1% but not more than 95% of the documents. For model evaluation, ShuffleSplit is configured with a test size of 2% and a training size of 98%. The SVM Classifier uses a linear kernel, and probabilities are enabled. It has a cache size of 200 MB and a maximum of 1,000,000 iterations. Lastly, for model interpretability, LIME is set to explain the results using 40 features.
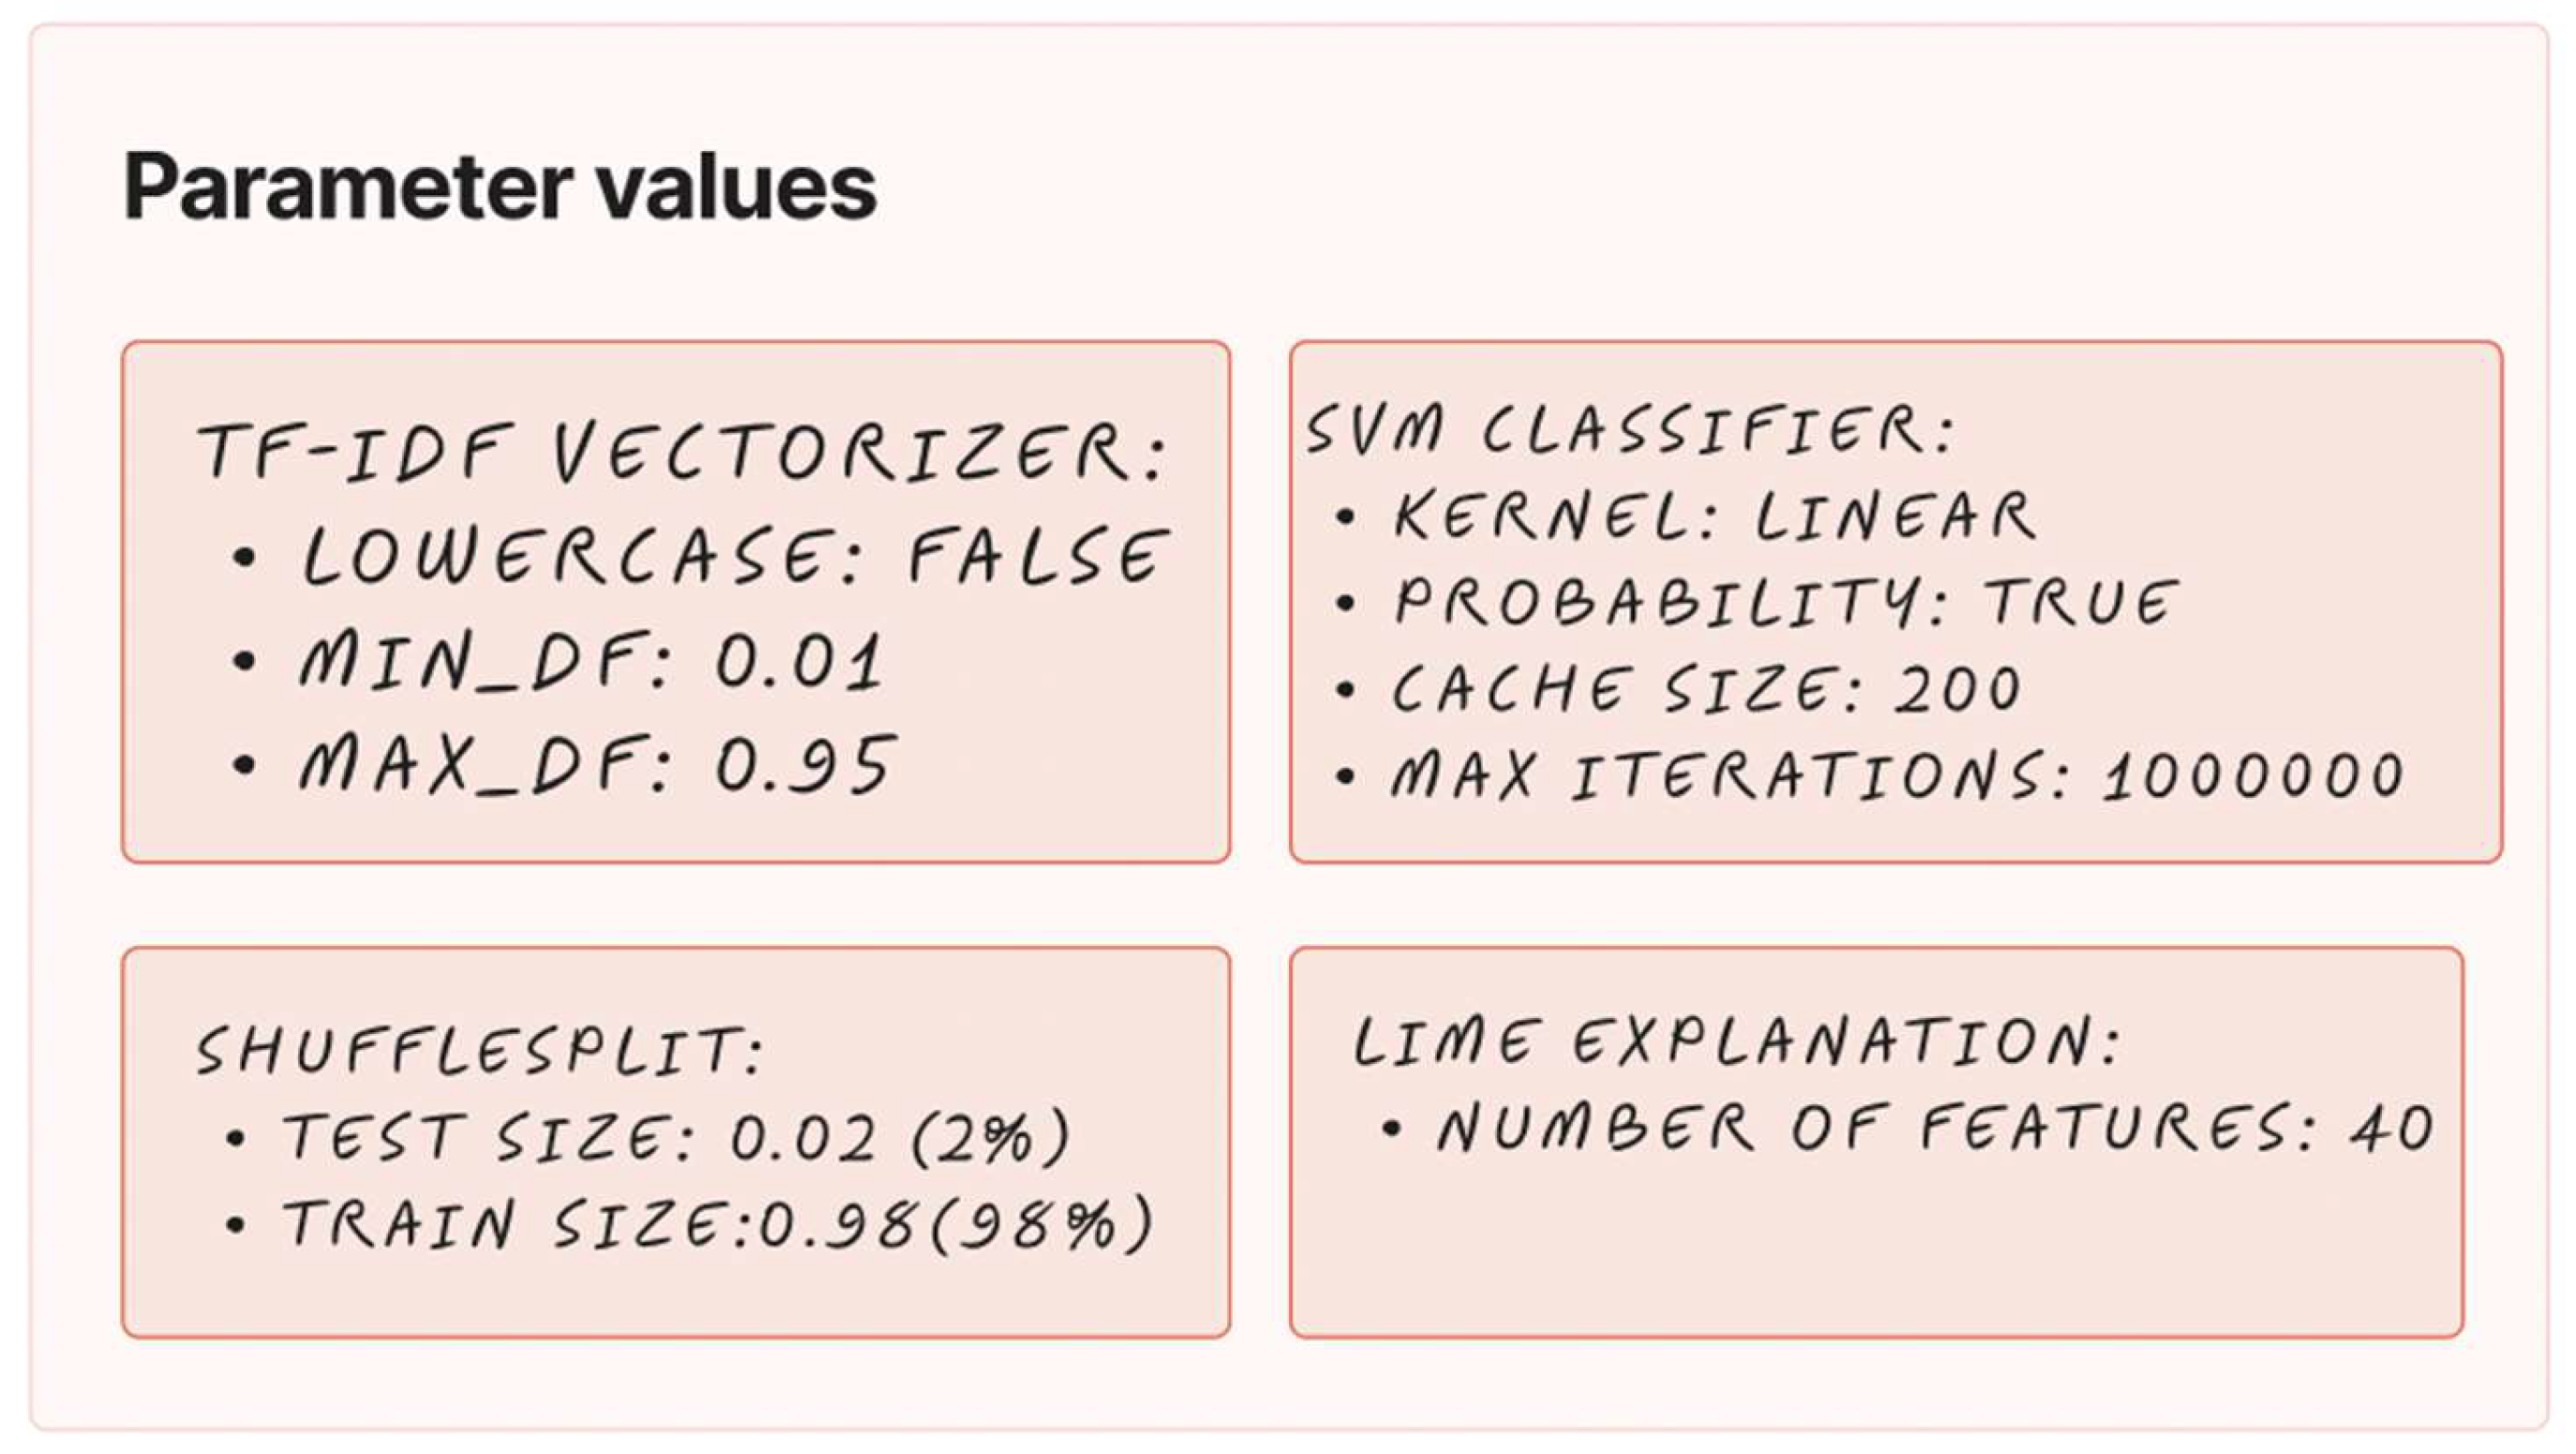
Figure 3.
The figure depicts the third step of the TMining application. It starts with data splitting using ShuffleSplit for a 98% training set and a 2% testing set. The pipeline includes TF-IDF vectorization with specific parameters for document frequency and an SVM classifier with a linear kernel and probability estimates. After defining the pipeline, the model is trained with the specified data, and the final step is saving the trained model using the “joblib” library.
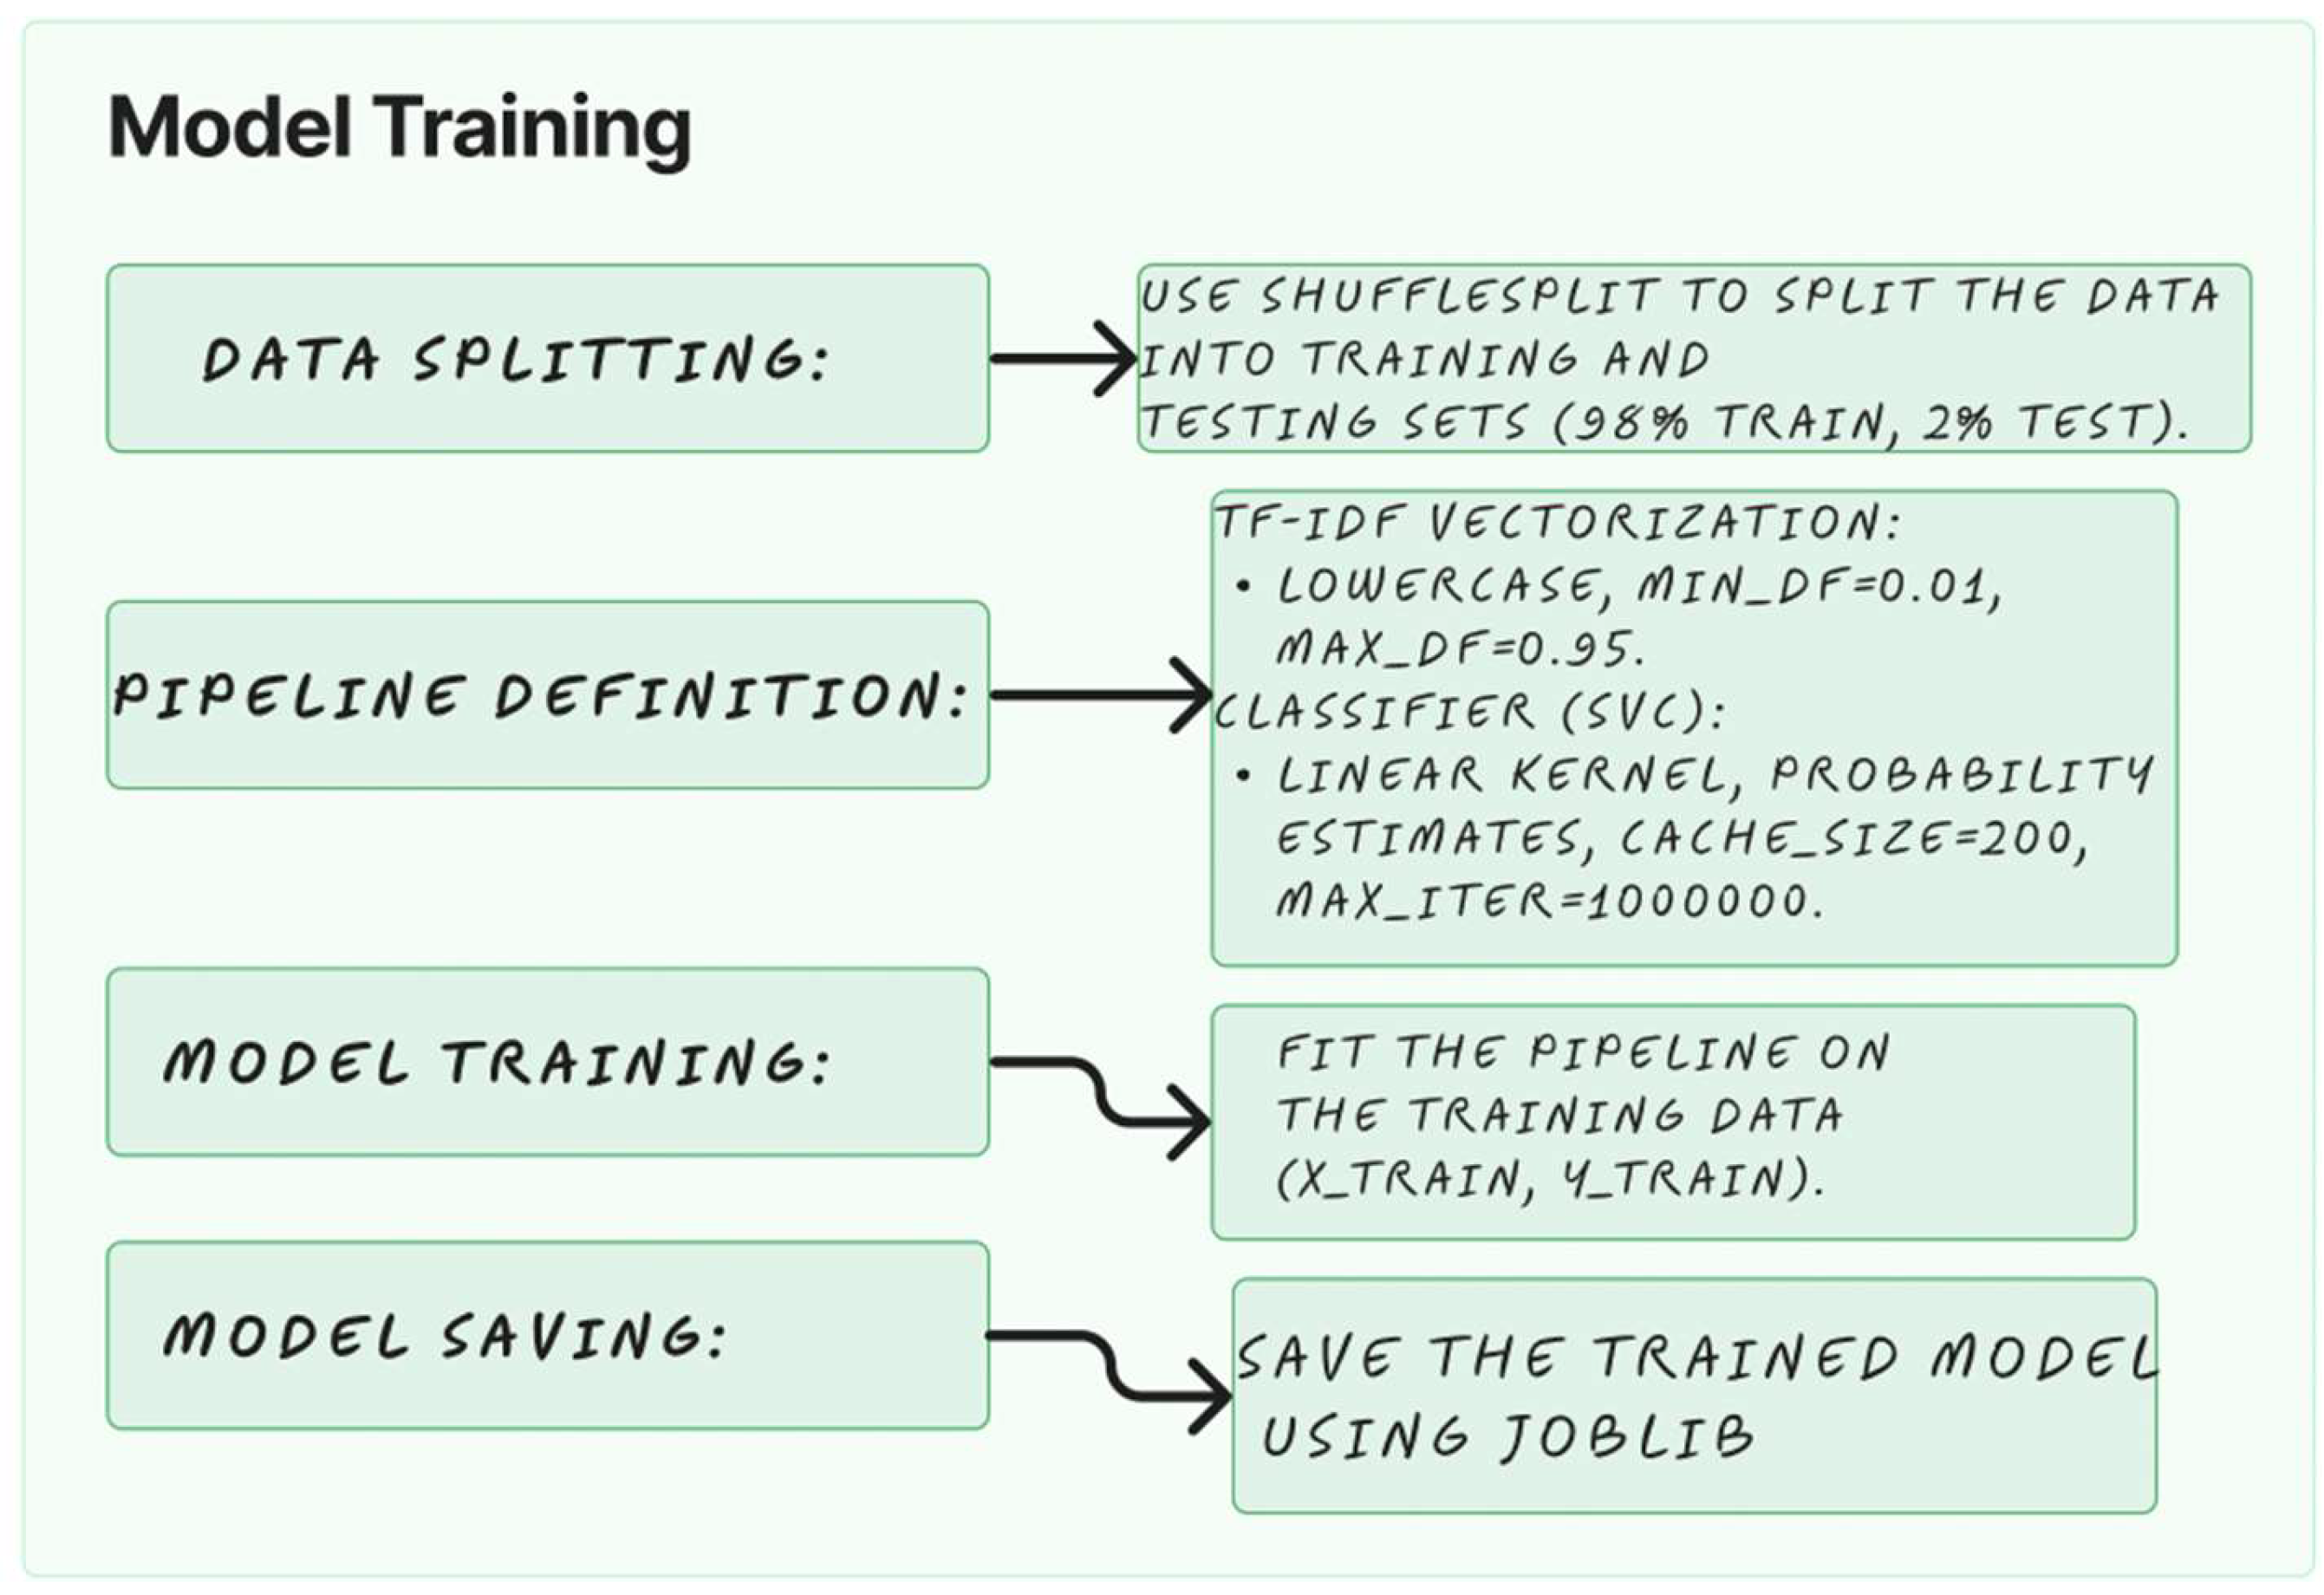
Figure 4.
depicts the fourth step of the TMining application. It details the performance metrics for an ML model. It includes model evaluation, where predictions are made on the test data and metrics such as accuracy and F1 score are calculated. It also highlights the use of LIME for model interpretability, where explanations are generated for a subset of test instances and saved as HTML files for visualization purposes.

The NLTK was used to break down the articles into words (tokenization). To facilitate uniformity and reduce dimensionality, stemming was performed using LancasterStemmer, thereby changing words to their stems.
Further work was performed with the TfidfVectorizer modifier, a key component of the scikit-learn library. The idea behind the TfidfVectorizer is named TF-IDF. This TF controls the number of times a word appears in a document. When two statistical measures assess the importance of a word for a document in a corpus.
Documents differ in length, so the word frequency is naturally greater for longer documents. However, that does not mean that the position matters much. The IDF solves this problem by measuring the importance of the term. Common words in each document (such as ‘is’, ‘an’, and ‘the’) contain more specific information, so the IDF of these words is close to zero.
The TfidfVectorizer converts the text into feature vectors that can be used as input into the estimator. It converts a stack of documents into a TF-IDF object matrix. Thus, it provides a statistical measure of the importance of words, reducing the impact of tokens that appear frequently in a corpus and are not as informative as those that occur in a smaller proportion of the training corpus.
The models used were based on traditional ML algorithms:
- Support Vector Classifier (SVC): The SVC is a type of SVM used for classification problems. This method classifies data points in multidimensional space uniquely and divides the data into classes by finding the best hyperplane. The algorithm takes the input data and uses a line (2D space) or hyperplane (3D space and above) that separates the data into the classes with the greatest margin output.
- Support Vector Regression (SVR): Unlike SVC, SVR is used for regression problems. Instead of trying to fit the maximum street size possible between two classes while limiting margin violations, SVR tries to fit as many cases as possible in the street. The street width hyperparameter is called the epsilon and governs. SVR is a linear regression in a high (infinite) dimensional space.
- Logistic Regression: A logistic regression is a statistical model that uses a logistic function to model a binary dependent variable. In other words, the probability of an event is determined by fitting the data to the logistic curve. The results can be thought of as the probability of the given input point belonging to a class (mostly reliable or mostly unreliable).
K-fold cross-validation: K-fold cross-validation involves splitting a dataset into k subsets. The model is trained and tested k times through multiple iterations, using a different subset as the validation set each time. The performance metrics obtained from each iteration are averaged to gauge the model’s overall predictive performance. We divided the datasets at a proportion of 80/20, accounting for 80% of the training data and 20% of the testing data. This methodology enhances the models’ reliability.
We used the LIME approach to explain our model’s predictions. This approach involves perturbing the input data it receives, noting its assumptions, and finally, training a simpler model to approximate what the complex model should do. This approach helped us understand which of the attributes was significant.
Model performance was measured using performance metrics such as accuracy, F1 score, and the area under the receiver operating characteristic curve (AUC-ROC).
We aim for a comprehensive methodology that covers many stages, starting with the collection of data and continuing until we explain how the model works. The basic dataset overview for the computational experiments is presented in Table 1.
The dataset was divided into two subsets: a training set and a test set. The main steps for preparation are as follows:
- reading and preparing the data;
- initialization and ML;
- data analysis.
4. Results of the Experiments
Following the completion of the empirical analysis, we employed three separate prototypes to evaluate each data cluster: the first dataset (id 1), the second dataset (id 2), and the third dataset (id 3). The quantified outputs of the TMining application are visualized in the subsequent tabular representation.
Table 2 shows the results for the three diverse datasets. Changes were made in the TMining application data processing applied for data processing, which significantly improved the outputs. The numerical data and accuracy of the results demonstrated a noticeable increase. In terms of confirming the effectiveness, the 5-fold cross-validation method is the most reliable. For each dataset, three different models: SVC, SVR, and Logistic Regression, were used, each yielding diverse performance metrics. In particular, the third dataset yielded satisfactory results with the SVC model after 5-fold cross-validation, with an average accuracy of 0.793 and an average error rate of f1=0.883.
Figure 5 presents varying coefficients assigned to a keyword bearing on the publication classification. The term “false” is allocated a coefficient of 0.14, whereas the keyword “evidence” is assigned a coefficient of 0.07, indicating a primary association with unreliable sources. Interestingly, for the term “Facebook”, a coefficient of 0.06 is assigned to “mostly unreliable”.
Figure 6 shows the explanation of another model decision. A “Mostly reliable” prediction with 0.7 probability is presented. Specifically, the term “mostly” has a coefficient of 0.06, paralleling the coefficient of the word “miss”, which equals 0.06 as well.
As demonstrated in Figure 2 and Figure 3, we can classify the outcomes into two exhibited categories: ‘positive’, which corresponds to a condition of “mostly reliable”, and ‘negative’, which identifies as “mostly unreliable”. The weighting system significantly impacts the likelihood of predictions. Specifically, Figure 2 suggests that, based on the calculations of word quantification within the given document, the system predicts that the given text is “mostly unreliable” with a probability equal to 0.92. In a similar context, Figure 3 illustrates that the model predicts the given text as “mostly reliable” with a probability equal to 0.7.
Figure 7 shows that specifically, the term “development” equals the 0.08 coefficient, and the word “rank” equals the 0.05 coefficient.
Figure 8 explains the “mostly unreliable” interpretation of another LIME explanation. Specifically, the term “claim” equals the -0.125 coefficient, and the word “blue” equals the -0.115 coefficient.
Figure 7 and Figure 8 demonstrate the results from the third dataset, and the SVC model was used to analyze the text fact-checking.
The illustrations in Figure 9 are divided into three distinct charts: the learning curve, the model’s scalability, and the model’s performance:
- Learning Curve: Shows the number of training examples on the X-axis and the corresponding model score, such as the accuracy and F1 score, on the Y-axis. The red curve represents the score of the training cohort, while the green curve represents the cross-validation score. It provides information about how well the model is learning based on the number of training examples.
- Model scalability: The chart explicates the model’s scalability by showing the number of training sets on the X-axis and the time taken to fit the model on the training data on the Y-axis. It visualizes how the fit time changes with fluctuations in the size of the training set, providing a clear representation of the model’s scalability.
- Model Performance: This graph shows the relationship between the number of fits (X-axis) and the model performance (Y-axis), allowing us to explore how the model’s performance changes with different numbers of fits.
The ROC curve depicted in Figure 10 is a visual representation of the performance of the news reliability detection model discussed in the provided document. The AUC was 0.89, indicating high accuracy in classifying news articles. This high AUC value indicates that the model has strong discriminative power, far surpassing the baseline performance of 0.5 that would be expected by random chance. As elaborated in this paper, such a model is crucial for identifying misinformation in the media space.
5. Application Infrastructure
The TMining application is a powerful ML tool optimized for processing and analyzing extensive text data. It has a command-line interface that relies on input to execute instructions directly.
The command line commands include
- -h, --help: Used to provide program usage information and describe available options.
-
train -dataset_path ./data/factcheck.csv [-x text] [-y target] [-save_to ./result] [-model SVC] [-vectorizer TfidfVectorizer] [-kfold 10] [-test_size 0.2]: Primarily used to train ML models on the specified CSV-formatted data.
- ○
- dataset_path: path to the dataset.
- ○
- x: name of the column containing the input text. Default: “text”
- ○
- y: name of the column containing the output labels. Default: “target”
- ○
- save_to: the path of saving the trained model file. Default: The path where the program starts. Default model name: “model.mdl”.
- ○
- model: select a training model. Three models are available: SVC, SVR, and LogisticRegression. Default model: SVC.
- ○
- vectorizer: select the text vectorization. Three approaches are available. CountVectorizer, TfidfVectorizer, and HashingVectorizer. Default vectorizer: TfidfVectorizer.
- ○
- kfold: number of folds to use for cross-validation. Default 1.
- ○
- test_size: size of the test set. Default 0.
-
validate -model_path ./model.mdl -dataset_path ./data/factcheck.csv [-x text] [-y target] [-test_size 0.2]: Validate the model using the provided dataset.
- ○
- model_path: path to the trained model.
- ○
- dataset_path: path to the dataset.
- ○
- x: name of the column containing the input text. Default: “text”
- ○
- y: column name containing the output labels. Default: “target”
- ○
- test_size: size of the test set. Default: 0.2.
-
predict -model_path ./model.mdl -text “fake news text”: This may be used for prediction via a previously trained model or to extract information from a given text.
- ○
- model_path: path to the trained model.
- ○
- text: text for prediction.
-
visualize -model_path ./model.mdl -text “fake news text” [-features 60] [-save_to ./result]: Generates an HTML visualization of model predictions for a given text input using LIME (local interpretable model-agnostic explanations).
- ○
- model_path: path to the trained model.
- ○
- text: next to predict.
- ○
- features: the maximum number of tokens displayed in the table. Default: 40.
- ○
- save_to: save the rendered results in HTML. Default: “./results/1.html”.
-
host -model_path ./model.mdl [-address 0.0.0.0] [-port 5000]: Can be used to host the trained model as a service on the specified port, enabling other systems or applications to take advantage of the model for prediction tasks
- ○
- model_path: path to the trained model.
- ○
- address: IP address for the API host. Default: 0.0.0.0.
- ○
- port: port for the API host. Default: 5000.
In the infrastructure sector, this system plays an important role in the extensive text mining process. Its processes include model training to classify text information, providing this capability as a service to other modules in connected systems.
Hosting an application programming interface (API) based on a trained model. There are two endpoints in the API:
- /model/predict?text=here is text (GET method): Gets the text for the prediction and returns the predicted result in JSON format.
- /model/visualize?text=here is text (GET method): Gets the text for the prediction and returns the image with prediction and model explanation.
It clarifies the application functionality needed to address model training, hosting, and API usage for text prediction and visualization.
6. Conclusion
The purpose of this study was to highlight the development of a dynamic ML application that effortlessly detects manipulative context to measure text reliability. Three datasets were used to facilitate this exploration; these texts were segregated into two types of subsets: training and testing. Furthermore, these textual segments have been converted into vectors for easy input into the ML model.
The open-source TMining (Text Mining) application proposed in this study amalgamates diverse methodologies, supplementing the interpretability of models. The application relies on the Natural Language Toolkit (NLTK) for data processing. We ensure the results are clear and reliable when using ML algorithms, such as SVM. The findings of this study confirm the effectiveness of the approach adopted, and the k-fold cross-validation method provides evidence of the model’s reliability.
The results showed that the first dataset led to reliable accuracy for all the models used to execute logistic regression, SVC, and SVR. The models’ accuracy based on the initial LIAR dataset demonstrated suboptimal results on other papers. As described before, it is not optimal to check whether the statement is true with supervised learning. Moreover, the dataset was rearranged, and the result was much better (~0.6 accuracy) using the TMining application. The models’ accuracy based on the second dataset did not show great performance as there was not enough training data. The models’ accuracy based on the the third dataset displayed excellent results for all three models and showed the remarkable accuracy of the SVC model in fact-checking (~0.8 accuracy).
Utilizing only supervised ML techniques, without a data source of truth, we cannot accurately ascertain the authenticity of the data, we can only check the manipulative context. The next step of this research will be building a fact-checking tool using LLMs (Large Language Models) to check the source of truth and its related statements.
To recapitulate what was said in this paper, the TMining application represents an optimal solution within its field, exemplifying the pinnacle of current methodologies and techniques advancing the scientific community and can be used for different purposes, from data reliability analysis to authorship and unique text style recognition. The fact that the TMining application is publicly available for the scientific community enriches it even further for broader development and scientific research.
Here is the link to the open-source repository of the TMining (Text Mining) application: https://github.com/MaxLupey/TMining
References
- Aïmeur, E. Amri, S., Brassard, G. (2023). Fake News, Disinformation and Misinformation in Social Media: a Review, Soc. Netw. Anal. Min. 13(1): 30.
- Apejoye, A. (2015). Comparative Study of Social Media, Television and Newspapers’ News Credibility.
- Yuan, L., Jiang, H., Shen, H., Shi, L., Cheng, N.. (2023). Sustainable Development of Information Dissemination: A Review of Current Fake News Detection Research and Practice. 458. [CrossRef]
- Lazer, D. M. J. et al. The Science of Fake News. Science 359, 1094–1096 (2018). https://www.science.org/doi/10.1126/science.aao2998. [CrossRef]
- Vlachos, A., & Riedel, S. (2014). Fact Checking: Task Definition and Dataset Construction. ACL Workshop.
- Ribeiro, M. T., Singh, S., & Guestrin, C. (2016). “Why Should I Trust You?” Explaining the Predictions of Any Classifier. KDD ‘16.
- Conroy, N. K., Rubin, V. L. & Chen, Y. Automatic Deception Detection: Methods for Finding Fake News. Proc. Assoc. Inf. Sci. Technol. 52, 1–4. (2015). https://doi.org/10.1002/pra2.2015.145052010082. [CrossRef]
- Castillo, C., Mendoza, M., Poblete, B. (2011). Information Credibility on Twitter. In: Proceedings of the 20th International Conference on World Wide Web, pp 675–684.
- Khanam, Z., B. N. Alwasel, H. Sirafi and M. Rashid. Fake News Detection Using Machine Learning Approaches. [CrossRef]
- Wang, W. Y. (2017). “Liar, Liar Pants on Fire”: A New Benchmark Dataset for Fake News Detection. ACL ‘17. Available at https://paperswithcode.com/dataset/liar.
- Zhou, X., Zafarani, R. (2020). A Survey of Fake News: Fundamental Theories, Detection Methods, and Opportunities.
- Tang, D., Qin, B., Liu, T. (2015). Document Modeling with Gated Recurrent Neural Network for Sentiment Classification.
- Zhang et al. (2019). Simple RNN of Hidden Layer.
- Chen, Y., Cheng, Q., Cheng, Y.,Yang, H. (2019). Applications of Recurrent Neural Networks in Environmental Factor Forecasting. [CrossRef]
- Shu, K. , Wang, S., Liu, H. (2019). Beyond News Contents: The Role of Social Context for Fake News Detection.
- Monti, F., Frasca, F., Eynard, D., Mannion, D., Bronstein, M.M. (2019). Fake News Detection on Social Media Using Geometric Deep Learning.
- Lupei, M., Mitsa, O., Sharkan, V., Vargha, S., Gorbachuk, V. The Identification of Mass Media by Text Based on the Analysis of Vocabulary Peculiarities Using Support Vector Machines. 2022 International Conference on Smart Information Systems and Technologies (SIST), 2022. (DOI: 10.1109/sist54437.2022.9945774). [CrossRef]
- Lupei, M., Mitsa, O., Sharkan, V., Vargha, S., Lupei N (2023). Analyzing Ukrainian Media Texts by Means of Support Vector Machines: Aspects of Language and Copyright.
Figure 5.
Identification of the text fragment belonging to the “Mostly unreliable” group on the SVC model for the third dataset. The image appears to display a LIME (Local Interpretable Model-agnostic Explanations) visualization, which is a technique used to explain the predictions of a ML model. The visualization indicates that the model predicts the instance as “Mostly unreliable” with a high probability of 0.92. The words contributing to this classification, such as “false”, “claim”, and “Facebook”, have weights shown, suggesting their influence on the prediction. “Mostly reliable” features like “factcheck” and “author” have lower weights and are less influential in this prediction.
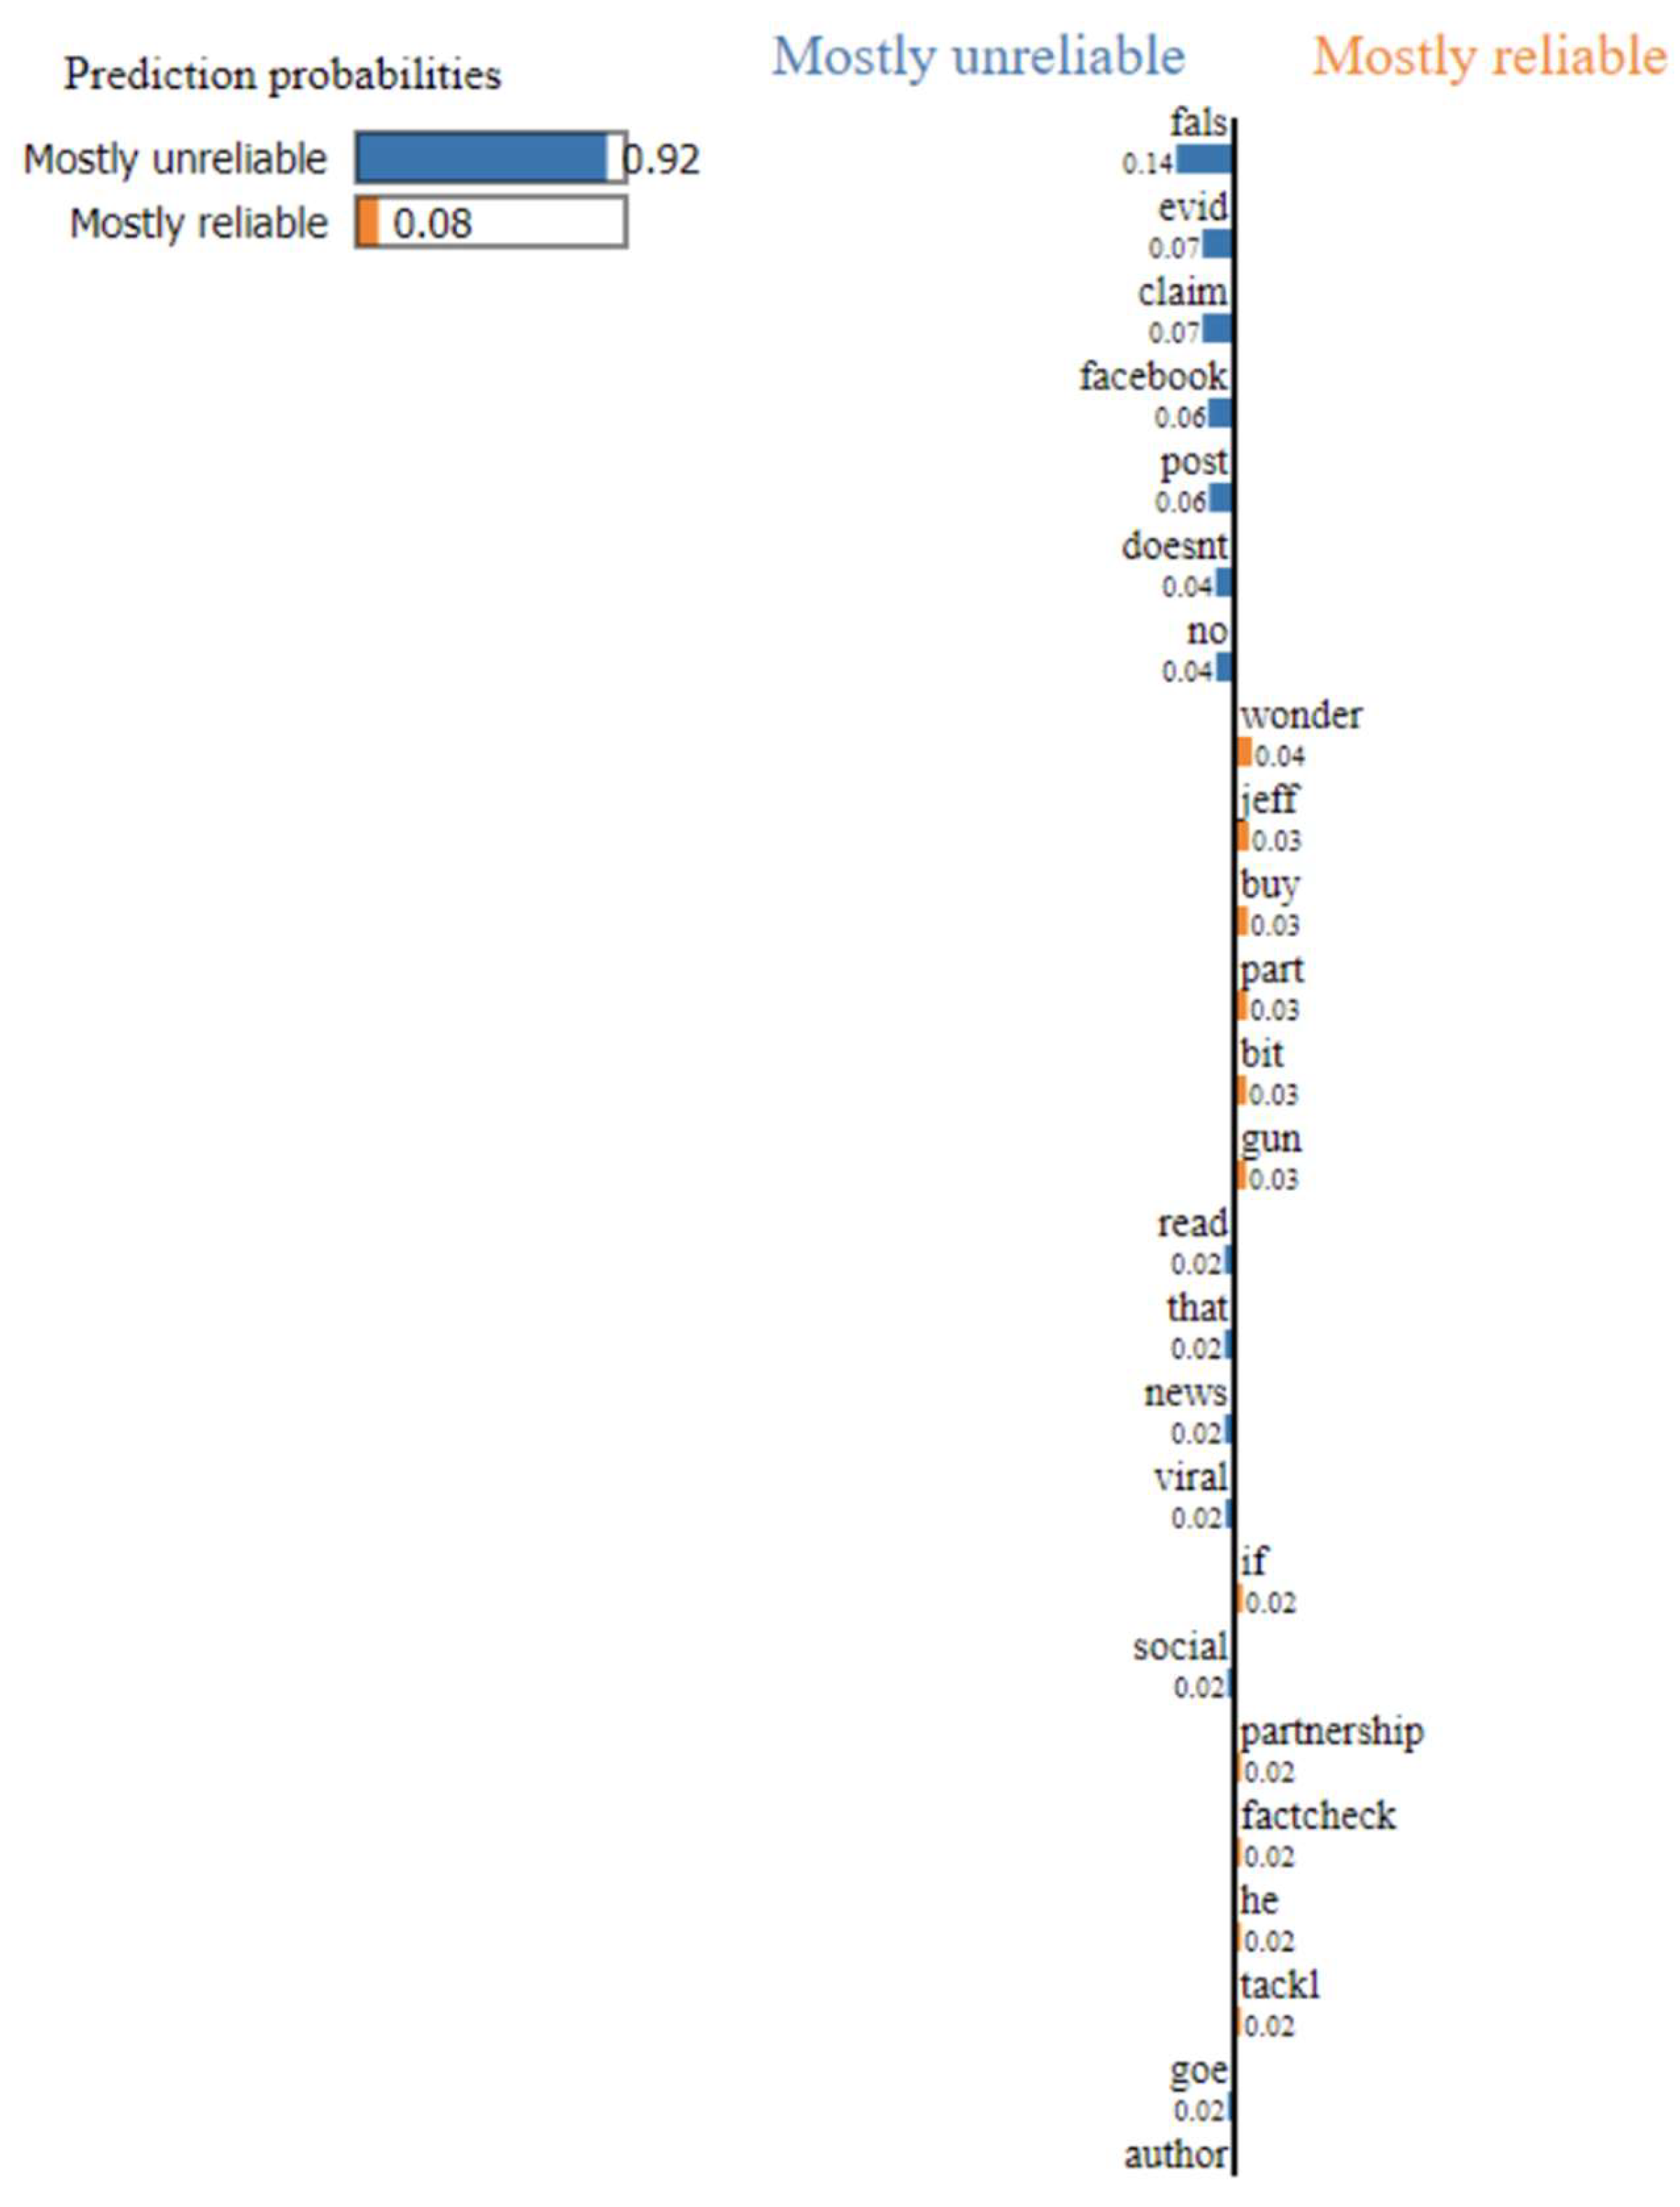
Figure 6.
The text fragment belonging to the “mostly reliable” group on the SVC model for the third dataset is identified. The image is a LIME (Local Interpretable Model-agnostic Explanations) visualization showing the prediction probabilities of a text being classified as “Mostly unreliable” or “Mostly reliable”. The model predicts with a 70% probability that the text is reliable. The bar chart lists words from the text with their corresponding weights, indicating how each word influences the model’s prediction of being reliable or unreliable. Words like “true”, “vote”, and “florida” are some of the features contributing to the text’s reliability.
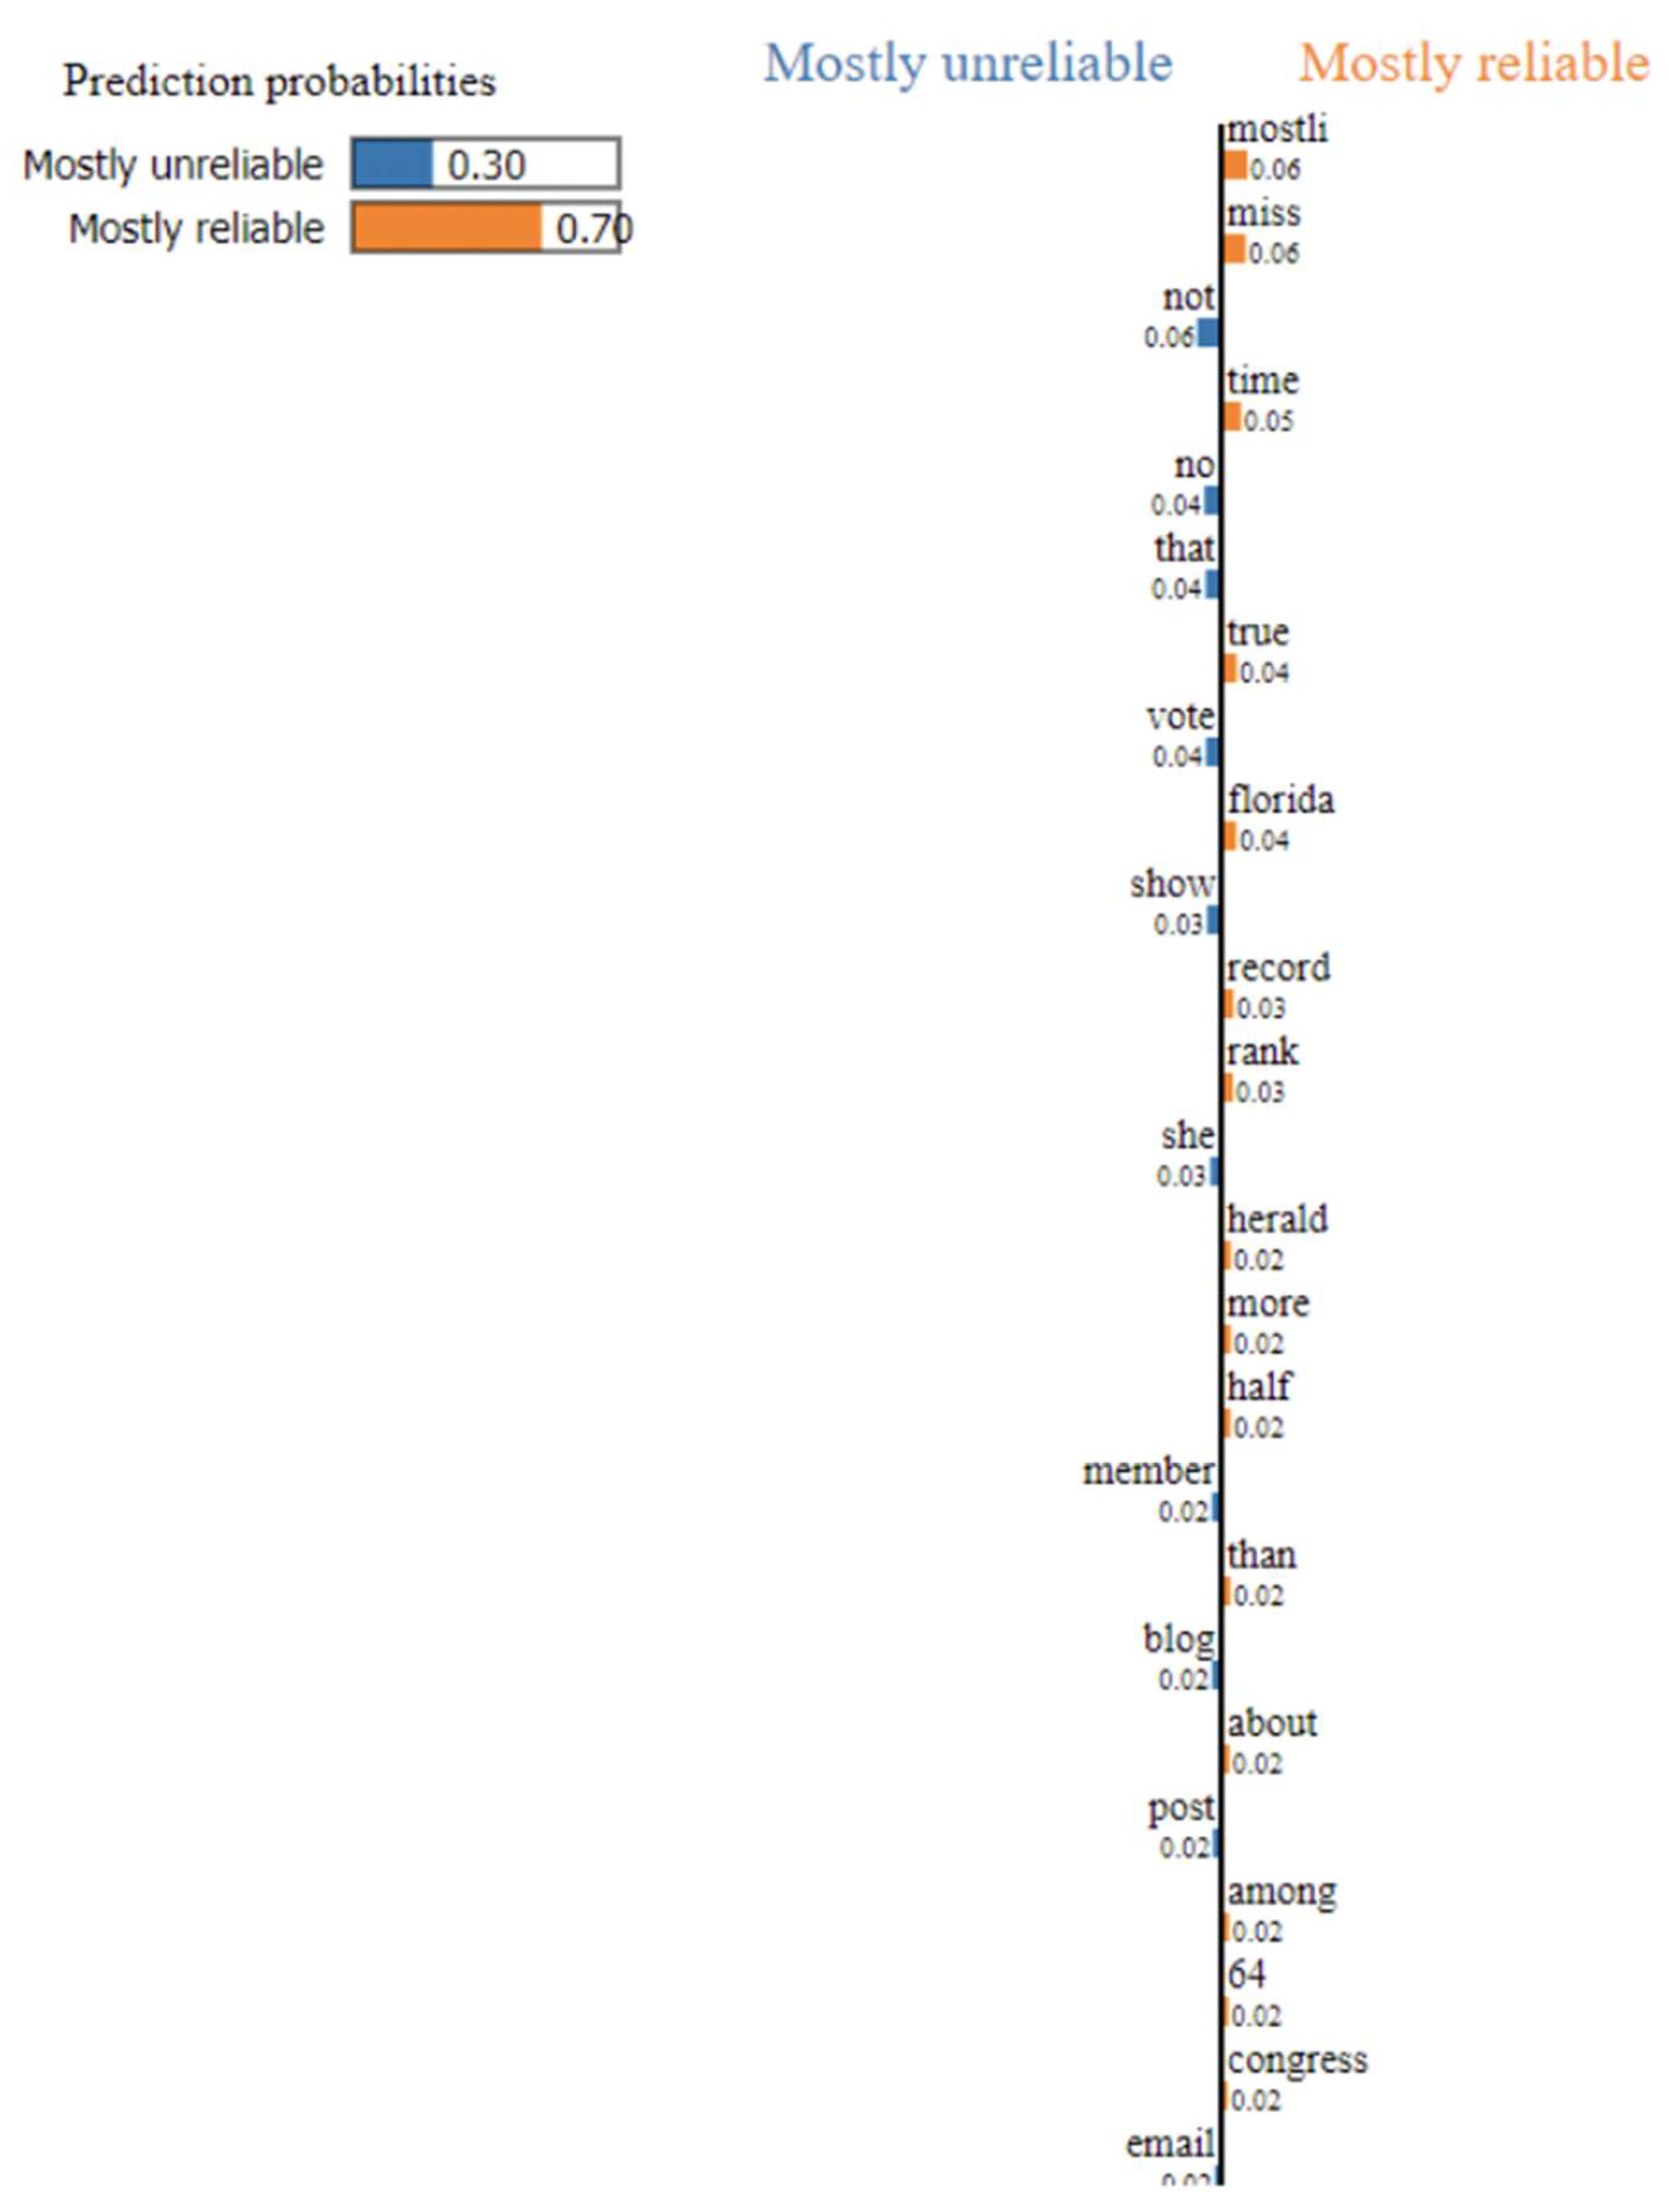
Figure 7.
Local explanation of a class belonging to the “mostly reliable” class in the SVC model. This image is a bar chart from a LIME explanation showing the local feature importance for a text classified as “mostly reliable”. The green bars indicate features that contribute positively to this class, suggesting elements the model associates with reliability. The red bars indicate features that contribute negatively, suggesting aspects that the model associates with unreliability. Key terms such as “research”, “administration”, and “world” positively influence the model’s decision, whereas words like “development”, “foundation”, and “gross” seem to push the decision toward unreliability.
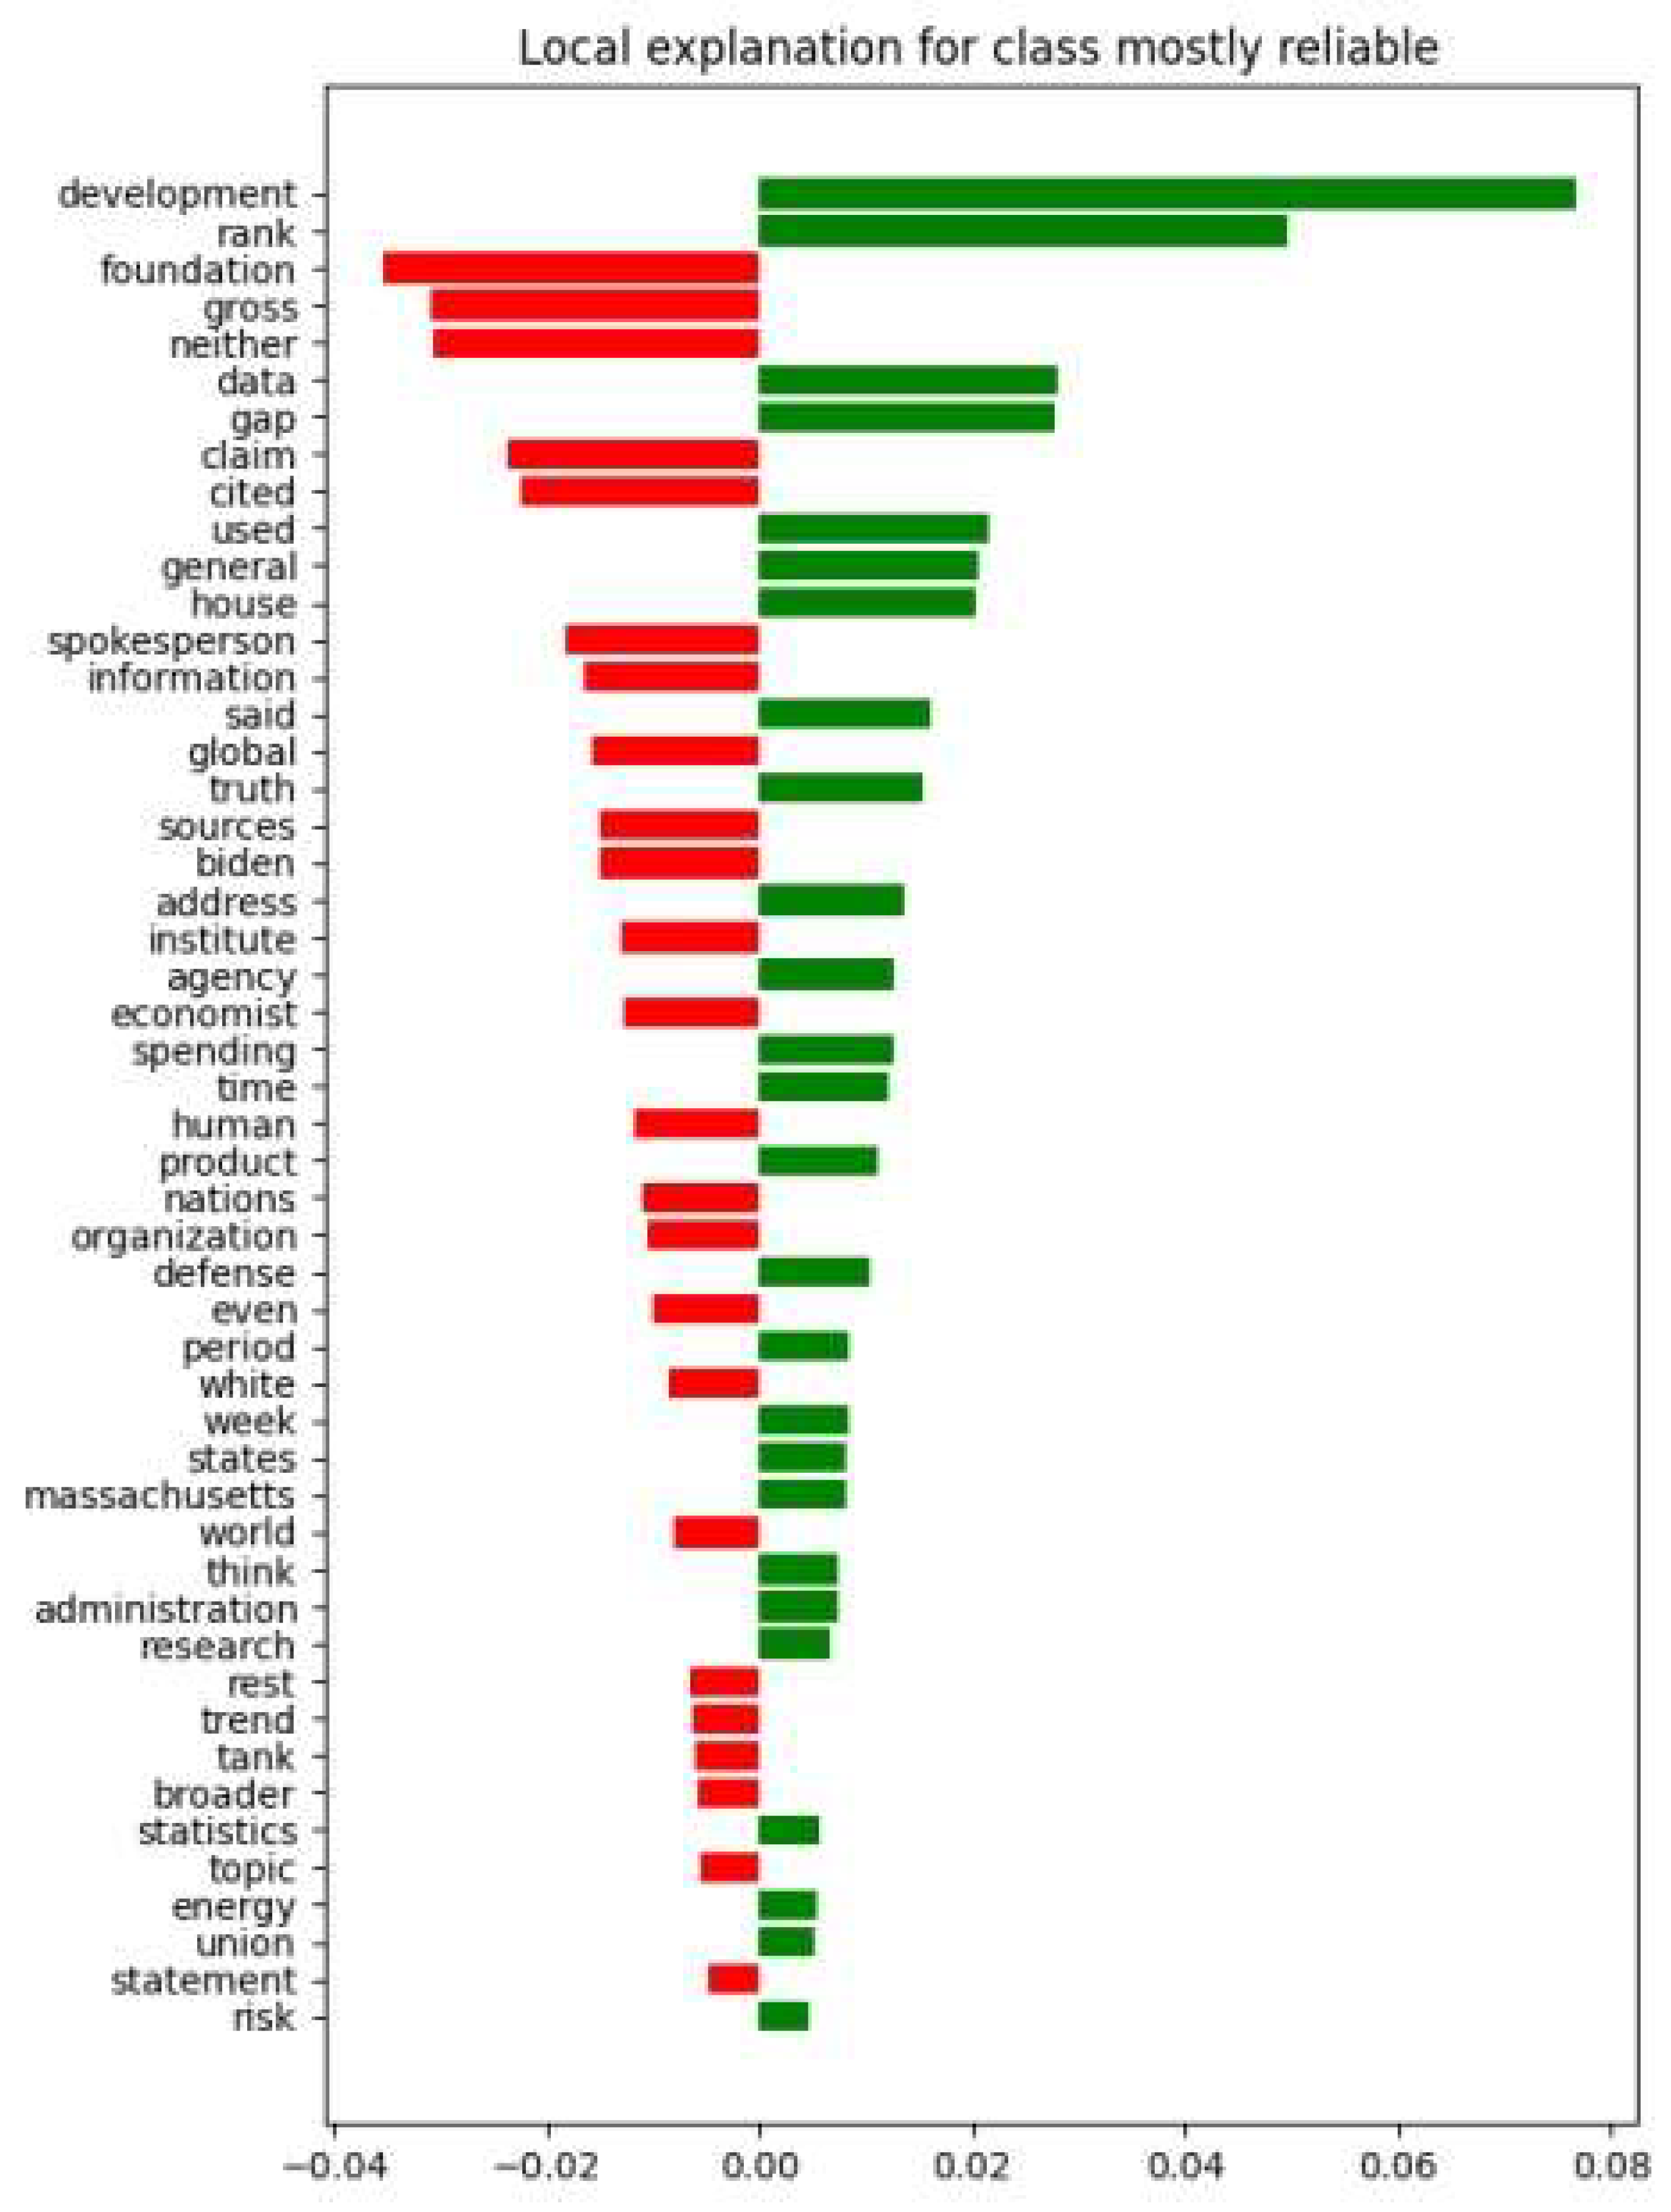
Figure 8.
Local explanation of a class belonging to the “Mostly unreliable” class in the SVC model. In this LIME visualization, the model predicts a class of “mostly unreliable”. The chart illustrates which words increase or decrease that prediction likelihood. Red bars represent words that push the prediction towards unreliability, while green bars indicate words that contribute to the text being perceived as more reliable. Notable terms like “claim”, “article”, and “trump” have strong red bars, heavily influencing the model towards an “unreliable” prediction, whereas terms like “senate”, “republican”, and “vote” have smaller green bars, indicating a lesser influence towards reliability.
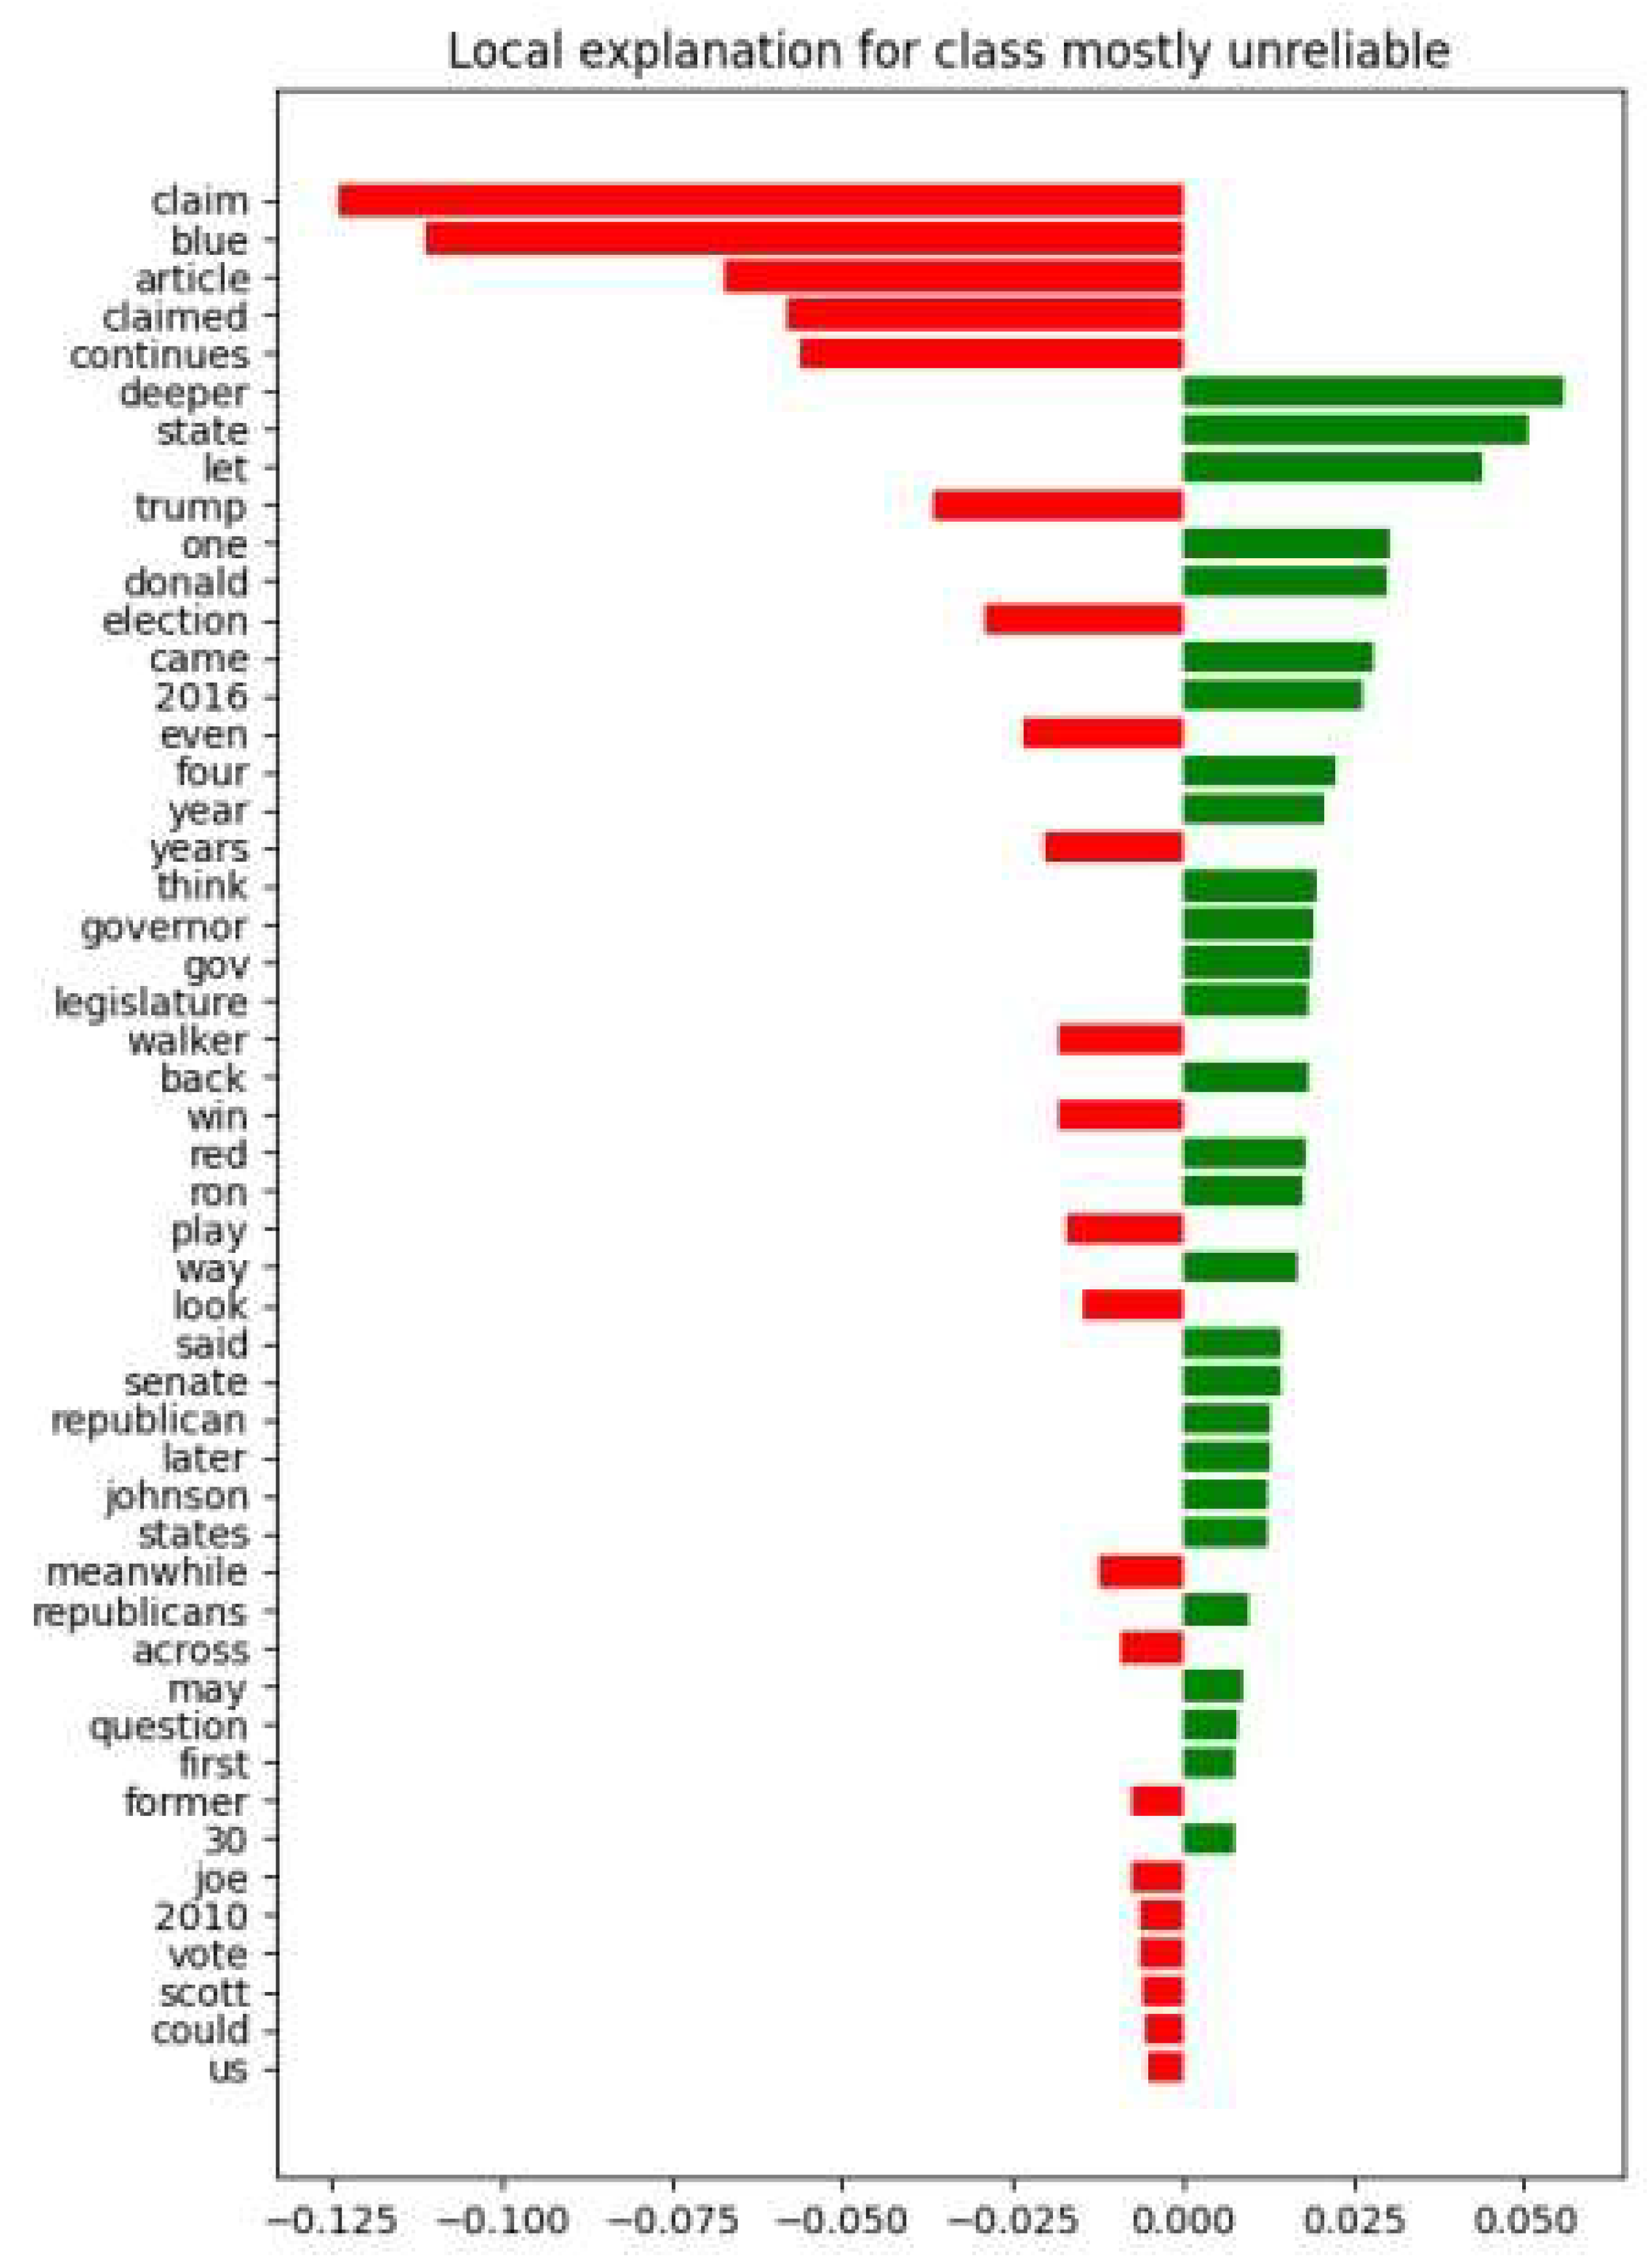
Figure 9.
Chart of SVC model performance with the third dataset.
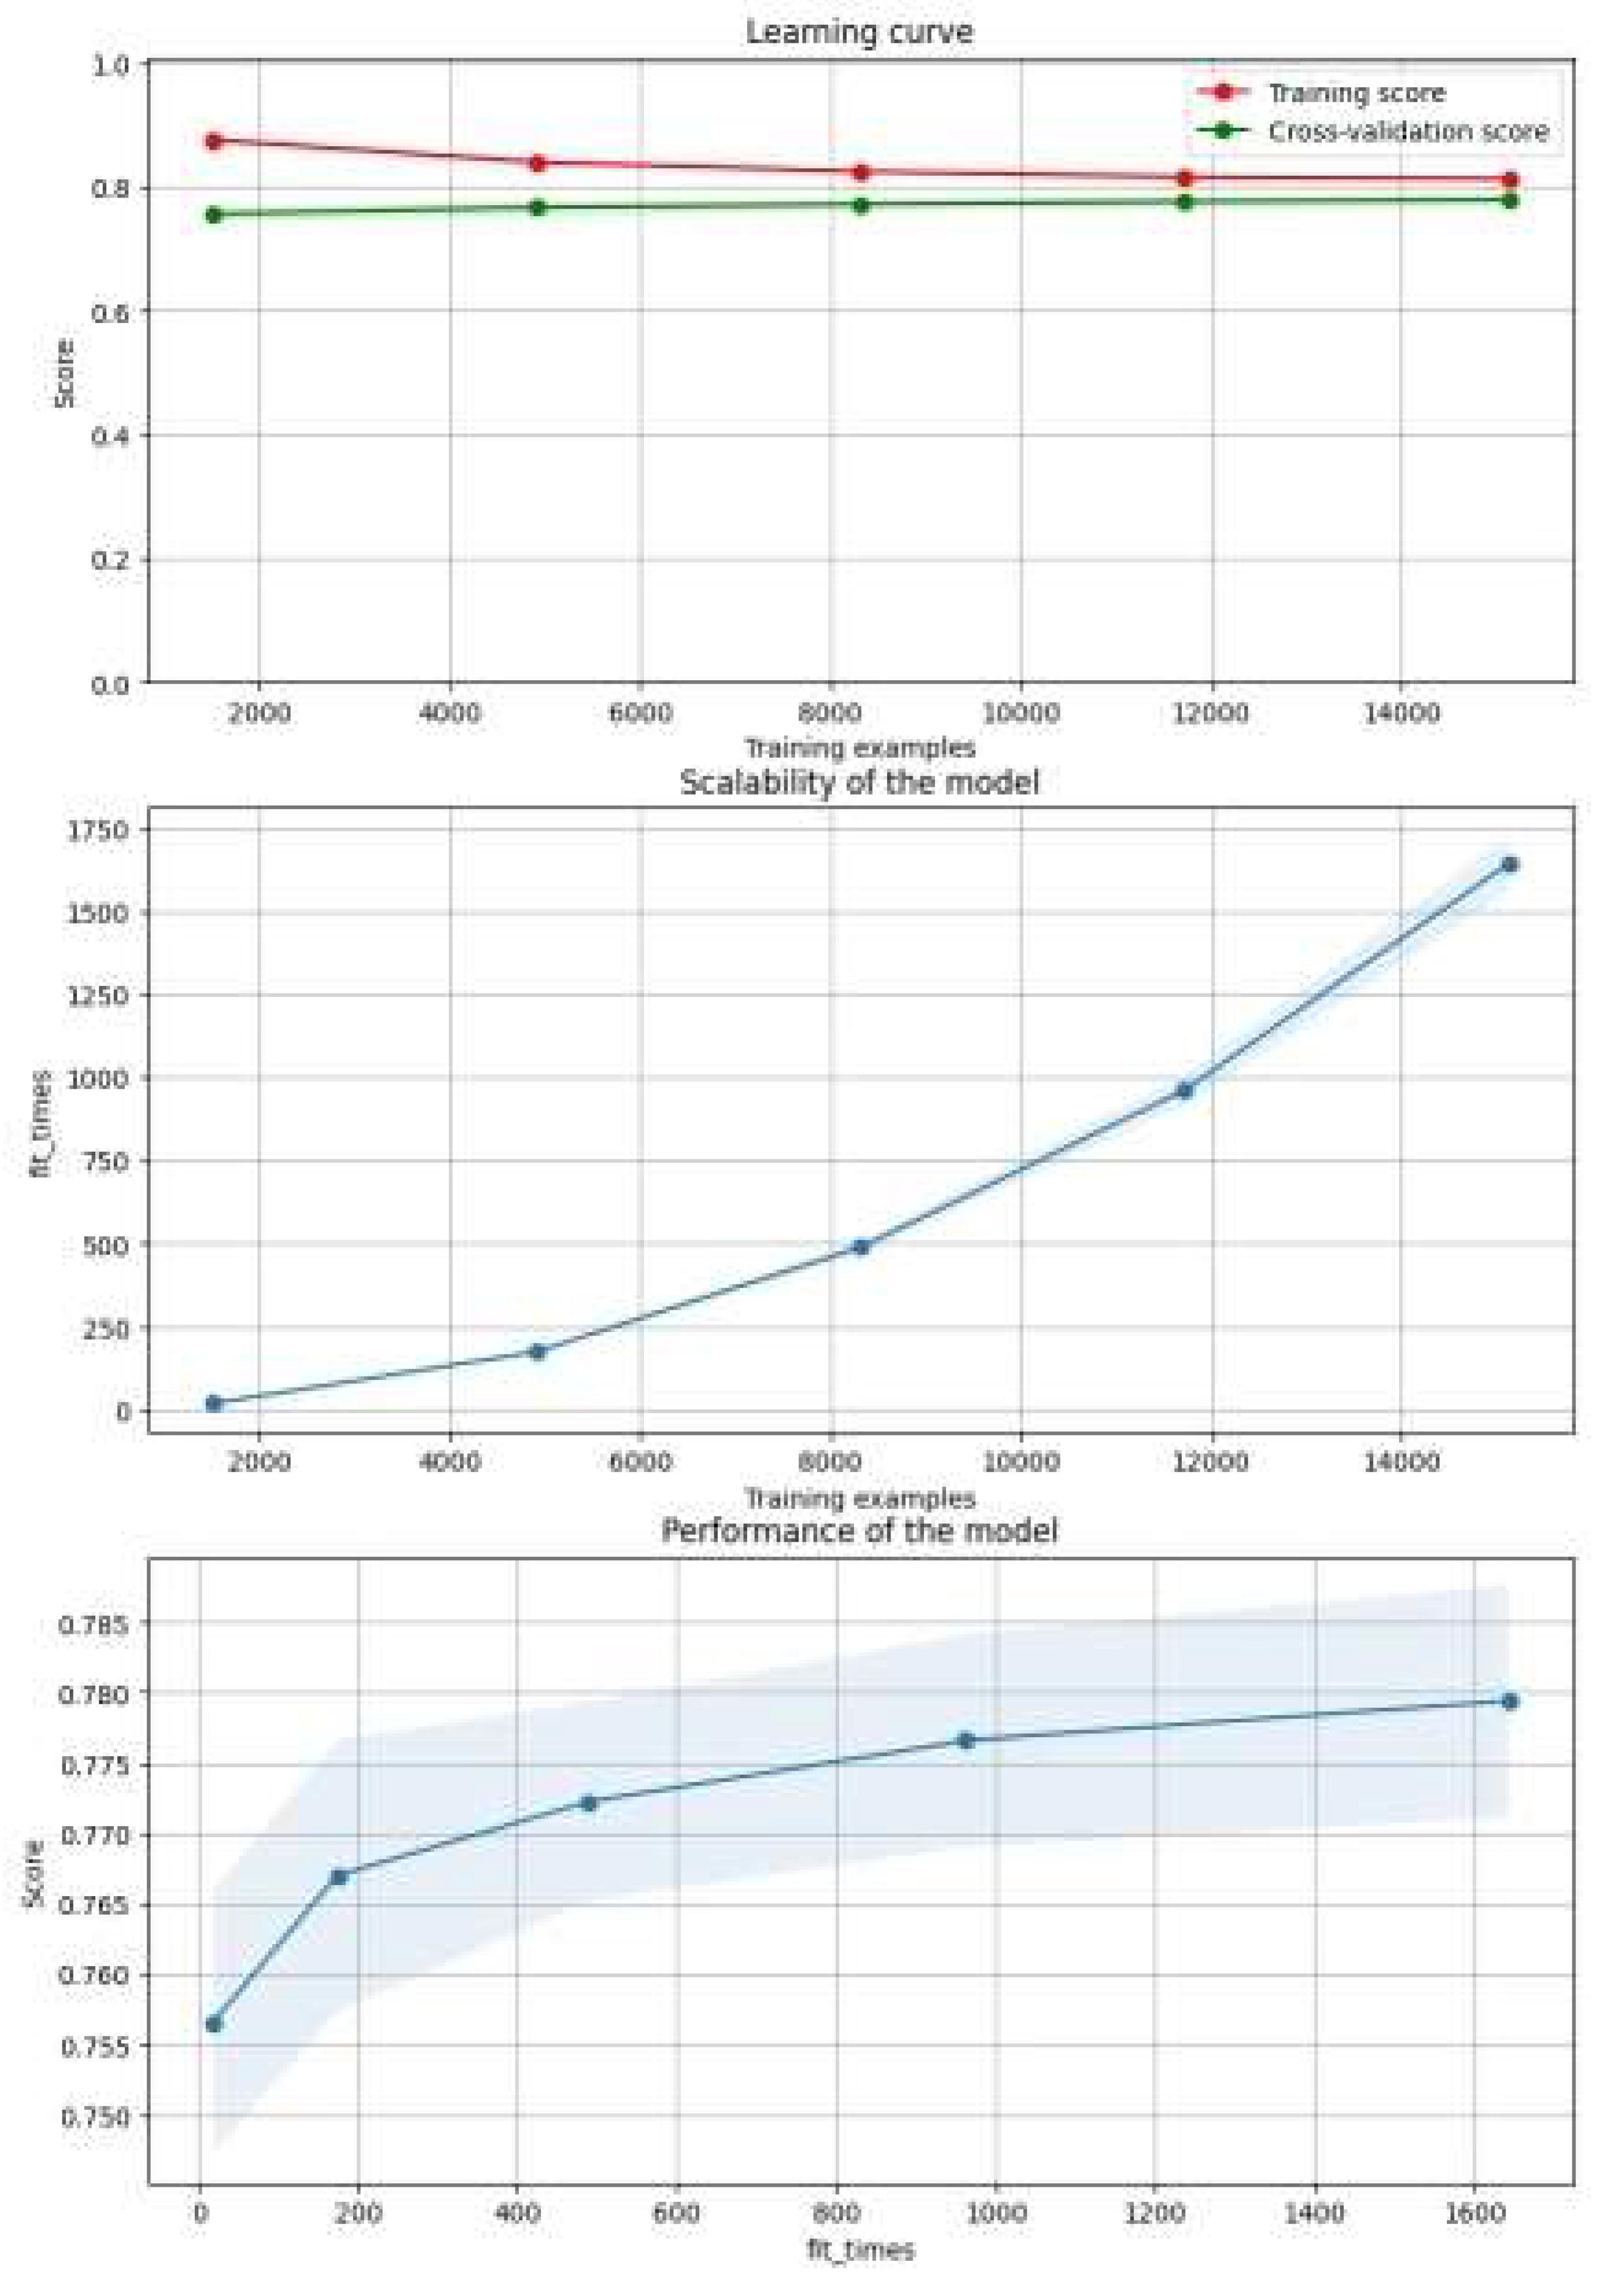
Figure 10.
ROC curve identification for news reliability detection in the SVR Model on the third dataset.
Figure 10.
ROC curve identification for news reliability detection in the SVR Model on the third dataset.
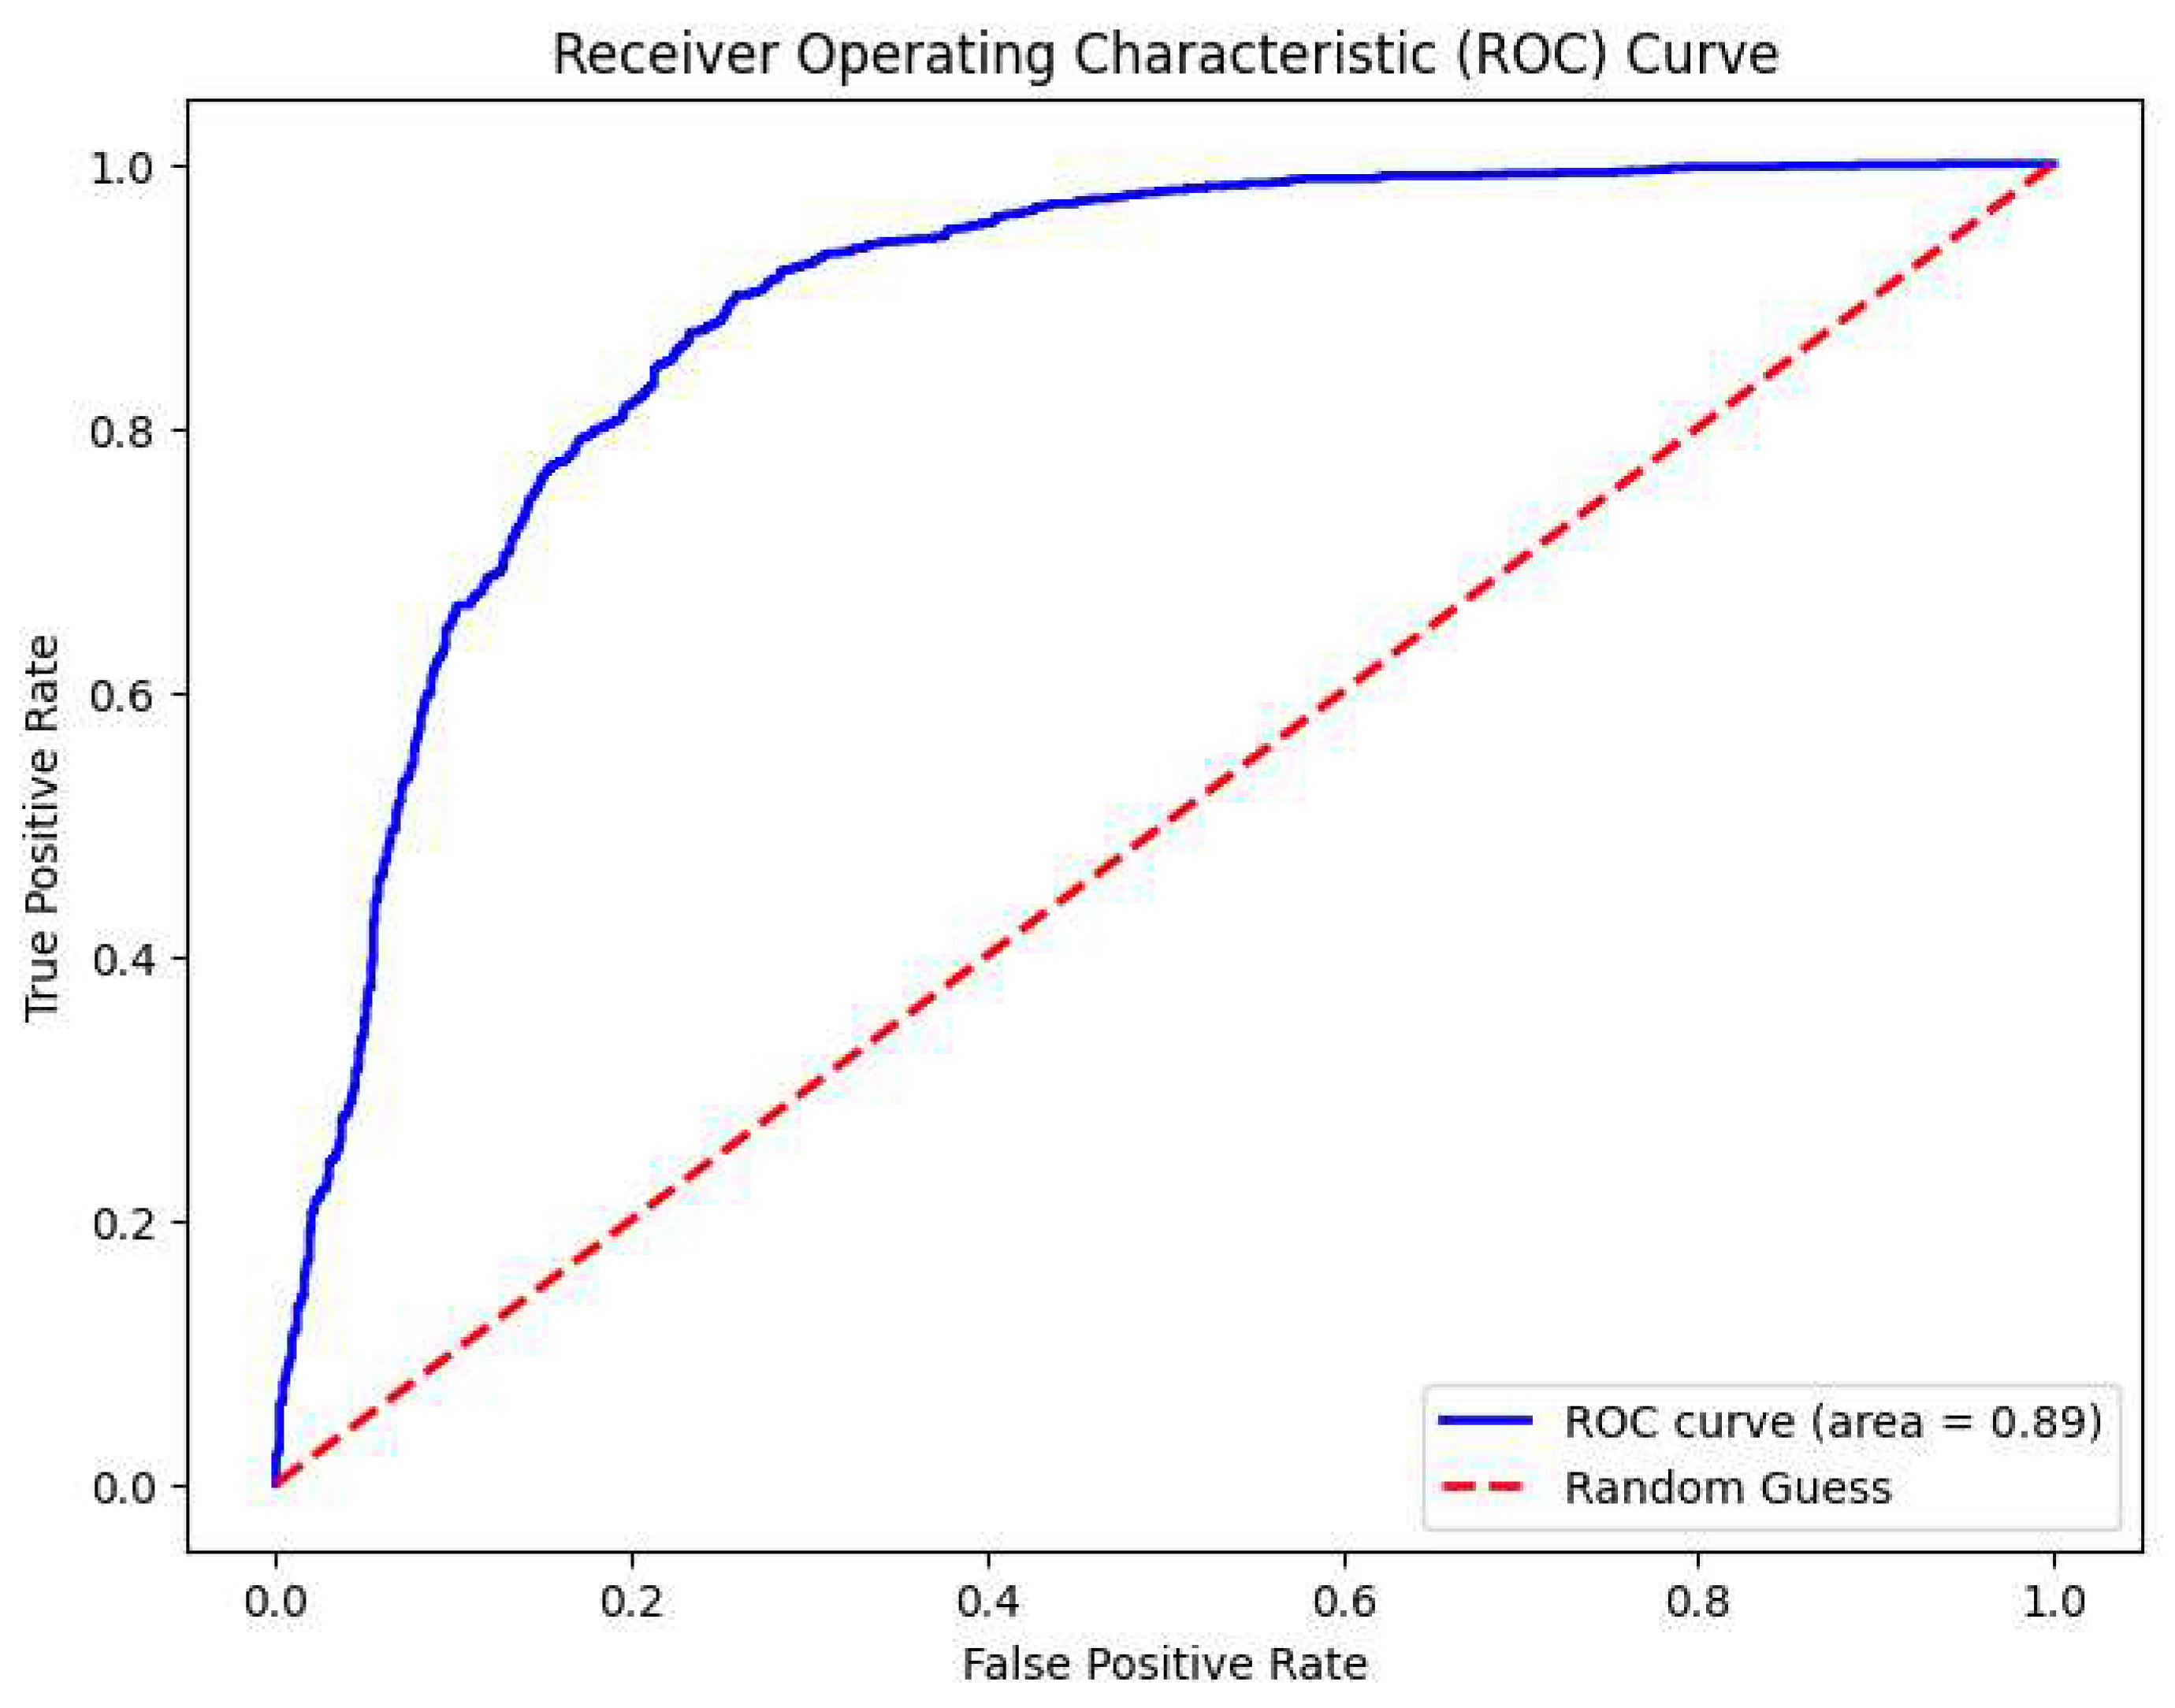

Table 1.
Dataset overview.
| ID | Source | Sample | Features | Target |
| 1 | LIAR dataset | 10270 | Article Body |
Mostly Reliable – 1 Mostly Unreliable - 0 |
| 2 | Politifact parser | 4472 | Article Title | |
| 3 | Politifact parser | 23640 | Article Body |
Table 2.
Results of the experiments.
| ID | K-FOLD | Model | Values | Accuracy |
| 1 | 5 | Logistic Regression | F1=0.67 | 0.593 |
| 1 | 5 | SVC | F1=0.696 | 0.595 |
| 1 | 5 | SVR* | F1=0.691 | 0.595 |
| 2 | 5 | Logistic Regression | F1=0.845 | 0.158 |
| 2 | 5 | SVC | F1=0.032 | 0.838 |
| 2 | 5 | SVR* | F1=0.045 | 0.838 |
| 3 | 5 | Logistic Regression | F1=0.822 | 0.78 |
| 3 | 5 | SVC | F1=0.883 | 0.793 |
| 3 | 5 | SVR* | F1=0.772 | 0.772 |
*SVR prediction was rounded to an integer.
Disclaimer/Publisher’s Note: The statements, opinions and data contained in all publications are solely those of the individual author(s) and contributor(s) and not of MDPI and/or the editor(s). MDPI and/or the editor(s) disclaim responsibility for any injury to people or property resulting from any ideas, methods, instructions or products referred to in the content. |
© 2024 by the authors. Licensee MDPI, Basel, Switzerland. This article is an open access article distributed under the terms and conditions of the Creative Commons Attribution (CC BY) license (http://creativecommons.org/licenses/by/4.0/).
Copyright: This open access article is published under a Creative Commons CC BY 4.0 license, which permit the free download, distribution, and reuse, provided that the author and preprint are cited in any reuse.


