
Submitted:
06 September 2024
Posted:
09 September 2024
You are already at the latest version
Abstract
Nonlinear single unit activity (SUA) characteristics are the useful measures to reveal the information processing and transfer features associated with Parkinson’s disease (PD) in the basal ganglia. Most of the state-of-the-art approaches to compute such parameters in continuous and discrete forms are strongly dependent on SUA recording length, noise level and input parameters. Due to the specificity of SUA data collection (mainly short recordings with relatively low signal-to-noise ratio) new techniques to evaluate neuronal nonlinear properties are needed. We have developed an encoding technique based on a mean interspike interval (ISI) value to calculate spike train discrete nonlinear features. The approach to compute mutual information (MI) of isolated neurons with its unstructured activity was also proposed. The proposed technique of SUA nonlinear features evaluation slightly depends on spike train length, has low correlations with other SUA characteristics (firing rate, coefficient of ISI variance and asymmetry index). The derived entropy measure in the subthalamic nucleus has significant positive correlation with PD severity. The proposed approach provides nonlinear features that are slightly dependent on investigated sample size and independent on input parameters. Also, the developed mean ISI based measures reflect the more complex nature of oscillatory activity in the basal ganglia, than it was thought previously. Moreover, MI, unlike entropy, takes into account the position of the spike train elements, which allows us to investigate the amount of information retained after the occurrence of temporary failures. The developed approach may be useful in describing nonlinear features of basal ganglia activity contributing to PD pathophysiology probably associated with impaired information transfer in movement disorders.
Keywords:
Entropy
; mutual information
; single unit activity
; basal ganglia
; subthalamic nucleus
; Parkinson’s disease
1. Introduction
The basal ganglia represent a network of subcortical structures that include the striatum, the external and internal pallidal segments (GPe, GPi, respectively), the subthalamic nucleus (STN), and the pars reticulata and compacta of the substantia nigra (SNr and SNc, respectively). These structures have anatomical connections with the thalamus, motor cortex, and brainstem, and play a key role in movement control. Microelectrode recording studies of single unit activity in the basal ganglia primarily focus on measuring various temporal and rhythmic properties of observed spike trains, such as firing rate, inter-spike interval (ISI) features, and oscillation scores [1,2,3,4]. Spike density histogram analysis is also applied to identify specific single unit activity patterns [5,6].
However, these linear time- and frequency-dependent descriptors do not fully reflect complex features of neuronal activity, as they do not account for the nonlinear properties of ISIs or the sequence of spike timestamps [7]. Shannon entropy and its modifications, such as approximate entropy and sample entropy, have been successfully used to describe the nonlinear features of brain activity [8,9,10,11]. To apply a discrete entropy approach, a continuous sequence of ISIs or spike timestamps is converted into a symbol sequence. There are two widely used techniques for transforming ISI sequences: the first one uses consequential comparison of ISI sizes [12]; the second one is based on transforming observed spikes into ones and interspike intervals into sets on nulls [13]. Additionally, the entropy approach and its modifications are thought to reflect the process of information transfer in cortical and subcortical structures using parameters such as transfer entropy and mutual information (MI) [14,15,16,17,18]. Mutual information captures higher order moments between two signals, including both linear and nonlinear aspects, but does not indicate directionality unless there is a time shift in one of the inputs. In contrast, transfer entropy offers directionality information and sensitivity to linear and nonlinear higher-order terms by utilizing conditional probability density functions.
The most popular methods for determining the regularity of a series of data based on the existence of patterns, Approximate entropy and Sample entropy, are extremely sensitive to noise, length of data, and input parameter [19,20]. Even though those equations are useful for deterministic processes, small amounts of noise and short data samples make them invalid for real series of data. In this study we elaborate techniques for nonlinear SUA features estimations that are less sensitive to sample length and input parameters. We also propose an approach for computing MI for a single spike train and compare the computational results for different spike train encoding methods using synthetic data and experimental data. We also aim to examine the dependencies of entropy and MI on linear single unit activity descriptors, spiking activity patterns, and the intensity and frequency of oscillatory activity.
2. Material and Methods
2.1. Simulated Data
To demonstrate the relationship between the characteristics of single unit activity and the distribution of interspike intervals (ISIs) in the underlying spiking process, synthetic spike trains were generated (Figure 1). This was accomplished by sampling ISIs from a gamma distribution
with shape parameter k and scale parameter s, assuming independent and identically distributed ISIs. Here, Γ denotes the gamma function [21].
2.2. Experimental Data
The data from the research on a single unit activity in the subthalamic nucleus (STN) in Parkinson's disease were used [23]. Data for spontaneous SUA were collected intraoperatively with microelectrode recording (MER) technique. MER signals were pre-processed, including bandpass filtering (300–5000 Hz), alignment and spike sorting, with Spike2 software (CED, Cambridge, UK). Spikes were detected using an amplitude threshold and then sorted using principal component analysis (PCA). Records with 1–3 clearly identifiable single units were selected for further analysis.
2.3. Single Unit Activity Clusterization
Spike train data were segmented into three distinct activity patterns using a hierarchical clustering approach based on similarities in spike density histograms [24]. Specifically, the first pattern, referred to as the tonic pattern, corresponds to regular activity characterized by consistent intervals between spikes close to the mean ISI. The second pattern, known as the burst pattern, exhibits variable ISIs without evident prolonged pauses in spike trains. Finally, the third pattern, named the pause pattern, consists of bursts of spikes separated by silent periods.
2.4. Spike Train Entropy Calculation
The discrete approach to calculate Shannon entropy requires converting continuous data into a discrete form [25]. This stage may be performed in different ways that influence the output. Three data transformation techniques were compared:
- "Spike in bin": Each spike train is separated into bins, with bin sizes determined automatically, by steadily decreasing bin size until each bin will contain only one or no spikes. The output is a sequence of zeros and ones, where 0 represents no spike in the given bin and 1 represents a single spike in the bin (Figure 3A). The resulting alphabet power is 2 [13].
- "ISI to ISI": Each Inter-Spike Interval (ISI) is compared to the previous ISI by absolute value. The resulting value of ISIi+1 divided by ISIi is rounded to 4 decimal places. The values are then converted into a symbol sequence based on the following rule: "-" if ISIi+1 / ISIi < 1, "0" if ISIi+1 / ISIi = 1, and "+" if ISIi+1 / ISIi > 1. The output of this technique is a three-symbol sequence, where "-" and "+" indicate that the following ISI is less or more than the previous ISI, respectively, and "0" represents equal ISIs rounded to 4 decimal places (Figure 3B). In this case, the alphabet power is 3 [12].
- "ISI to mean ISI": Mean ISI value is commonly used in spike train analysis [26,27]. In this method, each ISI in a spike train is compared to the mean ISI of that particular spike train. Encoding is performed based on the following rule: "-" (or 0) for ISIi < ISImean and "+" (or 1) for ISIi > ISImean. As the sampling frequency is 16kHz, cases where ISIi = ISImean were not observed. This method results in a two-symbol sequence, where "-" (or 0) represents relatively "small" ISI values and "+" (or 1) represents relatively "big" ISI values (Figure 3C). The alphabet power is 2.
After translating the ISI sequence into a symbol string, the probability of the occurrence of a set of length n (word - xni, where n is a natural number from 2 to 7, and i is an index of one of the possible words of length n) is calculated. The probability is calculated as the number of word occurrences in the string divided by the total number of possible words in the string with a shift of 1 symbol. This probability is then used to compute Shannon entropy.
2.5. Mutual Information
To take into account the X randomness, entropy values () was compared to a mean conditional entropy , where Y is a set of 100 shuffled series based on the same data as X [28]. The calculations were performed using Mutual Information definition:
where H(X|Y) is the conditional entropy and P(X|Y) is the conditional probability of observing word xnj when word yni in a shuffled string is observed. Thus, I(Y;X) indicates how robust the information capacity grounded in a ISI sequence is to the noise.
2.6. Statistical Analysis
To assess the significance of differences in parameters, we employed statistical Mann-Whitney U-test. To enhance the robustness of the findings, we performed bootstrapping with 10,000 bootstrap samples. Spearman's correlation coefficient was used to examine the correlation between all computed SUA descriptors, including entropy. Additionally, Spearman's correlation coefficient was calculated to assess linear association between different SUA features and UPDRS III scores. P-values were adjusted for multiple comparisons, and FDR adjusted p-values below 0.05 were considered statistically significant.
3. Results
3.1. Simulated Data
3.1.1. Entropy and MI Depending on Sample Length
To investigate the relationship between entropy and mutual information (MI) and the length of the sample, a total of 10 synthetic spike trains were generated with identical basic parameters (Figure 4). These parameters included a firing rate of 50 spikes/s, a shape factor (k) of 1 in a gamma distribution, and a spike count of 1000. Subsequently, entropy and MI parameters were computed for sample slices ranging from 10 to 1000 spikes with a step size of 10.
Irrespective of the chosen method, calculations of entropy and MI for a word of length 2 resulted in reaching a plateau at the shortest sample sizes. As intraoperative microelectrode recordings are usually short and may contain an extremely small number of spikes, optimal technique should give robust results on relatively short spike trains. Therefore, this word length was selected for further analysis.
3.1.2. Nonlinear Parameters Correlation with SUA Features
We have calculated the correlations between entropy, MI, and various statistical measures such as coefficient of variance (CV), asymmetry index (AI), and firing rate to search for interrelations between these SUA descriptors (Figure 5). To achieve this, a set of 5000 spike trains was generated with firing rates ranging from 10 to 100 in increments of 10, and shape factors ranging from 0.02 to 1 in increments of 0.02. For each basic parameter set, an artificial spike train was generated 10 times.
3.1.3.
SIB and ISITISI entropy and mutual information were highly correlated with nonlinear parameters (Figure 5A,B,D,E,G,H,J,K,M,N,P,Q). At the same time, ISITM entropy correlated strongly with CV and AI (Figure 5,I,O) and ISITM mutual information was highly dependent on firing rate (Figure 5F) regardless of the encoding method chosen. ISITM was the only one encoding technique, which has no significant correlation with firing rate for entropy, and has weak dependencies on CV and AI for mutual information (Figure 5C,L,R). Correlation coefficients and significance are represented in Table 1. Nonlinear features for different SUA patterns.
We investigated dependencies of the analyzed nonlinear SUA features on type of activity (Figure 6) using generated data including 5000 spike trains with the same modeling parameters (as described in section “Entropy and MI depending on sample length”). The only parameter influencing the SUA pattern is a shape factor of Gamma distribution. Modulating the shape in range from 0.02 to 1 in increments of 0.02 allowed us to simulate tonic, burst and pause activity. Lower shape factor values correspond to the pause pattern, whereas values close to 1 results in tonic activity.
All spike train encoding techniques allowed for statistically significant differentiation of single unit activity patterns except pause-burst segregation in case of ISITM-based mutual-information (Figure 6F) due to high dependence of this method on firing rate.
3.1.4. Nonlinear Features Dependency on Oscillatory Properties
Establishing the dependency of investigated nonlinear features was carried out using 4000 simulated spike trains (Figure 7 and Figure 8) with baseline firing rate 50 spikes/s, modulation index from 0.05 to 1 with step 0.05 and oscillation frequency from the set {3, 5, 8, 10, 12, 16, 20, 22, 25, 30, 35, 40, 45, 50, 55, 60, 67, 75, 82, 90} Hz to cover main physiological ranges. Each set of basic parameters was composed of 10 generated samples.
Entropy calculated using the ISITM approach was the only parameter that exhibited statistically significant deviations for weak and strong oscillatory activity (defined here with 0.05 ang 1 modulation index values correspondingly) across the majority of frequency spectrum (Figure 7C). ISITM-based entropy for strong oscillations showed gradual increase on frequency segments from 3 to 35 Hz as well as from 60 to 82 Hz, while for weak oscillations entropy values were relatively constant in the whole range of studied frequencies. For ISITISI-based entropy and ISITISI-based MI parameters, values estimated for strong oscillatory activity were significantly higher in the 3-16 Hz frequency range (Figure 7B,E).
Entropy calculated with the ISITM encoding approach effectively discriminated between different oscillatory frequencies, particularly at high modulation index values. The nature of deviations at modulation index = 1 is depicted in Figure 7C. Meanwhile, ISITISI entropy was higher for oscillation frequencies of 3, 8, and 12 Hz compared to other frequencies at high modulation index values (Figure 8B).
3.2. Experimental Data
829 single units from 48 hemispheres of PD patients undergoing DBS surgeries in the STN were assigned to the dataset. For each patient, 15–89 single units were isolated (median number 29), median duration of spike trains was 16.9 s (13.6 – 22.9 s) containing 609 spikes on average (400–938).
3.2.1. Nonlinear Features Correlation with SUA Features
The investigation of nonlinear parameters correlation with firing rate, coefficient of variance and asymmetry index was repeated on clinical data (Figure 9).
As it was observed on generated data, ISITM encoding technique has weak correlation with firing rate for entropy, and weak dependencies on CV and AI for mutual information (Figure 9C,L,R). Entropy and MI calculated with the ISITISI approach has no significant correlation with CV and AI (Figure 9H,N,K,Q) on clinical data unlike the generated dataset, however they are dependent on firing rate (Figure 9B,E). Correlation coefficients and significance are represented in Table 1.
3.2.2. Nonlinear Features of Oscillatory Activity
For every spike train, oscore values in the main physiological ranges (theta: 3-8 Hz, alpha: 8-12 Hz, low-beta: 12-20 Hz, beta: 20-30 Hz, gamma: 30-60 Hz, high-gamma: 60-90 Hz) were calculated. After that, we searched for dependencies between oscore values and entropy and mutual information (Figure 10).
Entropy values using SIB and ISITISI methods as well as MI values for ISITISI approach (Figure 10A,B,E) for weak and strong oscillations (defined here as oscore values below and above median values correspondingly) differ less significant at low-beta frequencies (12-20 Hz) than at another ranges (except theta-range for ISITISI entropy (Figure 10B)). At the same time, there are less significant differences in ISITM entropy and SIB MI between weak and strong oscillations at alpha (8-12 Hz) and low-beta bands (Figure 10C,D). Entropy calculated with ISITM method (Figure 10C) for strong oscillation has the similar dependency on rhythmic activity (Figure 7C), whereas entropy for weak oscillations steadily falls with oscores values growth, that is different from its relatively constant value for simulated data.
3.2.3. Nonlinear Features Correlation with PD Severity
We also studied the potential utility of these nonlinear metrics based on clinical features estimated for patient’s data. Correlations of entropy and MI values with the UPDRS III scores in off-state are presented in Figure 11.
The only feature that has significant correlation with UPDRS III score was ISITM entropy for the pause neurons (the correlation coefficient was 0.38 with p-value < 10^-5), whereas ISITM entropy for tonic and burst neurons revealed no significant correlations (Figure 11C). Despite the high significance level, other parameters were weakly correlated with UPDRS III (from 18 to 78). Correlation coefficients and significance are represented in Table 2.
4. Discussion
Standard linear SUA descriptors are typically based on evaluations of temporal and rhythmic properties, but they tend to ignore the structural characteristics of interspike intervals (ISIs) and firing sequences. In contrast, nonlinear properties such as entropy and mutual information take into consideration the features of spike train structure, reflecting its complexity or informational transfer accordingly [13,29]. In this study, we consider a comprehensive approach for analyzing the nonlinear properties of spike trains that involves computing entropy and mutual information for particular simulated and recorded samples in a discrete form. Prior to these calculations, the data undergo preprocessing using various encoding methods, spike observation [13], comparison of neighboring ISIs [12], and comparison of ISIs with their mean values. The resulting nonlinear features were tested on both simulated and real data.
4.1. Nonlinear Features Interpretation
The technique utilized for parameter calculation enabled us to obtain precise values even with a relatively small number of spikes, which is crucial for practical applications given that experimental data often involve a limited number of spikes. Furthermore, entropy and mutual information exhibit variations across different single unit activity patterns, although there are no consistent dependencies for each encoding method. Among the encoding techniques, the ISITISI method demonstrated the most intuitively clear pattern dependence: tonic activity patterns yielded the lowest entropy values, pause patterns yielded the highest, and entropy for bursting neurons fell between pause and tonic patterns (Figure 6B). This trend can be attributed to the approximation of ISI values to 0.1 ms in the original encoding technique, which groups relatively similar ISIs while neutralizing small ISI variations.
The SIB and ISITM methods utilize absolute timestamps and ISI values, resulting in an inverse pattern dependency for entropy: small ISI fluctuations in tonic patterns correspond to higher entropy values (indicating equal likelihood of all events), whereas pause neurons exhibit the lowest entropy as one particular subsequence is more likely (Figure 6A,C). Previous conclusion is also valid in this case, however, inverse results highlight the importance of complex investigation of spike trains due to the differences in the determination of events for entropy calculations.
Mutual information in our study describes the amount of information contained in the original sequence when shuffled - the measure of data structure stability to the artificial exposure. For the SIB and ISITISI methods, the resulting mutual information parameters exhibit similar pattern dependencies as entropy (Figure 6D,E). However, for ISITM, mutual information is higher for pause and burst patterns compared to tonic patterns, indicating a higher probability of maintaining pattern consistency after shuffling, which is similar to ISITISI technique (Figure 6F). SIB approach results in long sequences of “0” in pauses and shorter sequences of “0” between spikes (“1”) in bursts. Thus, multiple shuffling of such sequences makes data structure more regular and affects pause and burst spike trains stronger than tonic ones. ISITISI and ISITM techniques operate ISIs values, and, on the contrary, the most irregular pause pattern after shuffling stays mainly similar to the original sequence. At the same time, tonic spike trains lose their original structure.
4.2. Nonlinear Features and PD STN Activity
Using SIB and ISITISI encoding techniques in analysis of weak and strong oscillatory activity in PD STN suggests that strong oscillatory activity has lower entropy than weak oscillations, almost at all frequency ranges (Figure 10A,B). This corresponds to the previous study on STN LFPs: high beta power and low beta entropy represent lower information transfer capacity [11,30]. However, the ISITM method exhibits complex interrelations with oscillation frequencies (Figure 10C). Within physiological frequency ranges, theta and alpha oscillations demonstrate relatively low data complexity, while beta and gamma high-amplitude oscillations exhibit higher entropy compared to slightly oscillating or non-rhythmic neurons. ISITM entropy of strongly oscillating neurons at low-beta ranges is not different from weak low-beta oscillations. These results contradict the existing ideas about the information state of beta oscillations. However, existing reports explore movement related entropy features, whereas here we were focused on resting state PD STN activity.
Further analysis of ISITM entropy on clinical data is needed to identify the sources and potential consequences for the differences in entropy values between oscillatory ranges. Mutual information seems to be a useful tool in solving this problem, because, unlike entropy, mutual information produces equivalent results for clinical data regardless of the chosen encoding method (Figure 10D–F). Moreover, ISITM method is of special interest for further investigation as it has revealed a significant positive correlation of the ISITM entropy values for pause neurons with UPDRS III scores in the off-state as well as with oscillation power in 12-20 Hz range for pause neurons (Figure 11C). This corresponds well with the findings of the original work, which provided the experimental data used here [23]. Authors have found a significant positive correlation between oscillation scores at low-beta range with UPDRS III scores that was especially prominent for the pause-burst pattern of activity.
The role of the informational transfer in the low-beta band in the basal ganglia should be investigated more deeply to understand how synchronization in this frequency range contributes to PD progression. We explored correlations between SIB and ISITISI entropy and ISITISI mutual information with oscillation frequency using experimental data and found lesser differences between strong and weak oscillations in the low-beta range compared to other investigated frequencies (Figure 10A,B,E). Independently of how strong low-beta oscillations are, the information capacity of the studied STN neurons was the same (Figure 10A–C). This result questions the hypothesis assuming that high oscillatory synchrony decreases information capacity [31,32]. These reports also mentioned that DBS and antiparkinsonian medications reduce low-beta LFP oscillation power in the STN. At the same time, DBS and apomorphine scaled down neuronal entropy in the globus pallidus and the subthalamic nucleus, correspondingly [10,33,34,35]. Our results suggest that low-beta band suppression and entropy drop may be coordinated processes during the PD treatment.
In our research, we focus on discrete entropy and mutual information as key concepts from information theory that provide a robust framework for quantifying the information conveyed by spike trains. Our approach includes a comparative analysis of original and shuffled spike trains, building on methodologies used in previous studies [28,36,37,38]
Traditionally, differences in entropy between original and shuffled states is evaluated to assess the additional uncertainty introduced by the temporal structure of the data. However, this method does not account for the positioning of the elements under investigation, specifically ISIs and their subsequences.
In contrast, mutual information explicitly considers the positions of elements in the sequences being compared. For instance, if an element xi in sequence X matches yi in sequence Y, it contributes positively to the MI; conversely, a mismatch decreases it. This positional sensitivity is a significant advantage of our approach, as it allows us to investigate the amount of information retained after temporal disruptions occur.
By emphasizing these aspects, our study aims to provide deeper insights into the informational content of spike trains and how temporal violations impact this information. Suggested approach may also provide a better understanding of changes in information processing that lead to brain disorders (including movement disorders).
5. Conclusion
The approach developed here may be useful in clarifying the neural criteria of PD pathophysiology associated with impaired information transfer during the development of motor control capabilities. First time mutual information was shown as a promising estimator of isolated spike train pattern features in accordance with information theory. In addition, a new spike train encoding method was shown as a useful tool to characterize neuron oscillatory activity. Various but not contradictory results of calculating nonlinear parameters of neural activity for different coding methods illustrate the importance of complex spike train analysis.
Author Contributions
Nikita Zakharov: Conceptualization, Methodology, Software, Investigation, Formal analy sis, Writing - Original Draft. Elena Belova: Validation, Writing - Review & Editing, Supervision, Funding acquisition. Anna Gamaleya: Data Curation, Validation. Alexey Tomskiy: Data Curation, Validation. Alexey Sedov: Conceptualization, Validation, Writing - Review & Editing, Supervision, Project administration.
Funding
This work was supported by the Russian Science Foundation [grant number 22-15-00344].
Conflict of interest
The authors declare no conflicts of interest. The funders had no role in the design of the study; in the collection, analyses, or interpretation of data; in the writing of the manuscript; or in the decision to publish the results.
References
- Hutchison, W.D.; Dostrovsky, J.O.; Walters, J.R.; Courtemanche, R.; Boraud, T.; Goldberg, J.; Brown, P. Neuronal Oscillations in the Basal Ganglia and Movement Disorders: Evidence from Whole Animal and Human Recordings: Figure 1. J. Neurosci. 2004, 24, 9240–9243. [Google Scholar] [CrossRef]
- Dostrovsky, J.; Bergman, H. Oscillatory activity in the basal ganglia--relationship to normal physiology and pathophysiology. Brain 2004, 127, 721–722. [Google Scholar] [CrossRef] [PubMed]
- Nambu, A.; Tachibana, Y.; Chiken, S. Cause of parkinsonian symptoms: Firing rate, firing pattern or dynamic activity changes? Basal Ganglia 2015, 5, 1–6. [Google Scholar] [CrossRef]
- Galvan, A.; Wichmann, T. Basal ganglia neurons in healthy and parkinsonian primates generate recurring sequences of spikes. J. Neurophysiol. 2023, 129, 1010–1020. [Google Scholar] [CrossRef] [PubMed]
- V. Myrov, A. V. Myrov, A. Sedov, A. Tomskiy, L. Myrova, and E. Belova, ‘A new approach for estimation of spiketrain patterns in basal ganglia’, in Progress in Brain Research, vol. 249, Elsevier, 2019, pp. 321–325. [CrossRef]
- Szűcs, A. Applications of the spike density function in analysis of neuronal firing patterns. J. Neurosci. Methods 1998, 81, 159–167. [Google Scholar] [CrossRef]
- Nonlinear Dynamics of Parkinson's Disease and the Basal Ganglia-Thalamic-cortical System; Elsevier: Amsterdam, NX, Netherlands, 2023.
- Andres, D.S.; Cerquetti, D.; Merello, M.; Stoop, R. Neuronal Entropy Depends on the Level of Alertness in the Parkinsonian Globus Pallidus in vivo. Front. Neurol. 2014, 5, 96. [Google Scholar] [CrossRef]
- Darbin, O.; Jin, X.; Von Wrangel, C.; Schwabe, K.; Nambu, A.; Naritoku, D.K.; Krauss, J.K.; Alam, M. Neuronal Entropy-Rate Feature of Entopeduncular Nucleus in Rat Model of Parkinson’s Disease. Int. J. Neural Syst. 2016, 26. [Google Scholar] [CrossRef]
- Dorval, A.D.; Russo, G.S.; Hashimoto, T.; Xu, W.; Grill, W.M.; Vitek, J.L. Deep Brain Stimulation Reduces Neuronal Entropy in the MPTP-Primate Model of Parkinson's Disease. J. Neurophysiol. 2008, 100, 2807–2818. [Google Scholar] [CrossRef] [PubMed]
- Syrkin-Nikolau, J.; Koop, M.M.; Prieto, T.; Anidi, C.; Afzal, M.F.; Velisar, A.; Blumenfeld, Z.; Martin, T.; Trager, M.; Bronte-Stewart, H. Subthalamic neural entropy is a feature of freezing of gait in freely moving people with Parkinson's disease. Neurobiol. Dis. 2017, 108, 288–297. [Google Scholar] [CrossRef]
- Sherry, C.J.; Klemm, W.R. Entropy as an Index of the Informational State of Neurons. Int. J. Neurosci. 1981, 15, 171–178. [Google Scholar] [CrossRef]
- Strong, S.P.; Koberle, R.; Steveninck, R.R.d.R.v.; Bialek, W. Entropy and Information in Neural Spike Trains. Phys. Rev. Lett. 1998, 80, 197–200. [Google Scholar] [CrossRef]
- Gilmour, T.P.; Lagoa, C.; Jenkins, W.K.; Rao, A.N.; Berk, M.A.; Venkiteswaran, K.; Subramanian, T. ‘Transfer entropy between cortical and basal ganglia electrophysiology’, in 2012 IEEE Signal Processing in Medicine and Biology Symposium (SPMB), New York City, NY, USA: IEEE, Dec. 2012, pp. 1–5.
- Ma, C.; Pan, X.; Wang, R.; Sakagami, M. Estimating causal interaction between prefrontal cortex and striatum by transfer entropy. Cogn. Neurodynamics 2013, 7, 253–261. [Google Scholar] [CrossRef] [PubMed]
- Rodriguez-Sabate, C.; Gonzalez, A.; Perez-Darias, J.C.; Morales, I.; Sole-Sabater, M.; Rodriguez, M. Causality methods to study the functional connectivity in brain networks: the basal ganglia – thalamus causal interactions. Brain Imaging Behav. 2023, 18, 1–18. [Google Scholar] [CrossRef] [PubMed]
- Sun, C.; Yang, F.; Wang, C.; Wang, Z.; Zhang, Y.; Ming, D.; Du, J. Mutual Information-Based Brain Network Analysis in Post-stroke Patients With Different Levels of Depression. Front. Hum. Neurosci. 2018, 12, 285. [Google Scholar] [CrossRef]
- Wang, Z.; Alahmadi, A.; Zhu, D.; Li, T. ‘Brain functional connectivity analysis using mutual information’, in 2015 IEEE Global Conference on Signal and Information Processing (GlobalSIP), Orlando, FL, USA: IEEE, Dec. 2015, pp. 542–546.
- Delgado-Bonal, A.; Marshak, A. Approximate Entropy and Sample Entropy: A Comprehensive Tutorial. Entropy 2019, 21, 541. [Google Scholar] [CrossRef]
- Yentes, J.M.; Hunt, N.; Schmid, K.K.; Kaipust, J.P.; McGrath, D.; Stergiou, N. The appropriate use of approximate entropy and sample entropy with short data sets. Ann. Biomed. Eng. 2013, 41, 349–365. [Google Scholar] [CrossRef]
- Brostek, L.; Büttner, U.; Mustari, M.J.; Glasauer, S. Neuronal Variability of MSTd Neurons Changes Differentially With Eye Movement and Visually Related Variables. Cereb. Cortex 2012, 23, 1774–1783. [Google Scholar] [CrossRef]
- Matzner, A.; Bar-Gad, I. Quantifying Spike Train Oscillations: Biases, Distortions and Solutions. PLOS Comput. Biol. 2015, 11, e1004252. [Google Scholar] [CrossRef]
- Belova, E. .; Filyushkina, V.I.; Dzhalagoniia, I.; Gamaleya, A.A.; Tomskiy, A.A.; Neumann, W.-J.; Sedov, A. Oscillations of pause-burst neurons in the STN correlate with the severity of motor signs in Parkinson's disease. Exp. Neurol. 2022, 356, 114155. [Google Scholar] [CrossRef]
- Myrov, V.; Sedov, A.; Belova, E. Neural activity clusterization for estimation of firing pattern. J. Neurosci. Methods 2018, 311, 164–169. [Google Scholar] [CrossRef]
- Shannon, C.E. A Mathematical Theory of Communication. Bell Syst. Tech. J. 1948, 27, 623–656. [Google Scholar] [CrossRef]
- Chen, L.; Deng, Y.; Luo, W.; Wang, Z.; Zeng, S. Detection of bursts in neuronal spike trains by the mean inter-spike interval method. Prog. Nat. Sci. 2009, 19, 229–235. [Google Scholar] [CrossRef]
- Myrov, V.; Sedov, A.; Salova, E.; Tomskiy, A.; Belova, E. Single unit activity of subthalamic nucleus of patients with Parkinson’s disease under local and generalized anaesthesia: Multifactor analysis. Neurosci. Res. 2018, 145, 54–61. [Google Scholar] [CrossRef]
- Darbin, O.; Soares, J.; Wichmann, T. Nonlinear analysis of discharge patterns in monkey basal ganglia. Brain Res. 2006, 1118, 84–93. [Google Scholar] [CrossRef]
- Houghton, C. Calculating mutual information for spike trains and other data with distances but no coordinates. R. Soc. Open Sci. 2015, 2, 140391. [Google Scholar] [CrossRef] [PubMed]
- Fleming, J.E.; Lowery, M.M. ‘Changes in Neuronal Entropy in a Network Model of the Cortico-Basal Ganglia during Deep Brain Stimulation’, in 2019 41st Annual International Conference of the IEEE Engineering in Medicine and Biology Society (EMBC), Berlin, Germany: IEEE, Jul. 2019, pp. 5172–5175.
- Brittain, J.-S.; Brown, P. Oscillations and the basal ganglia: Motor control and beyond. NeuroImage 2014, 85, 637–647. [Google Scholar] [CrossRef]
- Little, S.; Brown, P. The functional role of beta oscillations in Parkinson's disease. Park. Relat. Disord. 2014, 20, S44–S48. [Google Scholar] [CrossRef] [PubMed]
- Dorval, A.D.; Kuncel, A.M.; Birdno, M.J.; Turner, D.A.; Grill, W.M. Deep Brain Stimulation Alleviates Parkinsonian Bradykinesia by Regularizing Pallidal Activity. J. Neurophysiol. 2010, 104, 911–921. [Google Scholar] [CrossRef]
- Dorval, A.D.; Grill, W.M. Deep brain stimulation of the subthalamic nucleus reestablishes neuronal information transmission in the 6-OHDA rat model of parkinsonism. J. Neurophysiol. 2014, 111, 1949–1959. [Google Scholar] [CrossRef]
- Lafreniere-Roula, M.; Darbin, O.; Hutchison, W.; Wichmann, T.; Lozano, A.; Dostrovsky, J. Apomorphine reduces subthalamic neuronal entropy in parkinsonian patients. Exp. Neurol. 2010, 225, 455–458. [Google Scholar] [CrossRef]
- Maye, A.; Hsieh, C.-H.; Sugihara, G.; Brembs, B. Order in Spontaneous Behavior. PLOS ONE 2007, 2, e443–e443. [Google Scholar] [CrossRef] [PubMed]
- Alam, M.; Sanghera, M.K.; Schwabe, K.; Lütjens, G.; Jin, X.; Song, J.; Von Wrangel, C.; Stewart, R.M.; Jankovic, J.; Grossman, R.G.; et al. Globus pallidus internus neuronal activity: a comparative study of linear and non-linear features in patients with dystonia or Parkinson’s disease. J. Neural Transm. 2016, 123, 231–240. [Google Scholar] [CrossRef] [PubMed]
- Wang, Z.; Feng, Z.; Yuan, Y.; Guo, Z.; Cui, J.; Jiang, T. Dynamics of neuronal firing modulated by high-frequency electrical pulse stimulations at axons in rat hippocampus. J. Neural Eng. 2024, 21, 026025. [Google Scholar] [CrossRef] [PubMed]
Figure 1.
Simulated spike trains (left) and corresponding spike density histogram (right) representing three different types of neuronal activity [5]. The firing rate is set at 50 spikes/s, and the sample size is 15 seconds. A - pause spiking pattern with a shape factor of 0.1. B - bursting activity with a shape factor of 0.5. C - tonic activity pattern with a shape factor of 1.
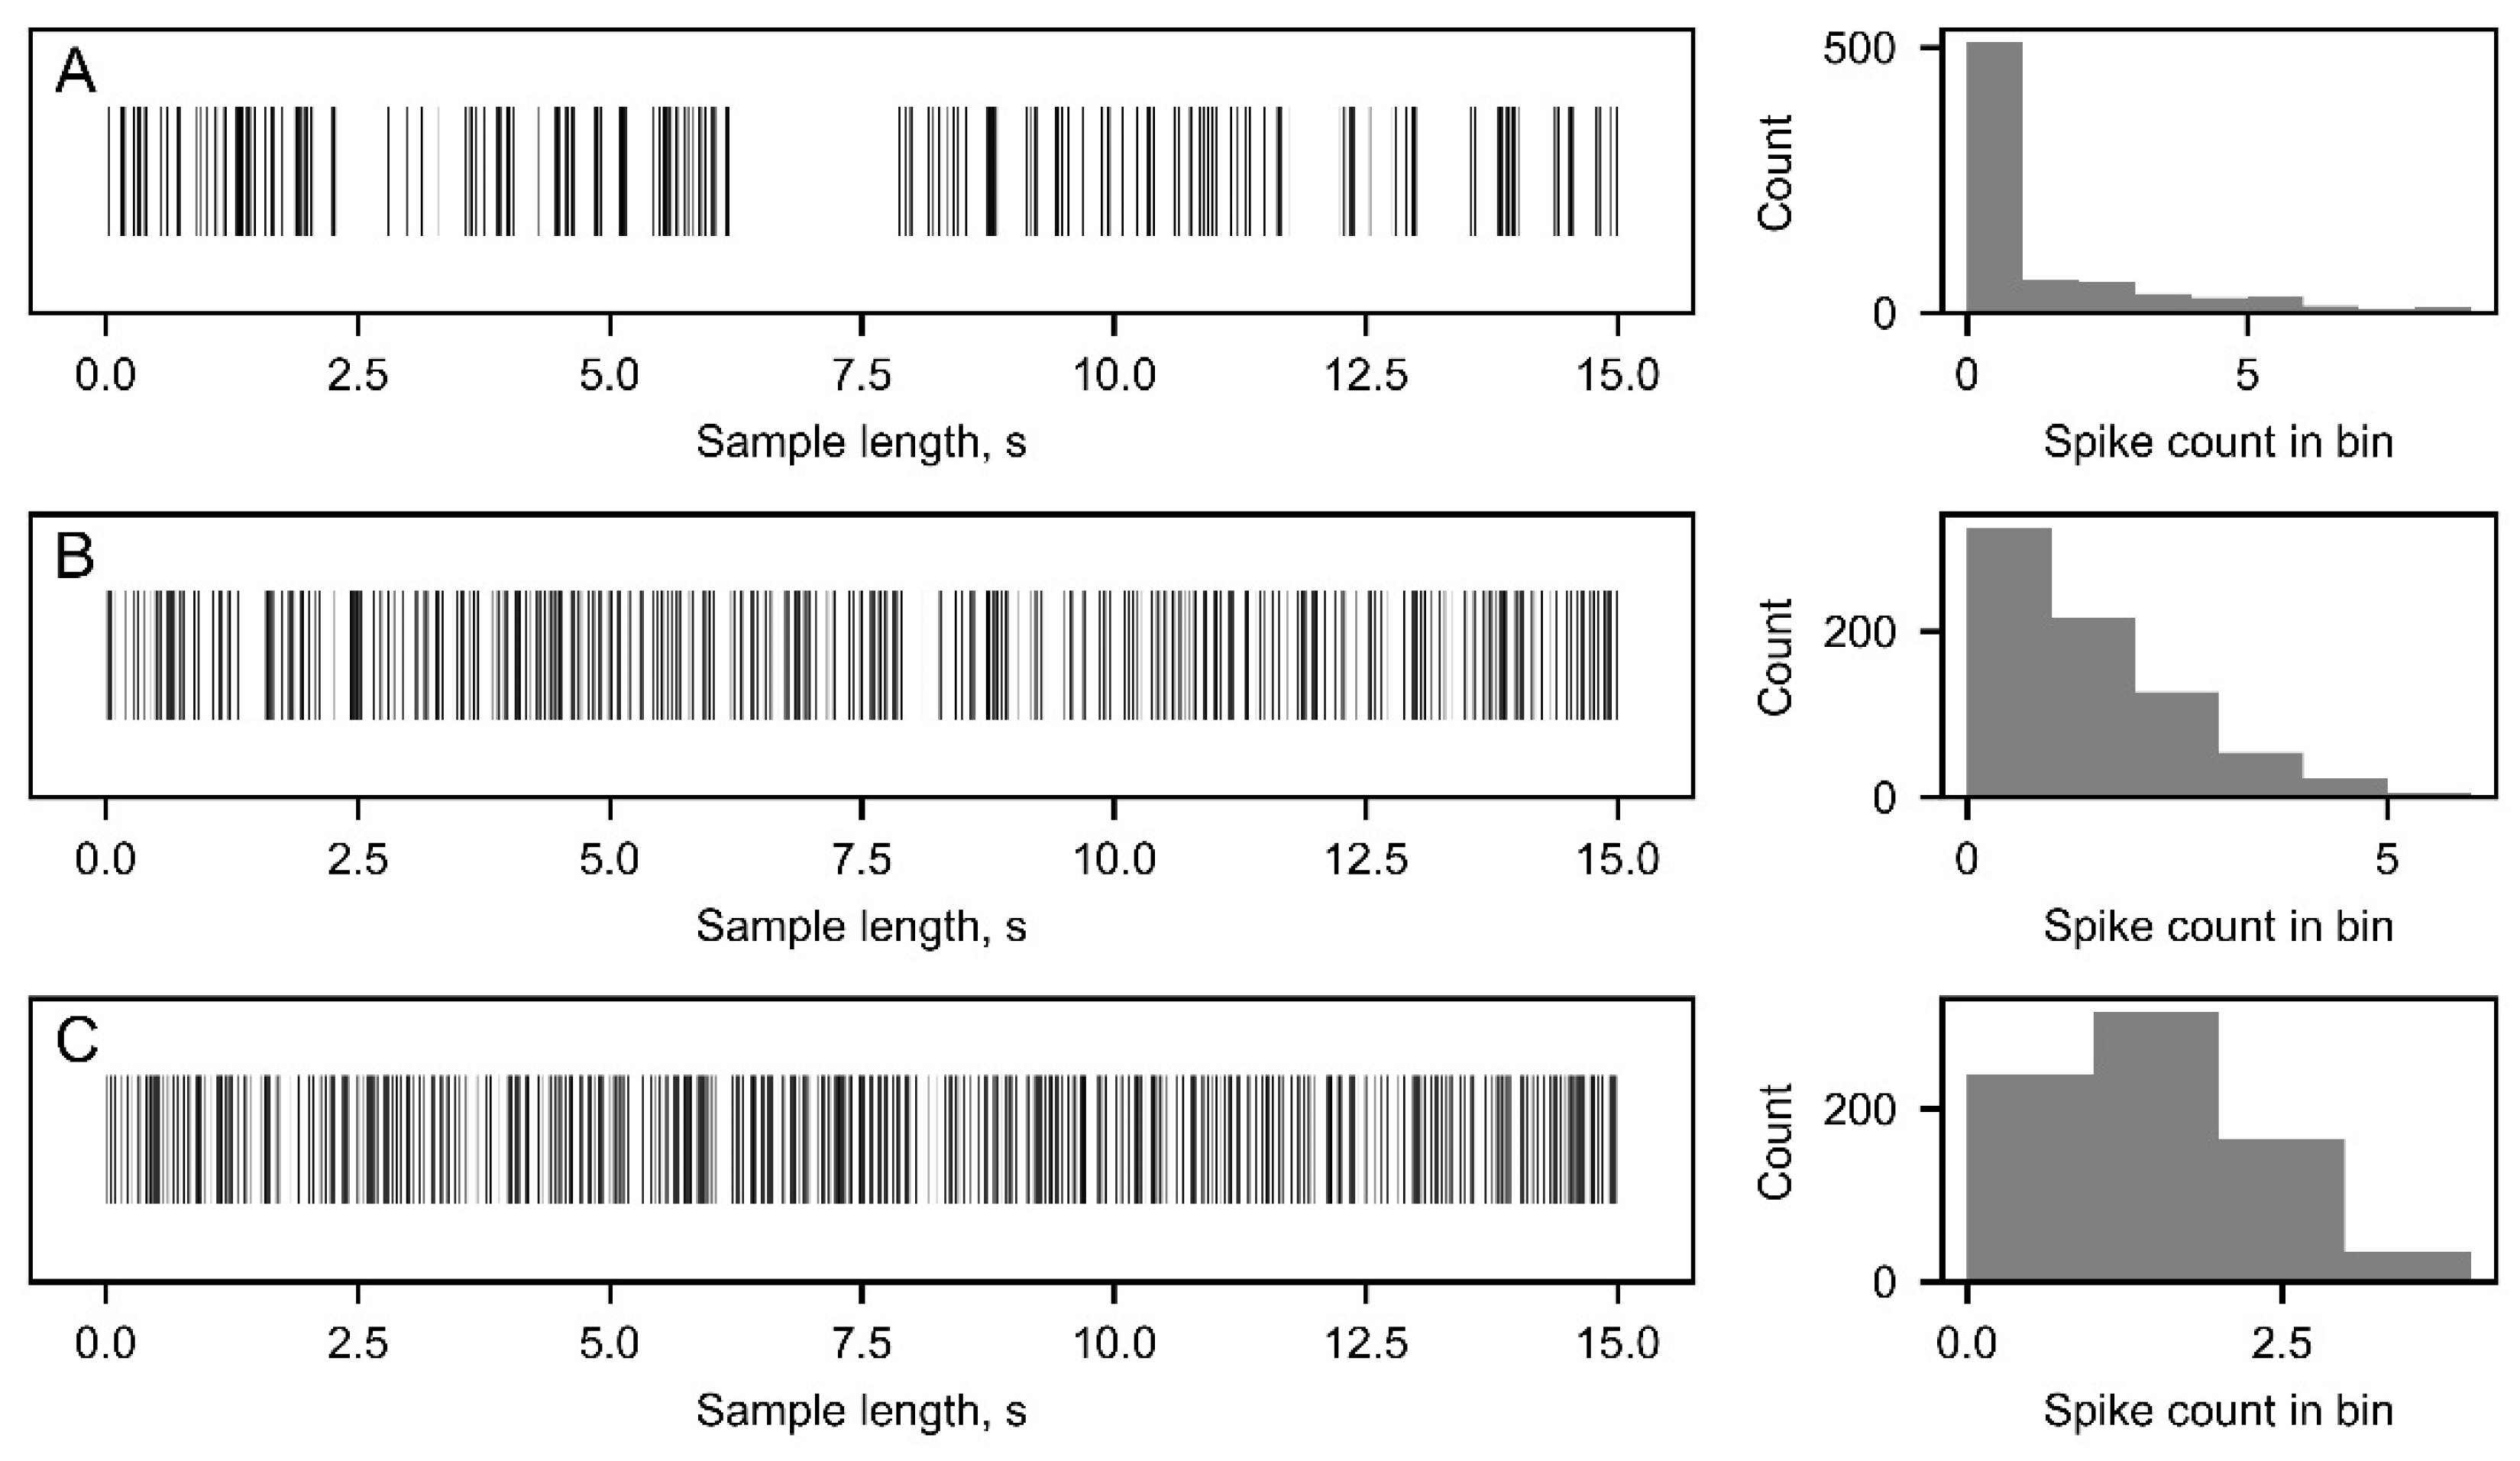
Figure 2.
Examples of simulated oscillating spike trains with a baseline firing rate of 50 spikes/s, representing different rhythmic features of neuronal activity: A - spike train exhibiting strong oscillatory activity at 3 Hz, with a modulation index of 1. B - slightly oscillating activity sample at a frequency of 3 Hz, with a modulation index of 0.05.
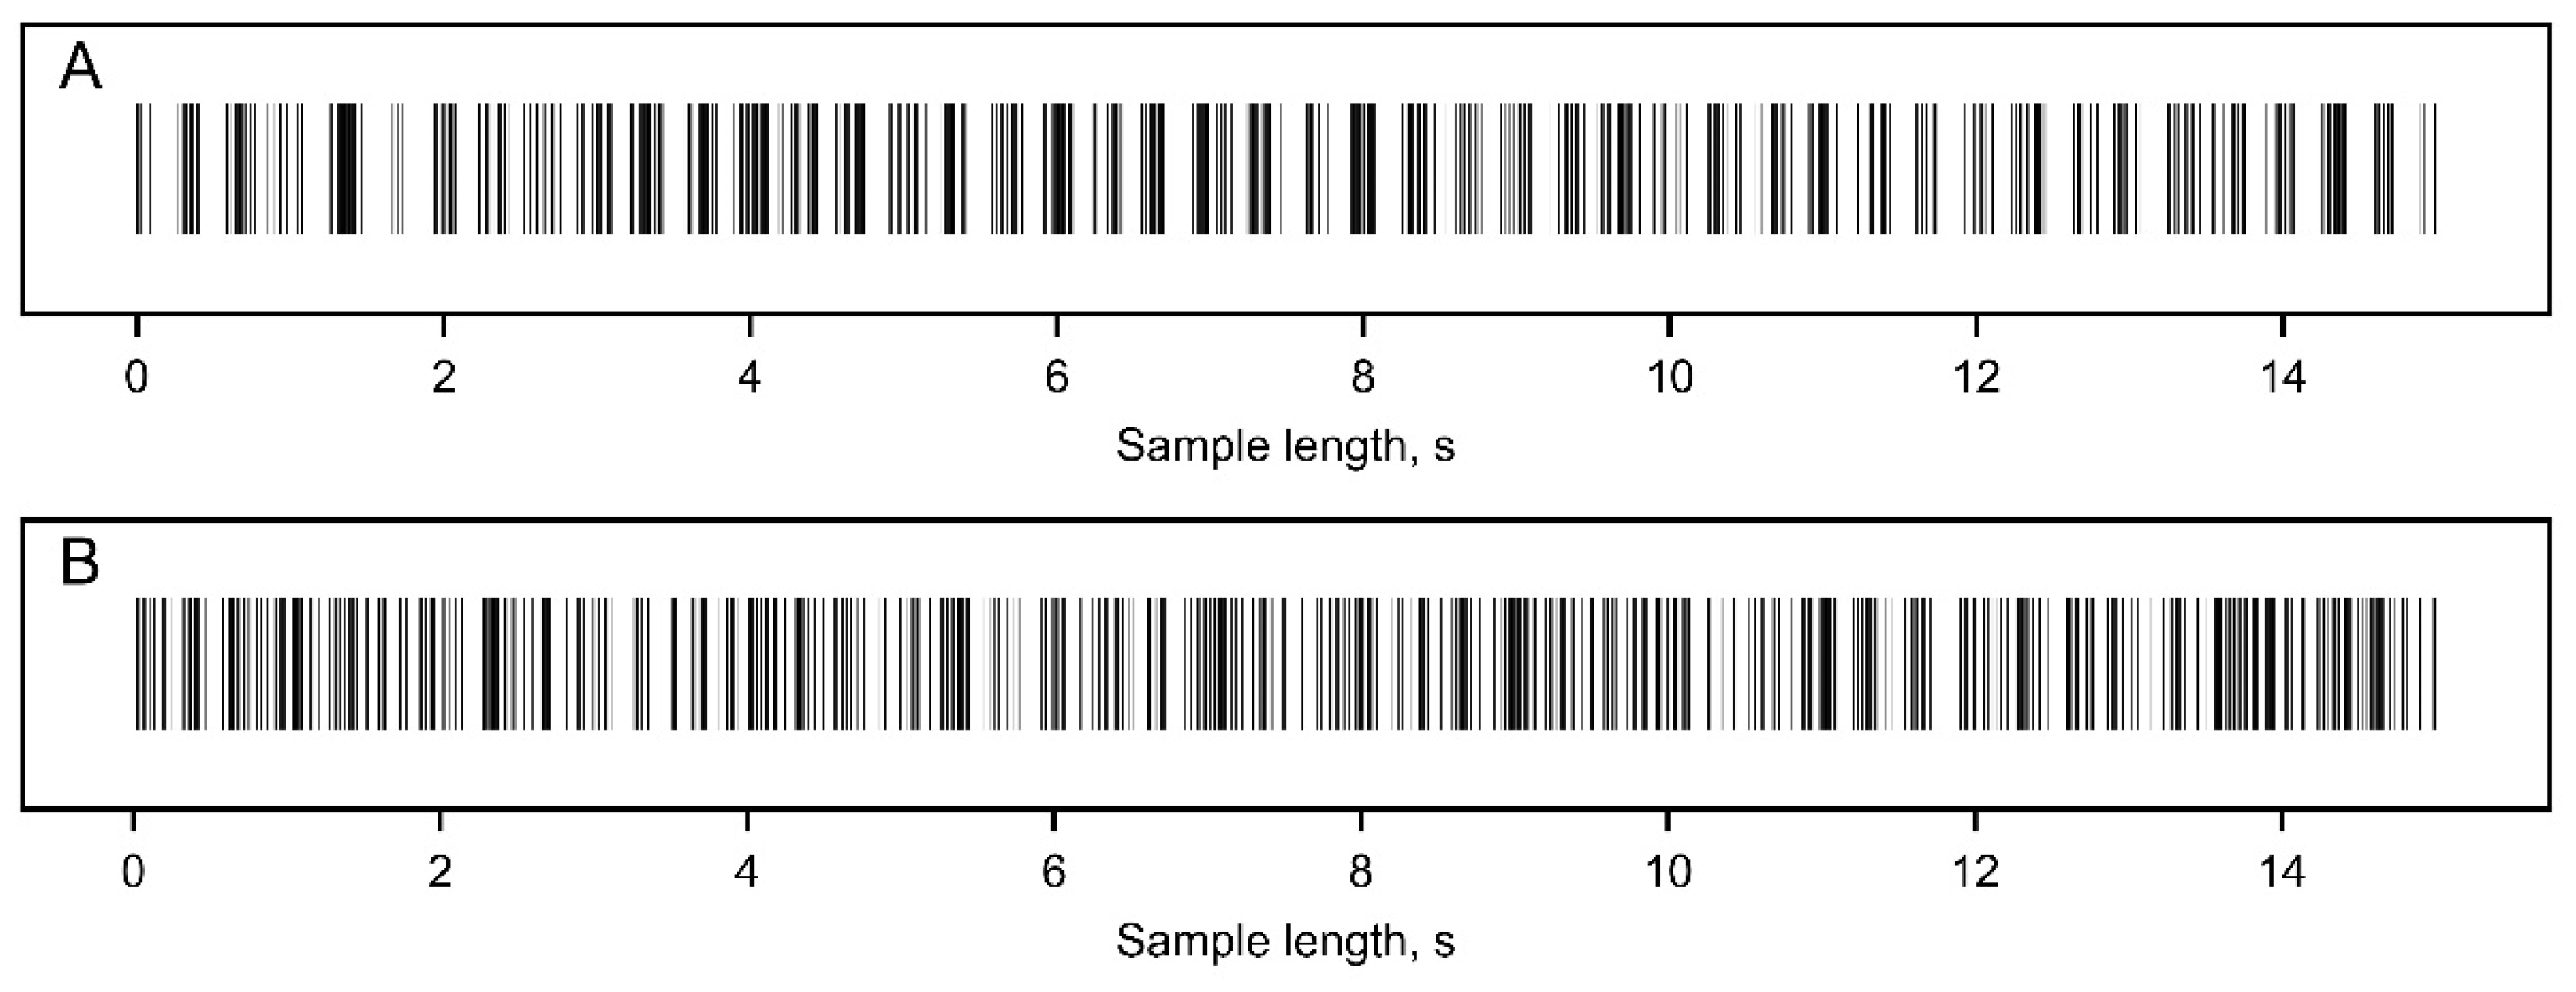
Figure 3.
Representation of methods used to convert spike timestamps and inter-spike interval (ISI) values into a symbol string, which is used for discrete entropy and mutual information (MI) calculations. A - Spike in bin (SIB) encoding technique. B - ISI to ISI (ISITISI) encoding technique. C - ISI to mean ISI (ISITM) encoding technique.

Figure 4.
The dependency of entropy (A-C) and mutual information (MI) (D-F) on sample size for different spike train encoding methods. Entropy and MI were calculated using word lengths ranging from 2 (dark grey) to 7 (light grey).
Figure 4.
The dependency of entropy (A-C) and mutual information (MI) (D-F) on sample size for different spike train encoding methods. Entropy and MI were calculated using word lengths ranging from 2 (dark grey) to 7 (light grey).
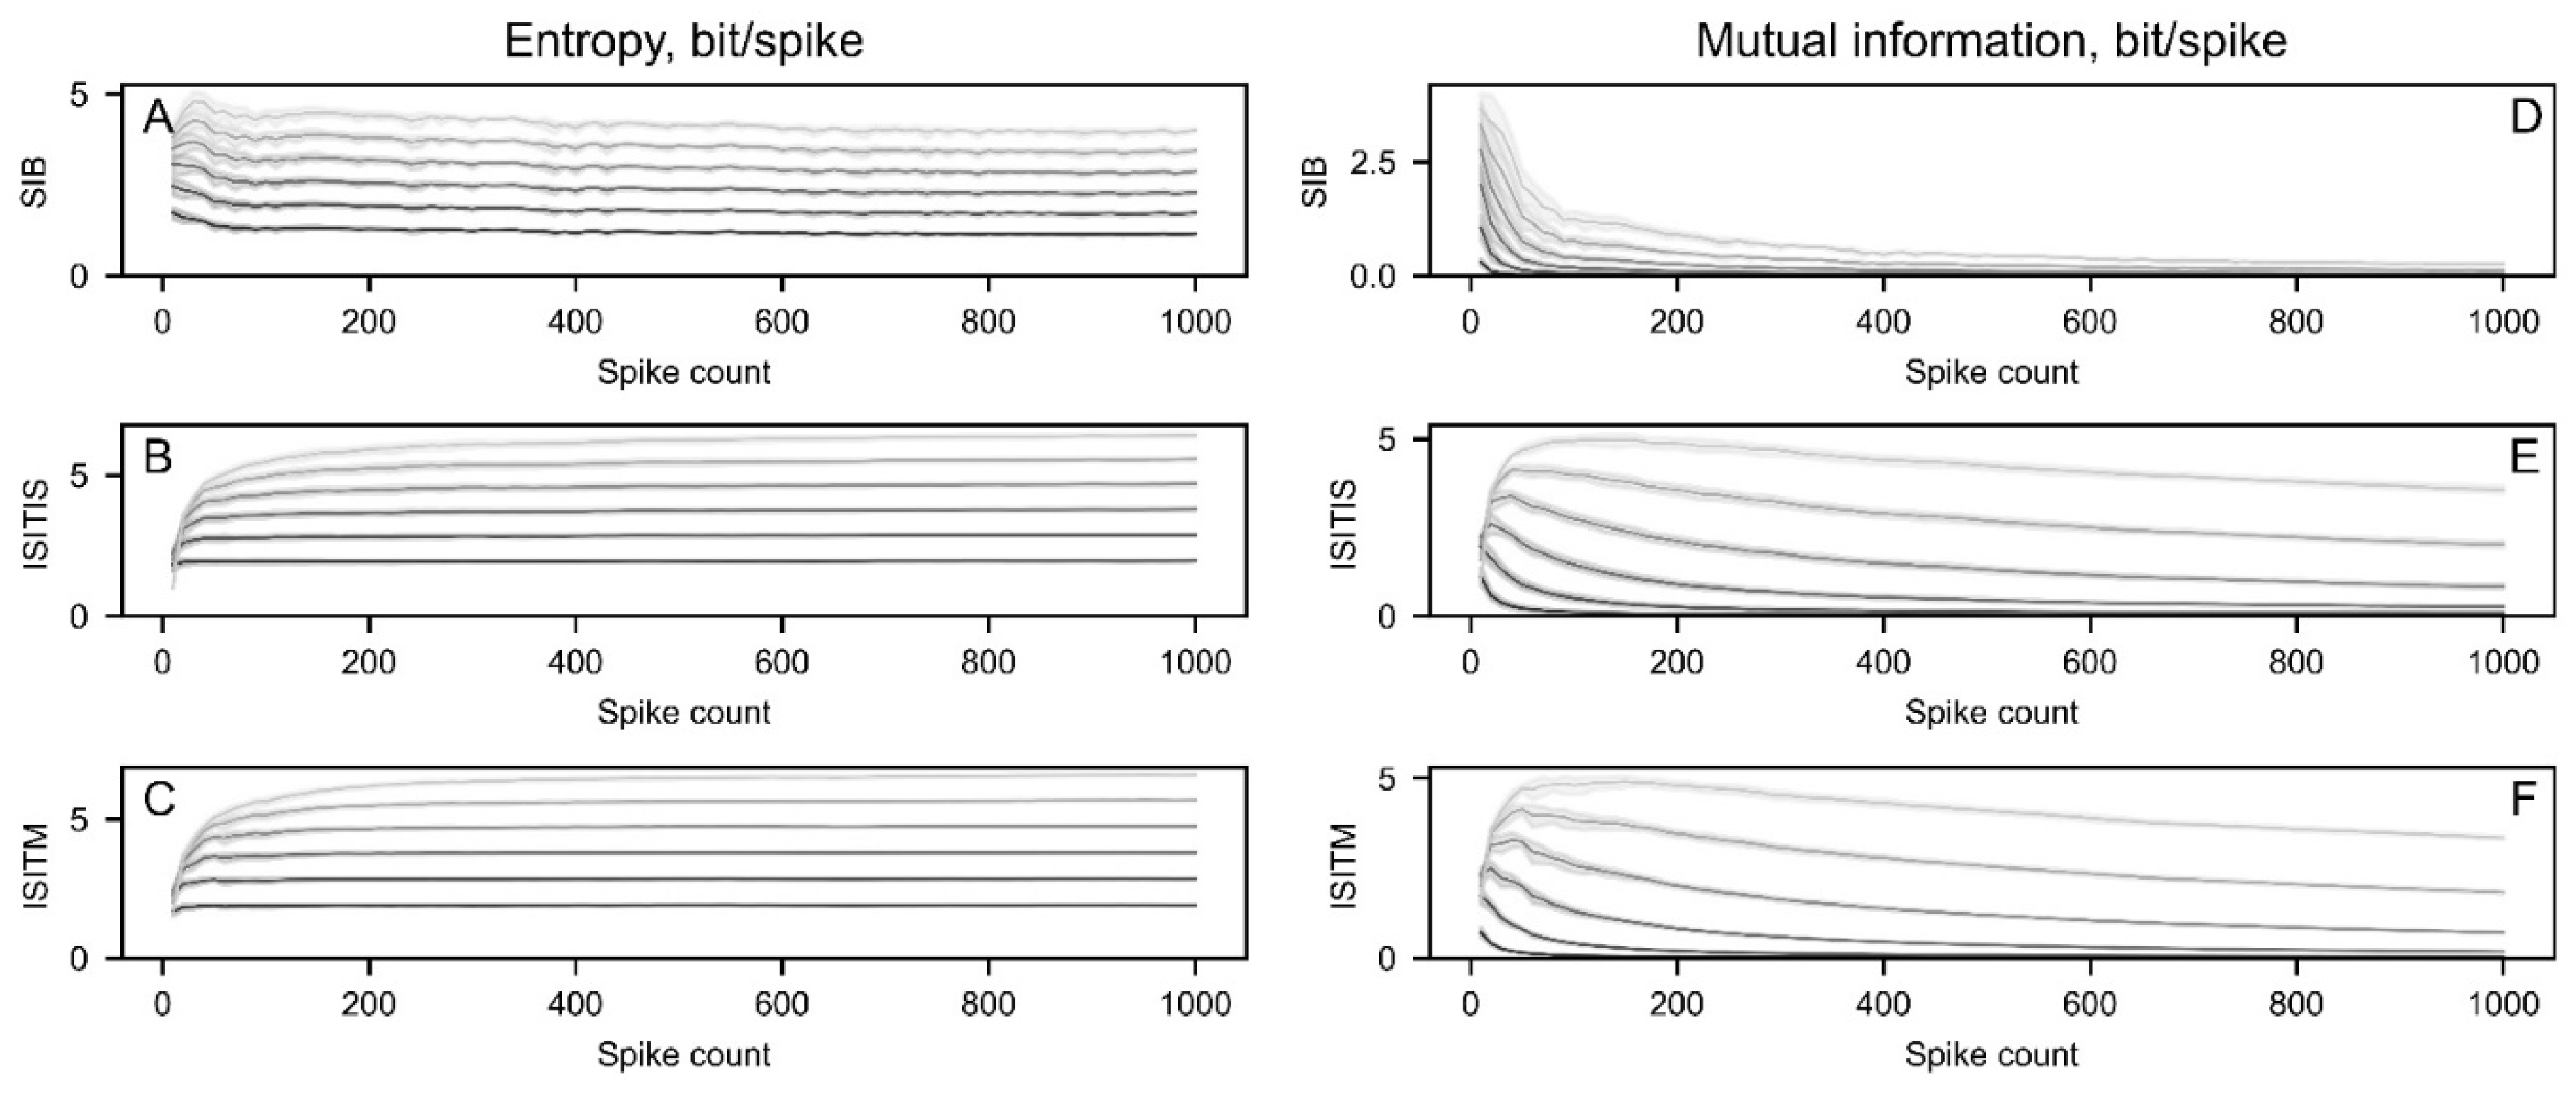
Figure 5.
The interrelations between nonlinear features and firing rate (FR) (A-F), Coefficient of variance (CV) (G-L), asymmetry index (AI) (M-R) for artificial dataset. The samples are color-coded based on their firing rate values, with dark representing low firing rate values and bright representing high firing rate values.
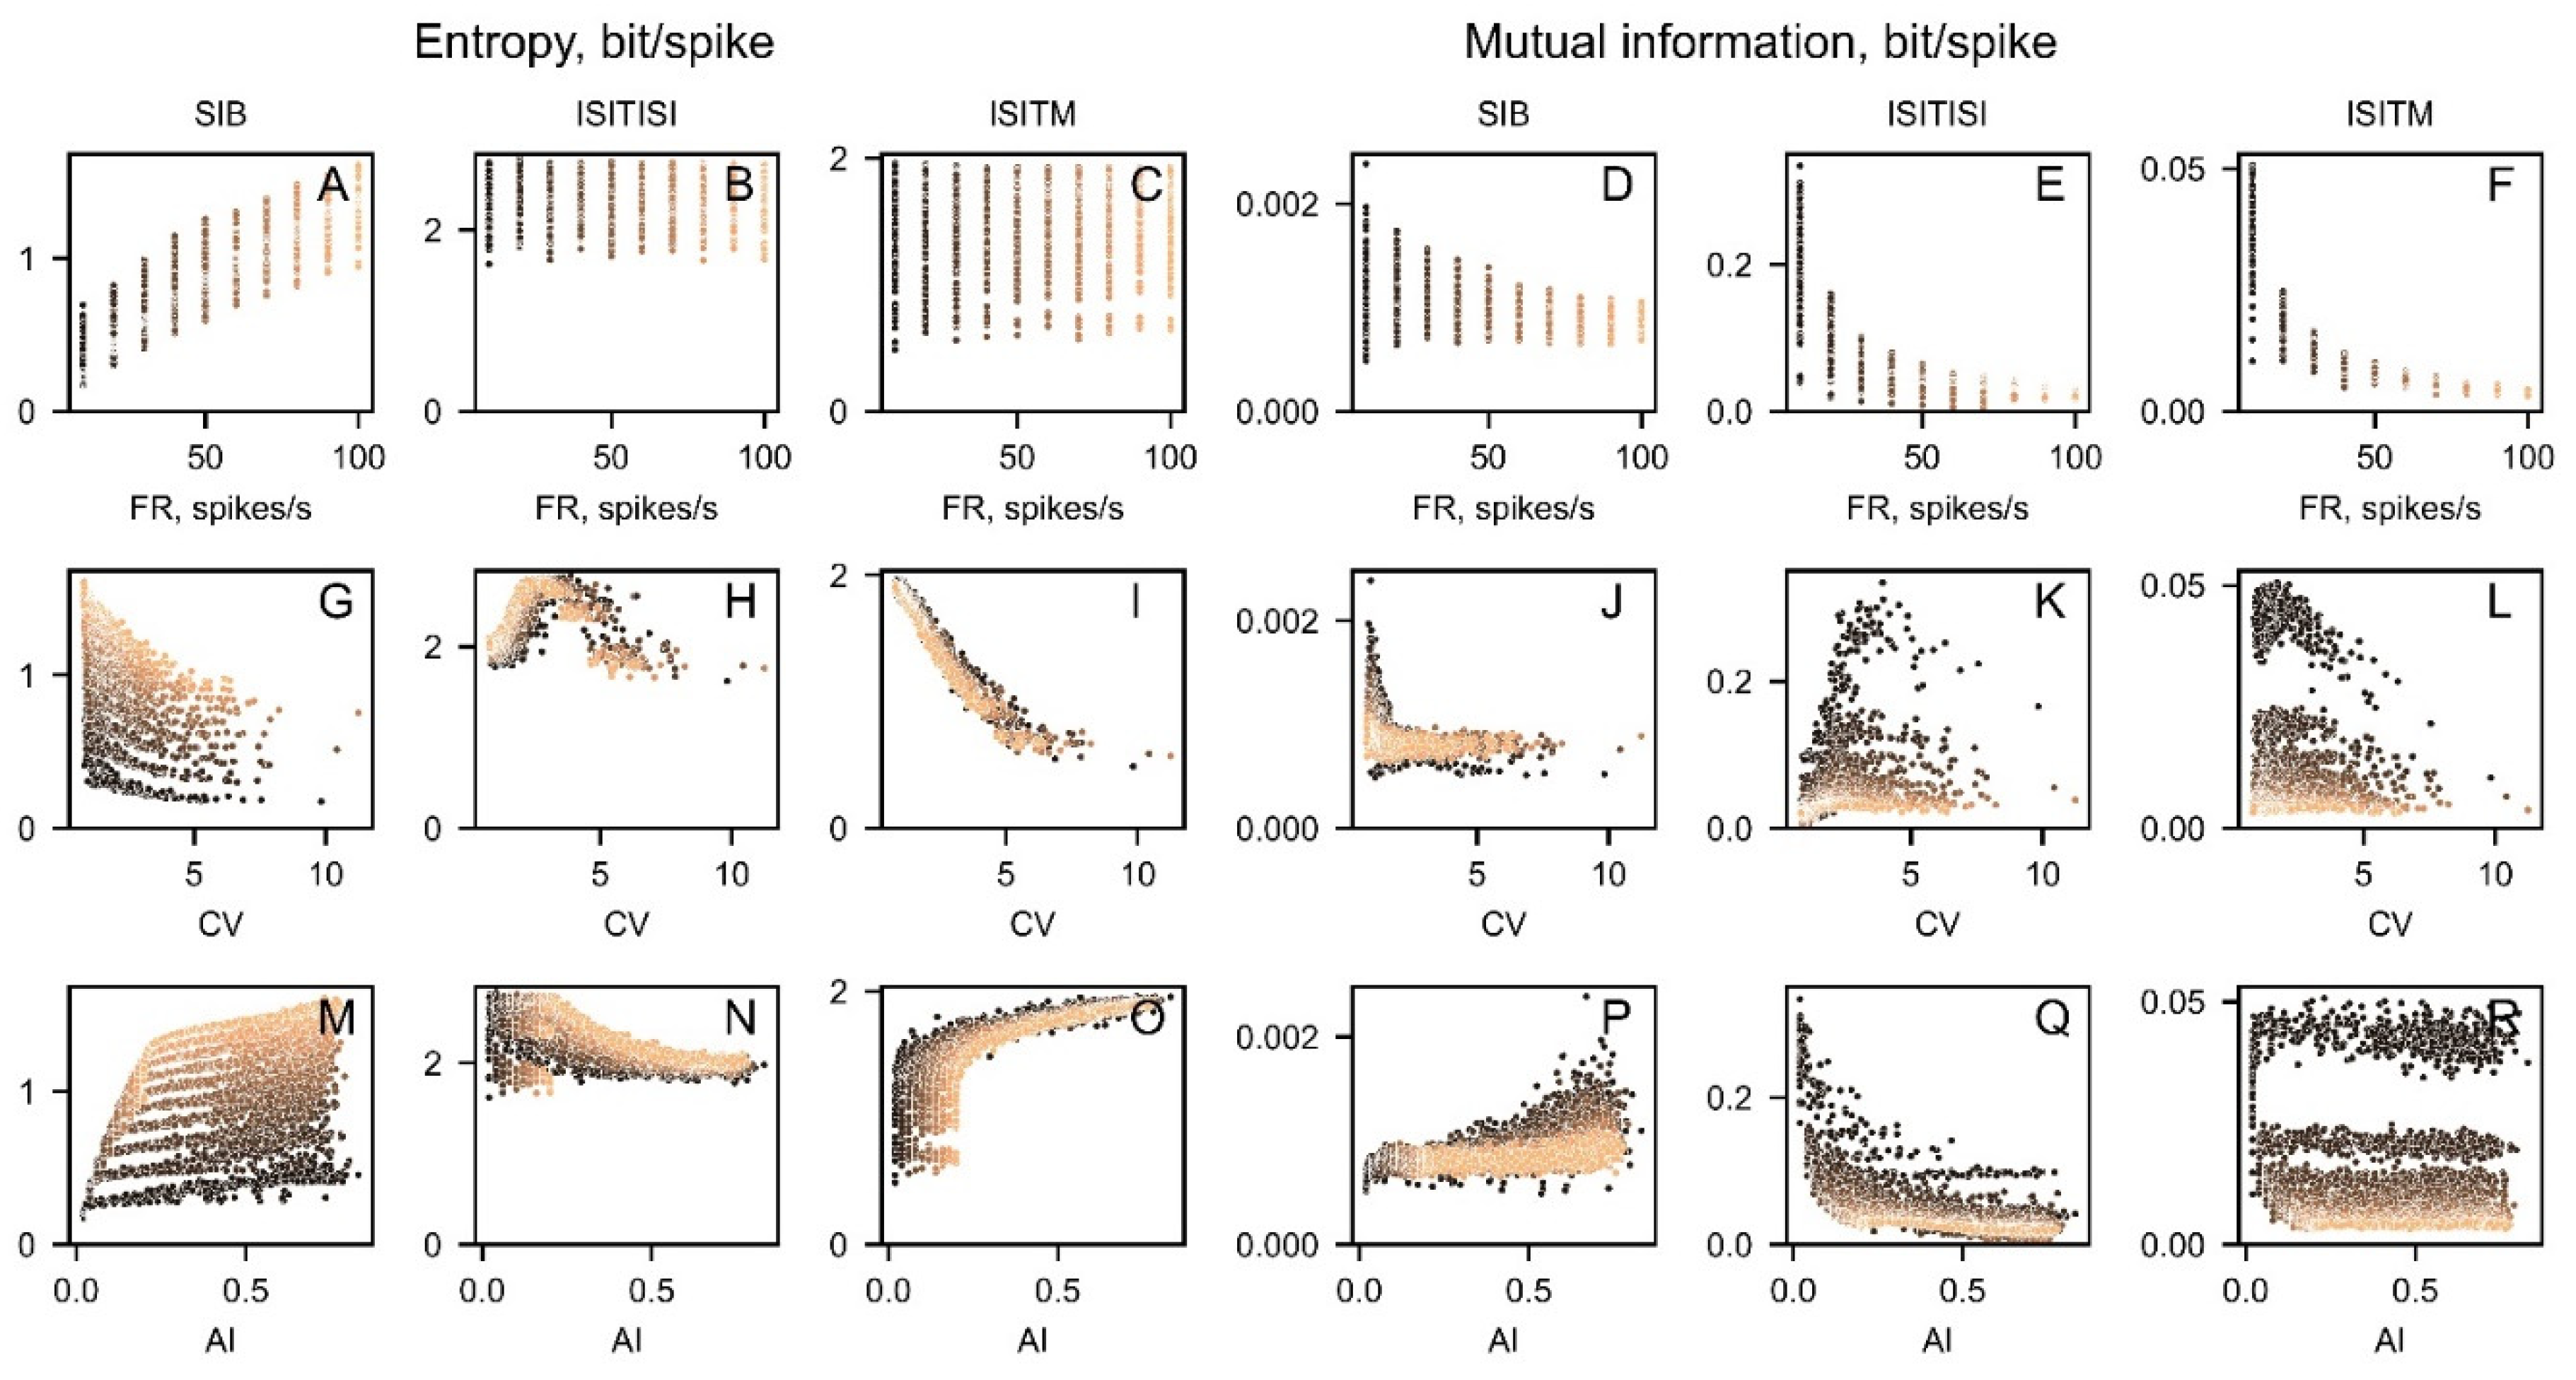
Figure 6.
The variations in entropy (A-C) and mutual information (MI) (D-F) calculated using different spike train encoding techniques, depending on the single unit activity pattern: pause (dark grey), burst (grey), tonic (light grey). Outliers at high MI values in plot F are related to low firing rate values.
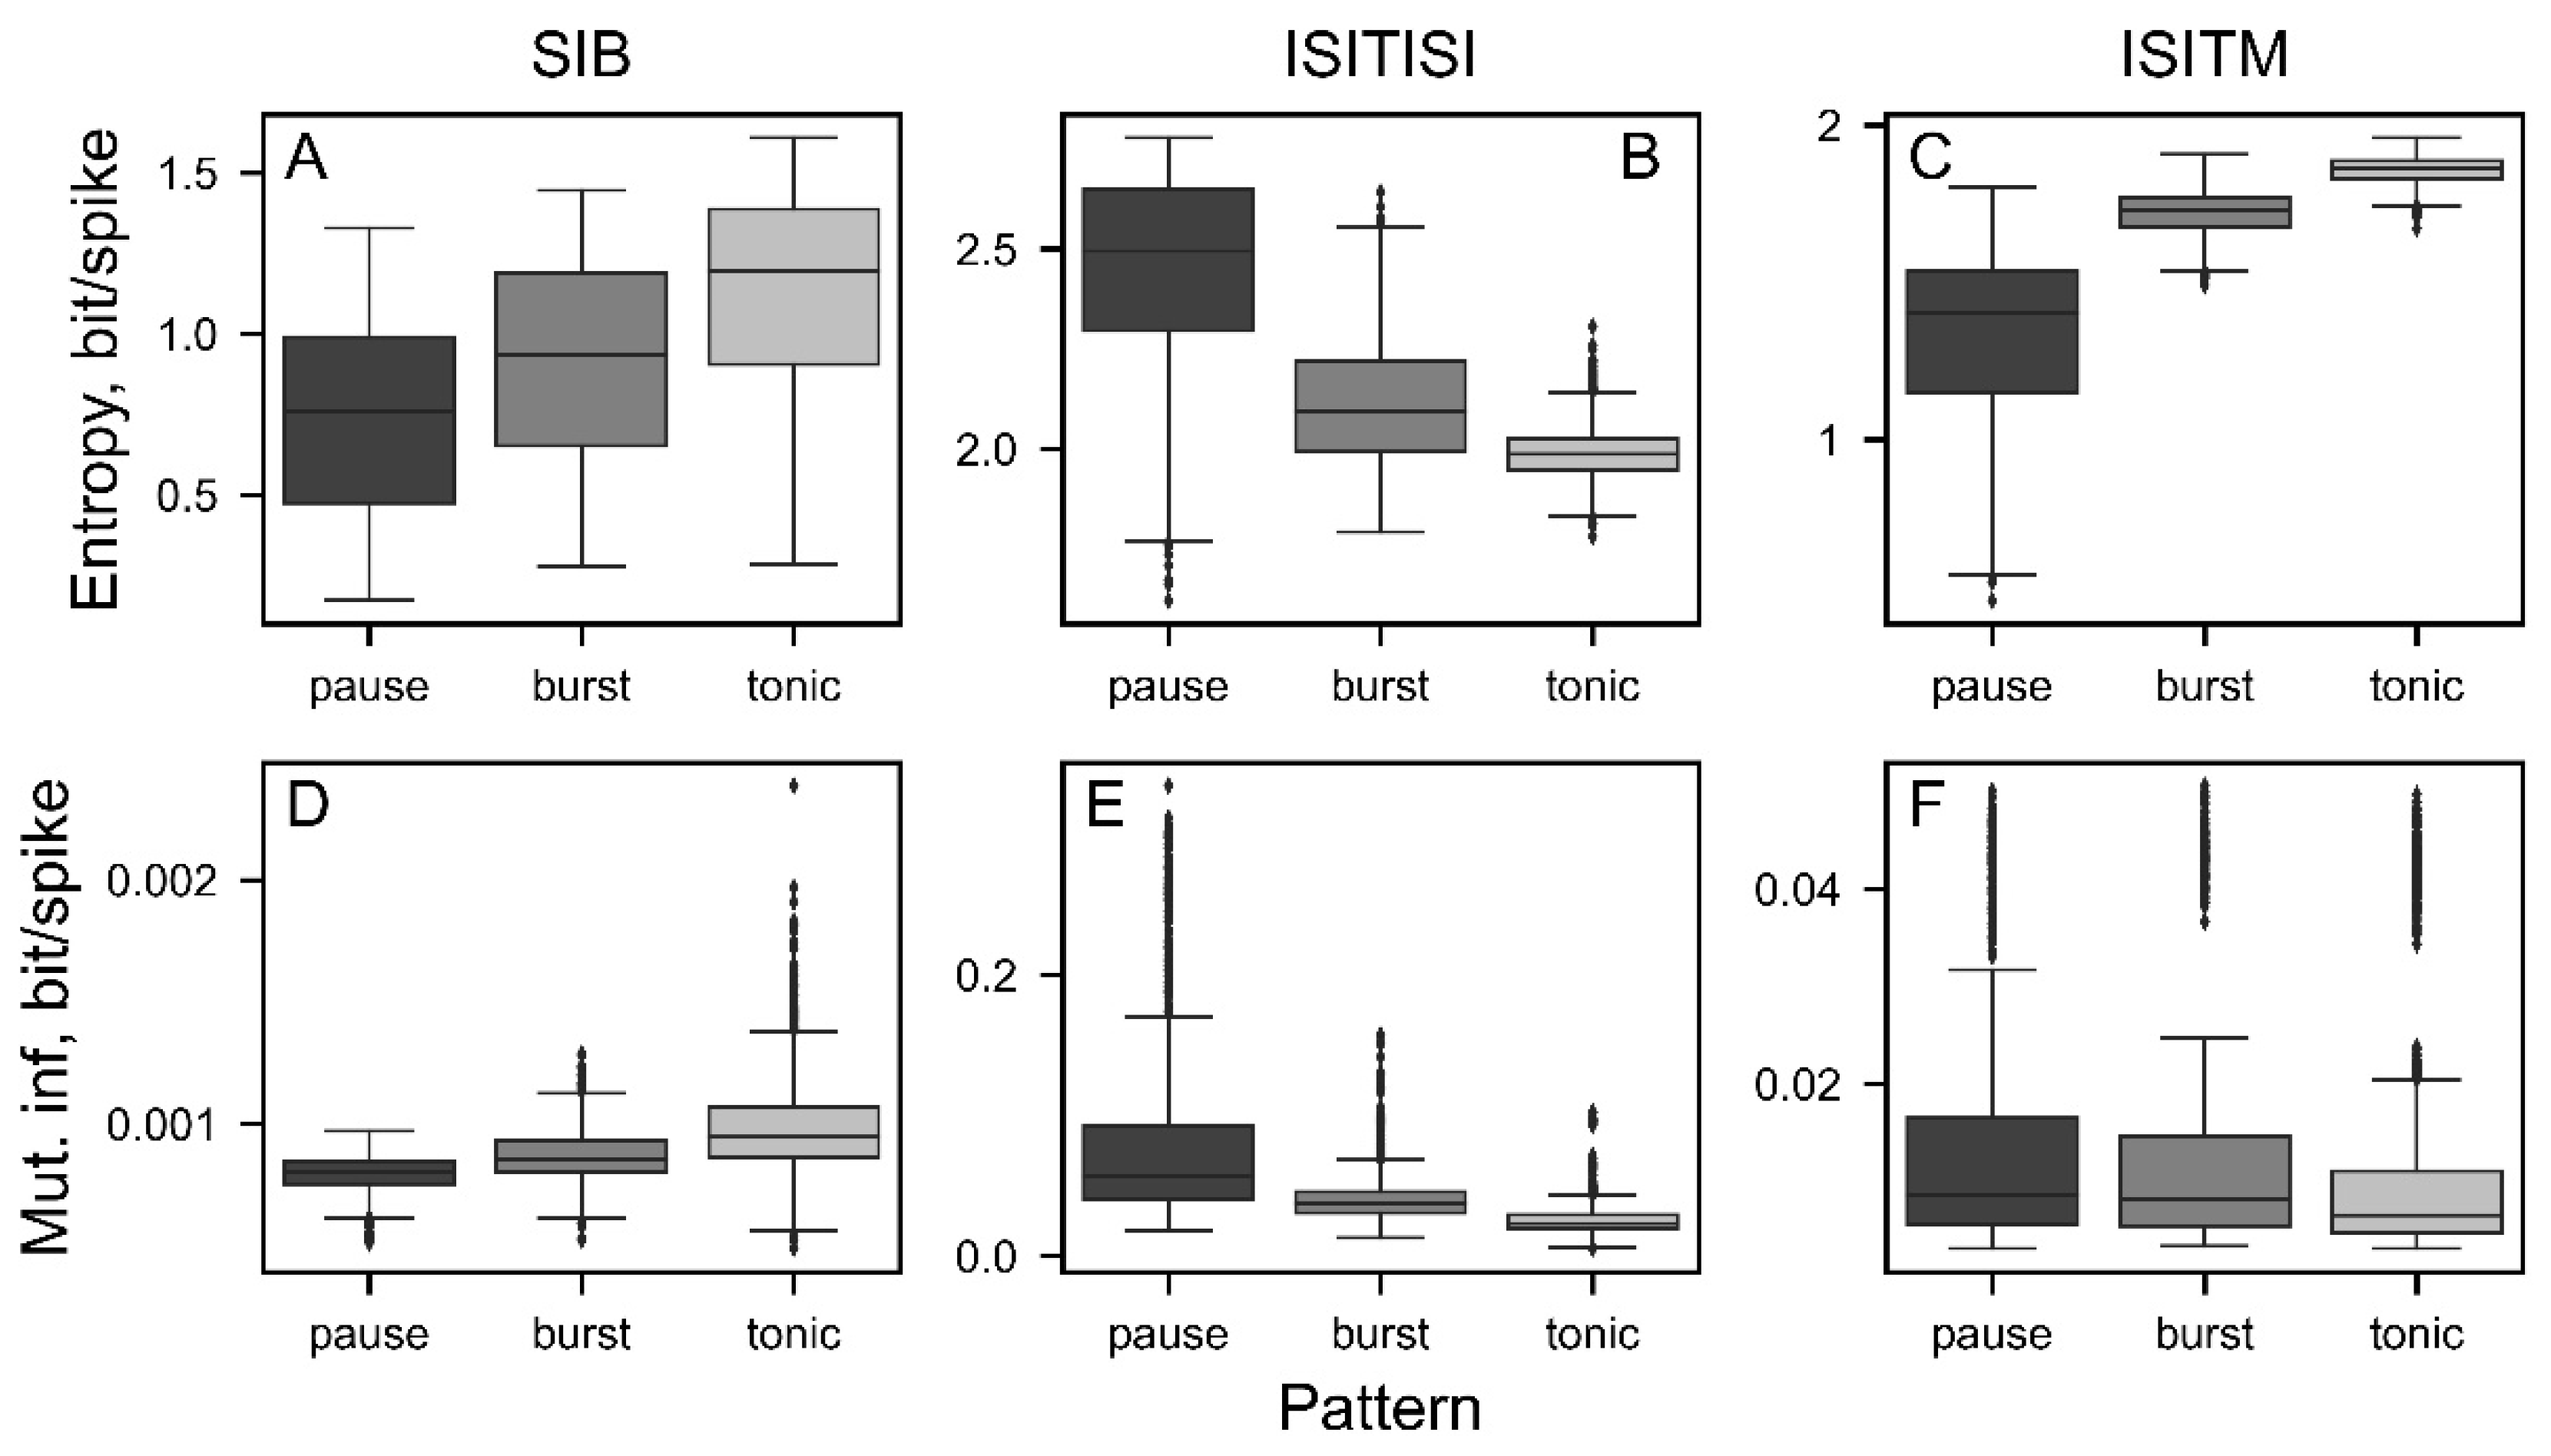
Figure 7.
The entropy (A-C) and mutual information (MI) (D-F) values depending on the frequency of simulated oscillatory activity. Light gray represents weak oscillatory activity with a modulation index of 0.05, while black represents strong oscillatory activity with a modulation index of 1. Above the plots regions with p-value < 0.001 are illustrated with black dashes.
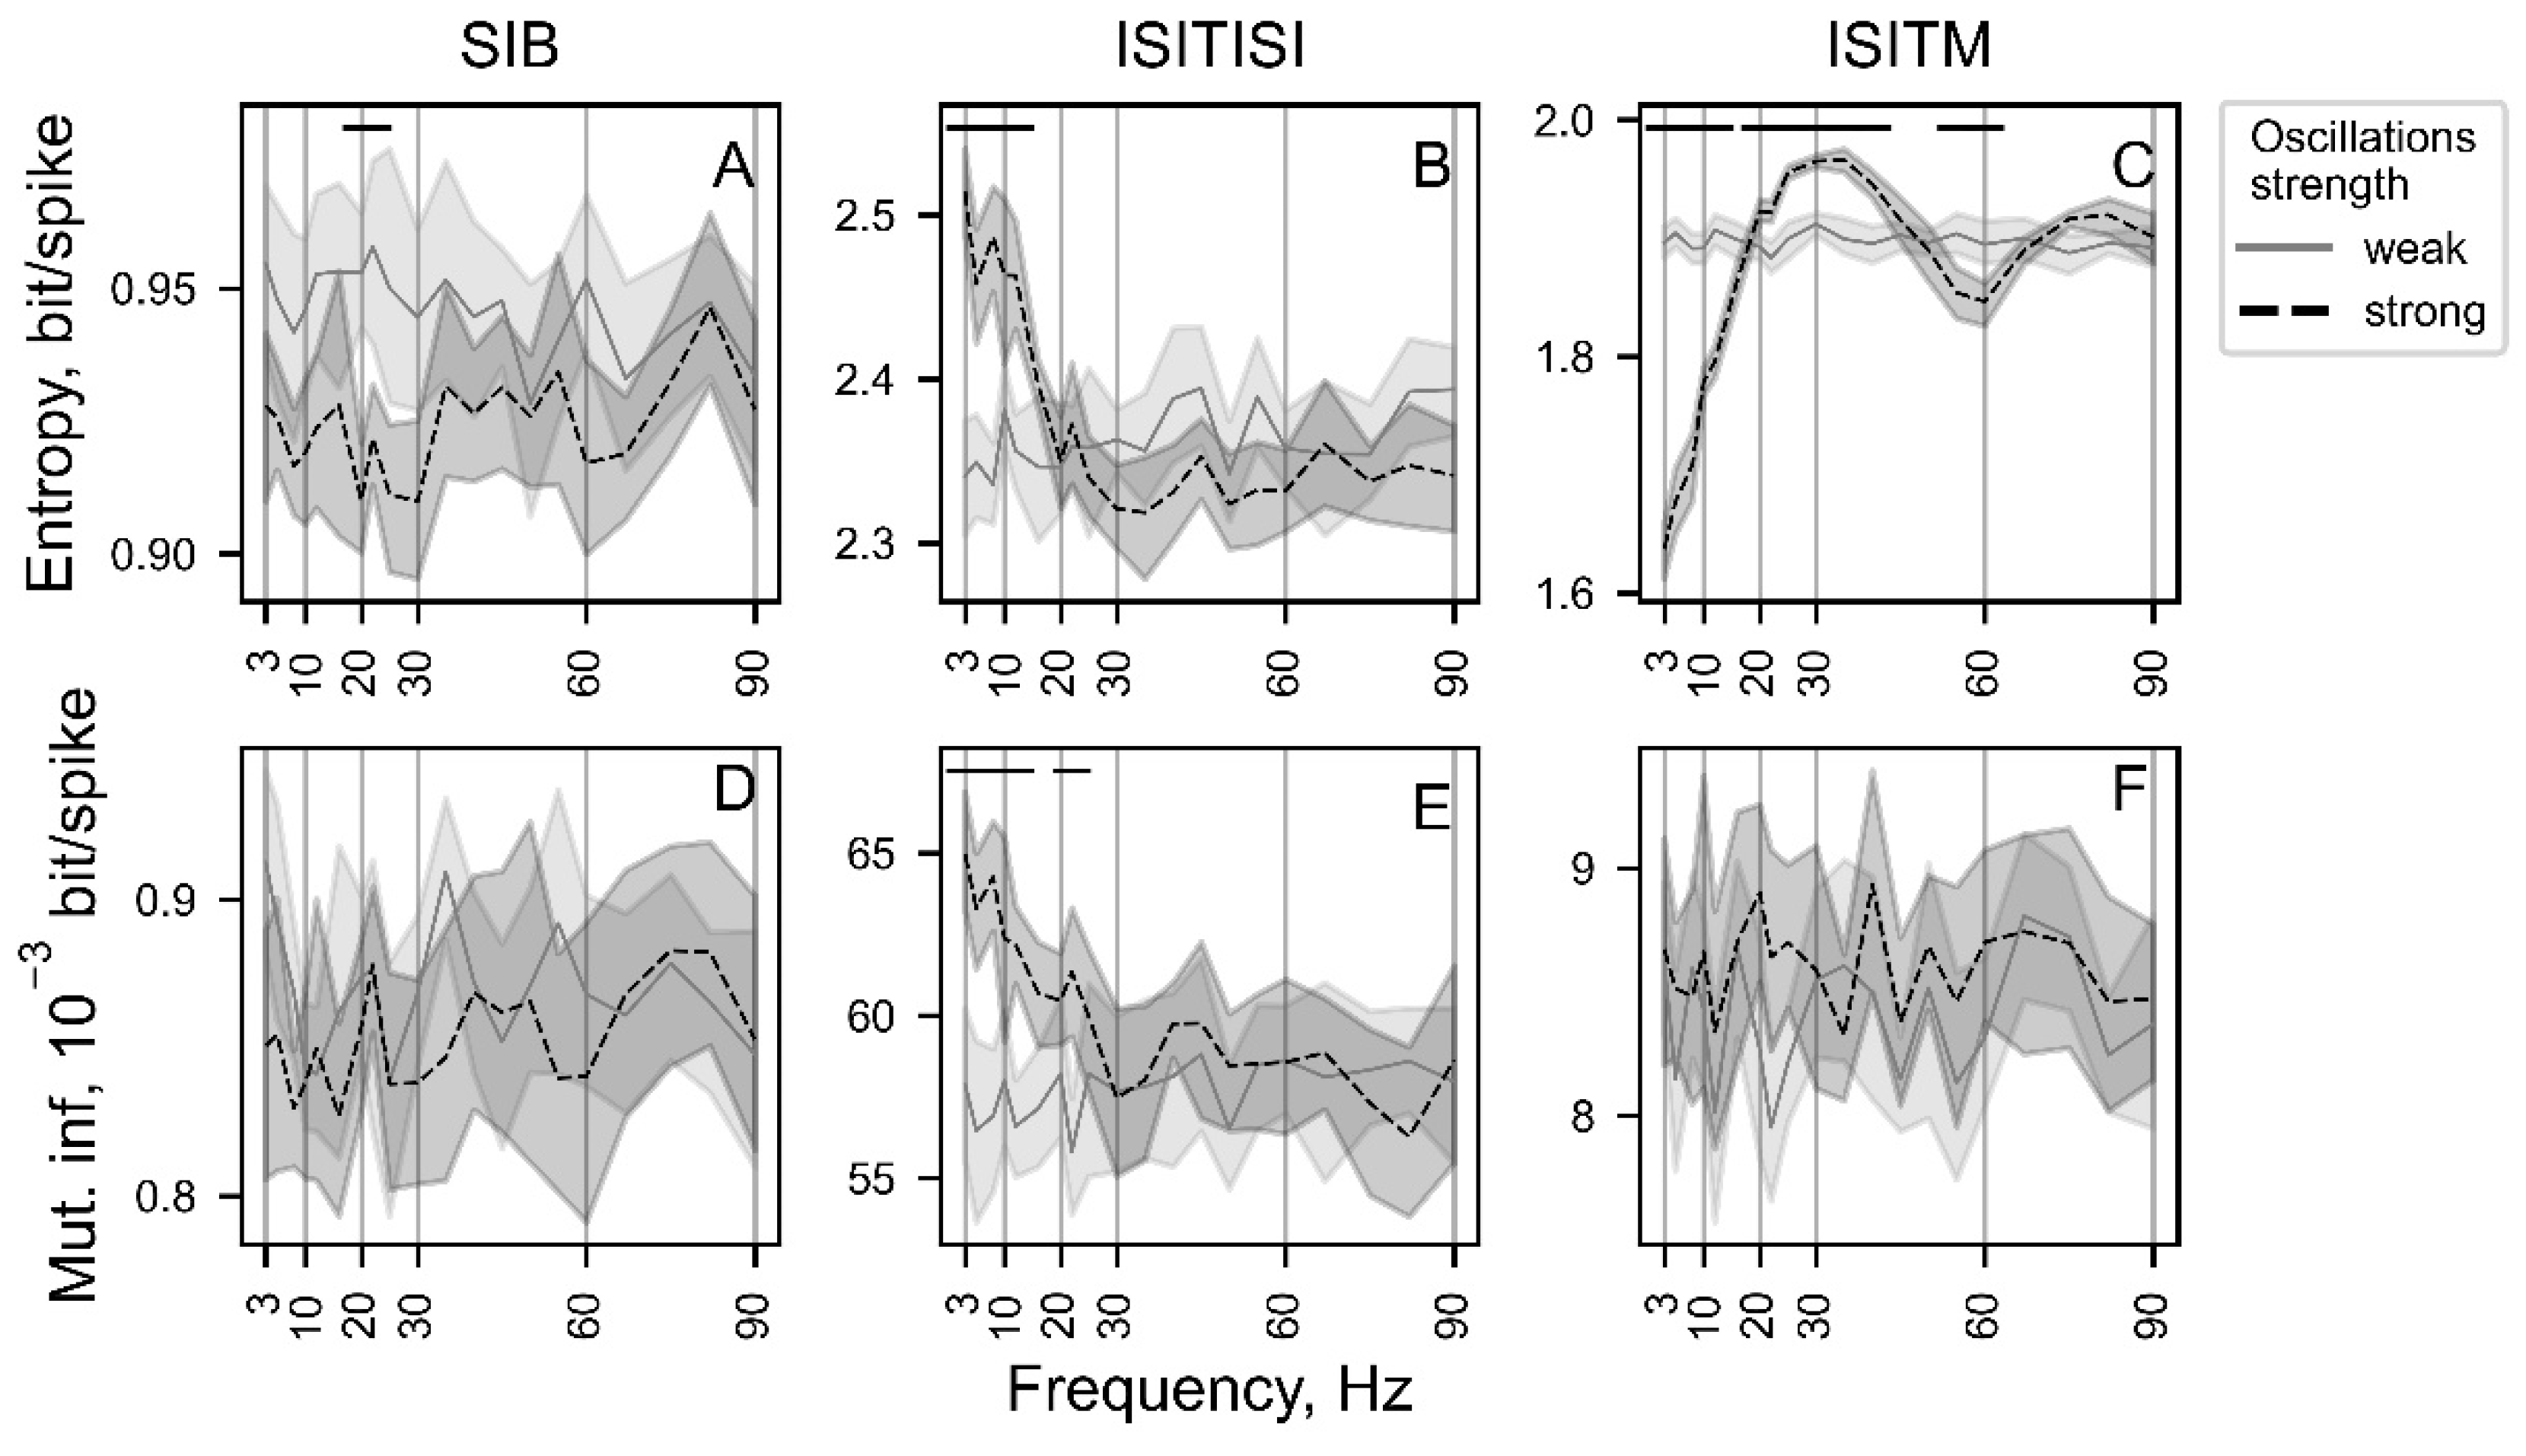
Figure 8.
The dependencies of entropy (A-C) and mutual information (MI) (D-F) values on oscillation intensity. The visualized dependencies are shown for frequencies of 3, 8, 12, 20, 30, 60, and 90 Hz, representing the basic physiological oscillatory ranges. The plots are color-coded based on their frequency values, with dark representing low oscillation frequency values and bright representing high oscillation frequency values.
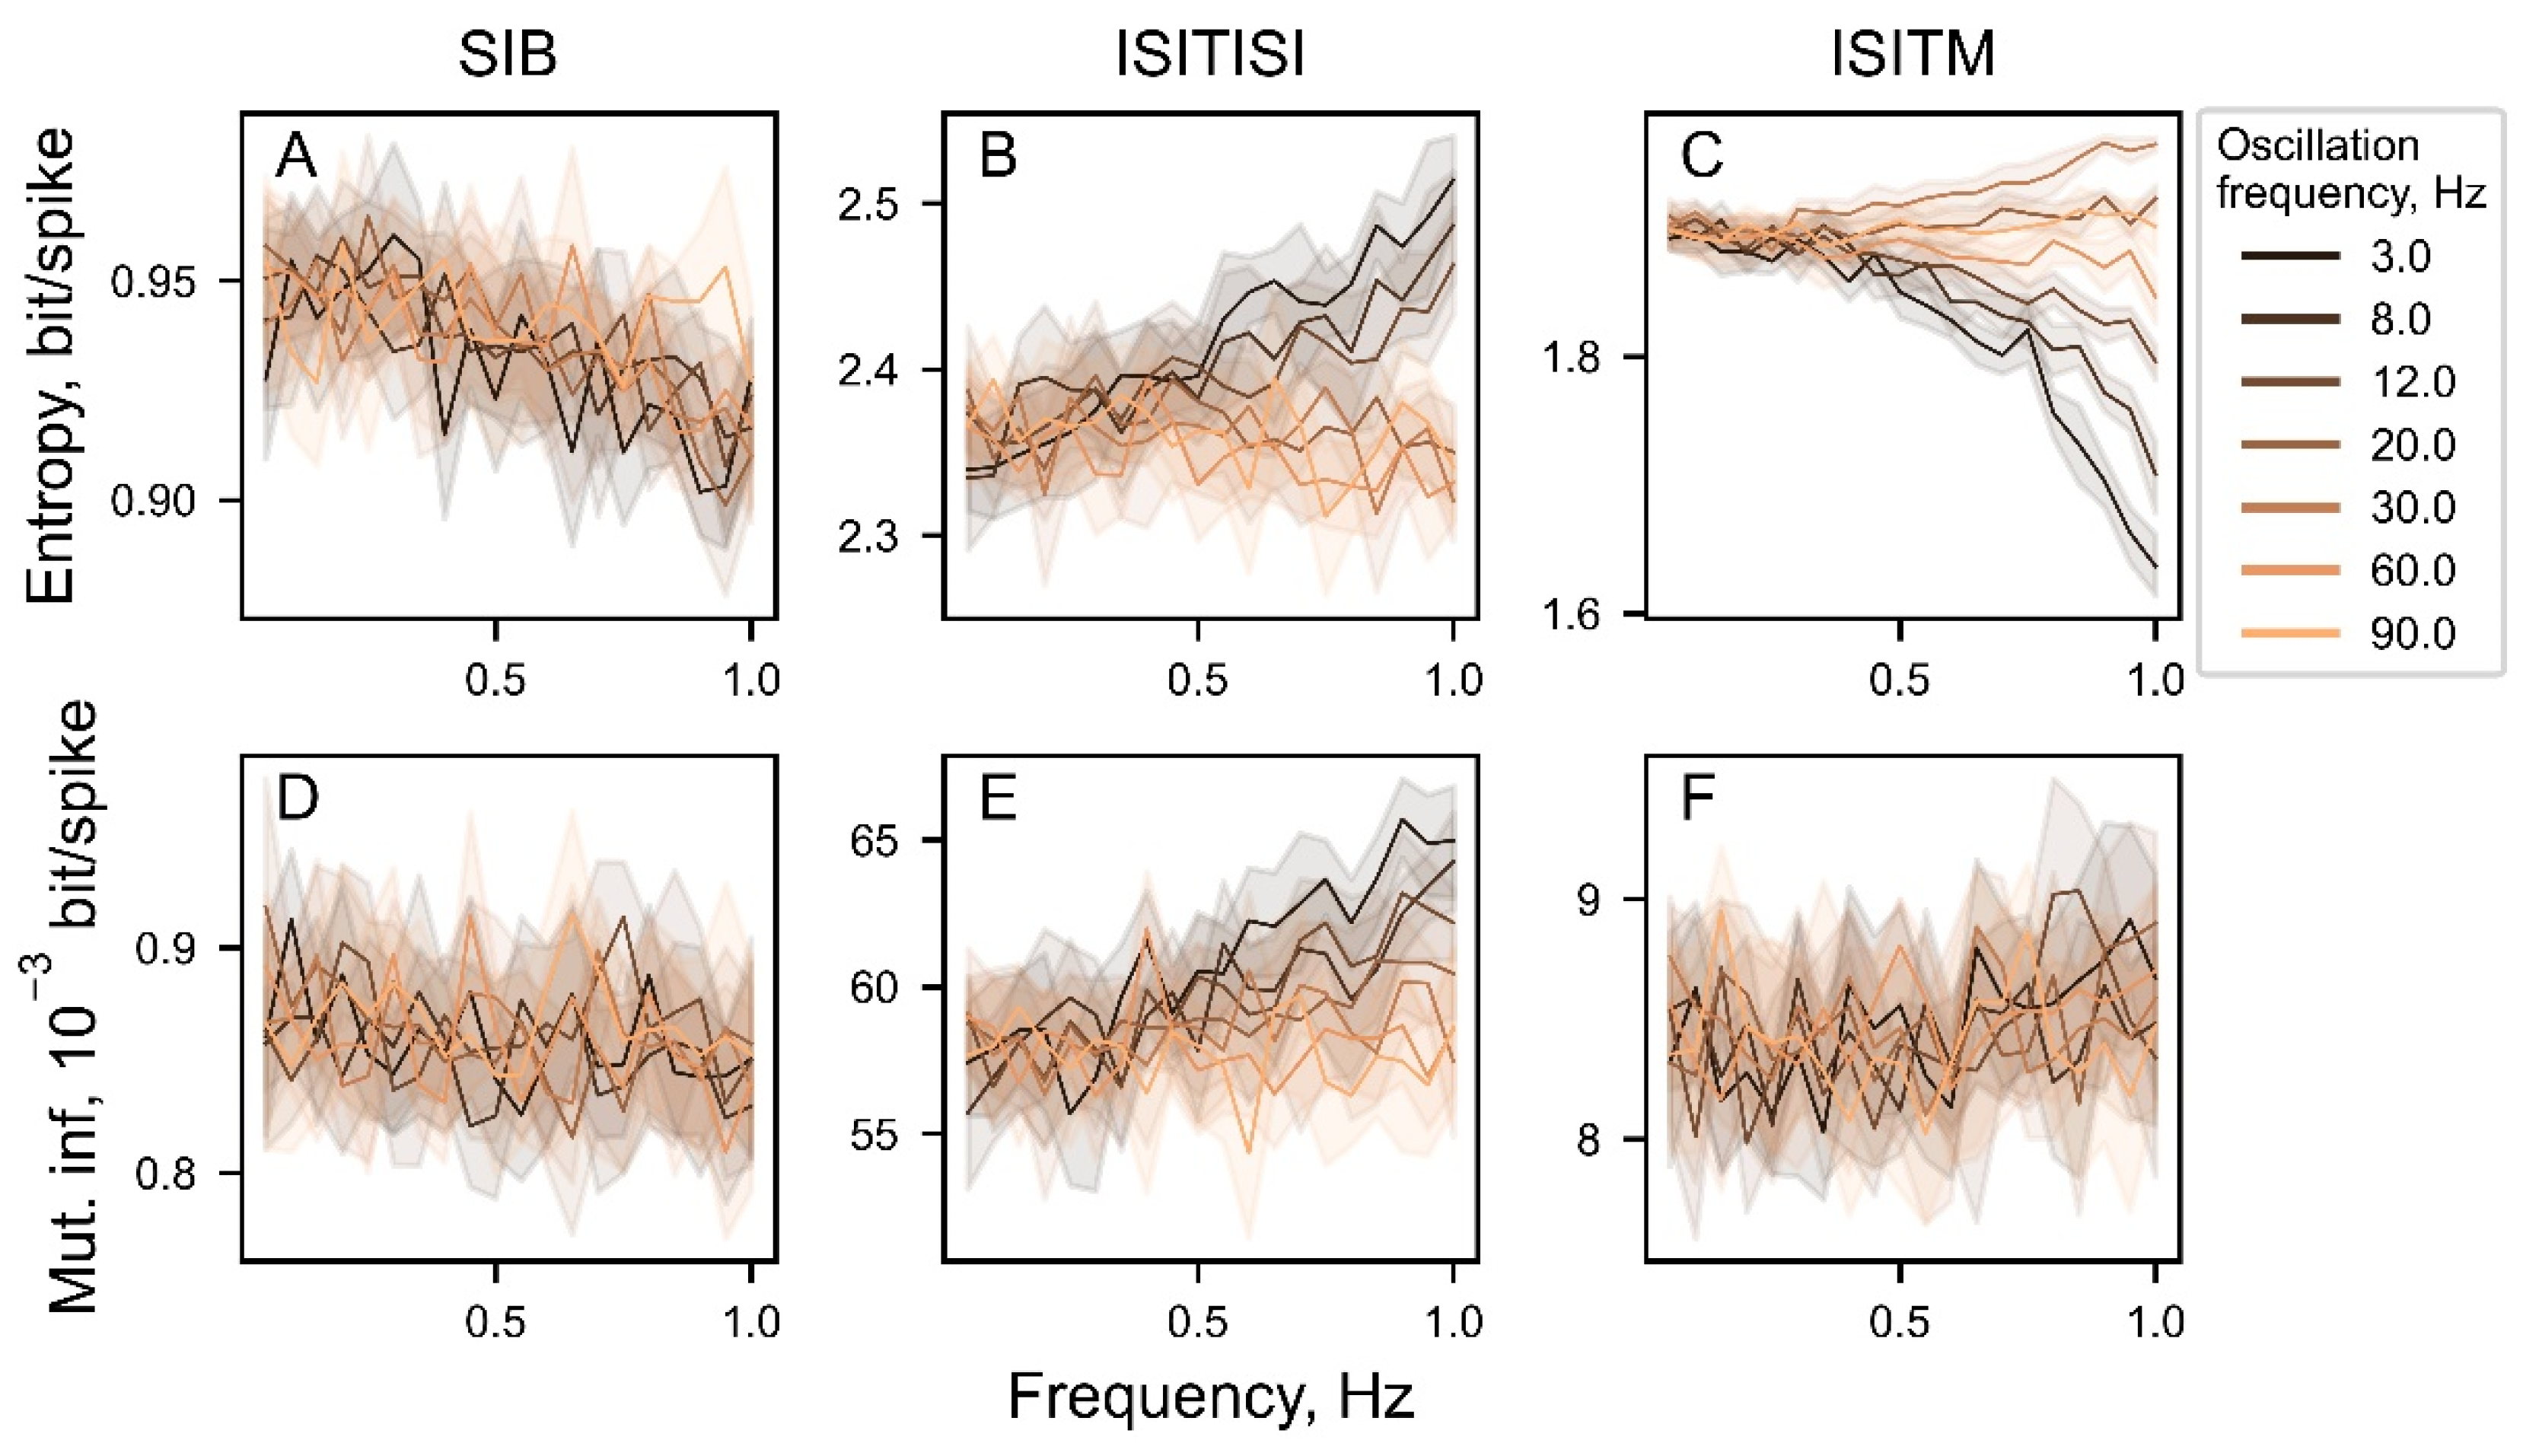
Figure 9.
The interrelations between nonlinear features and firing rate (FR) (A-F), coefficient of variance (CV) (G-L), asymmetry index (AI) (M-R) for experimental data.
Figure 9.
The interrelations between nonlinear features and firing rate (FR) (A-F), coefficient of variance (CV) (G-L), asymmetry index (AI) (M-R) for experimental data.
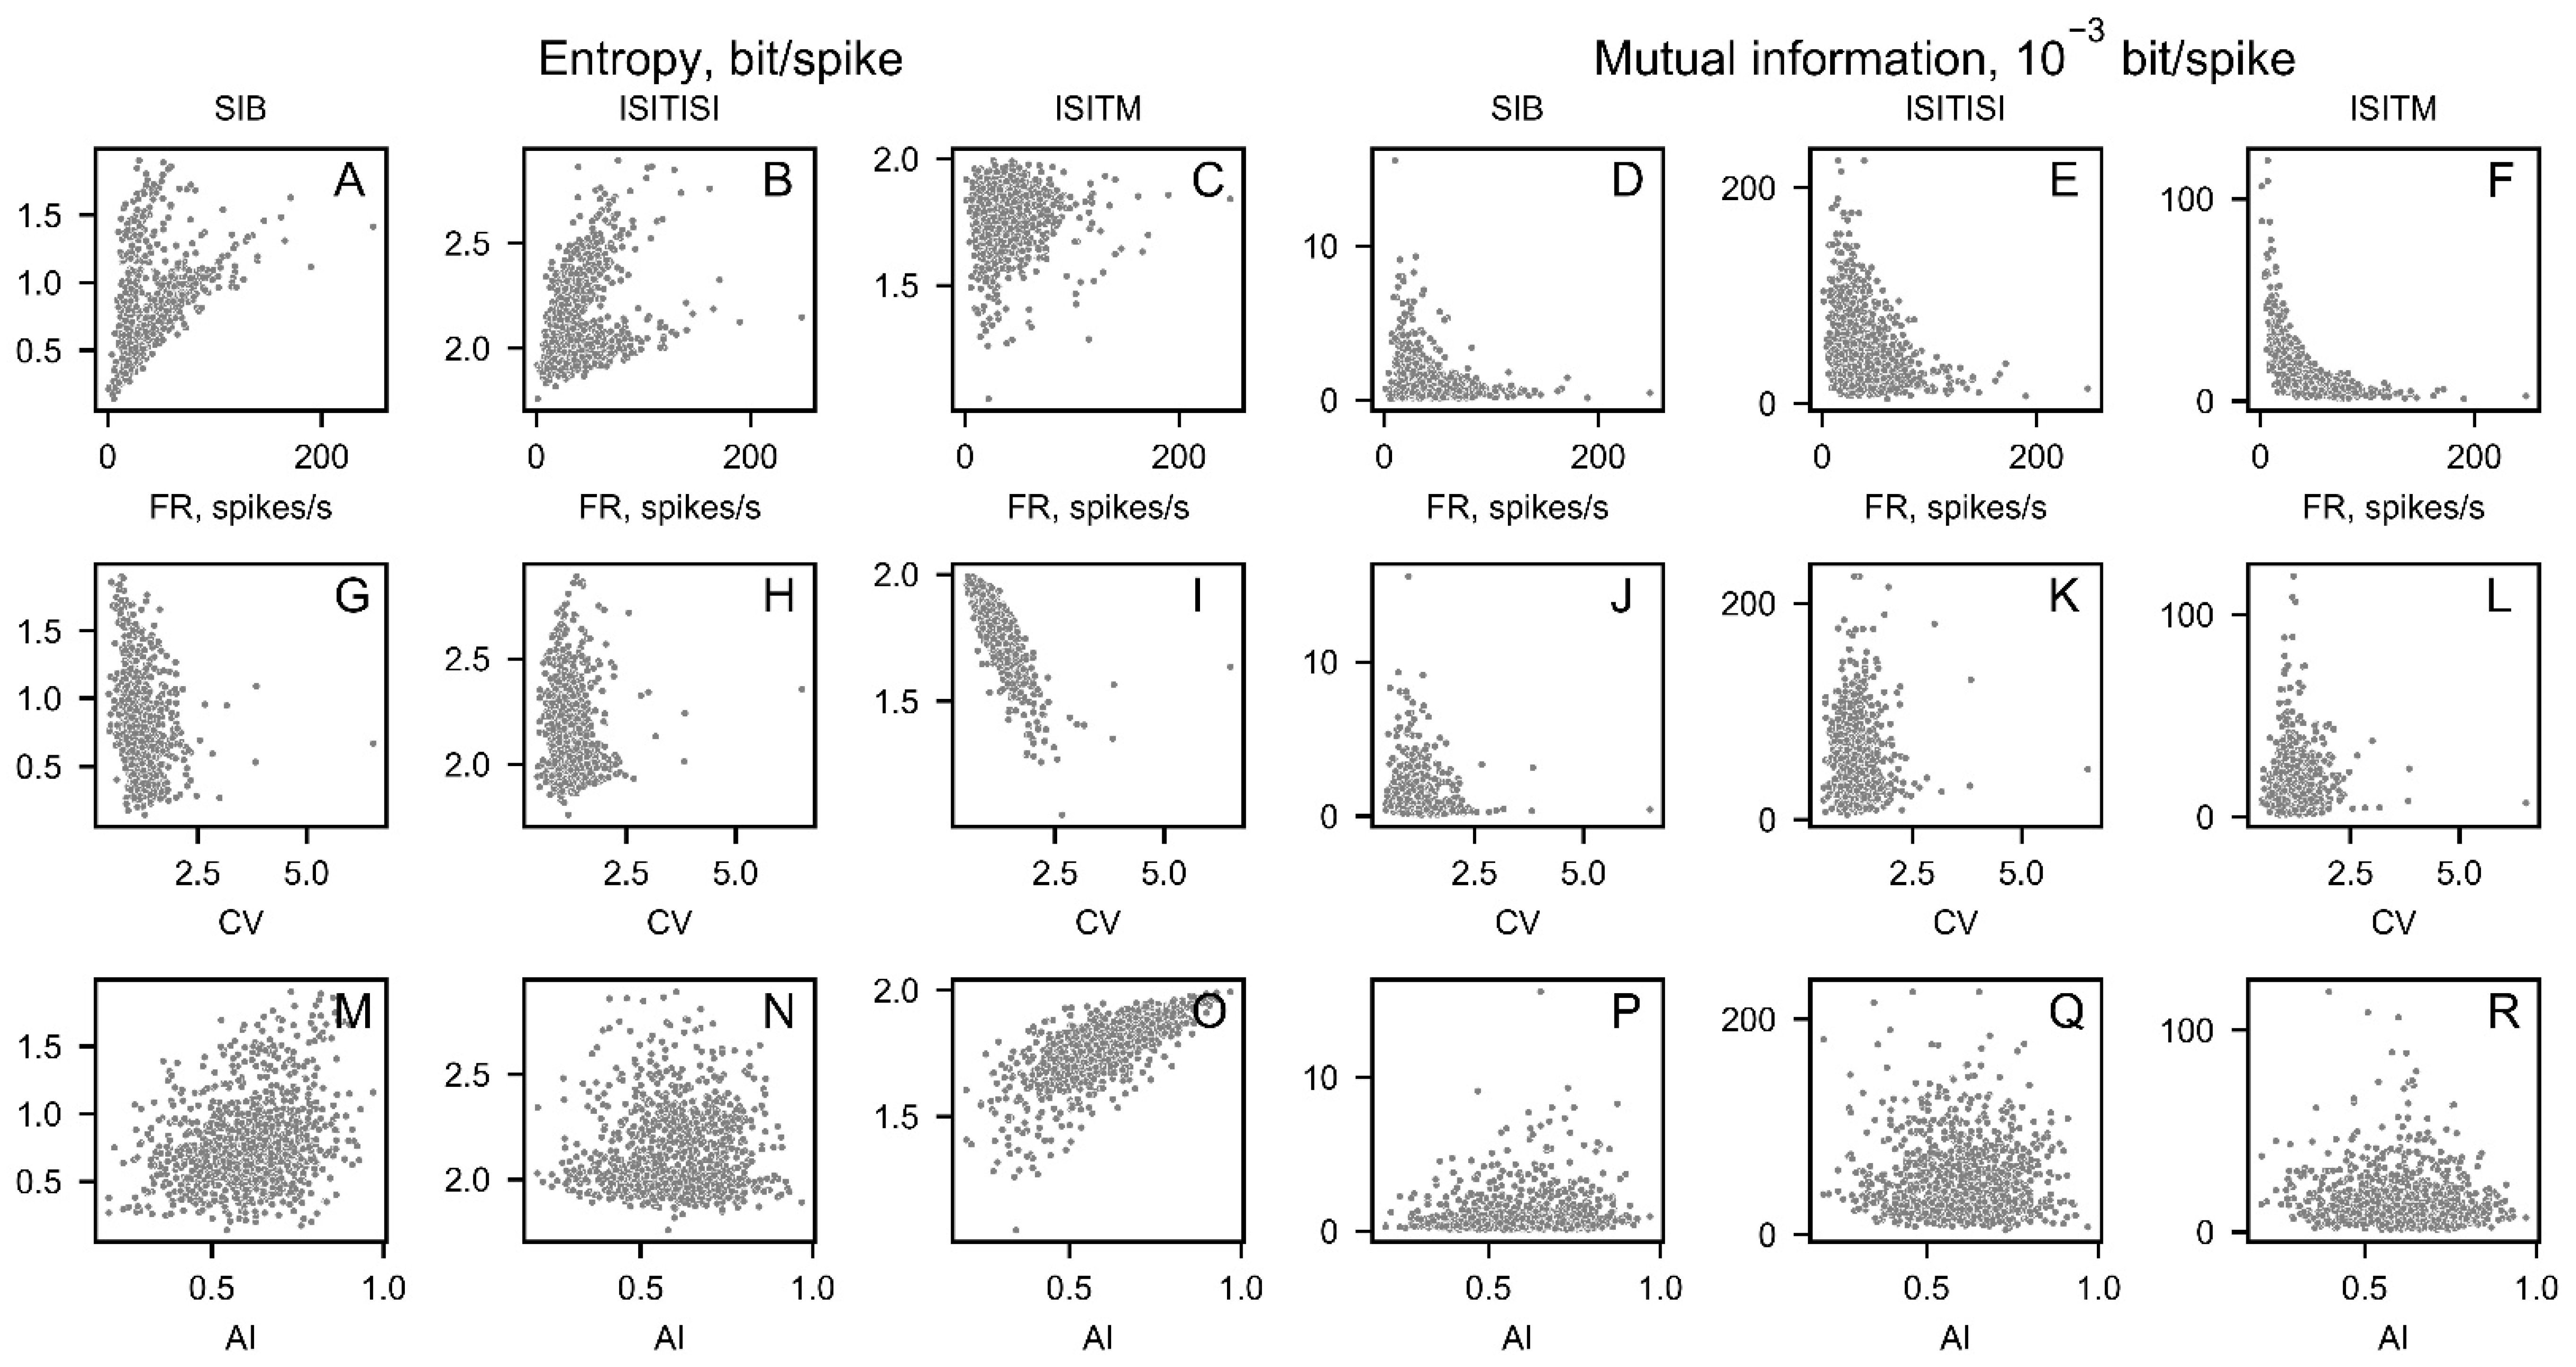
Figure 10.
The entropy (A-C) and mutual information (MI) (D-F) values depending on the frequency of experimental data oscillatory activity. Light grey represents weak oscillatory activity with oscore values less than median value for the observing frequency range, black represents strong oscillatory activity, which oscores are greater than median oscore value. Above the plots regions with p-value < 0.0001 are illustrated with black dashes.
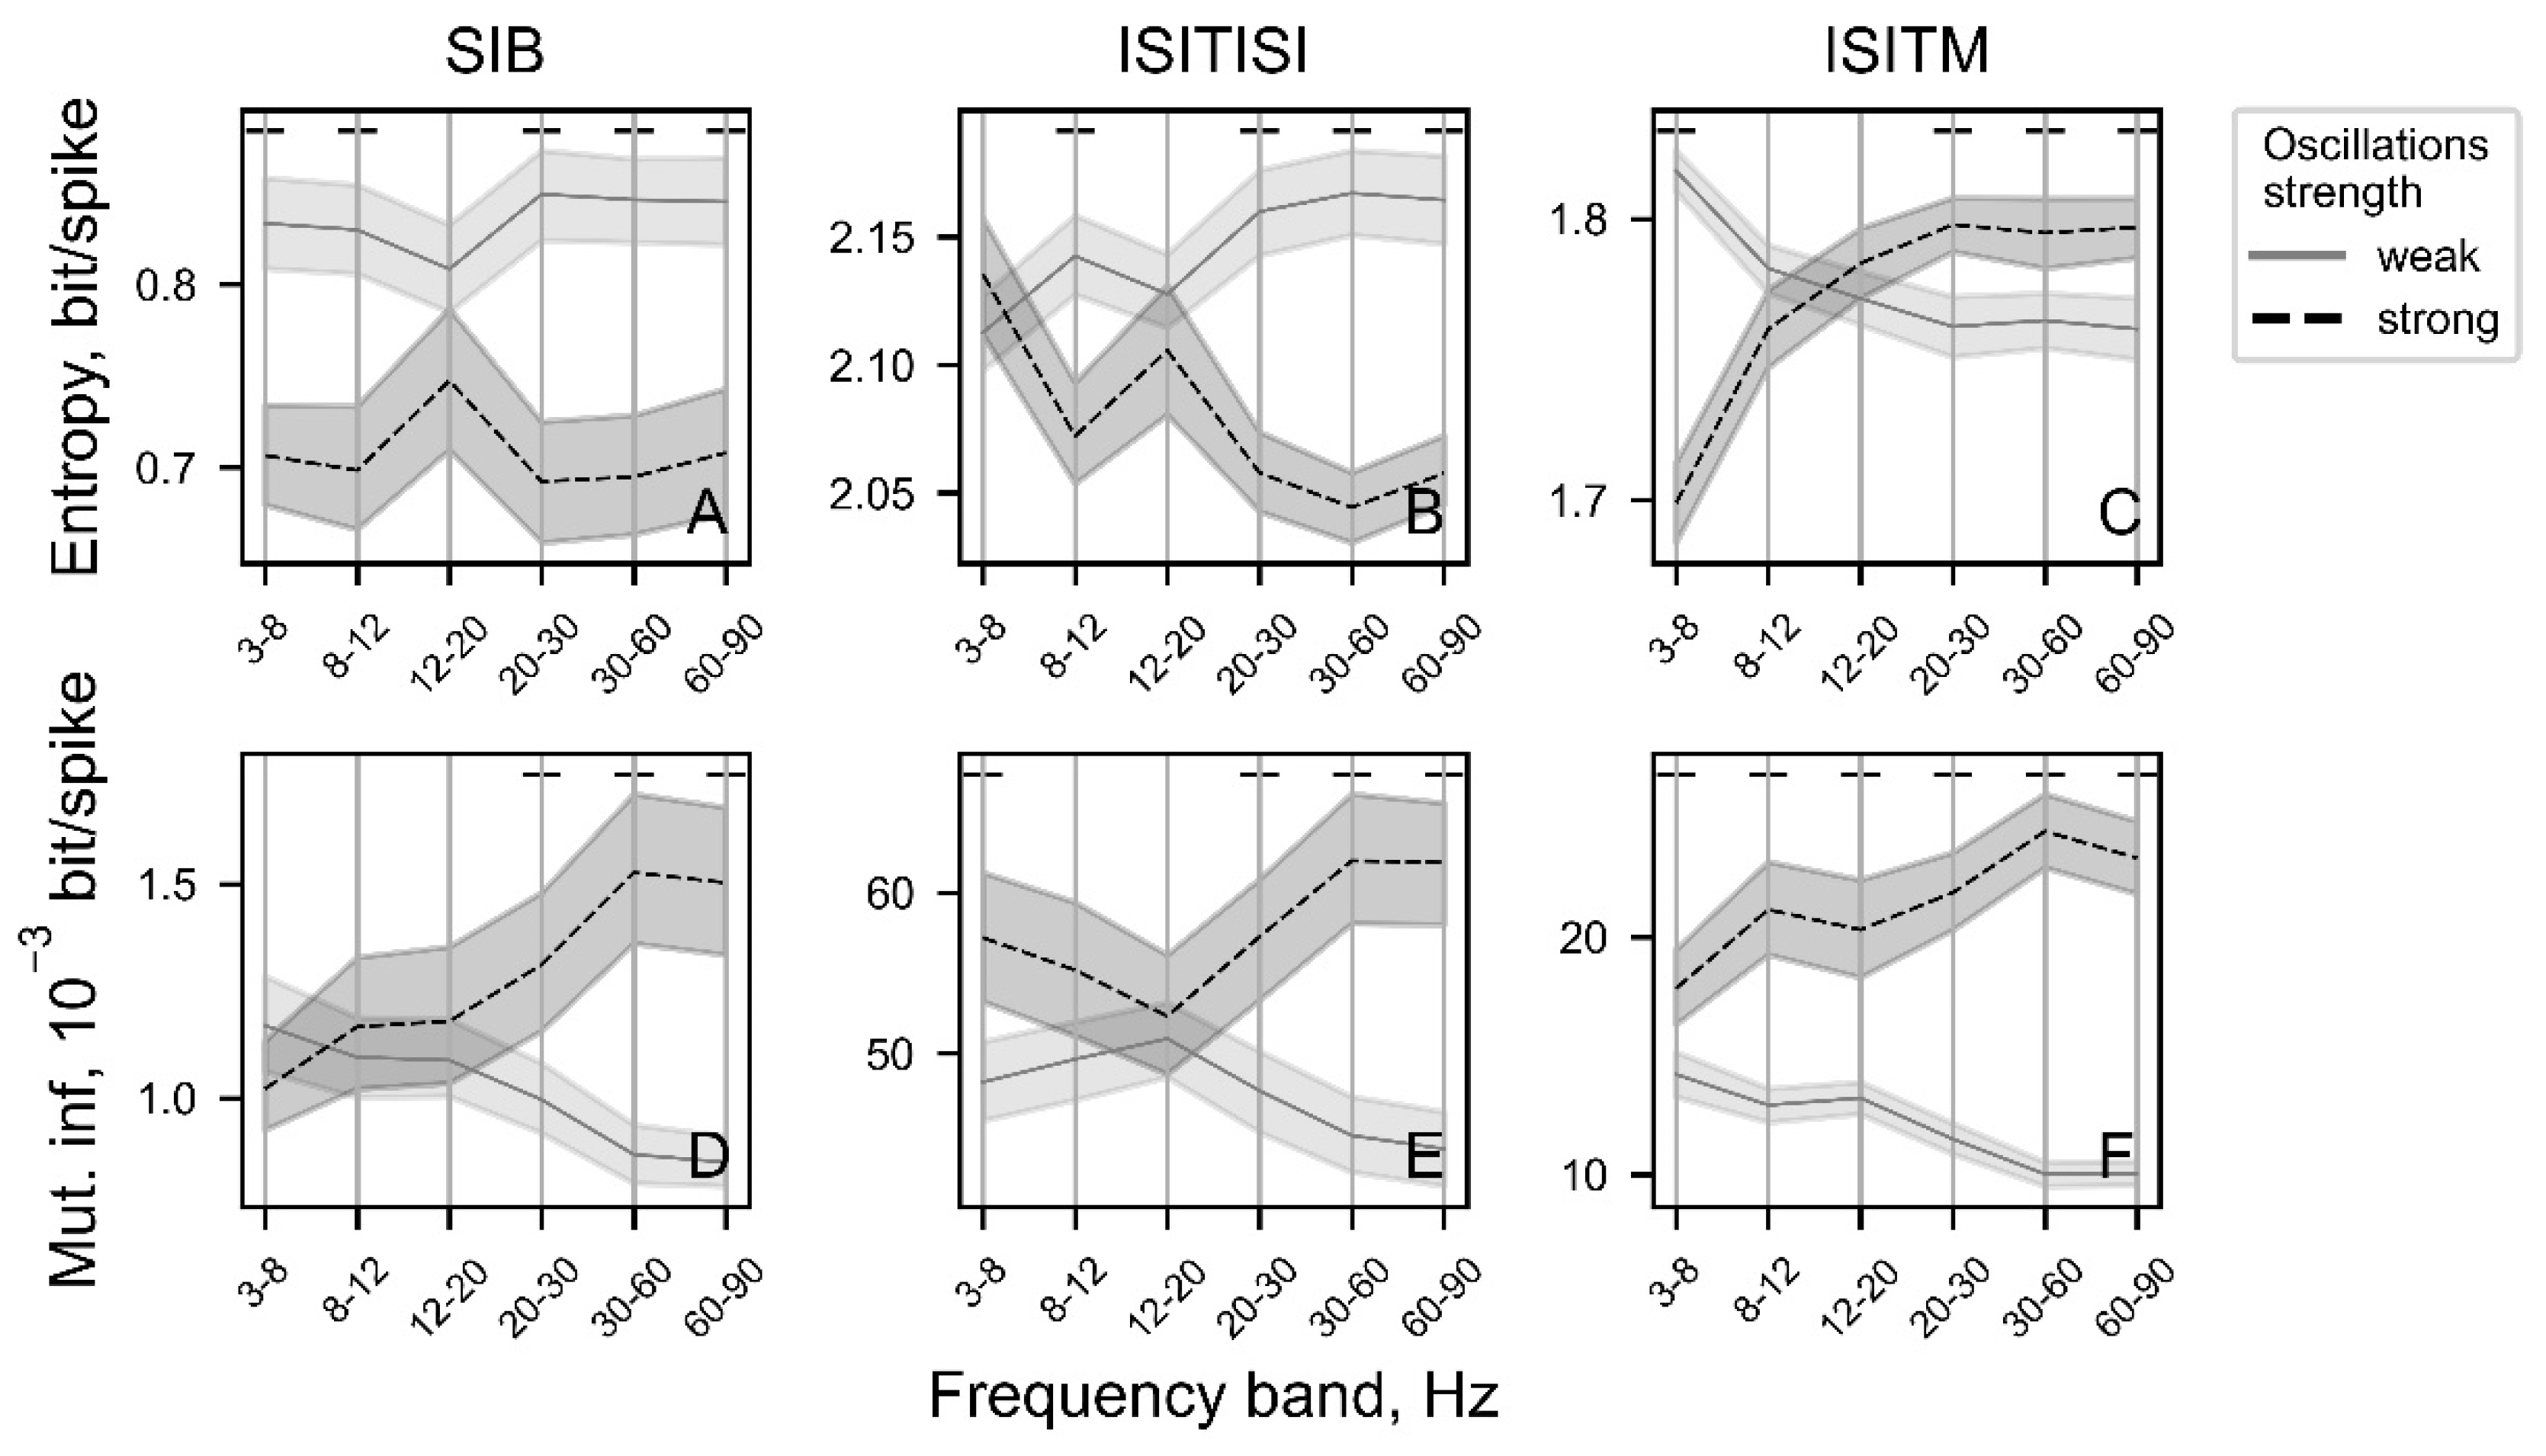
Figure 11.
The entropy (A-C) and mutual information (MI) (D-F) values depending on UPDRS III scores in off-state (without medication). Data was separated into three groups in accordance with its activity pattern: brown is for tonic activity pattern, blue is for bursting activity, grey is for pause activity.
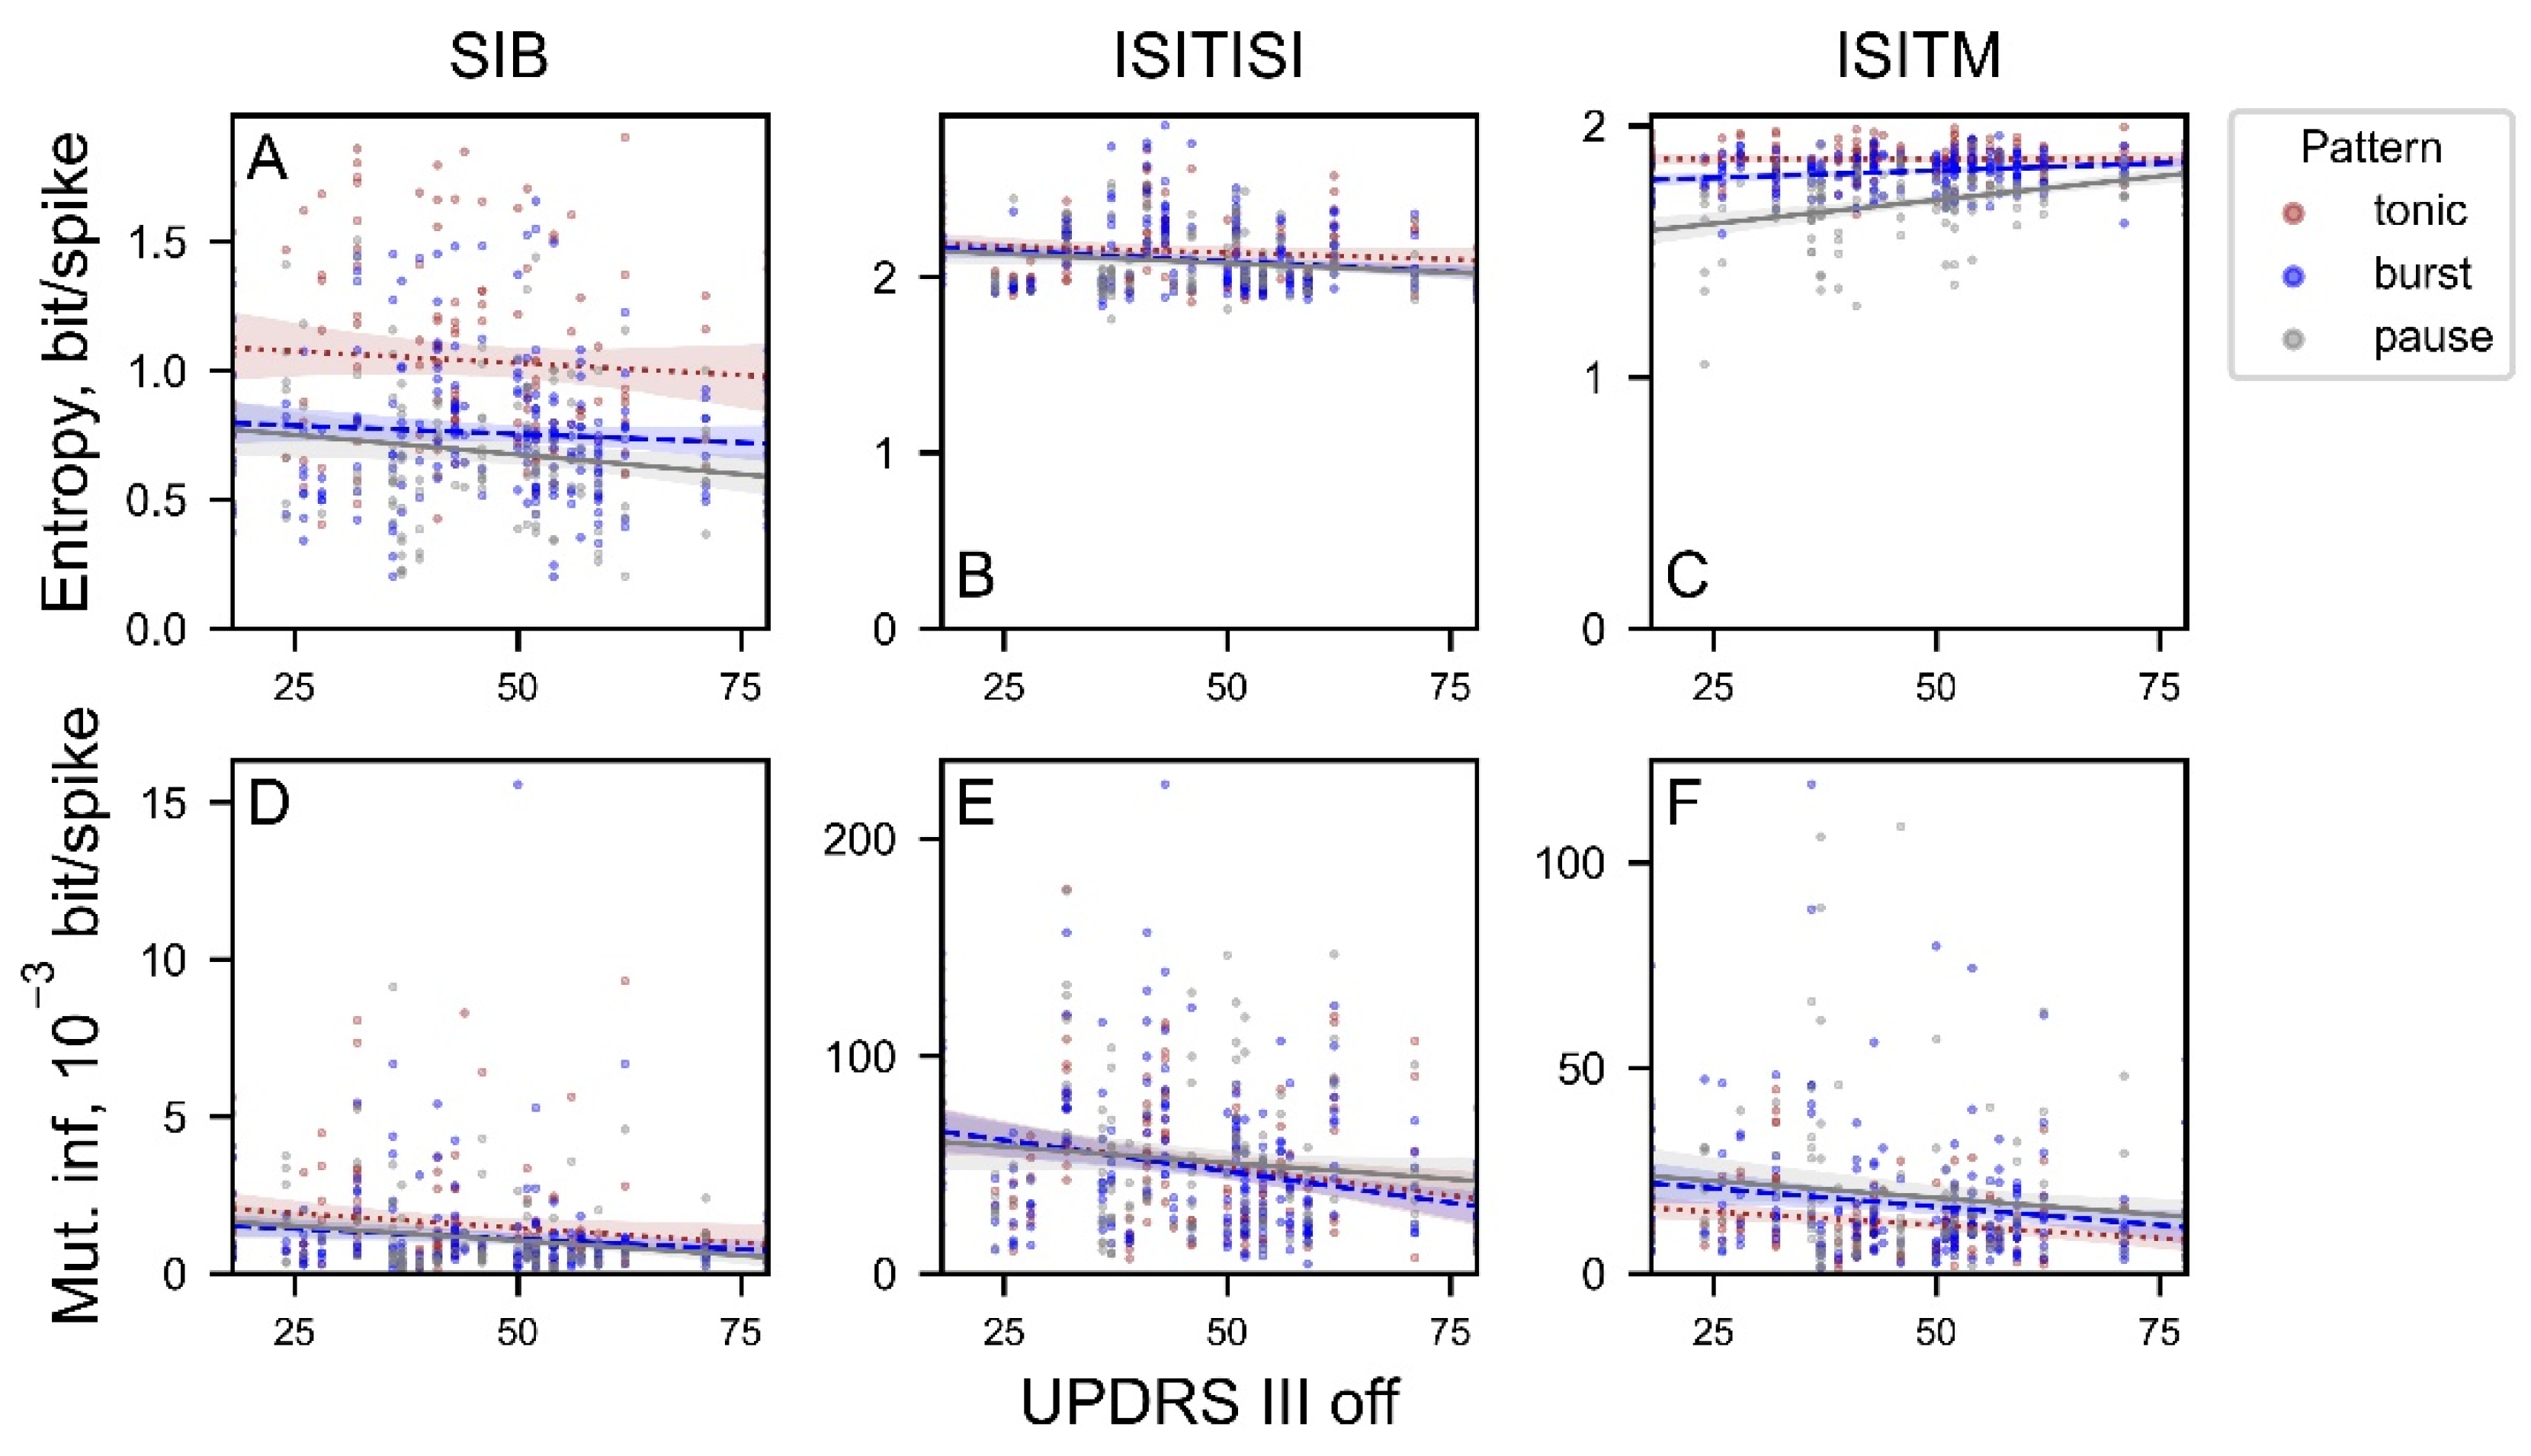

Table 1.
Spearman's correlation coefficients and corresponding p-values for nonlinear SUA features dependencies on firing rate, coefficient of variance and asymmetry index for generated and experimental data.
Table 1.
Spearman's correlation coefficients and corresponding p-values for nonlinear SUA features dependencies on firing rate, coefficient of variance and asymmetry index for generated and experimental data.
| Dataset | Simulated data | Clinical Data | |||||||||||
|---|---|---|---|---|---|---|---|---|---|---|---|---|---|
| Nonlinear parameter | Entropy | Mut. inf. | Entropy | Mut. inf. | |||||||||
| Method | SIB | ISITISI | ISITM | SIB | ISITISI | ISITM | SIB | ISITISI | ISITM | SIB | ISITISI | ISITM | |
| Firing rate | Corr. coeff. | 0,93 | 0,34 | -0,01 | -0,32 | -0,53 | -0,98 | 0,55 | 0,36 | 0,10 | -0,14 | -0,32 | -0,77 |
| p-value | 0 | 3*10-133 | 0,7 | 3*10-121 | 0 | 0 | 5*10-80 | 5*10-31 | 9*10-4 | 8*10-6 | 2*10-24 | 1*10-19 | |
| CV | Corr. coeff. | -0,49 | 0,62 | -0,95 | -0,56 | 0,70 | 0,19 | -0,26 | 0,02 | -0,81 | -0,14 | 0,06 | 0,13 |
| p-value | 5*10-294 | 0 | 0 | 0 | 0 | 8*10-40 | 3*10-17 | 0,43 | 1*10-230 | 1*10-5 | 0,07 | 3*10-5 | |
| AI | Corr. coeff. | 0,45 | -0,66 | 0,95 | 0,60 | -0,70 | -0,16 | 0,25 | -0,02 | 0,73 | 0,13 | -0,06 | -0,12 |
| p-value | 2*10-245 | 0 | 0 | 0 | 0 | 1*10-29 | 7*10-16 | 0,47 | 5*10-167 | 7*10-5 | 0,04 | 1*10-4 | |
Table 2.
Spearman's correlation coefficients and corresponding p-values for nonlinear SUA features dependencies on UPDRS III off score.
Table 2.
Spearman's correlation coefficients and corresponding p-values for nonlinear SUA features dependencies on UPDRS III off score.
| Parameter | Method | Tonic | Burst | Pause | |||
|---|---|---|---|---|---|---|---|
| Corr. coeff. | p-value | Corr. coeff. | p-value | Corr. coeff. | p-value | ||
| Entropy | SIB | -0,09 | 0,292 | -0,08 | 0,224 | -0,16 | 0,063 |
| ISITISI | -0,14 | 0,089 | -0,17 | 0,011 | -0,08 | 0,335 | |
| ISITM | 0,05 | 0,536 | 0,21 | 0,002 | 0,38 | 5*10-6 | |
| Mut. inf. | SIB | -0,26 | 0,002 | -0,18 | 0,007 | -0,18 | 0,029 |
| ISITISI | -0,25 | 0,003 | -0,27 | 6*10-5 | -0,08 | 0,362 | |
| ISITM | -0,21 | 0,014 | -0,16 | 0,014 | -0,13 | 0,117 | |
Disclaimer/Publisher’s Note: The statements, opinions and data contained in all publications are solely those of the individual author(s) and contributor(s) and not of MDPI and/or the editor(s). MDPI and/or the editor(s) disclaim responsibility for any injury to people or property resulting from any ideas, methods, instructions or products referred to in the content. |
© 2024 by the authors. Licensee MDPI, Basel, Switzerland. This article is an open access article distributed under the terms and conditions of the Creative Commons Attribution (CC BY) license (https://creativecommons.org/licenses/by/4.0/).
Copyright: This open access article is published under a Creative Commons CC BY 4.0 license, which permit the free download, distribution, and reuse, provided that the author and preprint are cited in any reuse.


