
Submitted:
02 September 2024
Posted:
05 September 2024
You are already at the latest version
Abstract
Questionnaires for self-report of food-elicited emotions are an established practice in consumer studies. However, most tools are originally developed in English and translated into other languages, which limits their use. The aim of this study was to develop the first Greek emotion lexicon and measurement tool for consumers, using standard methodology and extending it. The lexicon was compiled using linguistic sources and extended using the World Wide Web and a popular social media platform for the collection of authentic language and usage data. Terms were also collected from consumers using questionnaires and a variety of stimuli. Terms collected from consumers only comprise: healthy, distrustful, curious, childish, impressed, tolerant, impatient It was validated by application in various case studies, providing discrimination across and within food categories, and by comparison to the Greek translation of a standard tool in English, the EsSense Profile. The comparison was conducted by measuring emotions elicited by six food categories and demonstrated that it is preferable to use emotion measurement tools developed in the linguistic and cultural context of intended use, as they convey consumers’ emotions naturally and more accurately. This tool can be used as a Check- or Rate- All-That-Apply questionnaire to measure consumer responses to food categories and products. The methodology and validation presented can be applied for the compilation of emotion lexicons in languages less studied than English.
Keywords:
emotion lexicon
; self-report questionnaires
; food
; consumer studies
; measurement
1. Introduction
1.1. Measuring Food-Elicited Emotions in Consumer Studies
Measuring emotions elicited by foods has attracted great research interest in the past few decades. By 2010 food scientists used emotion lists from the psychology domain. Since then, lists containing food-elicited emotions have been created in various languages. These lists can be used for general or food-specific studies or for specific consumer groups. The first food-related emotion measurement tool was the EsSense Profile [1]. The original word list was compiled by using existing lists from the psychiatry and psychology domain, and by getting feedback from consumers.
Since 2010, there have also been a few attempts to compile emotion lexicons from scratch, without using existing lists, for example for beer in Spanish [2] and in English [3], for food in general in Spanish with Brazilian consumers [4] and in German [5], and for beer, wine and non-alcoholic beer in Dutch and Portuguese [6]. The first step in such a process is term collection and identification. Such studies are usually food specific and use consumer feedback to compile the lexicon. Consumers usually taste samples and report their emotional responses either by using free-listing techniques [2,3,4,6,7,8,9,10] or by answering closed-ended questionnaires, individually [11,12,13,14,15] or after group discussion [3,6,7,9,16,17].
Most measurement tools are developed in English. For less widespread languages and smaller markets, universal and translated tools have been used to cater for measurement needs [18,19,20,21,22,23,24]. However, experience and expression of emotion is linguistically and culturally conditioned [25,26]. Specifically for the Greek language no food-related emotion measurement tool had been available until recently.
1.2. Using Standard and New Linguistic Sources for Lexicon Compilation
To develop a lexicon from scratch, linguistic sources, such as dictionaries, thesauri, and corpora, and the World Wide Web (the Web), are needed when checking synonyms, meanings, and usages [27,28,29]. Corpora are machine-readable, usually finite-sized, collections of authentic texts. These texts have been collected to represent a language or a language variety [28]. Corpora can provide information such as frequency of use of words and linguistic patterns and can be used for qualitative and quantitative analysis. So far, their use is not frequent in consumer studies. However, in languages that lack emotion lists, corpora have been used to compile lexicons from scratch [5]. The Web, its search engines, and its lexical databases have also been used as sources of data for the development of emotion lexicons [5]. The Web, in fact, can be considered as a very large multilingual corpus containing texts in almost all languages and all text types [29].
The Web has specific features that render it unique and ideal for linguistic research. Specifically, it: a) can be used as one unified source, because its content is interconnected; b) contains authentic, spontaneous, natural speech; c) contains a new style of writing: written speech with characteristics of oral speech; d) contains all styles and registers of a language; e) contains synchronous language, but can also be used for diachronic research; f) its contents are self-productive, as wikis, blogs, and forums are daily enriched and updated. However, using the Web as a corpus for linguistic research has some disadvantages: a) its dimensions are unknown and constantly altering; b) repeatability of results is impossible due to the algorithms used in searches; c) because of its great heterogeneity, it can prove to be risky for the researcher. Sinclair (2004) reported the concern that the Web cannot be considered as a corpus because of its unknown and constantly altering dimensions and it is not designed from a linguistic perspective. However, the number of researchers currently using the Web to create corpora, and those using the Web itself as a corpus is increasing [27,28,29].
Data sources such as Online Social Media (OSM) networking sites, content communities, online reviews, forums, and blogs provide a rich and expansive source of qualitative data that can be analyzed in a quantitative manner [31]. Especially when the focus of a consumer study is the phenomenon of food neophobia, data mining on social media platforms is preferable compared to common tests of Central Location, to minimize selection bias [32]. During the past decade, the size of the content published online has drastically increased, mainly due to the widespread use of online social media. The content available on social media has the potential to be used for understanding, modeling, and predicting human behavior and its effects [33]. Twitter is already being used as a linguistic source within and outside food research to identify linguistic patterns and for sentiment analysis [34,35,36,37].
In a systematic linguistic study aiming to compile the first food-elicited emotion lexicon in German, a three-step approach was followed to identify which German words can describe emotions elicited by foods [5]. The original list consisted of single-word adjectives and was compiled using thesauri, electronic corpora, the Web (Google search and lexical databases), as well as an emotions hierarchy from literature. Inclusion criteria for the emotion terms were to be frequently used in everyday situations and to follow certain syntactic criteria, i.e., to collocate with the verbs “feel” and “be”.
1.3. The Present Study
The present article describes the process of compiling a food-related emotion lexicon in the Greek language. Standard sources of emotion terms were used, such as thesauri and dictionaries, and feedback from consumers was also obtained. The Web and Instagram were also used as linguistic sources in accordance with standard methodology in recent literature [27,28,29,34,35]. Instagram was selected because it is very popular in Greece, and cooking/baking come third among the ten most common hobbies, and second among the most common interests of Greek Instagram users [38]. Emotion words collected from previous stages were checked by consumers for food consumption appropriateness, using questionnaires. Consumers were asked to provide extra emotion words if needed. The emotion list compiled was used as a tool to measure emotions evoked by foods and beverages.
2. Materials and Methods
2.1. Methodology
The process comprised two phases: a) emotion lexicon development (stages 1-4) (Figure 1), and b) validation by using the lexicon to measure emotional responses elicited by various food categories. In addition, its discriminating ability was compared to that of the Greek translation of a well-known English tool, the EsSense Profile. In total 1,429 people participated in the study; of whom 983 took part in the development process (n=194, stage 2a; n=566, stage 2b; n=223, stage 2c), and 446 in validation (Figure 2).
2.2. Motion Lexicon Development
2.2.1. Emotion Terms Collection from Thesaurus and Elimination of Synonyms
The Greek thesaurus “Antilexiko” (1998) was initially used as a term source to create an extensive list of emotion words, not food specific. A thesaurus was selected as the starting point for word collection because it is a linguistic source that contains all the general vocabulary words of a language, presented in semantic categories. Emotion words were taken from the categories “emotion”, “feeling”, and “ethos” [39]. They had to collocate with the verb “feel” (e.g., I feel upset but not I feel violent). A dictionary of Modern Greek [40] was used to group synonyms, and allocate an umbrella term to semantically represent each group (see 3.1.1 and Figure 1).
2.2.2. Linguistic Sourcing Using the Web and Instagram
To deepen the understanding of how emotion related to food consumption is expressed in Greek, the Web and Instagram were used as linguistic sources. At first, a search for food-elicited emotions was made on the Google search engine to make sure all the emotions most frequently related to food were included on the initial list, using the keywords: feel, food, emotion, and feeling in various combinations.
Then, the 119 terms of the initial list (Table S1) were searched for using the Google search engine to check if they are indeed used in authentic food-related speech by consumers. The search was performed using the words feel, eat, food, emotion, feeling, consumption in combination with each one of the 119 emotions on the list (Table 1).
The same terms were searched for on Instagram as hashtags. The specific foods with which each emotion collocated were noted, and the positive or negative sense in which the terms were used was also recorded (see 3.1.2). This was done by assessing the rest of the hashtags used by the post creator and the emojis/emoticons used by the creator and the followers commenting on the post (Figure 1).
2.2.3. Emotion Terms Identification as to Their Food-Relatedness by Consumers
2.2.3.1. Consumers Select Terms They Consider Able to Describe Food-Elicited Emotions from the List Provided
The list of 119 terms was broken down to three randomly formed groups (40/40/39 terms). The order of terms in each group was randomized so as not to affect the selection of adjectives [41]. Each group of adjectives was presented to participants in a Check-All-That-Apply (CATA) online questionnaire. Native speakers of Greek participated in the survey [n=194; mean age (SD): 38 (11)]. The participants were instructed to think about how they feel when consuming their most and least favourite drink, snack, dessert, meal, and choose the words that express elicited emotions, following the methodology by King and Meiselman (2010) (see 3.1.3). The instructions aimed at collecting both positive and negative emotions related to food consumption.
2.2.3.2. Consumers Write Which Foods Elicit Specific Emotions in Them from the List Provided
A CATA questionnaire was given to consumers with an open-ended answer section after each emotion (using the same three randomly created groups of emotion terms as in 2.2.3.1). The 566 participants [mean age (SD): 36 (13)] were instructed to choose only the words that express emotions elicited by foods and provide an example of food that elicits that emotion in them (see 3.1.3).
2.2.3.3. Consumers Write Emotion Terms as a Response to Food Pictures Provided
In addition to the word-based stimuli of the previous stages, a questionnaire based on pictures of foods was set up. It consisted of 34 pictures of foods and beverages with an open-ended answer section after each picture (Figure S1). The pictures were purposefully selected to cover foods in three conditions of consumption within the Greek culture: every-day conditions, celebratory conditions, and foods not habitually consumed by Greeks. The 223 participants [mean age (SD): 38.5 (12)] were instructed to write up to three emotional adjectives, describing how each food/ beverage made them feel when consumed (see 3.1.3 and Table 3).
2.2.4. Final List of Terms
Statistical analysis of the stages that involved consumers (see 2.5) produced a final list of the 33 emotion terms: angry, ashamed, calm, cheerful, cheerless, disappointed, disgusted, dissatisfied, energetic, glad, good-looking, grateful, guilty, happy, healthy, nervous, optimistic, pleasant, pleased, privileged, relaxed, relieved, resentful, sad, satisfied, sensual, stressed, tired, uninterested, unrestrained, unsatisfied, weak, whole.
2.3. Validation of the Emotion Lexicon
Validation of the developed emotion lexicon was done by using it as a measurement tool to measure emotions elicited by nine food categories in four case studies. Specifically, the final emotion list was used in CATA and rating scale format questionnaires for consumers’ self-report of food-elicited emotions in response to stimuli: a) actual tasting of foods (olive oils), b) food names (rusks, pizza, vanilla ice cream, fried chicken, meat and potatoes, chocolate, fruit) and c) food pictures (olives). The specific case studies aimed at checking the tool’s discriminating ability among food samples and food-related conceptualizations, both with physical presence (case studies 1, 3) and online surveys (case studies 2, 4), within food categories (case studies 1, 2, 3) and across food categories (case study 4). The total number of participants in these studies was 446 [mean age (SD): 40 (13.8)].
Case study 1
The aim was to investigate how information concerning the sustainability of the packaging could affect consumers’ emotional responses to traditional Greek rusks. The 33 emotions in the tool list and 4 food category-specific from a preliminary study (self-restrained, prudent, condescending, lonely) were presented in a CATA format questionnaire to 108 participants aged 18-80. They were asked to assess each sample under blind conditions in conventional (polypropylene) and biodegradable packaging with no information provided, and then under informed conditions, i.e. after providing information on the sustainability of the packaging (biodegradable and edible claims). Participants could add emotions if necessary.
Case study 2
The list of 33 emotion terms was presented to 106 participants aged 18-62 along with pictures of olive containing jars with different label colors in an online survey. A 5pt rating scales format was used to assess emotions elicited by each sample. Participants could add emotions if necessary.
Case study 3
The new measurement tool was given to 107 participants aged 18-55 along with olive oil samples of various quality statuses to taste and assess the intensity of elicited emotions on 5pt rating scales under blind and informed conditions. Participants could add emotions if necessary.
Case study 4
The new tool was used in an online survey using food names as stimuli, namely pizza, meat and potatoes, vanilla ice cream, fried chicken, chocolate, and fruit. These foods were chosen to cover a variety of eating circumstances. They were assessed on 5pt rating scales as to the intensity of emotions they elicited in the 125 participants aged 18-62 (see 2.4.2) (Table 4 and Table 5).
2.4. Comparison with a Translated English Tool
2.4.1. Methodology of English Tool Translation into Greek
To further validate the discriminating ability of the newly developed Greek tool, and to check the trend of using translated tools in cross-cultural consumer studies, the new tool was compared with the Greek translational equivalent of the EsSense Profile [1] (referred to as “translated EP”).
The translation and back-translation of the English tool into Greek was done by the authors, native speakers of Greek and proficient in English, certified in translation and bilingual lexicography. Each emotion of the English tool was semantically covered by a Greek term; however, this was not done by translating emotions one-to-one but by making sure all emotions on the original list were represented in the Greek list. Thus, the translated EP consisted of 36 emotion terms, not 39 as the original (Table 2).
2.4.2. Comparison between the Translated EP and the Newly Developed Tool
The comparison was done in online surveys with no actual tasting of foods. In this way, linguistic, cultural, and conceptual aspects could be compared without influence from specific food samples. Both tools were used in 5pt rating scales questionnaire format. The food categories chosen were pizza, mashed potatoes and gravy, vanilla ice cream, fried chicken, chocolate, and fruit, to cover a variety of eating circumstances. This was case study 4 of the new tool validation process (see chapter 2.3). The translated tool was tested with 134 Greek participants and the newly developed tool with 125 participants aged 19-68 (see 3.3.2, Figure 2 and Figure 3).
2.5. Statistical Analysis
Statistical analysis for all studies presented in this article were performed using XLSTAT software (Version, 2018.1., Addinsoft). Word collection from internet sources was analyzed based on frequency of appearance for food consumption, while collection from consumers using questionnaires was analyzed based on frequency of selection (running Cochran’s Q, multiple pairwise comparisons according – critical difference by Sheskin, and correspondence analysis with Chi-square tests – significance level 5%), or statistical significance (running one-way Analysis of Variance and Principal Component Analysis).
2.5.1. Emotion Term Collection Process
Terms selected by at least 20% of the participants during term collection of stages 2.2.3.1, 2.2.3.2, and 2.2.3.3 that involved consumers, were included in the final list. The cut-off point of 20% was selected because: a) this is the norm in relevant lexicon development studies involving consumers [42], b) it yielded a list of terms (33 emotions) that could be easily handled by study participants without missing out on valuable information, and c) it provided balance between positive and negative terms on both axes of emotion (valence and arousal) which is necessary in consumer studies.
2.5.2. Case Studies during the Validation Process
In case study 1, CATA data were analyzed using correspondence analysis (CA) and Principal Component Analysis (PCA) to explore relationships among the selected emotion terms and the samples under diverse conditions. Cochran’s Q test was carried out to identify differences between the frequencies of the selected emotions. Significance was tested at a significance level of 0.05.
In case studies 2, 3, and 4, Analyses of Variance (ANOVAs) and PCAs were performed on the collected data, with a confidence interval of 95%, and a tolerance of 0.0001 to check the discriminating ability of the tool, to identify differences in the emotional profiling of the samples, and to connect samples to emotions based on the intensities allocated to each emotion on the list.
2.5.3. Comparison with Translated Tool
ANOVA (confidence interval: 95%) was performed for foods and for terms for the translated EP and for the new Greek tool to check how foods and terms are grouped together based on allocated intensities, and if the tools provide statistically significant differences between foods and emotion terms. PCAs for terms (Figure 3) and for foods (Figure 4) were conducted for the translated EP and the Greek tool to visualize correlations. An internal reliability test was also performed to check if the emotions on the new Greek tool list were statistically discrete from one another.
3. Results
3.1. Emotion Lexicon Development
3.1.1. Emotion Term Collection from Thesaurus and Elimination of Synonyms
Emotion words were taken from the categories “emotion”, “feeling/ sensation”, and “ethos”. Through this process 204 adjectives were collected. Words excluded were: archaic and old-fashioned, informal, foreign in morphology, rare and literary/ poetic, expressing degree of emotion, figurative, expressing idiosyncratic characteristics not caused by external stimuli, politically incorrect and related to mental illnesses, words a person would not use to refer to oneself (e.g., derogatory words), repeated in various subcategories, and those that cannot be attributed to a human being. The most general or the most frequently used term from each group of synonyms, according to the dictionary and the thesaurus used, was chosen to represent the group as an “umbrella term” (i.e., the term that semantically covers all others within the group). The adjectives that remained on the list were 119 (Figure 1, Table S1).
3.1.2. Linguistic Sourcing Using the Web and Instagram
To deepen our understanding of how emotion related to foods is expressed in Greek, the Web and Instagram were used as sources of language data. Both nouns and adjectives were searched for (e.g., surprise, surprised), so as not to miss any important connections. The emotions that were found collocating with food consumption were recorded in order of frequency of usage for food consumption: guilt/ remorse/ guilty, pleasure/ pleased, satisfaction/ satisfied, shame/ embarrassment/ embarrassed, wholeness/ whole, stress/ stressed, energy/ energetic/ active, weakness/ weak, calm/ calmness, joy/ joyful, disgust/ aversion/ disgusted, relief/ relieved, happiness/ happy, anger/ angry, tiredness/ tired, sadness/ sad, relaxation/ relaxed, sensual/ sexy, awful, euphoria, incompetent, success/ successful, joyful, wellness, depressed, empty, comfort. During this stage, 9 emotion terms were collected that were not listed using the thesaurus (stage 2, Figure 1).
The valence of each term, whether it is positive or negative and how much so, was checked using the entire post (text, hashtags, images, emojis) and cross-checked with a list available by Facebook on which emojis/emoticons are matched to emotion words. For example, disgust was found to be used negatively as expected, but also ironically in a positive sense to express intense liking.
3.1.3. Emotion Term Identification as to food-Relatedness by Consumers
The terms selected from the original list of 119 by more than 20% of consumers were twenty-three. Consumers added terms that matched the ones identified on the Web and Instagram, and others that were not identified in the language sources. Examples of the latter case include: healthy, distrustful, curious, childish, impressed, tolerant, impatient (Figure 1, Table 3).

Table 3.
Examples of emotions provided by consumers in a questionnaire containing pictures of foods as a stimulus for term elicitation.
Table 3.
Examples of emotions provided by consumers in a questionnaire containing pictures of foods as a stimulus for term elicitation.
| organic foods | pita gyro (Greek street food with chopped meat in pita bread and toppings) | champagne | ouzo with meze (Greek aperitif with a selection of appetizers) | plant milk | lamp on the spit (traditional Greek Easter food) | cooked legumes | nuts | sweets/ pastries | honey |
|---|---|---|---|---|---|---|---|---|---|
| healthy | guilty | cheerful | happy | uninterested | full | full | traditional | full | adventurous |
| happy | happy | festive | full | athletic | whole | whole | tame | happy | disgusted |
| light | whole | relaxed | satisfied | sensible | satisfied | traditional | satisfied | guilty | insecure |
| cheerful | satisfied | friendly | unrestrained | whole | energetic | happy | healthy | uninterested | sick |
| sensible | full | happy | nostalgic | worried | secure | satisfied | sensible | sociable | privileged |
| balanced | greedy | sociable | authentic | pleased | relieved | strong | strong | worried | cheerful |
| fresh | lazy | sensual | Greek | healthy | happy | guilty | full | whole | worried |
| energetic | impulsive | uninterested | boring | energetic | cheerful | satisfied | disgusted | satisfied | afraid |
| uninterested | overweight | classy | traditional | strong | warm | aggressive | happy | greedy | healthy |
| satisfied | traditional | independent | warm | full | stressed | pleased | boring | ecstatic | guilty |
| whole | joyful | guilty | fat | relaxed | pleased | energetic | unsatisfied | friendly | calm |
| secure | naughty | disgusted | festive | unrestrained | uninterested | nostalgic | uninterested | warm | happy |
| responsible | Greek | formal | whole | happy | strong | uninterested | cheerful | dirty | energetic |
| lucky | blissful | fun | joyful | disgusted | blissful | pleased | inspired | sensual | wild |
| privileged | restless | tired | guilty | cheerful | traditional | healthy | calm | fun | pleased |
| victimized | sensual | dizzy | relieved | greedy | lucky | nostalgic | sad | pleased | dissatisfied |
| whole | pleased | regretful | nostalgic | athletic | unrestrained | privileged | loved | fat | sick |
| deceived | fat | privileged | privileged | excited | greedy | unsatisfied | distant | calm | incompetent |
| strong | blissful | cool | sociable | privileged | disgusted | angry | light | hesitant | repulsed |
| refreshed | normal | sad | greedy | smart | sensual | cheerful | vegan | blissful | fat |
3.1.4. Final Terms and Their Valence
Input from the Web/ Instagram and consumers provided insight into the valence of emotion terms, grouping them into positive, negative, and neutral (Figure 1). The case studies that followed validated the categorization (Figure 3). There is a need for both positive and negative terms on emotion measurement tools, to cater for food product development and consumer study needs.
3.2. Results per Case Study
Case study 1
Under blind conditions, the most frequently chosen term for the conventional packaging was calm (43.2%), whereas for the biodegradable one nervous (38.4%), unsatisfied (29.8%), and stressed (28.8%), which could probably be attributed to its irritating texture/ sound according to participants. Under informed conditions, the terms with the highest frequencies for the conventional packaging were pleased (36.5%), satisfied (33.6%), and calm (32.6%), whereas for the biodegradable and edible ones pleased (40.3% and 50%, respectively), satisfied (39.4% and 46.1%), and calm (28.8% and 34.6%), which demonstrates that both sustainable packages shared a similar emotional profile due to sustainability claims, which elicited positive emotions in consumers. The tool was able to provide discrimination among the various packaging conditions and claims.
Case study 2
The tool provided discrimination among samples within the food category (olives). The emotions with the highest intensity across samples were healthy, pleased, satisfied, and glad. The two most preferred label colors were associated with the emotional terms relaxed, unrestrained, happy, and relieved.
Case study 3
All olive oil samples were identified as statistically different based on their emotional profiling. The statistically significant emotions were quite different under blind (cheerful, cheerless, disgusted, glad, optimistic, privileged, relieved, satisfied, uninterested, weak) and informed conditions (disappointed, dissatisfied, grateful, happy, healthy, pleasant, pleased, unsatisfied, whole) (Table 4 and Table 5).
Table 4.
Example of across food categories discriminating ability of the developed tool: the rating scores of emotions on 5pt scales (0/feel like this not at all to 5/feel like this extremely) per food category are presented. Ratings over 2.5 appear in bold.
Table 4.
Example of across food categories discriminating ability of the developed tool: the rating scores of emotions on 5pt scales (0/feel like this not at all to 5/feel like this extremely) per food category are presented. Ratings over 2.5 appear in bold.
| pizza | meat and potatoes | vanilla ice cream | fried chicken | chocolate | fruit | |
|---|---|---|---|---|---|---|
| pleased | 3.144 | 2.936 | 2.656 | 2.576 | 3.152 | 3.000 |
| satisfied | 2.968 | 2.752 | 2.504 | 2.440 | 3.024 | 2.888 |
| glad | 2.848 | 2.672 | 2.616 | 2.392 | 2.896 | 2.904 |
| relaxed | 2.704 | 2.520 | 2.512 | 2.240 | 2.728 | 2.808 |
| calm | 2.552 | 2.504 | 2.440 | 2.328 | 2.728 | 2.848 |
| happy | 2.560 | 2.432 | 2.400 | 2.272 | 2.864 | 2.776 |
| cheerful | 2.712 | 2.272 | 2.448 | 2.216 | 2.720 | 2.648 |
| whole | 2.504 | 2.528 | 2.296 | 2.144 | 2.640 | 2.656 |
| grateful | 2.096 | 2.456 | 2.208 | 2.072 | 2.520 | 2.760 |
| pleasant | 2.352 | 2.168 | 2.288 | 2.208 | 2.504 | 2.624 |
| healthy | 2.080 | 2.488 | 2.056 | 2.056 | 2.096 | 3.632 |
| privileged | 2.016 | 2.208 | 2.064 | 1.928 | 2.416 | 2.416 |
| good-looking | 1.984 | 2.024 | 2.016 | 1.976 | 2.232 | 2.608 |
| optimistic | 1.928 | 1.760 | 1.968 | 1.752 | 2.480 | 2.392 |
| relieved | 2.000 | 1.792 | 1.912 | 1.728 | 2.424 | 2.264 |
| unrestrained | 2.096 | 1.552 | 1.704 | 1.544 | 2.216 | 1.392 |
| energetic | 1.680 | 1.712 | 1.680 | 1.648 | 2.104 | 2.480 |
| sensual | 1.312 | 1.216 | 1.552 | 1.248 | 1.928 | 1.368 |
| guilty | 1.664 | 1.160 | 1.536 | 1.392 | 1.984 | 1.040 |
| uninterested | 1.464 | 1.288 | 1.304 | 1.200 | 1.152 | 1.344 |
| unsatisfied | 1.144 | 1.144 | 1.304 | 1.128 | 1.232 | 1.232 |
| tired | 1.168 | 1.128 | 1.096 | 1.120 | 1.296 | 1.104 |
| stressed | 1.160 | 1.072 | 1.080 | 1.144 | 1.312 | 1.104 |
| dissatisfied | 1.168 | 1.096 | 1.200 | 1.144 | 1.208 | 1.056 |
| disappointed | 1.128 | 1.064 | 1.176 | 1.128 | 1.216 | 1.080 |
| sad | 1.104 | 1.096 | 1.128 | 1.048 | 1.224 | 1.040 |
| angry | 1.088 | 1.040 | 1.128 | 1.096 | 1.160 | 1.080 |
| cheerless | 1.072 | 1.080 | 1.072 | 1.104 | 1.160 | 1.072 |
| weak | 1.120 | 1.024 | 1.088 | 1.056 | 1.216 | 1.072 |
| disgusted | 1.136 | 1.056 | 1.104 | 1.088 | 1.072 | 1.056 |
| nervous | 1.104 | 1.056 | 1.120 | 1.064 | 1.240 | 1.040 |
| embarrassed | 1.112 | 1.064 | 1.160 | 1.064 | 1.200 | 1.024 |
| resentful | 1.040 | 1.072 | 1.128 | 1.088 | 1.152 | 1.064 |
| P1 | < 0.0001 | < 0.0001 | < 0.0001 | < 0.0001 | < 0.0001 | < 0.0001 |
1 P was derived by performing pairwise comparisons by Tukey (HSD).
Table 5.
Summary of all Ys from ANOVA of rating scores of emotions on 5pt scales (0/feel like this not at all to 5/feel like this extremely) presented. Across food categories discriminating ability of the translated tool validated (case study 4).
Table 5.
Summary of all Ys from ANOVA of rating scores of emotions on 5pt scales (0/feel like this not at all to 5/feel like this extremely) presented. Across food categories discriminating ability of the translated tool validated (case study 4).
| Summary for all Ys: | ||||||
|---|---|---|---|---|---|---|
| pizza | meat and potatoes | vanilla ice cream | fried chicken | chocolate | fruit | |
| R² | 0,209 | 0,157 | 0,116 | 0,068 | 0,186 | 0,206 |
| F | 36,233 | 25,560 | 17,937 | 10,043 | 31,158 | 35,429 |
| Pr > F | < 0.0001 | < 0.0001 | < 0.0001 | < 0.0001 | < 0.0001 | < 0.0001 |
Case study 4
The tool was able to discriminate between all six food categories. Food discrimination ability of the new Greek emotion tool is depicted in the intensity allocated to each term by consumers (Figure 5). Twenty-three out of the thirty-three emotions were statistically significant: stressed, uninterested, weak, sensual, optimistic, released, wild, energetic, guilty, thankful, happy, pleased, calm, satisfied, joyful, tired, nervous, whole, privileged, healthy, relaxed, glad, good-looking. Terms were identified to create distinct emotional profiles: sensual, wild, energetic, guilty, thankful, healthy.
3.3. Comparison between Translated EP and New Tool
3.3.1. Translation Process
Following established translational techniques, the English terms were not translated one-to-one. Instead, emotions as notions were translated into Greek. As a result, the term good was not translated into Greek as the English expression I feel good according to dictionaries means I feel in good health or in a good mood, but as a notion it was partly covered by other terms, such as glad, happy, and joyful. Likewise, the term loving was semantically covered by the translations of affectionate and tender, the term merry was covered by the translation of joyful, and the terms nostalgic and warm were turned into the respective nouns nostalgia and comfort in Greek because there is no respective Greek adjective for these emotions. It was important for all emotions to be represented on the list, so using a different part of speech was opted for. Thus, the emotion list of the translated EP consisted of 36 adjectives, instead of 39 (Table 2).
3.3.2. Comparison of Tools
For the translated EP, 34 out of the 36 terms provided statistically significant differences, except aggressive and bored. The PCA for terms showed that disgusted, boring, stressed, bored, guilty, and aggressive are different than the other terms (Figure 3). These are the negative emotion terms on the list. The PCA for foods grouped ice cream and fruit together, chocolate on its own, and fried chicken with pizza, and meat and potatoes (Figure 4). Vanilla ice cream and fruit correlated with intense positive emotions. As regards correlations between the frequency of consumption and the terms, guilty was statistically significantly different.
For the Greek tool, 23 out of the 33 terms provided statistically significant differences except disgusted, cheerless, unsatisfied, disappointed, pleasant, angry, sad, ashamed, and resentful. The PCA for terms showed that uninterested, disgusted, weak, dissatisfied, resentful, cheerless, disappointed, ashamed, sad, nervous, unsatisfied, stressed, guilty, and tired are different that the other terms (Figure 3). These are the negative emotion terms on the list. The terms sensual, optimistic, relieved, wild, energetic, guilty, grateful, and healthy had F<0.0001. The PCA for foods grouped fruit separately, meat and potatoes with fried chicken together, pizza separately, and chocolate together with ice cream (Figure 4). Fruit and chocolate got the highest mean intensities. Vanilla ice cream and fruit correlated with intense positive emotions only. Meat and potatoes received the lowest mean intensities. As regards frequency of consumption correlations with terms, pleased, satisfied, glad, healthy, and happy correlated with frequent consumption, whereas guilty correlated with rare consumption.
In the PCA for terms for the translated EP one factor stood out corresponding to 53% of the variation, while for the Greek tool two factors stood out corresponding to about 35% and 19% of the variation (Figure 3). These two factors grouped the terms into positive, negative, and neutral. In the PCA for foods using the translated EP one factor stood out corresponding to about 62% of the variation, while using the Greek tool one factor stood out corresponding to about 71% of the variation (Figure 4). Ten out of the 12 terms that were common for the two tools were allocated lower intensity ratings using the Greek tool.
4. Discussion
4.1. Emotion Term Collection and Lexicon Development Process
Using linguistic sources as a starting point for the compilation of an emotion lexicon for general use (not food-specific) in food consumption studies was practical and effective. The linguistic sources provided a great variety of terms, both positive and negative. Authentic food-related linguistic data from the Web and Instagram validated the terms previously collected and provided some extra terms, thus covering a variety of food consumption instances. Social media also provided information regarding the usage of terms, semantic nuances, metaphorical uses, and the valence of emotion terms. Involving natural speakers/ consumers in the term identification process further validated the original list. Collecting emotion terms from consumers only could lead to a very short list, and probably less broad in emotions covered. This is the reason why consumer-defined emotion lists are compiled mainly when developing food category specific lexicons.
Terms added by participants, such as distrustful, curious, childish, impressed, tolerant, and impatient, did not appear more than the terms already on the list, which means that the list already compiled using linguistic sources could cover them sufficiently. The only term added by consumers that appeared frequently enough to be included in the final list was healthy. This adjective may not be considered an emotion in the narrow sense but feeling healthy is one of the main reasons to consume food, and food producers would like to have this concept measured during product development.
4.2. Validation of the Greek Tool by Using it as an Emotion Measurement Tool
The food categories used in the four case studies of validation cover a wide range of foods as regards functionality and nutrition, from everyday foods (meat and potatoes, olives, olive oil, fruit), to snacks (rusks), to treats (chocolate, ice cream), and fast foods (pizza, fried chicken). Based on the statistical analyses performed, the new tool was able to provide discrimination among samples within food categories, as well as across food categories, with a high percentage of emotions on the list providing statistical difference (70%) (Figure 3 and Figure 4). Cronbach’s alpha was very close to 1 throughout the case studies, which means that most emotions on the list are well established. Uninterested was the only emotion that negatively correlated to others. This is expected because when there is not any interest in something, there are neither positive nor negative emotions towards it. However, this emotion should not be considered redundant as it provides discrimination among food samples, according to the validation studies, and lack of interest should be measured when developing a product.
Specifically, as regards the six food categories used as stimuli, chocolate, vanilla ice cream, and pizza correlated with emotions such as sensual, energetic, unrestrained, and privileged, which are high-key positive, alluding to good mood, appetite, and self-satisfaction. Fried chicken, meat and potatoes, and fruit correlated with emotions such as healthy, glad, relaxed, and calm, which are low-key positive, alluding to an internal state of wellbeing (Table 5). All these categories are commonly acceptable foods and as a result correlate with positive emotions, even though the level of emotional arousal they elicit differs based on their functionality. For example, ice cream and chocolate are comfort foods, but not healthy choices as opposed to meat and potatoes or fruit that are healthy choices but not usually cause excitement when consumed.
4.3. Comparing the Use of the Translated Tool and the Tool Developed from Scratch
Only 12 emotions were included in both the translated EP and the new Greek tool. This is the key point of the present study. While testing the translated EP, comments were made by participants that the list contained emotions not relevant to food consumption, or terms not intuitively used by native speakers of Greek for food consumption. Participants felt the urge to add various terms to the list.
It is evident, based on the intensities allocated to the terms of each tool, that the same emotion terms weighed differently on each list. There is a phenomenon described in literature called “halo-dumping” [43,44]. According to this phenomenon, when participants experience emotions that are not within the given choices in a questionnaire, they “dump” the emotional load of those onto the existing ones. As a result, term selection and rating are affected by the length of the list and the semantic correlations between the terms on the list. This emotional “dumping” could be the explanation in this case for the participants’ allocated intensities to the emotions on the translated EP list. The fact that only 3 out of the 12 common terms got a higher intensity rating when using the Greek tool, supports this inference and can be taken as proof that participants, when presented with less fitting choices, “dump” their emotional load onto the existing terms. Participants using the Greek tool did not seem to have this problem and did not make any comments of concern about the terms provided.
As regards food categories, groupings made by PCAs for the translated EP do not make sense. Ice cream was grouped with fruit, chocolate on its own, and fried chicken with pizza, and meat and potatoes. On the contrary, using the Greek tool, fruit and pizza were two separate categories, meat and potatoes and fried chicken were grouped together, and chocolate together with ice cream (Figure 4). The latter categorization is more reasonable as meat-containing foods were grouped together, sweets together, fruit and fast food on their own. The intensities allocated using the newly developed Greek tool for the six food categories as analyzed by ANOVA created distinct emotional profiles for all food categories, which was not the case using the translated tool.
5. Conclusions
Using linguistic sources as a starting point to develop an emotion lexicon has proven to have the advantage of containing a variety of terms, which consumers might not be able to think of while performing a free-listing task, especially when the aim is to compile a general emotion lexicon (not food specific). However, using dictionaries and thesauri only for relevant word collection would be erroneous, because it would be from a subjective viewpoint, providing words that do not depict language use by the entire population under study. Making use of other sources (social media and the Web as in this case) and collecting data from consumers are necessary steps to depict real and synchronous usage of language. Using social media as a source of linguistic data has the advantage of using a readily available pool of spontaneous self-expression of consumers, combining multiform content (texts, hashtags, images, emojis), and thus making it easier to define the valence of emotion terms. The disadvantage of collecting words from social media and the Web only would be that their users do not represent the entire population under study linguistically or culturally. Combining the two methods overcomes the disadvantages of each. By comparing the newly developed tool and the translation of the English tool it can be concluded that it is not effective to use emotion lexicons and measurement tools developed for other populations, even if translated. It may be more effort, time, and expenses consuming to develop culture- and language- specific tools, but original, developed from scratch, culture- and language- specific tools provide more accurate results and are more participant-friendly. The emotion lexicon compiled can be used as a Check-All-That-Apply or Rate-All-That-Apply measurement tool to profile food-elicited emotions during product development and in consumer studies on foods. Even though it was time and effort consuming to compile a lexicon using all these sources (thesaurus/dictionary, internet/social media, and consumers using questionnaires), it is safe to say that the lexicon compiled is representative of the population under study at this point in time. Other food categories, especially novel foods, not traditionally consumed in the country, can be included in future studies to further validate the measurement tool.
Supplementary Materials
The following supporting information can be downloaded at: www.mdpi.com/xxx/s1, Table S1: The original list of emotions collected from linguistic sources that contained 119 terms. Presented in Greek with their English translation.; Figure S1: Pictures presented to consumers in an online questionnaire for food-related emotion elicitation. Participants were asked to write one to three emotions that each food elicits in them.
Author Contributions
Conceptualization, Malamatenia Panagiotou and Konstantinos Gkatzionis; Data curation, Malamatenia Panagiotou; Formal analysis, Malamatenia Panagiotou and Aikaterini Gkatzioni; Funding acquisition, Konstantinos Gkatzionis; Investigation, Malamatenia Panagiotou and Aikaterini Gkatzioni; Methodology, Malamatenia Panagiotou, Vasiliki Bountziouka and Konstantinos Gkatzionis; Project administration, Konstantinos Gkatzionis; Resources, Konstantinos Gkatzionis; Supervision, Konstantinos Gkatzionis; Visualization, Malamatenia Panagiotou; Writing – original draft, Malamatenia Panagiotou; Writing – review & editing, Vasiliki Bountziouka and Konstantinos Gkatzionis.
Funding
This research was co-funded by the European Regional Development Fund of the European Union and Greek national funds through the Operational Program Competitiveness, Entrepreneurship, and Innovation, under the call RESEARCH – CREATE – INNOVATE (project code: T2EDK-02137).
Institutional Review Board Statement
The study was conducted in accordance with the Declaration of Helsinki, and approved by the Institutional Ethics Committee of the University of the Aegean (protocol code AP-33433, date 26/7/2024).
Informed Consent Statement
Informed consent was obtained from all subjects involved in the study.
Data Availability Statement
The data presented in this study are openly available in ResearchBox at https://researchbox.org/3465, reference number 3465.
Conflicts of Interest
The authors declare no conflicts of interest. The funders had no role in the design of the study; in the collection, analyses, or interpretation of data; in the writing of the manuscript; or in the decision to publish the results. This article is a revised and expanded version of a paper entitled “Development of an Emotion Lexicon in Greek for the Self-Report and Measurement of Emotions Elicited by Foods”, which was presented at the 4th International Electronic Conference on Foods, 15–30 October 2023 [45].
References
- King, S.C.; Meiselman, H.L. Development of a Method to Measure Consumer Emotions Associated with Foods. Food Qual. Prefer. 2010, 21, 168–177. [Google Scholar] [CrossRef]
- Chaya, C.; Eaton, C.; Hewson, L.; Vázquez, R.F.; Fernández-Ruiz, V.; Smart, K.A.; Hort, J. Developing a Reduced Consumer-Led Lexicon to Measure Emotional Response to Beer. Food Qual. Prefer. 2015, 45, 100–112. [Google Scholar] [CrossRef]
- Eaton, C. Developing an Effective Approach to Measure Emotional Response to the Sensory Properties of Beer, Developing an effective approach to measure emotional response to the sensory properties of beer (PhD thesis). The University of Nottingham, United Kingdom., 2015.
- Fonseca, V.V.; Ares, G.; Deliza, R. Do Food-Related Emotional Associations Differ with Socio-Economic Status? An Exploratory Qualitative Study with Brazilian Consumers. Food Res. Int. 2019, 116, 687–696. [Google Scholar] [CrossRef] [PubMed]
- Gmuer, A.; Nuessli Guth, J.; Runte, M.; Siegrist, M. From Emotion to Language: Application of a Systematic, Linguistic-Based Approach to Design a Food-Associated Emotion Lexicon. Food Qual. Prefer. 2015, 40, 77–86. [Google Scholar] [CrossRef]
- Silva, A.P.; Jager, G.; van Bommel, R.; van Zyl, H.; Voss, H.-P.; Hogg, T.; Pintado, M.; de Graaf, C. Functional or Emotional? How Dutch and Portuguese Conceptualise Beer, Wine and Non-Alcoholic Beer Consumption. Food Qual. Prefer. 2016, 49, 54–65. [Google Scholar] [CrossRef]
- Mora, M.; Dupas de Matos, A.; Fernández-Ruiz, V.; Briz, T.; Chaya, C. Comparison of Methods to Develop an Emotional Lexicon of Wine: Conventional vs Rapid-Method Approach. Food Qual. Prefer. 2020, 83. [Google Scholar] [CrossRef]
- Dorado, R.; Chaya, C.; Tarrega, A.; Hort, J. The Impact of Using a Written Scenario When Measuring Emotional Response to Beer. Food Qual. Prefer. 2016, 50, 38–47. [Google Scholar] [CrossRef]
- Eaton, C.; Chaya, C.; Smart, K.A.; Hort, J. Comparing a Full and Reduced Version of a Consumer-led Lexicon to Measure Emotional Response to Beer. J. Sens. Stud. 2019, 34, e12481. [Google Scholar] [CrossRef]
- Gunaratne, T.M.; Gonzalez Viejo, C.; Fuentes, S.; Torrico, D.D.; Gunaratne, N.M.; Ashman, H.; Dunshea, F.R. Development of Emotion Lexicons to Describe Chocolate Using the Check-All-That-Apply (CATA) Methodology across Asian and Western Groups. Food Res. Int. 2019, 115, 526–534. [Google Scholar] [CrossRef]
- Ferrarini, R.; Carbognin, C.; Casarotti, E.M.; Nicolis, E.; Nencini, A.; Meneghini, A.M. The Emotional Response to Wine Consumption. Food Qual. Prefer. 2010, 21, 720–725. [Google Scholar] [CrossRef]
- Wardy, W.; Sae-Eaw, A.; Sriwattana, S.; No, H.K.; Prinyawiwatkul, W. Assessing Consumer Emotional Responses in the Presence and Absence of Critical Quality Attributes: A Case Study with Chicken Eggs. J. Food Sci. 2015, 80, S1574–S1582. [Google Scholar] [CrossRef] [PubMed]
- Silva, A.P.; Voss, H.-P.; van Zyl, H.; Hogg, T.; de Graaf, C.; Pintado, M.; Jager, G. Temporal Dominance of Sensations, Emotions, and Temporal Liking Measured in a Bar for Two Similar Wines Using a Multi-Sip Approach. J. Sens. Stud. 2018, 33, e12459. [Google Scholar] [CrossRef]
- Jager, G.; Schlich, P.; Tijssen, I.; Yao, J.; Visalli, M.; de Graaf, C.; Stieger, M. Temporal Dominance of Emotions: Measuring Dynamics of Food-Related Emotions during Consumption. Food Qual. Prefer. 2014, 37, 87–99. [Google Scholar] [CrossRef]
- Cardello, A. V.; Meiselman, H.L.; Schutz, H.G.; Craig, C.; Given, Z.; Lesher, L.L.; Eicher, S. Measuring Emotional Responses to Foods and Food Names Using Questionnaires. Food Qual. Prefer. 2012, 24, 243–250. [Google Scholar] [CrossRef]
- Danner, L.; Ristic, R.; Johnson, T.E.; Meiselman, H.L.; Hoek, A.C.; Jeffery, D.W.; Bastian, S.E.P. Context and Wine Quality Effects on Consumers’ Mood, Emotions, Liking and Willingness to Pay for Australian Shiraz Wines. Food Res. Int. 2016, 89, 254–265. [Google Scholar] [CrossRef]
- Bhumiratana, N.; Adhikari, K.; Chambers, E. The Development of an Emotion Lexicon for the Coffee Drinking Experience. Food Res. Int. 2014, 61, 83–92. [Google Scholar] [CrossRef]
- Thomson, D.M.H.; Crocker, C. A Data-Driven Classification of Feelings. Food Qual. Prefer. 2013, 27, 137–152. [Google Scholar] [CrossRef]
- Ferdenzi, C.; Delplanque, S.; Barbosa, P.; Court, K.; Guinard, J.-X.; Guo, T.; Craig Roberts, S.; Schirmer, A.; Porcherot, C.; Cayeux, I.; et al. Affective Semantic Space of Scents. Towards a Universal Scale to Measure Self-Reported Odor-Related Feelings. Food Qual. Prefer. 2013, 30, 128–138. [Google Scholar] [CrossRef]
- Jaeger, S.R.; Vidal, L.; Kam, K.; Ares, G. Can Emoji Be Used as a Direct Method to Measure Emotional Associations to Food Names? Preliminary Investigations with Consumers in USA and China. Food Qual. Prefer. 2017, 56, 38–48. [Google Scholar] [CrossRef]
- den Uijl, L.C.; Jager, G.; de Graaf, C.; Waddell, J.; Kremer, S. It Is Not Just a Meal, It Is an Emotional Experience – A Segmentation of Older Persons Based on the Emotions That They Associate with Mealtimes. Appetite 2014, 83, 287–296. [Google Scholar] [CrossRef]
- Gutjar, S.; Dalenberg, J.R.; de Graaf, C.; de Wijk, R.A.; Palascha, A.; Renken, R.J.; Jager, G. What Reported Food-Evoked Emotions May Add: A Model to Predict Consumer Food Choice. Food Qual. Prefer. 2015, 45, 140–148. [Google Scholar] [CrossRef]
- Hu, X.; Lee, J. Emotions Elicited While Drinking Coffee: A Cross-Cultural Comparison between Korean and Chinese Consumers. Food Qual. Prefer. 2019, 76, 160–168. [Google Scholar] [CrossRef]
- Sosa, M.; Cardinal, P.; Contarini, A.; Hough, G. Food Choice and Emotions: Comparison between Low and Middle Income Populations. Food Res. Int. 2015, 76, 253–260. [Google Scholar] [CrossRef]
- van Zyl, H.; Meiselman, H.L. An Update on the Roles of Culture and Language in Designing Emotion Lists: English, Spanish and Portuguese. Food Qual. Prefer. 2016, 51, 72–76. [Google Scholar] [CrossRef]
- van Zyl, H.; Meiselman, H.L. The Roles of Culture and Language in Designing Emotion Lists: Comparing the Same Language in Different English and Spanish Speaking Countries. Food Qual. Prefer. 2015, 41, 201–213. [Google Scholar] [CrossRef]
- Wu, L. The Web as Corpus: Theory and Practice. Maristella Gatto. Digit. Scholarsh. Humanit. 2015. [Google Scholar] [CrossRef]
- Bouzou, X.G. The Web as a Corpus A Multilingual Multipurpose Corpus; 2018;
- Vaezian, H. The Web as a Corpus: A Resource for Translation. Vertimo Stud. 2018, 11, 62–75. [Google Scholar] [CrossRef]
- Sinclair, J. Corpus and Text — Basic Principles. In Developing Linguistic Corpora: a Guide to Good Practice; Wynne, M., Ed.; Oxbow Books, 2004; pp. 5–24.
- Hutchings, S.C.; Dixit, Y.; Al-Sarayreh, M.; Torrico, D.D.; Realini, C.E.; Jaeger, S.R.; Reis, M.M. A Critical Review of Social Media Research in Sensory-Consumer Science. Food Res. Int. 2023, 165, 112494. [Google Scholar] [CrossRef]
- Jaeger, L.-C.; Höhler, J. Using Word of Mouth Data from Social Media to Identify Asymmetric Competition in Food Retailing. J. Retail. Consum. Serv. 2021, 58, 102284. [Google Scholar] [CrossRef]
- Tsakalidis, A.; Papadopoulos, S.; Voskaki, R.; Ioannidou, K.; Boididou, C.; Cristea, A.I.; Liakata, M.; Kompatsiaris, Y. Building and Evaluating Resources for Sentiment Analysis in the Greek Language. Lang. Resour. Eval. 2018, 52, 1021–1044. [Google Scholar] [CrossRef]
- Vidal, L.; Ares, G.; Machín, L.; Jaeger, S.R. Using Twitter Data for Food-Related Consumer Research: A Case Study on “What People Say When Tweeting about Different Eating Situations. ” Food Qual. Prefer. 2015, 45, 58–69. [Google Scholar] [CrossRef]
- Vidal, L.; Ares, G.; Jaeger, S.R. Use of Emoticon and Emoji in Tweets for Food-Related Emotional Expression. Food Qual. Prefer. 2016, 49, 119–128. [Google Scholar] [CrossRef]
- Swaney-Stueve, M.; Jepsen, T.; Deubler, G. The Emoji Scale: A Facial Scale for the 21st Century. Food Qual. Prefer. 2018, 68, 183–190. [Google Scholar] [CrossRef]
- Kralj Novak, P.; Smailović, J.; Sluban, B.; Mozetič, I. Sentiment of Emojis. PLoS One 2015, 10, e0144296. [Google Scholar] [CrossRef]
- Gewiese, J.; Rau, S. Instagram Users in Greece; 2023.
- Vostantzoglou, T. Antilexikon i Onomastikon Tis Neoellinikis Glossis (Thematic Dictionary of Modern Greek); 2nd ed.; Ioanna Vostantzoglou: Athens, 1998; ISBN 9789608813311. [Google Scholar]
- Babiniotis, G. Lexiko Tis Neas Ellinikis Glossas (Lexicon of the Modern Greek Language); 2nd ed.; Lexicology Centre: Athens, 2002; ISBN 9608619017. [Google Scholar]
- King, S.C.; Meiselman, H.L.; Thomas Carr, B. Measuring Emotions Associated with Foods: Important Elements of Questionnaire and Test Design. Food Qual. Prefer. 2013, 28, 8–16. [Google Scholar] [CrossRef]
- Panagiotou, M.; Gkatzionis, K. Lexicon Development to Measure Emotions Evoked by Foods: A Review. Meas. Food 2022, 7. [Google Scholar] [CrossRef]
- Clark, C.C.; Lawless, H.T. Limiting Response Alternatives in Time-Intensity Scaling: An Examination of the Halo-Dumping Effect. Chem. Senses 1994. [Google Scholar] [CrossRef]
- Nestrud, M.A.; Meiselman, H.L.; King, S.C.; Lesher, L.L.; Cardello, A. V. Development of EsSense25, a Shorter Version of the EsSense Profile®. Food Qual. Prefer. 2016, 48, 107–117. [Google Scholar] [CrossRef]
- Panagiotou, M.; Gkatzionis, K. Development of an Emotion Lexicon in Greek for the Self-Report and Measurement of Emotions Elicited by Foods. In Proceedings of the Foods 2023; MDPI: Basel Switzerland, October 14, 2023; p. 42. [Google Scholar]
Figure 1.
Emotion terms collected and selected as food-elicited during the term collection and identification process.
Figure 1.
Emotion terms collected and selected as food-elicited during the term collection and identification process.
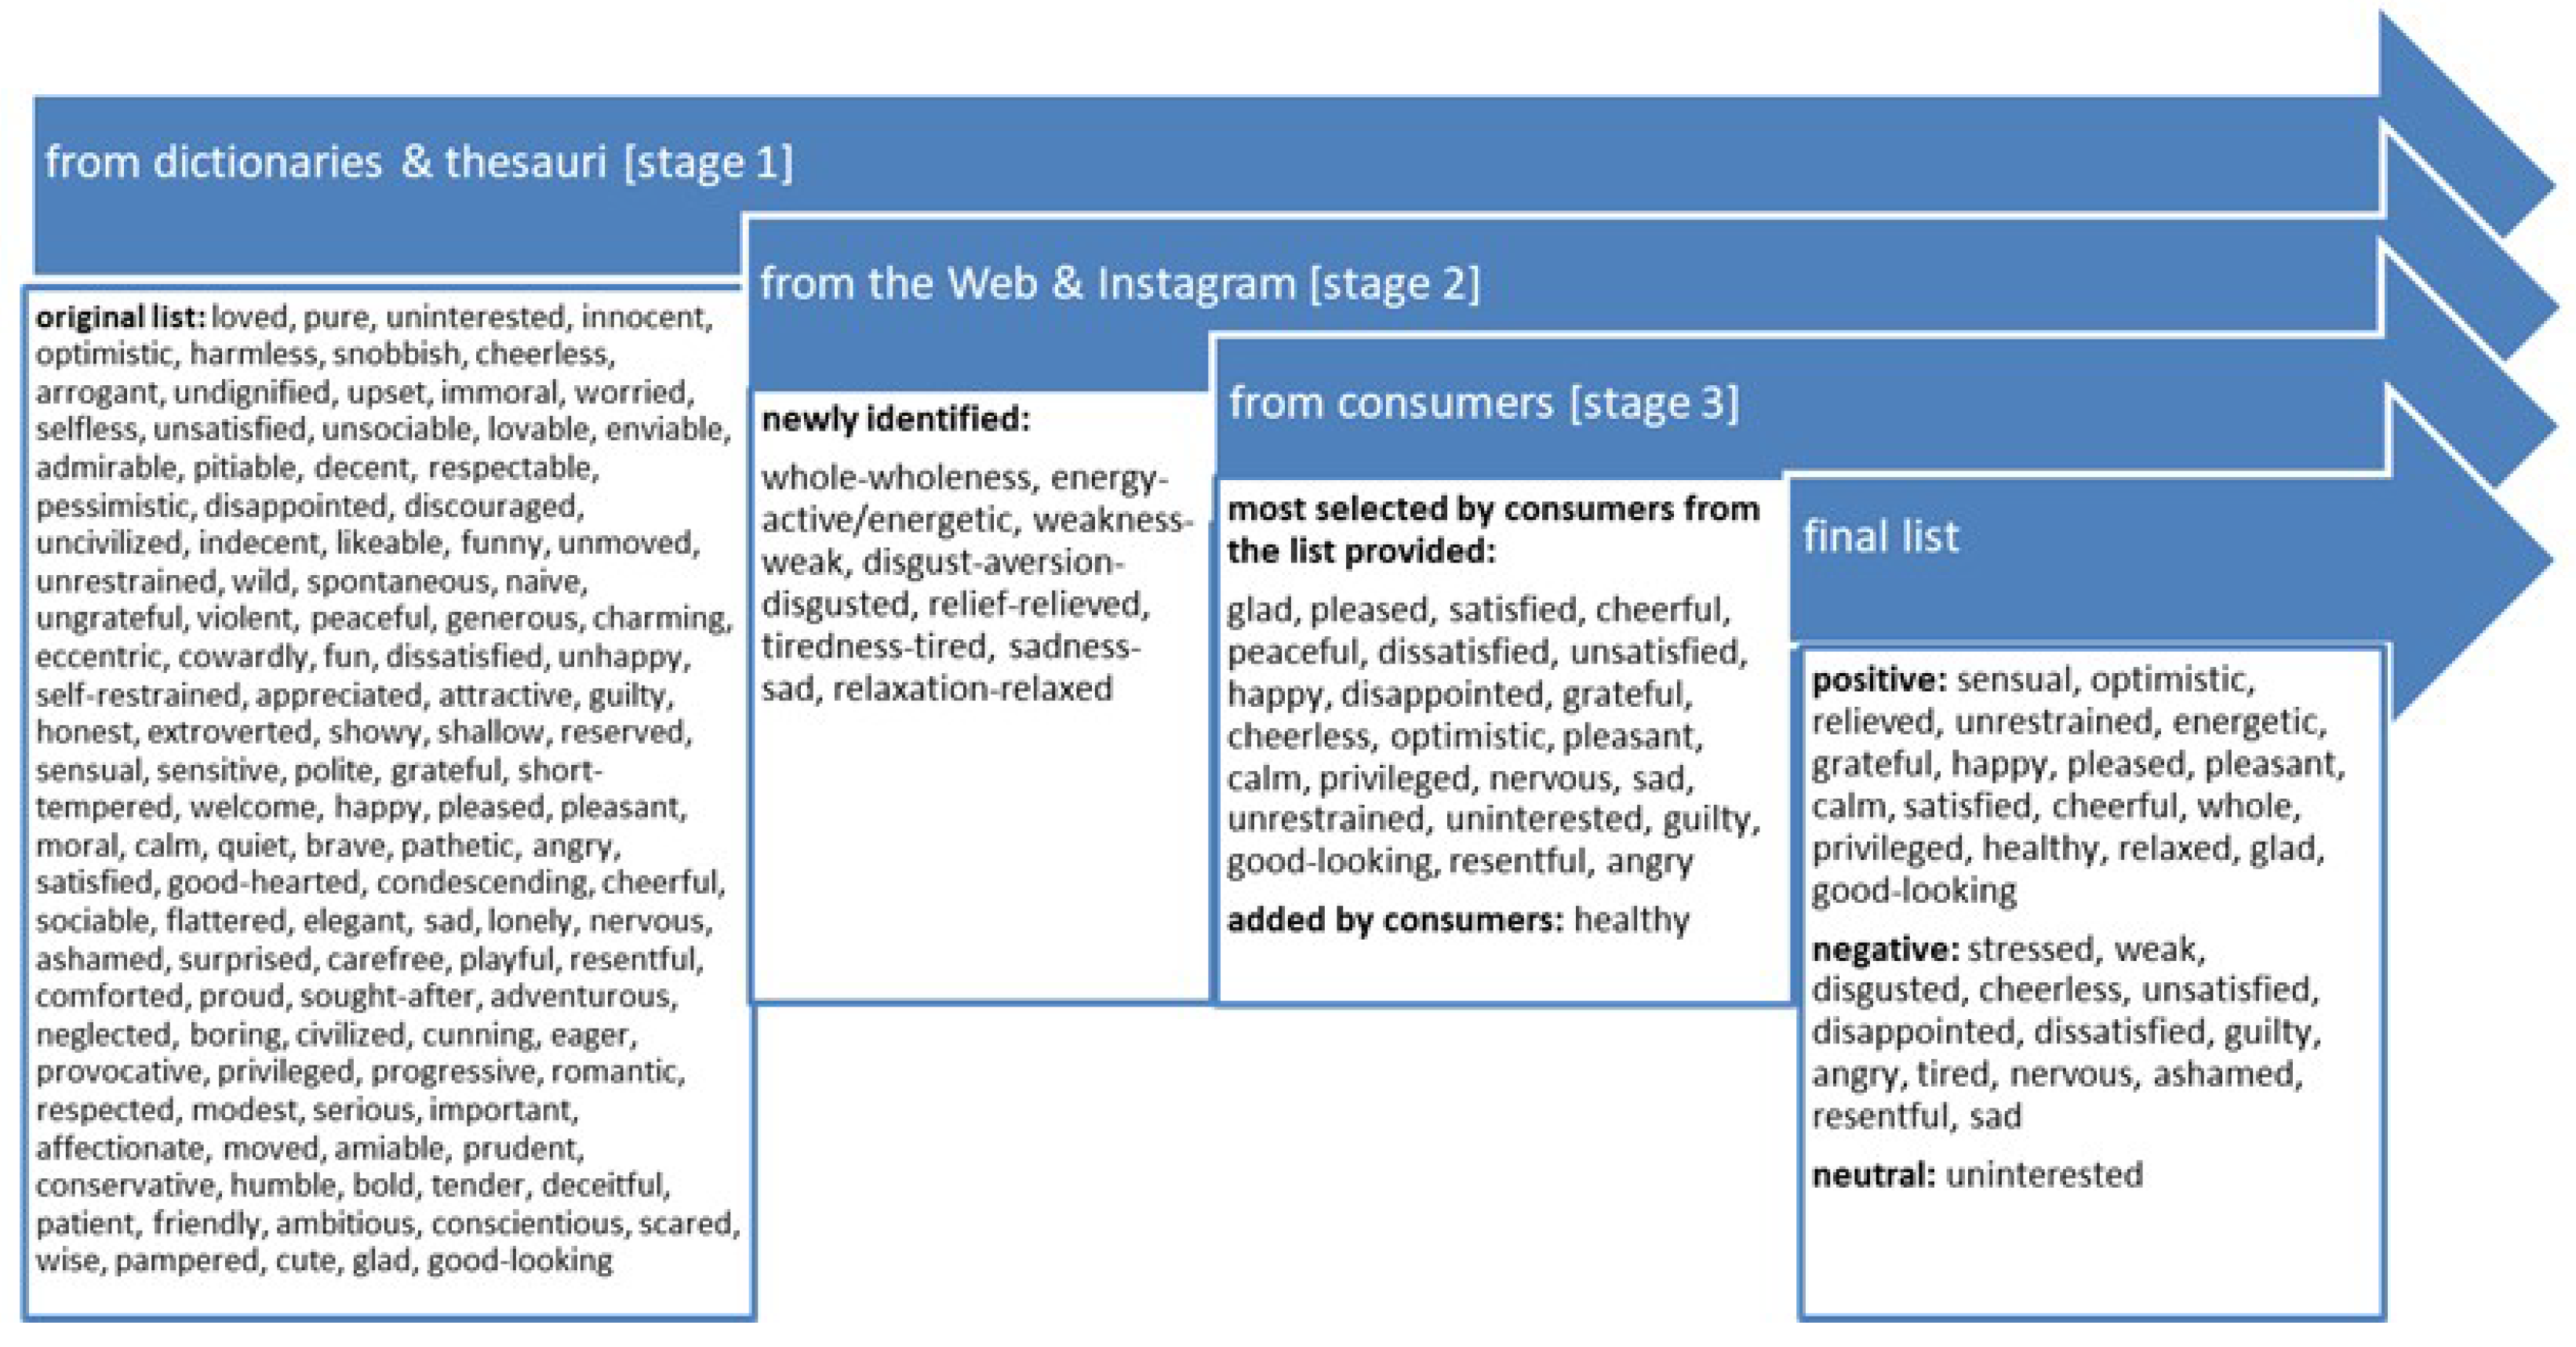
Figure 2.
Graphical illustration of the emotion lexicon development process.
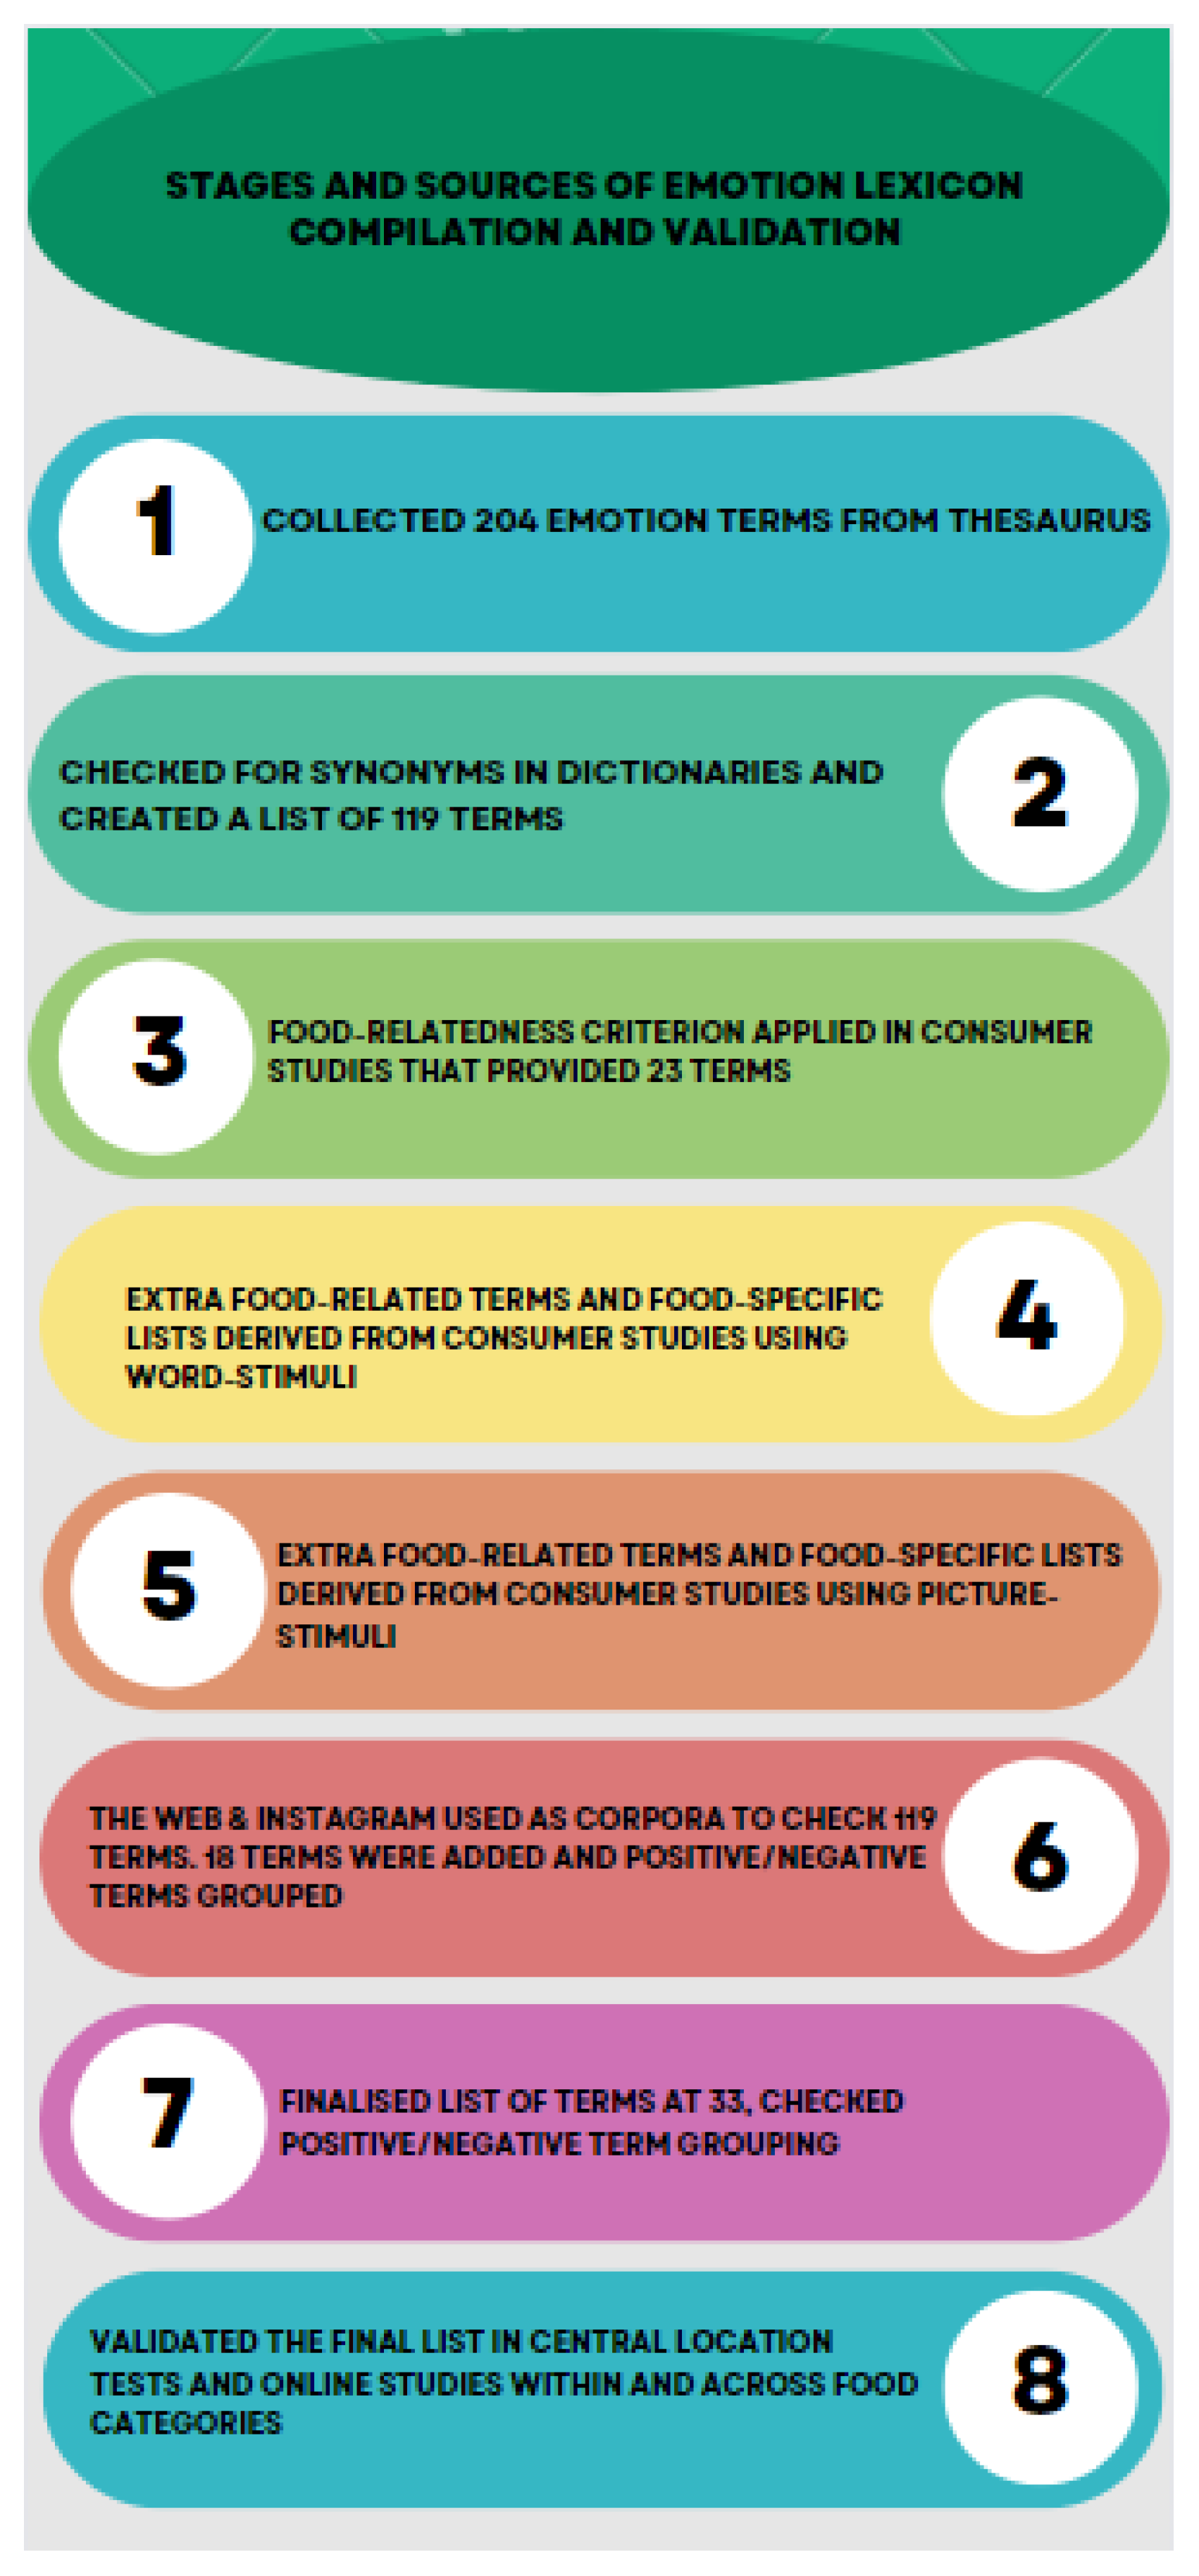
Figure 5.
Food discrimination ability of the new Greek emotion tool is depicted in the intensity allocated by consumers to each term in case study 4. Twenty-three out of the thirty-three emotions are statistically significant. Positive emotions are allocated high intensities. Sensual, wild, energetic, guilty, thankful, and healthy create distinct profiles for foods.
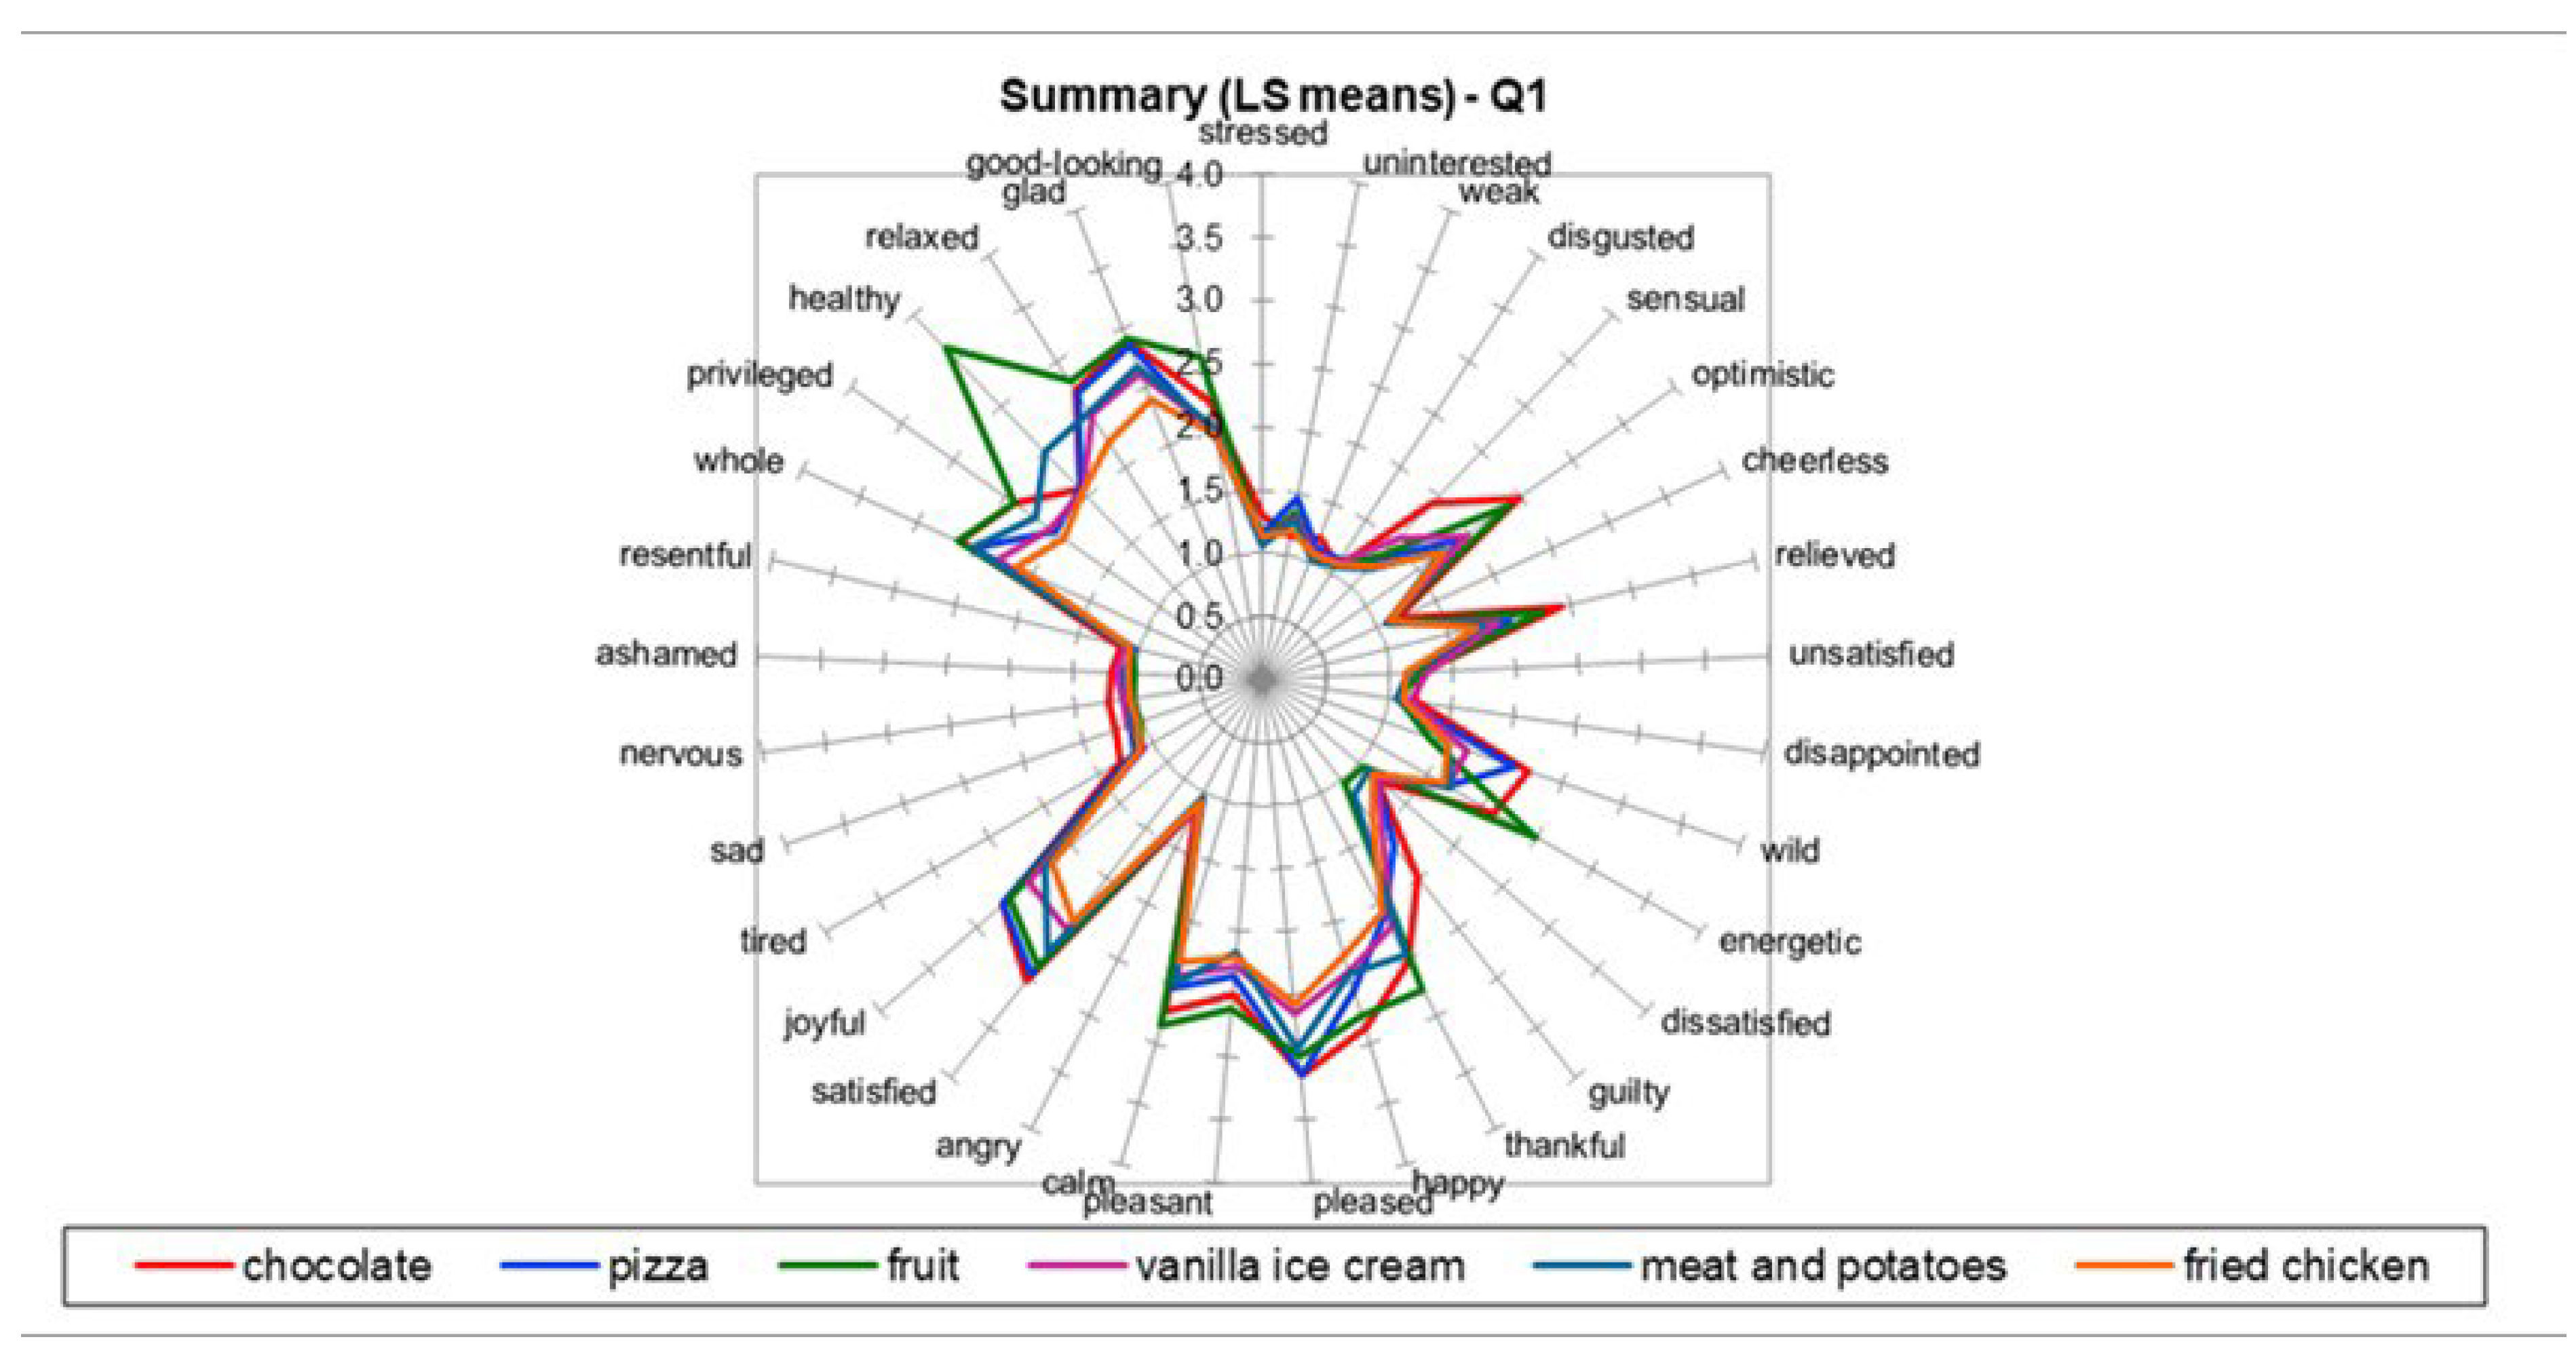
Figure 3.
Principal Component Analysis for terms (factors 1 and 2) for (a) the translated EsSense Profile and (b) the new Greek tool. The red dots represent active variables.
Figure 3.
Principal Component Analysis for terms (factors 1 and 2) for (a) the translated EsSense Profile and (b) the new Greek tool. The red dots represent active variables.
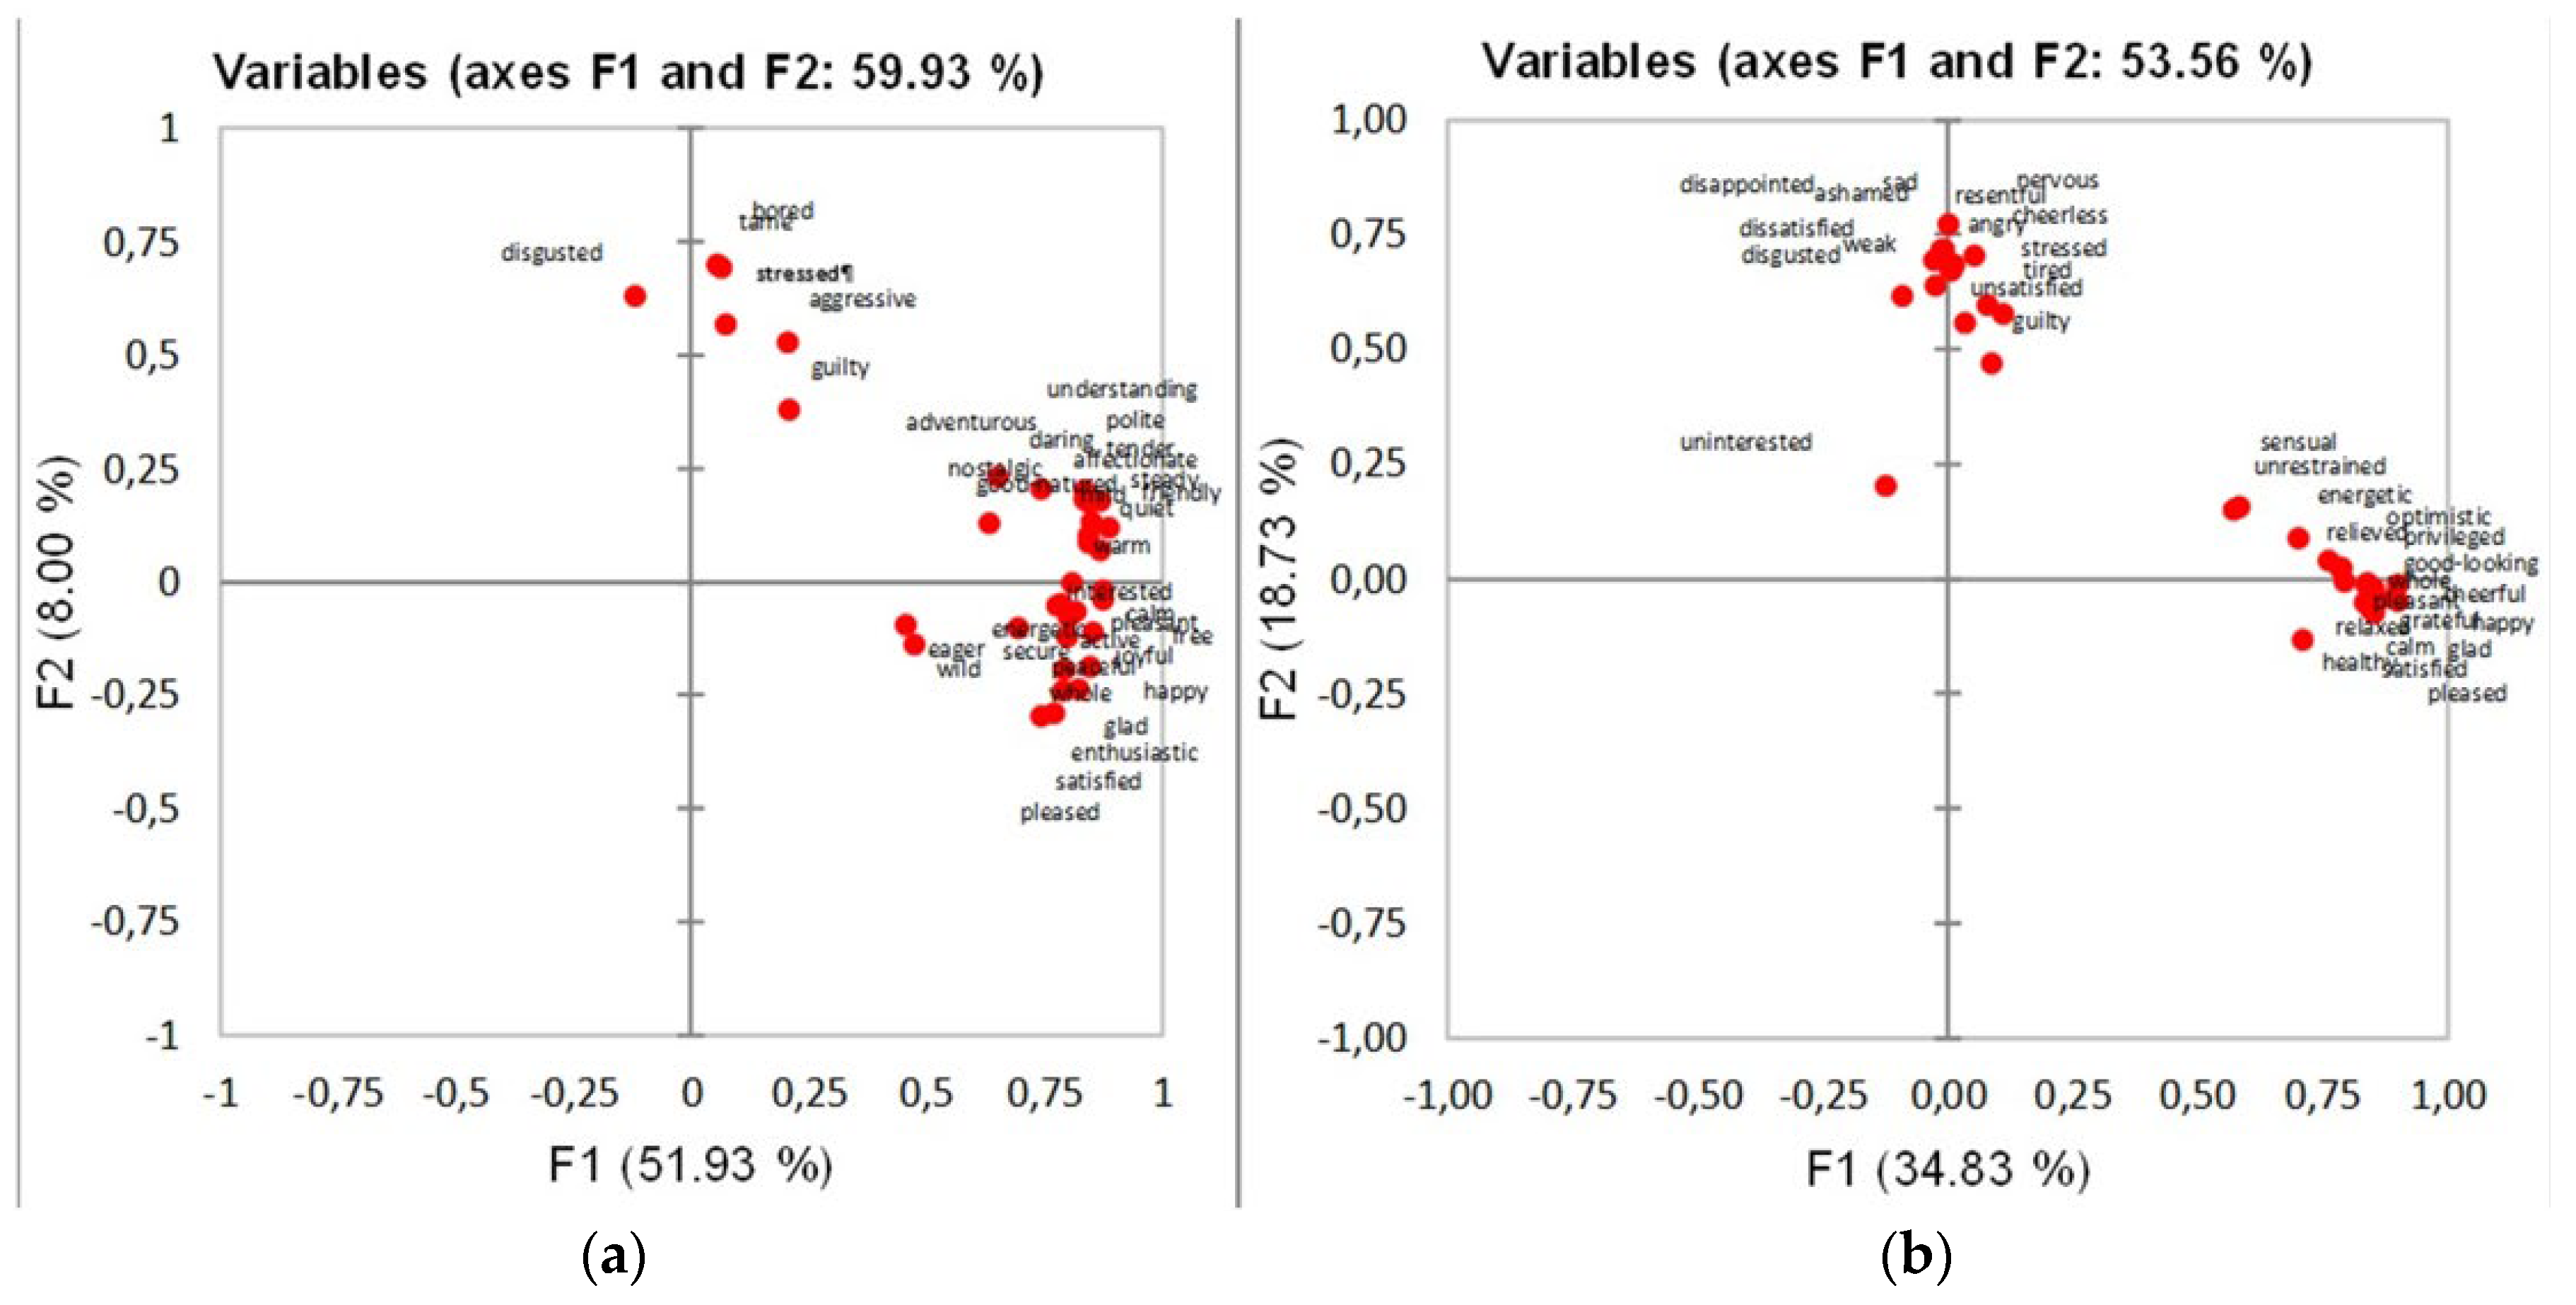
Figure 4.
Principal Component Analysis for foods (factors 1 and 2) for (a) the translated EsSense Profile and (b) the new Greek tool. The red dots represent active variables.
Figure 4.
Principal Component Analysis for foods (factors 1 and 2) for (a) the translated EsSense Profile and (b) the new Greek tool. The red dots represent active variables.
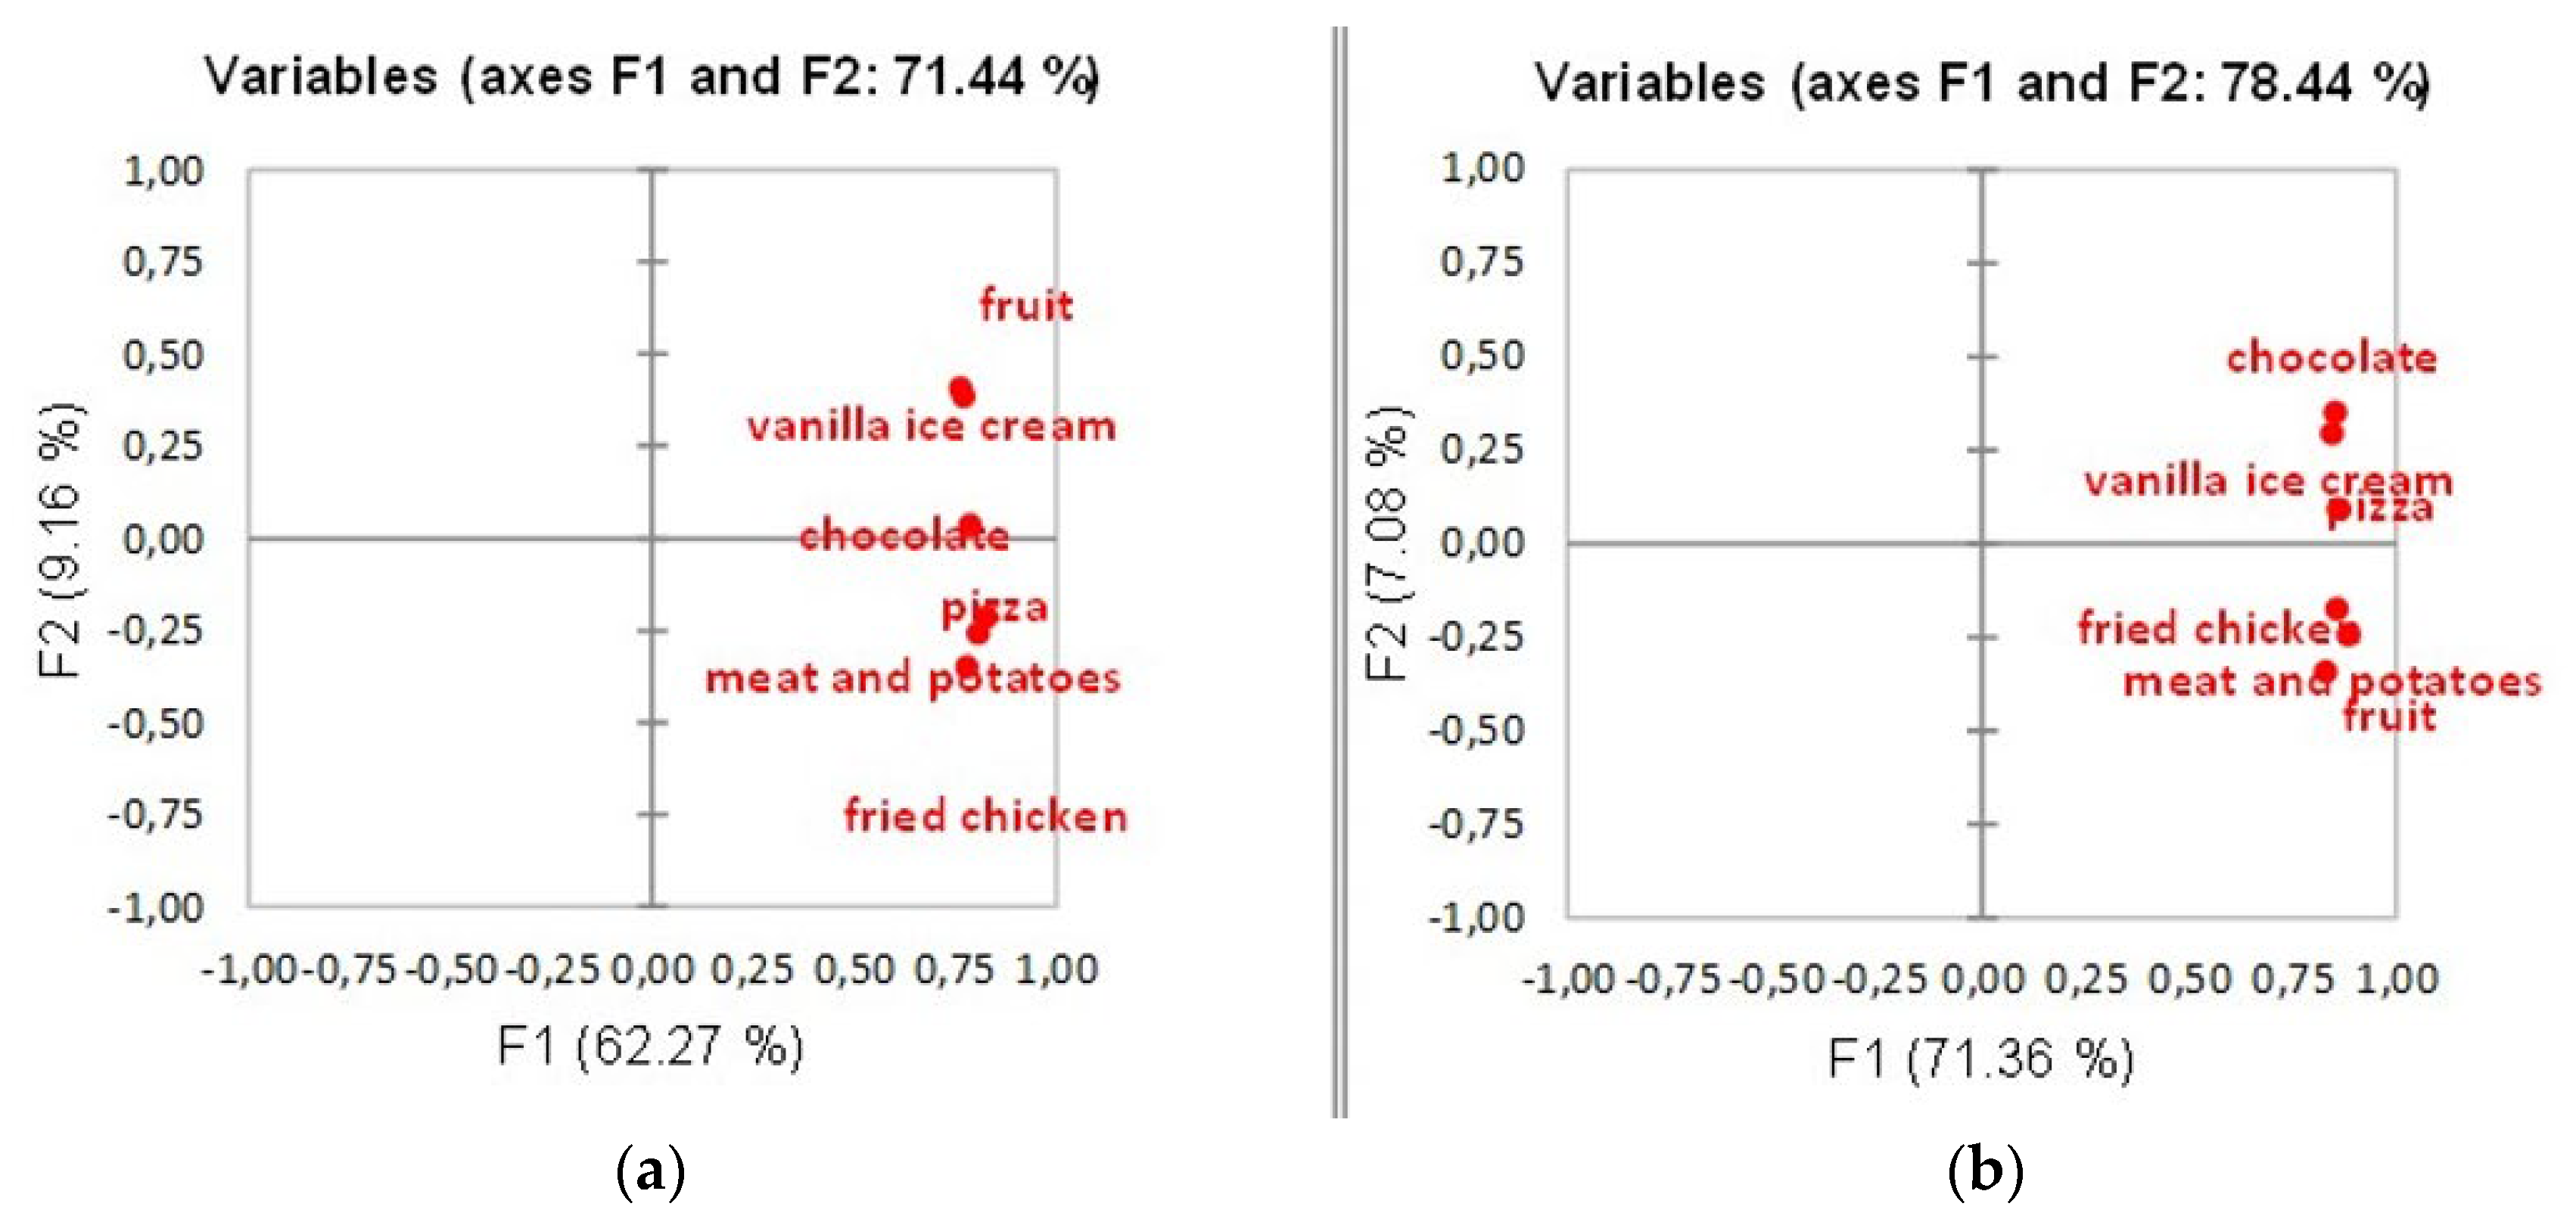
Table 1.
Greek words for web search and their English equivalents.
| Greek search words | English equivalents |
|---|---|
| νιώθω /njóθo/ | feel |
| αισθάνομαι /esθánome/ | feel |
| τρόφιμο /trófimo/ | food |
| φαγητό /fajitó/ | food |
| συναίσθημα /sinésθima/ | emotion |
| αίσθηση /ésθisi/ | feeling |
| αίσθημα /ésθima/ | feeling |
| τρώω /tróo/ | eat |
| κατανάλωση /katanálosi/ | consumption |
Table 2.
Emotion terms of EsSense Profile, of translated EsSense Profile into Greek, and of new Greek tool.
Table 2.
Emotion terms of EsSense Profile, of translated EsSense Profile into Greek, and of new Greek tool.
| EsSense Profile | Translated EsSense Profile | new Greek tool |
|---|---|---|
| active | ενεργός | |
| adventurous | περιπετειώδης | |
| affectionate | στοργικός | |
| loving | ||
| tender | ||
| aggressive | επιθετικός | |
| bored | βαριεστημένος | |
| calm | ήρεμος | ήρεμος |
| daring | τολμηρός | |
| disgusted | αηδιασμένος | αηδιασμένος |
| eager | ανυπόμονος | |
| energetic | δραστήριος | δραστήριος |
| enthusiastic | ενθουσιώδης | |
| free | ελεύθερος | |
| friendly | φιλικός | |
| glad | χαρούμενος | χαρούμενος |
| good | ||
| good-natured | καλοσυνάτος | |
| guilty | ένοχος | ένοχος |
| happy | ευτυχισμένος | ευτυχισμένος |
| interested | ενδιαφερόμενος | |
| joyful | κεφάτος | κεφάτος |
| merry | ||
| mild | πράος | |
| nostalgic | νοσταλγία | |
| peaceful | γαλήνιος | |
| pleasant | ευχάριστος | ευχάριστος |
| pleased | ευχαριστημένος | ευχαριστημένος |
| polite | ευγενικός | |
| quiet | ήσυχος | |
| satisfied | ικανοποιημένος | ικανοποιημένος |
| secure | ασφαλής | |
| steady | σταθερός | |
| tame | βαρετός | |
| understanding | συμπονετικός | |
| warm | θαλπωρή | |
| whole | πλήρης | πλήρης |
| wild | ασυγκράτητος | ασυγκράτητος |
| worried | ανήσυχος | αγχωμένος / stressed |
| αδιάφορος / uninterested | ||
| αδύναμος / weak | ||
| αισθησιακός / sensual | ||
| αισιόδοξος / optimistic | ||
| άκεφος / cheerless | ||
| ανακουφισμένος / relieved | ||
| ανικανοποίητος / unsatisfied | ||
| απογοητευμένος / disappointed | ||
| δυσαρεστημένος / dissatisfied | ||
| ευγνώμων / grateful | ||
| θυμωμένος / angry | ||
| κουρασμένος / tired | ||
| λυπημένος / sad | ||
| νευρικός / nervous | ||
| ντροπιασμένος / ashamed | ||
| παραπονεμένος / resentful | ||
| προνομιούχος / privileged | ||
| υγιής / healthy | ||
| χαλαρός / relaxed | ||
| ωραίος / good-looking |
Disclaimer/Publisher’s Note: The statements, opinions and data contained in all publications are solely those of the individual author(s) and contributor(s) and not of MDPI and/or the editor(s). MDPI and/or the editor(s) disclaim responsibility for any injury to people or property resulting from any ideas, methods, instructions or products referred to in the content. |
© 2024 by the authors. Licensee MDPI, Basel, Switzerland. This article is an open access article distributed under the terms and conditions of the Creative Commons Attribution (CC BY) license (http://creativecommons.org/licenses/by/4.0/).
Copyright: This open access article is published under a Creative Commons CC BY 4.0 license, which permit the free download, distribution, and reuse, provided that the author and preprint are cited in any reuse.


