Submitted:
02 September 2024
Posted:
03 September 2024
You are already at the latest version
Abstract
The study addressed the following questions: How does continuous lighting (CL) im-pact plant physiology, photosynthetic and stress response? Does the impact of CL de-pend on the source of light and other environmental factors (natural vs artificial)? Do responses to CL differ for native and non-native plant species in the Subarctic and, if differences exist, what physiological reasons might they be associated with? Experi-ments were conducted with three native to Subarctic (Geranium sylvaticum L., Geum rivale L., Potentilla erecta (L.) Raeusch.) and three non-native plant species (Geranium himalayense Klotzsch, Geum coccineum Sibth. & Sm., Potentilla atrosanguinea Loddiges ex D. Don) introduced in Polar-Alpine Botanic Garden (KPABG, 67°38′N). Obtained re-sults have shown that plants lack specific mechanisms of tolerance to CL. Protective responses are non-specific and induced by developing photo-oxidative stress. In cli-mate chambers under constant environmental conditions artificial CL causes leaf inju-ries due to oxidative stress, the main cause of which is circadian asynchrony. In nature plants are not photodamaged during the polar day as endogenous rhythms are main-tained due to daily fluctuations of several environmental factors (light intensity, spec-tral distribution, temperature and air humidity). The obtained data show that among possible non-specific protective mechanisms, plants use flavonoids to neutralize excess ROS generated under CL. In local subarctic plants, their photoprotective role is signif-icantly higher than in non-native introduced plant species.
Keywords:
Subarctic
; native
; non-native plants
; photoperiod
; continuous lighting
1. Introduction
All living organisms are constantly exposed to various environmental factors and their fluctuations. The most vulnerable to their effects are sessile organisms such as terrestrial plants that are not capable of moving in space. This means that their survival is directly dependent on the reliability and effectiveness of the protective and adaptive mechanisms that they have acquired in the course of long-term evolution. Some of them are general (non-specific), and some are specific. The first of them are the most universal and therefore are used more often by different plants in a wide variety of natural climatic conditions. It is not surprising that many plant species are characterized by significant numbers and large habitat areas, which include territories with significantly different environmental conditions. Since plants are constantly exposed to fluctuating environmental factors, this forces them to activate, depending on the situation, one or another part of their arsenal of adaptive responses. This is convincingly demonstrated by the results of numerous studies on the effects of such environmental factors as temperature, moisture supply and light, which are considered to be the main ones for the plant life. The third of them (light) has been given, as it seems to us, somewhat less attention in recent decades than it was before, but with the advent of LED light sources and plant factories with artificial lighting (PFAL), the interest in this factor has increased significantly.
Three principal characteristics of light affect plant growth: quantity, quality and duration. Photoperiod quantifies the amount of time a plant is exposed to light, usually within a 24-hour circadian cycle. Photoperiod exerts profound effects on the growth and flowering of many plant species, and manipulation of daylength is essential for scheduling several greenhouse crops. Under natural conditions, the duration of daylight varies considerably over the Earth’s surface, and is dependent on season and latitude. The duration of daylight for 67°44’N (the Kola Peninsula) (Figure 1) is presented in Table 1. At this latitude, the duration of daylength during the vegetation season (May-September) varies from about 18 hours the early May to 24 hours in June and early July and 12 hours in late September. The polar day, when the Sun remains visible at midnight, lasts at these latitudes about 50 days (from late May to mid-July) (Figure 2). This natural phenomenon occurs in the summer months in places north of the Arctic Circle or south of the Antarctic Circle. Moreover, at these latitudes the period when civil twilight lasts all night (also referred as white night) takes place almost a month before the beginning of the polar day and as many after. At this time the Sun does not sink low below the horizon and darkness does not occur. It turns out that plants in this region are exposed to continuous lighting (CL) for more than 3 months.
However, too much light can be harmful to plants as it significantly reduces the efficiency of photosynthesis which can lead to photoinhibition causing damage to photosystem II (PSII) [1]. Long photoperiods can also be harmful to plants. While the photoperiodic threshold is different for each plant species, generally, photoperiods longer than 17 hours can cause leaf damage observed as interveinal chlorosis and plants grown under CL tend to have higher carbohydrate and reactive oxygen species (ROS) levels which may lead to down-regulation of photosynthesis [2,3]. Theoretically, the implementation of CL strategy can increase yield if photoperiod-related injury is prevented [4,5]. Long photoperiods of lower light intensities could be used to achieve the desired daily light integral (DLI) with lower installed light capacity/capital costs and low electricity costs in regions with low night electricity prices [6]. Therefore, the application of CL in controlled environment agriculture (CEA) is a particular issue of interest to both plant scientists and commercial plant producers [7].
The underlying mechanism of CL-injury is unknown. Current hypotheses include (a) a mismatch between the endogenous circadian rhythm and exogenous environmental cues [8,9], (b) improper gene expression [10,11], and (c) over-accumulation of photosynthetic products leading to feedback inhibition [7,12,13]. Without question, growth under CL can cause plants to undergo a stress response. However, the extent to which the abiotic factor causing the stress response becomes harmful to the plant as opposed to beneficial is difficult to quantify [6].
The number of hours during which the Sun is visible (black line). From bottom (most yellow) to top (most gray) the color bands indicate: full daylight, twilight (civil, nautical, and astronomical) and full night.
The use of artificial light generates light environments that are usually very different from the natural, sunlight-illuminated environments under which plants originally evolved [8]. Plants growing in natural environments experience diurnal fluctuations in irradiance and light quality, with gradual shifts between light and dark at dawn and dusk [14,15]. In contrast, experiments in controlled environment chambers typically expose plants to a constant irradiance during the day, and abrupt transitions between light and dark at dawn and dusk. Growth chambers do offer some advantages: the experiments are easily reproducible and allow responses to a single factor (e.g., day length, irradiance, or temperature) to be investigated [16,17]. In the strict sense, CL does not naturally occur [3], not even during the summer in arctic regions, because during the polar day considerable variations in light intensity and spectral distribution take place. However, for simplicity, we will refer to the lighting conditions during the polar day as CL.
In this study, we conducted an experiment to test the effect of CL on the responses of three native and three non-native to Subarctic plant species (Figure 3). We assumed that native plants have evolved over thousands of years to be adapted to specific lighting conditions of the northern polar region. Non-native plants were introduced to the Polar Alpine Botanic Garden (67°38′N), which is one of the three botanical gardens in the world located beyond the Arctic Circle. They originated from regions where CL conditions never exist and therefore should not have been adapted to CL. Thus, we observed plants that grew under natural CL during the polar day and plants that were placed in controlled environment chambers with 24 h photoperiod. We asked the following questions: (1) How does CL impact plant physiology, photosynthetic and stress response? (2) Does the impact of CL depend on the source of light and other environmental factors (natural vs artificial)? (3) Do responses to CL differ for native and non-native plant species in the Subarctic and, if differences exist, what physiological reasons might they be associated with?
2. Results
2.1. Plants under Artificial Lighting
Plants grown in climate chambers and treated by A-CL had significantly lower values of potential quantum yield of photochemical activity of PSII (Fv/Fm) compared to A-16 h plants (Table 2). Values of Fv/Fm varied between 0.691 and 0.806 for A-CL plants.
Leaf mass per area (LMA) values were much greater in A-CL plants than in their A-16 h counterparts. LMA values of A-CL-treated plants were 7-53% higher for native species and 52-66% for non-native species (Table 2).
Total chlorophyll (Chl) content was decreased in A-CL-treated plants by 9-38% in native and 19-53% in non-native plant species. Carotenoids were little affected by A-CL in native plant species, but their content decreased in non-native G. coccineum and P. atrosanguinea. A-CL increased Chl a/b ratio and decreased Chl/carotenoids ratio in plants, although not all the differences were significant. Share of Chl in light-harvesting complex II (LHCII) was decreased by A-CL treatment in G. sylvaticum, G. rivale and P. atrosanguinea.
All plants grown under A-CL had higher H2O2 content compared to A-16 h plants. Thus, it increased by 39-138% in native and by 37-68% in non-native plants (Table 2). The intensity of lipid peroxidation was also higher in these plants. The MDA content increased by 27-93% in native and by 45-88% in non-native plant species. Besides, they had higher flavonoid and anthocyanin contents. Native and non-native plants had 27-83% and 5-56% higher content of flavonoids, correspondingly. Anthocyanin content showed a broad range of species-specific variation. The A-CL-induced increase in anthocyanins content varied between 18% in P. erecta to 5.3- and 8-fold increase in G. sylvaticum and P. atrosanguinea.
Analysis of the daily course of stomatal conductance (gs) of plants showed that after two weeks of exposure to A-CL under constant temperature and air humidity the variation range of gs significantly decreased compared to that at A-16 h treatment by 2.6-6 times. The maximum and minimum gs values in the daily cycle of A-16 h and A-CL plants are presented in the Table 3. As an example, the daily course of gs in P. atrosanguinea is shown on Figure 4. The other species demonstrated similar trends.
Exposure of plants to A-CL resulted in leaf injuries of varying degrees. In some plants, such as P. erecta and G. rivale the leaves demonstrated just slight degreening. Injuries of leaves of G. sylvaticum, G. himalayense, G. coccineum and P. atrosanguinea were seen as yellow discoloration with tissue necrosis along the margins. Some of the leaves of G. sylvaticum and G. coccineum have tuned rusty red (Figure 5).
2.1. Plants under Natural Lighting
Plants exposed to N-CL during the polar day did not have any visible leaf injuries. Much later, in August, when days were shorter, we observed age-dependent injuries that were similar to those seen on A-CL-treated leaves (Figure 6).
During the polar day N-CL plants had significantly similar or slightly lower values of Fv/Fm compared to N-16 h plants (Table 4). However, the lowest recorded value of Fv/Fm was 0.794, which means that the PSII rection centers were not damaged and N-CL-induced photoinhibition did not occur either in native or non-native plants.
Leaf mass per area (LMA) values were higher by 7-52% and 12-56% in N-CL-treated native and non-native plants, correspondingly, than in their N-16 h counterparts (Table 4).
All N-CL plants showed a decreased in Chl content to varying degrees, although the most pronounced decrease was observed in non-native plant species (Table 4). N-CL-induced increase in Chl a/b and decrease in the share of Chl in LHCII were recorded for all plant species. Carotenoid content was decreased by N-CL by 15-26% in native plant species and by 40-86% in non-native plants. The ratio Chl/carotenoids was little affected by N-CL in native plants, but significantly decreased in non-native plants.
All plants grown under N-CL had higher H2O2 content compared to A-16 h plants. It increased by 22-47% in native plants and by 3-90% in non-native plants (Table 4). The MDA content increased by 7-22% in native and by 6-22% in non-native plant species.
Flavonoid content changes in response to N-CL significantly varied between plants in a species-specific manner. For instance, N-CL reduced their content by 20% in G. hymalayense, but increased by 70% in P. erecta (Table 4).
Under natural conditions, the daily course of stomatal activity did not differ significantly between N-16 h and N-CL plants and the difference between maximum and minimum gs values in the daily cycle was only 2-12% smaller in N-CL plants (Table 3). It means that under polar day conditions natural CL did not make the sinusoidal pattern of the daily course of gs to be flatter as the artificial CL in climate chambers did. The differences between aboriginal plant species and introduced plants were species-specific in nature and did not allow to identify any pattern.
3. Discussion
In this study we investigated plant responses to CL provided by artificial light sources and under natural conditions. Plants under study exposed to A-CL in the climate chamber where other parameters were held constant exhibited an entire spectrum of responses aimed at protection and adaptation to excessive illumination as were observed in many crop species exposed to artificial CL in growth chambers and PFALs [2,3,18,19,20,21,22,23,24,25,26,27,28,29,30,31,32,33,34,35,36]. These included degreening, higher Chl a/b ratio, lower Chl/carotenoid ratio and lower relative chlorophyll content in the LHCII compared to plants grown under 16 h photoperiod. Elevated H2O2 and MDA levels indicated the development of oxidative stress in these plants, and the increased antioxidant capacity was insufficient to cope with the oxidative stress induced by A-CL. The contents of flavonoids and anthocyanins which protect plant tissues from excess radiation were increased. In our experiments A-CL-treated plants had greater DLI compared to plants grown under A-16 h conditions (21.6 and 14.4 mol/(m2 day), correspondingly) and therefore the enhancement of photoprotective mechanisms was rather expected. Some decrease in Fv/Fm values was also observed, suggesting a possible decrease in photosynthetic activity, although most species showed an increase in LMA values, indicating an accumulation of assimilates in leaves, presumably as a result of their hindered export under CL conditions due to an imbalance between source and sink strengths [3,10,18,35]. Exposure to CL means plants are under constant photon pressure which continuously drives photosynthesis. Constant photosynthesis means continuous production of photosynthetic products such as soluble sugars and starch [13,36].
Excessive accumulation of carbohydrates can cause damage to chloroplast membranes, which inevitably leads to a downregulation of photosynthesis through a feedback mechanism caused by over-reduction of the electron transport chain components [37,38]. Many authors also believe that the accumulation of photosynthetic products during CL affects the expression of genes involved in the control of photosynthesis, and ultimately this leads to complete or partial inhibition of this process [39,40,41,42].
Under natural conditions during the polar day leaves of N-CL plants looked healthy, but later in August we observed changes in leaves associated with senescence (Figure 6). The symptoms were similar to those observed on A-CL leaves (Figure 5). Color changes of aging leaved were due to progressive loss of Chl coinciding with the partial retention of carotenoids, new synthesis of anthocyanins and the formation of dark oxidation products of phenolics. Thus, leaf photodamages induced by A-CL were actually symptoms of accelerated leaf senescence. Although the regulation of leaf senescence is age dependent it is heavily influenced by internal and environmental stimuli. It is thought that one of the processes that is involved in the control and response to senescence regulatory networks is that of sugar status. A high level of sugar in plants has been shown to both decrease the levels of photosynthetic activity and to initiate the senescence process. Our results are consistent with other research results [10,43,44,45] suggesting that a higher nighttime light intensity without a change in spectrum can raise the carbohydrate levels in plants and accelerate leaf senescence that are associated with CL-injury.
Why were the leaves not injured by N-CL during the polar day? Velez-Ramirez et al. [3] rightly noted that in the strict sense, CL does not naturally occur. In natural conditions even during the polar day in the absence of complete darkness light intensity and spectral distribution considerably vary. Irradiance from sunlight changes in a sinusoidal manner during the day (Figure 7). As for the spectral fluctuations, it was shown long ago that they set the circadian clock of arctic birds [46]. Great difference between spectral quality of artificial and natural light may be one of the reasons why plants did not become injured under N-CL. Artificial lighting produce light spectra with very uneven wavelength distributions, with sharp peaks around the main emission wavelengths and little or no light in between. In contrast, the visible light spectrum of sunlight is much more homogeneous [47]. Earlier experiments have shown that if CL was partially or totally provided by solar light, the injury was reduced or even absent [2,3,18,48,49]. Thus, the question was risen if the CL-induced injury is caused by the continuity of light itself or by an interaction between photoperiod and light spectral distribution?
We add to this that temperature fluctuations under CL can also set the circadian clock in plants under artificial CL [2,3,18,24,25,36,44,53]. As is known, in natural conditions the temperature fluctuates during the day/night cycle, whereas in most experiments in climate chambers the temperature is maintained at a constant level. Thus, results of CL treatments when other environmental parameters are held constant should be interpreted taking proper care.
It was shown by many authors that plants grown in controlled environments can show significantly different phenotypes from plants of the same genotype grown in more natural conditions or in the field [14,15,54,55,56]. However, the lack of information does not allow us to clearly judge which of the parameters that distinguish the natural and artificial environments have the greatest impact on plant metabolism and growth [47]. A unique series of experiments was carried out in the 1930s-1960s by the founders and first researchers worked for the Polar-Alpine Botanical Garden in (KPABG, Kirovsk, Russia, 67°38’ N). They studied responses to CL during the long polar day in indigenous plants and plants that were introduced from other parts of the world. Non-native plants were brought over for agricultural, medicinal and ornamental purposes. In order to exclude the influence of other environmental factors, plants were tested under either natural day length (24 hours) or shortened day length (8, 10, 12 or 14 hours). Daylight hours were shortened by shading using specially designed photoperiodic cabins that moved along rails. The cabin area was 6 m2, the height was 1.2 m. As many as 37 species of trees and shrubs and 21 species of herbaceous plants were tested. The effects of the long summer daylight on transpiration, photosynthesis, chemical composition, mineral uptake as well as rhythms of growth and development were investigated and reported. The reports on the experiments conducted have been preserved and are currently available in the archives of the Kola Research Center of the Russian Academy of Sciences. We did not find any mention of leaf injuries due to CL in them, although a slight change in color was sometimes noted. It is what we also observed in our research.
It is known that exposure of plants to CL can significantly increase the photo-oxidative stress [2,3]. ROS are a normal by-product of photosynthesis, but when generated in large quantities during periods of high irradiance or prolonged light exposure (e.g., CL), they can be harmful to plants. In particular, excessive ROS accumulation can cause severe and irreversible DNA damage leading to cell death [57]. ROS can also be used as a signaling molecule to alert the plant to stressful conditions such as high or prolonged light. Thus, a normal balance between ROS production and scavenging can maintain homeostasis since ROS accumulation can initiate expression of genes whose products are involved in cellular detoxification [57]. Plants with naturally higher levels of antioxidants and enzymes that scavenge ROS have been shown to suffer less damage when exposed to long photoperiods, even CL [29]. Therefore, it is suggested that the ability to eliminate excess ROS may also play an important role in preventing CL damage based on their role in photooxidative stress [58]. In our study, native plants exposed to CL had higher (by 30-80%) content of flavonoids compared to their non-native counterparts. Under N-CL plants generally had more flavonoids than under N-16 h conditions. Flavonoids are a numerous and widespread group of phenolic compounds in the plant kingdom [59]. Due to their pronounced antioxidant properties, they participate in the protection of plants from oxidative stress caused by adverse environmental influences. By absorbing ultraviolet radiation (330–350 nm) and some visible rays (520–560 nm), flavonoids protect plant tissues from excess radiation. Thus, the obtained experimental data indicate the participation of flavonoids in plant adaptation to CL. Apparently, the role of flavonoids in the mechanism of the photosynthetic apparatus protection from photodamage under CL conditions is greater in native to Subarctic plants compared to introduced plants. This supports the hypothesis that the qualitative and quantitative composition of flavonoids accumulated by plants is closely related to the origin and evolution of a particular species. By conducting this comparative analysis, our research offers valuable insights into the optimal lighting conditions necessary for the successful cultivation of plants in CEA. Sinusoidal LED light recipes instead of square wave light regimes may be of interest for optimizing indoor lighting regimes to more closely match the requirements of the crop in order to maximize photosynthetic efficiency and consequently marketable yield.
4. Materials and Methods
4.1. Plant Material
We selected three native plant species (Geranium sylvaticum L., Geum rivale L., Potentilla erecta (L.) Raeusch.), which are common in Subarctic woods, and three non-native plant species (Geranium himalayense Klotzsch, Geum coccineum Sibth. & Sm., Potentilla atrosanguinea Loddiges ex D. Don) that were introduced in Polar-Alpine Botanic Garden (KPABG), the Kola Scientific Center, Russian Academy of Sciences, Kirovsk, Russia (67°38′N) (Figure 2) and commonly used in city landscaping in Subarctic. Geranium himalayense and Potentilla atrosanguinea are native to Himalayas. Geum coccineum is native to the mountains of the Balkans. They are all herbaceous perennials that belong to Geraniaceae and Rosaceae families. Species selection was done to match congeneric pairs of native and non-native plant species.
4.2. Experimental Design
In the natural environment, measurements of physiological and biochemical parameters were carried out at the peak of the polar day (in the end of June), when the plants were illuminated continuously, and in the second decade of August, when the day length was about 16 hours.
Five plants of each of the three species pairs were placed into containers with soil and grown for a month in the climate chamber (Vötsch, Germany) at 16 h photoperiod, light intensity of 250 μmol m-2 s-1, temperature of 23°C, air humidity of 70±5%. Then, some of the plants were grown for two weeks under the same conditions, but 24 h photoperiod. Light was provided by cool-white fluorescent tubes supplemented with red-enhanced fluorescent tubes. The PPFD value was measured using LI-250A Light Meter (Li-COR Biosciences, Lincoln, NE, USA).
Thus, experimental groups included 3 species pairs exposed to 1) natural 16 h photoperiod (N-16 h), 2) natural CL (N-CL), 3) artificial 16 h photoperiod (A-16 h) and 4) artificial CL (A-CL).
4.3. Leaf Mass per Area
Five fully expanded leaves of five plants from each experimental group were sampled. Eight discs were cut from each leaf with an 8-mm diameter cork borer. The dry weight of the discs was determined after their drying to a constant weight at 105°C. The values of leaf mass per area (LMA) were calculated as the ratio of a dry mass of the lamina discs to their area.
4.4. Chlorophyll Fluorescence Measurements
Chlorophyll fluorescence parameters of the plants were measured using a Pulse Amplitude Modulation Fluorometer (MINI-PAM, Heinz Walz, Germany). The values of potential quantum yield of photochemical activity of PSII (Fv/Fm) were determined after leaves were dark-adapted for 30 min with leaf clips.
4.5. Stomatal Conductance Measurements
Stomatal conductance (gs) was measured using a steady state leaf porometer (SC1, Decagon Devices Inc., Pullman, WA, USA). The diurnal course of gs was measured every 3 hour during 3 days, from one of the topmost fully expanded leaf. Leaves used for measurements were tagged for repeated measurements. All the measurements were done on the abaxial side of the leaves.
4.6. Photosynthetic Pigment Analysis
The content of chlorophyll a and b and carotenoids was measured in 96% ethanol extracts with a SF2000 spectrophotometer (Spectrum, St. Petersburg, Russia) and calculated according to the known formulas [60]. The percentage of Chl in light-harvesting complex II (LHCII) was calculated by accepting that almost all chloropyll b is in LHCII and that the ratio of chlorophyll a/b in LHCII is 1.2 [61].
A SPAD-502 Plus chlorophyll meter (Konica Minolta Optics, Japan) was used to determine a chlorophyll content index (CCI).
4.7. Anthocyanins and Flavonoids Content
Anthocyanins were extracted from leaves, according to Kang et al. [62]. Fresh samples (0.1 g) were homogenized in 4 mL of 95% ethanol-1.5 N HCl- (85:15, v:v). After overnight extraction at 4°C in darkness, each sample was centrifuged at 10,000× g for 5 min. The absorbance of the supernatant was measured at 530 nm (peak of absorption of anthocyanin) and 657 nm (peak of absorption of chlorophyll degradation products). The results were plotted as a difference in absorption at 530 and 657 nm relative to tissue fresh weight (∆A∙g−1 FW), and the formula ∆A = A530 − 1/4A657 was used to deduct the absorbance contributed by chlorophyll and its degradation products in the extract [63].
4.8. Malondialdehyde (MDA) Content
The content of malondialdehyde (MDA), the end product of lipid peroxidation, was determined with a standard method based on the reaction of these substances with thiobarbituric acid (TBA) that produces a trimethine complex with an absorption maximum at 532 nm [67]. The value for nonspecific absorption of each sample at 600 nm was also recorded and subtracted from the absorbance recorded at 532 nm. The concentration of MDA was calculated using an extinction coefficient of 155 mM−1 cm−1. The lipid peroxidation levels were expressed as micromoles of MDA per gram of FW.
4.9. Hydrogen Peroxide Content
Hydrogen peroxide content was determined according to Velikova et al. [68]. Leaf tissues (0.1 g) were homogenized in an ice bath with 2 mL 0.1% (w/v) TCA. The homogenate was centrifuged at 12,000× g for 15 min at 4 °C and 0.5 mL of supernatant was added to 0.5 mL potassium phosphate buffer (pH 7.0) and 1 mL 1M KI. The absorbance of the supernatant was measured at 390 nm. The content of H2O2 was calculated by comparison with a standard calibration curve and expressed in µmol g−1 FW.
4.10. Data Analysis
Five plants per treatment were employed in the experiment. The tables and figures show mean values and standard errors. Significant differences between the means were revealed at p < 0.05 using the least significant difference test.
5. Conclusions
This research presents a novel approach by examining the specific effects of different lighting environments on plants of different origin. While previous studies have addressed aspects of responses of important crops to long photoperiods including CL under controlled climate conditions with artificial lighting, there was a lack of comprehensive research comparing natural and artificial lighting. A comprehensive comparison between natural light and artificial lighting sources have shown that plants lack specific mechanisms of tolerance to CL. Protective responses in this case are non-specific and induced by developing photo-oxidative stress. Under constant environmental conditions artificial CL causes photodamage to leaves due to oxidative stress, the main cause of which is circadian asynchrony, i.e., a mismatch between the internal (endogenous) rhythms of the organism and external light-dark cycles [8].
In nature, during the polar day, plants avoid photodamage because, unlike under artificial conditions, endogenous rhythms are maintained by daily fluctuations in other environmental factors (light intensity, spectral distribution, and temperature), which can probably obviously also act as pacemakers. Among various non-specific defense mechanisms, plants actively use flavonoids to neutralize the increased amount of ROS generated by light. At the same time, the role of flavonoids in the photoprotection mechanism is obviously higher in local subarctic plants than in non-native ones. This not only indicates their special role under CL conditions, but also confirms the hypothesis that the qualitative and quantitative composition of flavonoids accumulated by plants is closely related to both the origin of a particular species and its evolution, during which those adaptive mechanisms that were distinguished by their simplicity, reliability, and efficiency were selected and consolidated.
Author Contributions
Conceptualization, T.S.; methodology, T.S. and E.S.; formal analysis, investigation, T.S., E.S., A.R., N.S; writing—original draft preparation, T.S.; writing—review and editing, T.S., E.S., A.R., N.S., A.T. All authors have read and agreed to the published version of the manuscript.
Funding
This research was funded by the state order for the Karelian Research Center, Russian Academy of Sciences (FMEN-2022-0004).
Data Availability Statement
The data presented in this study are available on request from the corresponding author.
Acknowledgments
This research was carried out using the equipment of the Core Facility of the Karelian Research Center of the Russian Academy of Science within the framework of. The authors express their deep gratitude to the colleages from Polar-Alpine Botanic Garfen - O.Y. Nosatenko for her assistance in collecting and identifying plant species and V.I. Moskaleva for her help in finding archival materials and thank E.A. Pulkacheva, A.V. Isakov and I.A. Levkin for their valuable assistance.
Conflicts of Interest
The authors declare no conflicts of interest.
References
- Barber, J.; Andersson, B. Too much of a good thing: light can be bad for photosynthesis. Trends Biochem. Sci. 1992, 17, 61–66. [Google Scholar] [CrossRef]
- Sysoeva, M.I.; Markovskaya, E.F.; Shibaeva, T.G. Plants under continuous light: A review. Plant Stress 2010, 4, 5–17. [Google Scholar]
- Velez-Ramirez, A.I.; van Ieperen, W.; Vreugdenhil, D.; Millenaar, F.F. Plants under continuous light. Trends Plant Sci. 2011, 16, 310–318. [Google Scholar] [CrossRef] [PubMed]
- Velez-Ramirez, A.I.; Heuvelink, E.; van Ieperen, W.; Vreugdenhil, D.; Millenaar, F. Continuous light as a way to increase greenhouse tomato production: Expected challenges. ISHS Acta Hortic. 2012, 956, 51–57. [Google Scholar] [CrossRef]
- Shibaeva, T.G.; Sherudilo, E.G.; Rubaeva, A.A.; Titov, A.F. Continuous LED lighting enhances yield and nutritional value of four genotypes of Brassicaceae microgreens. Plants 2022, 11, 1. [Google Scholar] [CrossRef]
- Lanoue, J.; St. Louis, S.; Little, C.; Hao, X. Photosynthetic adaptation strategies in peppers under continuous lighting: insights into photosystem protection. Front Plant Sci., 2024, 31, 15:1372886. [Google Scholar]
- Velez-Ramirez, A.I.; Carreño-Quintero, N.; Vreugdenhil, D.; Millenaar, F.F.; van Ieperen, W. Sucrose and Starch Content Negatively Correlates with PSII Maximum Quantum Efficiency in Tomato (Solanum lycopersicum) Exposed to Abnormal Light/Dark Cycles and Continuous Light. Plant Cell Physiol. 2017, 58, 1339–1349. [Google Scholar] [CrossRef]
- Velez-Ramirez, A.I.; Dunner-Planella, G.; Vreugdenhil, D.; Millenaar, F.F.; van Ieperen, W. On the induction of injury in tomato under continuous light: circadian asynchrony as the main triggering factor. Funct. Plant Biol. 2017, 44, 597–611. [Google Scholar] [CrossRef]
- Marie, T.R.J.G.; Leonardos, E.D.; Lanoue, J.; Hao, X.; Micallef, B.J.; Grodzinski, B. A perspective emphasizing circadian rhythm entrainment to ensure sustainable crop production in controlled environment agriculture: dynamic use of LED cues. Front. Sustain. Food Syst. 2022, 6. [Google Scholar] [CrossRef]
- Velez-Ramirez, A.I.; Van Ieperen, W.; Vreugdenhil, D.; van Poppel, P.M.; Heuvelink, E.; Millenaar, F.F. A single locus confer tolerance to continuous light and allows substantial yield increase in tomato. Nat. Commun. 2014, 5, 4549. [Google Scholar] [CrossRef]
- Inoue, K.; Araki, T.; Endo, M. Circadian clock during plant development. J. Plant Res. 2018, 131, 59–66. [Google Scholar] [CrossRef]
- Shibaeva, T.G.; Mamaev, A.V.; Titov, A.F. Possible Physiological Mechanisms of Leaf Photodamage in Plants Grown under Continuous Lighting. Russ. J. Plant Physiol. 2023, 70, 15. [Google Scholar] [CrossRef]
- Pham, M.D.; Hwang, H.; Park, S.W.; Cui, M.; Lee, H.; Chun, C. Leaf chlorosis, epinasty, carbohydrate contents and growth of tomato show different responses to the red/blue wavelength ratio under continuous light. Plant Physiol. Biochem. 2019, 141, 477–486. [Google Scholar] [CrossRef] [PubMed]
- Vialet-Chabrand, S.; Matthews, J.S.A.; Brendel, O.; Blatt, M.R.; Wang, Y.; Hills, A.; Griffiths, H.; Rogers, S.; Lawson, T. Modelling water use efficiency in a dynamic environment: an example using Arabidopsis thaliana. Plant Science 2016, 251, 65–74. [Google Scholar] [CrossRef] [PubMed]
- Vialet-Chabrand, S.; Matthews, J.S.A.; Simkin, A.J.; Raines, C.A.; Lawson, T. Importance of fluctuations in light on plant photosynthetic acclimation. Plant Physiology 2017, 173, 2163–2179. [Google Scholar] [CrossRef]
- Jänkänpää, H.J.; Mishra, Y.; Schröder, W.P.; Jansson, S. Metabolic profiling reveals metabolic shifts in Arabidopsis plants grown under different light conditions. Plant Cell Environ. 2012, 35, 1824–1836. [Google Scholar] [CrossRef]
- Poorter, H.; Fiorani, F.; Pieruschka, R.; Wojciechowski, T.; Van der Putten, W.H.; Kleyer, M.; Schurr, U.; Postma, J. Pampered inside, pestered outside? Differences and similarities between plants growing in controlled conditions and in the field. New Phytol/ 2016, 212, 838–855. [Google Scholar] [CrossRef]
- Demers, D.A.; Gosselin, A. Growing greenhouse tomato and sweet pepper under supplemental lighting: optimal photoperiod, negative effects of long photoperiod and their causes. Acta Hort. 2002, 580, 83–88. [Google Scholar] [CrossRef]
- Hillman, W.S. Injury of tomato plants by continuous light and unfavorable photoperiodic cycles. Amer. J. Bot., 1956, 43, 89. [Google Scholar] [CrossRef]
- Demers, D.A.; Dorais, M.; Wien, H.C.; Gosselin, A. Effects of supplemental light duration on greenhouse tomato (Lycopersicon exculentum Mill.) plants and fruit yields. Sci. Hort., 1998, 74, 295. [Google Scholar] [CrossRef]
- Matsuda, R.; Ozawa, N.; Fujiwara, K. Effects of continuous lighting with or without a diurnal temperature difference on photosynthetic characteristics of tomato leaves. Acta Hort., 2012, 956, 165. [Google Scholar] [CrossRef]
- Matsuda, R.; Yamano, T.; Murakami, K.; Fujiwara, K. Effects of spectral distribution and photosynthetic photon flux density for overnight LED light irradiation on tomato seedling growth and leaf injury. Sci. Hort 2016, 198, 363–369. [Google Scholar] [CrossRef]
- Haque, M.S.; Kjaer, K.H.; Rosenqvist, E.; Ottosen, C.O. Continuous light increases growth, daily carbon gain, antioxidants, and alters carbohydrate metabolism in a cultivated and a wild tomato species. Front. Plant Sci. 2015, 6, 522. [Google Scholar] [CrossRef] [PubMed]
- Haque, M.; de Sousa, A.; Soares, C.; Kjaer, K.H.; Fidalgo, F.; Rosenqvist, E.; Ottosen, C.-O. Temperature variation under continuous light restores tomato leaf photosynthesis and maintains the diurnal pattern in stomatal conductance. Front. Plant Sci., 2017, 8, 1602. [Google Scholar] [CrossRef]
- Ikkonen, E.N. ; Shibaeva,T.G.; Rosenqvist, E.; Ottosen, C.O. Daily temperature drop prevents inhibition of photosynthesis in tomato plants under continuous light. Photosynthetica, 2015, 53, 114. [Google Scholar] [CrossRef]
- Shibaeva, T.G.; Mamaev, A.V.; Sherudilo, E.G.; Titov, A.F. The role of photosynthetic daily light integral in plant response to extended photoperiods. Russ. J. Plant Physiol 2022, 69, 7. [Google Scholar] [CrossRef]
- Murage, E.; Watashiro, N.; Masuda, M. Leaf chlorosis and carbon metabolism of eggplant in response to continuous light and carbon dioxide. Sci. Hort 1996, 67, 27. [Google Scholar] [CrossRef]
- Murage, E.N.; Sato, Y.; Masuda, M. Influence of light quality, PPFD and temperature on leaf chlorosis of eggplants grown under continuous illumination. Sci. Hort 1997, 68, 73. [Google Scholar] [CrossRef]
- Murage, E.N.; Masuda, M. Response of pepper and eggplant to continuous light in relation to leaf chlorosis and activites of antioxidative enzymes. Scientia Hortic. 1997, 70, 269–279. [Google Scholar] [CrossRef]
- Lanoue, J.; Little, C.; Hao, X. The power of far-red light at night: photomorphogenic, physiological, and yield response in pepper during dynamic 24 hour lighting. Front. Plant Sci., 2022, 13, 857616. [Google Scholar] [CrossRef]
- Wolff, S.A.; Langerud, A. Fruit yield, starch content and leaf chlorosis in cucumber exposed to continuous lighting. Eur. J. Hortic. Sci., 2006, 71, 259. [Google Scholar]
- Wheeler, R.M.; Tibbitts, T.W. Utilization of potatoes for life support systems in space. I. Cultivar-photoperiod interaction. Am. Potato J. 1986, 63, 315. [Google Scholar] [CrossRef] [PubMed]
- Wheeler, R.M.; Tibbitts, T.W. Growth and tuberization of potato (Solanum tuberosum L.) under continuous light. Plant Physiol., 1986, 80, 801. [Google Scholar] [CrossRef] [PubMed]
- Cao, W.; Tibbitts, T.W. Physiological responses in potato plants under continuous irradiation. J. Am. Soc. Hort. Sci., 1991, 116, 525. [Google Scholar] [CrossRef]
- Dorais, M.; Gosselin, A. Physiological response of greenhouse vegetable crops to supplemental lighting. Acta Hort. 2002, 580, 59. [Google Scholar] [CrossRef]
- Matsuda, R.; Ozawa, N.; Fujiwara, K. Leaf photosynthesis, plant growth, and carbohydrate accumulation of tomato under different photoperiods and diurnal temperature differences. Scientia Hortic. 2014, 170, 150–158. [Google Scholar] [CrossRef]
- Foyer, C.H.; Neukermans, J.; Queval, G.; Noctor, G.; Harbinson, J. Photosynthetic control of electron transport and the regulation of gene expression. J. Exp. Bot. 2012, 63, 1637–1661. [Google Scholar] [CrossRef]
- Zhu, M.-D.; Chen, X.-L.; Zhu, X.-Y.; Xing, Y.-D.; Du, D.; Zhang, Y.-Y.; Lu, X.; Peng, S.-S.; He, G.-H.; Zhang, T.-Q. Identification and gene mapping of the starch accumulation and premature leaf senescence mutant ossac4 in rice. J. Integr. Agric. 2020, 19, 2150–2164. [Google Scholar] [CrossRef]
- Pammenter, N.W.; Loreto, F.; Sharkey, T.D. End product feedback effects on photosynthetic electron transport. Photosynthesis Res. 1993, 35, 5–14. [Google Scholar] [CrossRef]
- Van Gestel, N.C.; Nesbit, A.D.; Gordon, E.P.; Green, C.; Pare, P.W.; Thompson, L.; Peffley, E.B.; Tissue, D.T. Continuous light may induce photosynthetic downregulation in onion - consequences for growth and biomass partitioning. Physiologia Plantarum 2005, 125, 235–246. [Google Scholar] [CrossRef]
- Smith, A.M.; Stitt, M. Coordination of carbon supply and plant growth. Plant Cell Environ. 2007, 30, 1126–1149. [Google Scholar] [CrossRef] [PubMed]
- Stitt, M.; Lunn, J.; Usadel, B. Arabidopsis and primary photosynthetic metabolism - more than the icing on the cake. Plant J. 2010, 61, 1067–1091. [Google Scholar] [CrossRef]
- Cushman, K.E.; Tibbitts, T.W. The role of ethylene in the development of constant-light injury of potato and tomato. J. Am. Soc. Hort. Sci. 1998, 123, 239. [Google Scholar] [CrossRef]
- Cushman, K.E.; Tibbitts, T.W.; Sharkey, T.D.; Wise, R.R. Constant-light injury of potato: temporal and spatial patterns of carbon dioxide assimilation, starch content, chloroplast Integrity, and necrotic lesions. J. Amer. Soc. Hort. Sci. 1995, 120, 1032. [Google Scholar] [CrossRef]
- Lim, P.O.; Kim, H.J.; Nam, H.G. Leaf senescence. Annu. Rev. Plant Biol. 2007, 58, 115. [Google Scholar] [CrossRef] [PubMed]
- Krüll, F. The synchronizing effect of slight oscillations of light intensity on activity period of birds. Oecologia 1976, 25, 301–308. [Google Scholar] [CrossRef]
- Annunziata, M.G.; Apelt, F.; Carillo, P.; Krause, U.; Feil, R.; Mengin, V.; Lauxmann, M.A.; Köhl, K.; Nikoloski, Z.; Stitt, M.; Lunn, J.E. ; Getting back to nature: a reality check for experiments in controlled environments. J. Exp. Bot. 2017, 68, 4463–4477. [Google Scholar] [CrossRef]
- Arthur, J.M.; Guthrie, J.D.; Newell, J.M. Some effects of artificial climates on the growth and chemical composition of plants. Am. J. Bot. 1930, 17, 416–482. [Google Scholar] [CrossRef]
- Darrow, G.M. Tomatoes, berries and other crops under continuous light in Alaska. Science, 1933, 78, 370. [Google Scholar] [CrossRef]
- Tibbitts, T.W.; Bennett, S.M.; Cao, W. Control of continuous irradiation injury on potatoes with daily temperature cycling. Plant Physiol. 1990, 93, 409–411. [Google Scholar] [CrossRef]
- Cushman, K.E.; Tibbitts, T.W. Root-zone temperature effects on continuous irradiation injury on potato. HortScience 1991, 26, 745. [Google Scholar]
- Cao, W.; Tibbitts, T.W. Temperature cycling periods affect growth and tuberization in potatoes under continuous light. Hort. Sci., 1992, 27, 344–345. [Google Scholar]
- Yamashino, T.; Ito, S.; Niwa, Y.; Kunihiro, A.; Nakamichi, N.; Mizuno, T. Involvement of Arabidopsis clock-associated pseudo-response regulators in diurnal oscillations of gene expression in the presence of environmental time cues. Plant Cell Physiol. 2008, 49, 1839–1850. [Google Scholar] [CrossRef] [PubMed]
- Servaites, J.C.; Geiger, D.R.; Tucci, M.A.; Fondy, B.R. Leaf carbon metabolism and metabolite levels during a period of sinusoidal light. Plant Physiology 1989, 89, 403–408. [Google Scholar] [CrossRef]
- Geiger, D.R.; Shieh, W.J.; Lu, L.S.; Servaites, J.C. Carbon assimilation and leaf water status in sugar beet leaves during a simulated natural light regimen. Plant Physiology 1991, 97, 1103–1108. [Google Scholar] [CrossRef]
- Bruce, T.J.; Aradottir, G.I.; Smart, L.E.; Martin, J.L.; Caulfield, J.C.; Doherty, A.; Spark, C.A.; Woodcock, C.M.; Birkett, M.A.; Napier, J.A.; Jones, H.D.; Pickett, J.A. The first crop plant genetically engineered to release an insect pheromone for defence. Scientific Reports 2015, 5, 11183. [Google Scholar] [CrossRef]
- Huang, H.; Ullah, F.; Zhou, D.X.; Yi, M.; Zhao, Y. Mechanisms of ROS regulation of plant development and stress responses. Front. Plant Sci. 2019, 10, 800. [Google Scholar] [CrossRef]
- Kim, C.; Meskauskiene, R.; Apel, K.; Laloi, C. No single way to understand singlet oxygen signalling in plants. EMBO Rep. 2008, 9, 435–439. [Google Scholar] [CrossRef]
- Yonekura-Sakakibara, K.; Higashi, Y.; Nakabayashi, R. The Origin and Evolution of Plant Flavonoid Metabolism. Front. Plant Sci. 2019, 10, 943. [Google Scholar] [CrossRef]
- Lichtenthaler, H.K.; Wellburn, A.R. Determinations of total carotenoids and chlorophylls a and b of leaf extracts in different solvents. Biochem. Soc. Trans. 1983, 603, 591–592. [Google Scholar] [CrossRef]
- Lichtenthaler, H.K. Chlorophylls and carotenoids: Pigment of photosynthetic biomembranes. Methods Enzymol. 1987, 148, 350–382. [Google Scholar]
- Kang, J.H.; Sugumaran, K.; Atulba, S.L.S.; Jeong, B.R.; Hwang, S.J. Light intensity and photoperiod influence the growth and development of hydroponically grown leaf lettuce in a closed-type plant factory system. Hort. Environ. Biotechnol. 2013, 54, 501–509. [Google Scholar] [CrossRef]
- Meng, X.; Xing, T.; Wang, X. The role of light in the regulation of anthocyanin accumulation in Gerbera hybrid. Plant Growth Regul. 2004, 44, 243–250. [Google Scholar] [CrossRef]
- Nogues, S.; Backer, N.R. Effect of drought on photosynthesis in Mediterranean plants under UV-B radiation. J. Exp. Bot. 2000, 51, 1309–1317. [Google Scholar] [PubMed]
- Baroowa, B.; Gogoi, N. Biochemical changes in two Vigna spp. during drought and subsequent recovery. Ind. J. Plant Physiol. 2013, 18, 319–325. [Google Scholar] [CrossRef]
- Kolupaev, Y.E.; Fisova, E.N.; Yastreb, T.O.; Ryabchun, N.I.; Kirichenko, V.V. Effect of hydrogen sulfide donor on antioxidant state of wheat plants and their resistance to soil drought. Russ. J. Plant Physiol. 2019, 66, 59–66. [Google Scholar] [CrossRef]
- Heath, R.L.; Packer, L. Photoperioxidation in isolated chloroplasts I. Kinetics and stoichiometry of fatty acid peroxidation. Arch. Biochem. Biophys. 1968, 125, 189–198. [Google Scholar] [CrossRef]
- Velikova, V.; Yordanov, I.; Edreva, A. Oxidative stress and some antioxidant system in acid rain-treated bean plants: protective role of exogenous polyamines. Plant Sci. 2000, 151, 59–66. [Google Scholar] [CrossRef]
Figure 1.
Location of the study site. Polar-Alpine Botanic Garden (KPABG), Kirovsk, Russia (67°38′N).
Figure 1.
Location of the study site. Polar-Alpine Botanic Garden (KPABG), Kirovsk, Russia (67°38′N).
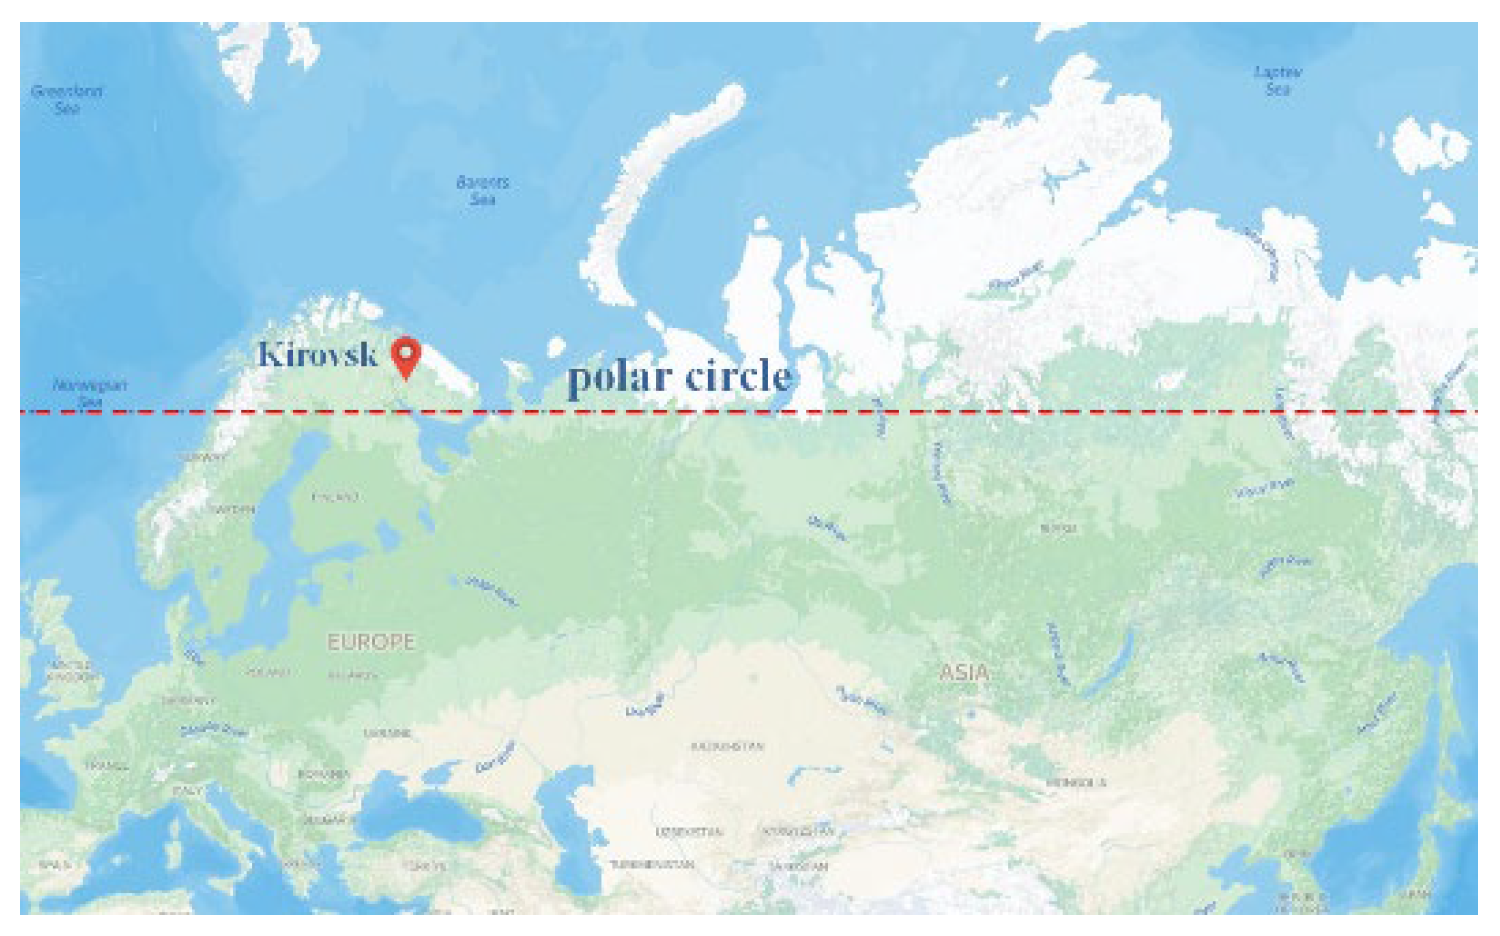
Figure 2.
Hours of daylight and twilight in Kirovsk (67°38′N) © WeatherSpark.com.

Figure 3.
Plants under study. Native to Subarctic plant species: (a) Geranium sylvaticum L., (b) Geum rivale L., (c) Potentilla erecta (L.) Raeusch.); non-native plant species: (d) Geranium himalayense Klotzsch, (e) Geum coccineum Sibth. & Sm., and (f) Potentilla atrosanguinea Loddiges ex D. Don.
Figure 3.
Plants under study. Native to Subarctic plant species: (a) Geranium sylvaticum L., (b) Geum rivale L., (c) Potentilla erecta (L.) Raeusch.); non-native plant species: (d) Geranium himalayense Klotzsch, (e) Geum coccineum Sibth. & Sm., and (f) Potentilla atrosanguinea Loddiges ex D. Don.
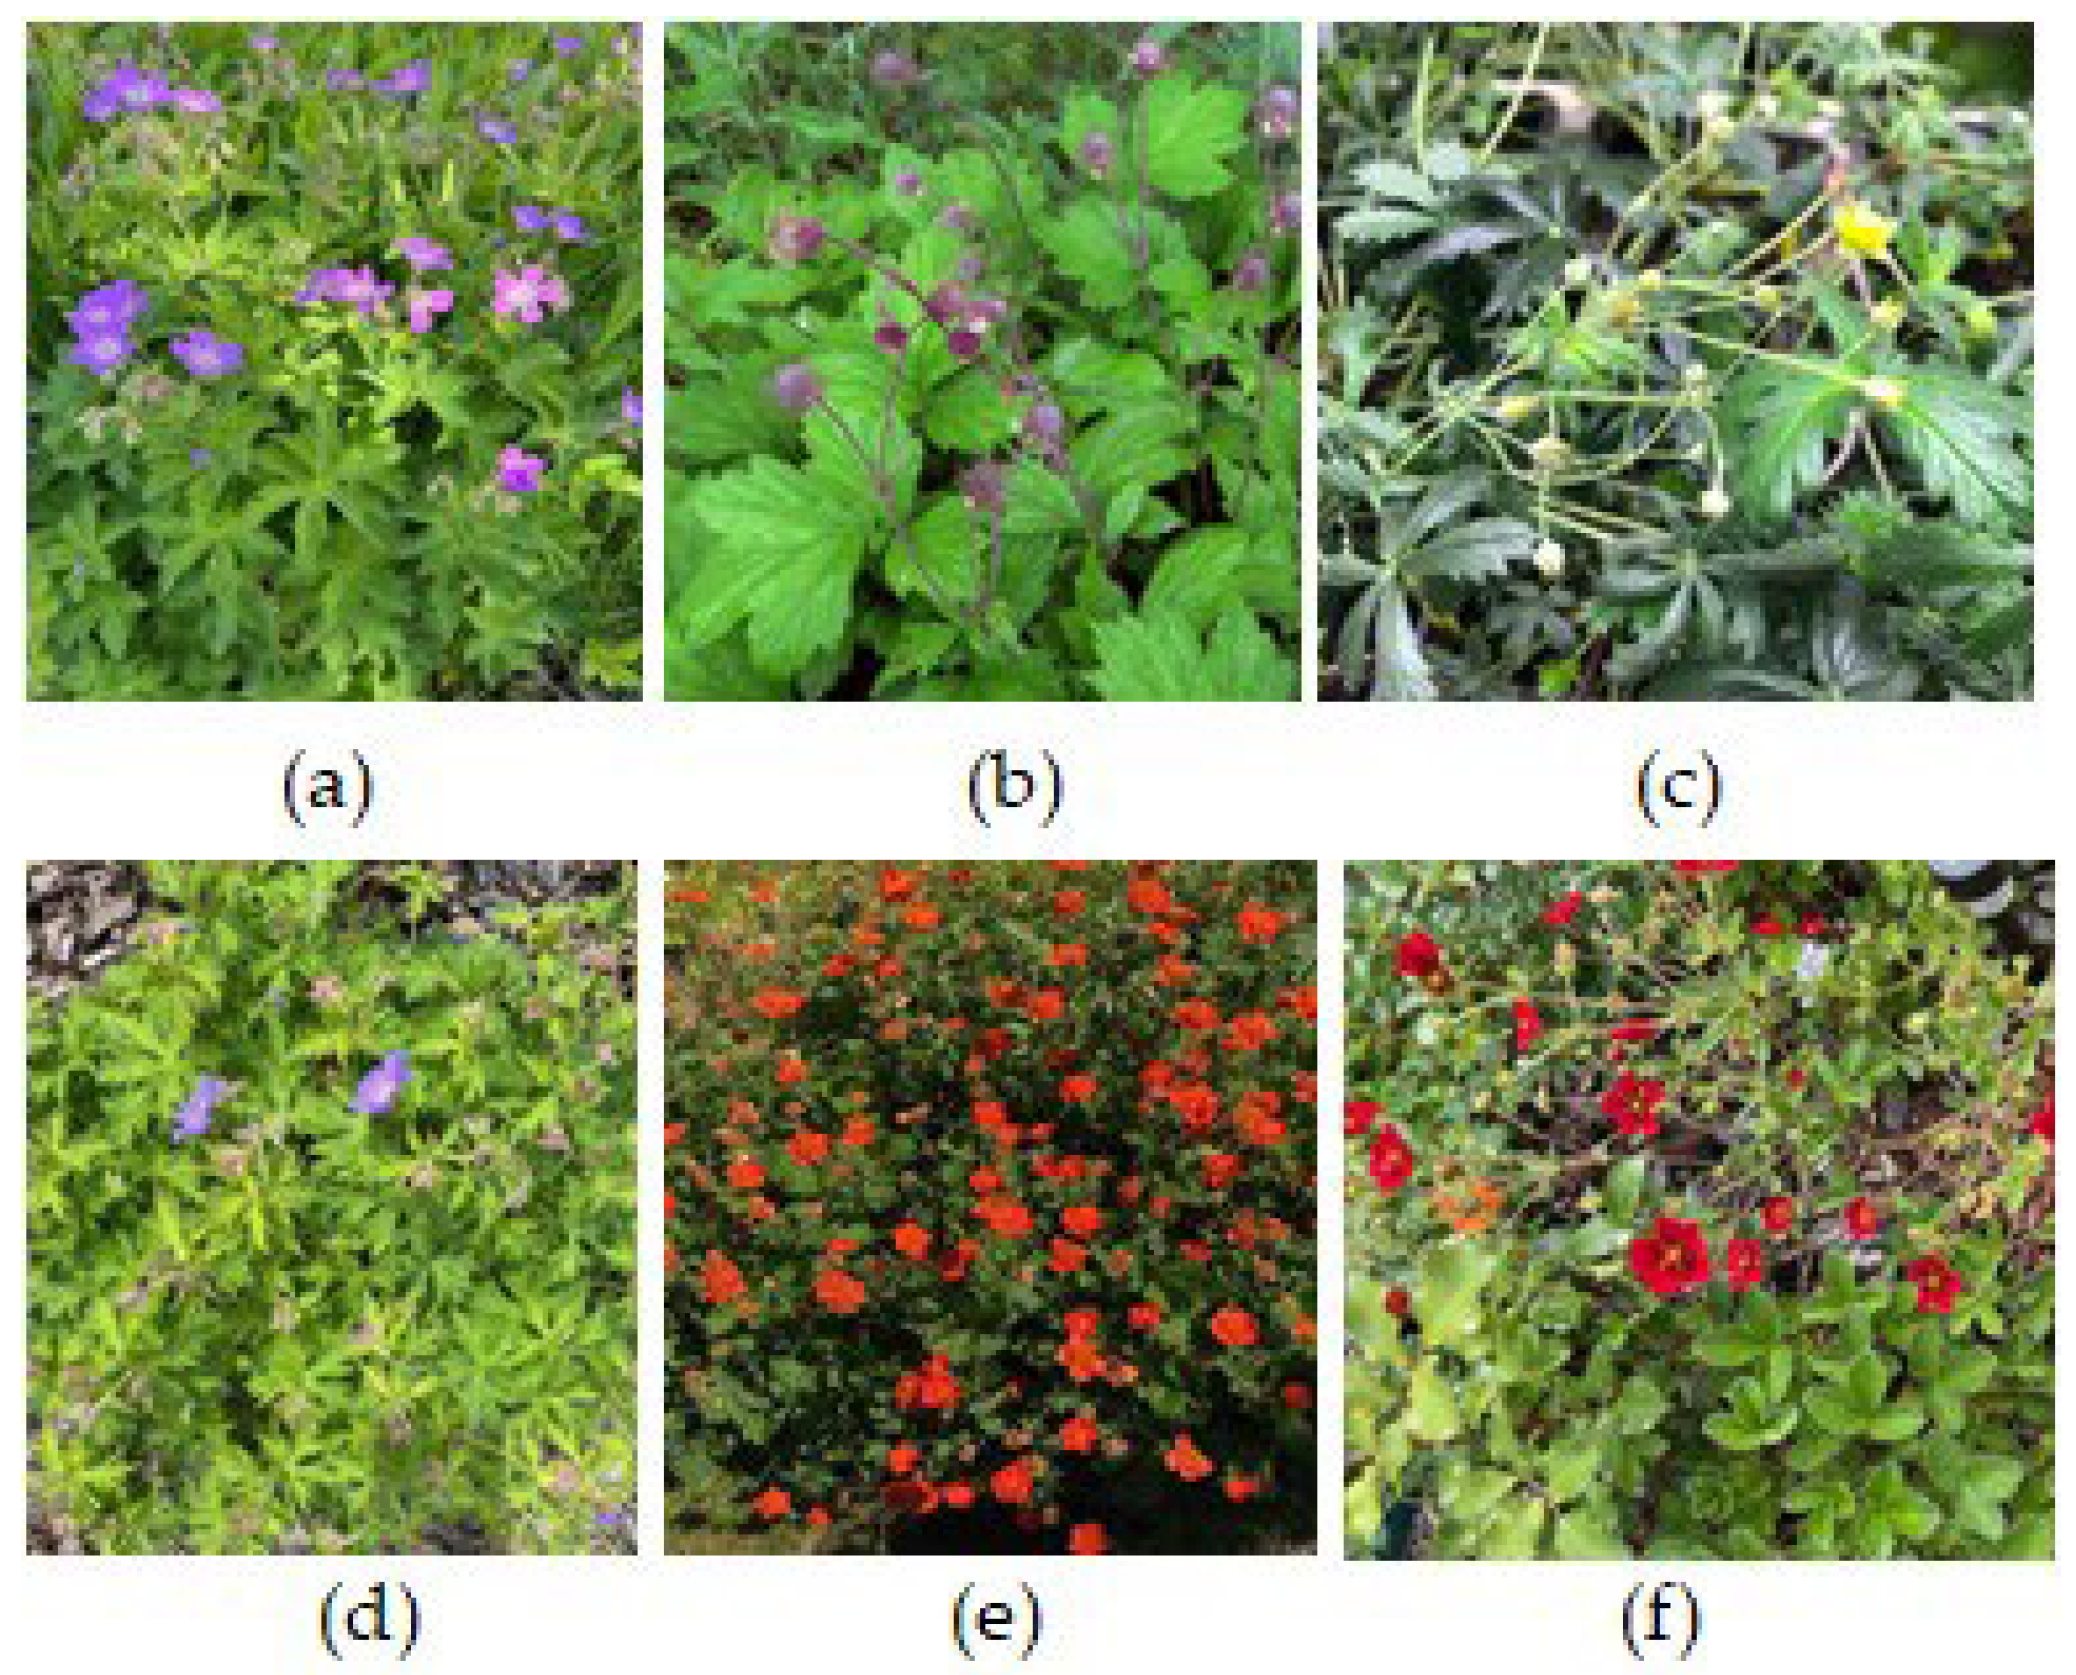
Figure 4.
The daily course of stomatal conductance of A-16 and A-CL leaves of Potentilla atrosanguinea.
Figure 4.
The daily course of stomatal conductance of A-16 and A-CL leaves of Potentilla atrosanguinea.
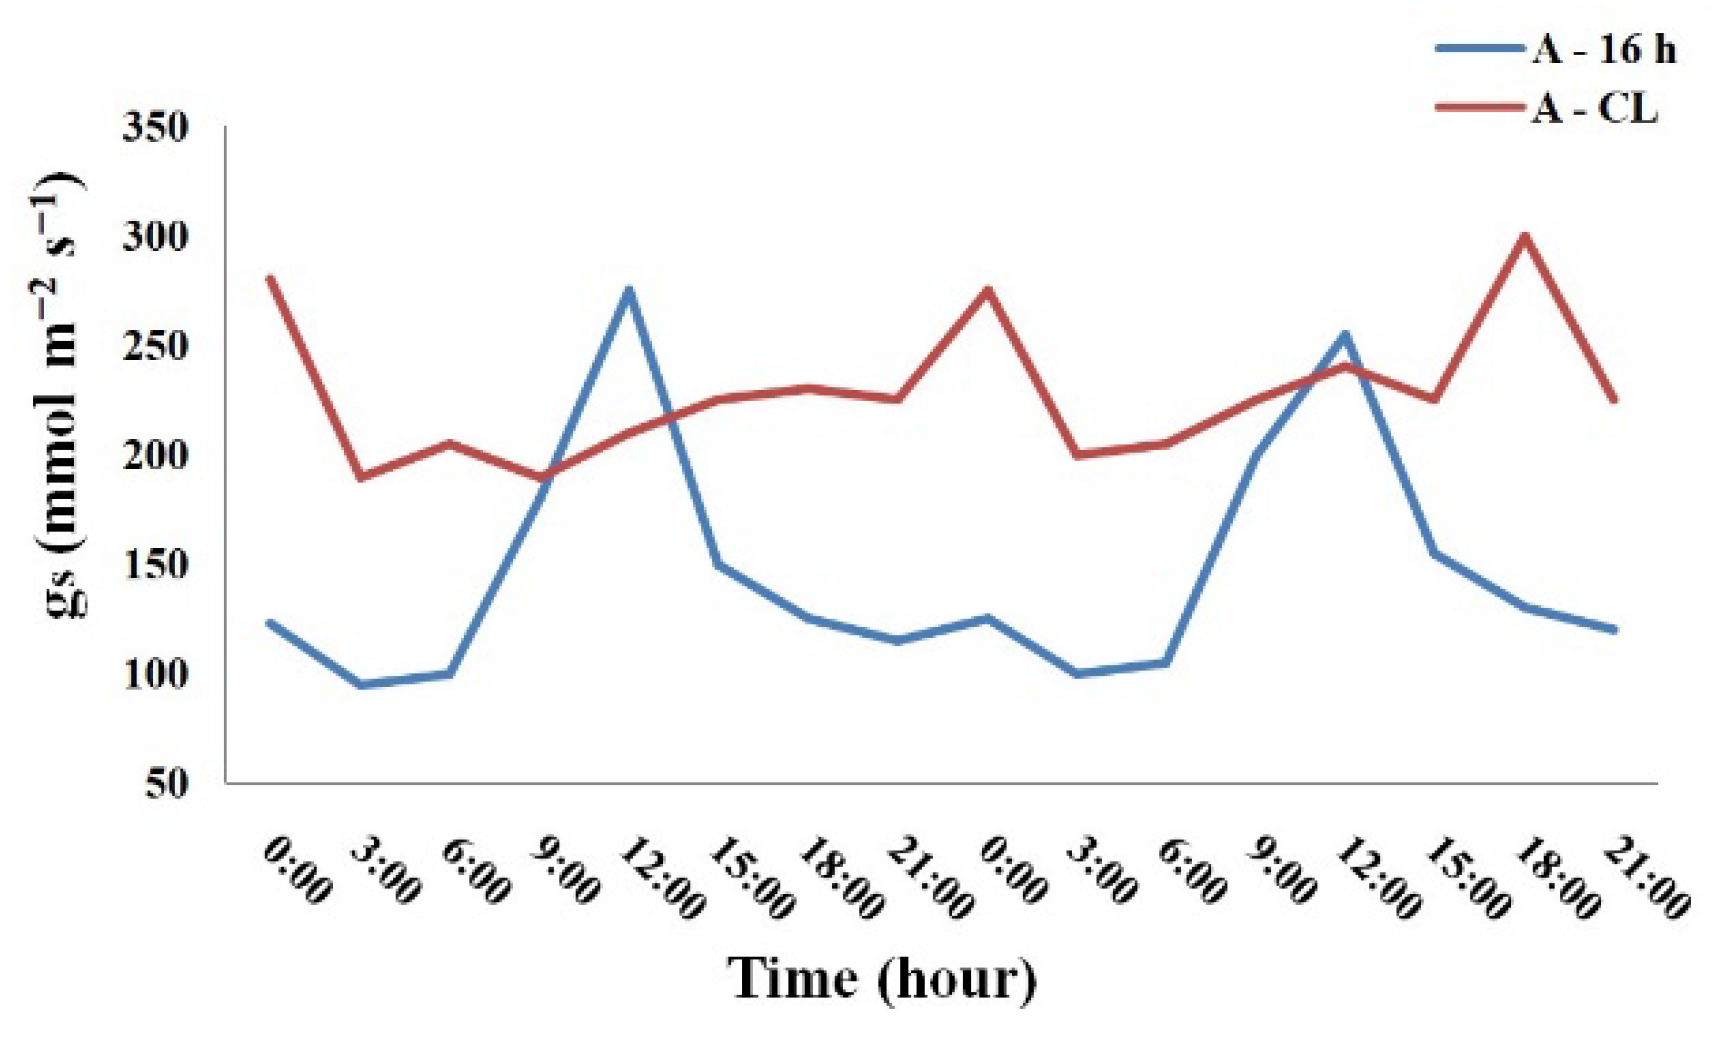
Figure 5.
Leaves of plants exposed to A-16 (top on (a), (c), (d), (e) and left on (b), (f)) and A-CL (bottom on (a), (c), (d), (e) and right on (b), (f)) for 2 weeks. (a) Geranium sylvaticum, (b) Geum rivale, (c) Potentilla erecta, (d) Geranium himalayense, (e) Geum coccineum and (f) Potentilla atrosanguinea.
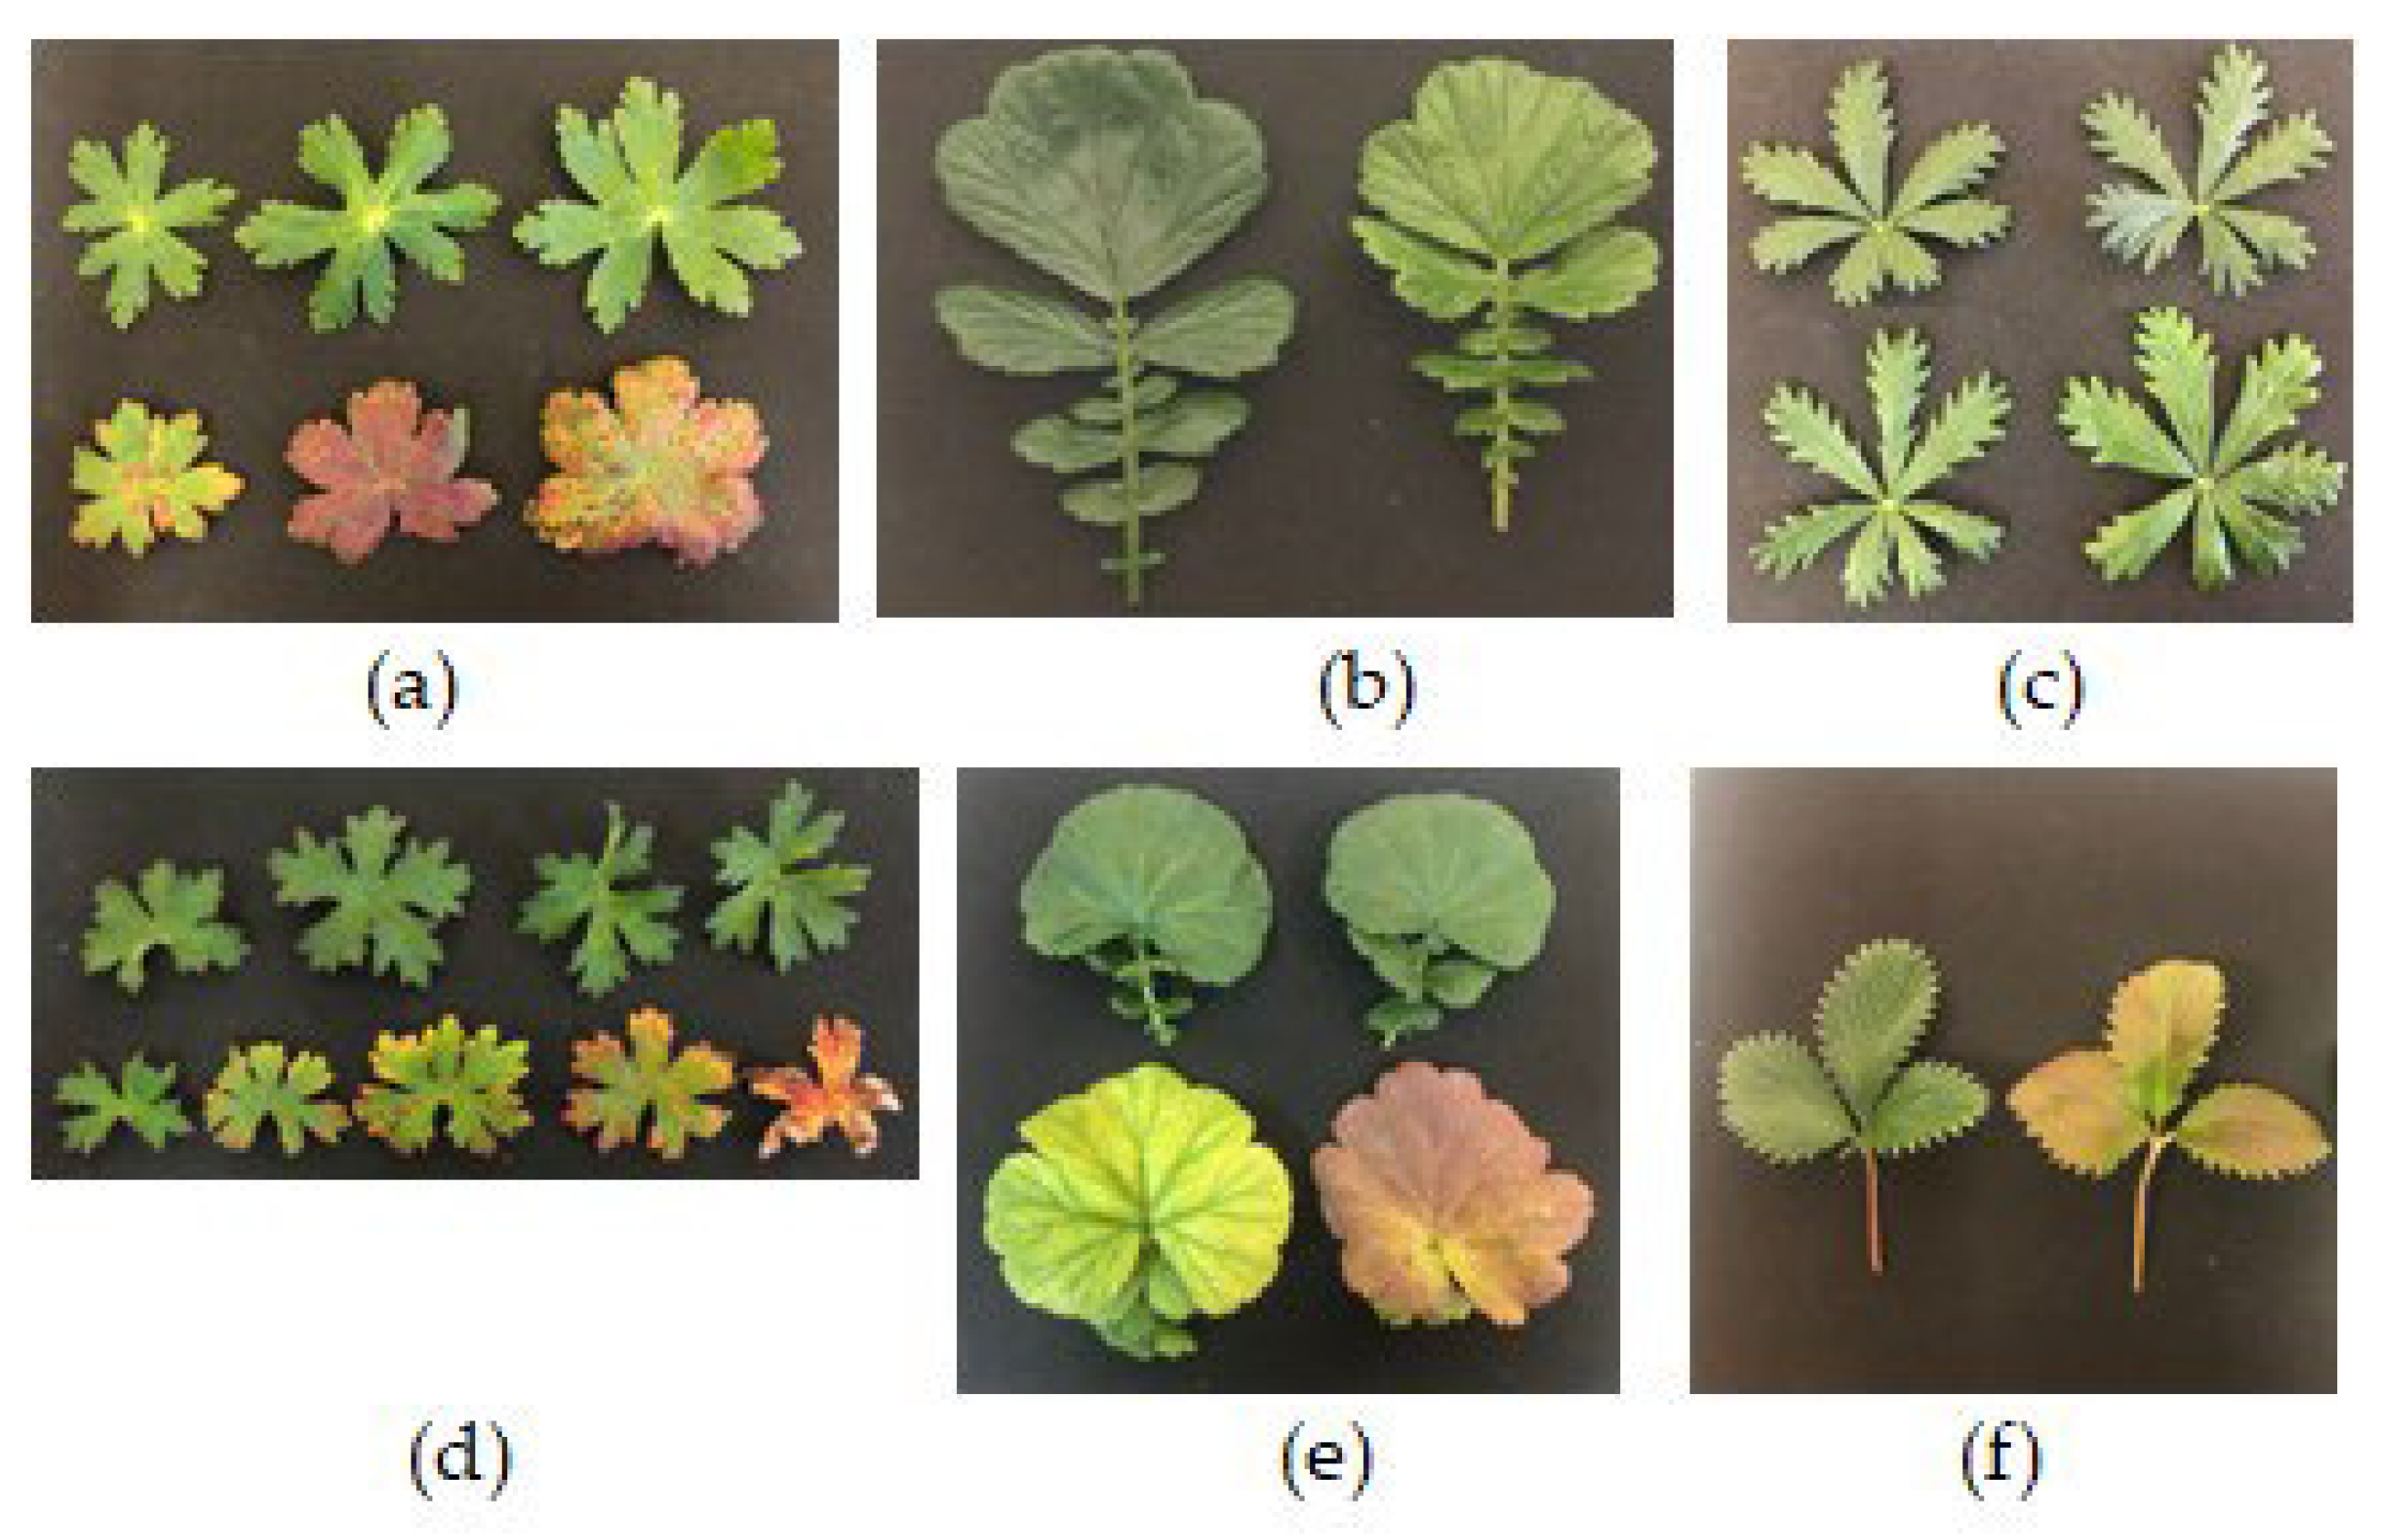
Figure 6.
Leaf color pattern in aging N-16 h leaves. (a) Geranium sylvaticum, (b) Geum rivale, (c) Potentilla erecta, (d) Geranium himalayense, (e) Geum coccineum and (f) Potentilla atrosanguinea.
Figure 6.
Leaf color pattern in aging N-16 h leaves. (a) Geranium sylvaticum, (b) Geum rivale, (c) Potentilla erecta, (d) Geranium himalayense, (e) Geum coccineum and (f) Potentilla atrosanguinea.
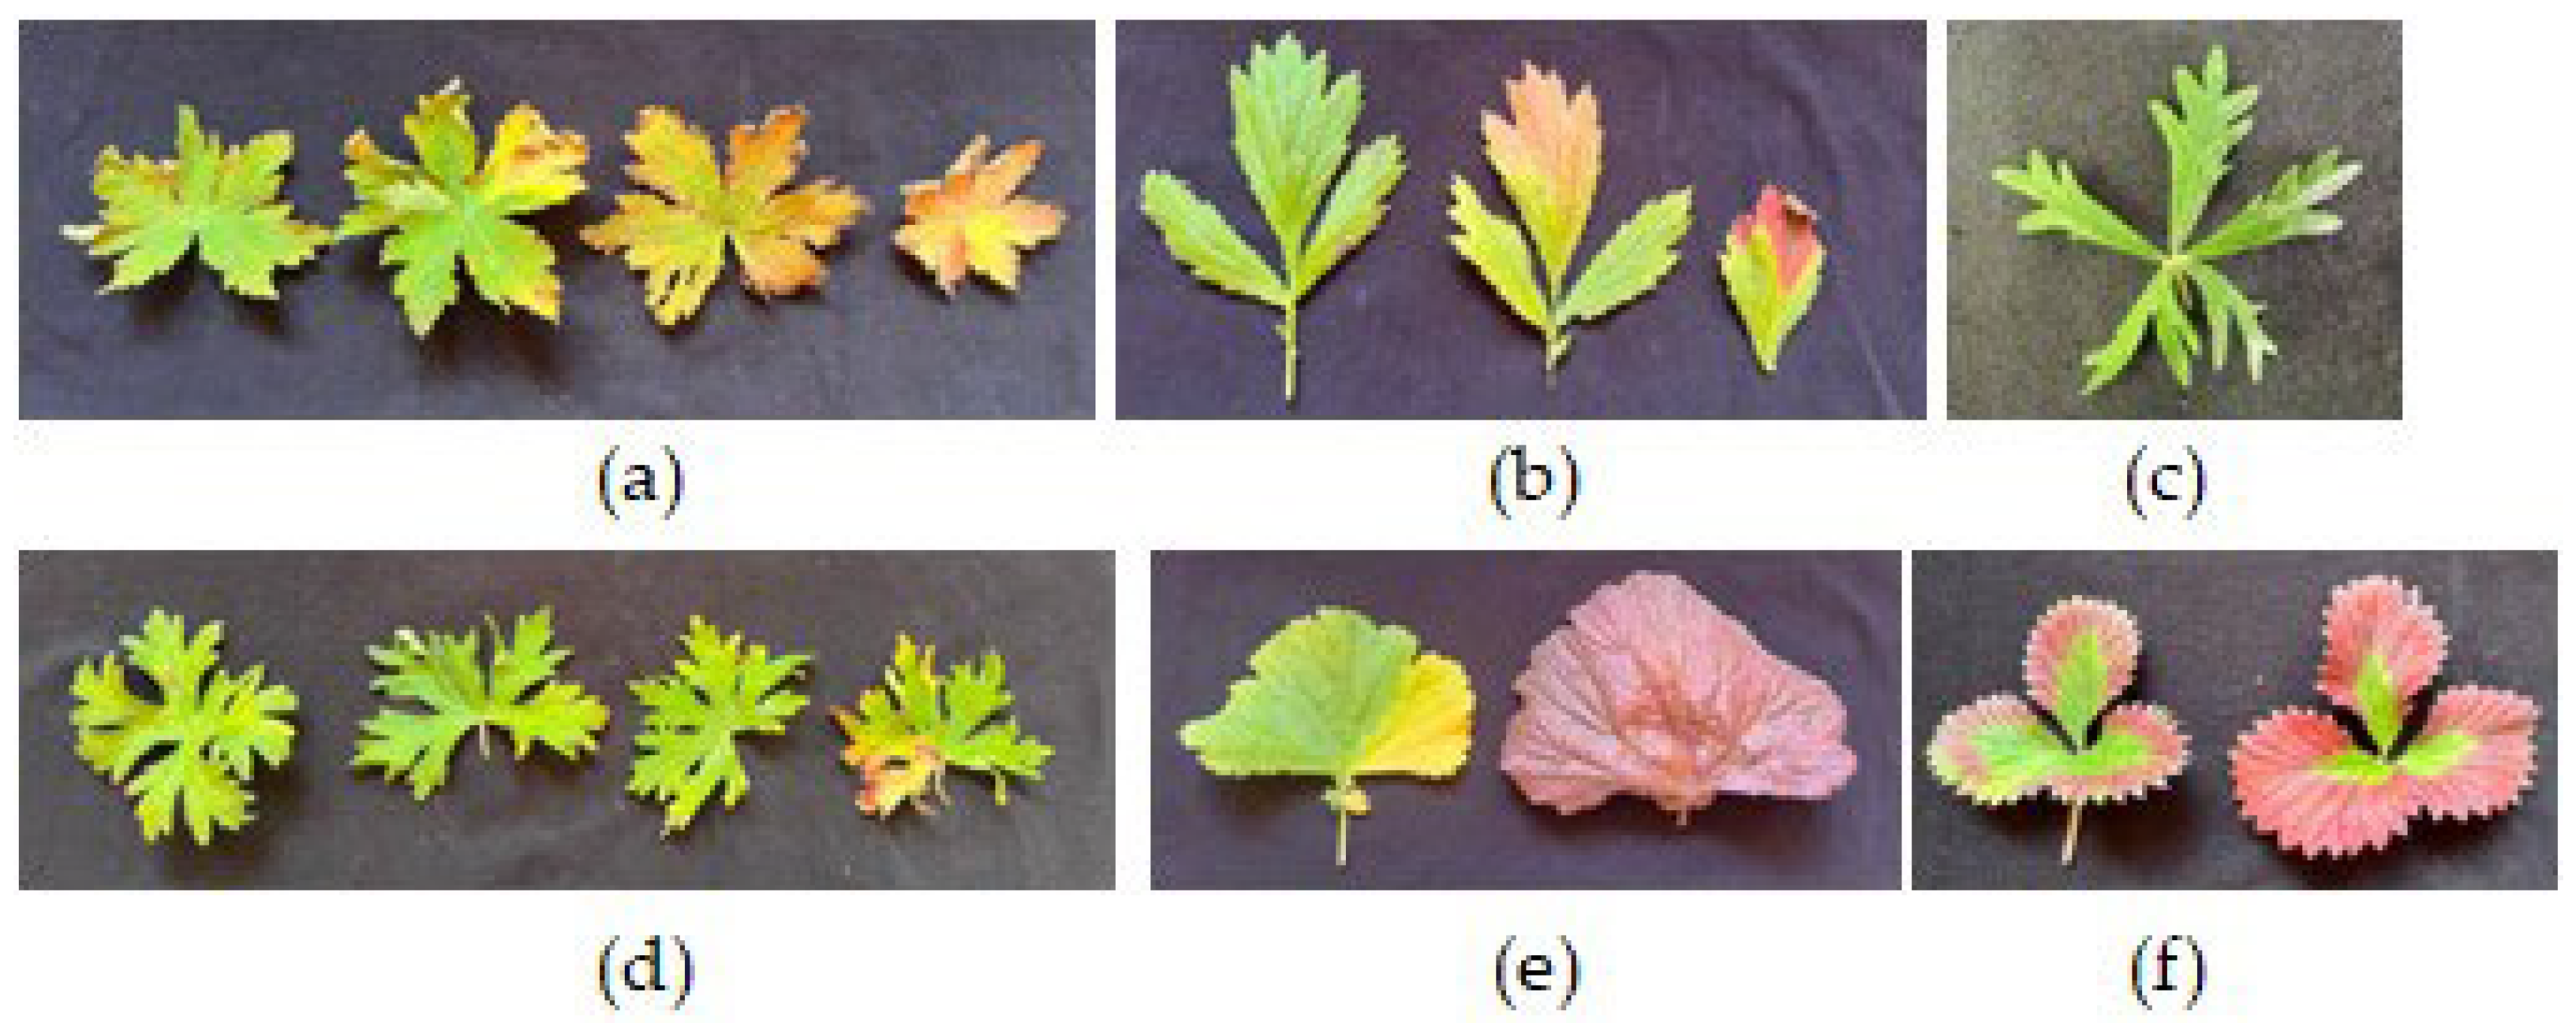
Figure 7.
Photosynthesis active radiation (PAR) measured during the polar day on June 24-26, 2024 at Kirovsk, Russia (67°38′N).
Figure 7.
Photosynthesis active radiation (PAR) measured during the polar day on June 24-26, 2024 at Kirovsk, Russia (67°38′N).
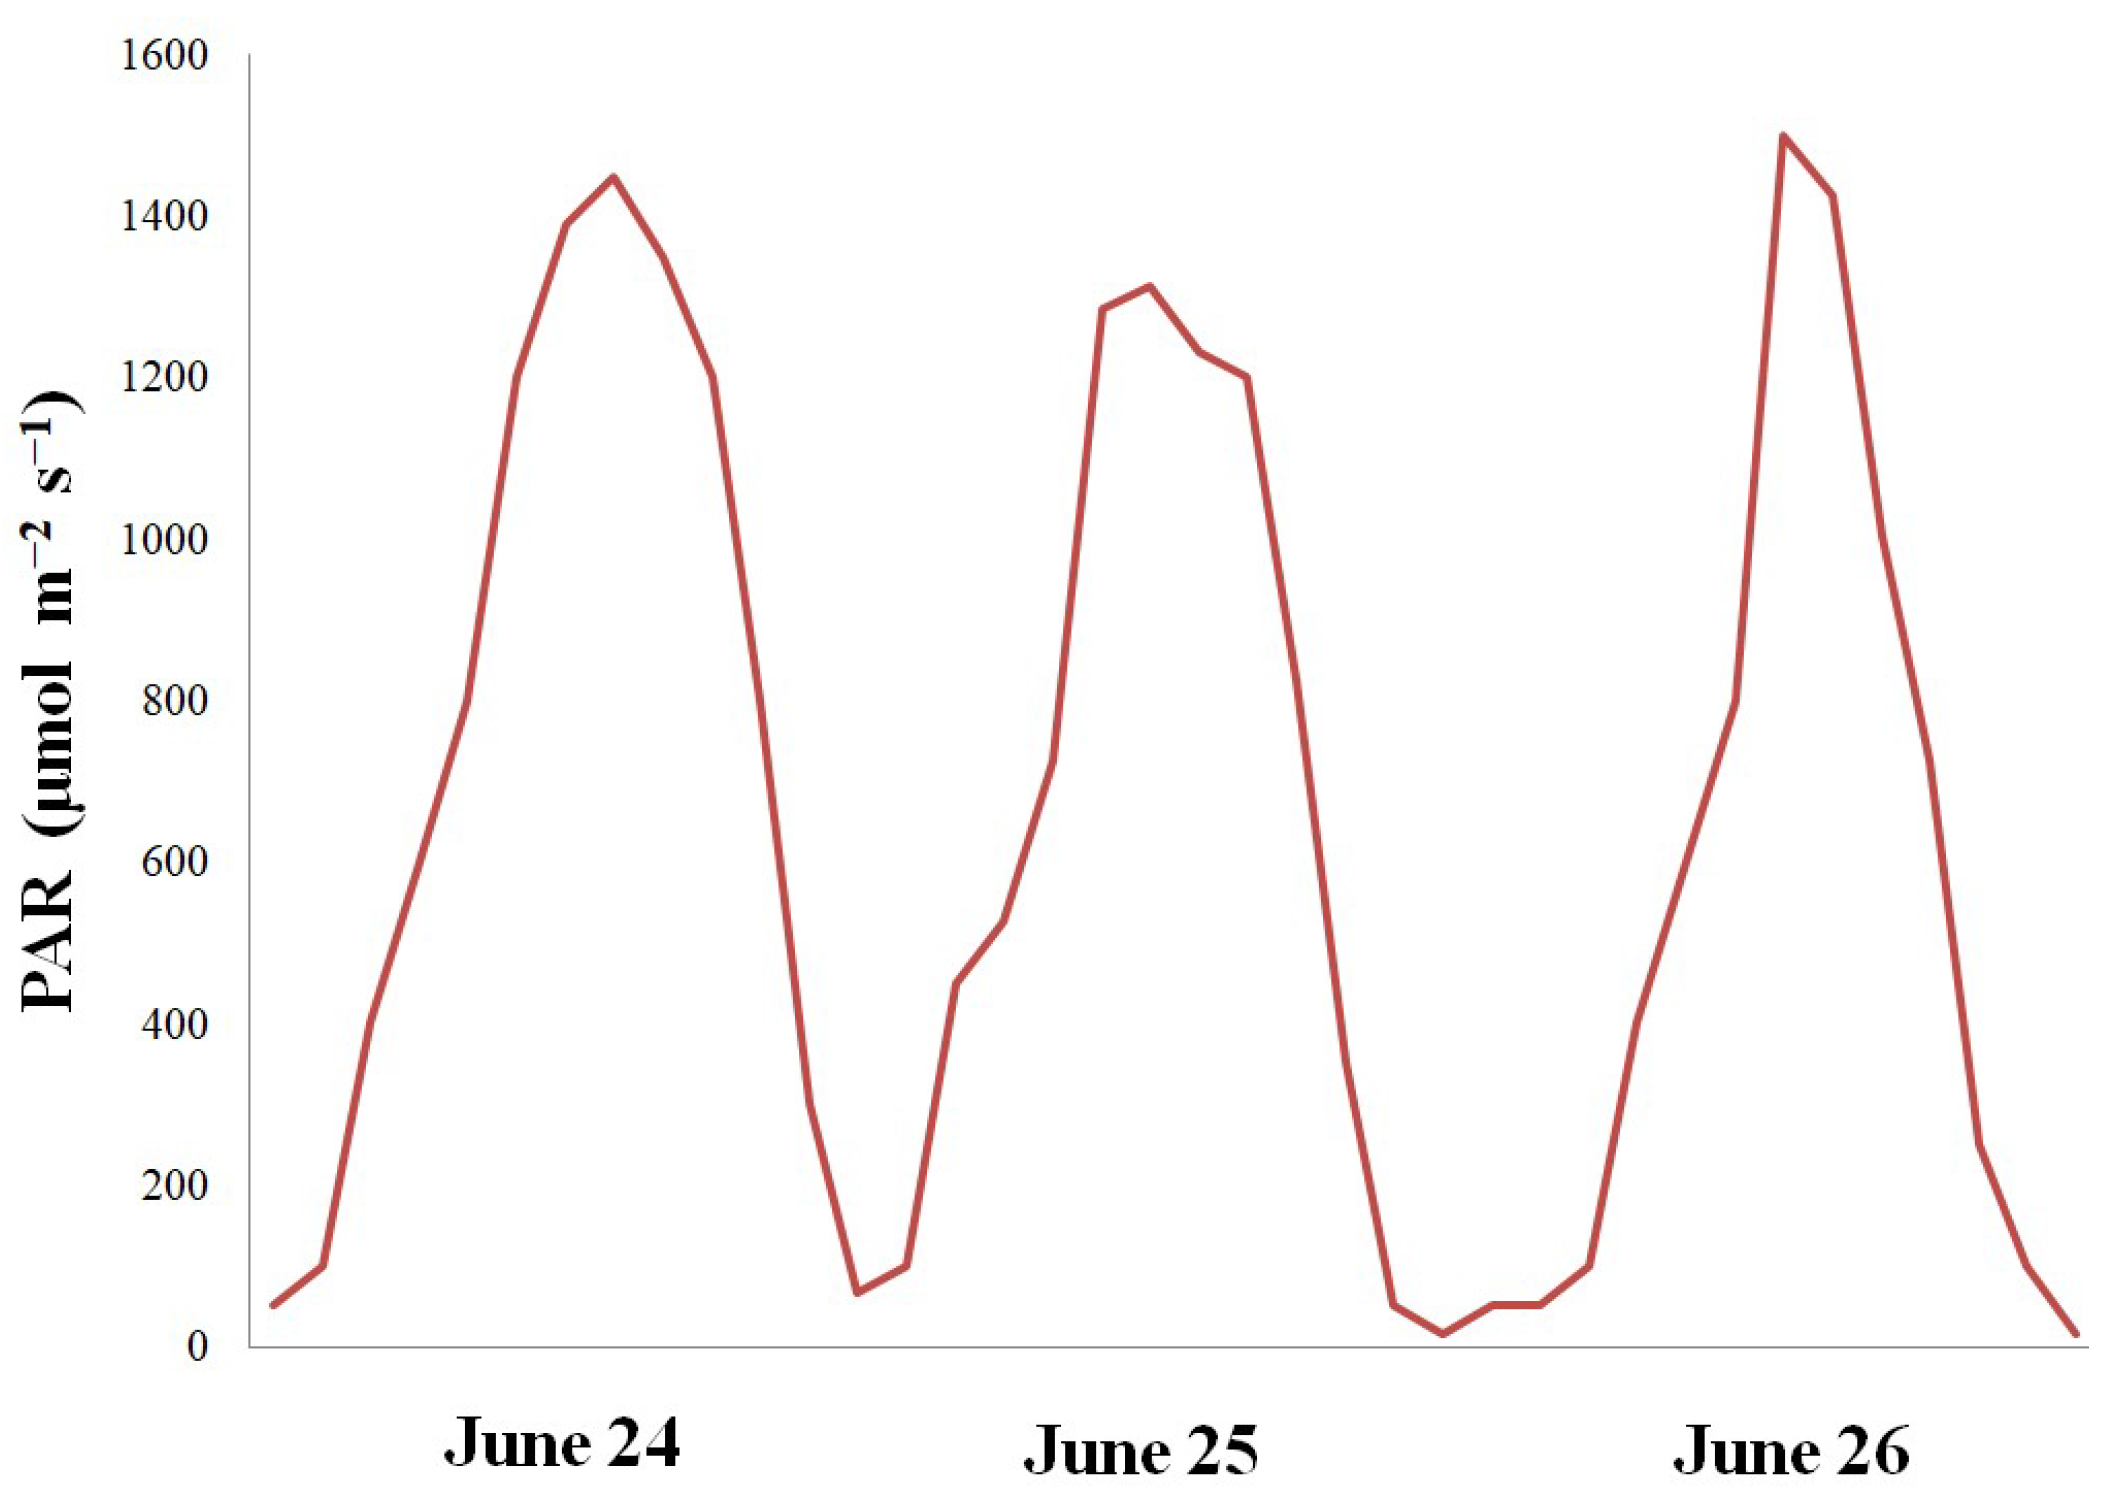

Table 1.
Day length in Khibiny Mountains (67°44′N), hour.
| Days | May | June | July | August | September |
|---|---|---|---|---|---|
| 1-5 | 17-42 | 23-07 | 24-00 | 18-41 | 14-38 |
| 6-10 | 18-24 | 24-00 | 23-59 | 17-57 | 14-00 |
| 11-15 | 19-08 | 24-00 | 22-44 | 17-18 | 13-22 |
| 16-20 | 19-53 | 24-00 | 21-27 | 16-40 | 12-42 |
| 21-25 | 20-46 | 24-00 | 20-29 | 16-02 | 12-04 |
| 26-30 | 21-52 | 24-00 | 19-35 | 15-09 | 11-28 |
| Average by month | 19-38 | 24-00 | 22-02 | 17-00 | 13-02 |
Table 2.
Physiological and biochemical parameters of native and non-native plant species exposed for 2 weeks to artificial lighting with 16 h (A-16 h) or 24 h (A-CL) photoperiod.
Table 2.
Physiological and biochemical parameters of native and non-native plant species exposed for 2 weeks to artificial lighting with 16 h (A-16 h) or 24 h (A-CL) photoperiod.
| Parameter | Photoperiod |
Geranium sylvaticum |
Geranium himalayense |
Geum rivale |
Geum coccineum |
Potentilla erecta |
Potentilla atrosanguinea |
|---|---|---|---|---|---|---|---|
| LMA, mg/cm2 | A-16 h | 3.52b | 3.00b | 4.78b | 4.63b | 4.94b | 5.25b |
| A-CL | 5.37a | 4.98a | 6.87a | 7.3a | 5.29a | 7.96a | |
| Fv/Fm | A-16 h | 0.766a | 0.778a | 0.783a | 0.782a | 0.823a | 0.804a |
| A-CL | 0.691b | 0.755b | 0.773a | 0.753b | 0.806b | 0.741b | |
| Chl, SPAD | A-16 h | 28.3a | 37.9a | 44.6a | 40.2a | 50.4a | 49.6a |
| A-CL | 26.0a | 33.8a | 43.9a | 22.5b | 49.8a | 37.2b | |
| Chl a+b, mg/g DW | A-16 h | 3.60a | 3.87a | 8.21a | 7.96a | 8.98a | 7.11a |
| A-CL | 2.64b | 3.14a | 5.12b | 2.39b | 8.13a | 3.32b | |
| Chl a/b | A-16 h | 2.3b | 2.9a | 2.5a | 2.4a | 2.0a | 3.15b |
| A-CL | 2.6a | 3.0a | 2.6a | 2.6a | 2.2a | 3.34a | |
| Carotenoids, mg/g DW | A-16 h | 0.51a | 0.68a | 1.0a | 0.98a | 0.72a | 1.02a |
| A-CL | 0.49a | 0.69a | 0.7a | 0.35b | 0.56a | 0.61b | |
| Chl/Carotenoids | A-16 h | 7.1a | 5.7a | 8.6a | 8.1a | 12.5a | 7.0a |
| A-CL | 5.4b | 4.6a | 6.8b | 6.8b | 14.5a | 5.0b | |
| LHCII, % | A-16 h | 69.9a | 56.4a | 64.0a | 67,9a | 79.3a | 54.4a |
| A-CL | 60.4b | 54.8a | 51.6b | 64.7a | 81.7a | 48.4b | |
| Anthocyanins, mg/mg FW | A-16 h | 0.80b | 1.98b | 0.98b | 1.06b | 0.59b | 0.78b |
| A-CL | 4.23a | 3.94a | 1.95a | 3.73a | 0.70a | 6.23a | |
| Flavonoids, mg/mg FW |
A-16 h | 271.60b | 404.3b | 191.2b | 189.9b | 85.0b | 205.1b |
| A-CL | 497.40a | 632.5a | 243.1a | 233.7a | 140.5a | 215.9a | |
| MDA, µmol/g FW |
A-16 h | 53.9b | 51.4b | 45.6b | 93.1b | 52.9b | 45.4b |
| A-CL | 79.0a | 76.4a | 88.0a | 175.3a | 67.3a | 65.9a | |
| H2O2, µmol/g FW |
A-16 h | 1.36b | 1.10b | 0.78b | 1.47b | 1.06b | 0.89b |
| A-CL | 2.58a | 1.85a | 1.86a | 2.02a | 1.47a | 1.44a |
Different letters for each plant species indicate significant differences between the mean values at p < 0.05.
Table 3.
Daily variation (maximum/minimum, mmol/m2 s) of stomatal conductance (gs) in native and non-native plant species exposed for 2 weeks to artificial lighting with 16 h (A-16 h) or 24 h (A-CL) photoperiod and exposed to natural 16 h photoperiod (N-16 h) in the second decade of August or natural continuous lighting (N-CL) in the end of June in Polar-Alpine Botanic Garden (KPABG, 67°38′N).
| Plant name | Maximum/minimum daily gs, mmol/(m2 s) | |||
|---|---|---|---|---|
| A-16 h | A-CL | N-16 h | N-CL | |
| Geranium sylvaticum | 229/142 | 312/275 | 996/330 | 686/244 |
| Geranium himlayense | 363/90 | 297/188 | 711/267 | 645/248 |
| Geum rivale | 440/250 | 395/320 | 845/304 | 776/286 |
| Geum coccineum | 215/98 | 123/101 | 477/183 | 450/197 |
| Potentilla erecta | 507/160 | 521/223 | 812/195 | 790/217 |
| Potentilla atrosanguinea | 342/114 | 297/2 60 | 995/302 | 806/124 |
Different letters for each plant species indicate significant differences between the mean values at p < 0.05.
Table 4.
Physiological and biochemical parameters of native and non-native plant species exposed to natural 16 h photoperiod (N-16 h) in the second decade of August or natural continuous lighting (N-CL) in the end of June in Polar-Alpine Botanic Garden (KPABG, 67°38′N).
Table 4.
Physiological and biochemical parameters of native and non-native plant species exposed to natural 16 h photoperiod (N-16 h) in the second decade of August or natural continuous lighting (N-CL) in the end of June in Polar-Alpine Botanic Garden (KPABG, 67°38′N).
| Parameter | Photoperiod |
Geranium sylvaticum |
Geranium himalayense |
Geum rivale |
Geum coccineum |
Potentilla erecta |
Potentilla atrosanguinea |
|---|---|---|---|---|---|---|---|
| LMA, mg/cm2 | N-16 h | 3.83b | 3.77b | 3.23a | 4.82b | 3.95b | 5.57b |
| N-CL | 4.74a | 4.23a | 3.47a | 7.50a | 5.99a | 6.81a | |
| Fv/Fm | N-16 h | 0,805а | 0.821a | 0.820a | 0.813a | 0.820a | 0.808a |
| N-CL | 0,795а | 0.802b | 0.818a | 0.794b | 0.821a | 0.800a | |
| Chl, SPAD | N-16 h | 22,8а | 41.3a | 43.3a | 40.2a | 40.8a | 45.1a |
| N-CL | 20,6а | 33.4b | 38.3a | 26.5b | 45.1a | 38.9b | |
| Chl a+b, mg/g DW | N-16 h | 3.21a | 5.24a | 3.03a | 6.43a | 7.28a | 4.51a |
| N-CL | 2.71b | 2.26b | 1.98b | 2.27b | 6.47b | 1.24b | |
| Chl a/b | N-16 h | 2.6b | 3.0b | 3.0a | 1.9b | 1.8b | 2.9b |
| N-CL | 3.4a | 3.6a | 3.4a | 2.5a | 2.5a | 3.7a | |
| Carotenoids, mg/g DW | N-16 h | 0.52a | 0.68a | 0.50a | 0.57a | 0.82a | 0.77b |
| N-CL | 0.44b | 0.41b | 0.37a | 0.28b | 0.62b | 0.66a | |
| Chl/Carotenoids | N-16 h | 6.2a | 7.8a | 6.1a | 11.3a | 8.9a | 5.9a |
| N-CL | 6.3a | 5.5b | 5.4a | 8.1b | 10.4a | 1.9 b | |
| LHCII, % | N-16 h | 61.2a | 6.1a | 55.0a | 77.9a | 78.5a | 56.8a |
| N-CL | 50.5b | 47.8b | 49.7a | 51.2b | 61.0b | 42.6b | |
| Anthocyanins, mg/mg FW | N-16 h | 1.18a | 0.84a | 0.87a | 0.82b | 1.17a | 0.98a |
| N-CL | 1.04a | 0.95a | 1.02a | 1.17a | 1.07a | 0.76b | |
| Flavonoids, mg/mg FW |
N-16 h | 254.7a | 354.1a | 279.8b | 334.8a | 82.1b | 131.4b |
| N-CL | 277.5a | 283.6b | 343.1a | 351.3a | 139.0a | 215.7a | |
| MDA, µmol/g FW |
N-16 h | 57.1b | 37.0b | 101.2b | 61.3a | 52.0a | 38.1a |
| N-CL | 69.7a | 45.0a | 120.9a | 72.8b | 55.7a | 40.3a | |
| H2O2, µmol/g FW |
N-16 h | 4.48b | 2.10b | 1,9b | 1.62b | 1.82b | 1.76a |
| N-CL | 6.42a | 4.01a | 2,8a | 2.54a | 2.22a | 1.82a |
Different letters for each plant species indicate significant differences between the mean values at p < 0.05.
Disclaimer/Publisher’s Note: The statements, opinions and data contained in all publications are solely those of the individual author(s) and contributor(s) and not of MDPI and/or the editor(s). MDPI and/or the editor(s) disclaim responsibility for any injury to people or property resulting from any ideas, methods, instructions or products referred to in the content. |
© 2024 by the authors. Licensee MDPI, Basel, Switzerland. This article is an open access article distributed under the terms and conditions of the Creative Commons Attribution (CC BY) license (http://creativecommons.org/licenses/by/4.0/).
Copyright: This open access article is published under a Creative Commons CC BY 4.0 license, which permit the free download, distribution, and reuse, provided that the author and preprint are cited in any reuse.


